April ARKANSAS LABOR MARKET REPORT Labo… · April ARKANSAS LABOR MARKET REPORT APRIL SPOTLIGHT...
19
2020 June ARKANSAS LABOR MARKET REPORT www.discover.arkansas.gov
Transcript of April ARKANSAS LABOR MARKET REPORT Labo… · April ARKANSAS LABOR MARKET REPORT APRIL SPOTLIGHT...

2020June
ARKANSASLABOR MARKET REPORT
w w w.d i scove r. a r ka n sa s .g ov

The Arkansas Labor Market is prepared monthly in conjunction with the U.S. Depart-ment of Labor, Bu-reau of Labor Statis-tics (BLS). The current month’s estimates are preliminary, while pre-vious month’s data is subject to revision.
Estimates of nonfarm payroll jobs show the number of jobs by industry and reflect employment by place of work. Hours and earnings estimates are based on payroll and worker-hour data col-lected for production workers in manufactur-ing industries.
Industries are classi-fied according to the North American In-dustry Classification System (NAICS). All estimates are based on a first quarter 2019 benchmark.
Explanation of Terms and Concepts
Monthly Business
Survey of Employers
A monthly sample sur-vey designed to pro-vide industry infor-mation on nonfarm payroll jobs. Data are compiled each month from mail surveys and telephone interviews conducted by the Bu-reau of Labor Statistics in cooperation with Department of Work-force Services. The data are based on establish-ment records and in-clude all workers, full-or part-time, who re-ceived pay during the payroll period which includes the 12th of the month. Approximately
5,000 Arkansas busi-ness establishments are surveyed.
Metropolitan
Statistical Areas
A term applied by the U.S. Office of Manage-ment and Budget to counties that have one or more central cities and that meet specified criteria of population density, commuting patterns and social and economic integration.
Current Population
Survey (CPS)
A monthly sample sur-vey of the population 16 years of age and over, designed to pro-vide data on the labor force, the employed and the unemployed. The survey is conduct-ed each month by the Bureau of the Census for BLS. The informa-tion is collected by trained interviewers from a sample of about 60,000 households. The data collected are based on the activity reported for the cal-endar week including the 12th of the month. Approximately 800 Arkansas households are represented in the sample survey.
Civilian Labor Force
The sum of all em-ployed and unem-ployed persons 16 years of age or older. Members of the Armed Forces are excluded.
Employment
An estimate of the number of persons who worked any time
for pay or profit or worked 15 hours or more as unpaid work-ers in a family business during the calendar week which includes the 12th of the month. Also included are those who, although not working, had some job attachment and were not looking for work, and persons involved in labor management disputes.
Unemployment
An estimate of the number of persons who did not have a job, but were available for work and actively seek-ing work during the calendar week which includes the 12th of the month.
Unemployment
Rate
The number of unem-ployed as a percentage of the civilian labor force. Unemployment rates are calculated from unrounded data.
Seasonal
Adjustment
A statistical technique applied to monthly data to e l iminate changes that normally occur during the year due to seasonal events such as weather, ma-jor holidays, schedule shifts, harvest times, and the opening/clos-ing of schools.
Technical Notes
Monthly Spotlight..................................................2
Arkansas Labor Force Summary.......................3
Arkansas Nonfarm Payroll Jobs........................4
Arkansas Production Workers...........................6
Metropolitan Statistical Areas...........................7
Micropolitan Statistical Areas/Cities.............14
County Labor Force Statistics..........................15
Local Workforce Development Areas..........18
Table of Contents
w w w.d i scove r. a r ka n sa s .g ov
JuneARKANSASLABOR MARKET REPORT
Arkansas Division of Workforce Services

2
JuneARKANSASLABOR MARKET REPORT
w w w.d i scove r. a r ka n sa s .g ov
JUNE SPOTLIGHTJUNE SPOTLIGHTWages in Arkansas
The Quarterly Census of Employment and Wages (QCEW) is the most comprehensive data collection program utilized by the Bureau of Labor Statistics (BLS). The program is based on each state’s Unemploy-ment Insurance (UI) program, which enables BLS to produce data using every business that is covered under UI tax law. In addition to calculating UI covered employment, the program also tracks the wages paid to employees. Due to the extensive nature of the information, data can be produced at any level-- national, statewide, counties, and cities.
The information below comes from the QCEW program and shows annual average wage data for each county in Arkansas. Annual average wages are calculated using the total wages earned during the cal-endar year, divided by annual average employment. The wages below are compiled using all industries in the private sector, for all workers included under UI tax law. It is important to note that QCEW data is based on county of employment, not county of residency. So if an individual works in a different county than where they live, their wages are counted in the county where they work.
In 2019, average annual wages in the private sector ranged from a low of $25,095, for those employed in Newton County, to a high of $63,946 in Benton County. Compared to 2018 annual averages, wages are up in 69 Arkansas counties.
Wages in Arkansas by County2019 Annual Average (Private Sector)
Yell
Polk
White
Union
ScottLee
Clark
Pope
Drew
Clay
Pike
Ashley
Desha
Benton
Izard
Saline
Logan
Miller
Grant
Newton
Pulaski
Arkansas
Lonoke
Dallas
Stone
Cross
Perry
Chicot
Sharp
Prairie
Madison
Fulton
Searcy
Phillips
Carroll
Jefferson
MarionBoone
Poinsett
Garland
Baxter
Sevier
Bradley
Mississippi
Nevada
Monroe
GreeneWashington
Ouachita
Johnson
Columbia
Faulkner
Lincoln
Calhoun
Conway
Van Buren
Craighead
Randolph
CrawfordCleburne
Montgomery
Lawrence
St. Francis
Cleveland
Hot Spring
Little River
Jackson
Howard
Franklin
Hempstead
Woodruff Crittenden
Lafayette
Sebastian
Independence
Annual Average Wages< $30,000
$30,000 - $35,000
$35,000 - $40,000
$40,000 - $45,000
> $45,000

Civi l ian Labor Force Est imates
Civilian Labor Force Employment Unemployment Unemployment Rate
U.S. Unemployment
1,345,5091,216,249
129,2609.6
13.3
1,312,2901,206,952
105,3388.0
11.1
1,360,3711,312,004
48,3673.6
3.7
Jun 19 Jun 20 May 20
Civilian Labor Force Employment Unemployment Unemployment Rate
U.S. Unemployment
1,349,5031,222,416
127,0879.4
13.0
1,329,7931,220,232
109,5618.2
11.2
1,379,2831,322,546
56,7374.1
3.8
Jun 19 Jun 20 May 20
Seasonally Adjusted Not Seasonally Adjusted
Unemployment Rates - Arkansas vs United States (Seasonally Adjusted)June: 2010 - 2020
Labor force data, produced by the U.S. Department of Labor, Bureau of Labor Statistics and released by the Arkansas Division of Workforce Services, show Arkansas’ seasonally adjusted unemployment rate declined one and six-tenths of a percentage point, from 9.6 percent in May to 8.0 percent in June. May’s unemployment rate was revised up from 9.5 percent to 9.6 percent. Arkansas’ civilian labor force decreased 33,219 in June, a result of 9,297 fewer employed and 23,922 fewer unemployed Arkansans. The United States’ jobless rate decreased over two full percentage points, going from 13.3 percent in May to 11.1 percent in June.
BLS Program Operations Manager Susan Price said, “Despite moving into Phase 2 of reopening in June, there was a notable increase in the number of survey respondents in Arkansas reporting that they were not employed or had dropped out of the labor force. This was due in part to changes in seasonal sum-mer hiring trends and recent temporary layoffs/closures. These reported losses more than offset the hiring that occurred in June.”
3
JuneARKANSASLABOR MARKET REPORT
w w w.d i scove r. a r ka n sa s .g ov
STATE OF ARKANSASSTATE OF ARKANSASCivilian Labor Force Summary
0.0%
2.0%
4.0%
6.0%
8.0%
10.0%
12.0%
2010 2011 2012 2013 2014 2015 2016 2017 2018 2019 2020
Arkansas United States

Jun 20 May 20 Jun 19
1210.9203.358.95.1
53.833.9
144.464.480.0
1007.6254.248.8
135.869.610.260.947.713.2
141.543.835.662.1
180.213.5
166.756.935.3
103.313.489.97.9
82.057.1
200.220.570.923.347.6
108.866.742.1
OTM OTY
Total Nonfarm Goods Producing Mining, Logging, & Construction Mining & Logging Construction Specialty Trade Contractors Manufacturing Durable Goods Nondurable Goods Service Providing Trade, Transportation & Utilities Wholesale Trade Retail Trade Transport, Warehousing & Utilities Information Financial Activities Finance & Insurance Real Estate & Rental & Leasing Professional & Business Services Professional, Scientific & Technical Management of Companies Administrative & Support Services Educational & Health Services Educational Services Health Care & Social Assistance Ambulatory Health Care Social Assistance Leisure & Hospitality Arts, Entertainment & Recreation Accommodation & Food Services Accommodation Services Food Services Other Services Government Federal Government State Government State Gov, Educational Services State Gov, Excluding Education Local Government Local Gov, Educational Services Local Gov, Excluding Education
(NAICS)
Not Seasonal ly Adjusted(In Thousands)
4
JuneARKANSASLABOR MARKET REPORT
w w w.d i scove r. a r ka n sa s .g ov
STATE OF ARKANSASSTATE OF ARKANSAS
1192.4201.958.35.1
53.233.4
143.663.380.3
990.5246.648.2
129.069.410.361.148.013.1
139.443.535.160.8
181.614.1
167.557.435.793.411.282.27.6
74.654.8
203.320.774.326.647.7
108.366.641.7
1272.4221.859.16.0
53.133.6
162.778.184.6
1050.6251.447.8
136.067.611.563.048.914.1
143.744.433.665.7
190.113.0
177.159.339.3
122.413.6
108.812.196.760.1
208.420.374.626.747.9
113.567.446.1
18.51.40.60.00.60.50.81.1
-0.317.17.60.66.80.2
-0.1-0.2-0.30.12.10.30.51.3
-1.4-0.6-0.8-0.5-0.49.92.27.70.37.42.3
-3.1-0.2-3.4-3.3-0.10.50.10.4
-61.5-18.5-0.2-0.90.70.3
-18.3-13.7-4.6
-43.02.81.0
-0.22.0
-1.3-2.1-1.2-0.9-2.2-0.62.0
-3.6-9.90.5
-10.4-2.4-4.0
-19.1-0.2
-18.9-4.2
-14.7-3.0-8.20.2
-3.7-3.4-0.3-4.7-0.7-4.0
Nonfarm Payroll Job Summary

Arkansas’ nonfarm payroll jobs rose 18,500 in June to total 1,210,900. Six major industry sectors posted gains, while employment in four sectors declined. Jobs in leisure and hospitality increased 9,900. Hir-ing occurred across all subsectors. Trade, transportation, and utilities added 7,600 jobs, mostly in retail trade (+6,800). Employment in other services rose 2,300. This sector includes businesses such as hair and nail salons, day spas, and membership organizations. Professional and business services increased 2,100. Gains were posted in all three subsectors. Jobs in government decreased 3,100. Most of the contractions were in state government, educational services (-3,300). Educational and health services declined 1,400. Small losses occurred in health care and social assistance (-800) and in edu-cational services (-600).
Nonfarm Payroll Jobs (Not Seasonally Adjusted)January 2018 - June 2020
May 2020 - June 2020
June 2019 - June 2020Compared to June 2019, nonfarm payroll jobs in Arkansas are down 61,500. Losses were reported in nine major industry sectors, while two sectors added jobs. Jobs in leisure and hospitality declined 19,100. Most of the reduction was in accommodation and food services (-18,900). Jobs in manufac-turing decreased 18,300, largely due to durable goods manufacturing (-13,700). Employment in edu-cational and health services is down 9,900. All losses were posted in health care and social assistance (-10,400). Government jobs declined 8,200, with contractions in both local (-4,700) and state (-3,700) government. Smaller losses were reported in other services (-3,000), professional and business ser-vices (-2,200), financial activities (-2,100), information (-1,300), and mining and logging (-900). Em-ployment in trade, transportation, and utilities rose 2,800 over-the-year. Gains in transportation-warehousing-utilities (+2,000) and wholesale trade (+1,000) more than offset minor declines in retail trade (-200).
5
JuneARKANSASLABOR MARKET REPORT
w w w.d i scove r. a r ka n sa s .g ov
STATE OF ARKANSASSTATE OF ARKANSASNonfarm Payroll Job Summary
1,140,000
1,160,000
1,180,000
1,200,000
1,220,000
1,240,000
1,260,000
1,280,000
1,300,000
1,320,000
J F M A M J J A S O N D
2018 2019 2020

Average Weekly HoursAverage Hourly EarningsAverage Weekly Earnings
38.018.24
693.12
39.218.82
737.74
43.718.68
812.82
Jun 19 Jun 20 May 20
Manufacturing
Average Weekly HoursAverage Hourly EarningsAverage Weekly Earnings
37.220.09
747.35
38.820.81
807.43
42.220.50
865.10
Jun 19 Jun 20 May 20
Average Weekly HoursAverage Hourly EarningsAverage Weekly Earnings
38.716.88
653.26
39.617.29
684.68
45.017.02
765.90
Jun 19 Jun 20 May 20
Durable Goods Manufacturing Nondurable Goods Manufacturing
Average Weekly Earnings in Manufacturing (Production Workers)June: 2010 - 2020
Durable Goods and Nondurable Goods Manufacturing
6
JuneARKANSASLABOR MARKET REPORT
w w w.d i scove r. a r ka n sa s .g ov
STATE OF ARKANSASSTATE OF ARKANSAS
Production Workers - Hours and Earnings
$571.73 $582.40
$650.87 $636.32
$661.18 $652.46 $660.19 $655.13
$736.10
$812.82
$737.74
$300.00
$400.00
$500.00
$600.00
$700.00
$800.00
$900.00
2010 2011 2012 2013 2014 2015 2016 2017 2018 2019 2020

Civi l ian Labor Force Est imates (Not Seasonal ly Adjusted)
Civilian Labor ForceEmployment UnemploymentUnemployment Rate
362,917350,74112,176
3.4
Jun 20 May 20 Jun 19354,363318,12836,235
10.2
349,070318,07930,991
8.9
Nonfarm Payrol l Jobs (Not Seasonal ly Adjusted)
Total Nonfarm Goods Producing Mining, Logging & Construction Manufacturing Service Providing Trade, Transportation & Utilities Wholesale Trade Retail Trade Trans., Warehousing & Utilities Information Financial Activities Professional & Business Services Educational & Health Services Leisure & Hospitality Other Services Government Federal Government State Government Local Government
343.637.418.219.2
306.268.915.636.317.03.6
20.946.852.429.317.666.79.9
33.123.7
337.636.917.919.0
300.766.115.533.716.93.7
20.945.852.827.017.267.29.9
33.623.7
366.439.417.921.5
327.070.215.837.516.94.4
22.148.357.535.518.870.29.6
34.626.0
NAICS Jun 20 May 20 Jun 196.00.50.30.25.52.80.12.60.1
-0.10.01.0
-0.42.30.4
-0.50.0
-0.50.0
-22.8-2.00.3
-2.3-20.8-1.3-0.2-1.20.1
-0.8-1.2-1.5-5.1-6.2-1.2-3.50.3
-1.5-2.3
OTM OTY
-13,847-32,66218,815
5.5
OTM OTY-5,293
-49-5,244
-1.3
The Little Rock-North Little Rock-Conway MSA = Faulkner, Grant, Lonoke, Perry, Pulaski, & Saline counties.
(In Thousands)
Number of UnemployedJune 2018 - June 2020
Nonfarm Payroll JobsJune: 2010 - 2020
7
JuneARKANSASLABOR MARKET REPORT
w w w.d i scove r. a r ka n sa s .g ov
METROPOLITAN STATISTICAL AREASMETROPOLITAN STATISTICAL AREASLittle Rock - North Little Rock - Conway MSA
0
5,000
10,000
15,000
20,000
25,000
30,000
35,000
40,000
45,000
Jun '18 Dec '18 Jun '19 Dec '19 June '20320,000
330,000
340,000
350,000
360,000
370,000
'10 '11 '12 '13 '14 '15 '16 '17 '18 '19 '20

Civi l ian Labor Force Est imates (Not Seasonal ly Adjusted)
Civilian Labor ForceEmployment UnemploymentUnemployment Rate
280,387272,693
7,6942.7
Jun 20 May 20 Jun 19277,485257,60019,885
7.2
273,583256,15917,424
6.4
Nonfarm Payrol l Jobs (Not Seasonal ly Adjusted)
Total Nonfarm Goods Producing Mining, Logging & Construction Manufacturing Service Providing Trade, Transportation & Utilities Wholesale Trade Retail Trade Trans., Warehousing & Utilities Information Financial Activities Professional & Business Services Educational & Health Services Leisure & Hospitality Other Services Government Federal Government State Government Local Government
253.840.912.428.5
212.956.512.325.518.71.98.2
51.226.924.39.1
34.82.8
13.318.7
251.340.812.228.6
210.555.112.224.318.61.98.2
50.427.122.49.1
36.32.8
14.818.7
261.042.612.530.1
218.456.212.225.718.32.18.3
49.829.027.39.7
36.02.7
13.919.4
NAICS Jun 20 May 20 Jun 192.50.10.2
-0.12.41.40.11.20.10.00.00.8
-0.21.90.0
-1.50.0
-1.50.0
-7.2-1.7-0.1-1.6-5.50.30.1
-0.20.4
-0.2-0.11.4
-2.1-3.0-0.6-1.20.1
-0.6-0.7
OTM OTY
-6,804-16,534
9,7303.7
OTM OTY-3,902-1,441-2,461
-0.8
The Fayetteville-Springdale-Rogers MSA = Benton, Madison, & Washington counties in Arkansas and McDonald county in Missouri.
(In Thousands)
Unemployment RatesJune: 2010 - 2020
Jobs in Leisure and HospitalityJune 2018 - June 2020
2019
8
JuneARKANSASLABOR MARKET REPORT
w w w.d i scove r. a r ka n sa s .g ov
METROPOLITAN STATISTICAL AREASMETROPOLITAN STATISTICAL AREASFayetteville - Springdale - Rogers MSA
0.0%
1.0%
2.0%
3.0%
4.0%
5.0%
6.0%
7.0%
8.0%
'10 '11 '12 '13 '14 '15 '16 '17 '18 '19 '20 0
5,000
10,000
15,000
20,000
25,000
30,000
35,000
40,000
Jun '18 Dec '18 Jun '19 Dec '19 June '20
Civi l ian Labor Force Est imates (Not Seasonal ly Adjusted)
Civilian Labor ForceEmployment UnemploymentUnemployment Rate
120,421115,731
4,6903.9
Jun 20 May 20 Jun 19119,688105,97513,713
11.5
115,429106,907
8,5227.4
Nonfarm Payrol l Jobs (Not Seasonal ly Adjusted)
Total Nonfarm Goods Producing Mining, Logging & Construction Manufacturing Service Providing Trade, Transportation & Utilities Wholesale Trade Retail Trade Trans., Warehousing & Utilities Information Financial Activities Professional & Business Services Educational & Health Services Leisure & Hospitality Other Services Government Federal Government State Government Local Government
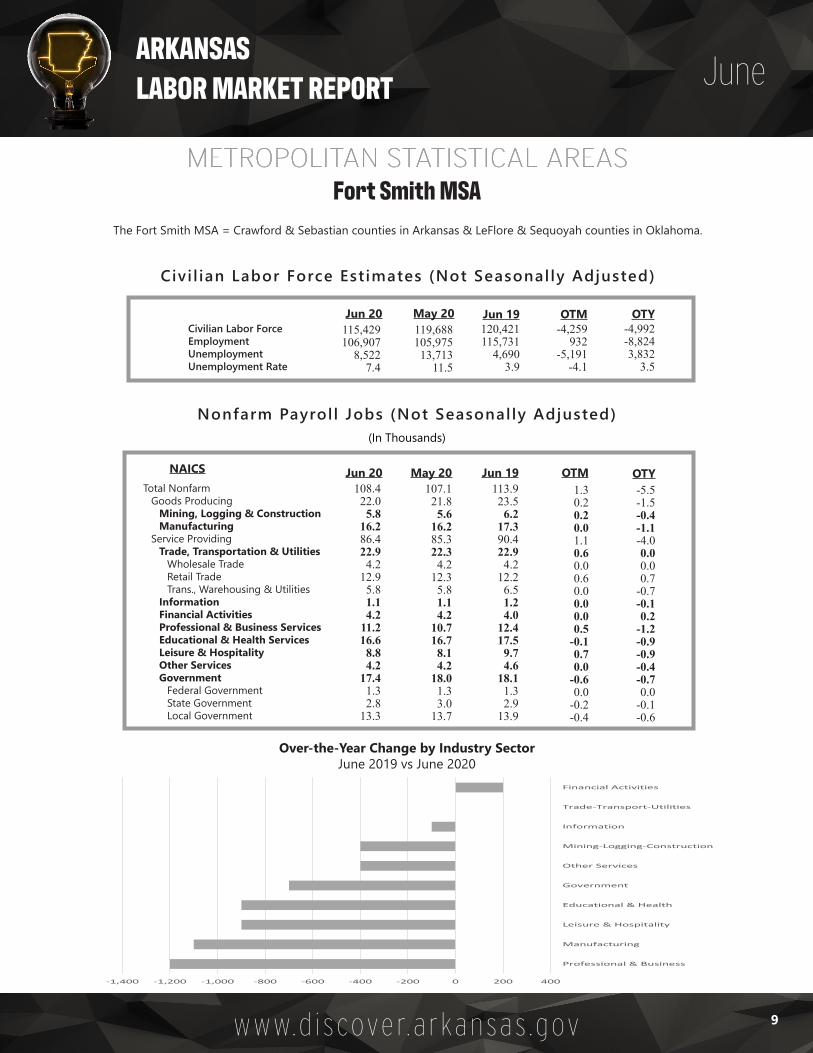
108.422.05.8
16.286.422.94.2
12.95.81.14.2
11.216.68.84.2
17.41.32.8
13.3
107.121.85.6
16.285.322.34.2
12.35.81.14.2
10.716.78.14.2
18.01.33.0
13.7
113.923.56.2
17.390.422.94.2
12.26.51.24.0
12.417.59.74.6
18.11.32.9
13.9
NAICS Jun 20 May 20 Jun 191.30.20.20.01.10.60.00.60.00.00.00.5
-0.10.70.0
-0.60.0
-0.2-0.4
-5.5-1.5-0.4-1.1-4.00.00.00.7
-0.7-0.10.2
-1.2-0.9-0.9-0.4-0.70.0
-0.1-0.6
OTM OTY
-4,992-8,8243,832
3.5
OTM OTY-4,259
932-5,191
-4.1
The Fort Smith MSA = Crawford & Sebastian counties in Arkansas & LeFlore & Sequoyah counties in Oklahoma.
(In Thousands)
Over-the-Year Change by Industry SectorJune 2019 vs June 2020
9
JuneARKANSASLABOR MARKET REPORT
w w w.d i scove r. a r ka n sa s .g ov
METROPOLITAN STATISTICAL AREASMETROPOLITAN STATISTICAL AREASFort Smith MSA
-1,400 -1,200 -1,000 -800 -600 -400 -200 0 200 400
Professional & Business
Manufacturing
Leisure & Hospitality
Educational & Health
Government
Other Services
Mining-Logging-Construction
Information
Trade-Transport-Utilities
Financial Activities

Civi l ian Labor Force Est imates (Not Seasonal ly Adjusted)
Civilian Labor ForceEmployment UnemploymentUnemployment Rate
41,98540,2951,690
4.0
Jun 20 May 20 Jun 1942,09036,3875,70313.5
41,37436,9444,43010.7
Nonfarm Payrol l Jobs (Not Seasonal ly Adjusted)
-611-3,3512,740
6.7
OTM OTY-716557
-1,273-2.8
The Hot Springs MSA = Garland County.
(In Thousands)
Number of EmployedJanuary 2018 - June 2020
37.64.5
33.14.2
36.34.3
32.04.4
39.54.7
34.84.3
NAICS Jun 20 May 20 Jun 191.30.21.1
-0.2
-1.9-0.2-1.7-0.1
OTM OTYTotal Nonfarm Goods Producing Service Providing Government
10
JuneARKANSASLABOR MARKET REPORT
w w w.d i scove r. a r ka n sa s .g ov
METROPOLITAN STATISTICAL AREASMETROPOLITAN STATISTICAL AREASHot Springs MSA
30,000
32,000
34,000
36,000
38,000
40,000
42,000
44,000
J F M A M J J A S O N D
2018 2019 2020

Civi l ian Labor Force Est imates (Not Seasonal ly Adjusted)
Civilian Labor ForceEmployment UnemploymentUnemployment Rate
66,18564,0472,138
3.2
Jun 20 May 20 Jun 1966,26260,6545,608
8.5
64,89859,887
5,0117.7
Nonfarm Payrol l Jobs (Not Seasonal ly Adjusted)
-1,287-4,1602,873
4.5
OTM OTY-1,364
-767-597-0.8
The Jonesboro MSA = Craighead & Poinsett counties.
(In Thousands)
Jobs in Goods Producing and Service Providing SectorsJune: 2000 - 2020
57.810.247.67.9
57.710.347.47.9
59.610.449.29.1
NAICS Jun 20 May 20 Jun 190.1
-0.10.20.0
-1.8-0.2-1.6-1.2
OTM OTYTotal Nonfarm Goods Producing Service Providing Government
2019
11
JuneARKANSASLABOR MARKET REPORT
w w w.d i scove r. a r ka n sa s .g ov
METROPOLITAN STATISTICAL AREASMETROPOLITAN STATISTICAL AREASJonesboro MSA
0
10,000
20,000
30,000
40,000
50,000
60,000
70,000
'00 '02 '04 '06 '08 '10 '12 '14 '16 '18 '20
Goods Producing Service Providing
Goods Producing + Service Providing = Total Nonfarm
Civi l ian Labor Force Est imates (Not Seasonal ly Adjusted)
Civilian Labor ForceEmployment UnemploymentUnemployment Rate
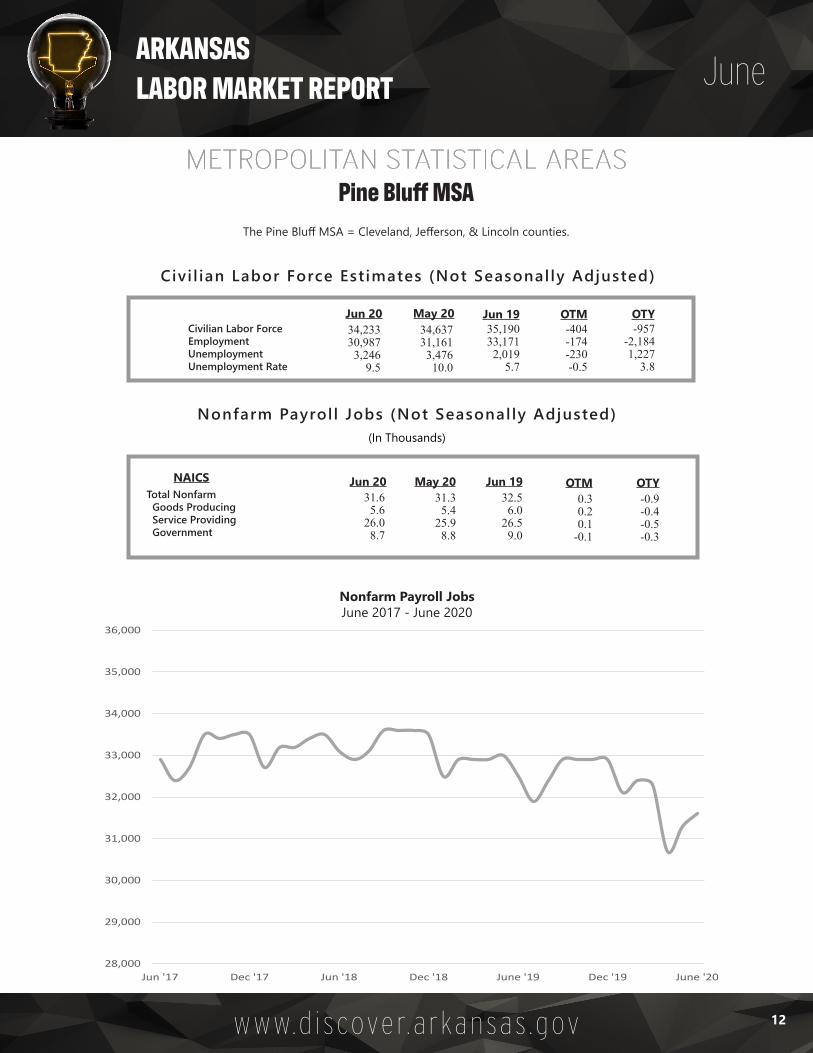
35,19033,1712,019
5.7
Jun 20 May 20 Jun 1934,63731,1613,47610.0
34,23330,9873,246
9.5
Nonfarm Payrol l Jobs (Not Seasonal ly Adjusted)
-957-2,1841,227
3.8
OTM OTY-404-174-230-0.5
The Pine Bluff MSA = Cleveland, Jefferson, & Lincoln counties.
(In Thousands)
Nonfarm Payroll JobsJune 2017 - June 2020
31.65.6
26.08.7
31.35.4
25.98.8
32.56.0
26.59.0
NAICS Jun 20 May 20 Jun 190.30.20.1
-0.1
-0.9-0.4-0.5-0.3
OTM OTYTotal Nonfarm Goods Producing Service Providing Government
12
JuneARKANSASLABOR MARKET REPORT
w w w.d i scove r. a r ka n sa s .g ov
METROPOLITAN STATISTICAL AREASMETROPOLITAN STATISTICAL AREASPine Bluff MSA
28,000
29,000
30,000
31,000
32,000
33,000
34,000
35,000
36,000
Jun '17 Dec '17 Jun '18 Dec '18 June '19 Dec '19 June '20

Civi l ian Labor Force Est imates (Not Seasonal ly Adjusted)
Civilian Labor ForceEmployment UnemploymentUnemployment Rate
651,549620,09331,456
4.8
Jun 20 May 20 Jun 19623,761557,26866,493
10.7
620,350546,52873,822
11.9
-31,199-73,56542,366
7.1
OTM OTY-3,411
-10,7407,329
1.2
Memphis, TN-MS-AR MSA
Civilian Labor ForceEmployment UnemploymentUnemployment Rate
66,01462,9993,015
4.6
Jun 20 May 20 Jun 1963,15656,4126,74410.7
64,27158,951
5,3208.3
-1,743-4,0482,305
3.7
OTM OTY1,1152,539
-1,424-2.4
The Memphis, TN-MS-AR MSA = Fayette, Shelby, & Tipton counties in Tennessee; Benton, Desoto, Marshall, Tate, & Tunica counties in Mississippi; & Crittenden County in Arkansas.
Texarkana MSA
The Texarkana MSA= Bowie County in Texas & Little River & Miller counties in Arkansas.
Memphis MSA - Unemployment RatesJune: 2010 - 2020
Texarkana MSA - Number of EmployedJanuary 2018 - June 2020
13
JuneARKANSASLABOR MARKET REPORT
w w w.d i scove r. a r ka n sa s .g ov
METROPOLITAN STATISTICAL AREASMETROPOLITAN STATISTICAL AREAS
Out-of-State MSAs
0.0%
2.0%
4.0%
6.0%
8.0%
10.0%
12.0%
14.0%
'10 '11 '12 '13 '14 '15 '16 '17 '18 '19 '20
48,000
52,000
56,000
60,000
64,000
68,000
J F M A M J J A S O N D
2018 2019 2020

Micropolitan Labor Force Est imates
Arkadelphia Micro = Clark CountyBatesville Micro = Independence CountyBlytheville Micro = Mississippi CountyCamden Micro = Calhoun & Ouachita countiesEl Dorado Micro = Union County
Forrest City Micro = St. Francis CountyHarrison Micro = Boone & Newton countiesHelena-West Helena Micro = Phillips CountyHope Micro = Hempstead & Nevada countiesMagnolia Micro = Columbia County
Malvern Micro = Hot Spring CountyMountain Home Micro = Baxter CountyParagould Micro = Greene CountyRussellville Micro = Pope & Yell countiesSearcy Micro = White County
Arkadelphia MicroBatesville Micro Blytheville MicroCamden Micro El Dorado Micro Forrest City MicroHarrison MicroHelena-West Helena MicroHope MicroMagnolia MicroMalvern MicroMountain Home MicroParagould MicroRussellville Micro Searcy Micro
8,71115,16015,20710,97413,8347,215
17,6505,434
12,0948,376
12,60314,66118,06133,76230,265
7871,2512,190
9031,704
7701,293
728938768
1,0821,4591,6822,6902,782
Micro Area CLF Emp Unemp8.37.6
12.67.6
11.09.66.8
11.87.28.47.99.18.57.48.4
Rate9,498
16,41117,39711,87715,5387,985
18,9436,162
13,0329,144
13,68516,12019,74336,45233,047
8,71815,17115,20010,98013,8457,212
17,6665,426
12,0978,381
12,56714,67818,09833,77430,293
8471,4512,641
9441,872
9821,609
857982829
1,2471,5881,9333,0003,050
CLF Emp Unemp8.98.7
14.87.9
11.912.08.3
13.67.59.09.09.89.78.29.1
Rate CLF Emp Unemp4.34.47.55.05.65.63.36.04.35.14.04.13.94.94.6
Rate
June 2020 May 2020 June 2019
Bella VistaBentonBentonvilleBlythevilleCabotConwayEl DoradoFayettevilleFort SmithHot SpringsJacksonvilleJonesboroLittle RockNorth Little RockParagouldPine BluffRogersRussellvilleSearcySherwoodSpringdaleTexarkana, ARVan BurenWest Memphis
11,99616,97126,2326,006
11,78232,9426,921
47,75038,56315,22811,63438,80996,56130,15112,64216,37534,92113,09910,01115,72838,42413,57310,15110,644
11,07415,65424,6955,122
10,83430,2755,993
43,89935,44513,13310,29835,65486,66526,58811,41214,53232,69112,1669,227
14,35336,16312,2609,4139,145
City CLF Emp Unemp7.77.85.9
14.78.08.1
13.48.18.1
13.811.58.1
10.211.89.7
11.36.47.17.88.75.99.77.3
14.1
Rate12,15717,18526,5676,097
11,95733,6717,013
48,73839,82615,72411,79739,67698,19630,72212,87516,57635,42213,23110,13616,07038,97113,74110,38710,736
11,14715,65924,859
5,11910,82730,2795,997
44,19035,57912,93510,30236,12486,69126,59611,43514,62232,90812,1769,236
14,35736,40312,1989,4459,129
CLF Emp Unemp8.38.96.4
16.09.5
10.114.59.3
10.717.712.79.0
11.713.411.211.87.18.08.9
10.76.6
11.29.1
15.0
Rate12,23517,77227,010
6,11712,35234,4657,040
48,14639,93315,02211,87039,35099,12430,43612,85816,72835,73613,37410,35916,33439,57713,95110,59810,655
11,80417,25826,3235,546
11,96133,3956,578
46,80938,50214,32411,35238,10395,53129,30812,30115,53134,84612,7649,878
15,82138,55913,27410,23210,078
431514687571391
1,070462
1,3371,431
698518
1,2473,5931,128
5571,197
890610481513
1,018677366577
CLF Emp Unemp3.52.92.59.33.23.16.62.83.64.64.43.23.63.74.37.22.54.64.63.12.64.93.55.4
Rate
June 2020 May 2020 June 2019
City Labor Force Statist ics
9,47916,71417,79712,55916,0958,355
19,7836,481
13,8069,186
14,24416,67020,25737,30433,955
405733
1,330634909471646392588471571691789
1,8291,553
9,56516,62217,84111,92415,7178,194
19,2756,283
13,0799,210
13,81416,26620,03136,77433,343
9,07415,98116,46711,92515,1867,884
19,1376,089
13,2188,715
13,67315,97919,46835,47532,402
Not Seasonally Adjusted
Not Seasonally Adjusted
14
JuneARKANSASLABOR MARKET REPORT
w w w.d i scove r. a r ka n sa s .g ov
MICROPOLITAN STATISTICAL AREAS AND CITIESMICROPOLITAN STATISTICAL AREAS AND CITIESCivilian Labor Force Estimates
9221,3171,537
884948
2,667928
3,8513,1182,0951,3363,1559,8963,5631,2301,8432,230
933784
1,3752,2611,313
7381,499
1,0101,5261,708
9781,1303,3921,0164,5484,2472,7891,4953,552
11,5054,1261,4401,9542,5141,055
9001,7132,5681,543
9421,607

ArkansasAshleyBaxterBentonBooneBradleyCalhounCarrollChicotClarkClayCleburneClevelandColumbiaConwayCraigheadCrawfordCrittendenCrossDallasDeshaDrewFaulknerFranklinFultonGarlandGrantGreeneHempsteadHot SpringHowardIndependenceIzardJacksonJeffersonJohnsonLafayetteLawrenceLeeLincolnLittle RiverLoganLonokeMadisonMarionMiller
9,0947,327
16,120133,64615,7124,3292,347
12,4813,1229,4985,4118,9393,1179,1448,081
54,93126,09821,1157,1682,6815,1917,534
60,0057,3084,914
41,3748,018
19,7439,476
13,6855,362
16,4114,8085,457
27,3169,9192,4016,7742,6743,8005,4118,205
33,0057,0866,510
19,549
8,5796,494
14,661125,20414,6344,0032,191
11,5602,6978,7114,9608,0922,8808,3767,425
50,64824,21218,6566,6432,4784,7166,881
55,4376,7554,560
36,9447,435
18,0618,837
12,6035,017
15,1604,2774,937
24,5969,1142,1676,2052,4193,5114,9777,430
30,4796,7155,954
17,842
515833
1,4598,4421,078
326156921425787451847237768656
4,2831,8862,459
525203475653
4,568553354
4,430583
1,682639
1,082345
1,251531520
2,720805234569255289434775
2,526371556
1,707
County CLF Emp Unemp5.7
11.49.16.36.97.56.67.4
13.68.38.39.57.68.48.17.87.2
11.67.37.69.28.77.67.67.2
10.77.38.56.77.96.47.6
11.09.5
10.08.19.78.49.57.68.09.47.75.28.58.7
Rate9,0427,407
16,266135,56115,9994,3552,341
12,7553,1019,5655,4269,1953,1589,2108,187
56,13026,68821,3087,2622,6905,2037,614
61,1557,5604,911
42,0908,046
20,0319,525
13,8145,372
16,6224,8605,442
27,66010,1902,4106,8282,7003,8195,4198,453
33,2657,1506,585
19,730
8,5726,493
14,678126,03414,6513,9962,188
11,5642,6888,7184,9498,0982,8908,3817,428
51,31524,29318,6236,6362,4794,7056,875
55,4456,7604,563
36,3877,429
18,0988,836
12,5675,010
15,1714,2804,926
24,7489,1162,1646,2212,4103,5234,9517,432
30,4606,7395,963
17,752
CLF Emp Unemp5.2
12.39.87.08.48.26.59.3
13.38.98.8
11.98.59.09.38.69.0
12.68.67.89.69.79.3
10.67.1
13.57.79.77.29.06.78.7
11.99.5
10.510.510.28.9
10.77.88.6
12.18.45.79.4
10.0
Rate9,5317,989
16,670137,24716,3814,6032,504
13,0793,3529,4795,7879,5903,2279,1868,467
55,87527,29121,6347,6222,9025,4837,857
63,1097,6045,181
41,9858,494
20,25710,07414,2445,758
16,7144,9275,907
27,98410,4782,5026,7482,8323,9795,6258,737
34,7437,4136,870
20,214
9,2387,533
15,979133,45715,8544,4022,388
12,7013,1169,0745,4929,1753,0998,7158,062
54,12726,31920,5607,2982,7515,2107,423
61,1507,3154,968
40,2958,201
19,4689,663
13,6735,550
15,9814,6285,489
26,2879,8742,3806,4372,7043,7855,3808,345
33,6497,2196,593
19,318
293456691
3,790527201116378236405295415128471405
1,748972
1,074324151273434
1,959289213
1,690293789411571208733299418
1,697604122311128194245392
1,094194277896
CLF Emp Unemp3.15.74.12.83.24.44.62.97.04.35.14.34.05.14.83.13.65.04.35.25.05.53.13.84.14.03.43.94.14.03.64.46.17.16.15.84.94.64.54.94.44.53.12.64.04.4
Rate
June 2020 May 2020 June 2019
(continued on Page 16)
Not Seasonally Adjusted
15
JuneARKANSASLABOR MARKET REPORT
w w w.d i scove r. a r ka n sa s .g ov
COUNTY LABOR FORCE STATISTICSCOUNTY LABOR FORCE STATISTICSCivilian Labor Force Estimates
470914
1,5889,5271,348
359153
1,191413847477
1,097268829759
4,8152,3952,685
626211498739
5,710800348
5,703617
1,933689
1,247362
1,451580516
2,9121,074
246607290296468
1,0212,805
411622
1,978

MississippiMonroeMontgomeryNevadaNewtonOuachitaPerryPhillipsPikePoinsettPolkPopePrairiePulaskiRandolphSt. FrancisSalineScottSearcySebastianSevierSharpStoneUnionVan BurenWashingtonWhiteWoodruffYell
17,3972,6862,7953,5563,2319,5304,0366,1624,1259,9677,817
28,3393,478
187,2737,2477,985
56,7334,1912,806
55,4365,2995,6864,570
15,5385,617
122,23033,0472,6058,113
15,2072,4352,5403,2573,0168,7833,7445,4343,8059,2397,169
26,1683,197
168,3576,6807,215
52,6273,9412,570
51,0784,9155,1444,139
13,8345,106
114,23830,2652,4037,594
County CLF Emp Unemp12.69.39.18.46.77.87.2
11.87.87.38.37.78.1
10.17.89.67.26.08.47.97.29.59.4
11.09.16.58.47.86.4
Rate17,8412,6552,8063,5543,2769,5834,0916,2834,171
10,1327,900
28,6353,439
190,4327,3068,194
57,3744,1952,846
57,2805,2895,7304,583
15,7175,720
124,28533,3432,6018,139
15,2002,4292,5233,2613,0158,7923,7425,4263,8009,3397,164
26,1893,191
168,4086,6817,212
52,6443,9342,574
51,2724,9115,1504,132
13,8455,108
114,99730,2932,3947,585
CLF Emp Unemp14.88.5
10.18.28.08.38.5
13.68.97.89.38.57.2
11.68.6
12.08.26.29.6
10.57.1
10.19.8
11.910.77.59.18.06.8
Rate17,7972,7993,1093,7323,402
10,0554,3326,4814,418
10,3108,183
28,9183,610
192,4837,3998,355
59,7564,3893,159
57,5055,5225,8774,863
16,0955,907
125,09933,9552,8018,386
16,4672,6632,9773,5553,2839,5374,1416,0894,2489,9207,831
27,4543,452
185,5807,0697,884
58,0204,2413,024
55,4845,2515,5564,628
15,1865,624
121,81232,4022,6488,021
1,330136132177119518191392170390352
1,464158
6,903330471
1,736148135
2,021271321235909283
3,2871,553
153365
CLF Emp Unemp7.54.94.24.73.55.24.46.03.83.84.35.14.43.64.55.62.93.44.33.54.95.54.85.64.82.64.65.54.4
Rate
June 2020 May 2020 June 2019
Not Seasonally Adjusted
(continued from Page 15)
Between May and June, unemployment rates declined in 66 of Arkansas’ 75 counties. Rates in eight counties increased, while one county was unchanged. Jobless rates ranged from a low of 5.2 percent in Madison County to a high of 13.6 percent in Chicot County.
In June, sixty-four counties posted unemployment rates at or above seven percent. That is down from 69 counties at or above seven percent in May. Monthly jobless rate changes ranged from a decline of three percentage points in Frankin County to an increase of nine-tenths of a percent-age point in Prairie County.
Compared to June 2019, unemployment rates are up in all 75 Arkansas counties. Over-the-year gains ranged from as low as a two percentage point increase in Calhoun and Yell counties to as much as a six and seven-tenths of a percentage point rise in Garland County.
2019
16
JuneARKANSASLABOR MARKET REPORT
w w w.d i scove r. a r ka n sa s .g ov
COUNTY LABOR FORCE STATISTICSCOUNTY LABOR FORCE STATISTICSCivilian Labor Force Estimates
County Labor Force Summary
2,190251255299215747292728320728648
2,171281
18,916567770
4,106250236
4,358384542431
1,704511
7,9922,782
202519
2,641226283293261791349857371793736
2,446248
22,024625982
4,730261272
6,008378580451
1,872612
9,2883,050
207554

County
June 2020 (Not Seasonally Adjusted)
MadisonArkansasScottBentonHowardYellWashingtonCalhounHempsteadNewtonBooneCrawfordFultonPerrySalineSevierCrossGrantPoinsettCarrollBradleyClevelandDallasFaulknerFranklin
5.25.76.06.36.46.46.56.66.76.76.97.27.27.27.27.27.37.37.37.47.57.67.67.67.6
Rate
1234557899
111212121212171717202122222222
Rank County
IndependenceLincolnLonokePopeCraigheadOuachitaPikeRandolphWoodruffHot SpringSebastianLittle RiverConwayJohnsonPrairieClarkClayPolkColumbiaLawrenceNevadaSearcyWhiteGreeneMarion
7.67.67.77.77.87.87.87.87.87.97.98.08.18.18.18.38.38.38.48.48.48.48.48.58.5
Rate
22222828303030303035353738383841414144444444444949
Rank County
DrewMillerBaxterMontgomeryVan BurenDeshaMonroeLoganStoneCleburneJacksonLeeSharpSt. FrancisLafayetteJeffersonPulaskiGarlandIzardUnionAshleyCrittendenPhillipsMississippiChicot
8.78.79.19.19.19.29.39.49.49.59.59.59.59.69.7
10.010.110.711.011.011.411.611.812.613.6
Rate
51515353535657585860606060646566676869697172737475
Rank
17
JuneARKANSASLABOR MARKET REPORT
w w w.d i scove r. a r ka n sa s .g ov
Ranked by Unemployment Rates
County Unemployment Rates
Yell
Polk
White
Union
ScottLee
Clark
Pope
Drew
Clay
Pike
Ashley
Desha
Benton
Izard
Saline
Logan
Miller
Grant
Newton
Pulaski
Arkansas
Lonoke
Dallas
Stone
Cross
Perry
Chicot
Sharp
Prairie
Madison
Fulton
Searcy
Phillips
Carroll
Jefferson
MarionBoone
Poinsett
Garland
Baxter
Sevier
Bradley
Mississippi
Nevada
Monroe
GreeneWashington
Ouachita
Johnson
Columbia
Jackson
Howard
Franklin
Faulkner
Lincoln
Calhoun
Conway
Van Buren
Craighead
Randolph
Crawford Cleburne
Hempstead
Woodruff
Montgomery
Lawrence
St. Francis
Cleveland
Hot Spring
Independence
Little River
Crittenden
Lafayette
Sebastian
Unemployment Rates< or = 5.0% [NONE]
5.1% - 7.0%
7.1% - 9.0%
9.1% - 11.0%
> 11.0%

Central (minus LR)City of Little RockEasternNorth CentralNortheastNorthwestSoutheastSouthwestWest CentralWestern
246,61996,56145,10492,054
121,470319,82278,84890,294
129,965109,055
225,86786,66540,36784,083
111,000298,55271,79282,674
118,648100,585
LWDA CLF Emp Unemp8.4
10.210.58.78.66.78.98.48.77.8
Rate250,12498,19645,74793,007
123,694324,72379,40590,840
131,688112,076
225,88686,69140,30784,115
111,803300,21571,91982,570
118,055100,855
CLF Emp Unemp9.7
11.711.99.69.67.59.49.1
10.410.0
Rate257,37699,12446,92495,722
124,173329,32082,49994,169
133,816113,709
248,98395,53144,53591,099
118,980319,92278,29489,674
127,819109,535
CLF Emp Unemp3.33.65.14.84.22.95.14.84.53.7
Rate
June 2020 May 2020 June 2019
Yell
Polk
White
Union
ScottLee
Clark
Pope
Drew
Clay
Pike
Ashley
Desha
Benton
Izard
Saline
Logan
Miller
Grant
Newton
Pulaski
Arkansas
Lonoke
Dallas
Stone
Cross
Perry
Chicot
Sharp
Prairie
Madison
Fulton
Searcy
Phillips
Carroll
Jefferson
MarionBoone
Poinsett
Garland
Baxter
Sevier
Bradley
Mississippi
Nevada
Monroe
Greene
Washington
Ouachita
Johnson
Columbia
Jackson
Howard
Franklin
Faulkner
Lincoln
Calhoun
Conway
Van Buren
Craighead
Randolph
CrawfordCleburne
Hempstead
Woodruff
Montgomery
Lawrence
Crittenden
St. Francis
Cleveland
Lafayette
Hot Spring
Sebastian
Independence
Little River
Central (minus LR)
Eastern
North Central
Northeast
Northwest
Southeast
Southwest
West Central
Western
20,7529,8964,7377,971
10,47021,2707,0567,620
11,3178,470
24,23811,5055,4408,892
11,89124,5087,4868,270
13,63311,221
8,3933,5932,3894,6235,1939,3984,2054,4955,9974,174
Not Seasonally Adjusted
18
JuneARKANSASLABOR MARKET REPORT
w w w.d i scove r. a r ka n sa s .g ov
LOCAL WORKFORCE DEVELOPMENT AREASLOCAL WORKFORCE DEVELOPMENT AREASCivilian Labor Force Estimates