Pyramid - AnnualReports.co.uk€¦ · · 2016-09-28April 5, 2012 Dear Fellow Stockholder,

April 6, 2010 14:28 WSPC/185-JBCB S0219720010004756
Journal of Bioinformatics and Computational BiologyVol. 8, No. 2 (2010) 219–246c© Imperial College PressDOI: 10.1142/S0219720010004756
UNDERSTANDING DISTAL TRANSCRIPTIONALREGULATION FROM SEQUENCE, EXPRESSION
AND INTERACTOME PERSPECTIVES
ARVIND RAO∗, DAVID J. STATES†
and ALFRED O. HERO, III‡
Bioinformatics, University of MichiganAnn Arbor, MI 48109, USA
∗[email protected]†[email protected]‡[email protected]
JAMES DOUGLAS ENGEL
Cell and Developmental BiologyUniversity of Michigan
Ann Arbor, MI 48109, [email protected]
Received 20 July 2009Revised 17 October 2009Accepted 17 October 2009
Gene regulation in eukaryotes involves a complex interplay between the proximal pro-moter and distal genomic elements (such as enhancers) which work in concert to driveprecise spatio-temporal gene expression. The experimental localization and characteri-zation of gene regulatory elements is a very complex and resource-intensive process. Thecomputational identification of regulatory regions that confer spatiotemporally specifictissue-restricted expression of a gene is thus an important challenge for computationalbiology. One of the most popular strategies for enhancer localization from DNA sequenceis the use of conservation-based prefiltering and more recently, the use of canonical (tran-scription factor motifs) or de novo tissue-specific sequence motifs. However, there is anongoing effort in the computational biology community to further improve the fidelity ofenhancer predictions from sequence data by integrating other, complementary genomicmodalities.
In this work, we propose a framework that complements existing methodologies forprospective enhancer identification. The methods in this work are derived from twokey insights: (i) that chromatin modification signatures can discriminate proximal and
distally located regulatory regions and (ii) the notion of promoter-enhancer cross-talk
∗Corresponding author.
219

April 6, 2010 14:28 WSPC/185-JBCB S0219720010004756
220 A. Rao et al.
(as assayed in 3C/5C experiments) might have implications in the search for regula-tory sequences that co-operate with the promoter to yield tissue-restricted, gene-specific
expression.
Keywords: Nephrogenesis; random forests; transcriptional regulation; transcription fac-tor binding sites (TFBS); GATA genes; comparative genomics; functional genomics;tissue-specific genes; network analysis; directed information; heterogeneous dataintegration.
1. Introduction
Understanding the mechanisms underlying regulation of tissue-specific gene expres-sion remains a challenging question. While all mature cells in the body have acomplete copy of the human genome, each cell type only expresses those genes itneeds to carry out its assigned task. This includes genes required for basic cellularmaintenance (often called “housekeeping genes”) and those genes whose functionis specific to the particular tissue type that the cell belongs to. Gene expressionby way of transcription is the process of generation of messenger RNA (mRNA)from the DNA template representing the gene. It is the intermediate step beforethe generation of functional protein from messenger RNA. During gene expression,transcription factor (TF) proteins are recruited at the proximal promoter of thegene as well as at sequence elements (enhancers/silencers) which can lie severalhundreds of kilobases from the gene’s transcriptional start site (Figs. 1 and 2).
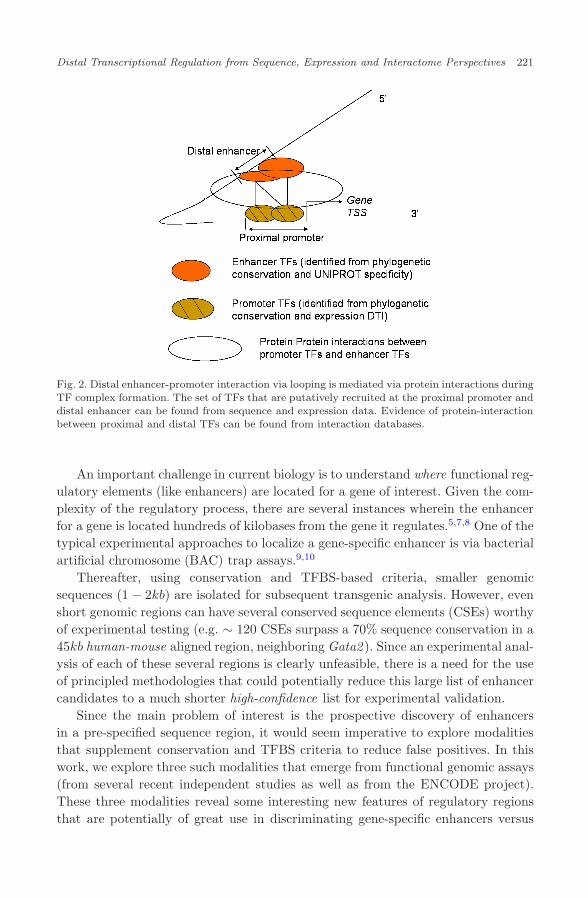
It is hypothesized that the collective set of transcription factors that drive (reg-ulate) expression of a target gene are cell, context-and tissue-dependent.1,2 Some ofthese TFs are recruited at proximal regions such as the promoter of the gene, whileothers are recruited at these distal regulatory regions. There are several (hypothe-sized) mechanisms for promoter-enhancer interaction through protein interactionsbetween TFs recruited at these elements during formation of the transcriptionalcomplex.3 A commonly accepted mechanism of distal interaction, during regula-tion, is looping,4–6 shown in Fig. 2, wherein intervening DNA between the enhancerand promoter is “looped out” to facilitate the interaction between the TFs of thepromoter and the enhancer, leading to formation of the transcriptional complex.
TF Complex
Promoter (proximal)
TATA box
Exon Intron
Distal Enhancer
Distal Enhancer
TSSRNA Pol II
Fig. 1. Schematic of transcriptional regulation. Sequence motifs at the promoter and the distalregulatory elements together confer specificity of gene expression via TF binding.
April 6, 2010 14:28 WSPC/185-JBCB S0219720010004756
Distal Transcriptional Regulation from Sequence, Expression and Interactome Perspectives 221
Fig. 2. Distal enhancer-promoter interaction via looping is mediated via protein interactions duringTF complex formation. The set of TFs that are putatively recruited at the proximal promoter anddistal enhancer can be found from sequence and expression data. Evidence of protein-interactionbetween proximal and distal TFs can be found from interaction databases.
An important challenge in current biology is to understand where functional reg-ulatory elements (like enhancers) are located for a gene of interest. Given the com-plexity of the regulatory process, there are several instances wherein the enhancerfor a gene is located hundreds of kilobases from the gene it regulates.5,7,8 One of thetypical experimental approaches to localize a gene-specific enhancer is via bacterialartificial chromosome (BAC) trap assays.9,10
Thereafter, using conservation and TFBS-based criteria, smaller genomicsequences (1 − 2kb) are isolated for subsequent transgenic analysis. However, evenshort genomic regions can have several conserved sequence elements (CSEs) worthyof experimental testing (e.g. ∼ 120 CSEs surpass a 70% sequence conservation in a45kb human-mouse aligned region, neighboring Gata2 ). Since an experimental anal-ysis of each of these several regions is clearly unfeasible, there is a need for the useof principled methodologies that could potentially reduce this large list of enhancercandidates to a much shorter high-confidence list for experimental validation.
Since the main problem of interest is the prospective discovery of enhancersin a pre-specified sequence region, it would seem imperative to explore modalitiesthat supplement conservation and TFBS criteria to reduce false positives. In thiswork, we explore three such modalities that emerge from functional genomic assays(from several recent independent studies as well as from the ENCODE project).These three modalities reveal some interesting new features of regulatory regionsthat are potentially of great use in discriminating gene-specific enhancers versus

April 6, 2010 14:28 WSPC/185-JBCB S0219720010004756
222 A. Rao et al.
other neutral regions. We note that there are promoter-independent enhancers too,and that their computational study has been far more principled.1,11 However,their study is outside the scope of this study where we focus on gene-specificity inaddition to tissue-specificity.
Understanding the characteristics of such regulatory regions entails severalaspects:
(1) Do regulatory regions like promoters and enhancers have any interestingsequence properties that depend on their tissue-specificity of gene expression?Such properties can be examined based on their individual sequences or theirepigenetic preferences. A common approach is the identification of canonicalor de novo tissue-specific motif-signatures2,13 for such elements, and has beenapplied quite extensively. In this work, we focus on the sequence-specificity andepigenetic preferences of tissue-specific distal regulatory regions (enhancers)versus proximal regulatory regions (promoters).
(2) To reduce the large number of false positives that arise from sequence com-parisons alone, we appeal to a mechanistic insight from biology. For long-rangetranscriptional regulation to be possible, there has to be an enhancer-promoterinteraction during formation of the tissue-specific, gene-specific transcriptionalmachinery. Literature suggests that such interaction is mediated by protein-protein interactions between promoter TFs and enhancer TFs after loopingalong the chromosomal length.4,6,14 This insight (Fig. 2) leads to two furtherquestions:
• Which TFs bind the promoter and the putative enhancer(s)?• Does this resultant “interaction graph” between enhancer and promoter
TFs have any special structural characteristic that can discriminate func-tional non-coding regulatory regions from non-functional ones?
The primary goal of answering the questions above is to build an enhancerdiscovery program that can localize tissue-restricted gene-specific enhancers in agiven chunk of genome sequence (within a ∼ 200kb genomic window, as obtainedfrom BAC trap strategies10). These questions will help us understand the natureof distal regulatory regions and provide a way to complement existing approachesin enhancer localization11,12 to achieve lower false positive rate and higher experi-mental efficacy.
As a case study to answer these questions, we examine the distal regulation ofGata2 regulation in the developing kidney. Gata2 is a gene belonging to the GATAfamily of transcription factors (GATA1-6 ), and binds the consensus –WGATAR–motif on DNA. It is located on mouse chromosome 6, and plays an important role inmammalian hematopoiesis, nephrogenesis and CNS development, with importantphenotypic consequences. The study of long-range regulatory elements that effectGata2 expression has been ongoing for several years now.

April 6, 2010 14:28 WSPC/185-JBCB S0219720010004756
Distal Transcriptional Regulation from Sequence, Expression and Interactome Perspectives 223
Recently, Khandekar and co-workers10 reported the characterization of twoenhancer elements, conferring urogenital-specific (UG) expression of Gata2, between80–150kb downstream from the Gata2 transcription start site on chromosome 6. Inthis experiment, four regions were selected for transgenic analysis based on sequenceidentity and TF motif matches. However, only two of these were functional.
Based on the insights from the various individual studies since and the ENCODEproject, outlined above, we asked if it might now be possible to explain the behaviorof these four regions along these new modalities (tissue-specificity, epigenetic sig-natures and TF-interaction graphs), thereby enabling the proposal of a frameworkfor promoter-specific enhancer discovery from sequence.
2. Rationale and Data Sources
The overall schematic of distal transcriptional regulation via looping is shown inFig. 2. This schematic and the discussion in Sec. 1 suggests the decompositionof the regulatory process along three main modalities: sequence, expression andinteractome. Our main goal in this paper is to understand urogenital enhancerpotential of these four UG sequence candidates10 from these three perspectives.These attributes are discussed below:
(1) Sequence perspective: To build motif signatures underlying kidney-specificenhancer activity, it would be ideal to have a database of known, previ-ously characterized, urogenital (UG) enhancers so that we could learn thesequence preferences of such tissue-specific regulatory regions. However, dueto the unavailability of such data, we instead utilize kidney-specific promotersequences (like in Refs. 2, 13, or 15). Apart from this approach, we also exam-ine a public dataset of histone-modified sequences of regulatory regions to findmotif-signatures of genomic elements that are potentially enhancers. Thoughthis data source is not kidney-specific, we observe that these epigenetic signa-tures have a strong, discriminative association with distal regulatory regions.
• Chromatin marks in known regulatory elements: The ENCODE project suggeststhat mono-methylation of the lysine 4 residue of Histone H3 is associated withenhancer (or distal regulatory) activity16 whereas tri-methylation of H3K4and H3 acetylation are associated with promoter activity. Using this set ofH3K4me1, H3K4me3 and H3ac sequences, we aim to find sequence motifsthat are indicative of such epigenetic preferences during transcription. Thoughsuch epigenetic data is available for five different cell lines, we choose the HeLacell line data because of its widespread use as a model system to understandtranscriptional regulation in vitro in the laboratory.
For simplicity, we find the frequencies of six-nucleotide long motifs inthe H3K4me1 and H3K4me3/H3ac sequences. Then, we build a randomforest (RF) classifier to discriminate monomethylated-H3K4 sequences fromtrimethylated-H3K4/acetylated-H3 sequences based on motif occurrence.We note that even though this data is not kidney cell-specific, it has favorable

April 6, 2010 14:28 WSPC/185-JBCB S0219720010004756
224 A. Rao et al.
specificity and sensitivity characteristics. The motifs thus obtained are puta-tively associated with epigenetic properties of proximal and distally locatedregulatory regions (such as enhancers), and are predictive of the regulatorypotential of new sequences (Sec. 8).
• Promoters of kidney-specific genes: A catalog of kidney-specific mouse pro-moters is available from the GNF Symatlas (http://symatlas.gnf.org/ ). Thisdatabase contains a list of annotated genes and their expression in several tissuetypes, including the kidney. Since the proximal promoter of such kidney-specificgenes harbors the transcriptional machinery for gene regulation, their sequencesputatively have motifs that are associated with kidney-specific expression.Additionally, promoters that are spatio-temporally expressed during kidneydevelopment are also analyzed (MGI: http://www.informatics.jax.org/ ). TheGNF dataset profiles mostly adult tissue-types. Since our goal is to studyenhancer activity during nephrogenesis, we focus on genes expressed betweenday e10 and e12 in the developing kidney — such a list is obtained from theMGI database.
Without loss of generality, we use six-nucleotide motifs (hexamers) for char-acterizing these sequences. This is based on the observation that most transcrip-tion factor binding motifs have a 5–6 nucleotide core sequence with degeneracyat the ends of the motif. A similar strategy was introduced in Refs. 17 and18. The main difference in our approach from such previous work is that dif-ferential hexamer analysis was done for the same class of sequences, and thestatistical nature of the “test-set” is, by design, similar to the training set. Thatis, in Ref. 17, differential hexamers are found between known Cis-RegulatoryModules (CRMs) and non-CRMs, and used for the prediction of new CRMsfrom sequence. On the other hand, Ref. 18 deals with finding hexamer featuresof known promoters and using them to predict new promoters from sequence.In our case, however, we do not have enhancer sequence data (equivalent toCRMs) and we are using promoter sequence-data for the prediction of enhancers(CRMs) instead. Thus, the nature of the test sequence is very different. Wedemonstrate that our approach is partially useful in the discovery of putativeenhancers from sequence. Also, the presented motif-finding approach does notdepend on motif length and can be scaled, depending on biological knowledge.
We set up the motif discovery as a feature extraction problem from thesetissue-specific promoter sequences and then build a random forest (RF) classi-fier to classify new sequences into tissue-specific and non tissue-specific cat-egories based on these identified sequence features (motifs). Based on themotifs derived using a RF classifier algorithm we are able to accurately classifymore than 95% (training-error rate) of tissue-specific genes based upon theirupstream promoter region sequences alone. Since promoters are non-codingregulatory regions, the derived motifs can be putatively used to find kidney-specificity of other non-coding regions genome-wide (Sec. 9).

April 6, 2010 14:28 WSPC/185-JBCB S0219720010004756
Distal Transcriptional Regulation from Sequence, Expression and Interactome Perspectives 225
(2) Expression perspective: There is limited expression data for the devel-oping mouse kidney, mainly due to small tissue yield at such early timepoints. For this study, we use microarray expression data from a pub-lic repository of kidney microarray data (http://genet.chmcc.org, Ref. 19,http://spring.imb.uq.edu.au/ ).20 Each of these resources contain expressiondata profiling kidney development from about day 10.5 dpc to the neonatestage. Such expression data can be mined for potential regulatory influencebetween upstream TF genes and Gata2.21,22
• Inference of TF effectors at the promoter region: The TFs putatively recruitedat the proximal promoter are identified using the directed information (DTI)metric, that uses gene-expression (mRNA-level) influence in addition to phylo-genetic conservation of the corresponding binding site. We have earlier shownthat DTI is a good predictor of gene influence and can be used to infer tran-scriptional regulatory networks.22
• Inference of TF effectors at each non-coding region: At the distal enhancer, itis believed that there is recruitment of tissue-specific transcription factors thatco-operate with the basal transcriptional machinery (at the promoter) to directtissue-specific gene expression.23,2 Whereas phylogeny and expression-basedinfluence metrics can yield high confidence candidates for promoter TFs, a sim-ilar analysis for enhancers is not possible, because of higher order effects.2,13
To this end, the only way to search for putative enhancer TFs is to combinephylogeny with tissue-specific annotation (from UNIPROT or MGI). Hence,every transcription factor, whose motif is conserved at a non-coding (puta-tive enhancer) region and is tissue-specific in annotation, is considered a likelycandidate TF at that non-coding region.
(3) Interactome perspective: The identification of phylogenetically con-served effector TFs at the promoter (identified via DTI), as well asthose that are phylogenetically conserved at the putative enhancer candi-date regions, lead to the exploration of protein-interactions (PPI) betweenthese TFs, during distal enhancer-promoter interaction (Sec. 10). TheSTRING database (http://string.embl.de) integrates various experimentalmodalities (genomic context, high-throughput experiments such as co-immunoprecipitation, co-expression and literature) to maintain a list oforganism-specific functional protein-association networks that is amenable tosuch exploration.
In this work, the above perspectives are examined in the context of the urogen-ital enhancers identified in Ref. 10. We aim to show that each of these modalities(tissue-specificity motifs, epigenetic signatures and TF-interaction graphs) has apredictive value for the identification of enhancers and the integration of these het-erogeneous perspectives can lead to potential reduction in false positive rate duringlarge-scale enhancer discovery, genome-wide. Such analyses can also be examined
April 6, 2010 14:28 WSPC/185-JBCB S0219720010004756
226 A. Rao et al.
in the context of new studies.24,25 To date, there has been no comprehensive studyfor summarizing these various heterogeneous data sources to understand the char-acteristics of such regulatory regions.
3. Validation/Biological Application
As suggested in Sec. 1, we use the recently identified Gata2 urogenital (UG)enhancers to validate our computational approach. All the data sources (and theiranalysis) are therefore going to be focused on the developing kidney.
The experimental characterization of these enhancers was done as follows. Basedon BAC transgenic10 studies, the approximate location of the urogenital enhancer(s)of Gata2 were localized to a 70 kilobase region on chromosome 6. Using inter-species conservation plots, four elements were selected for transgenic analysis inthe mouse. These were designated UG1, 2, 3 and 4. After a lengthy and resource-intensive experimental effort, two out of these four non-coding elements, UG2 andUG4, were found to be true UG enhancers. Our goal is to find preferences at thesequence, expression and interactome level that can explain these experimentalobservations: i.e. that UG2, 4 are Gata2 -specific urogenital enhancers and UG1, 3are not urogenital enhancers for Gata2.
It is easy to see the utility of such an “enhancer discovery” methodology, sincethis can be applied also to other genes of interest. Given the complexity of 1% of thegenome, made possible by the ENCODE project, the search for functional elementsgenome-wide is going to be an important and challenging exercise.
4. Organization
With a view to understanding the discriminating characteristics of transcriptionalregulatory regions, the first part of this paper (Secs. 5–8) addresses identification ofmotif signatures representative of transcriptional control from kidney-promoter andepigenetically marked sequence sets. The second part of this work (Secs. 10.1–10.2)integrates phylogeny and expression data to find regulatory TFs at the proximalpromoter and enhancer(s) of Gata2. Using the notion of TF interactions betweenenhancer and promoter, we examine if protein-interaction data (Sec. 10.3) can offersupporting evidence for the observed in-vivo behavior of the four Gata2 candidatesequences. Classifiers are designed to discriminate regulatory versus non-regulatoryregions based on these three modalities (kidney-specific motifs, epigenetic signaturesand TF-interaction graphs). Finally, a probabilistic combination of these classifiersis done to obtain a validation (Sec. 11) of the Gata2 UG enhancer (UGE) candidates(UG1 − 4). Sections 12 and 13 conclude the paper.
5. Sequence Data Extraction and Pre-Processing
Before proceeding to motif identification, a matrix of motif–chromatin-sequencecorrespondences is created. In this matrix, the counts of hexamer (six-nucleotide)
April 6, 2010 14:28 WSPC/185-JBCB S0219720010004756
Distal Transcriptional Regulation from Sequence, Expression and Interactome Perspectives 227
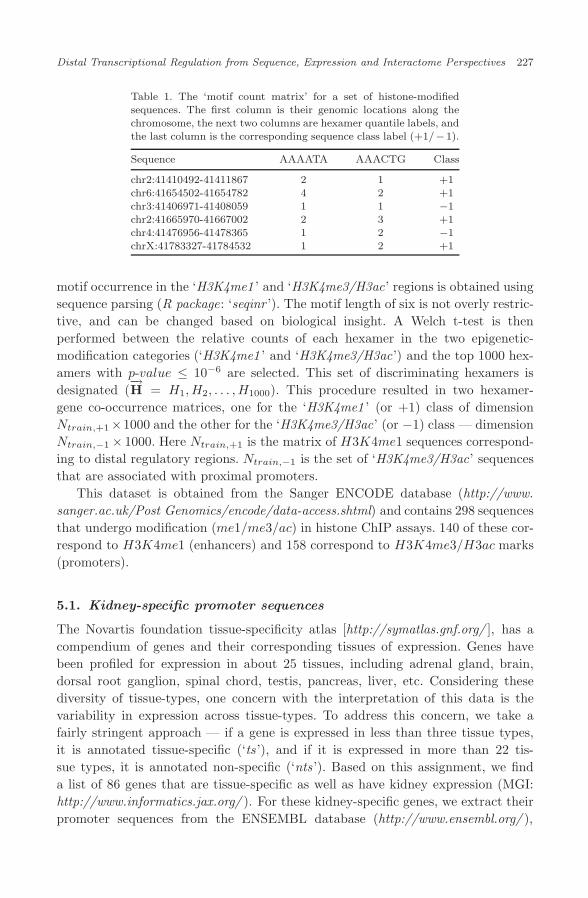
Table 1. The ‘motif count matrix’ for a set of histone-modifiedsequences. The first column is their genomic locations along thechromosome, the next two columns are hexamer quantile labels, andthe last column is the corresponding sequence class label (+1/−1).
Sequence AAAATA AAACTG Class
chr2:41410492-41411867 2 1 +1chr6:41654502-41654782 4 2 +1chr3:41406971-41408059 1 1 −1chr2:41665970-41667002 2 3 +1chr4:41476956-41478365 1 2 −1chrX:41783327-41784532 1 2 +1
motif occurrence in the ‘H3K4me1 ’ and ‘H3K4me3/H3ac’ regions is obtained usingsequence parsing (R package: ‘seqinr ’). The motif length of six is not overly restric-tive, and can be changed based on biological insight. A Welch t-test is thenperformed between the relative counts of each hexamer in the two epigenetic-modification categories (‘H3K4me1 ’ and ‘H3K4me3/H3ac’) and the top 1000 hex-amers with p-value ≤ 10−6 are selected. This set of discriminating hexamers isdesignated (
−→H = H1, H2, . . . , H1000). This procedure resulted in two hexamer-
gene co-occurrence matrices, one for the ‘H3K4me1 ’ (or +1) class of dimensionNtrain,+1×1000 and the other for the ‘H3K4me3/H3ac’ (or −1) class — dimensionNtrain,−1 × 1000. Here Ntrain,+1 is the matrix of H3K4me1 sequences correspond-ing to distal regulatory regions. Ntrain,−1 is the set of ‘H3K4me3/H3ac’ sequencesthat are associated with proximal promoters.
This dataset is obtained from the Sanger ENCODE database (http://www.sanger.ac.uk/Post Genomics/encode/data-access.shtml) and contains 298 sequencesthat undergo modification (me1/me3/ac) in histone ChIP assays. 140 of these cor-respond to H3K4me1 (enhancers) and 158 correspond to H3K4me3/H3ac marks(promoters).
5.1. Kidney-specific promoter sequences
The Novartis foundation tissue-specificity atlas [http://symatlas.gnf.org/ ], has acompendium of genes and their corresponding tissues of expression. Genes havebeen profiled for expression in about 25 tissues, including adrenal gland, brain,dorsal root ganglion, spinal chord, testis, pancreas, liver, etc. Considering thesediversity of tissue-types, one concern with the interpretation of this data is thevariability in expression across tissue-types. To address this concern, we take afairly stringent approach — if a gene is expressed in less than three tissue types,it is annotated tissue-specific (‘ts ’), and if it is expressed in more than 22 tis-sue types, it is annotated non-specific (‘nts ’). Based on this assignment, we finda list of 86 genes that are tissue-specific as well as have kidney expression (MGI:http://www.informatics.jax.org/ ). For these kidney-specific genes, we extract theirpromoter sequences from the ENSEMBL database (http://www.ensembl.org/ ),

April 6, 2010 14:28 WSPC/185-JBCB S0219720010004756
228 A. Rao et al.
using sequence 2000bp upstream and 1000bp downstream up to the first exon rel-ative to the transcriptional start site reported in ENSEMBL (release 37).
6. Motif-Class Correspondence Matrices
From the above, Ntrain,+1 × 1000 and Ntrain,−1 × 1000 dimensional count matricesare available for the chromatin-modified sequences. Before proceeding to the feature(hexamer motif) selection step, the counts of the M = 1000 hexamers in eachtraining sample are normalized to account for variable sequence lengths. In the co-occurrence matrix, let gci,k represent the absolute count of the kth hexamer, k ∈1, 2, . . . , M in the ith chromatin-sequence. Then, for each sequence gi, the quantilelabeled matrix has Xi,k = l if gci,[ l−1
K M ] ≤ gci,k < gci,[ lK M ], K = 4. Matrices of
dimension Ntrain,+1×1001, Ntrain,−1×1001 for the specific and non-specific trainingsamples are now obtained. Each matrix contains the quantile label assignments forthe 1000 hexamers (Xi, i ∈ (1, 2, . . . , 1000)), as stated above, and the last columnwould have the corresponding class label (Y = −1/ + 1). Having constructed twogroups of sequences for analysis — enhancer-associated (‘H3K4me1 ’) and promoter-associated (‘H3K4me3/H3ac’) — we seek to find the smallest set of hexamer motifsthat are most discriminatory between these two classes. Towards this goal, we userandom forest classifiers (RF)26 for finding such a discriminative hexamer subset.
Based on the above strategy for epigenetically marked sequences, we followthe same procedure, from sequence extraction, parsing and quantization to obtainhexamer-promoter counts for the kidney-specific gene promoter sequences. As anillustration, we show a representative matrix (Table 2).
7. Random Forest Classifiers
A random forest (RF) is an ensemble of classifiers obtained by aggregating (bagging)several classification trees.26 Each data point (represented as an input vector) isclassified based on the majority vote gained by that vector across all the trees of
Table 2. The ‘motif count matrix’ for a set of gene-promoters.The first column is their ENSEMBL gene identifiers, the nexttwo columns are hexamer quantile labels, and the last columnis the corresponding gene’s class label (+1/ − 1).
Ensembl Gene ID AAAAAA AAATAG Class
ENSG00000155366 1 1 +1ENSG000001780892 4 3 +1ENSG00000189171 1 2 −1ENSG00000168664 4 3 −1ENSG00000160917 2 1 −1ENSG00000176749 1 1 −1ENSG00000006451 3 2 +1

April 6, 2010 14:28 WSPC/185-JBCB S0219720010004756
Distal Transcriptional Regulation from Sequence, Expression and Interactome Perspectives 229
the forest. Each tree of the forest is grown in the following way:
• A bootstrapped sample (with replacement) of the training data is used to groweach tree. The sampling for bootstrapped data selection is done individually ateach tree of the forest.
• For an M -dimensional input vector, a random subspace of m (� M)-dimensionsis selected, and the best split on this subspace is used to split the node. This isdone for all nodes of the tree.
During the training step, before sampling by replacement, one-third of the casesare kept “out of the training bag.” This OOB (out-of-bag) data is used to obtainan unbiased estimate of the classification error as trees are added to the forest. Itis also used to get estimates of variable importance.
Several interesting insights into the data are available using random forest anal-ysis. The variable importance plot yields the variables that are most discriminatoryfor classification under the ‘ensemble of trees’ classifier. This importance is basedon two measures: ‘Gini index’ and ‘decrease in accuracy.’ The Gini index is anentropy-based criterion which measures the purity of a node in the tree, while theother metric simply looks at the relative contribution of each variable to the accu-racy of the classifier. For our studies, we use the ‘randomForest’ package for R.The classifier performance on the individual data and the related diagnostics arementioned under Sec. 8.
8. Random Forests on Chromatin-Modified Sequences
We train the RF classifier on the set of 298 chromosome sequences that have varyingchromatin modifications associated with them (i.e. H3K4me1/me3, and H3ac),as mentioned in Sec. 2. These are derived from the HeLa cell line and are notnecessarily context-specific for kidney development. However, given the widespreaduse of this cell line for transcriptional studies, we aim to find if the motifs associatedwith regulatory elements are indeed predictive of enhancer activity.
Before proceeding to motif identification, we check for possible sequence bias(such as GC-nucleotide composition) between these two classes of chromatin mod-ified sequences. If there is a significant bias, then the motifs turn out to be justGC-rich sequences that are not very biologically informative for determination ofregulatory potential. The GC composition of these two classes of sequences is rep-resented in Fig. 3. As can be seen, the average GC composition is the same andthere is no such sequence bias that would skew the discovery and subsequent inter-pretation of these epigenetic motifs. The performance of the histone-RF classifieris explained in the context of the classifier combination in Sec. 11.
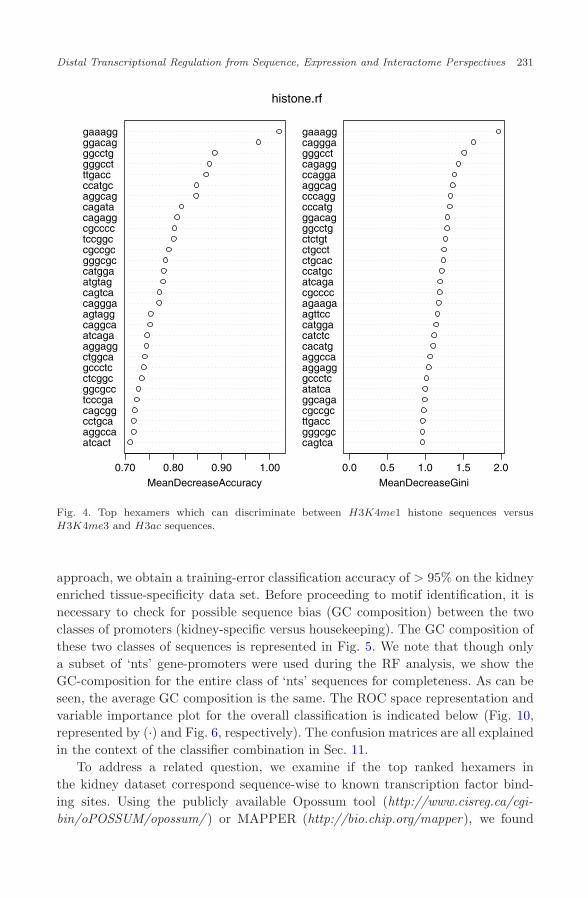
The motifs obtained from the random forest analysis indicate the “sequence-preferences” of regulatory elements that are nucleosome-free in HeLa cells (Fig. 4).We analyze the performance of these classifiers on the 4 UG candidate regions,mentioned previously. In both cases, UG2 − 4 are classified as enhancers, whereas

April 6, 2010 14:28 WSPC/185-JBCB S0219720010004756
230 A. Rao et al.
0.3
0.4
0.5
0.6
0.7
0.8
0.3
0.4
0.5
0.6
0.7
Histogram of GC.class0
GC.class0
Fre
quen
cy
0.3 0.4 0.5 0.6 0.7 0.8
05
1015
2025
30
Histogram of GC.class1
GC.class1
Fre
quen
cy
0.3 0.4 0.5 0.6 0.7
05
1015
2025
Fig. 3. GC plots for sequence bias in H3K4me1 histone sequences versus H3K4me3 and H3acsequences. We observe that there is no significant bias in GC content.
UG1 is correctly classified as not being regulatory. Additionally, a control set of“promoter-independent” enhancers derived from the Mouse Enhancer database1
was also classified as enhancers based on these chromatin-sequence motif signatures.This high prediction accuracy in spite of non-specificity of cell context (HeLa cellline) is very interesting and has potentially high predictive value.
9. Random Forests on Kidney-Specific Promoters
In this section, we aim to find discriminating sequence motifs between a set ofkidney-specific promoters and housekeeping promoters with a goal to find sequencemotifs underlying kidney-specific regulation. The kidney enriched dataset has 86genes that are assigned to a tissue specific class and have higher than mean expres-sion in the kidney. For the purpose of training and testing, we consider the set ofhousekeeping genes identified from the ‘nts ’ class and reported in literature.27,28
There are almost 1500 genes in the housekeeping gene (‘nts ’) set. Since this wouldlead to unbalanced predictions during classifier training, we use a stratified sam-pling approach29 to select a sample size that reduces this effect (the sampling itselfis done with a prior on the relative sizes of the two classes). Here, the set of (−1)promoter-sequences are taken to be of the same size as the (+1) class. Using this
April 6, 2010 14:28 WSPC/185-JBCB S0219720010004756
Distal Transcriptional Regulation from Sequence, Expression and Interactome Perspectives 231
atcactaggccacctgcacagcggtcccgaggcgccctcggcgccctcctggcaaggaggatcagacaggcaagtaggcagggacagtcaatgtagcatggagggcgccgccgctccggccgcccccagaggcagataaggcagccatgcttgaccgggcctggcctgggacaggaaagg
0.70 0.80 0.90 1.00MeanDecreaseAccuracy
cagtcagggcgcttgacccgccgcggcagaatatcagccctcaggaggaggccacacatgcatctccatggaagttccagaagacgccccatcagaccatgcctgcacctgcctctctgtggcctgggacagcccatgcccaggaggcagccaggacagagggggcctcagggagaaagg
0.0 0.5 1.0 1.5 2.0MeanDecreaseGini
histone.rf
Fig. 4. Top hexamers which can discriminate between H3K4me1 histone sequences versusH3K4me3 and H3ac sequences.
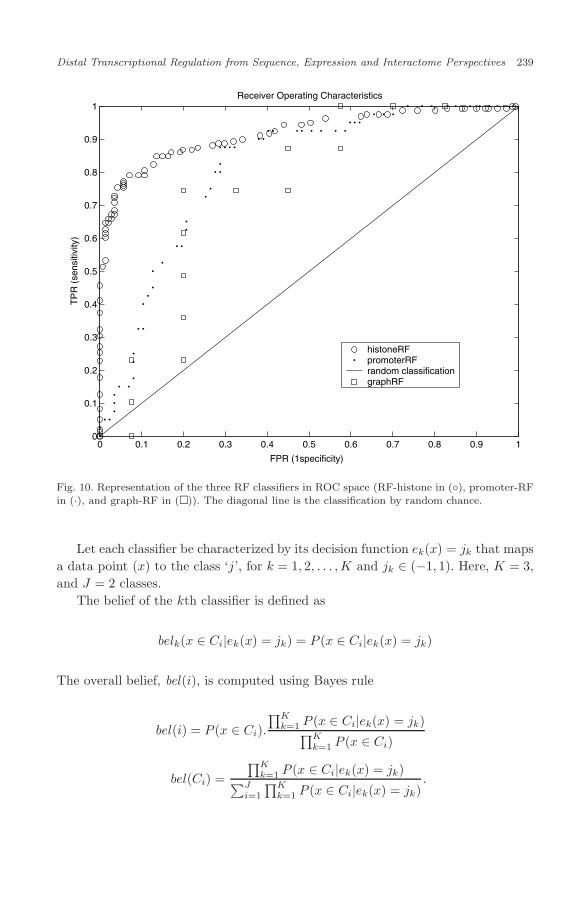
approach, we obtain a training-error classification accuracy of > 95% on the kidneyenriched tissue-specificity data set. Before proceeding to motif identification, it isnecessary to check for possible sequence bias (GC composition) between the twoclasses of promoters (kidney-specific versus housekeeping). The GC composition ofthese two classes of sequences is represented in Fig. 5. We note that though onlya subset of ‘nts’ gene-promoters were used during the RF analysis, we show theGC-composition for the entire class of ‘nts’ sequences for completeness. As can beseen, the average GC composition is the same. The ROC space representation andvariable importance plot for the overall classification is indicated below (Fig. 10,represented by (·) and Fig. 6, respectively). The confusion matrices are all explainedin the context of the classifier combination in Sec. 11.
To address a related question, we examine if the top ranked hexamers inthe kidney dataset correspond sequence-wise to known transcription factor bind-ing sites. Using the publicly available Opossum tool (http://www.cisreg.ca/cgi-bin/oPOSSUM/opossum/ ) or MAPPER (http://bio.chip.org/mapper), we found

April 6, 2010 14:28 WSPC/185-JBCB S0219720010004756
232 A. Rao et al.
Fig. 5. GC plots for sequence bias in kidney-specific versus housekeeping promoters.
atgcacccagctgatttccatcgtggggctgaggtcgagggtgggtcagccccccccaggtcatctcccgtcaggctccaaattgcagggggcgtgaggcggtcgatgtgcggcggctccagggatcaggcgcttttctgagcctcacccgacggaacccggcacaccaagtgcacacca
0.4 0.6 0.8MeanDecreaseAccuracy
tcctgatcatctcaaattgggtcaggaggccccagggatttcattaaaacccccagggataggctccccgggttcttggacggaggcgtgcactccgcagggtgagcccacctgtcctgtacaccccaggcgatggtgggctcccacacccttttctcacccacccggacaccaaagtgc
0.0 0.5 1.0 1.5MeanDecreaseGini
kidney.rf
Fig. 6. Top hexamers which can discriminate between kidney-specific and housekeeping genes.

April 6, 2010 14:28 WSPC/185-JBCB S0219720010004756
Distal Transcriptional Regulation from Sequence, Expression and Interactome Perspectives 233
several interesting transcription factors to map to these motifs, such as Nkx, ARNT,c-ETS, FREAC4, NFAT, CREBP, E2F, HNF4A, Pax2, MSX1, SP1, several ofwhich are kidney-specific. Though this is highly consistent with the tissue-specificityof the dataset, the functional relevance of these sites remains to be experimentallyvalidated.
10. PPI Between Promoter and Enhancer TFs
In order to understand the nature of interactions between the enhancer and pro-moter TFs (Fig. 2), we decouple the overall regulation problem into three parts:
(1) Identification of putative TF effectors at the promoter (Sec. 10.1),(2) Identification of enhancer TFs (Sec. 10.2), and(3) Examination of the interaction-graph formed between enhancer-TFs and pro-
moter TFs (Sec. 10.3).
The key question that is explored in the following sections is: having identified theset of tissue-specific TFs that might putatively bind the promoter and the can-didate regulatory regions, does the structure of the bipartite TF-interaction graph(across the promoter TFs and the enhancer TFs) reveal any interesting features thatdistinguish the functional UG2, 4 regions from the non-functional UG1, 3 regions?
10.1. TF effector identification at promoter and enhancer
Promoter TF identification: TFs that regulate basal transcription at the promotercan be identified from phylogenetic conservation or co-expression studies. In thisapproach, the promoter sequence (here, the Gata2 promoter) is aligned across mul-tiple species and the TFBS motifs that are conserved in the multiple alignmentare considered to be putative effectors of gene regulation. Such sequence-basedapproaches have been examined in literature.2,13
Since the list of putative TFs (identified above) that potentially bind at thepromoter is still large, there have been efforts to incorporate gene-expression datato reduce the set of potential TF effectors. In this scenario, if the gene correspondingto the conserved TF has a high expression-level influence on Gata2 expression, thenthat TF has stronger evidence for being a potential regulator.21
Recently, we introduced the directed information (DTI) as a metric to inferexpression-level influence between any putative transcription factor (TF) gene anda target gene (such as Gata2 ).22 This seeks to integrate sequence and expressiondata into the determination of relationships between transcription factors and theirtarget-genes. All additional details (performance on synthetic data, other biologicaldata and comparison with other metrics) are available in Ref. 22. Information-based measures have enabled the investigation of non-linear gene relationships inthe presence of measurement noise.21 An important point to note is that unlikemutual information, the DTI is a directed metric that enables the determination

April 6, 2010 14:28 WSPC/185-JBCB S0219720010004756
234 A. Rao et al.
ATF3
Gata2
POU3F2E2F CREB1
HNF4A WT1
SP1 EGR1 NFYB MSX1
Fig. 7. Putative upstream TFs using DTI for the Gata2 gene.
of the strength, significance and direction of gene influence. For Gata2, this list ofeffectors is listed in Fig. 7.
10.2. Enhancer TF identification
In Sec. 10.1, we examined the identification of promoter TFs using phylogeneticsequence conservation of TFBS motifs in conjunction with expression level influ-ence using DTI. The next key step towards determining the structure of promoter-enhancer TF interactions is the identification of enhancer-TFs. As has been alludedto earlier, there is no method to precisely infer which transcription factors bind acertain regulatory element during long-range gene regulation. Thus, we appeal toa traditional approach of finding tissue-specific transcription factors that are phy-logenetically conserved at any potential regulatory region11,2 (one caveat, however,is that conservation is not a very reliable predictor of TF binding30,31). This isconsistent with earlier observations that enhancers recruit tissue-specific transcrip-tion factors during the formation of the overall transcriptional machinery duringgene expression, whereas promoters recruit components of the basal transcriptionalmachinery.23,2,13,4
To ascertain the tissue-specificity of each TF that putatively binds a regulatoryelement (identified via phylogenetic conservation), we examine that TF’s annotationin the UNIPROT or MGI database.
10.3. Enhancer-promoter distal interaction via protein-protein
interactions — a graph-based analysis
Using the notion of protein-protein interaction (PPI) mediating long-distance inter-actions between promoters and enhancers during looping,3,14,32 we explore the inter-actome to look for within-group and between-group interactions in the promoter-TFand the enhancer-TF groups.

April 6, 2010 14:28 WSPC/185-JBCB S0219720010004756
Distal Transcriptional Regulation from Sequence, Expression and Interactome Perspectives 235
The interaction-graphs (e.g. Fig. 8) are obtained in the following manner:
• One part of the graph (hollow circles) corresponds to the TF effector group atthe promoter. These Vp TFs are identified based on phylogenetic conservation,tissue-specificity and directed information (Sec. 10.1).
• The other part of the graph (filled circles) corresponds to the Ve tissue-specificTFs group at the enhancer, identified based on phylogeny and tissue-specificityannotation (Sec. 10.2).
• The interaction-graph is defined by the vertices V = (Vp ∪ Ve), andthe edges E = ei,j , i, j ∈ (1, 2, . . . , |Vp ∪ Ve|). Each bidirectional edgeE = (ei,j) is derived from an annotated interaction between TFs i andj, based on an interaction database. These edges describe both within-group TF interactions as well as between-group interactions. These inter-actions are obtained from the STRING (http://string.embl.de/ ) and MiMI(http://mimi.ncibi.org/MiMI/home.jsp) databases, both of which contain dataderived from multiple sources, such as yeast-2-hybrid screens, literature etc.
It would be of great value to use a catalog of gene-specific and tissue-specificregulatory regions (with all possible transcription factors) from which to find suchinteraction characteristics. However, such a repository does not yet exist. In thissection, we use a few examples (Gata3 OVE, Gata3 KE, Fgf OVE, Mecp2 F21/F6,Shh FE) of known tissue-specific and gene-specific regulatory elements from litera-ture, as a positive training set. For the negative training set, we consider the set ofregions that were reportedly investigated in these transgenic experiments but didnot yield gene-specific regulatory activity.
We have presented a preliminary analysis of enhancer-promoter TF interaction-graphs for some genomic elements with known regulatory or non-regulatory activ-ity6,33,8,34 in Table 3. The table represents the listing of some of the structuralattributes of these interaction-graphs, following analysis methods from literature.35
Table 3. The first column is the various regulatory and non-regulatory elements from literature,the next column corresponds to its class label (+1/ − 1). The subsequent columns correspondto the attributes of the overall TF-interaction graph (both within-group and between-groupinteractions).
Clustering CharacteristicSequence Class coefficient path length Heterogeneity Centralization Density
Mecp2 F216 +1 0.208 2.824 0.668 0.184 0.133Mecp2 F66 −1 0 1.75 0.342 0.067 0.145Gata3 OVE8 +1 0.036 2.254 0.779 0.359 0.154Gata3 KE8 +1 0.409 2.0 0.813 0.684 0.216Gata3 NE18 −1 0.383 2.131 1.139 0.757 0.15Gata3 NE28 −1 0.458 2.013 0.872 0.699 0.203Fgf10 OVE34 +1 0.313 2.433 0.72 0.323 0.133Shh FE33 +1 0.394 2.312 0.797 0.49 0.175

April 6, 2010 14:28 WSPC/185-JBCB S0219720010004756
236 A. Rao et al.
A deeper analysis of other graph topology metrics and their relation to functionalenhancer activity is a topic of future interest.
• Clustering coefficient: The clustering coefficient of a node is always a numberbetween 0 and 1. The network clustering coefficient is the average of the clusteringcoefficients for all nodes in the network.
• Characteristic path length: The characteristic path length denotes the averageshortest-path distance of the graph. This gives the expected distance of any twoconnected nodes in the graph and is a global indicator of network-connectivity.
• Heterogeneity: Network heterogeneity denotes the coefficient of variation of thedegree distribution.
• Centralization: This refers to the overall connectivity (cohesion) of the graph. Itindicates how strongly the graph is organized around its most central point(s).
• Density: It shows how densely the network is populated with edges (i.e. how“close-knit” an empirical graph is). A network which contains no edges and solelyisolated nodes has a density of 0, whereas the density of a clique (completelyconnected graph) is 1.
The above-mentioned network properties (as well as clustering coefficients, num-ber of connected components etc.) are examined for the overall interaction-graphsfor the reported enhancers from literature. A logistic regression reveals that lowvalues of heterogeneity, characteristic path length and centralization are strongpredictors of potential enhancer activity. All of these attributes point to the decen-tralized, homogenous and somewhat tighter connectivity of the interaction-graphsfor true enhancers. We note that the OOB error rate of the RF here is about 20%.The quality of this classifier can be expected to improve as we obtain more data(gene-specific regulatory regions) from which to extract features.
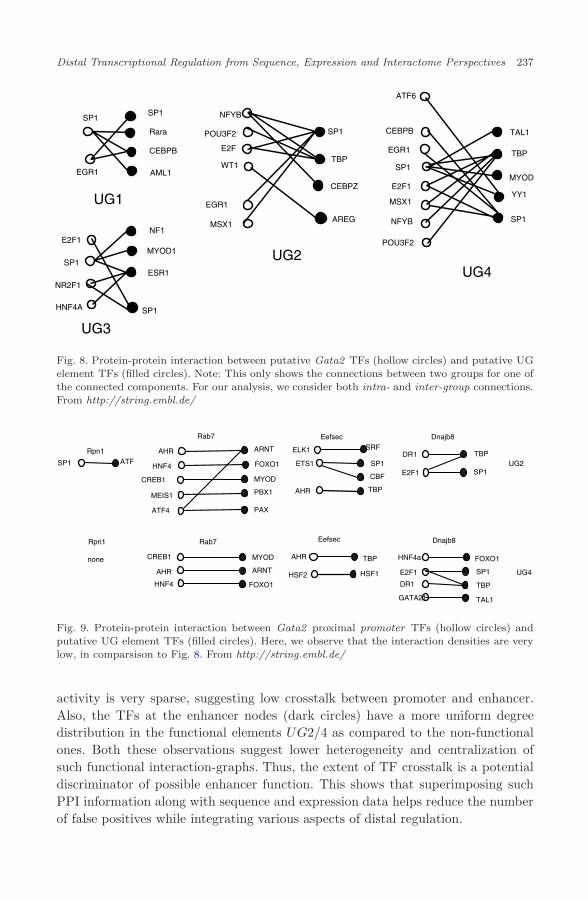
We now examine the interaction-graphs for the test set, i.e. the four Gata2UGE candidates. For illustration, we only show the largest connected componentof the inter-group edges for each interaction graph (Fig. 8). For comparison, we havealso shown the interaction graphs between the UG candidates and the promotersproximal to the Gata2 promoter (Rpn1, Rab7, Eefsec, Dnajb8 ). We observe thatthe interaction densities for the proximal promoters are very low in comparisonto the density for Gata2, and that there are no strongly connected componentsin the interaction graphs for the Gata2 proximal promoters, suggesting a highspecificiity of interaction between the true UG candidates (UG2/UG4) and theGata2 promoter, Fig. 9, and a corresponding low specificity of interaction for theproximal promoters. This demonstrates the utility of this approach to the resolutionof promoter-specificity of enhancer action.
This figure indicates a very interesting property of the real enhancers vis-a-visthe other conserved elements. We see that the TF effectors for Gata2 such as SP1,POU3F2 (identified in the TF effector network above, Fig. 7), are involved in cross-element interactions at the protein level, between the promoter and true enhancers(UG2/4). However, the network linkage in the elements that showed no enhancer
April 6, 2010 14:28 WSPC/185-JBCB S0219720010004756
Distal Transcriptional Regulation from Sequence, Expression and Interactome Perspectives 237
UG1
UG2
UG3
SP1
Rara
CEBPB
AML1EGR1
SP1
E2F1
SP1
NR2F1
HNF4A
NF1
MYOD1
ESR1
SP1
UG4
SP1
TBP
CEBPZ
AREG
NFYB
POU3F2
E2F
WT1
EGR1
MSX1
TAL1
TBP
MYOD
YY1
SP1
ATF6
CEBPB
EGR1
SP1
E2F1
MSX1
NFYB
POU3F2
Fig. 8. Protein-protein interaction between putative Gata2 TFs (hollow circles) and putative UGelement TFs (filled circles). Note: This only shows the connections between two groups for one ofthe connected components. For our analysis, we consider both intra- and inter-group connections.From http://string.embl.de/
UG2
UG4
Rab7
Rpn1
none
CREB1
AHR ARNT
HNF4 FOXO1
MYOD
MEIS1 PBX1
ATF4 PAX
Rpn1ATFSP1
Rab7
CREB1 MYOD
AHR
HNF4
ARNT
FOXO1
HNF4a
E2F1
DR1
GATA21
FOXO1
SP1
TBP
TAL1
Dnajb8Eefsec
AHR TBP
HSF2 HSF1
Dnajb8
DR1 TBP
E2F1 SP1
EefsecSRFELK1
ETS1 SP1
CBF
TBPAHR
Fig. 9. Protein-protein interaction between Gata2 proximal promoter TFs (hollow circles) andputative UG element TFs (filled circles). Here, we observe that the interaction densities are verylow, in comparsison to Fig. 8. From http://string.embl.de/
activity is very sparse, suggesting low crosstalk between promoter and enhancer.Also, the TFs at the enhancer nodes (dark circles) have a more uniform degreedistribution in the functional elements UG2/4 as compared to the non-functionalones. Both these observations suggest lower heterogeneity and centralization ofsuch functional interaction-graphs. Thus, the extent of TF crosstalk is a potentialdiscriminator of possible enhancer function. This shows that superimposing suchPPI information along with sequence and expression data helps reduce the numberof false positives while integrating various aspects of distal regulation.

April 6, 2010 14:28 WSPC/185-JBCB S0219720010004756
238 A. Rao et al.
11. Heterogeneous Data Integration and Validation on GATA2UGE Candidate Sequences
As mentioned previously, the primary goal of the framework developed above isto understand the behavior of known regulatory elements along different genomicmodalities. To validate their predictive potential, we demonstrate their applicationto predicting the behavior of the experimentally-verified Gata2 UG enhancer can-didates (which is our test set). Here we combine the results of the individual classi-fiers (kidney-promoter RF, histone RF and interactome-RF) to obtain an integratedprediction that a candidate sequence is an enhancer. For combining heterogeneousclassifiers, we use a “probabilistic belief fusion” approach.
The framework involves combining the ‘beliefs’ of the individual classifiers toobtain a combined belief of prediction. To compute the belief of each classifierwe start by examining the confusion matrices for each of the classifiers (promoterRF, histone-RF and graph-RF), following Ref. 38. Since each of the classifiers arerandom forests, we can obtain their OOB error estimates through these confusionmatrices. For the graph-RF, this confusion matrix is as below,
CMgraph−RF =
Class −1 1 class.error
−1 4 1 0.20
1 1 4 0.20
,
thereby yielding an OOB error estimate of ∼ 20%.Similarly, we have,
CMpromoter−RF =
Class −1 1 class.error
−1 67 19 0.22
1 10 76 0.12
,
thus yielding an OOB error estimate of ∼ 17%.
CMhistone−RF =
Class −1 1 class.error
−1 134 24 0.15
1 21 119 0.15
,
yielding an OOB error estimate of ∼ 15%.As can be seen, these classifiers have fairly good sensitivity and specificity char-
acteristics. However, we note that each of the modalities might be imbalanced inclass membership in the original study, and so might not be as generalizable. Thisis expected to improve as more training data for these classifiers becomes available(especially for the graph-RF case). Moreover, these are three complementary datasources and can be effectively combined to improve detection reliability. Since theyare trained on very different modalities, they can be assumed to be independent.It can also be seen that this method of belief combining is applicable to as manymodalities (K) as necessary to the biological problem of interest, and hence is trulyscalable.
April 6, 2010 14:28 WSPC/185-JBCB S0219720010004756
Distal Transcriptional Regulation from Sequence, Expression and Interactome Perspectives 239
0 0.1 0.2 0.3 0.4 0.5 0.6 0.7 0.8 0.9 10
0.1
0.2
0.3
0.4
0.5
0.6
0.7
0.8
0.9
1
FPR (1specificity)
TP
R (
sens
itivi
ty)
Receiver Operating Characteristics
histoneRFpromoterRFrandom classificationgraphRF
Fig. 10. Representation of the three RF classifiers in ROC space (RF-histone in (◦), promoter-RFin (·), and graph-RF in (�)). The diagonal line is the classification by random chance.
Let each classifier be characterized by its decision function ek(x) = jk that mapsa data point (x) to the class ‘j’, for k = 1, 2, . . . , K and jk ∈ (−1, 1). Here, K = 3,and J = 2 classes.
The belief of the kth classifier is defined as
belk(x ∈ Ci|ek(x) = jk) = P (x ∈ Ci|ek(x) = jk)
The overall belief, bel(i), is computed using Bayes rule
bel(i) = P (x ∈ Ci).∏K
k=1 P (x ∈ Ci|ek(x) = jk)∏Kk=1 P (x ∈ Ci)
bel(Ci) =∏K
k=1 P (x ∈ Ci|ek(x) = jk)∑Ji=1
∏Kk=1 P (x ∈ Ci|ek(x) = jk)
.
April 6, 2010 14:28 WSPC/185-JBCB S0219720010004756
240 A. Rao et al.
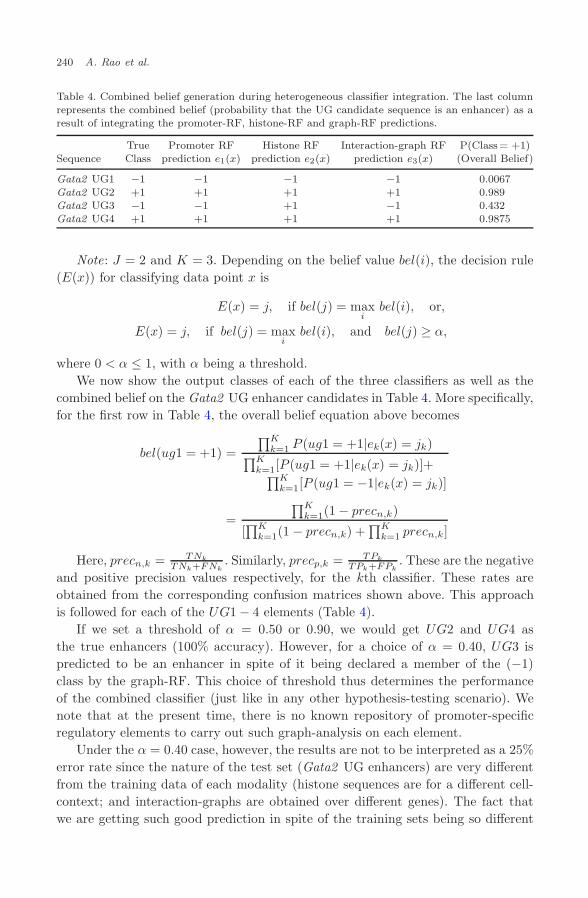
Table 4. Combined belief generation during heterogeneous classifier integration. The last columnrepresents the combined belief (probability that the UG candidate sequence is an enhancer) as aresult of integrating the promoter-RF, histone-RF and graph-RF predictions.
True Promoter RF Histone RF Interaction-graph RF P(Class= +1)Sequence Class prediction e1(x) prediction e2(x) prediction e3(x) (Overall Belief)
Gata2 UG1 −1 −1 −1 −1 0.0067Gata2 UG2 +1 +1 +1 +1 0.989Gata2 UG3 −1 −1 +1 −1 0.432Gata2 UG4 +1 +1 +1 +1 0.9875
Note: J = 2 and K = 3. Depending on the belief value bel(i), the decision rule(E(x)) for classifying data point x is
E(x) = j, if bel(j) = maxi
bel(i), or,
E(x) = j, if bel(j) = maxi
bel(i), and bel(j) ≥ α,
where 0 < α ≤ 1, with α being a threshold.We now show the output classes of each of the three classifiers as well as the
combined belief on the Gata2 UG enhancer candidates in Table 4. More specifically,for the first row in Table 4, the overall belief equation above becomes
bel(ug1 = +1) =∏K
k=1 P (ug1 = +1|ek(x) = jk)∏Kk=1[P (ug1 = +1|ek(x) = jk)]+∏K
k=1[P (ug1 = −1|ek(x) = jk)]
=∏K
k=1(1 − precn,k)
[∏K
k=1(1 − precn,k) +∏K
k=1 precn,k]
Here, precn,k = TNk
TNk+FNk. Similarly, precp,k = TPk
TPk+FPk. These are the negative
and positive precision values respectively, for the kth classifier. These rates areobtained from the corresponding confusion matrices shown above. This approachis followed for each of the UG1 − 4 elements (Table 4).
If we set a threshold of α = 0.50 or 0.90, we would get UG2 and UG4 asthe true enhancers (100% accuracy). However, for a choice of α = 0.40, UG3 ispredicted to be an enhancer in spite of it being declared a member of the (−1)class by the graph-RF. This choice of threshold thus determines the performanceof the combined classifier (just like in any other hypothesis-testing scenario). Wenote that at the present time, there is no known repository of promoter-specificregulatory elements to carry out such graph-analysis on each element.
Under the α = 0.40 case, however, the results are not to be interpreted as a 25%error rate since the nature of the test set (Gata2 UG enhancers) are very differentfrom the training data of each modality (histone sequences are for a different cell-context; and interaction-graphs are obtained over different genes). The fact thatwe are getting such good prediction in spite of the training sets being so different
April 6, 2010 14:28 WSPC/185-JBCB S0219720010004756
Distal Transcriptional Regulation from Sequence, Expression and Interactome Perspectives 241
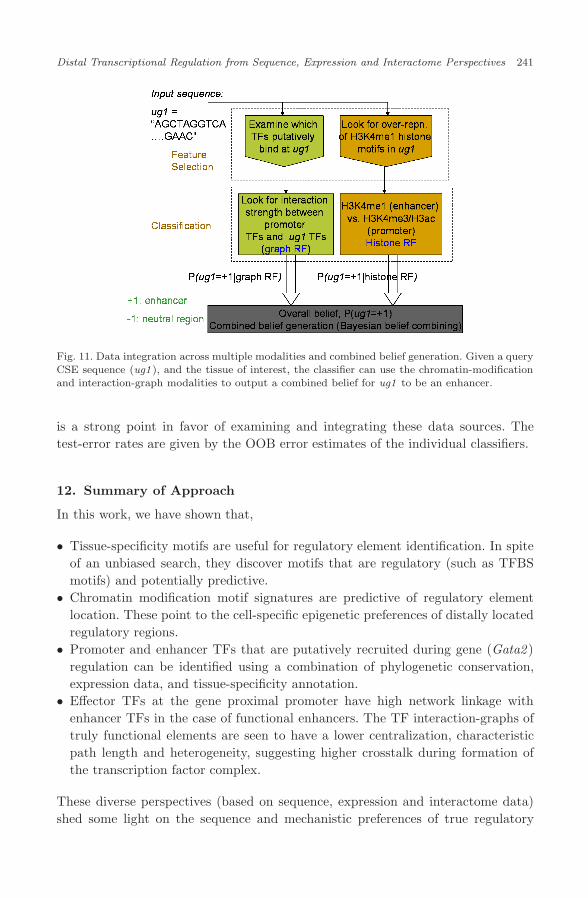
Fig. 11. Data integration across multiple modalities and combined belief generation. Given a queryCSE sequence (ug1 ), and the tissue of interest, the classifier can use the chromatin-modificationand interaction-graph modalities to output a combined belief for ug1 to be an enhancer.
is a strong point in favor of examining and integrating these data sources. Thetest-error rates are given by the OOB error estimates of the individual classifiers.
12. Summary of Approach
In this work, we have shown that,
• Tissue-specificity motifs are useful for regulatory element identification. In spiteof an unbiased search, they discover motifs that are regulatory (such as TFBSmotifs) and potentially predictive.
• Chromatin modification motif signatures are predictive of regulatory elementlocation. These point to the cell-specific epigenetic preferences of distally locatedregulatory regions.
• Promoter and enhancer TFs that are putatively recruited during gene (Gata2 )regulation can be identified using a combination of phylogenetic conservation,expression data, and tissue-specificity annotation.
• Effector TFs at the gene proximal promoter have high network linkage withenhancer TFs in the case of functional enhancers. The TF interaction-graphs oftruly functional elements are seen to have a lower centralization, characteristicpath length and heterogeneity, suggesting higher crosstalk during formation ofthe transcription factor complex.
These diverse perspectives (based on sequence, expression and interactome data)shed some light on the sequence and mechanistic preferences of true regulatory

April 6, 2010 14:28 WSPC/185-JBCB S0219720010004756
242 A. Rao et al.
regions interspersed genome-wide. It is to be noted that this model is data-drivenand needs further validation to correspond directly with the biology of transcription.
13. Conclusions
The novelty of the proposed work spans several areas. Firstly, data sources thatare relevant to understanding the mechanism of gene regulation (with Gata2 asan example) have been identified. We have developed methods that reconcile thebehavior of known regulatory elements along each of these modalities. The utiliza-tion of histone-modified sequences and their exploration for sequence motifs areindicative of epigenetic preferences and nucleosome-occupancy patterns. This hasnot been explored before for the prediction of distal regulatory regions. The use ofDTI as a metric to infer putative TF to target-gene influence is a recent one thatserves to integrate phylogenetic TFBS conservation with expression data. Finally,the utilization of graph-based analysis techniques to understand the “structure” ofthe TF interaction-graph between enhancer and promoter helps us understand trueenhancer behavior from a mechanistic viewpoint. The probabilistic combination ofmultiple classifiers (each deriving from a unique data resource) aims to reconcile thebehavior of existing enhancers along multiple modalities. We hope to demonstratethat a principled integration of non-overlapping genomic modalities can be used tointerpret the context and specificity of gene regulation.
14. Future Work
Some key elements directly emerge for guiding future research. As already alludedto in the motif-signature procedure, specific expression data corresponding to stagesand tissues of interest would greatly improve the specificity of regulatory elementprediction. Furthermore, as histone modification maps for related cell lines aregenerated, the false positive rate of prediction would decrease, thereby improvingaccuracy. Several other learning paradigms can be introduced into this setting sincewe are learning from structured data. Also, methods in joint classifier and featureoptimization might likely improve the accuracy of predictions. Additionally, meth-ods that analyze the grammar of these cis-regulatory regions (LREs) and look formotif position, spacing and orientation will be of great utility.
At the expression level, methods for supervised network inference would have agreat impact on the discovery of TF effectors. Rapid advances have been made inthis area and their relevance to the biological context of the problem has becomevery principled. At the interactome level, the work presented here can be extendedto the investigation of graph-clusters for weighted interaction-graphs. The weightededges are obtained from the confidence of the individual data sources, as well as thenumber of species over which that particular edge is conserved.35,36 Such analysisenables the discovery of subgraphs of various degrees of inter-connectedness, therebydiscovering functional “graph-motifs.”
April 6, 2010 14:28 WSPC/185-JBCB S0219720010004756
Distal Transcriptional Regulation from Sequence, Expression and Interactome Perspectives 243
An important point to note here is that there is currently no resource forpromoter-specific enhancer data genome-wide. However, as various high throughputexperiments become more prevalent, we can look forward to using these methodsfor precision-recall analysis on such public repositories.
Acknowledgments
We thank Ms. Swapnaa Jayaraman for useful discussions about network analysis.We are also very grateful to the two anonymous reviewers for their help in revisingthe conference manuscript.
References
1. Pennacchio LA, Ahituv N, Moses A, Prabhakar S, Nobrega M, Shoukry M, MinovitskyA, Dubchak I, Holt A, Lewis K, Plazer-Frick I, Akiyama J, DeVal S, Afzal V, BlackB, Couronne O, Eisen M, Visel A, Rubin EM, In vivo enhancer analysis of humanconserved non-coding sequences, Nature 444(7118):499–502, 2006.
2. MacIsaac KD, Fraenkel E, Practical strategies for discovering regulatory DNAsequence motifs, PLoS Comput Biol 2(4):e36, 2006.
3. Petrascheck M, Escher D, Mahmoudi T, Verrijzer CP, Schaffner W, Barberis A, DNAlooping induced by a transcriptional enhancer in vivo, Nucleic Acids Res 33(12):3743–3750, 2005.
4. Simonis M, Kooren J, de Laat W, An evaluation of 3C-based methods to captureDNA interactions, Nature Methods 4(11):895, 2007.
5. Fraser P, Transcriptional control thrown for a loop, Curr Opin Genet Dev 16(5):490–495, 2006.
6. Liu J, Francke U, Identification of cis-regulatory elements for MECP2 expression,Hum Mol Genet 15(11):1769–1782, 2006.
7. Lakshmanan G, Lieuw KH, Lim KC, Gu Y, Grosveld F, Engel JD, Karis A, Localiza-tion of distant urogenital system-, central nervous system-, and endocardium-specifictranscriptional regulatory elements in the GATA-3 locus, Mol Cell Biol 19:1558–1568,1999.
8. Hasegawa SL, Moriguchi T, Rao A, Kuroha T, Engel JD, Lim KC, Dosage-dependentrescue of definitive nephrogenesis by a distant Gata3 enhancer, Dev Biol 301(2):568–577, 2007.
9. Lee EC, Yu D, Martinez de Velasco J, Tessarollo L, Swing DA, Court DL, JenkinsNA, Copeland NG, A highly efficient Escherichia coli-based chromosome engineeringsystem adapted for recombinogenic targeting and subcloning of BAC DNA, Genomics73:56–65, 2001.
10. Khandekar M, Suzuki N, Lewton J, Yamamoto M, Engel JD, Multiple, distant Gata2enhancers specify temporally and tissue-specific patterning in the developing urogen-ital system, Mol Cell Biol 24(23):10263–10276, 2004.
11. Pennacchio LA, Loots GG, Nobrega MA, Ovcharenko I, Predicting tissue-specificenhancers in the human genome, Genome Res 17(2):201–211, 2007.
12. Hallikas O, Palin K, Sinjushina N, Rautiainen R, Partanen J, Ukkonen E, Taipale J,Genome-wide prediction of mammalian enhancers based on analysis of transcription-factor binding affinity, Cell 124(1):47–59, 2006.
13. Kreiman G, Identification of sparsely distributed clusters of cis-regulatory elementsin sets of co-expressed genes, Nucleic Acids Res 32(9):2889–2900, 2004.

April 6, 2010 14:28 WSPC/185-JBCB S0219720010004756
244 A. Rao et al.
14. Blackwood E, Kadonaga J, Going the distance: A current view of enhancer action,Science 281:60–63, 1998.
15. Mayer H, Bilban M, Kurtev V, Gruber F, Wagner O, Binder BR, de Martin R,Deciphering regulatory patterns of inflammatory gene expression from interleukin-1-stimulated human endothelial cells, Arterioscler Thromb Vasc Biol 24(7):1192–1198,2004.
16. Heintzman ND, Stuart RK, Hon G, Fu Y, Ching CW, Hawkins RD, Barrera LO, VanCalcar S, Qu C, Ching KA, Wang W, Weng Z, Green RD, Crawford GE, Ren B, Dis-tinct and predictive chromatin signatures of transcriptional promoters and enhancersin the human genome, Nat Genet 39(3):311–318, 2007.
17. Chan BY, Kibler D, Using hexamers to predict cis-regulatory motifs in Drosophila,BMC Bioinformatics 6:262, 2005.
18. Hutchinson GB, The prediction of vertebrate promoter regions using differential hex-amer frequency analysis, Comput Appl Biosci 12(5):391–398, 1996.
19. Stuart RO, Bush KT, Nigam SK, Changes in gene expression patterns in the uretericbud and metanephric mesenchyme in models of kidney development, Kidney Inter-national 64(6):1997–2008, 2003.
20. Challen G, Gardiner B, Caruana G, Kostoulias X, Martinez G, Crowe M, Taylor DF,Bertram J, Little M, Grimmond SM, Temporal and spatial transcriptional programsin murine kidney development, Physiol Genomics 23(2):159–171, 2005.
21. Margolin AA, Nemenman I, Basso K, Wiggins C, Stolovitzky G, Dalla Favera R, Cal-ifano A, ARACNE: An algorithm for the reconstruction of gene regulatory networksin a mammalian cellular context, BMC Bioinformatics 7(Suppl 1):S7, 2006.
22. Rao A, Hero AO, States DJ, Engel JD, Using directed information to build biologi-cally relevant influence networks, Proc Computational Systems Bioinformatics (CSB),2007.
23. Kleinjan DA, van Heyningen V, Long-range control of gene expression: Emergingmechanisms and disruption in disease, Am J Hum Genet 76(1):8–32, 2005.
24. Carvajal JJ, Keith A, Rigby PW, Global transcriptional regulation of the locus encod-ing the skeletal muscle determination genes Mrf4 and Myf5, Genes Dev 22(2):265–76,2008.
25. Landry JR, Bonadies N, Kinston S, Knezevic K, Wilson NK, Oram SH, Janes M, PiltzS, Hammett M, Carter J, Hamilton T, Donaldson IJ, Lacaud G, Frampton J, FollowsG, Kouskoff V, Gttgens B, Expression of the leukemia oncogene Lmo2 is controlled byan array of tissue-specific elements dispersed over 100 kb and bound by Tal1/Lmo2,Ets, and Gata factors, Blood 113(23):5783–5792, 2009.
26. Breiman L, Random forests, Machine Learning 45(1):5.32, 2001.27. Eisenberg E, Levanon EY, Human housekeeping genes are compact, Trends Genet
19(7):362–365, 2003.28. Farr D, Bellora N, Mularoni L, Messeguer X, Alb MM, Housekeeping genes tend to
show reduced upstream sequence conservation, Genome Biol 8(7):R140, 2007.29. Liaw A, Wiener M, Classification and Regression by randomForest, R News 2:18–22,
2002.30. McGaughey DM, Vinton RM, Huynh J, Al-Saif A, Beer MA, McCallion AS, Metrics
of sequence constraint overlook regulatory sequences in an exhaustive analysis atPhox2b, Genome Res 18(2):252–260, 2008.
31. Odom DT, Dowell RD, Jacobsen ES, Gordon W, Danford TW, MacIsaac KD, RolfePA, Conboy CM, Gifford DK, Fraenkel E, Tissue-specific transcriptional regulationhas diverged significantly between human and mouse, Nat Genet 39(6):730–732, 2007.

April 6, 2010 14:28 WSPC/185-JBCB S0219720010004756
Distal Transcriptional Regulation from Sequence, Expression and Interactome Perspectives 245
32. Gilbert SF, Developmental Biology, Sinauer Associates Inc., Publishers Sunderland,Massachusetts, 1997.
33. Lettice LA, Heaney SJ, Purdie LA, Li L, de Beer P, Oostra BA, Goode D, ElgarG, Hill RE, de Graaff E, A long-range Shh enhancer regulates expression in thedeveloping limb and fin and is associated with preaxial polydactyly, Hum Mol Genet12(14):1725–1735, 2003.
34. Ohuchi H, Yasue A, Ono K, Sasaoka S, Tomonari S, Takagi A, Itakura M, MoriyamaK, Noji S, Nohno T, Identification of cis-element regulating expression of the mouseFgf10 gene during inner ear development, Dev Dyn 233(1):177–187, 2005.
35. Bader GD, Hogue CW, An automated method for finding molecular complexes inlarge protein interaction networks, BMC Bioinformatics 4:2, 2003.
36. Sharan R, Suthram S, Kelley RM, Kuhn T, McCuine S, Uetz P, Sittler T, Karp RM,Ideker T, Conserved patterns of protein interaction in multiple species, Proc NatlAcad Sci USA 102(6):1974–1979, 2005.
37. Assenov Y, Ramrez F, Schelhorn SE, Lengauer T, Albrecht M, Computing topologicalparameters of biological networks, Bioinformatics 24(2):282–284, 2008.
38. Xu L, Krzyzak A, Suen CY, Methods of combining multiple classifiers and theirapplications to handwriting recognition, IEEE Transactions on Systems, Man andCybernetics 22(3):418–435, 1992.
Arvind Rao received his Bachelor of Engineering degree (with distinction) in Elec-tronics and Communications from Bangalore University, India in 2001. In 2003,he received the Master of Science in Engineering degree from the Electrical andComputer Engineering department at the University of Texas at Austin, with aspecialization in Communications, Networks and Systems. He earned an A.M. instatistics from the University of Michigan in 2007 and was a Rackham PredoctoralFellow. For his doctoral work at the University of Michigan, he worked on under-standing long-range transcriptional regulation in higher eukaryotes. Currently, heis a Lane Fellow in Computational Biology in the School of Computer Science,Carnegie Mellon University. His research interests lie at the intersection of signalprocessing, machine learning, experimental and computational systems biology.
David J. States received his B.A. (magna cum laude) from Harvard College (1975)and his M.D. and Ph.D. from Harvard University (1983) in Biophysics. He was a res-ident in Internal Medicine at the University of California, San Diego and a ClinicalAssociate at the National Heart, Lung and Blood Institute. In 1988, he joined theNational Center for Biotechnology Information, and in 1992, moved to WashingtonUniversity in St. Louis to be the Director of the Institute for Biomedical Computingand in 2001, he became a Professor of Human Genetics and founding Director ofthe Bioinformatics Program at the University of Michigan in Ann Arbor. In 2008,Dr. States moved to the School of Health Science Information at the University ofTexas in Houston to establish a Center for Systems Biology and Bioinformatics. Hisrecent research interests have been in alternative splicing in cancer, the analysis ofgenome regulation and data integration in molecular biology. He is a Fellow of theAmerican College of Medical Informatics (ACMI). He was a founding member ofthe Board of Directors of the International Society for Computational Biology and

April 6, 2010 14:28 WSPC/185-JBCB S0219720010004756
246 A. Rao et al.
served as Treasurer from 1997 to 2000. He chaired organizing committees for theIntelligent Systems in Molecular Biology Conference in 1996 and 2005.
Alfred O. Hero III received his B.Sc. (summa cum laude) from Boston University(1980) and his Ph.D. from Princeton University (1984), both in Electrical Engineer-ing. Since 1984, he has been with the University of Michigan, Ann Arbor, wherehe is the R. Jamison and Betty Professor of Engineering. His primary appoint-ment is in the Department of Electrical Engineering and Computer Science andhe also has appointments, by courtesy, in the Department of Biomedical Engineer-ing and the Department of Statistics. In 2008, he was awarded the Digiteo Chaired’Excellence, sponsored by Digiteo Research Park in Paris, located at the EcoleSuperieure d’Electricite, Gif-sur-Yvette, France. He is a Fellow of the Institute ofElectrical and Electronics Engineers (IEEE) and several of his research articles haverecieved best paper awards. He received the IEEE Signal Processing Society Meri-torious Service Award (1998), and the IEEE Third Millenium Medal (2000). AlfredHero was the President of the IEEE Signal Processing Society (2006–2008) and sitson the Board of Directors of the IEEE (2009–2011).
Alfred Hero’s recent research interests have been in detection, classification,pattern analysis, and adaptive sampling for spatio-temporal data. Of particularinterest are applications to network security, multi-modal sensing and tracking,biomedical imaging, and genomic signal processing.
James Douglas Engel received his Ph.D. in biophysical chemistry at the Univer-sity of Oregon in 1975 with P.H. von Hippel. He was a Helen Hay Whitney Fellowwith N. Davidson and T. Maniatis at Caltech from 1975 to 1978, and then joinedthe faculty at Northwestern University, where he became the Owen L. Coon Pro-fessor and Assoc. Director for Basic Sciences of the Robert H. Lurie ComprehensiveCancer Center. He moved to the University of Michigan School of Medicine in 2002,and was endowed the first G. Carl Huber Chair in Developmental Biology and Chairof the Department of Cell and Developmental Biology. Dr. Engel’s lab is devoted todeciphering, both experimentally and theoretically, the transcriptional regulatorynetworks that lead to correctly modulated gene expression during embryonic devel-opment. Dr. Engel is a Fellow of the American Association of Arts and Sciencesand an Editor of Molecular and Cellular Biology.