April 2019 DPMF flight - Eurocontrol
38
Edition Number : 1.0 Edition Validity Date : 01/07/2019 DPMF VDL2 MONITORING FLIGHT REPORT April 2019 DPMF flight April 2019 DPMF flight
Transcript of April 2019 DPMF flight - Eurocontrol
Edition Number : 1.0
Edition Validity Date : 01/07/2019
DPMF VDL2 MONITORING FLIGHT REPORT
April 2019 DPMF flight
April 2019 DPMF flight

April 2019 DPMF flight
DPMF VDL2 MONITORING FLIGHT REPORT
Edition Validity Date: 01/07/2019 Edition: 1.0 Status: Released Issue ii
DOCUMENT CHARACTERISTICS
Document Title Document Subtitle
(optional) Edition Number Edition Validity Date
DPMF VDL2 MONITORING FLIGHT REPORT
April 2019 DPMF flight
1.0 01/07/2019
Abstract
This document reports on the 7th VDL monitoring flight performed on 16.05.2019.
Author(s)
Christophe Visée
Contact Person(s) Tel/email Unit
Christophe Visée [email protected]
NMD/NS/CFC
STATUS AND ACCESSIBILITY
Status Accessible via
Working Draft Intranet
Draft Extranet
Proposed Issue Internet (www.eurocontrol.int)
Released Issue
TLP STATUS
Intended for Detail
Red Highly sensitive, non-disclosable information
Amber Sensitive information with limited disclosure
Green Normal business information
White Public information
April 2019 DPMF flight
DPMF VDL2 MONITORING FLIGHT REPORT
Edition Validity Date: 01/07/2019 Edition: 1.0 Status: Released Issue iii
©2015 The European Organisation for the Safety of Air Navigation (EUROCONTROL). This document is published by EUROCONTROL for information purposes. It may be copied in whole or in part, provided that EUROCONTROL is mentioned as the source and the extent justified by the non-commercial use (not for sale). The information in this document may not be modified without prior written permission from EUROCONTROL.
Edition History
The following table records the complete history of the successive editions of the present document.
Edition History
Edition No. Edition
Validity Date Author Reason
0.1 03/06/2019 Ch. Visée Initial Draft
0.2 09/06/2019 Ch. Visée Template update
0.3 26/06/2019 Ch. Visée Internal review
1.0 01/07/2019 Ch. Visée Release

April 2019 DPMF flight
DPMF VDL2 MONITORING FLIGHT REPORT
Edition Validity Date: 01/07/2019 Edition: 1.0 Status: Released Issue iv
Table of Contents
DOCUMENT CHARACTERISTICS .................................................................................. II
EDITION HISTORY .......................................................................................................... III
TABLE OF CONTENTS ................................................................................................... IV
1 SUMMARY ....................................................................................................... 1
2 INTRODUCTION .............................................................................................. 2
2.1 OUTLINE OF THE REPORT ..............................................................................................2
3 MEASUREMENT SETUP AND METHOD OF ANALYSIS .............................. 4
4 RESULTS ......................................................................................................... 6
4.1 AIRBORNE CHANNEL OCCUPANCY ..................................................................................6
AVERAGE OCCUPANCY .......................................................................................................... 6
ONE MINUTE OCCUPANCY OVER TIME ................................................................................. 7
4.2 AIRBORNE COLLISION RATE ...........................................................................................8
4.3 CHANNEL USE ...............................................................................................................9
SHARE OF CHANNELS BY ACSPS ....................................................................................... 10
CSC OFFLOAD ........................................................................................................................ 11
DISTRIBUTION OF AVLC FRAME BY TYPE .......................................................................... 13
AOA TRAFFIC .......................................................................................................................... 15
GLOBAL PEAK AND MEDIAN TRAFFIC RATE (KBITS/S) PER AVLC FRAME TYPE ....... 16
CHANNEL THROUGHPUT ...................................................................................................... 18
4.4 INTERFERENCES ......................................................................................................... 19
MODULATED VOICE SIGNALS .............................................................................................. 19
5 CONCLUSIONS ............................................................................................. 20
6 REFERENCES ............................................................................................... 22
7 ABBREVIATIONS .......................................................................................... 22
ANNEX 1 - MEASUREMENT SETUP ......................................................................... 23
ANNEX 2 - TABULATED VALUES OF CHAPTER 3 ................................................. 24
A1.1 SERVICE PROVIDER RELATED DATA .................................................................................. 24
A1.2 NUMBER OF STATION HEARD AND THEIR GENERATED TRAFFIC ................................. 25
A1.3 PARTITION OF AVLC FRAME TYPE ...................................................................................... 26
A1.4 GLOBAL PEAK AND MEDIAN TRAFFIC RATE (KBITS/S) PER AVLC FRAME TYPE ....... 27
A1.5 PEAK AND MEDIAN TRAFFIC RATE (KBITS/S) PER FREQUENCY AND PER AVLC FRAME TYPE 27
A1.6 GLOBAL PEAK AND MEDIAN TRAFFIC EVOLUTION PER AVLC FRAME TYPE FOR THE SUMMER FLIGHTS ....................................................................................................................................... 29
ANNEX 3 - RECEIVER LEVEL PDF AND CDF CURVES .......................................... 30
A1.7 136.975 MHZ ............................................................................................................................. 30
A1.8 136.875 MHZ ............................................................................................................................. 31
A1.9 136.775 MHZ ............................................................................................................................. 31
April 2019 DPMF flight
DPMF VDL2 MONITORING FLIGHT REPORT
Edition Validity Date: 01/07/2019 Edition: 1.0 Status: Released Issue v
A1.10 136.725 MHZ ............................................................................................................................. 32
LIST OF FIGURES IN MAIN DOCUMENT
Figure 3-1 : Typical flight route. ..............................................................................4
Figure 4-1 : Occupancy in function of time on 16/04/2019. ...................................7
Figure 4-2 : Occupancy in function of time on 03/05/2018. ...................................8
Figure 4-3 : Traffic distribution between ACSP per frequency ........................... 10
Figure 4-4 : Traffic distribution between ACSPs on the CSC .............................. 11
Figure 4-5 : Partition of the total traffic between the CSC and the alternate frequencies ...................................................................................................... 11
Figure 4-6 : Evolution of the traffic volume per ACSP between the CSC and Alternate frequencies ...................................................................................... 12
Figure 4-7 : Number of aircraft heard on alternate frequencies .......................... 12
Figure 4-8 : AVLC frame distribution over time ................................................... 13
Figure 4-9: AVLC frame distribution over time for frequencies conveying E-R traffic ................................................................................................................ 14
Figure 4-10 : AOA traffic repartition ...................................................................... 15
Figure 4-11 : Median traffic rate ............................................................................ 16
Figure 4-12: Median traffic rate for frequencies conveying E-R traffic ............... 16
Figure 4-13 : 95th percentile traffic rate ................................................................ 17
Figure 4-14: 95th percentile traffic rate for frequencies conveying E-R traffic .. 17
Figure 4-15 : Peak channel throughput ................................................................ 18
Figure 4-16 : Median channel throughput ............................................................ 18
LIST OF TABLES IN MAIN DOCUMENT
Table 1 : Average occupancy for summer flights. .................................................6
Table 2 : Average occupancy for spring flights .....................................................6
Table 3 : Collision rate for summer flights .............................................................8
Table 4 : Collision rate for the spring flights ..........................................................9
Table 5 : Interference duration summary ............................................................. 19
Table 6 : Modulated voice signal duration summary ........................................... 19
Table 7 : Traffic partition per ACSP and per frequency for the summer flights. 24
Table 8 : Traffic repartition per ACSP and per frequency for the spring flights 24
Table 9 : Global traffic partition per ACSP ........................................................... 24
Table 10 : Number of station and their generated traffic per frequency and per station type ...................................................................................................... 25
Table 11 : Traffic repartition per frequency and AVLC frame type ..................... 26
Table 12 : Global traffic repartition per AVLC frame type ................................... 26

April 2019 DPMF flight
DPMF VDL2 MONITORING FLIGHT REPORT
Edition Validity Date: 01/07/2019 Edition: 1.0 Status: Released Issue 1
1 Summary
Twice a year, the DPMF conducts VDL monitoring flights in order to monitor the performance of the European Data Link Services (DLS) as seen from an aircraft perspective.
This report highlights the multi-frequency deployment and the rise of the observed traffic: The key points are listed below.
1. 67% of the observed traffic volume is now taking place on the alternate frequencies.
2. An increase of 12% of the traffic volume is observed between May 2018 and April 2019.
3. The traffic volume on the CSC is split 73% ARINC and 27% SITA.
4. The traffic on the CSC is continuously decreasing since July 2017.
5. 78% of the aircrafts on SITA’s network are observed on its alternates frequencies while 56% for ARINC.
6. AOA represent 60% of the global traffic volume.
7. The median traffic rate increased by 15.7% between May 2018 and April 2019.
8. Voice communication are still heard on VDL2 frequencies
April 2019 DPMF flight
DPMF VDL2 MONITORING FLIGHT REPORT
Edition Validity Date: 01/07/2019 Edition: 1.0 Status: Released Issue 2
2 Introduction
The purpose of this document is to report some data link performance metrics, as defined in the DPMF report catalogue [5], from the last monitoring flight campaign that took place on April 16th, 2019 above core Europe. It also presents the evolution and trends of the measured parameters from the previous flights (since August 2015) as well as dedicated analyses.
As the monitoring flights are intended to analyse VHF Data Link at the airborne side, some effort has been made, when needed, to distinguish between airborne traffic (E-R) and ground traffic (Terminal) which is expected to be different in nature. However, except where stated otherwise, the traffic values presented in this report take into account all monitored frequencies as they are part of the monitoring flight results.
Since 2017, frequency assignments have been set according to AIR and GND categories (see ICAO Doc11 [7]). The designation of the frequencies in this report is then based on these two categories1 The terminology “alternate” frequency used in this document refers to any frequency other than the CSC. For SITA, 136.875 MHz is assigned for GND and 136.775 MHz for AIR. For ARINC2, 136.825 is assigned for AIR and 136.725 for GND.
Finally, we remind the reader that the traffic volume expressed in this report are measured on the RF channels as seen by the monitoring aircraft taking into account all the possible retransmissions observed as these are part of the real and observed traffic.
2.1 Outline of the report
Chapter 2 covers the measurement setup and the method of analysis.
Chapter 3 presents the results of the last monitoring flight together with the previous ones.
Remark: The metrics defined in [5] are highlighted in bold with the performance metric identification number between brackets.
The airborne channel occupancy (A-1) is used as a simple estimator of the traffic load on the different channels. It is computed by dividing the number of samples whose level is above a certain threshold over the total number of samples observed during a time period. This report provides a mean airborne channel occupancy, and also an airborne channel occupancy statistic based on one second integrated values. The latter is intended to have comparable values to what the VDRs are supposed to provide.
The airborne burst collision rate (A-2) is an estimation of the number of collisions observed at FL370. It is computed by dividing the number of bursts
1 The denomination “mixed” frequency to denote a “mixed GND-AIR” frequency is not used as it is not compliant with the current ICAO Doc11 frequency plan. 2 At the time of writing, ARINC is using its GND frequency (136.725 MHz) for both AIR and GND. The deployment of the AIR frequency is planned for 2019.

April 2019 DPMF flight
DPMF VDL2 MONITORING FLIGHT REPORT
Edition Validity Date: 01/07/2019 Edition: 1.0 Status: Released Issue 3
identified in a collision over the total number of bursts observed during a time period. It is used as an indicator to the correct behaviour of the radio channels. To achieve maximum throughput, the number of collisions needs to be minimal.
The channel load (KPI_PHY_01) is used to measure the evolution of traffic. It is defined as the sum of the AVLC frame size (in kB) by periods. It is also expressed in this report as a traffic rate in kbits/s computed as an average per second over periods of 60 seconds. The median and the 95th percentile values over the whole flight are presented. These values are also computed in function of the type of traffic (AOA, ATN or AVLC protocol related) referring to KPI_PHY_02.
This report also provides the distribution of traffic between the CSC and the alternate frequencies, and is used to monitor the traffic offload of the CSC in the scope of the multi-frequency deployment.
Interference reporting is presented for each type of observed interference in term of their total duration.
Chapter 4 covers discussion on the metric results.
Finally, chapter 5 gives the conclusions and addresses recommendations.

April 2019 DPMF flight
DPMF VDL2 MONITORING FLIGHT REPORT
Edition Validity Date: 01/07/2019 Edition: 1.0 Status: Released Issue 4
3 Measurement setup and method of analysis
Measurements were performed using NLR3’s Cessna Citation II flying across Europe at FL370. The setup can be found in the annex 1.
Figure 3-1 : Typical flight route.
The analysis is performed using dedicated software tools.
IF-PAN (spectrum) data are converted into “spectrum tiles” to display the recorded spectrum in order to perform interference analysis. It is also used to list all the voice transmissions generated by the aircraft and overloading the receiver – the latter events being excluded from the following analysis.
The recorded IQ data (500 kHz) is first channelized to the desired 25 kHz channels and saved into separate IQ files.
Each channel is then processed to detect and demodulate bursts. Demodulated AVLC frames are saved into text files in a hexadecimal format with additional RF information (time-stamp, level, duration).
Airborne channel occupancy and other RF statistics (levels distribution) are also processed channel by channel and the results saved in text files.
AVLC frame analysis is performed for each generated channel log file providing with various statistics depending the ACSPs, AVLC frame types, time-stamps or plane location. Only correctly demodulated frames are used for the analysis.
Channelized IQ data (25 kHz) is also used to visually count the burst collisions over a set of 120 one-second data using a dedicated GUI tool. The latter is also capable of performing burst demodulation of a selected burst when required.
3 Nationaal Lucht-en Ruimtevaarlaboratorium (NL).

April 2019 DPMF flight
DPMF VDL2 MONITORING FLIGHT REPORT
Edition Validity Date: 01/07/2019 Edition: 1.0 Status: Released Issue 5
When needed IQ data is also used to demodulate other type of signals (i.e. voice, ACARS (POA))

April 2019 DPMF flight
DPMF VDL2 MONITORING FLIGHT REPORT
Edition Validity Date: 01/07/2019 Edition: 1.0 Status: Released Issue 6
4 Results
4.1 Airborne channel occupancy
Occupancy measurements are computed over channelized IQ data using 64 kSamples/s.
As occupancy values depends on the level threshold used, level density function graphs are provided for each frequency in the annex 3. In the following sections a -90 dBm threshold at the antenna is considered (“idle to busy” threshold defined in ICAO annex 10 [6]).
Average occupancy
The following tables summarizes the mean occupancy measured above FL285 since 2015. Tables are split into spring and summer flights due the seasonal variation of traffic.
Table 1 : Average occupancy for summer flights.
Frequency / assignation 08.2015 08.2016 07.2017 08.2018
136.975 MHz CSC 20.35% 26.23% 31.02% 23.12%
136.875 MHz SITA Ter. 1.84% 6.33% 8.69% 7.75%
136.825 MHz ARINC E-R 0.02% 1.69% 0.00% 0.22%
136.775 MHz SITA E-R 0.01% 0.63% 4.33% 4.53%
136.725 MHz ARINC Ter. 0.40% 0.82% 3.01% 19.52%
Table 2 : Average occupancy for spring flights
Frequency / assignation 04.2017 05.2018 04.2019
136.975 MHz CSC 18.82% 18.03% 23.59%
136.875 MHz SITA Ter. 5.20% 6.80% 8.87%
136.825 MHz ARINC E-R 0.31% 0.18% 0.00%
136.775 MHz SITA E-R 1.29% 2.84% 8.97%
136.725 MHz ARINC Ter. 1.49% 11.50% 17.43%
Note 1: The reader shall note that the occupancy measurement on the SITA Terminal frequency does not reflect the real behaviour of the channel due to the location of the monitoring receiver (aircraft at FL370). In order to have a correct
April 2019 DPMF flight
DPMF VDL2 MONITORING FLIGHT REPORT
Edition Validity Date: 01/07/2019 Edition: 1.0 Status: Released Issue 7
representation of the channel occupancy, the measurement would need to be done at the airport location (and is not in the scope of this document). However, average channel occupancy values are still presented in this report as they give information on the use of the frequency. This phenomenon is not addressed on ARINC’s terminal frequency because today this frequency is used for both en-route and terminal use. As soon as ARINC implements its dedicated en-route frequency, the same comments will also apply to ARINC’s terminal frequency.
Note 2: The rise of the mean occupancy on the CSC is due to the voice interference that occurred during descent (UK border to AMS) as it will be seen in the next section.
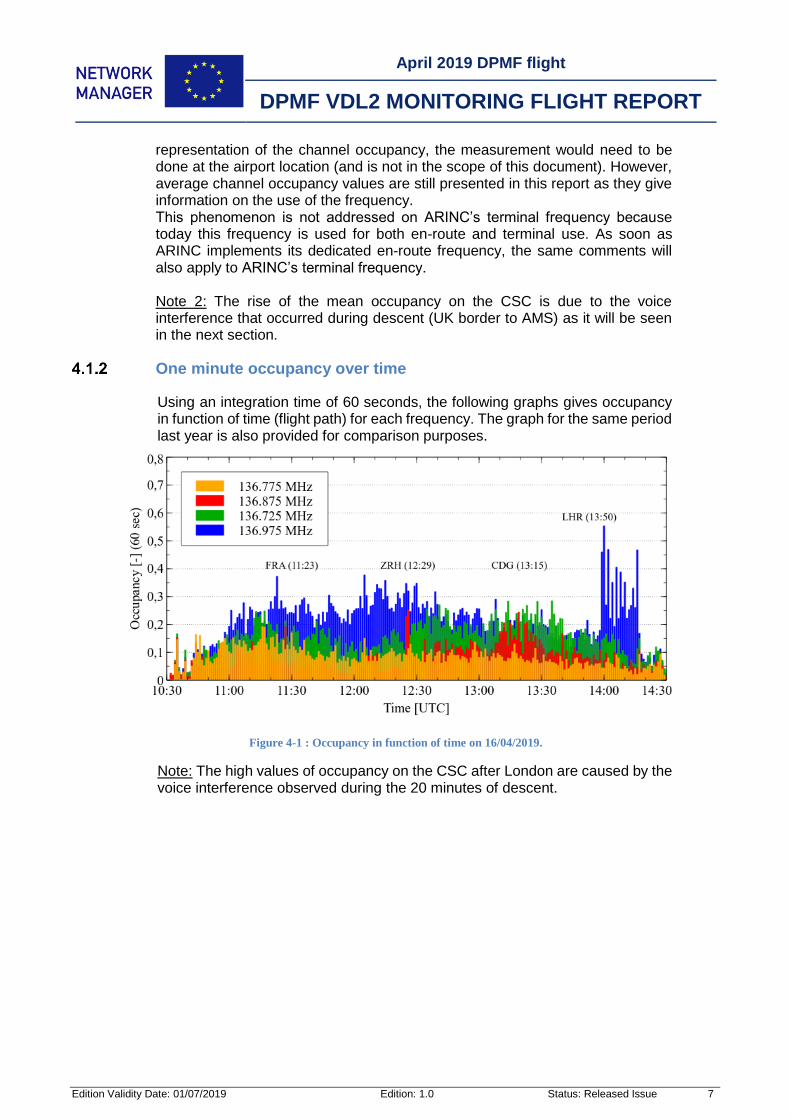
One minute occupancy over time
Using an integration time of 60 seconds, the following graphs gives occupancy in function of time (flight path) for each frequency. The graph for the same period last year is also provided for comparison purposes.
Figure 4-1 : Occupancy in function of time on 16/04/2019.
Note: The high values of occupancy on the CSC after London are caused by the voice interference observed during the 20 minutes of descent.

April 2019 DPMF flight
DPMF VDL2 MONITORING FLIGHT REPORT
Edition Validity Date: 01/07/2019 Edition: 1.0 Status: Released Issue 8
Figure 4-2 : Occupancy in function of time on 03/05/2018.
4.2 Airborne collision rate
Using a dataset of 120 one-second4 of data, the collision rate is estimated by computing the ratio between the number of collided bursts over the total number of observed bursts. The values are summarized in the following table.
Table 3 : Collision rate for summer flights
Frequency / assignation 08.2015 08.2016 07.2017 08.2018
136.975 MHz CSC 47.85% 42.57% 50.28% 37.10%
136.875 MHz SITA Ter. 6.43% 16.31% 16.26% 15.82%
136.825 MHz ARINC E-R - - - -
136.775 MHz SITA E-R - - 7.52% 5.91%
136.725 MHz ARINC Ter. - 0.00% 9.92% 29.51%
4 Since 2019 the one-second dataset have been extended to 180 (flight duration above FL285).

April 2019 DPMF flight
DPMF VDL2 MONITORING FLIGHT REPORT
Edition Validity Date: 01/07/2019 Edition: 1.0 Status: Released Issue 9
Table 4 : Collision rate for the spring flights
Frequency / assignation 04.2017 05.2018 04.2019
136.975 MHz CSC 36.71% 37.48% 34.17%
136.875 MHz SITA Ter 17.29% 15.43% 18.32%
136.825 MHz ARINC E-R - - -
136.775 MHz SITA E-R 2.99% 5.49% 13.06%
136.725 MHz ARINC Ter. 6.12% 20.73% 25.27%
Note 1: As mentioned earlier, the measurements on the SITA Terminal frequency do not reflect the real behaviour of the channel. The number of collisions as seen from the aircraft at FL370 is strongly overestimated when compared to the expected reality. We expect very few collisions on a terminal frequency at a specific airport as most aircrafts (on ground) and VGSs see each other whereas the airborne monitoring aircraft sees transmissions from all airport stations acting as hidden transmitters. However, the values are still presented as they are good examples of the hidden transmitter problem phenomenon. Note 2: The reader shall note the significant increase of the collision rate on SITA en-route frequency. Note 3: The reader should note a decrease in the collision rate on the CSC mainly due to the traffic offloading on the CSC. Unfortunately due to the voice interference on the CSC during descent, this decrease is not observable through the mean occupancy from table-2.
4.3 Channel use
This section presents statistics on how the traffic is distributed over the different channels depending on the type of frame sent. The analysis is performed only using correctly received AVLC frames during the full flight duration. All the following analysis is based on the frame size (bytes), not their number.
The traffic rate is expressed in kbits/s5, and is computed using one-minute datasets of traffic along the flight duration. The one-minute integration time is chosen to reduce various “averaging” effects (time, location) that is observed if we use the aggregated data from the full flight when analysing the peak of the
5 The traffic rate is expressed as : 𝑅𝑎𝑡𝑒 [𝑘𝑏𝑖𝑡𝑠 𝑠⁄ ] = 8 ∗
𝑇𝑟𝑎𝑓𝑓𝑖𝑐 [𝑘𝐵/𝑚𝑖𝑛𝑢𝑡𝑒]
60

April 2019 DPMF flight
DPMF VDL2 MONITORING FLIGHT REPORT
Edition Validity Date: 01/07/2019 Edition: 1.0 Status: Released Issue 10
traffic6. The Median and the 95th percentile values are used to estimate the “mean” and “peak” traffic on the different channels.
Tabulated values related to the following graphs can be found in the annexe 2.
Share of channels by ACSPs
The following graphs summarizes the share of each channel by the service providers over time.
Figure 4-3 : Traffic distribution between ACSP per frequency
Note: The use of 136.875 MHz by both ACSP in 2015 and 2016 is due to the mixed used of the frequency prior to 2017.
The following graph focuses on the distribution of traffic between ACSPs on the CSC.
6 The observed traffic being a function of time and location, the monitoring aircraft flying across Europe above different locations will observe different traffic profiles. Moreover, some flights experienced interferences and/or corrupted data of various sources, hence reducing the total number of correctly received AVLC frame during the flight.

April 2019 DPMF flight
DPMF VDL2 MONITORING FLIGHT REPORT
Edition Validity Date: 01/07/2019 Edition: 1.0 Status: Released Issue 11
Figure 4-4 : Traffic distribution between ACSPs on the CSC
CSC offload
The following graph summarizes the percentage of traffic between the CSC and the alternate frequencies (the latter is split between the two ACSPs), highlighting the increase of traffic on the alternate frequencies.
Figure 4-5 : Partition of the total traffic between the CSC and the alternate frequencies
The following graph displays the evolution of the total traffic volume heard during the monitoring flights for each ACSP between the CSC and the alternate frequencies (grouped) highlighting the percentage of traffic volume offloaded from the CSC for each ACSP.

April 2019 DPMF flight
DPMF VDL2 MONITORING FLIGHT REPORT
Edition Validity Date: 01/07/2019 Edition: 1.0 Status: Released Issue 12
Figure 4-6 : Evolution of the traffic volume per ACSP between the CSC and Alternate frequencies
Note: 80% of the traffic volume heard on SITA’s network is seen on alternate frequencies while 57% of the traffic volume heard on ARINC’s network is seen on the alternate frequency.
The following graph shows the number of aircraft (unique ICAO 24-bits address) observed during the monitoring flight in function of the frequencies (CSC-alternates). It highlights the number of aircraft tuned to alternate frequencies in function of the monitoring flights. The number of aircraft only heard on the CSC is computed as the difference between the total number of aircraft heard (per ACSP) and the ones heard on alternate frequencies.
Figure 4-7 : Number of aircraft heard on alternate frequencies
April 2019 DPMF flight
DPMF VDL2 MONITORING FLIGHT REPORT
Edition Validity Date: 01/07/2019 Edition: 1.0 Status: Released Issue 13
Note 1: An aircraft only heard on the CSC does not mean it is not multi-frequency capable.
Note 2: 78% of the aircraft (unique ICAO 24-bits address) on SITA’s network were heard on alternate frequencies while 56% of the aircraft (unique ICAO 24-bits address) on ARINC’s network were heard on an alternate frequency. Looking at all the aircraft (both ACSPs), 66% of them are heard on alternate frequencies.
Note 3: The growth of the total number of aircraft heard during the 4 hrs of monitoring flight has been reduced to a yearly average of 4.7% since 2017 while the growth was observed to be 17.6% between 2015 and 2017.
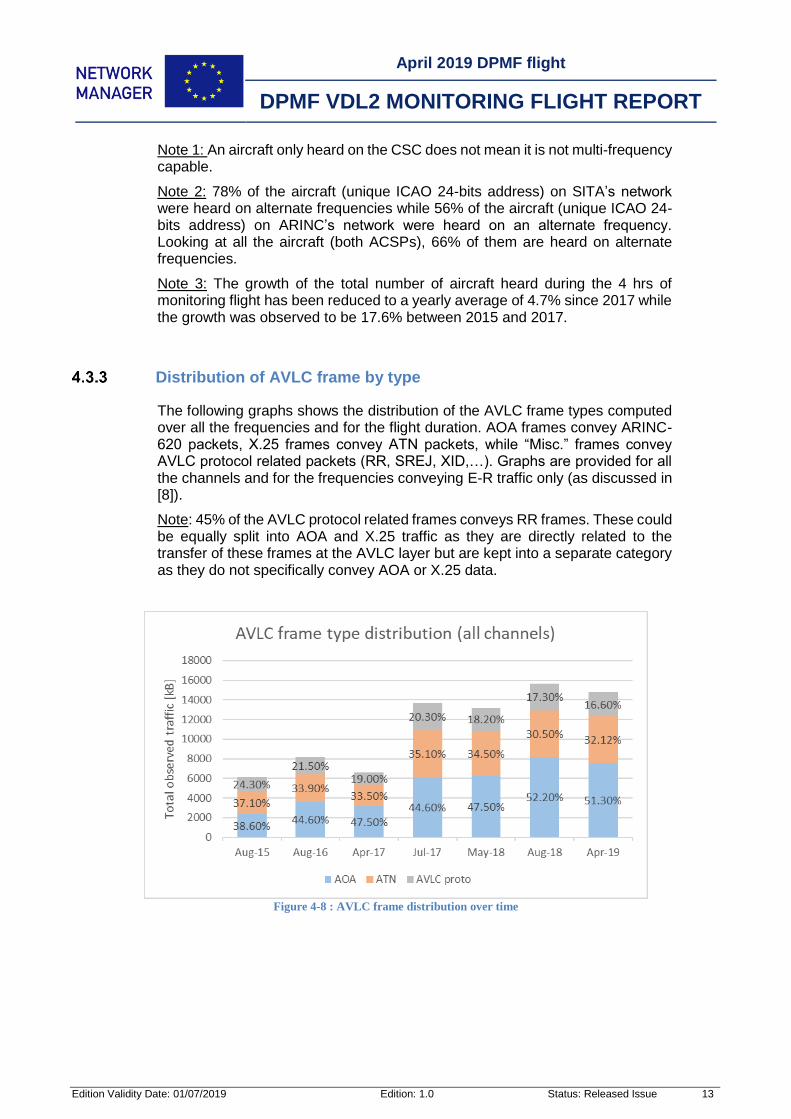
Distribution of AVLC frame by type
The following graphs shows the distribution of the AVLC frame types computed over all the frequencies and for the flight duration. AOA frames convey ARINC-620 packets, X.25 frames convey ATN packets, while “Misc.” frames convey AVLC protocol related packets (RR, SREJ, XID,…). Graphs are provided for all the channels and for the frequencies conveying E-R traffic only (as discussed in [8]).
Note: 45% of the AVLC protocol related frames conveys RR frames. These could be equally split into AOA and X.25 traffic as they are directly related to the transfer of these frames at the AVLC layer but are kept into a separate category as they do not specifically convey AOA or X.25 data.
Figure 4-8 : AVLC frame distribution over time

April 2019 DPMF flight
DPMF VDL2 MONITORING FLIGHT REPORT
Edition Validity Date: 01/07/2019 Edition: 1.0 Status: Released Issue 14
Figure 4-9: AVLC frame distribution over time for frequencies conveying E-R traffic
Note 1: An increase of 12% of the global traffic is observed between May 2018 and April 2019.
Note 2: AOA is responsible for 60% of the global traffic volume observed.
April 2019 DPMF flight
DPMF VDL2 MONITORING FLIGHT REPORT
Edition Validity Date: 01/07/2019 Edition: 1.0 Status: Released Issue 15
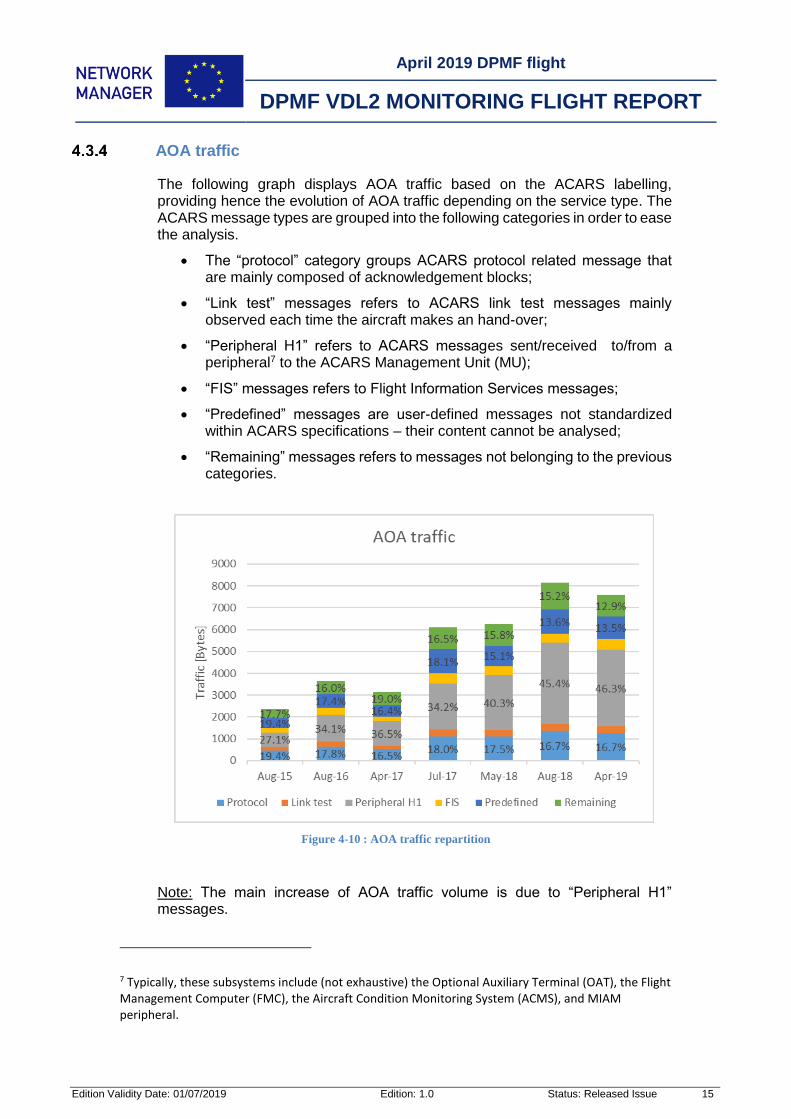
AOA traffic
The following graph displays AOA traffic based on the ACARS labelling, providing hence the evolution of AOA traffic depending on the service type. The ACARS message types are grouped into the following categories in order to ease the analysis.
The “protocol” category groups ACARS protocol related message that are mainly composed of acknowledgement blocks;
“Link test” messages refers to ACARS link test messages mainly observed each time the aircraft makes an hand-over;
“Peripheral H1” refers to ACARS messages sent/received to/from a peripheral7 to the ACARS Management Unit (MU);
“FIS” messages refers to Flight Information Services messages;
“Predefined” messages are user-defined messages not standardized within ACARS specifications – their content cannot be analysed;
“Remaining” messages refers to messages not belonging to the previous categories.
Figure 4-10 : AOA traffic repartition
Note: The main increase of AOA traffic volume is due to “Peripheral H1” messages.
7 Typically, these subsystems include (not exhaustive) the Optional Auxiliary Terminal (OAT), the Flight Management Computer (FMC), the Aircraft Condition Monitoring System (ACMS), and MIAM peripheral.

April 2019 DPMF flight
DPMF VDL2 MONITORING FLIGHT REPORT
Edition Validity Date: 01/07/2019 Edition: 1.0 Status: Released Issue 16
Global peak and median traffic rate (kbits/s) per AVLC frame type
The following graphs shows the median and 95th percentile traffic rate for the three categories of AVLC frames computed over all the frequencies. Graphs are provided for all the channels and for the frequencies conveying E-R traffic only (as discussed in [8]).
Figure 4-11 : Median traffic rate
Figure 4-12: Median traffic rate for frequencies conveying E-R traffic

April 2019 DPMF flight
DPMF VDL2 MONITORING FLIGHT REPORT
Edition Validity Date: 01/07/2019 Edition: 1.0 Status: Released Issue 17
Figure 4-13 : 95th percentile traffic rate
Figure 4-14: 95th percentile traffic rate for frequencies conveying E-R traffic
Note: An increase of 15.7% (all channels) and 15.7% (E-R only) of the median traffic rate is observed between May 2018 and April 2019. The increase of the 95th percentile is 9.4% (all channels) and 19.8% (E-R only).

April 2019 DPMF flight
DPMF VDL2 MONITORING FLIGHT REPORT
Edition Validity Date: 01/07/2019 Edition: 1.0 Status: Released Issue 18
Channel throughput
The following graphs shows the peak and median channel8 throughputs (kbits/s) measured per frequency over a one-minute time window.
Figure 4-15 : Peak channel throughput
Figure 4-16 : Median channel throughput
Note 1: The throughput on the CSC (both peak and median) is decreasing since July 2017. This is mostly due to the offloading of the CSC
8 We consider here the bust length instead of the AVLC size.

April 2019 DPMF flight
DPMF VDL2 MONITORING FLIGHT REPORT
Edition Validity Date: 01/07/2019 Edition: 1.0 Status: Released Issue 19
4.4 Interferences
The same kind of interferences as seen during the previous monitoring flights were observed across the VDL band.
The following table summarizes the duration (MM:SS) of the interferences over the full flight duration.
Table 5 : Interference duration summary
08.2015 08.2016 04.2017 07.2017 05.2018 08.2018 04.2019
Modulated voice signals 02:58 21:04 01:42 01:54 01:43 01:46 11:14
RTTY-like signals 00:34 00:14 02:27 00:28 01:00 00:00 00:00
5-tones selcall 00:23 00:42 00:48 00:22
Industial noise-like 34:56 12:59 04:32 10:36 07:45 07:53 09:54
Total 38:53 34:17 08:41 13:21 11:10 10:27 21:30
Note: The satellite signals are no longer displayed nor analysed as their presence is known, regular and predictable9. The two satellites identified by the Leeheim (D) satellite monitoring station in 2015 have an average pass of 2 hours every 60 hours each, resulting in an interfering signal to be present about 3.3% of the time.
Modulated voice signals
Voice communications are still present on the VDL band. The following tables summarizes their duration according to the channels they were observed on.
Table 6 : Modulated voice signal duration summary
N. of transmissions Duration (MM:SS) Notes
136.975 MHz 161 05:48 CSC
136.950 MHz 8 00:16 Guard channel
136.912 MHz 102 03:55 Guard channel
136.875 MHz 4 00:22 SITA Ter.
136.800 MHz 24 00:53 Guard channel
9 The satellite passes can be computed using NORAD TLEs. A Two Line Element set (TLE) is a data
format to encode orbital elements of an earth-orbiting object within two lines of ASCII text and used to estimate the position of the object using prediction formulae. The North American Aerospace Defence Command (NORAD) tracks all detectable earth-orbiting objects and the non-classified objects TLEs are made available on the website: https://www.celestrak.com/NORAD/elements/.

April 2019 DPMF flight
DPMF VDL2 MONITORING FLIGHT REPORT
Edition Validity Date: 01/07/2019 Edition: 1.0 Status: Released Issue 20
5 Conclusions
This report presents the results of the 7th monitoring flight that took place on April 16th 2019.
The key points are summarized hereafter and further discussed in the following paragraphs:
1. 67% of the observed traffic volume is now taking place on the alternate frequencies.
2. An increase of 12% of the traffic volume is observed between May 2018 and April 2019.
3. The traffic volume on the CSC is split 73% ARINC and 27% SITA.
4. The traffic on the CSC is continuously decreasing since July 2017.
5. 78% of the aircrafts on SITA’s network are observed on its alternates frequencies while 56% for ARINC.
6. AOA represent 60% of the global traffic volume.
7. The median traffic rate increased by 15.7% between May 2018 and April 2019.
8. Voice communication are still heard on VDL2 frequencies.
Multi-frequency deployment
The multi-frequency deployment is still on-going and 67% of the observed traffic volume is now being performed on the alternate frequencies
The traffic on the CSC is continuously decreasing since July 2017. The median measured throughput has fallen from 5.5 kbits/s in July 2017 to 4.1 kbits/s.
The number of aircraft heard on the alternate frequencies has increased and represent today 66% (78% for SITA and 56% for ARINC).of the total number of aircraft heard during the monitoring flight.
Traffic volume
An increase of 12% of the global traffic volume is observed between May 2018 and April 2019 (section 4.3.3).
80% of the traffic volume heard on SITA’s network is exchanged on its alternate frequencies. 57% of the traffic volume heard on ARINC’s network is exchanged on its alternate frequency.
AOA traffic represents 60% of the global traffic volume observed (section 4.3.3).
The median of the global traffic rate has increased by 15.7% between May 2018 and April 2019 (section 4.3.5).

April 2019 DPMF flight
DPMF VDL2 MONITORING FLIGHT REPORT
Edition Validity Date: 01/07/2019 Edition: 1.0 Status: Released Issue 21
Interferences
A significant voice interference was heard on the CSC during the 20 minutes of descent to AMS. It is by far the most important one observed since 2015. A probable interferer has been identified and notified to the appropriate body.

April 2019 DPMF flight
DPMF VDL2 MONITORING FLIGHT REPORT
Edition Validity Date: 01/07/2019 Edition: 1.0 Status: Released Issue 22
6 REFERENCES
[1] Ch. VISEE, VDL2 Flight test analysis for EUROCONTROL CRO, Preliminary report, C.C.R.M., 2015.
[2] Ch. VISEE, VDL2 Flight test analysis for EUROCONTROL CRO – 2016 test flight analysis – Comparison with 2015 results, C.C.R.M., 2016
[3] Ch. VISEE, VDL2 Flight test analysis for EUROCONTROL CRO – April 2017 monitoring flight and comparison with previous flights, C.C.R.M., 2017
[4] Ch. VISEE, VDL2 Flight test analysis for EUROCONTROL DMPF – July 2017 monitoring flight and comparison with previous flights, C.C.R.M., 2017
[5] D. Isaac, The DPMF report catalogue, v0.2, 2019
[6] ICAO, Annex 10 to the convention on international civil aviation: Volume III Communication systems, July 2007.
[7] ICAO, AUR Frequency Management Manual for Aeronautical Mobile and Aeronautical Radio Navigation Services – ICAO EUR Doc 011 (2017), edition Dec.2017.
[8] Ch. VISEE, DMPF VDL 2 MONITORING FLIGHT REPORT, May 2018 DPMF test flight, July 2018.
[9] Ch. VISEE, VDL2 TRAFFIC MODELING AND FORECASTING, Methodology proposal and initial results, March 2019.
7 ABBREVIATIONS
Abbreviations and acronyms used in this document are available in the EUROCONTROL Air Navigation Inter-site Acronym List (AIRIAL) which may be found here:
http://www.eurocontrol.int/airial/definitionListInit.do?skipLogon=true&glossaryUid=AIRIAL
April 2019 DPMF flight
DPMF VDL2 MONITORING FLIGHT REPORT
Edition Validity Date: 01/07/2019 Edition: 1.0 Status: Released Issue 23
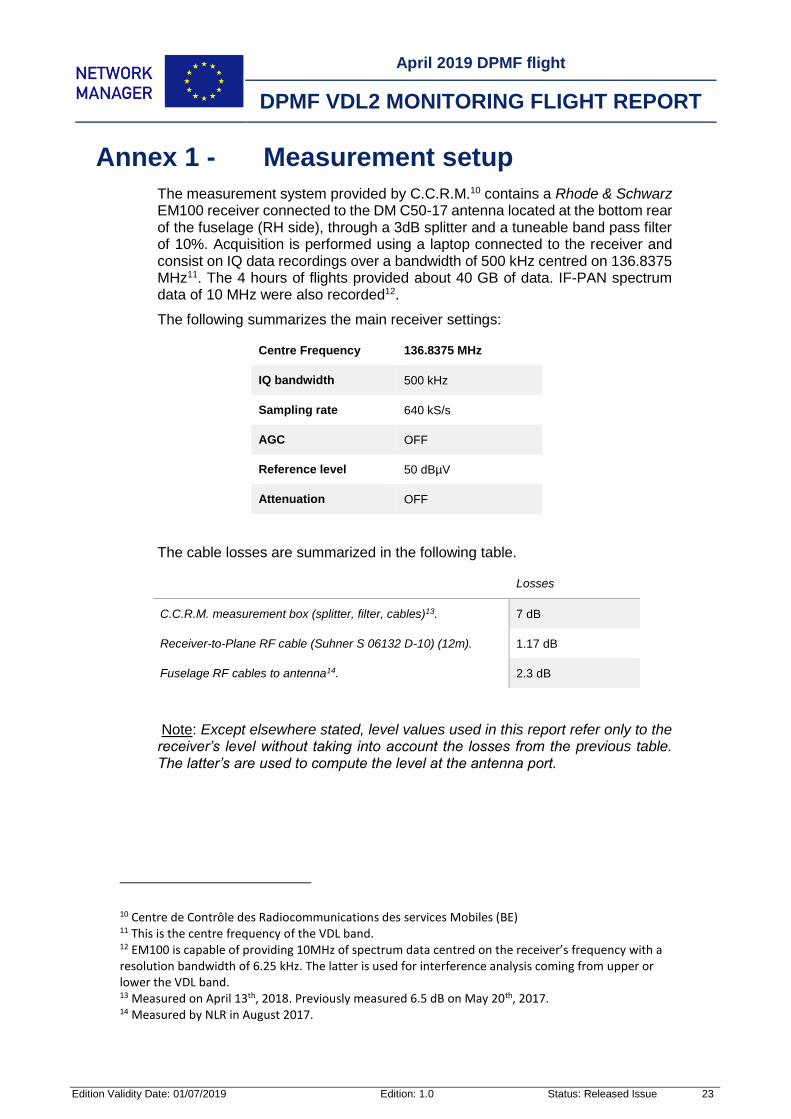
Annex 1 - Measurement setup
The measurement system provided by C.C.R.M.10 contains a Rhode & Schwarz EM100 receiver connected to the DM C50-17 antenna located at the bottom rear of the fuselage (RH side), through a 3dB splitter and a tuneable band pass filter of 10%. Acquisition is performed using a laptop connected to the receiver and consist on IQ data recordings over a bandwidth of 500 kHz centred on 136.8375 MHz11. The 4 hours of flights provided about 40 GB of data. IF-PAN spectrum data of 10 MHz were also recorded12.
The following summarizes the main receiver settings:
Centre Frequency 136.8375 MHz
IQ bandwidth 500 kHz
Sampling rate 640 kS/s
AGC OFF
Reference level 50 dBµV
Attenuation OFF
The cable losses are summarized in the following table.
Losses
C.C.R.M. measurement box (splitter, filter, cables)13. 7 dB
Receiver-to-Plane RF cable (Suhner S 06132 D-10) (12m). 1.17 dB
Fuselage RF cables to antenna14. 2.3 dB
Note: Except elsewhere stated, level values used in this report refer only to the receiver’s level without taking into account the losses from the previous table. The latter’s are used to compute the level at the antenna port.
10 Centre de Contrôle des Radiocommunications des services Mobiles (BE) 11 This is the centre frequency of the VDL band. 12 EM100 is capable of providing 10MHz of spectrum data centred on the receiver’s frequency with a resolution bandwidth of 6.25 kHz. The latter is used for interference analysis coming from upper or lower the VDL band. 13 Measured on April 13th, 2018. Previously measured 6.5 dB on May 20th, 2017. 14 Measured by NLR in August 2017.

April 2019 DPMF flight
DPMF VDL2 MONITORING FLIGHT REPORT
Edition Validity Date: 01/07/2019 Edition: 1.0 Status: Released Issue 24
Annex 2 - Tabulated values of chapter 3
A1.1 Service provider related data
Table 7 : Traffic partition per ACSP and per frequency for the summer flights
Frequency / assignation 08.2015 08.2016 07.2017 08.2017
136.975 MHz CSC (ARINC)
(SITA)
44%
56%
38%
62%
45%
55%
58%
42%
136.875 MHz SITA Ter.
(ARINC)
80%
20%
96%
4%
100%
0%
100%
136.825 MHz ARINC E-R - - - -
136.775 MHz SITA E-R - - 100% 100%
136.725 MHz ARINC Ter. - 100% 100% 100%
Table 8 : Traffic repartition per ACSP and per frequency for the spring flights
Frequency / assignation 04.2017 05.2018 04.2019
136.975 MHz CSC (ARINC)
(SITA)
43%
57%
64%
36%
73%
27%
136.875 MHz SITA Ter. 100% 100% 100%
136.825 MHz ARINC E-R - -
136.775 MHz SITA E-R 0% 100% 100%
136.725 MHz ARINC Ter. 100% 100% 100%
Table 9 : Global traffic partition per ACSP
Provider 08.2015 08.2016 04.2017 07.2017 05.2018 08.2018 04.2019
GLOBAL CSC 89% 72% 60% 53% 42% 36% 33%
Alt. 11% 28% 40% 47% 58% 64% 67%
ARINC CSC 93% 91% 79% 74% 47% 37% 43%
Alt. 7% 9% 21% 26% 53% 63% 57%
SITA CSC 82% 64% 51% 43% 35% 35% 20%
Alt. 18% 36% 49% 57% 65% 65% 80%

April 2019 DPMF flight
DPMF VDL2 MONITORING FLIGHT REPORT
Edition Validity Date: 01/07/2019 Edition: 1.0 Status: Released Issue 25
A1.2 Number of station heard and their generated traffic
The following table summarizes, for each channel, the number of station heard (airborne/grounded aircraft, VGSs) and their respective generated traffic.
Table 10 : Number of station and their generated traffic per frequency and per station type
08.2015 08.2016 04.2017 07.2017 05.2018 08.2018 04.2019
136.975 MHz
CSC
AIR 1284 1628 1356 1742 1511 1558 1381
2537 kB 3758 kB 1960 kB 4326 kB 3014 kB 3198 kB 2890 kB
GND 411 472 365 525 487 492 460
283 kB 283 kB 327 kB 465 kB 480 kB 458 kB 409 kB
VGS 69 88 79 88 97 107 102
1749 kB 1892 kB 1689 kB 2452 kB 2011 kB 1962 kB 1620 kB
136.875 MHz
SITA Ter.
AIR 63 223 238 412 368 398 400
135 kB 354 kB 255 kB 666 kB 841 kB 874 kB 801 kB
GND 127 434 334 536 284 303 351
247 kB 901 kB 814 kB 1317 kB 757 kB 831 kB 815 kB
VGS 18 29 24 28 25 26 25
330 kB 857 kB 637 kB 1277 kB 693 kB 868 kB 934 kB
136.775 MHz
SITA E-R
AIR 0 0 169 443 390 466 673
0 kB 0 kB 269 kB 1166 kB 915 kB 1302 kB 1854 kB
GND 0 0 22 52 15 20 14
0 kB 0 kB 33 kB 105 kB 8 kB 23 kB 20 kB
VGS 0 1 11 16 17 20 17
0 kB 3 kB 202 kB 814 kB 451 kB 501 kB 719 kB
136.725 MHz
ARINC Ter.
AIR 0 61 166 232 467 662 623
0 kB 83 kB 250 kB 753 kB 2415 kB 3158 kB 2557 kB
GND 0 9 26 45 163 233 253
0 kB 1 kB 6 kB 12 kB 345 kB 742 kB 690 kB
VGS 0 5 7 7 11 13 16
0 kB 60 kB 192 kB 380 kB 1296 kB 1763 kB 1509 kB

April 2019 DPMF flight
DPMF VDL2 MONITORING FLIGHT REPORT
Edition Validity Date: 01/07/2019 Edition: 1.0 Status: Released Issue 26
A1.3 Partition of AVLC frame type
The following table summarizes, for the four channels, the repartition of AVLC frame type. AOA frames convey ARINC-620 packets, X.25 frames convey ATN packets, while “Misc.” frames convey AVLC protocol related packets (RR, SREJ, XID,…).
Table 11 : Traffic repartition per frequency and AVLC frame type
08.2015 08.2016 04.2017 07.2017 05.2018 08.2018 04.2019
136.975 MHz
CSC
AOA 37.2% 38.1% 38.9% 36.3% 42.9% 45.6% 47.4%
X.25 38.9% 38.1% 39.7% 41.1% 37.1% 34.1% 32.7%
Misc. 23.9% 23.8% 21.4% 22.5% 20.0% 20.3% 19.8%
136.875 MHz
SITA Ter.
AOA 52.5% 62.4% 67.6% 61.4% 63.2% 62.1% 69.3%
X.25 26.3% 21.2% 18.3% 21.4% 20.2% 22.8% 18.7%
Misc. 21.2% 16.4% 14.1% 17.2% 16.6% 15.1% 11.9%
136.775 MHz
SITA E-R
AOA - 0% 52.9% 49.5% 38.5% 48.7% 40.1%
X.25 - 0% 25.1% 29.8% 38.4% 31.1% 40.2%
Misc. - 100% 22.0% 20.8% 23.1% 20.1% 19.7%
136.725 MHz
ARINC Ter.
AOA - 31.6% 35.3% 35.8% 47.5% 55.3% 51.8%
X.25 - 41.6% 45.3% 46.0% 37.8% 30.3% 34.1%
Misc. - 26.7% 19.4% 18.2% 14.7% 14.4% 14.1%
The following table summarizes the global repartition of the AVLC frame types, all channels confound. For the AOA type, the proportion for ARINC and SITA is provided between brackets.
Table 12 : Global traffic repartition per AVLC frame type
08.2015 08.2016 04.2017 07.2017 05.2018 08.2018 04.2019
AOA
(ARINC -SITA)
38.6%
(11.2%-27.4%)
44.6%
(12.0%-32.6%)
47.5%
(12.4%-35.1%)
44.6%
(11.8%-32.9%)
47.5%
(28.3%-
19.2%)
52.2%
(31.1%-21.1%)
51.3%
(29.0%-22.3%)
X.25 37.1% 33.9% 33.5% 35.1% 34.5% 30.5% 32.1%
Misc. 24.3% 21.5% 19.0% 20.3% 18.2% 17.3% 16.6%
April 2019 DPMF flight
DPMF VDL2 MONITORING FLIGHT REPORT
Edition Validity Date: 01/07/2019 Edition: 1.0 Status: Released Issue 27
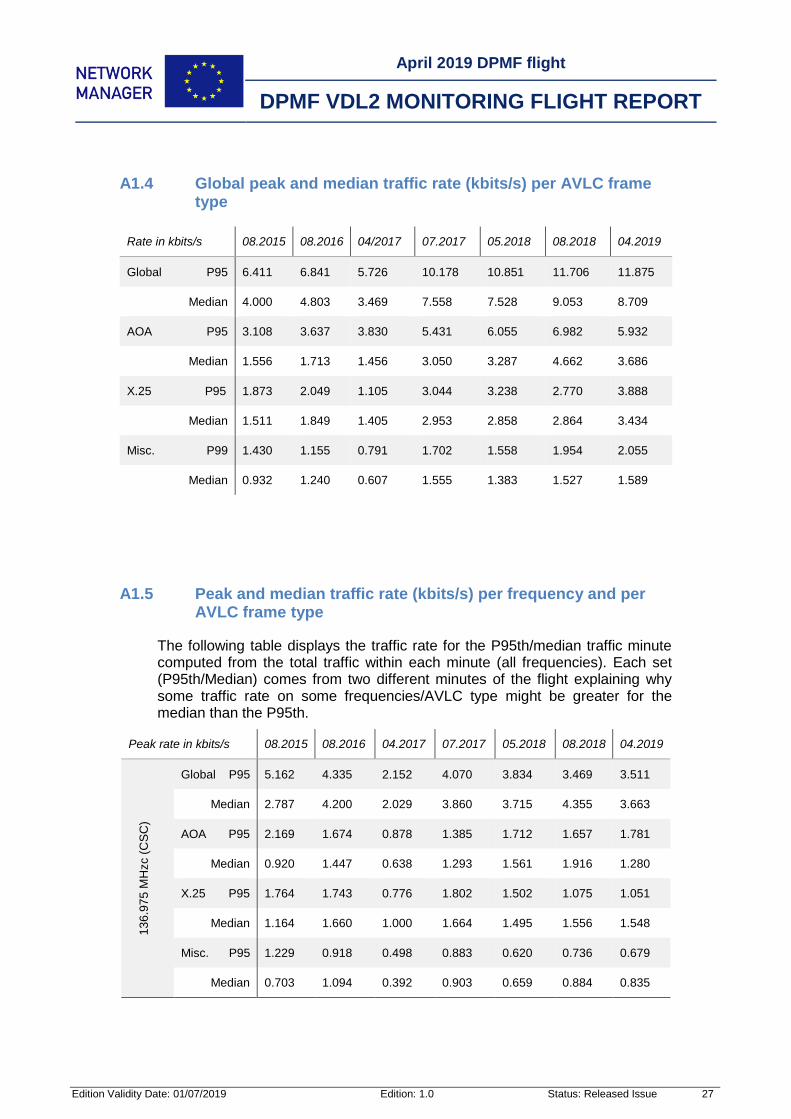
A1.4 Global peak and median traffic rate (kbits/s) per AVLC frame type
Rate in kbits/s 08.2015 08.2016 04/2017 07.2017 05.2018 08.2018 04.2019
Global P95 6.411 6.841 5.726 10.178 10.851 11.706 11.875
Median 4.000 4.803 3.469 7.558 7.528 9.053 8.709
AOA P95 3.108 3.637 3.830 5.431 6.055 6.982 5.932
Median 1.556 1.713 1.456 3.050 3.287 4.662 3.686
X.25 P95 1.873 2.049 1.105 3.044 3.238 2.770 3.888
Median 1.511 1.849 1.405 2.953 2.858 2.864 3.434
Misc. P99 1.430 1.155 0.791 1.702 1.558 1.954 2.055
Median 0.932 1.240 0.607 1.555 1.383 1.527 1.589
A1.5 Peak and median traffic rate (kbits/s) per frequency and per AVLC frame type
The following table displays the traffic rate for the P95th/median traffic minute computed from the total traffic within each minute (all frequencies). Each set (P95th/Median) comes from two different minutes of the flight explaining why some traffic rate on some frequencies/AVLC type might be greater for the median than the P95th.
Peak rate in kbits/s 08.2015 08.2016 04.2017 07.2017 05.2018 08.2018 04.2019
13
6.9
75
MH
zc (
CS
C)
Global P95 5.162 4.335 2.152 4.070 3.834 3.469 3.511
Median 2.787 4.200 2.029 3.860 3.715 4.355 3.663
AOA P95 2.169 1.674 0.878 1.385 1.712 1.657 1.781
Median 0.920 1.447 0.638 1.293 1.561 1.916 1.280
X.25 P95 1.764 1.743 0.776 1.802 1.502 1.075 1.051
Median 1.164 1.660 1.000 1.664 1.495 1.556 1.548
Misc. P95 1.229 0.918 0.498 0.883 0.620 0.736 0.679
Median 0.703 1.094 0.392 0.903 0.659 0.884 0.835

April 2019 DPMF flight
DPMF VDL2 MONITORING FLIGHT REPORT
Edition Validity Date: 01/07/2019 Edition: 1.0 Status: Released Issue 28
13
6.8
75
MH
z
(SIT
A T
er)
.
Global P95 1.249 2.422 2.631 2.034 2.446 2.276 2.257
Median 1.213 0.566 1.044 2.041 0.946 1.104 1.472
AOA P95 0.939 1.938 2.330 1.171 1.908 1.249 1.499
Median 0.637 0.256 0.706 1.246 0.600 0.871 1.224
X.25 P95 0.109 0.273 0.142 0.495 0.287 0.653 0.439
Median 0.347 0.166 0.215 0.521 0.173 0.140 0.107
Misc. P95 0.201 0.212 0.159 0.368 0.251 0.375 0.319
Median 0.229 0.144 0.124 0.274 0.173 0.094 .0141
13
6.7
75
MH
z
(SIT
A E
-R)
Global P95 - - 0.727 3.329 0.638 0.872 2.080
Median - - 0.117 0.544 0.955 0.656 2.153
AOA P95 - - 0.576 2.535 0.226 0.449 0.670
Median - - 0.040 0.119 0.186 0.125 0.600
X.25 P95 - - 0.093 0.442 0.275 0.216 0.956
Median - - 0.037 0.252 0.454 0.263 1.163
Misc. P99 - - 0.058 0.351 0.137 0.207 0.464
Median - - 0.039 0.173 0.315 0.269 0.389
13
6.7
25
MH
z
(AR
INC
Ter)
.
Global P95 - 0.084 0.215 0.745 3.932 5.089 4.026
Median - 0.037 0.279 1.113 1.192 2.937 1.421
AOA P95 - 0.025 0.046 0.340 2.208 3.627 1.982
Median - 0.011 0.073 0.392 0.939 1.751 0.582
X.25 P95 - 0.033 0.094 0.305 1.173 0.826 1.441
Median - 0.023 0.153 0.516 0.736 0.906 0.616
Misc. P95 - 0.026 0.076 0.100 0.551 0.636 0.603
Median - 0.003 0.053 0.205 0.237 0.280 0.224
April 2019 DPMF flight
DPMF VDL2 MONITORING FLIGHT REPORT
Edition Validity Date: 01/07/2019 Edition: 1.0 Status: Released Issue 29
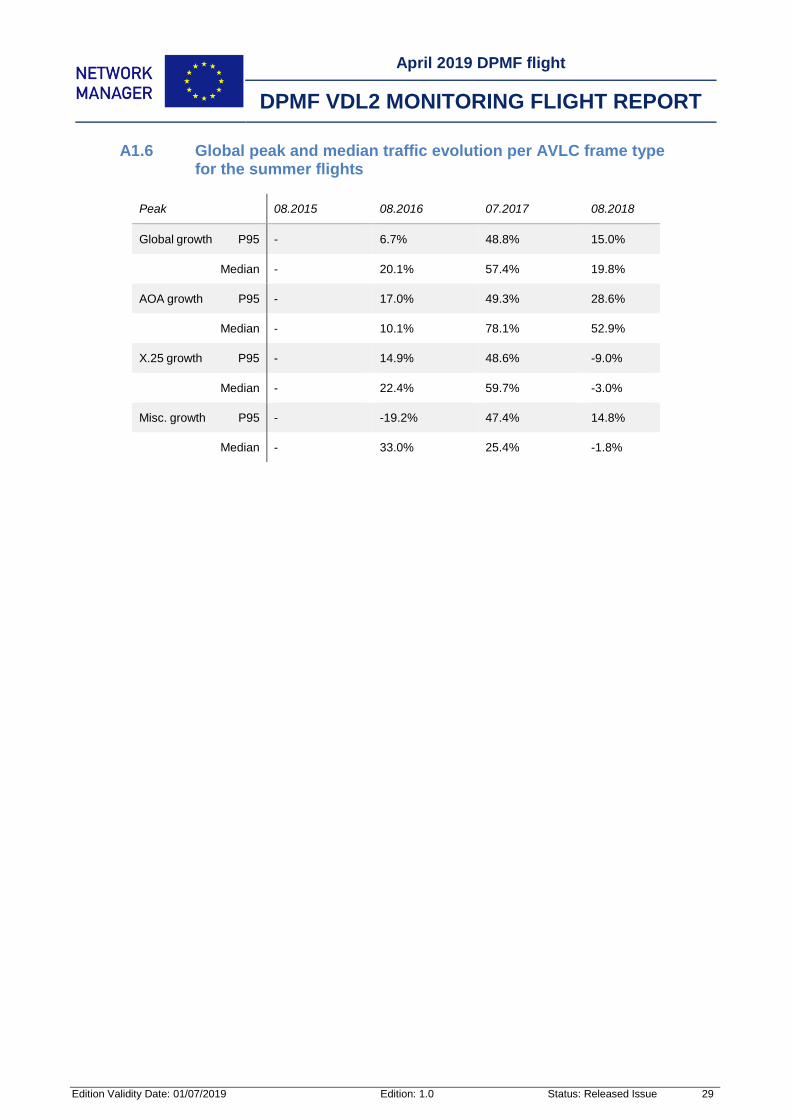
A1.6 Global peak and median traffic evolution per AVLC frame type for the summer flights
Peak 08.2015 08.2016 07.2017 08.2018
Global growth P95 - 6.7% 48.8% 15.0%
Median - 20.1% 57.4% 19.8%
AOA growth P95 - 17.0% 49.3% 28.6%
Median - 10.1% 78.1% 52.9%
X.25 growth P95 - 14.9% 48.6% -9.0%
Median - 22.4% 59.7% -3.0%
Misc. growth P95 - -19.2% 47.4% 14.8%
Median - 33.0% 25.4% -1.8%

April 2019 DPMF flight
DPMF VDL2 MONITORING FLIGHT REPORT
Edition Validity Date: 01/07/2019 Edition: 1.0 Status: Released Issue 30
Annex 3 - Receiver level PDF and CDF curves
The following graphs provides with the PDF and CDF of the receiver’s level. Occupancy at a specific level threshold can be calculated using the following formula:
𝑂𝑐𝑐𝑢𝑝𝑎𝑛𝑐𝑦 [−] = 1 − 𝐶𝐷𝐹(𝐿𝑒𝑣𝑒𝑙𝑡ℎ𝑟𝑒𝑠ℎ𝑜𝑙𝑑 [𝑑𝐵𝑚])
A1.7 136.975 MHz

April 2019 DPMF flight
DPMF VDL2 MONITORING FLIGHT REPORT
Edition Validity Date: 01/07/2019 Edition: 1.0 Status: Released Issue 31
A1.8 136.875 MHz
A1.9 136.775 MHz

April 2019 DPMF flight
DPMF VDL2 MONITORING FLIGHT REPORT
Edition Validity Date: 01/07/2019 Edition: 1.0 Status: Released Issue 32
A1.10 136.725 MHz

April 2019 DPMF flight
DPMF VDL2 MONITORING FLIGHT REPORT
Edition Validity Date: 01/07/2019 Edition: 1.0 Status: Released Issue 33
DOCUMENT FINAL PAGE


![EUROCONTROL Call Sign Similarity Project WG1/3-CSST.pdf · EUROCONTROL Call Sign Similarity Project ... Initialise ATC C/S [file] Flight Schedule With proposed ATC C/S ... F5 F4 F3](https://static.fdocuments.us/doc/165x107/5b1cf6d67f8b9a16788bc429/eurocontrol-call-sign-similarity-project-wg13-csstpdf-eurocontrol-call-sign.jpg)