APRIL 2018JULY 2018 - Mesco Steel
31
Transcript of APRIL 2018JULY 2018 - Mesco Steel

APRIL 2018JULY 2018
INVESTOR PRESENTATION
Mideast Integrated Steels Limited

Iron Ore: Mining rights - 3MTPA
Pig Iron:
Approved Capacity - 1.2MTPA
Current Capacity - 0.7MTPA
Executive Summary
2
Total Revenue
INR
6,302 Mn
EBITDA
INR
1,548 Mn
EBITDA Margins
24.56 %
Net ProfitINR
233 Mn
• Mideast Integrated Steels Ltd.
(MISL) belongs to the MESCO
STEEL GROUP which has
business interests in steel to
aerospace.
• MISL was incorporated in 1992
with assets in coastal Odisha in
eastern India.
• Listed on BSE by the name of
Mideast Integrated Steels Ltd.
OverviewFinancials
FY18*Business Mix
*Standalone financials

COMPANY OVERVIEW
3

Company Overview
4
• Incorporated in 1992, Mideast Integrated Steels Ltd.
(MISL) belongs to one of the fastest growing
business groups in India the MESCO GROUP which
has business interests in steel to aerospace.
• MISL is engaged in the business of Iron Ore mining
and Pig Iron production.
• Secured the Roida iron ore mining lease in the prime
iron ore belt of Odisha in1996.
• Pig Iron plant has two 389 cubic meters Blast
Furnaces and the hot metal is cast as Pig Iron.
• Acquired Maithan Ispat Ltd. in 2015, a stressed asset
which possesses an integrated facility, straddling the
value chain from ore to finished steel.
• Mining concession in place for Limestone and
Dolomite mines in Katni, Madhya Pradesh covering
533 hectares.
5,530 5,210
2253,221
3,090
37
2,630
2,810
3,080
-
1,000
2,000
3,000
4,000
5,000
6,000
7,000
8,000
9,000
10,000
FY14 FY15 FY16 FY17* FY18
Pig Iron Mining
Revenue Mix (INR Mn)
* Production of pig iron was suspended due to unfavourable steel prices.

Key Milestones
5
Mideast
Integrated
Steels Ltd
Formed
Came out
with an IPO
Acquisition
of Roida
Iron Ore
Mine
Foundation of
Pig Iron Plant at
Jajpur
Pig Iron Plant
Commissioned
Iron Ore
Mine Starts
Production
Production
Starts at Pig
Iron Plant
Mining
Concessions
for limestone
and dolomite in
MP
Sinter Plant
Commissioned
Private
Railway Siding
Commissioned
2005 2006 2007 2010 2011 2012 20151992 1996 19971994 2017
Listed back
on BSE
Acquires
Maithan Ispat
Ltd

Board of Directors
6
•Has set a great example of woman entrepreneurship in the country.
•Starting from a small business, through sheer determination and entrepreneurial drive she navigated Mesco Steel group through choppywaters to the present position of strength.
Mrs. Rita Singh, Chairperson cum Managing Director
•Holds a B. A. (Economics) degree.
•Having more than 20 years experience she has been successfully managing the company.
Mrs. Natasha Singh Sinha, Director Finance
•Holds a B. Tech (Electrical) from IIT, New Delhi and MBA from Delhi University.
•Has more than 40 years of work experience in public and private sector in marketing, strategic planning, business diversification, policyformulation for import and export of commodities, supply chain, Management and logistics and promoting trade related infrastructure.
Mr. Sanjiv Batra, Non Executive Independent Director
•Holds a Master Degree of Arts in Economics and an M. Phil in Public Administration.
•Has held prestigious positions of authority like Additional Secretary, Commerce – Government of India; Secretary, Ministry of Small ScaleIndustry – Government of India; Chief Secretary – Government of Odisha, etc.
Mr. Debi Prasad Bagchi, Non Executive Independent Director

•Holds a Master of Arts degree in Economics and a Bachelor's degree in Law. He did professional programs in Project Management and HumanResource Development from IIM Ahmadabad, IIM Kolkata, IMI New Delhi and he is a Certified Associate of Indian Institute of Bankers (CAIIB).
•His banking career spans over 37 years and covers every major dimension of banking operations, both in India as well as overseas.
Mr. Madhukar, Non Executive Independent Director
•Ex Chief Commissioner of Income Tax, belongs to the 1966 cadre of the Indian Revenue Service
•Has over 36 years of rich and experience in various critical portfolios in public sector administration.
Mr. Nandanandan Mishra, Non Executive Independent Director
•Has more than 20 years of work experience in public and private sector in strategic planning, business diversification, policy formulationaviation, aerospace, aircrafts, and ancillary industry.
•Has last served as member advisory committee to Punjab government on aviation and civil pilot A.L.T.P license.
Mr. Gurjeet Singh Jawandha, Non Executive Independent Director
•Holds degree of M.Sc. Economics from University College of Swansea, Wales, U. K. , M. Sc. Physics (1st) and B.Sc. Physics (1st).
•Joined the IAS in 1966 and served in different assignment with the Government of India and State Government of West Bengal.
•Also served as India’s Ambassador to European Union, Belgium & Luxemburg at Brussels.
Mr. Dipak Chatterjee, Non Executive Independent Director
Board of Directors
7

Key Strengths
8
• Strong operating cash-flows potential from the merchant iron ore mining operations.
• Environmental Approvals for ramping up mining capacity to 6 MTPA (from present 3 MTPA) is at an advanced stage.
• Well connected with state highways and rails.
Strong Merchant Mining Business
• The merchant iron ore mines provide strong raw material integration for Steel operations in various entities.
• MISL has captive limestone / dolomite mines in Madhya Pradesh – at preliminary stage.
Strong Raw Material Integration
• MISL assets present ready infrastructure for forward integration.
• Readily available land, raw material integration, existing plant and operating iron ore mines – rare combination of assets in the Indian steel industry today.
Strong Steel and Mining Infrastructure
• All the requisite approvals in place for expansion to 3.5MTPA steel manufacturing capacity at the existing pig iron plant of MISL.
All Approvals in Place

BUSINESS OVERVIEW
9

Fines75%
Lumps25%
• The Company is currently having annual mining rights for
3MTPA in Orissa, though they have received Stage-I
approval from Ministry of Environment and Forests (MOEF)
for enhancement to 6MTPA.
• The mine produces high quality iron ore and is a Merchant
Mine with estimated reserves of 199MT.
• Current estimated EBITDA INR 1,500 per tonne.
• As of 31st March 2018, the company has a current inventory
of 2.39 MTPA of iron ore.
• The company produces 70% iron ore fines and 30% lumps
at an average from their mining operations.
Iron Ore: Fines & Lumps
Iron Ore
10
0
5,00,000
10,00,000
15,00,000
20,00,000
25,00,000
30,00,000
35,00,000
Permissible Production Actual Production
Productions Details of Iron Ore MineIron Ore (Fines & Lumps Production Estimates)
• Total Mining Lease Area – 104.68 Ha.
• Land Type – Reserve Forest (Sidhamath RF).
• Already Diverted Forest Area - 51.99 Ha.
• Safety Zone Area - 8.581 Ha.
• Balance Area Applied for Diversion – 44.109 Ha.
• Proposal does not form part of any National Park, Wildlife
Sanctuary or Biosphere Reserve.
• No Protected archeological / heritage site / defense
establishment or any other important monument located in
the area.
• All the mining operation in Orissa were suspended in 2014-
15 and hence there was a downturn in the production of iron
ore during that period.
Roida Mine Details

• Pig iron is the intermediate product in smelting iron ore.
• MISL’s pig iron is ideal for the manufacturing of high end infra goods.
• About 20% - 25% of production is consumed by group entity and these transactions are at arms length prices only, and the rest is sold
to near by steel companies and foundries.
• Being a sinter plant 1.5 tonnes of iron ore fines and 0.5 tonne of iron ore lump is required for the production of 1 tonne of hot metal.
• Currently an average EBITDA of INR 3,500 / tonne is realised by the sale of pig iron.
• One blast furnace is currently in operation at 85% utilisation capacity; and the second furnace is expected to be operational by
September 2018.
Pig Iron
11
• The steel plant of MISL is located on about 237 hectares in Odisha, the steel belt of India.
• MISL has two, 389 cubic meters blast furnaces supported by commensurate raw material handling system, power plant and blower
house, power distribution system, plant water system and associated essential services.
• The hot metal production capacity of the existing blast furnaces has been estimated to be around 700,000 tonnes per year, with up to
70% sinter in the burden and balance sized ore.
• The hot metal is currently cast into Pig Iron.
• The current expansion plan is to take the finished steel capacity to 3.5MTPA in 2 phases.
Mesco-I Steel Plant Jajpur Odisha

Manufacturing Process
Sinter plant
Blast Furnace
Limestone Sinter
Iron Ore Fines
BF Grade Coke
Pig Iron Power Plant
Output
Input
Legend
Saleable
Products
Plants
Raw Materials
Raw Materials
Granulated Slag Molten Metal BF Gas
12
Iron Ore Lumps
Intermediates

Manufacturing Infrastructure
Iron ore
• Approved
capacity up to
1.2MTPA
• Pig iron sold to
nearby
foundries &
Steel factories
Pig Iron
• Power is
received over
132 kV double
circuit line from
Old Duburi
sub-station of
OPTCL and
terminated at
MISL
Plant Power Distribution
• Raw water
treatment plant
• Water systems
pertaining to
BF-1 & BF-2
• Water system
for slag
granulation
Plant Water System
• Connected
between
Jakhapura and
Sukinda Road
stations
• Enabling the
plant to receive
majority of the
raw materials
by rail
Rail Yard
• The plant has
a regular
network of
roads which
are partly
metalled
• The plant
drainage
system is
partly in place
Roads and Drainage
Plant
Capacity
Description
3MTPA 0.7MTPA* 9MW 120,000 m3In-plant railway
yard
In-plant roads &
drainage
• High grade
iron ore
(58%-64%)
• Locational
Advantage
13
* Current Capacity, Approval in place to expand capacity to 1.2MTPA

2
3
5
# Name of Company LocationDistance
from Roida
Iron Ore
Lump
Prices (Per
tonne)
Iron Ore
Fines
Prices (Per
tonne)
1 MISL Roida NA 4,200 1,400
2 Rungta Mines Keonjhar 14 Km 5,800 2,750
3 Essel Mining Koira 25 Km 4,200 1,600
4 KJS Ahluwalia Nuagaon 28 Km 4,300 2,325
5 Kaypee Enterprises Thakurani 14 Km 4,200 2,325
Iron Ore Mines in Orissa near MISL – Roida Mines
Roida Mines
4
Source - Steelmint
MISL Pig Iron
Plant
MISL – Roida Mines
Other Mining Companies
MISL Pig Iron Plant
Paradip Port
Paradip Port
Geographical Location
14

Maithan Ispat Ltd. (MIL) is a subsidiary of
MISL which holds 99.60% Shares of MIL
which was acquired for INR 1,160 Cr in a
mix of debt & equity.
Specifications of the plant:
• 0.4 MTPA Integrated Steel Plant
• Spread over area covering 125 acres
• 0.2 MTPA Billets plant
• 0.4 MTPA Heavy Section Mill
• Heavy Sections are used in High-end
Infra Projects
Acquired by the Group in
March 2015
Steel – Maithan Ispat Ltd.
15
Mesco–II Steel Plant at Jajpur (Odisha)
What Maithan Produces?
The DRI (Direct
Reduced Iron) plant
produces Sponge Iron
both for internal
consumption & sales at
a capacity of 2 x 350
MT
Sponge Iron
High volume of Billets
are produced from SMS
(Steel Melting Shop) of
capacity 4 x 6 MT
Induction Furnaces &
Casting Mill (CCM)
Billets
Under the Heavy
Section Mill, large
amount of high tensile
steel beams of all sizes
is produced
PF Beams
The Captive Power
Plant is capacity of 30
MW electricity
production from Waste
Heat & Coal using
AFBC Boiler for captive
use only
Power
MIL have recently
started TMT Bar
manufacturing from
their Bar Mill and also
projecting a large
expansion along with
more product lines
Bars
Current Scenario post
acquisition
Additional installed capacity:
• 0.4MTPA Electric Arc Furnace (EAF)
under commissioning
• 0.2MTPA Rebar plant.
• Up-gradation of existing single strand
Bloom / Beam-Blank Caster a 2-strand
combi-caster for casting of billets,
blooms & beam blanks.

Steel Products – Maithan Ispat
16
SPONGE IRON
Produces Direct-reduced iron (DRI / Sponge Iron) from high quality iron ore / pellets. Secondary steel processors can use this high quality & high metallic iron content along with consistent chemical
and physical characteristics, Sponge Iron in their furnaces to produce various steel
products
STEEL BARS
Producing high quality steel bars for industrial & domestic use of various
defined sizes
HEAVY SECTION BEAMS
Supplies different size hot rolled low, medium & high tensile structural steel
BILLETS
A billet is a length of metal that has a square cross-section of different
dimensions. Billets are produced directly via continuous casting. Supplies high quality steel billets of various cross-
sections and sizes, which enables MIL to meet customer requirements and industry
specifications

17
INDUSTRY OVERVIEW

Growth In India’s Metals And Mining Sector
18
15.89
25.3424.3
26.52
20.3521.36
19.58
0
5
10
15
20
25
30
FY12 FY13 FY14 FY15 FY16 FY17 FY18
Notes: CAGR - Compound Annual Growth Rate is till FY17,
FY18 is up to November 2017.
Source: Make in India, Ministry of Mines, Aranca Research
• In FY16, India had 1,878 operative mines – excluding mining
areas for minor minerals, crude petroleum, natural gas and
atomic minerals.
• During 2011-12 to 2016-17, value of ore and mineral imports
into India witnessed a growth of 6.1%.
• Imports of Iron Ore and Minerals increased at a CAGR of
6.1% to USD 21.36 Bn in FY17 from USD 15.89 Bn in FY12.
• The import figure stood at USD 19.58 Bn during April-
November 2017.
• During April – July 2017, India’s mineral output grew by 6%
year-on-year to reach USD 11.93 Bn. The contribution of iron
ore was at USD 1.5 Bn contributing 13.02% to India’s mineral
output.
Value of Imports of Ore and Minerals in India
(USD Bn)
188213 213 219
207
167
136152
129
156
192210
0
50
100
150
200
250
FY07 FY08 FY09 FY10 FY11 FY12 FY13 FY14 FY15 FY16 FY17 FY18
Iron Ore Production & Steel Demand
19
Source: Business Standard, Ministry of Mines (Annual Report), Aranca Research
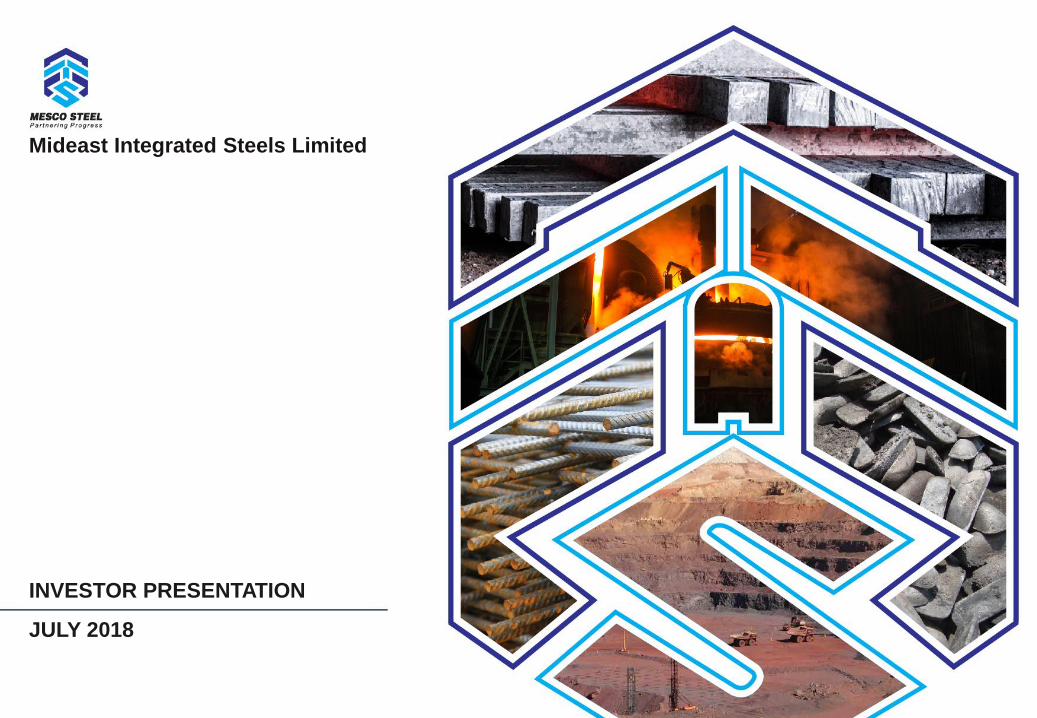
• Majority (over 85%) of iron ore reserves are of medium to high-
grade and are directly used in blast furnace and Direct
Reduced Iron (DRI) plants in the form of sized lumps or sinters
or pellets.
• During April-July 2017, India’s iron ore production stood at
64.84 Mn tonnes and in FY18 it is expected to be at 210 Mn
tonnes.
Iron ore production (Mn tonnes)
• With the Indian economy expected to grow by approximately
7% in the years to come, sectors such as infrastructure and
automobiles will receive a renewed thrust, which would further
generate demand for steel in the country.
• Crude steel production reached 97.385 million metric tonnes in
FY17, expanding at a CAGR of 6.44% over 2006–17, making it
world’s 3rd largest producer of crude steel, with a global share
of 6%.
• The Directorate General of Anti-Dumping and Allied Duties
(DGAD), an investigation arm of the commerce ministry have
imposed an anti dumping duty on steel products being
imported from China making it a favourable for the Indian steel
industry.
Crude steel production (Mn tonnes)
4953
5863
6772
7781
87 88 9097
102.9
0
20
40
60
80
100
120
Iron ore production in India
Rising Steel Demand Driving Growth
Source: Business Standard, Ministry of Mines (Annual Report), Aranca Research

Demand On Supply Of Iron And Steel
20
4953
5863
6772
7781
87
0
10
20
30
40
50
60
70
80
90
100
FY10 FY11 FY12 FY13 FY14 FY15 FY16 FY17 FY18
India’s exports of iron and steel (USD Bn)
• In FY17, India’s iron and steel exports were valued at
USD 8.7 Bn. During FY10-17, India’s exports of iron and
steel increased at a CAGR of 9.84%. The figure stood
at USD 7.4 Bn during April-November 2017.
• The new government would start stalled projects, after it
pushes large flagship projects, including the freight and
industrial corridors, to boost the demand for steel, which
is expected to grow by 15% annually after FY17.
• Government of India imposes 30% export duty on all
iron ore forms (Except the low grade iron ore) and 5%
export duty is levied on iron ore pellets.
• India has turned into a net importer of iron and steel due
to strong growth in the manufacturing sector and rising
infrastructure projects.
• India’s transition into a net importer of steel despite the
strong growth in domestic steel production shows the
demand potential of the sector.
Source: Ministry of Commerce, DGFT – Directorate General of Foreign Trade, Aranca
Research , DGCIS
8.8
11
13.7 13.6
9.1
12.311.3
8.37.1
0
2
4
6
8
10
12
14
16
FY10 FY11 FY12 FY13 FY14 FY15 FY16 FY17 FY18
India’s imports of iron and steel (USD Bn)

Favourable Policies For Sector Growth
21
• The MMDR Act of 1957, witnessed amendments in 2015 for the promotion and development of themining industry in India, that includes making auctions the sole method for the allotment of mineralconcessions and mandating the establishment of District Mineral Foundation (DMF).
The Mines and Minerals(Development
and Regulation ) Amendment Act, 2015
• FDI of up to 100% is permitted under the Automatic Route to explore and exploit all non-fuel andnon atomic minerals and process all metals as well as for metallurgy.
• FDI caps for coal and lignite has been increased to 100 per cent under the automatic route.Relaxed FDI Norms
• Government of India is encouraging private ownership for steel operations and other high priorityindustry.
Allowing private ownership
• Profits of companies producing specified metals are given tax concession under the Income Tax Act.
• Low custom duty on the capital equipment used for minerals.
• Companies who do mining in backward districts are eligible for complete tax holiday for a period of 5years from the commencement of production and 30% tax holiday for 5 years thereafter.
Investment Incentives
• Government of India significantly reduced the duty payable on finished steel products and hasstreamlined the associated approval process.
Reduced custom duty
• Focuses on upgradation of the skill sets to foster adaptation of new state of art technology.
• Aims to increase the capacity and quality of training infrastructure and trainers to address humanresource needs.
Skill Development Plan for the Mining Sector

Opportunities
22
Untapped market with strong growth potential
• The National Steel Policy aims at more than doubling the per capita steel consumption to 158 kg by 2030-31, from about 65 kg at present.
• An amount equal to USD 25 Bn to USD 33 Bn is expected to be invested in steel sector over the next 6-7 years.
Scope for new mining capacities in iron ore
• India has the world’s fourth largest base of iron ore, and accounts for about 11% of total world production.
Rapid growth of user-industries to drive demand for metals and minerals
• Strong long-term demand from the steel industry is expected to further boost the iron ore industry.
• Increasing power production is likely to catapult demand for coal.
• Booming construction, automobiles and packaging industries are expected to lend substantial support to the metals and mining sector.
Expansion of product line by existing players
• The iron and steel segment offers a product mix which includes hot rolled parallel flange beams and columns rails, plates, coils, wire rods, and continuously cast products such as billets, blooms, beams, blanks, rounds and slabs as well as metallic and ferro alloy. Looking at the expected growth in sector, existing manufacturers have a huge opportunity to expand their product line in new segments.

FINANCIAL OVERVIEW
23

Standalone Profit & Loss Statement
24
Particulars (INR Mn) FY14 FY15 FY16 FY17* FY18*
Total Revenue 8,624 5,583 5,164 2,835 6,302
Expenditure 6,352 5,687 4,430 1,990 4,754
EBITDA 2,272 (104) 734 845 1,548
EBITDA margin 26.34% (1.86)% 14.21% 29.80% 24.56%
Depreciation 475 586 608 547 565
Finance Cost 19 83 141 403 824
Other Income 72 814 133 195 141
PBT 1,850 41 118 90 300
Tax 688 31 32 (50) 67
PAT 1,162 10 86 140 233
PAT margin 13.48% 0.18% 1.66% 4.94% 3.70%
Other Comprehensive Income (net of Tax) - - - - -
Total Comprehensive income 1,162 10 86 140 233
EPS 8.43 0.07 0.62 1.02 1.69
* As per IND-As

Standalone Balance Sheet (IND-As)
25
Equity & Liabilities (INR Mn) FY17* FY18
Equity
Equity Share Capital 1,379 1,379
Other Equity
Securities premium 678 678
Retained earnings 2,704 2,937
Other reserve 1,643 1,643
Non current liabilities
Financial liabilities
Borrowings 530 399
Trade Payables 885 549
Other financial liability 5,411 5,200
Deferred tax liabilities (net) 735 737
Employee benefit obligation 53 57
Current liabilities
Trade Payables 561 1,711
Other financial liability 896 1,020
Other Payables 9 (53)
Employee benefit obligation 5 8
Total 15,489 16,265
Assets (INR Mn) FY17 FY18
Non current assets
Property, plant & equipment 8,994 8,678
Capital work-in-progress 319 141
Non current investments 1,694 1,919
Financial Assets
Security deposits 55 53
Other financial assets 1,798 2,429
Other non current assets 952 919
Current Assets
Inventories 960 1,159
Financial Assets
Trade Receivables 10 237
Cash and cash equivalents 273 222
Loans 54 369
Other Financial Assets 380 139
Total 15,489 16,265

Consolidated Profit & Loss Statement
26
Particulars (INR Mn) FY14 FY15 FY16 FY17* FY18*
Total Revenue 8,624 5,583 7,684 7,073 10,765
Expenditure 6,352 5,687 6,974 6,024 8,916
EBITDA 2,272 (104) 710 1,049 1,849
EBITDA margin 26.34% NA 9.24% 14.83% 17.18%
Depreciation 475 586 916 836 829
Finance Cost 19 83 729 1,010 1,732
Other Income 72 814 247 254 137
PBT 1,850 41 (688) (543) (575)
Tax 688 31 31 (50) 66
PAT 1,162 10 (719) (493) (641)
PAT margin 13.48% 0.18% NA NA NA
Other Comprehensive Income (net of Tax) - - (3) (173) (3)
Total Comprehensive income 1,162 10 (722) (666) (644)
EPS 8.43 0.07 (5.22) (3.58) (4.65)
* As per IND-As

Consolidated Balance Sheet (IND-As)
27
Assets (INR Mn) FY17 FY18
Non current assets
Property, plant & equipment 13,261 12,682
Capital work-in-progress 591 537
Non current investments 120 120
Financial Assets
Security deposits 92 108
Other financial assets 2,158 2,304
Other non current assets 1,033 1,210
Goodwill on consolidation 4,285 4,285
Current Assets
Inventories 1,967 2,580
Financial Assets
Trade Receivables 58 121
Cash and cash equivalents 495 694
Loans 71 537
Other Financial Assets 447 332
Total 24,578 25,510
Equity & Liabilities (INR Mn) FY17 FY18
Equity
Equity Share Capital 1,379 1,379
Other Equity
Securities premium 1,335 1,335
Retained earnings 1,336 694
Other reserve 1,643 1,643
Non controlling interest (418) (448)
Non current liabilities
Financial liabilities
Borrowings 3,817 3,873
Trade Payables 905 548
Other financial liability 5,840 5,714
Deferred tax liabilities (net) 735 737
Employee benefit obligation 60 66
Minority Interest 3,888 3,770
Current liabilities
Trade Payables 2,010 3,681
Other financial liability 2,031 2,558
Other Payables 8 (53)
Employee benefit obligation 9 13
Total 24,578 25,510

Capital Market Information
28
Price Data (As of 31st March, 2018) INR
Face Value 10
Market Price 46.55
52 Week H/L 92.0/39.20
Market Cap (INR Mn) 6,340
Equity Shares Outstanding (Mn) 137.87
1 Year Avg. Trading Volume ('000) 54.71
Shareholding Pattern (As of 31st March, 2018)
Promoters65.54%
Others34.46%

DisclaimerDisclaimer:
No representation or warranty, express or implied, is made as to, and no reliance should be placed on, the fairness, accuracy, completeness or correctness of the information or opinions
contained in this presentation. Such information and opinions are in all events not current after the date of this presentation. Certain statements made in this presentation may not be
based on historical information or facts and may be "forward looking statements" based on the currently held beliefs and assumptions of the management of Mideast Integrated Steels
Ltd., which are expressed in good faith and in their opinion reasonable, including those relating to the Company’s general business plans and strategy, its future financial condition and
growth prospects and future developments in its industry and its competitive and regulatory environment.
Forward-looking statements involve known and unknown risks, uncertainties and other factors, which may cause the actual results, financial condition, performance or achievements of
the Company or industry results to differ materially from the results, financial condition, performance or achievements expressed or implied by such forward-looking statements, including
future changes or developments in the Company’s business, its competitive environment and political, economic, legal and social conditions. Further, past performance is not necessarily
indicative of future results. Given these risks, uncertainties and other factors, viewers of this presentation are cautioned not to place undue reliance on these forward-looking statements.
The Company disclaims any obligation to update these forward-looking statements to reflect future events or developments.
This presentation is for general information purposes only, without regard to any specific objectives, financial situations or informational needs of any particular person. This presentation
does not constitute an offer or invitation to purchase or subscribe for any securities in any jurisdiction, including the United States. No part of it should form the basis of or be relied upon
in connection with any investment decision or any contract or commitment to purchase or subscribe for any securities. None of our securities may be offered or sold in the United States,
without registration under the U.S. Securities Act of 1933, as amended, or pursuant to an exemption from registration there from.
This presentation is confidential and may not be copied or disseminated, in whole or in part, and in any manner.
Valorem Advisors Disclaimer:
Valorem Advisors is an Independent Investor Relations Management Service company. This Presentation has been prepared by Valorem Advisors based on information and data which
the Company considers reliable, but Valorem Advisors and the Company makes no representation or warranty, express or implied, whatsoever, and no reliance shall be placed on, the
truth, accuracy, completeness, fairness and reasonableness of the contents of this Presentation. This Presentation may not be all inclusive and may not contain all of the information that
you may consider material. Any liability in respect of the contents of, or any omission from, this Presentation is expressly excluded. Valorem Advisors also hereby certifies that the
directors or employees of Valorem Advisors do not own any stock in personal or company capacity of the Company under review.
For further information please contact our Investor Relations Representative:
Mr. Anuj Sonpal
Valorem Advisors
Tel: 91-22-4903 9500
Email: [email protected]
29
THANK YOU
30