April, 2013 - MUFG€¦ · Underlying such circumstances are a large number of risks and ......
26
ALM April, 2013
Transcript of April, 2013 - MUFG€¦ · Underlying such circumstances are a large number of risks and ......

ALM
April, 2013

1
This document contains forward-looking statements in regard to forecasts, targets and plans of Mitsubishi UFJ Financial Group, Inc. (“MUFG”) and its group companies (collectively, “the group”). These forward-looking statements are based on information currently available to the group and are stated here on the basis of the outlook at the time that this document was produced. In addition, in producing these statements certain assumptions (premises) have been utilized. These statements and assumptions (premises) are subjective and may prove to be incorrect and may not be realized in the future. Underlying such circumstances are a large number of risks and uncertainties. Please see other disclosure and public filings made or will be made by MUFG and the other companies comprising the group, including the latest kessantanshin, financial reports, Japanese securities reports and annual reports, for additional information regarding such risks and uncertainties. The group has no obligation or intent to update any forward-looking statements contained in this document
In addition, information on companies and other entities outside the group that is recorded in this document has been obtained from publicly available information and other sources. The accuracy and appropriateness of that information has not been verified by the group and cannot be guaranteed
The financial information used in this document was prepared in accordance with accounting standards generally accepted in Japan, or Japanese GAAP

2
Contents
Business environment and B/SBusiness environment and B/SOperational environment of Japanese banksCharacteristics of BTMU’s B/SAbout ALMMarket risk management in ALM businessNII (Net Interest Income)
4
5678
ALMALMRegarding BTMU’s B/S and ALMNII curve of BTMUBusiness cycles and net gains (losses) ondebt securitiesYen ALMNet gains (losses) on debt securities/net interest incomeManaging JGB holding riskForeign currency ALM
101112
1314
1516
AppendixAppendix
Economic and monetary environment Regulatory environment and higher compliance levelStrengthen administration practices and deepen cooperationDirection of the medium-term business planExpansion co-managed offices
Environment changes and future Environment changes and future ALM/market businessALM/market business
1819
20
21
22
Global Markets Unit/ALM divisions JGB yield trendGap between deposits/lending and JGB holdings
232425

3
Business environment and B/S

4
Japanese banksJapanese banks’’ netnet gainsgains ((losseslosses) on ) on debt securitiesdebt securities and and interest incomeinterest income
Japanese banksJapanese banks’’ deposits and deposits and lendinglendingss
(Source) Japanese Bankers Association
Japanese banksJapanese banks’’ securities and securities and equitiesequities(¥bn)(¥tn)
(¥tn)
Operational environment of Japanese banks
(Source) Japanese Bankers Association
(Source) Japanese Bankers Association
Large deposit surplus continues due to growth in deposits and sluggish lendings
Business practice of strategic shareholdings
Impairment arises when share prices fall
Decrease in interest income due to declining market interest ratesAcceleration in customers’ overseas expansion
194
18
278257231
181921
0
50
100
150
200
250
300
End Mar 09 End Mar 10 End Mar 11 End Mar 12
Investment SecuritiesEquities
615576616603588
465 458446449 459
0
100
200
300
400
500
600
700
End Mar 09 End Mar 10 End Mar 11 End Mar 12 End Sep 12
Deposits Lendings
8,703.7
(558.6)
826.3747.5289.4
8,156.98,349.48,689.3
(2,000)
0
2,000
4,000
6,000
8,000
10,000
FY08 FY09 FY10 FY11
Net gains (losses) on debt securities
Interest income

5
Securities¥61 tn
Loans¥69 tn
Others¥28 tn
Deposits¥107 tn
Others¥44 tn
Net assets ¥7 tn
Domestic business International business
Loans¥49 tn
Securities¥48 tn
Deposits¥91 tn
Others¥13 tn
Others¥16 tn
Loans¥16 tn
Deposits¥13 tn
Others¥6 tn
Others¥17 tn
Source and use of fundsSource and use of funds**
B/S B/S ((Sum of domestic and international businessSum of domestic and international business))
Securites¥12 tn
CDs¥6 tn
End Sep 12: ¥159 tnEnd Mar 09 :¥148 tn
Securities¥38 tn
Loans¥73 tn
Others¥36 tn
Deposits¥100 tn
Others¥43 tn
Net assets ¥5 tn
Large deposit surplusIncrease in yen deposits and sluggish lending have seen large deposit surplus continuously expand
Strategic equity holdingsDespite progressive reduction of cross-shareholdings, strategic equity holdings are more than ¥2 tn. As a result, impairment risk persists when share prices fall
Expansion of foreign currency B/SSupport Japanese customers advance overseas
Aim to expand transactions with Japanese and non-Japanese customers under the medium-term business plan
Resulting in an increasing trend of our foreign currency B/S, led by the asset side
Characteristics of BTMU’s B/S (BTMU non-consolidated)
* FY12 H1 average balance
6
ALM divisions
Customer
Customer-facing divisions
Market
Deposits/Lending, etc.
Concentrate interest risk in the ALM divisions via
the TP
Manage interest risk and liquidity risk through
market transactions
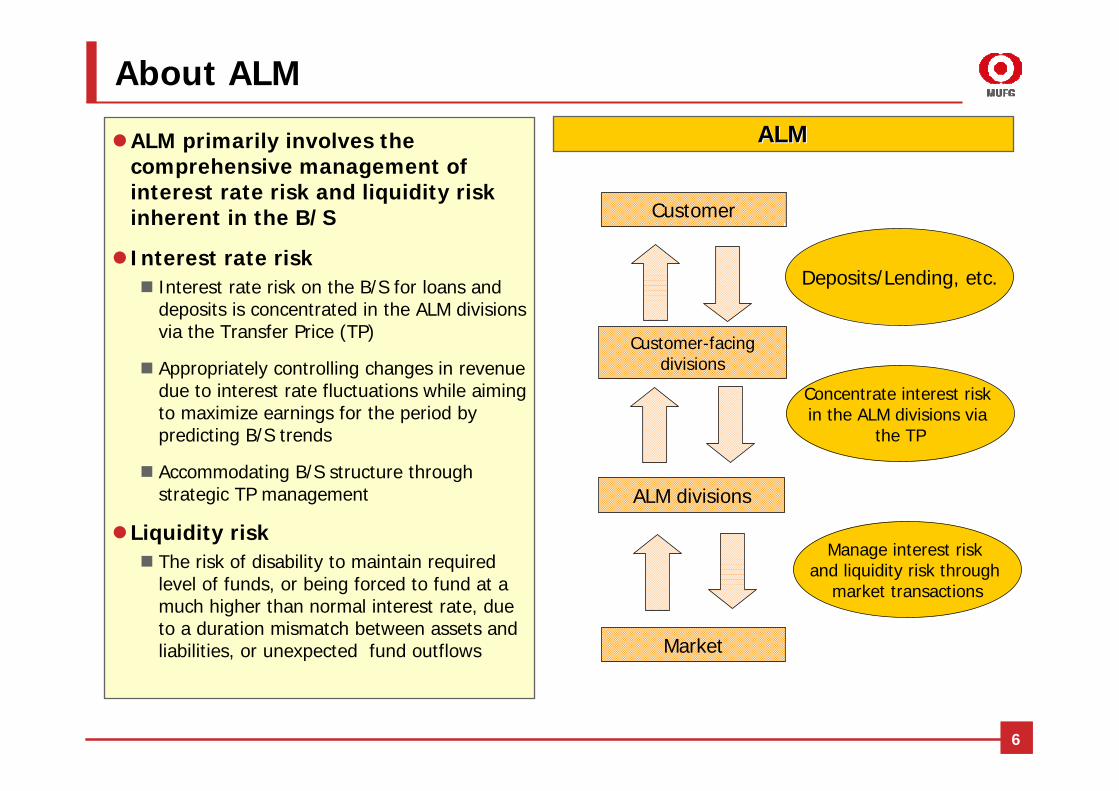
About ALM
ALM primarily involves the comprehensive management of interest rate risk and liquidity risk inherent in the B/S
Interest rate riskInterest rate risk on the B/S for loans and deposits is concentrated in the ALM divisions via the Transfer Price (TP)
Appropriately controlling changes in revenue due to interest rate fluctuations while aiming to maximize earnings for the period by predicting B/S trends
Accommodating B/S structure through strategic TP management
Liquidity riskThe risk of disability to maintain required level of funds, or being forced to fund at a much higher than normal interest rate, due to a duration mismatch between assets and liabilities, or unexpected fund outflows
ALMALM

7
Overall gains/lossesOverall gains/losses
Market risk management frameworkMarket risk management framework
Board of Directors
Executive Comm
ittee
ALM Committee
Risk management divisions
Global Markets Unit
ALM divisions
Trading divisions
Market risk management in ALM business
Market risk management frameworkMarket riskThe Executive Committee assign to the Global Markets Unit the amount of market risk (VaR+Val) calculated from allocated economic capital and profit plan. Within the Global Markets Unit, the amount is allocated to operations and branches
Loss limit Managed on the basis of overall gains/losses (financial income + unrealized gains/losses) with soft limits, alarm points and triggers for consultation, based on stress tests
Both calculated daily and reported to management
Market risk management governanceALM Committee under the Executive Committee meets monthly for in-depth discussion with management
The Global Markets Unit and risk management divisions discuss the market risk situation on a weekly basis
Profitability of ALM can be measured through net gains (losses) on debt securities, etc. and unrealized gains/losses
Decrease or increase in deferred gains/losses
Decrease or increase in unrealized gains/losses
Unrealized gains/losses
Net interest rate swaps income
Interest rate swaps
Net gains (losses) on debt securities
Interest and dividend on securities
(Excl. equities related)
Financial income
Securities

8
NII(Net Interest Income)
NII curveA NII curve is a plot of changes in net interest income caused by fluctuations ofinterest rates over a fixed period (one year, two years, etc.)
Periodically calculated and monitored, aim to create a B/S with high revenue generation, increase resilience to interest rate fluctuation (monitored by ALM committee)
How we consider the NII curveWhen analyzing the NII curve its level and shape (sensitivity to interest rates) are important
It’s shape (sensitivity) changes based on how interest rate risk is taken
Asset sensitive: NII up if interest rate rise Liability sensitive: NII up if interest rate
decline
NII curveNII curve(¥)
(bps)±0-50 +50
NIINII curve variation examplescurve variation examples
Decrease in loans, smaller loan spreads
Increase in loans, widening of loan spreads
FlatteningDownIncrease in long-term funding
ParallelDown
Flattening
Parallel
Shape
Up
Up
Level
Increase in long-term assets
Example
NII level The NII level and curve’s
shape (sensitivity) are key
Interest rate change from current level
NII level
NII level
Asset sensitive Liability sensitive
Interest rate change from current level
Interest rate change from current level

9
ALM

10
Net gains (losses) on debt securitiesNet gains (losses) on debt securities//Net interest incomeNet interest income
Debt securities investments balanceDebt securities investments balance
Regarding BTMU’s B/S and ALM
Yen ALMB/S management under large deposit surplus (decrease in lending, increase in securities investments)
Management of strategic equity holdings
Handling of JGB holding risk
Foreign currency ALMStrengthening and diversification of foreign currency funding
Sophisticate buffer asset management
ProfitsNet gains (losses) on debt securities
Net interest income
(BTMU non-consolidated)
(¥bn)
(¥tn)
64.4252.6 249.0206.4
67.0
567.1
1,203.81,308.11,342.8 1,247.6
0
500
1,000
1,500
2,000
FY08 FY09 FY10 FY11 FY12 H1
Net gains (losses) on debt securitiesNet interest income
20
39 43 45 437
58
11 10
0
10
20
30
40
50
60
End Mar 09 End Mar 10 End Mar 11 End Mar 12 End Sep 120%
10%
20%
30%
40%
50%
Domestic bonds Foreign bondsShare of B/S

11
(bps)
NII curve of BTMU (example)NII curve of BTMU (example)
±0-50 +50
ALM divisions’ NII
Total NII
Customer-facing Units’ NII
NII curve of BTMU
NII curve of BTMUBTMU’s NII curve slopes upward showing net interest income will increase if interest rates rise
If NII is divided between ALM divisions (Global Markets Unit) and customer-facing units (Retail, Corporate, Global) it will be:ALM divisions: graph falls to the right Customer-facing units: graph falls to the left
The shape of NII curves of customer-facing units is due to the liability side's (mostly deposits) responsiveness to interest rate changes, being lower than the asset side's (lending, securities, etc.)
As the NII curve slopes fall to the left, interest income will decline if interest rate decline
To mitigate the decline in net interest income due to falling deposits and lending interest rates, the ALM divisions hold interest rate-type products (bonds, interest swaps)
(¥)
NII level
Interest rate change from current level
12
Stock prices and Interest ratesStock prices and Interest rates
Net gains (losses) on debt securitiesNet gains (losses) on debt securities and and credit costs/losses on writecredit costs/losses on write--down of equity securitiesdown of equity securities
(¥) (%)
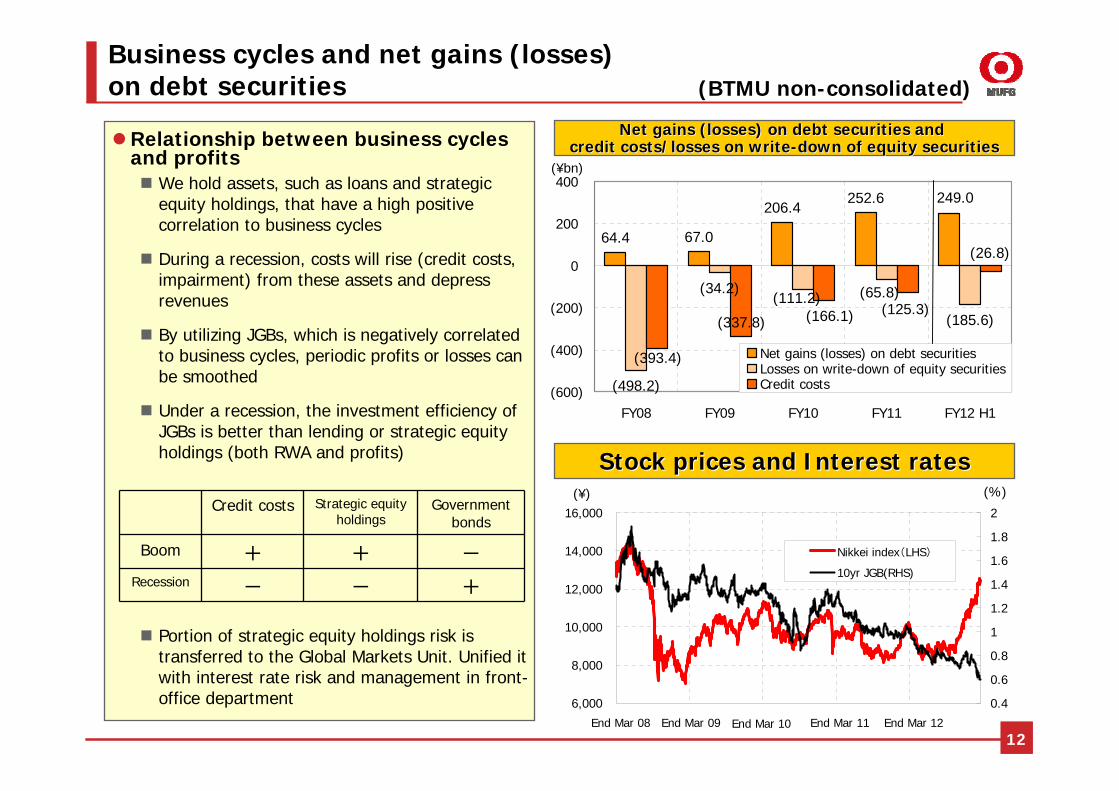
Business cycles and net gains (losses) on debt securities (BTMU non-consolidated)
Relationship between business cycles and profits
We hold assets, such as loans and strategic equity holdings, that have a high positive correlation to business cycles
During a recession, costs will rise (credit costs, impairment) from these assets and depress revenues
By utilizing JGBs, which is negatively correlated to business cycles, periodic profits or losses can be smoothed
Under a recession, the investment efficiency of JGBs is better than lending or strategic equity holdings (both RWA and profits)
Portion of strategic equity holdings risk is transferred to the Global Markets Unit. Unified it with interest rate risk and management in front-office department
Credit costs Strategic equity holdings
Government bonds
Boom + + -
Recession - - +
(¥bn)
6,000
8,000
10,000
12,000
14,000
16,000
H20.4.1 H21.4.1 H22.4.1 H23.4.1 H24.4.10.4
0.6
0.8
1
1.2
1.4
1.6
1.8
2
Nikkei index(LHS)
10yr JGB(RHS)
End Mar 11End Mar 09End Mar 08 End Mar 10 End Mar 12
64.4
252.6
(498.2)
(185.6)
67.0
206.4249.0
(34.2) (65.8)(111.2)
(337.8) (166.1) (125.3)
(26.8)
(393.4)
(600)
(400)
(200)
0
200
400
FY08 FY09 FY10 FY11 FY12 H1
Net gains (losses) on debt securitiesLosses on write-down of equity securitiesCredit costs

13
3946 48 48
3229
41 42
3427
0
10
20
30
40
50
60
FY08 FY09 FY10 FY11 FY12 H1
Excess deposits
Securities investments
NNet notional principal of interest rate swapset notional principal of interest rate swaps
Average balance of domestic excess Average balance of domestic excess deposits and securities investments deposits and securities investments
Yen ALM
Effects of holding securities such as JGBs in yen ALM
Perspective of NII: Stabilizing NII fluctuation risk (graph falls to the left sharply) stemming from deposits and loans on B/S
Perspective of market value accounting: Taking into account the negative correlation with business cycles can be used for risk control/hedging of strategic equity holdings, etc.
JGBs, corporate bonds (BOJ eligible collateral). To allow flexible response in our portfolio management, these are held in ‘other securities’
The source of funds for yen securities investment is deposits; after assessment of interest rate sensitivity and retention, part is designated as core deposits (in principle, leveraged investment is not implemented)
Securities held are also applied to BOJ collateral, etc. as part of normal fund operations management (Considering use for non-CCP margin requirements in future)
Comprehensively taking into account the scale of our deposit surplus and interest rate spread, securities and interest swaps are chosen to invest
(BTMU non-consolidated)(¥tn)
(¥tn) (BTMU consolidated)
10
00
25
2
0
10
20
30
End Mar 09 End Mar 10 End Mar 11 End Mar 12 End Sep 12

14
(%)
(year)
Roll down effect
Yields decline as redemption period shortens
(%)
Net gains (losses) on debt securities/net interest income (BTMU non-consolidated)
Based on the current NII curve ofBTMU, net interest income will decline, in case of continuous interest rate decline
Declining interest rate have a significant impact on not only customer-facing divisions but also Global Markets Unit
・Redemption of high-coupon bonds will be substituted by new low-couponbonds
ALM divisions try to strengthen deposits and lending with TP management in order to improve net interest income
Unrealized net gains (losses) improved, resulting from global monetary easing
Looking ahead, bond investment gains can be expected from:
Roll down effect
Trading gains from portfolio changes
Roll down effectRoll down effect
Yields
Period
Net interest income and JGB yieldNet interest income and JGB yield(¥bn)
567.11,203.81,247.61,308.11,342.8
0
500
1,000
1,500
FY08 FY09 FY10 FY11 FY12 H10.00
0.25
0.50
0.75
1.00
1.25
1.50
1.75Net interest income 10yr JGB

15
Early warnings Early warnings ((examples of fixedexamples of fixed--point checkspoint checks))
Liquidity risk
JGB market trends
Impact on capital of interest rate increases
JGB risk analysis(Rating trends, etc.)
Fiscal-related indices(Government debt, interest payment/tax revenue ratio, etc.)
Market trends(JGBs, CDS, effective exchange rates, financial institution shares, etc.)
BTMU’s JGB market share
Money flows(B/S structure of banks, holders ratio of JGBs, etc.)
BTMU’s B/S composition
Macro economic indices(International balance of payment, core inflation ratio etc.)
Risk management divisions
Front-office divisions
Managing JGB holding risk
Risk analysis and early warningsFormulate scenarios in which JGB holding risk materializes, and conduct profit/loss simulations
Prepare for risk, both front-office and risk management divisions undertake checks at various fixed points and report to the ALM Committee
Aim to minimize impact when risk arises by strengthening early warnings management through broad-based preparation
In the event risk materializesA price fall in JGBs causes an increase in appraisal losses. Appraisal losses damage equity capital
However, future net interest income will improve
Because we generally do not leverage, as long as deposits do not flow out severely there is no need to rapidly shrink portfolio
Duration around 3 years; portfolio expected to recover in a comparatively short period

16
Buffer asset managementBuffer asset management
Average balance of loans (international Average balance of loans (international business) business) and and foreign foreign securities investments securities investments
Market
Customer
BTMU
If market financing through Yen/U.S. dollar currency swaps, etc. becomes difficult (when liquidity is low, etc.) source funds through buffer asset holdings and continue customer transactions (lending)
Continue trans-actions (lending) Funding
Repo/Sell
Foreign currency ALM (BTMU non-consolidated)
Strengthen and diversify foreign currency sourcing to support increased assets resulting from increased overseas lending. Utilizing ample yen liquidity is key
Increase foreign currency deposits
Source funds using ample Yen assets (JGBs, etc.)
Issue foreign currency straight bonds
Improving our buffer asset management, such as foreign bonds investments, to prepare for difficulties in market financing
Mostly U.S. government bonds and U.S. higher-rated mortgage bonds with (eligible collateral with each countries’ central bank)
In 2012, to supplement foreign currency liquidity we established a special-purpose subsidiary, BTMU Liquidity Reserve Investment Limited(upgraded buffer asset management)
Main overseas offices also invest in foreign securities as buffer asset (Americas, Europe, Asia)
(¥tn)
13
9
161514 14
1012
7 8
0
4
8
12
16
20
FY08 FY09 FY10 FY11 FY12 H1
Loans Investment securities

17
Environment changes and future ALM/market business

1818
Economic and monetary environment
Japan: Effects of AbenomicsU.S.: Despite fiscal problems, economy is firmEU: Remains fragile as fiscal problems persistAsia
China’s economy decelerating, effects of worsening Japan-China relationsContinuing growth in ASEAN regionRegional geopolitical risk from North Korea, etc.
Changes in environment (Circumstances)Changes in environment (Circumstances)
Status of BTMU (Company)Status of BTMU (Company)
Market and investors (Competitors)Market and investors (Competitors)
Western banks’ competitiveness recovering, rise of regional banksStrengthening of regulations, higher required compliance levelRecovery of investors’ risk appetite
Decline in net interest incomeSigns of domestic lending bottoming outExpansion of foreign currency B/S
Sales & TradingSales & Trading
ALMALM
Management with consideration for domestic/overseas risk
More prudence in ALM amid continuing ultra-low interest rates, long-term interest rate reversal risk Employ flexible ALM while making consideration for various sources of risk
Diversification of Japanese customers’commercial flowsGrowing business with non-Japanese customersExpansion of emerging economies’businessesIncrease in market volatility

19
Major scheduled regulationMajor scheduled regulation
○
○
○
△
△
△
△
△
△
○
△
△
○
○
Impacton market business
Macro
Intermediate Holding Company (IHC)
Pay regulations
Risk Data Aggregation & Reporting
Single Counterparty Credit Limit
Shadow Banking
Financial Transaction Tax
Benchmark interest rate reform
Transaction report archiving requirement, CCP requirement,Electronic transaction base
Recovery and resolutions plans (RRP)
Vickers/Liikanen
Volcker Rule
Non-CCP margin requirements
Basel 3
Push Out
TransactionsM
icro
Regulation
Regulatory environment and higher compliance level
Regulatory trendsNo change in trend to strengthen global regulations
Continued regulatory strengthening and more sophisticated risk management at various levels
Difficult to conjecture about effects as numerous undecided elements remain, but the full financial impact is expected several years hence
Taking capital and liquidity into account, the Japanese banks position will improve relatively
Higher compliance levelLibor impropriety and AML issues arising
Large fines, etc. would a large effect on finances
Review customary market practices, reform Libor, etc.
As G-SIFIs we must aim for the highest standards of compliance
Need for continuous strengthening of internal controls

20
Strengthen administration practices
Sophisticate internal controls
Correspond to regulations
Deepen cooperationCooperation between businessesEstablished Integrated Global Markets Business Group with the aim of strengthening sales and trading business through unified management of BTMU and MUSHD markets business (July 12)
Cooperation between unitsDeepen cooperation with other units in order to maximize added value from every point of view, not only within Global Markets Unit
Cooperation between regionsRespond to the globalization of customers’distribution channels, it is essential to strengthen the structure for cooperation between regions Implementing organizational change to add a global matrix to the existing regional matrix
Strengthen administration practices and deepen cooperation

21
Direction of the medium-term business plan
Global Markets Unit gross profitsGlobal Markets Unit gross profitsAs ALM divisions' revenues decline if interest rates rise, it is necessary to establish a revenue base that is not influenced by interest rate trends
Aim to strengthen the sales and trading business based on customer transactions under the medium-term business plan. Plan to shift earnings structure
Responding globally to customers’interest rate risk hedge needs associated with their fund sourcing and forex hedge needs arising from money flows
Provide advise as market professionals to increase added value
(¥bn)
Sales & Trading business gross profitsSales & Trading business gross profits(¥bn)
(BTMU consolidated)
(Note) Sum of customer-facing divisions and Global Markets Unit Exchange rates: Those adopted in our new business plan ($/¥=83, etc)
0
50
100
150
200
250
300
FY10 FY11 FY12 FY13 FY14
Sales Trading Plan
472.6
577.0551.6
370.0
0
100
200
300
400
500
600
700
FY09 FY10 FY11 FY12 H1

22
Global Markets Division for the ASEAN Region Bangkok branchBangkok branchBangkok branch
Mumbai branchMumbai branchMumbai branch BTMU (China)BTMU (China)BTMU (China)
Sydney branchSydney branchSydney branch
Jakarta branchJakarta branchJakarta branch
BTMU (Malaysia)BTMU (Malaysia)BTMU (Malaysia)
Expansion co-managed offices
CoCo--managed offices managed offices Expansion of offices co-managed with Global Business Unit
In response to customers’ diverse needs, market related business at some overseas offices is being jointly managed by the Global Business Unit and the Global Markets Business Unit
Through joint management, increase in the level of business standards expected not only in sales and trading business, but also in ALM. Backed by Global Markets Unit‘s market business know-how
Currently 6 offices under joint management
Operations at offices and markets’ growth will be considered comprehensively and expansion of co-managed offices examined. Also, promote strengthened internal control framework
Global Markets Division for the East Asia Region

23
Appendix: Global Markets Unit/ALM divisions
Retail Banking Business Unit
Corporate Banking Business Unit
Global Business Unit
Global Markets Unit
Corporate Services
Corporate Center
Shareholders Meeting
Board of Directors
Executive Comm
ittee
Global M
arkets Unit
ALM divisionsALM divisionsGlobal Markets UnitGlobal Markets Unit
Global Markets Planning Division
Global Markets Operations Division
Treasury and Investment Division
International Treasury and Investment Division
Strategic Investment Division
Global Markets Trading Division
Global Markets Marketing Division
Global Markets Division for the Americas
Global Markets Division for EMEA
Global Markets Division for the ASEAN Region
Global Markets Division for the East Asia Region
Global Markets Solution Office
Emerging Markets Trading Office
Securities Business Office
Japanese Customer Marketing Office
Global Customer Marketing Office
Global Markets Compliance & Regulatory
Affairs Office

24
0
0.25
0.5
0.75
1
1.25
1.5
1.75
2
10yr JGB
(%)
Appendix: JGB yield trend
End Mar 13End Mar 11End Mar 09End Mar 07End Mar 05End Mar 03End Mar 01

25
0
30
60
90
End Mar 00
End Mar 03
End Mar 06
End Mar 09
End Mar 12
Securities
Deposits/lending gap (deposits-lending)
Appendix: Gap between deposits/lending and JGB holdings
Regional banksRegional banksCity banksCity banks
(¥tn)(¥tn)
(Source) Japanese Bankers Association(Source) Japanese Bankers Association
(30)
0
30
60
90
120
150
180
End Mar 00
End Mar 03
End Mar 06
End Mar 09
End Mar 12
Securities
Deposits/lending gap (deposits-lending)