April, 2008 Utah Indicators: Aging & Work
18
State Profile: Utah Utah Indicators: Aging & Work State Profile Series April, 2008 State Perspectives By: Michelle Wong with Tay McNamara, Sandee Shulkin, Chelsea Lettieri and Vanessa Careiro Quick Fact Check for Utah Median age of the population y 28.4 years % population 55+ y 16.7% Median age of the workforce y 36.2 years % of population ages 55-64 employed y 64.7% % workforce ages 55-64 self employed y 13.7% Unemployment Rate of ages 55 – 64 y 2.8% Economic activity by industry sector y 11.2% of GDP is Manufacturing Industry sectors with high percentages of workers y 50-59 years old Educational services: 28.2% Public administration: 26.9% Food manufacturing: 25.8% Occupational groups with high percentages of y workers 50-59 years old Education, training & library: 28.9% Business & financial operations: 25.1% Management: 21.8% Educational levels achieved by residents 55 years y or older 28.1% bachelors degree or higher Sponsored by:
Transcript of April, 2008 Utah Indicators: Aging & Work

1
State Profile: U
tah
Utah Indicators: Aging & Work
State ProfileSeries
April, 2008
State Perspectives
By: Michelle Wong with Tay McNamara, Sandee Shulkin, Chelsea Lettieri and Vanessa Careiro
Quick Fact Check for Utah
Median age of the population y 28.4 years
% population 55+ y 16.7%
Median age of the workforce y 36.2 years
% of population ages 55-64 employed y 64.7%
% workforce ages 55-64 self employed y 13.7%
Unemployment Rate of ages 55 – 64 y 2.8%
Economic activity by industry sector y 11.2% of GDP is Manufacturing
Industry sectors with high percentages of workers y50-59 years old
Educational services: 28.2%
Public administration: 26.9%
Food manufacturing: 25.8%
Occupational groups with high percentages of yworkers 50-59 years old
Education, training & library: 28.9%
Business & financial operations: 25.1%
Management: 21.8%
Educational levels achieved by residents 55 years yor older
28.1% bachelors degree or higher
Sponsored by:
2
State Profile: U
tah
TaBLe oF CoNTeNTS
State Profiles overview Page 3
Section 1: age Demographics of the Population Page 3
Introduction
Population Changes: Distribution by Age 2000-2006
Anticipated Population Changes: Distribution by Age 2006-2010
Section 2: Labor Force Participation Demographics and age Page 6
Introduction
Labor Force Participation: Distribution by Age
Labor Force Participation in the Public Sector, Private Sector, and Self-Employed by Age
Unemployment Rates by Age
Section 3: Industry Sector and occupational Groups Page 11
Introduction
Economic Output
Employment by Industry Sectors
Employment by Occupational Groups
Section 4: education & Workforce Preparedness Page 14
Introduction
Educational Attainment by Age
Section 5: Legislative Readiness Page 15
Introduction
Current Legislation
Legislative Committees
Table of Figures: appendix a Page 18

3
State Profile: U
tah
Figure 1: Population by age (2006)
Section 1: age Demographics of the Population
Introduction
Age is one factor that helps us to predict and understand different types of life experiences. Some of these relationships are obvious. For instance, entry into the workforce typically occurs between the ages of 18 and 25. There are also connections between age and people’s assessment of different aspects of their lives, such as life satisfaction. Information about age can provide insights into some of the interests and supports needed by people. For example, states with large percentages of people between the ages of 25-34 are likely to find differences in the demands for specific types of services than those states with high percentages of people over the age of 75 years.
The median age in Utah, 28.4, is lower than the median age of the nation, 36.4.
Questions you might want to consider:
How does the age distribution of the population in our state compare to all of the states in the country?
Have businesses and education/health/social service providers in the state customized their marketing and outreach and delivery of products and services to the different age groups?
State Profiles overview
Changes in the age composition of the population – and of the labor force – have emerged as one of the defining social, economic and public policy issues of the 21st century. State leaders across the country are grappling with the implications of these shifts. As they move from awareness-to-action, they need access to information.
The State Perspectives Institute at the Boston College Center on Aging & Work has developed State Profiles to provide thoughtful leaders with information needed for planning decisions.
The State Profiles include information about the age demographics of the population, age demographics of the labor force, industry sectors and occupational groups, education and workforce preparedness, and legislative readiness.
Source: American Community Survey, 2006
< 25 25-34 35-44 45-54 55-64 65-74 75+
Utah United States
0.0%
10.0%
20.0%
30.0%
40.0%
50.0%43.5
34.6
16.013.3
12.214.7
11.514.5
7.910.6
4.66.3
4.26.1

4
State Profile: U
tah
Less than one in every five people residing in Utah (16.7% of Utah’s population) is aged 55 or older.
Figure 2: % of Population aged 55+ by State
Population Changes: Distribution by age 2000-2006
Importance of this Information:
Unique leadership opportunities can arise when there are shifts in trends, such as changes in the age demographics of the population. These changes may prompt leaders to pause, step-back, and think about the past, the present, and the future.
Times of change can also be opportune moments for state leaders in the government, business, and non-profit sectors to assess the state’s capacity to leverage the changes into competitive advantages.
observation about Recent Changes in the age Distribution of Utah’s Population:
From 2000-2006, the changes in the age distribution of Utah’s population aged 35 and older reflected national trends. That is, in Utah, there was a decrease in the percentage of the population between the ages of 35-44 and an increase in the 45-64 age groups. In addition, the Utah population 75 and older aged at the same rate as the nation as a whole.
Questions you might want to consider:
Did leaders in our state anticipate the changes which have occurred recently in the age demographics of our population?
As appropriate, did leaders from the government, business, and non-profit sectors engage in collaborative dialogue about the potential impact of these changes?
Were the responses of the state to the changes in the age demographics effective?
25% +
23 - 24.9%
21 - 22.9%
< 21%
Key:
DC
Source: American Community Survey, 2006

5
State Profile: U
tah
Figure 3: Percentage Point Changes in Population age Groups 2000-2006 in Utah and the United States
-3.0%-2.5%-2.0%-1.5%-1.0%-0.5%0.0%0.5%1.0%1.5%2.0%
< 25
-2.9
-0.8
1.4
-0.9-1.2
-1.4
1.10.9
1.51.9
-0.2
0.1 0.2 0.2
25-34 35-44 45-54 55-64 65-74 75+
Utah
% P
oint
s Ch
ange
in A
ge G
roup
s
United States
Source: American Community Survey, 2006 and Census, 2000
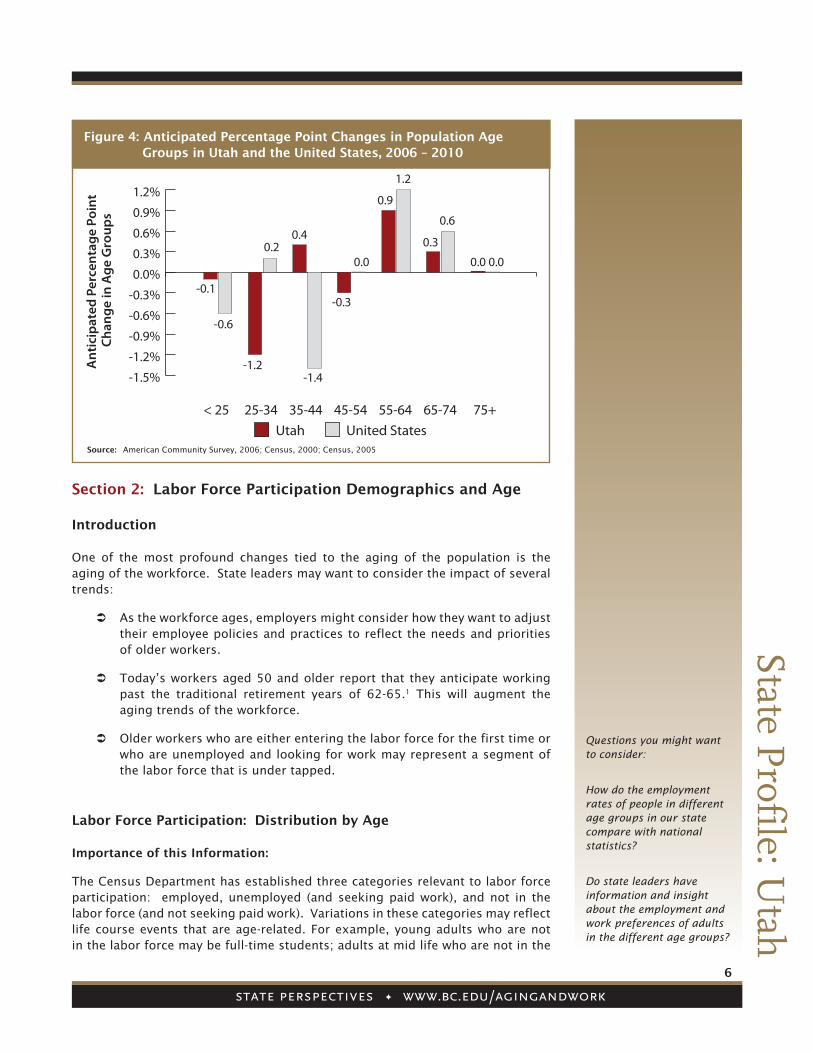
anticipated Population Changes: Distribution by age 2006 – 2010
Importance of this Information:
Forecasts about the future can help states to enhance their readiness for anticipated changes.
Businesses can take steps so that they can effectively recruit, engage, and Âretain workforces from the different age groups.
Non-profit organizations can take steps to develop the programs and Âresources often needed by people in the different age groups.
Government agencies can consider strategic policy adjustments to better Âreflect the needs of residents of different ages.
observation about the anticipated Changes in the age Distribution of Utah’s Population:
Compared to national statistics, Utah is expected to witness more significant decreases in two population groups: those between the ages of 25-34 and 45-54. In addition, the Utah population will age slower than the country as a whole. That is, there will be a smaller percentage point change in the 55-74 year old age groups between 2006 and 2010.
Questions you might want to consider:
What implications might the aging of the populations have for government, business, and non-profit sectors?
Are there new opportunities for leveraging the assets that people of different ages might be able to contribute to the health and welfare of the state?
Are there opportunities for new pilots that either focus on population groups that are increasing in size as well as those that are decreasing in size?
6
State Profile: U
tah
Figure 4: anticipated Percentage Point Changes in Population age Groups in Utah and the United States, 2006 – 2010
Source: American Community Survey, 2006; Census, 2000; Census, 2005
Questions you might want to consider:
How do the employment rates of people in different age groups in our state compare with national statistics?
Do state leaders have information and insight about the employment and work preferences of adults in the different age groups?
-1.5%
-1.2%
-0.9%
-0.6%
-0.3%
0.0%
0.3%
0.6%
0.9%
1.2%
< 25
-0.6
-0.1
0.2
-1.2-1.4
0.4
-0.3
0.0 0.00.0
25-34 35-44 45-54 55-64 65-74 75+Utah
Ant
icip
ated
Per
cent
age
Poin
t Ch
ange
in A
ge G
roup
s
United States
1.2
0.9
0.6
0.3
Section 2: Labor Force Participation Demographics and age
Introduction
One of the most profound changes tied to the aging of the population is the aging of the workforce. State leaders may want to consider the impact of several trends:
As the workforce ages, employers might consider how they want to adjust Âtheir employee policies and practices to reflect the needs and priorities of older workers.
Today’s workers aged 50 and older report that they anticipate working Âpast the traditional retirement years of 62-65.1 This will augment the aging trends of the workforce.
Older workers who are either entering the labor force for the first time or Âwho are unemployed and looking for work may represent a segment of the labor force that is under tapped.
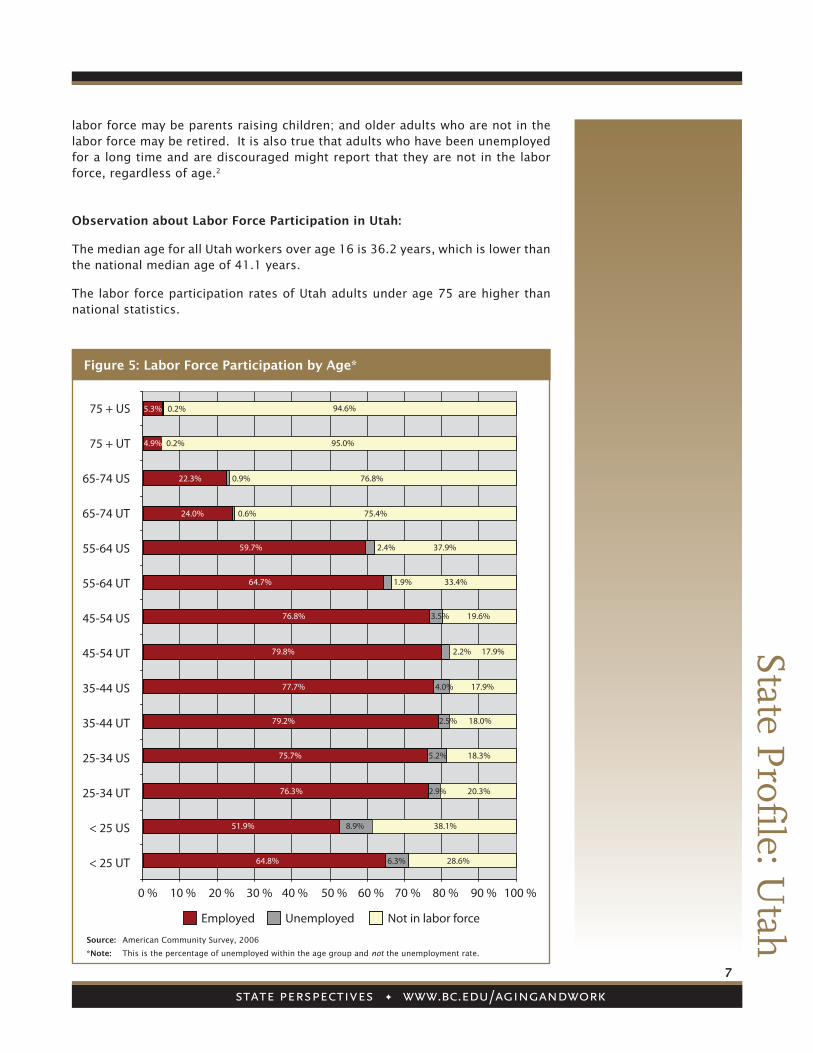
Labor Force Participation: Distribution by age
Importance of this Information:
The Census Department has established three categories relevant to labor force participation: employed, unemployed (and seeking paid work), and not in the labor force (and not seeking paid work). Variations in these categories may reflect life course events that are age-related. For example, young adults who are not in the labor force may be full-time students; adults at mid life who are not in the
7
State Profile: U
tah
labor force may be parents raising children; and older adults who are not in the labor force may be retired. It is also true that adults who have been unemployed for a long time and are discouraged might report that they are not in the labor force, regardless of age.2
observation about Labor Force Participation in Utah:
The median age for all Utah workers over age 16 is 36.2 years, which is lower than the national median age of 41.1 years.
The labor force participation rates of Utah adults under age 75 are higher than national statistics.
Figure 5: Labor Force Participation by age*
Source: American Community Survey, 2006
*Note: This is the percentage of unemployed within the age group and not the unemployment rate.
75 + US
75 + UT
65-74 US
55-64 US
45-54 US
35-44 US
35-44 UT
25-34 US
25-34 UT
< 25 US
< 25 UT
0 % 10 %
Employed
20 % 30 % 40 % 50 % 60 % 70 % 80 % 90 % 100 %
45-54 UT
55-64 UT
65-74 UT
Unemployed Not in labor force
0.2%
0.2%
5.3%
22.3%
24.0%
59.7% 2.4% 37.9%
33.4%1.9%64.7%
76.8% 3.5% 19.6%
17.9%2.2%79.8%
4.0%77.7%
79.2% 2.5% 18.0%
18.3%5.2%75.7%
76.3%
51.9% 8.9% 38.1%
28.6%6.3%64.8%
2.9% 20.3%
17.9%
0.6% 75.4%
0.9% 76.8%
94.6%
4.9% 95.0%
8
State Profile: U
tah
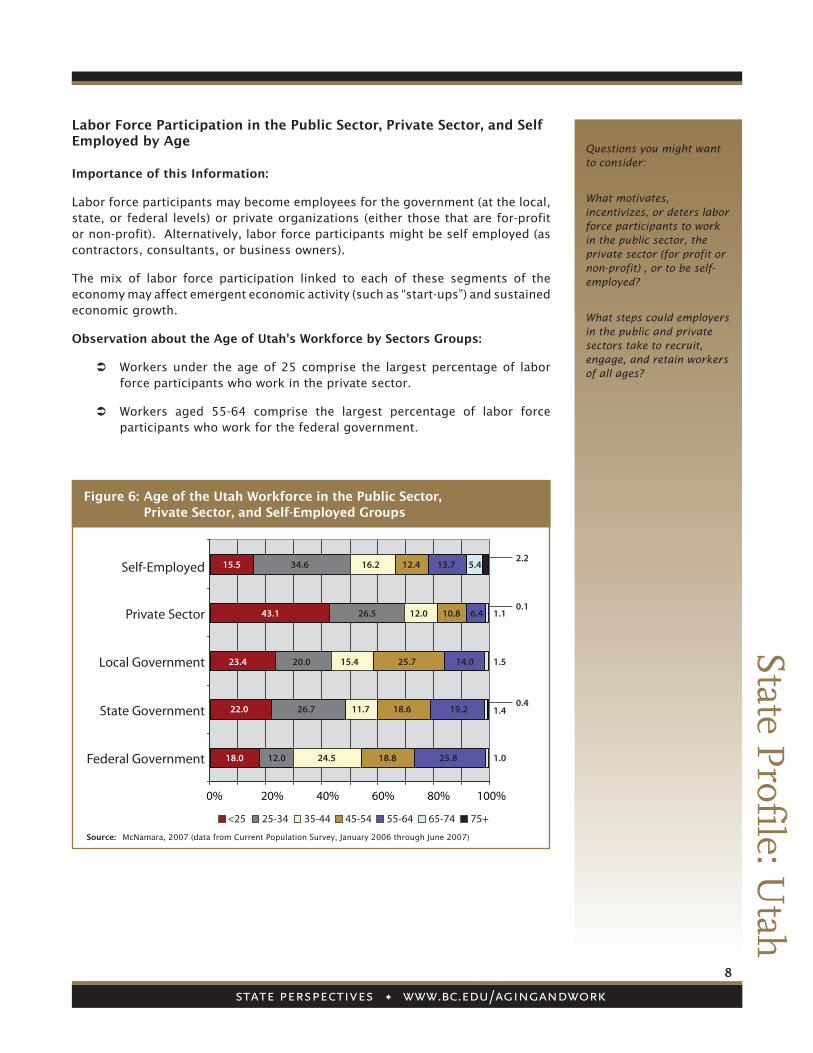
Labor Force Participation in the Public Sector, Private Sector, and Self employed by age
Importance of this Information:
Labor force participants may become employees for the government (at the local, state, or federal levels) or private organizations (either those that are for-profit or non-profit). Alternatively, labor force participants might be self employed (as contractors, consultants, or business owners).
The mix of labor force participation linked to each of these segments of the economy may affect emergent economic activity (such as “start-ups”) and sustained economic growth.
observation about the age of Utah’s Workforce by Sectors Groups:
Workers under the age of 25 comprise the largest percentage of labor Âforce participants who work in the private sector.
Workers aged 55-64 comprise the largest percentage of labor force Âparticipants who work for the federal government.
Questions you might want to consider:
What motivates, incentivizes, or deters labor force participants to work in the public sector, the private sector (for profit or non-profit) , or to be self-employed?
What steps could employers in the public and private sectors take to recruit, engage, and retain workers of all ages?
Figure 6: age of the Utah Workforce in the Public Sector, Private Sector, and Self-employed Groups
Source: McNamara, 2007 (data from Current Population Survey, January 2006 through June 2007)
Self-Employed
Private Sector
Local Government
State Government
Federal Government
<25
15.5
43.1
23.4
26.722.0 18.611.7 19.2 1.4
20.0 15.4 25.7 14.0 1.5
26.5 12.0 10.8 6.4 1.1
34.6 16.2 12.4 13.7 5.4
18.0 12.0 24.5 18.8 25.8 1.0
25-34 35-44 45-54 55-64 65-74 75+
0% 20% 40% 60% 80% 100%
2.2
0.1
0.4

9
State Profile: U
tah
Unemployment Rates by age
Importance of this Information:
High rates of unemployment create personal hardship and are also public policy concerns. State leaders will want to consider the implications of variations in the unemployment rates by age. It may also be important to consider variations by age in the utilization of services and programs designed to help people find employment.
observation about age and Unemployment:
The unemployment rates in Utah reflect a U-shaped curve; that is, the rates are highest among the youngest and oldest groups of labor force participants and the rates dip for those who are in the mid-adult years.
Across all age groups, Utah has a lower unemployment rate compared to national statistics.
Questions you might want to consider:
Do the unemployment rates among workers of different ages reflect the economic stress experienced in particular industries or occupations?
Do the unemployment rates among workers of different ages reflect individual employment experiences, education, or marketable skills and competencies?
Figure 7: annual Unemployment Rate by age, 2005
Source: American Community Survey, 2006
0.0%
3.0%
6.0%
9.0%
12.0%
15.0%
< 25
8.9
14.5
3.6
6.4
3.1
4.8
2.7
4.3
2.83.8
2.63.8 3.3
3.6
25-34 35-44 45-54 55-64 65-74 75+
Utah United States
10
State Profile: U
tah
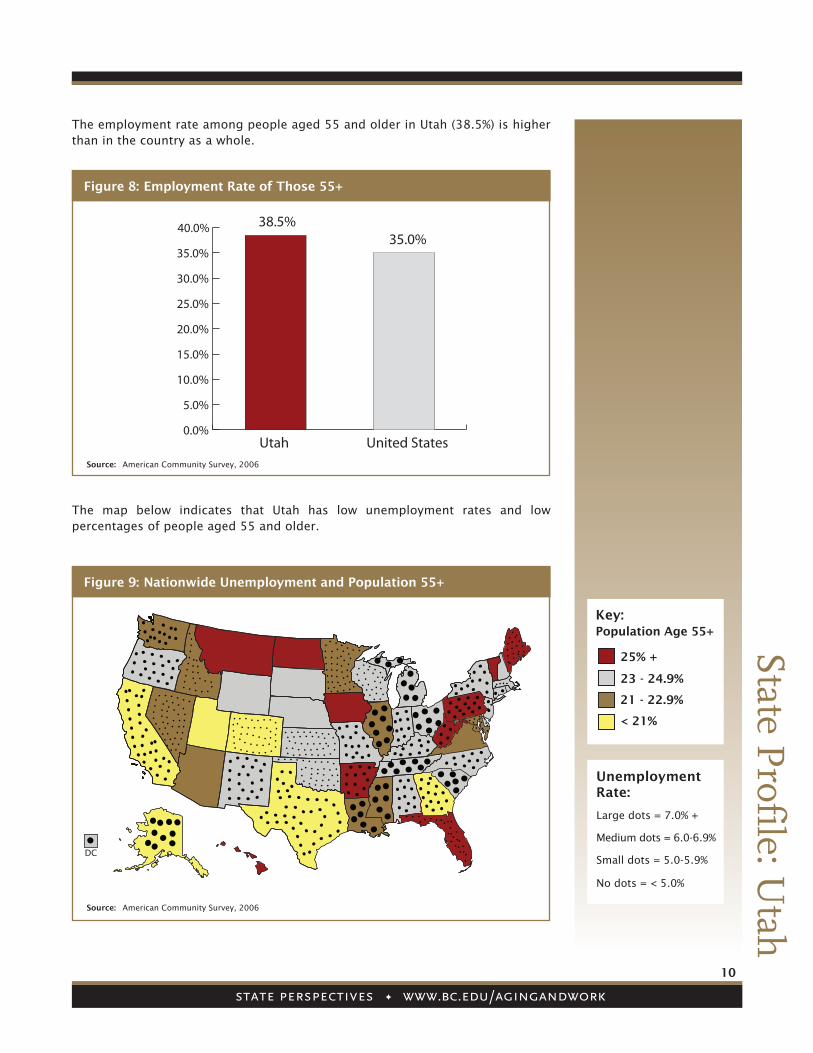
Figure 8: employment Rate of Those 55+
Figure 9: Nationwide Unemployment and Population 55+
Source: American Community Survey, 2006
0.0%
5.0%
10.0%
15.0%
20.0%
25.0%
30.0%
35.0%
40.0%
Utah United States
38.5%35.0%
The map below indicates that Utah has low unemployment rates and low percentages of people aged 55 and older.
25% +
23 - 24.9%
21 - 22.9%
< 21%
Key: Population age 55+
Large dots = 7.0% +
Medium dots = 6.0-6.9%
Small dots = 5.0-5.9%
No dots = < 5.0%
Unemployment Rate:
Source: American Community Survey, 2006
The employment rate among people aged 55 and older in Utah (38.5%) is higher than in the country as a whole.
DC

11
State Profile: U
tah
Section 3: Industry Sector and occupational Groups
Introduction
It is important to make the connection between workforce development and economic activity. Job expansion may be located in those industry sectors that make significant contributions to states’ economies and those that are expected to grow.
economic output
Importance of the Information:
Measures of economic output provide insight into the business productivity.
observation about economic output by Industry Sector in Utah:
As an industry sector, manufacturing contributes the most to the state economy, as measured by gross domestic product.
Questions you might want to consider:
Which industry sectors anchor the state’s economy?
Which industry sectors are in growth mode?
Which industry sectors show signs of being in decline?
Figure 10: Utah economic activity (GDP) by Industry Sector, 2005, Top 5 Industries
Source: Bureau of Economic Analysis, U.S. Department of Commerce, 2005
0.0%
2.0%
4.0%
6.0%
8.0%
10.0%
12.0% 11.2% 10.7%9.3% 8.8%
7.4%
Manufacturing Finance & InsuranceReal Estate, Rental & Leasing Retail Trade
State & Local Government
12
State Profile: U
tah
employment by Industry Sectors
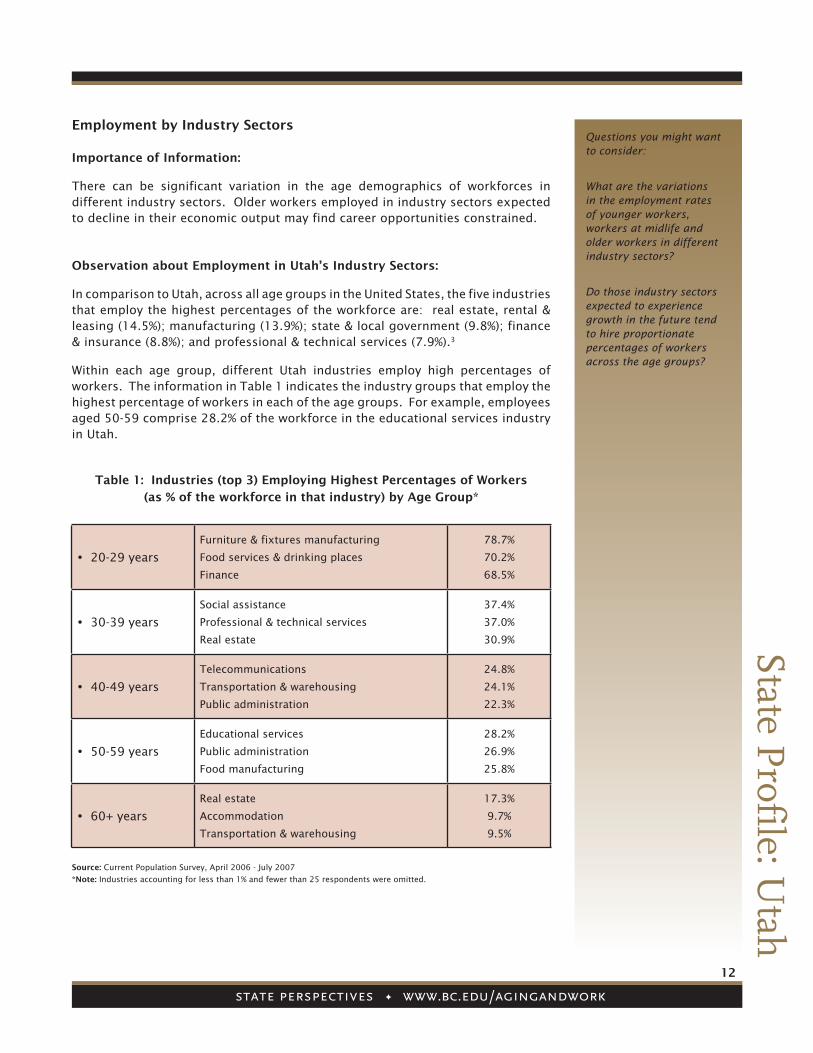
Importance of Information:
There can be significant variation in the age demographics of workforces in different industry sectors. Older workers employed in industry sectors expected to decline in their economic output may find career opportunities constrained.
observation about employment in Utah’s Industry Sectors:
In comparison to Utah, across all age groups in the United States, the five industries that employ the highest percentages of the workforce are: real estate, rental & leasing (14.5%); manufacturing (13.9%); state & local government (9.8%); finance & insurance (8.8%); and professional & technical services (7.9%).3
Within each age group, different Utah industries employ high percentages of workers. The information in Table 1 indicates the industry groups that employ the highest percentage of workers in each of the age groups. For example, employees aged 50-59 comprise 28.2% of the workforce in the educational services industry in Utah.
Table 1: Industries (top 3) employing Highest Percentages of Workers
(as % of the workforce in that industry) by age Group*
20-29 years y
Furniture & fixtures manufacturing
Food services & drinking places
Finance
78.7%
70.2%
68.5%
30-39 years y
Social assistance
Professional & technical services
Real estate
37.4%
37.0%
30.9%
40-49 years y
Telecommunications
Transportation & warehousing
Public administration
24.8%
24.1%
22.3%
50-59 years y
Educational services
Public administration
Food manufacturing
28.2%
26.9%
25.8%
60+ years y
Real estate
Accommodation
Transportation & warehousing
17.3%
9.7%
9.5%
Source: Current Population Survey, April 2006 - July 2007
*Note: Industries accounting for less than 1% and fewer than 25 respondents were omitted.
Questions you might want to consider:
What are the variations in the employment rates of younger workers, workers at midlife and older workers in different industry sectors?
Do those industry sectors expected to experience growth in the future tend to hire proportionate percentages of workers across the age groups?

13
State Profile: U
tah
employment by occupational Groups
Importance of this Information:
The occupational choices made vary from generation to generation. As a consequence, the age distribution within occupational groups varies.
observation about employment by occupational Groups in Utah:
Within each age group, different occupations employ different percentages of workers. The information in Table 2 indicates the occupational groups with the highest percentage of workers in each of the age groups. For example, employees aged 50-59 comprise 28.9% of people in the education, training & library occupational group.
Table 2: occupations (top 3) with the Highest Percentages of Workers
(as % of the workforce in that occupation) by age Group*
20-29 years y
Healthcare support
Protective service
Food preparation & serving related
69.7%
67.0%
64.6%
30-39 years y
Architecture & engineering
Healthcare practitioner
Life, physical & social sciences
44.1%
35.5%
33.0%
40-49 years y
Legal occupations
Computer & mathematical science
Life, physical & social sciences
32.7%
25.1%
24.6%
50-59 years y
Education, training & library
Business & financial operations
Management
28.9%
25.1%
21.8%
60+ years y
Management
Education, training & library
Legal occupations
12.6%
9.6%
8.6%
Source: Current Population Survey, April 2006 - July 2007
*Note: Occupations accounting for less than 1% and fewer than 25 respondents were omitted.
Questions you might want to consider:
What is the age distribution in occupational groups anticipated to grow in the next decade?
14
State Profile: U
tah
Section 4: education & Workforce Preparedness
Introduction
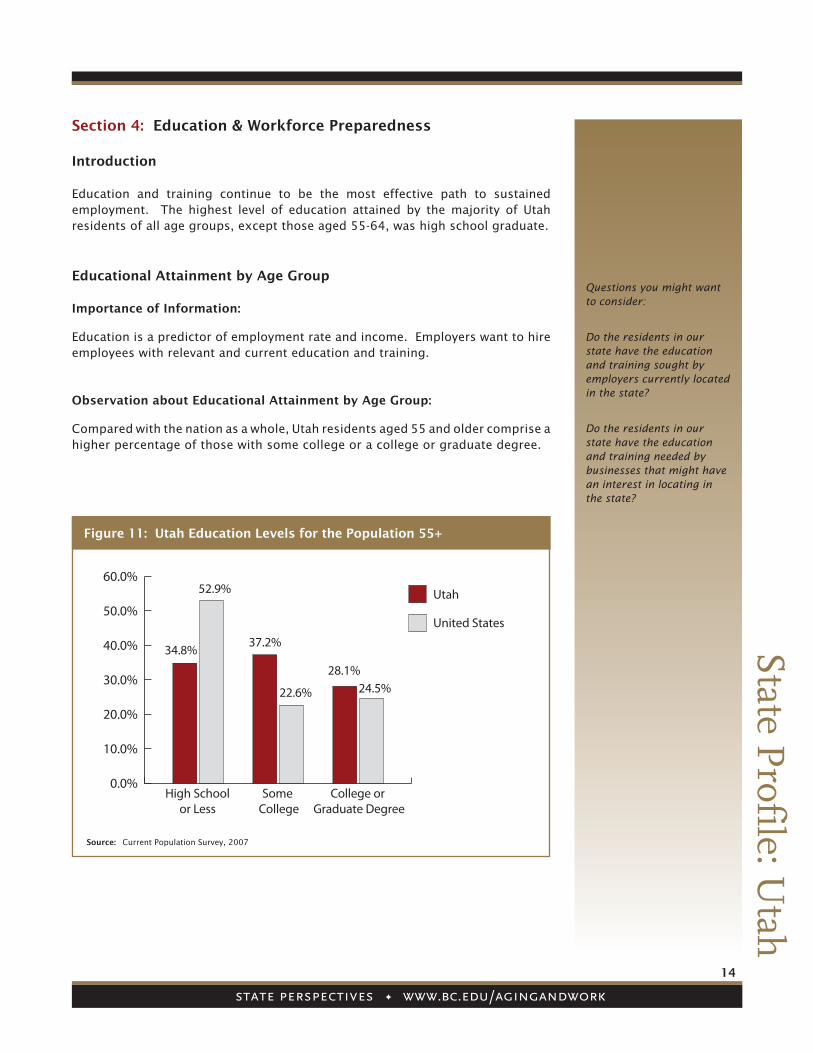
Education and training continue to be the most effective path to sustained employment. The highest level of education attained by the majority of Utah residents of all age groups, except those aged 55-64, was high school graduate.
educational attainment by age Group
Importance of Information:
Education is a predictor of employment rate and income. Employers want to hire employees with relevant and current education and training.
observation about educational attainment by age Group:
Compared with the nation as a whole, Utah residents aged 55 and older comprise a higher percentage of those with some college or a college or graduate degree.
Questions you might want to consider:
Do the residents in our state have the education and training sought by employers currently located in the state?
Do the residents in our state have the education and training needed by businesses that might have an interest in locating in the state?
Figure 11: Utah education Levels for the Population 55+
Source: Current Population Survey, 2007
0.0%
10.0%
20.0%
30.0%
40.0%
50.0%
60.0%
High Schoolor Less
Some College
College or Graduate Degree
34.8%
52.9% Utah
United States37.2%
22.6% 24.5%28.1%
15
State Profile: U
tah
Figure 12: Utah educational attainment by age
Source: Current Population Survey, 2007
Questions you might want to consider:
Have state agencies considered how the aging of the population will affect the expectations for state services?
Have state agencies considered how the aging of the workforce will affect their ability to recruit, engage, and retain talented employees?
Section 5: Legislative Readiness
Introduction
One way of evaluating states’ readiness to address the aging population is by looking at legislation and legislative committees relevant to older workers. Policies that expand the employment opportunities available to older workers can complement the efforts of employers interested in recruiting, engaging, and retaining older workers.
There are ample opportunities for states, as both policy-makers and as employers, to facilitate the employment of older workers, including:
Raise awareness about the aging of the workforce by providing information ■
to residents, community-based organizations, and employers.
Establish employment standards to guide employer decision-making. ■
Provide services to older residents and to employers, such as training. ■
Recognize the efforts of model employers who work to expand the quality ■
employment opportunities to older workers.
Being model employers themselves and utilizing “best practices,” such as ■
expanding the availability of flexible work options or providing training.
Current Legislation
Legislative activity is one indicator of the state’s level of preparedness to respond to the aging of the workforce.
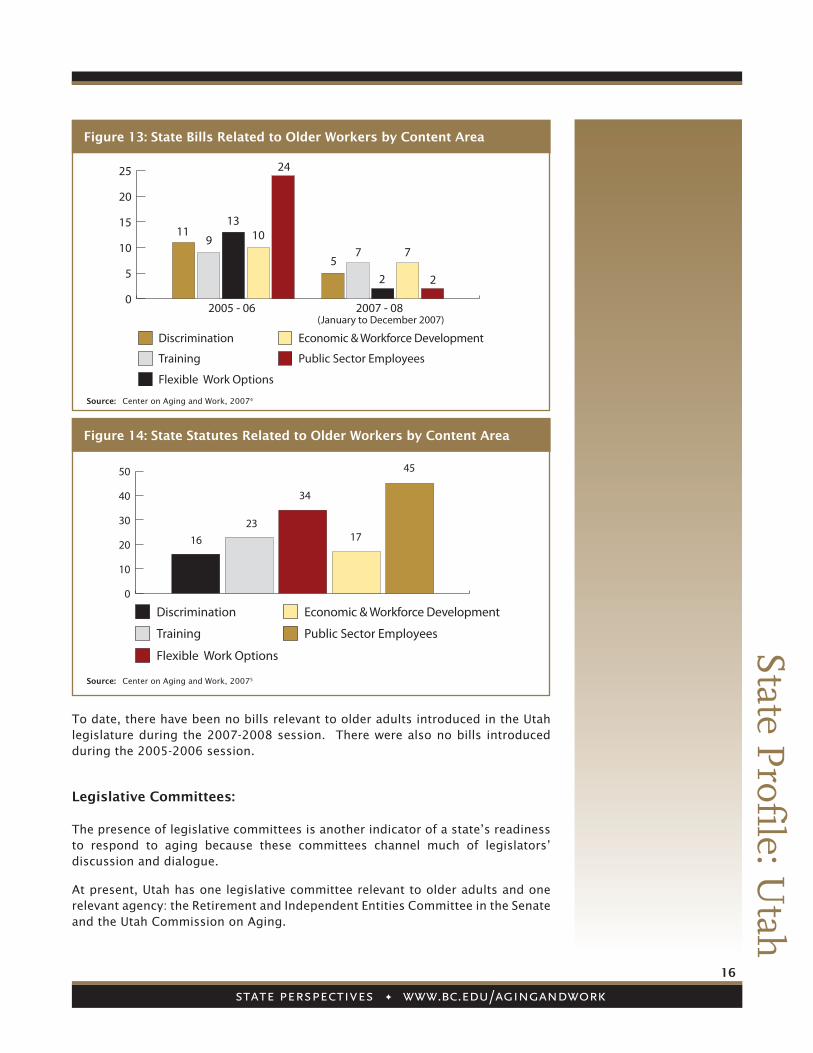
Figure 13 indicates that most of the state bills in 2005-2006 addressed issues related to the employment of older workers who work in public sector agencies and departments.
High School or Less Some College College or Graduate Degree
0.0%
10.0%
20.0%
30.0%
40.0%
50.0%
60.0%
70.0%
80.0%
15-24
70.8
38.739.0
38.0
45.0
28.531.8
29.936.5
37.734.9
39.2
0.8
30.531.4
24.4
33.027.1
15.8
29.4
37.7
25-34 35-44 45-54 55-64 65-74 75+
16
State Profile: U
tah
Figure 13: State Bills Related to older Workers by Content area
Figure 14: State Statutes Related to older Workers by Content area
Source: Center on Aging and Work, 20074
Source: Center on Aging and Work, 20075
To date, there have been no bills relevant to older adults introduced in the Utah legislature during the 2007-2008 session. There were also no bills introduced during the 2005-2006 session.
0
5
10
15
20
25
Discrimination
Training
Economic & Workforce Development
Public Sector Employees
Flexible Work Options
119
1310
24
57
2
7
2
2005 - 06 2007 - 08 (January to December 2007)
0
10
20
30
40
50
Discrimination
Training
Economic & Workforce Development
Public Sector Employees
Flexible Work Options
1623
34
17
45
Legislative Committees:
The presence of legislative committees is another indicator of a state’s readiness to respond to aging because these committees channel much of legislators’ discussion and dialogue.
At present, Utah has one legislative committee relevant to older adults and one relevant agency: the Retirement and Independent Entities Committee in the Senate and the Utah Commission on Aging.

17
State Profile: U
tah
Marcie Pitt-Catsouphes, State Perspectives Institute
Director and Co-Director of the Center
on Aging & Work
Michael A. Smyer, Co-Director of the Center
on Aging & Work
Tay McNamara, Research Director
Michelle M. Wong, Graduate Research
Assistant
Vanessa Careiro, Undergraduate Research
Assistant
Gaurie Pandey, Graphic Designer
References:
1 Brown, S. K. (2005). Attitudes of individuals 50 and older toward phased retirement (research report). Washington, D.C.: AARP Knowledge Management. Retrieved November 21, 2007 from http://www.aarp.org/research/work/retirement/Articles/attitudes_of_individuals_50_and_older_toward_phase.html
2 Maestas, N., & Li, X. (2006). Discouraged workers? job search outcomes of older workers. (Working Paper No. 133). Ann Arbor, MI: Utah Retirement Research Center, University of Utah. Retrieved November 21, 2007 from http://www.mrrc.isr.umich.edu/publications/Papers/pdf/wp133.pdf
3 Bureau of Economic Analysis. (2005). Industry Economic Accounts. Washington, D.C.: U.S. Department of Commerce. Retrieved November 21, 2007 from http://www.bea.gov/industry/index.htm
4 Center on Aging and Work. (2007). [Analysis of records from LexisNexis State Capital database, 2007]. Unpublished data.
5 Center on Aging and Work. (2007). [Analysis of records from LexisNexis State Capital database, 2007]. Unpublished data.
The State Perspectives Institute
The State Perspectives Institute at the Boston College Center on Aging & Work partners with state leaders across the country to examine impacts of the 21st century age demographics on economic and workforce development. The Institute gathers and analyzes information about employment at state agencies, as well as workforce demographics in the states’ primary industry sectors.
Web site: www.bc.edu/agingandwork Phone: 617-552-9195 Email: [email protected]
18
State Profile: U
tah
appendix a: List of Figures and Tables
Figure 1: Population Distribution by Age: Utah and the United States
Figure 2: Percent of the Population Aged 55+ by State
Figure 3: Percentage Point Change in Population Age Groups 2000-2006
Figure 4: Anticipated Percentage Point Change in Population Age Groups 2006-2010
Figure 5: Labor Force Participation by Age
Figure 6:Age Distribution of the Utah Workforce in the Public Sector, Private Sector,
and Self-Employed Groups
Figure 7: Annual Unemployment Rate by Age: 2005
Figure 8: Employment of Those 55+
Figure 9: Nationwide Unemployment and Population 55+
Figure 10: Utah Economic Activity by Industry Sector: Top 5 Industries
Figure 11: Education Levels for the Population 65+
Figure 12: Utah Educational Attainment by Age
Figure 13: State Bills
Figure 14: State Statutes
Table 1:Industries: Highest Percentages of Workers by Age Group as % of Workforce
by Industry Sector
Table 2:Occupations: Highest Percentages of Workers by Age Group as % of
Workforce by Occupational Category