April 2- Lecture Occup study design overview.ppt
18
4/1/2013 1 EPIDEMIOLOGY The study of the distributions (rates) and determinants (causes) of diseases and injuries in human populations. Cholera epidemic and water sources in London, 1854* Water supplier Houses Cholera deaths Rate per 10,000 houses Southward & Vauxhall Co. 40,046 1253 315 Lambeth Co. 26,107 98 37 Others 256,423 1422 59 *Gardner M. Arch Environ Health 1988;43:102-8
Transcript of April 2- Lecture Occup study design overview.ppt
4/1/2013
1
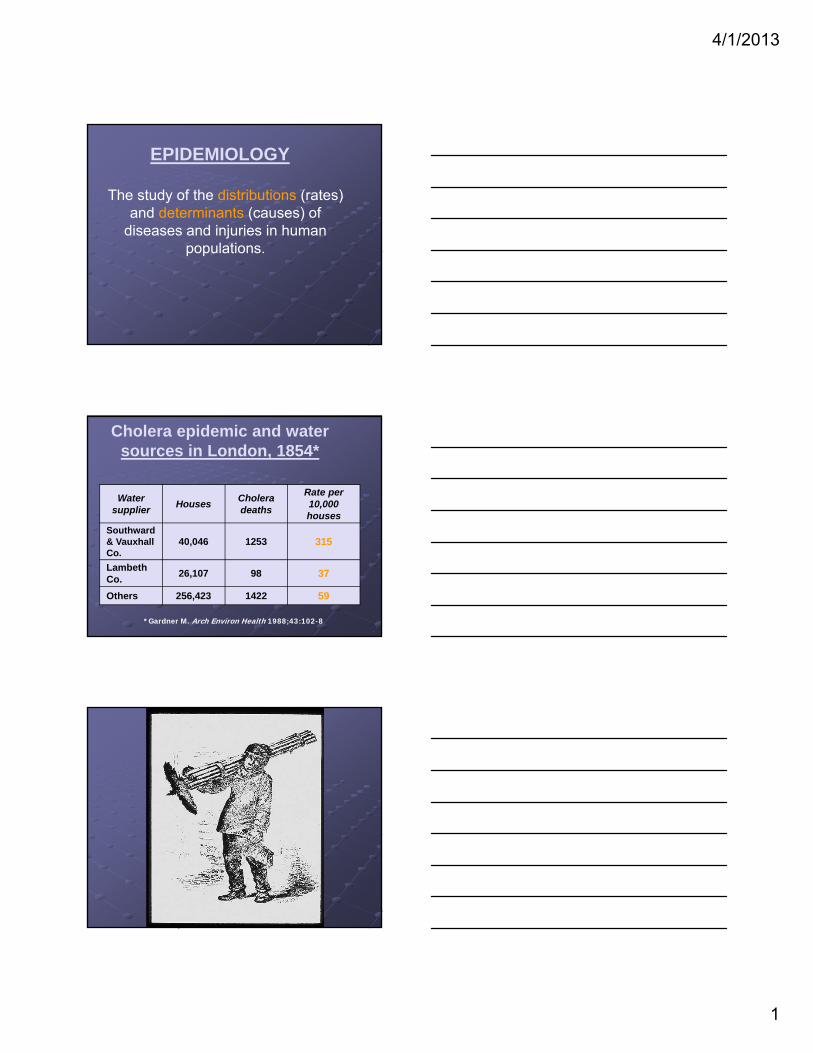
EPIDEMIOLOGY
The study of the distributions (rates) and determinants (causes) of
diseases and injuries in human populations.
Cholera epidemic and water sources in London, 1854*
Water supplier
HousesCholera deaths
Rate per 10,000 houses
Southward & Vauxhall Co.
40,046 1253 315
Lambeth Co.
26,107 98 37
Others 256,423 1422 59
*Gardner M. Arch Environ Health 1988;43:102-8

4/1/2013
2
Types of epidemiologic studies
Case series
Cross-sectional
Prospective cohort
Retrospective cohort
Case-control
Case-crossover (variant of case-control)
Case series
Report of case cluster, usually rare disease
Example: Angiosarcoma of the liver in workers in polyvinylchoridemanufacturing plant (Creech and Johnson, 1974)
4/1/2013
3
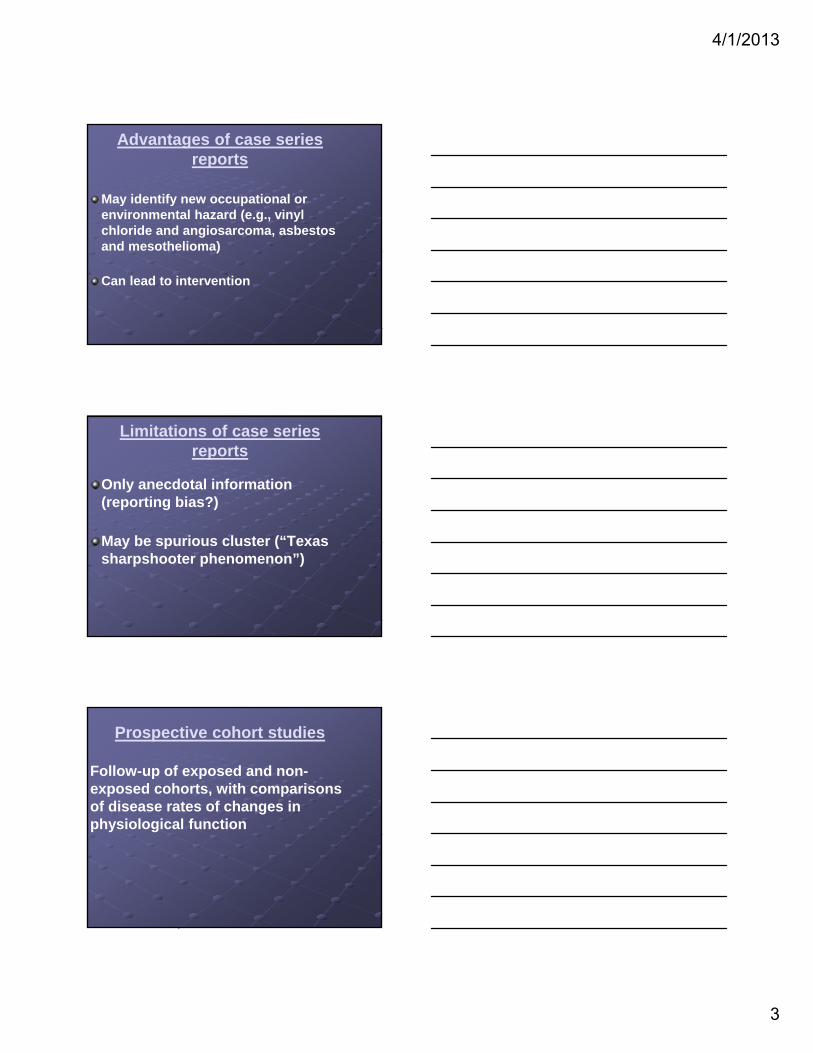
Advantages of case series reports
May identify new occupational or environmental hazard (e.g., vinyl chloride and angiosarcoma, asbestos and mesothelioma)
Can lead to intervention
Limitations of case series reports
Only anecdotal information (reporting bias?)
May be spurious cluster (“Texas sharpshooter phenomenon”)
Prospective cohort studies
Follow-up of exposed and non-exposed cohorts, with comparisons of disease rates of changes in physiological function
4/1/2013
4
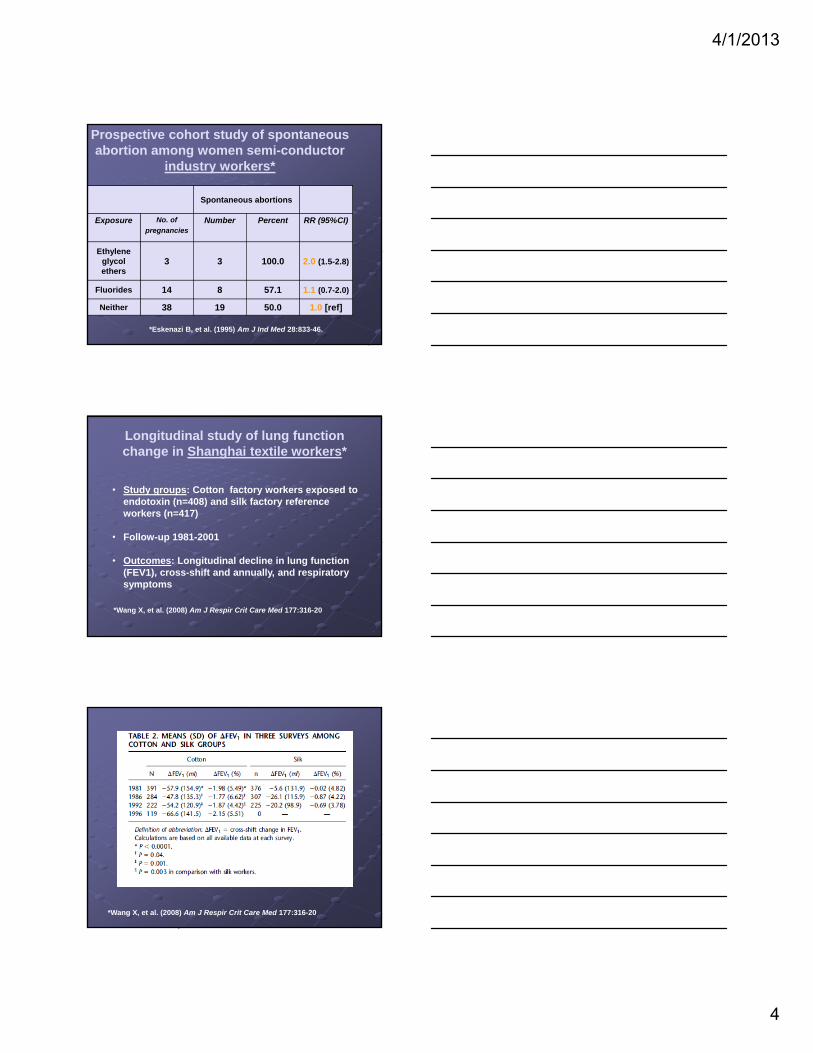
Prospective cohort study of spontaneous abortion among women semi-conductor
industry workers*
Spontaneous abortions
Exposure No. of
pregnanciesNumber Percent RR (95%CI)
Ethylene glycol ethers
3 3 100.0 2.0 (1.5-2.8)
Fluorides 14 8 57.1 1.1 (0.7-2.0)
Neither 38 19 50.0 1.0 [ref]
*Eskenazi B, et al. (1995) Am J Ind Med 28:833-46.
Longitudinal study of lung function change in Shanghai textile workers*
• Study groups: Cotton factory workers exposed to endotoxin (n=408) and silk factory reference workers (n=417)
• Follow-up 1981-2001
• Outcomes: Longitudinal decline in lung function (FEV1), cross-shift and annually, and respiratory symptoms
*Wang X, et al. (2008) Am J Respir Crit Care Med 177:316-20
*Wang X, et al. (2008) Am J Respir Crit Care Med 177:316-20

4/1/2013
5
Annual decline in FEV1 over 15 years in relation to frequency of cross-shift change:
Shanghai textile workers*
Silk
Cotton
*Wang X, et al. (2008) Am J Respir Crit Care Med 177:316-20
Advantages of prospective cohort studies
Logic similar to experiment
Well suited to short-term health outcomes
Eliminates prevalent cases at outset of follow-up
Limitations of prospective cohort studies
Not practical for most studies of chronic diseases (need very large cohort and long follow-up)
Practical difficulties updating exposure data prospectively
4/1/2013
6
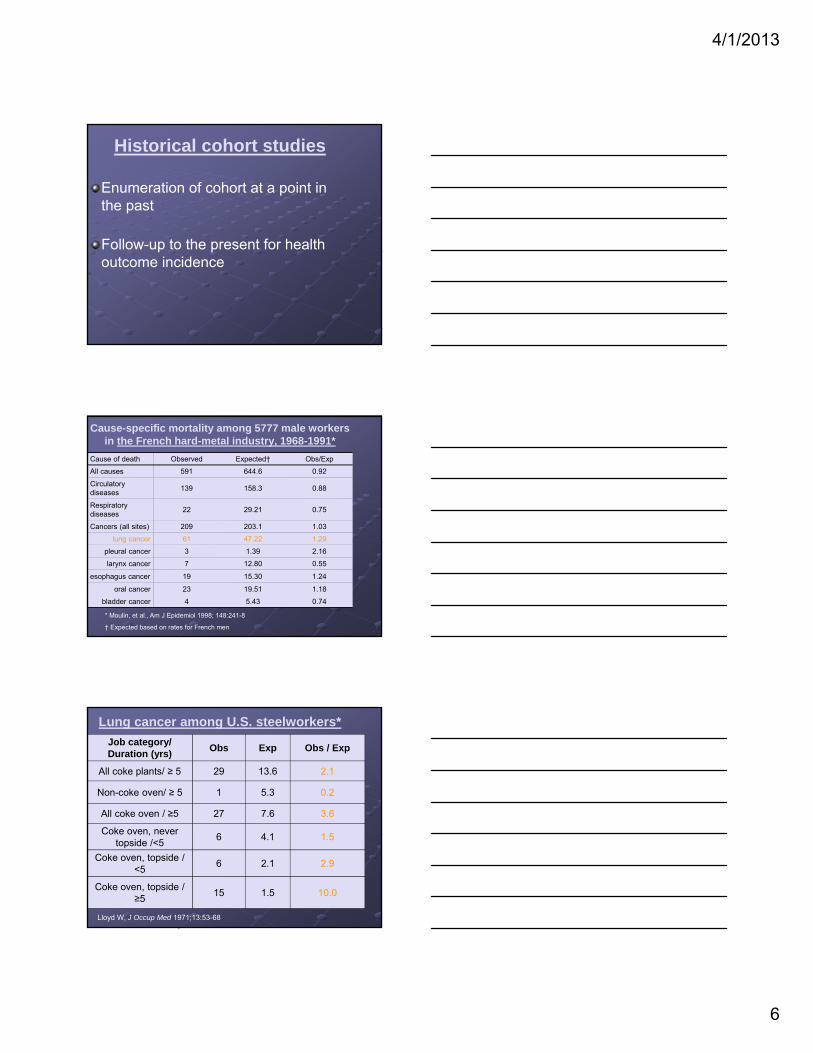
Historical cohort studies
Enumeration of cohort at a point in the past
Follow-up to the present for health outcome incidence
Cause-specific mortality among 5777 male workers in the French hard-metal industry, 1968-1991*
Cause of death Observed Expected† Obs/Exp
All causes 591 644.6 0.92
Circulatory diseases
139 158.3 0.88
Respiratory diseases
22 29.21 0.75
Cancers (all sites) 209 203.1 1.03
lung cancer 61 47.22 1.29
pleural cancer 3 1.39 2.16
larynx cancer 7 12.80 0.55
esophagus cancer 19 15.30 1.24
oral cancer 23 19.51 1.18
bladder cancer 4 5.43 0.74
* Moulin, et al., Am J Epidemiol 1998; 148:241-8
† Expected based on rates for French men
Lung cancer among U.S. steelworkers*
Job category/ Duration (yrs)
Obs Exp Obs / Exp
All coke plants/ ≥ 5 29 13.6 2.1
Non-coke oven/ ≥ 5 1 5.3 0.2
All coke oven / ≥5 27 7.6 3.6
Coke oven, never topside /<5
6 4.1 1.5
Coke oven, topside / <5
6 2.1 2.9
Coke oven, topside / ≥5
15 1.5 10.0
Lloyd W, J Occup Med 1971;13:53-68
4/1/2013
7
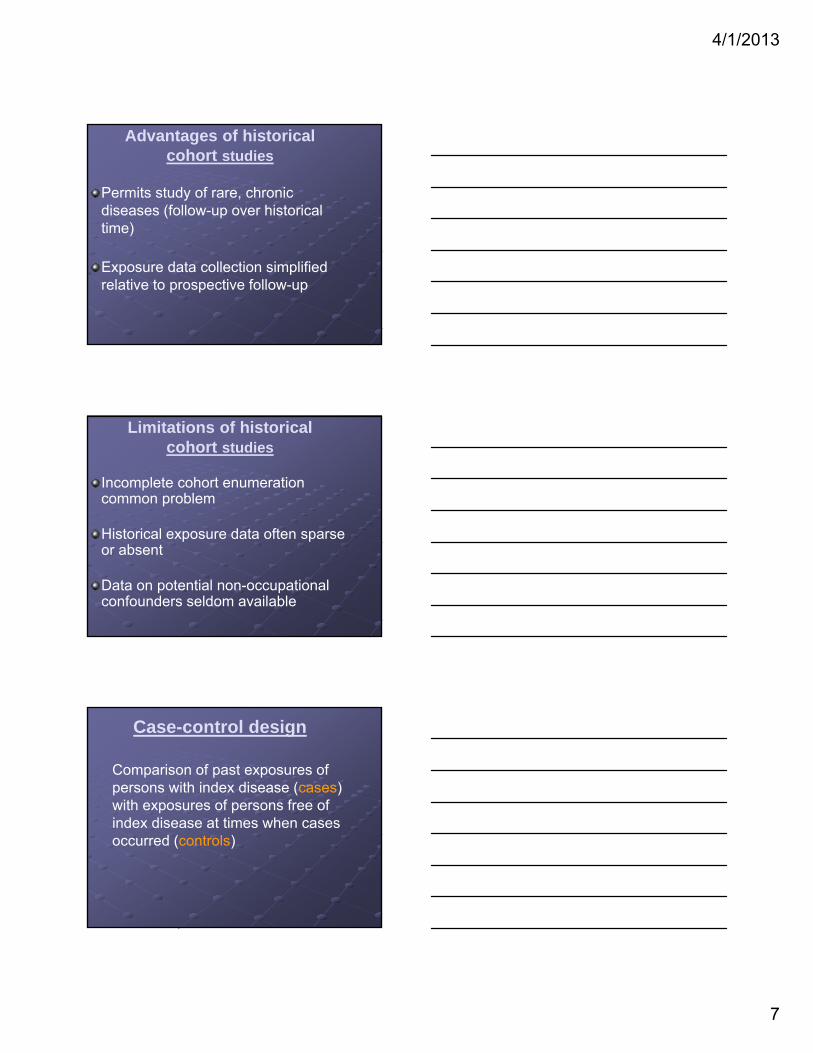
Advantages of historical cohort studies
Permits study of rare, chronic diseases (follow-up over historical time)
Exposure data collection simplified relative to prospective follow-up
Limitations of historical cohort studies
Incomplete cohort enumeration common problem
Historical exposure data often sparse or absent
Data on potential non-occupational confounders seldom available
Case-control design
Comparison of past exposures of persons with index disease (cases) with exposures of persons free of index disease at times when cases occurred (controls)
4/1/2013
8
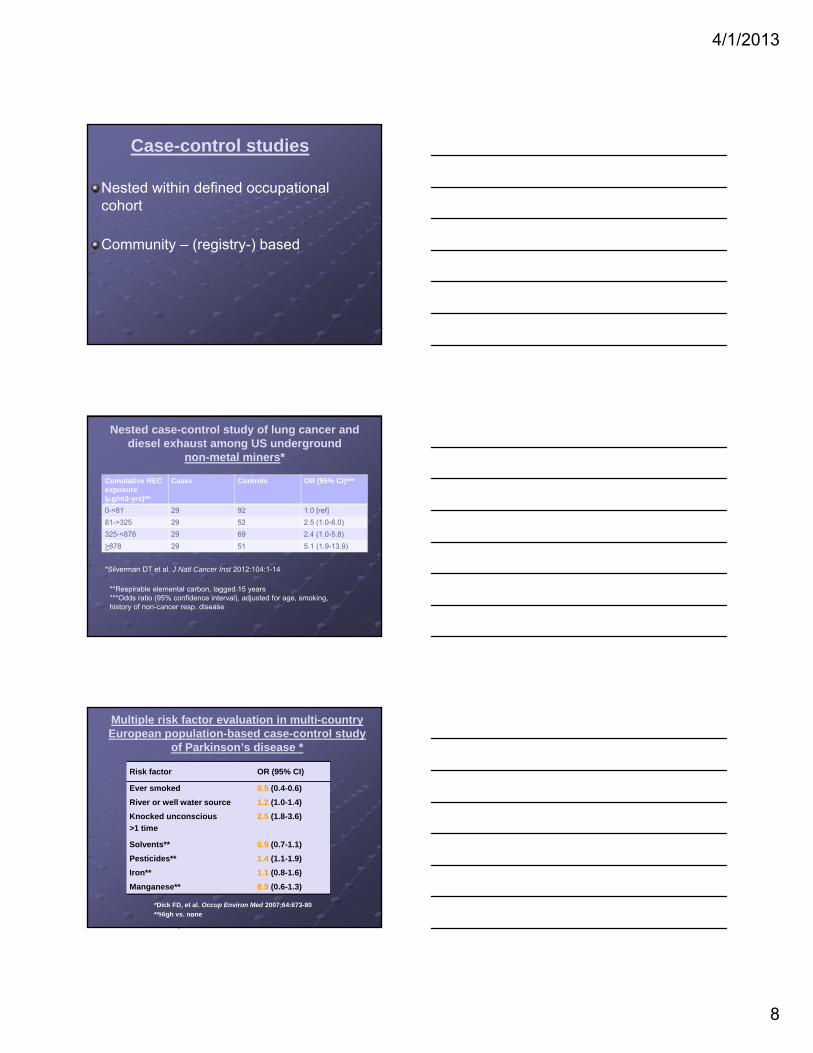
Case-control studies
Nested within defined occupational cohort
Community – (registry-) based
Nested case-control study of lung cancer and diesel exhaust among US underground
non-metal miners*
Cumulative REC exposure (g/m3-yrs)**
Cases Controls OR (95% CI)***
0-<81 29 92 1.0 [ref]
81->325 29 52 2.5 (1.0-6.0)
325-<878 29 69 2.4 (1.0-5.8)
>878 29 51 5.1 (1.9-13.9)
*Silverman DT et al. J Natl Cancer Inst 2012:104:1-14
**Respirable elemental carbon, lagged 15 years***Odds ratio (95% confidence interval), adjusted for age, smoking, history of non-cancer resp. disease
Multiple risk factor evaluation in multi-country European population-based case-control study
of Parkinson’s disease *
Risk factor OR (95% CI)
Ever smoked 0.5 (0.4-0.6)
River or well water source 1.2 (1.0-1.4)
Knocked unconscious
>1 time
2.5 (1.8-3.6)
Solvents** 0.9 (0.7-1.1)
Pesticides** 1.4 (1.1-1.9)
Iron** 1.1 (0.8-1.6)
Manganese** 0.9 (0.6-1.3)
*Dick FD, et al. Occup Environ Med 2007;64:673-80
**High vs. none

4/1/2013
9
Advantages of case-control design
Permits studies of rare disease
Can have multiple case groups and common control group (“case-cohort” design)
Obtaining data on confounders more feasible than in cohort studies
Limitations of case-control design
Reliance on questionnaire data for exposures in community-based studies
Selection of controls may be biased
Unequal participation rates and data quality may differ for cases and controls
Case-crossover design
“Case only” study, i.e., cases serve as their own controls (special type of matched case-control study)
Comparisons of exposures during cases’ “index” intervals with exposures during “reference” intervals
4/1/2013
10
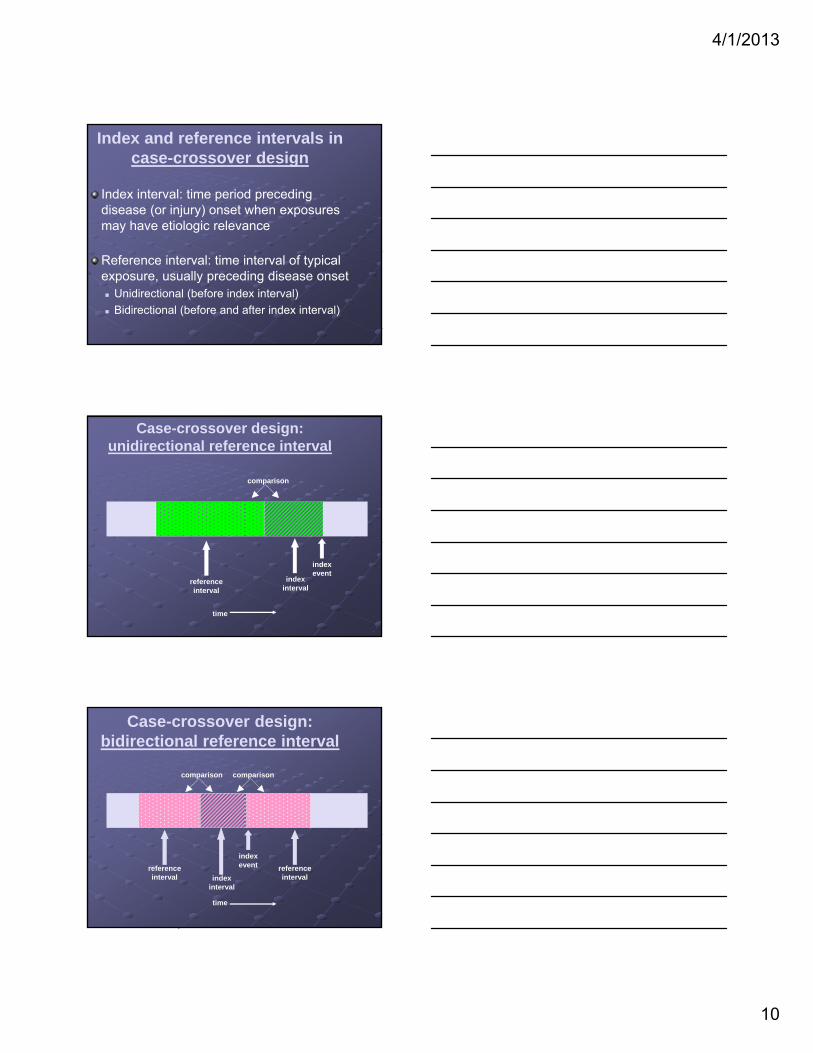
Index and reference intervals in case-crossover design
Index interval: time period preceding disease (or injury) onset when exposures may have etiologic relevance
Reference interval: time interval of typical exposure, usually preceding disease onset Unidirectional (before index interval)
Bidirectional (before and after index interval)
Case-crossover design: unidirectional reference interval
comparison
reference interval
indexinterval
indexevent
time
Case-crossover design: bidirectional reference interval
comparison comparison
reference interval index
interval
indexevent reference
interval
time
4/1/2013
11
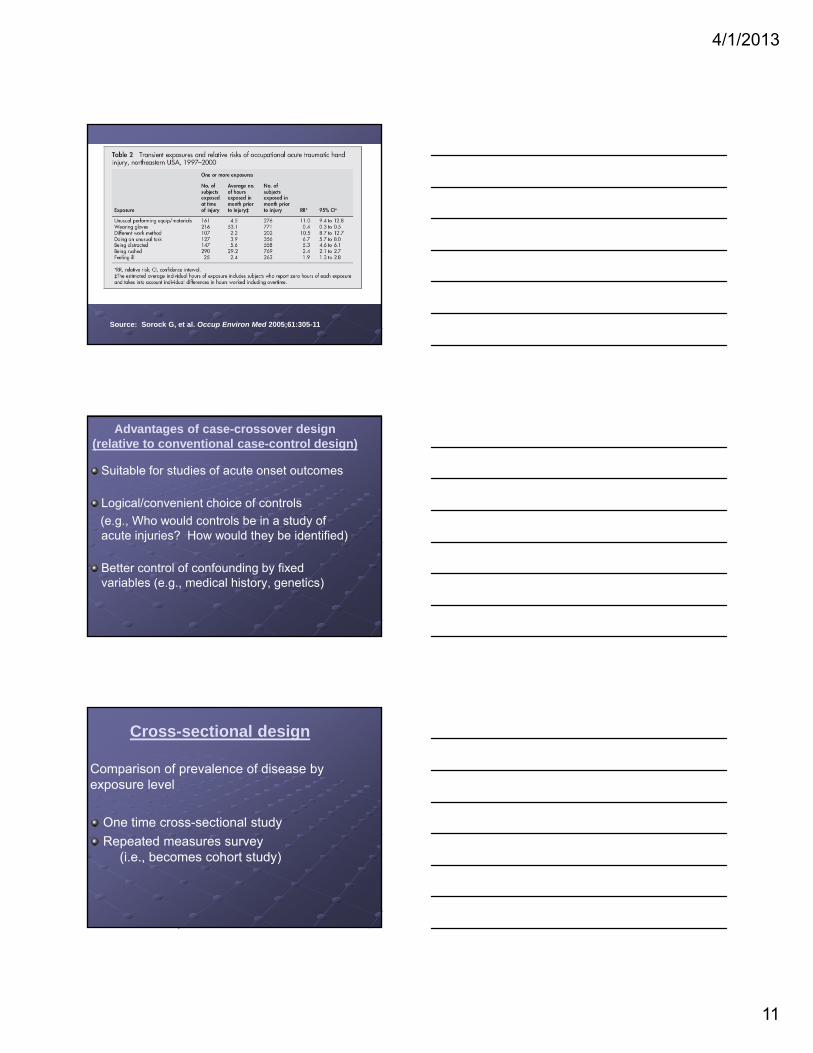
Source: Sorock G, et al. Occup Environ Med 2005;61:305-11
Advantages of case-crossover design (relative to conventional case-control design)
Suitable for studies of acute onset outcomes
Logical/convenient choice of controls
(e.g., Who would controls be in a study of acute injuries? How would they be identified)
Better control of confounding by fixed variables (e.g., medical history, genetics)
Cross-sectional design
Comparison of prevalence of disease by exposure level
One time cross-sectional study
Repeated measures survey (i.e., becomes cohort study)

4/1/2013
12
Respiratory symptoms and endotoxin exposure in Dutch wastewater workers*
Endotoxin level (EU/mg/m3)
No. subjects
Lower resp. and skin symptoms
Flu-like symptoms
Upper resp. symptoms
<50 (ref) 141 1.0+ 1.0 1.0
51 – 200 63 1.1 (0.5 – 2.4) 1.2 (0.6 – 2.3) 1.6 (0.9 – 3.0)
>200 12 1.8 (0.6 – 5.2) 2.0 (0.8 – 4.9) 1.8 (0.8 – 3.8)
*Source: Smit LAM, et al. Am J Ind Med 2005;48:30-9.+Prevalence ratio adjusted for age, sex, smoking
Advantages of cross-sectional studies
Very suitable for studying symptoms, physiological variation (e.g., lung function)
Direct contact with workers permits additional data collection (confounders, use of PPE, etc.)
Limitations of cross-sectional studies
Generally limited to active workers –workers who left may be most affected
Possible selection bias (e.g., migration between jobs influenced by health status.
4/1/2013
13
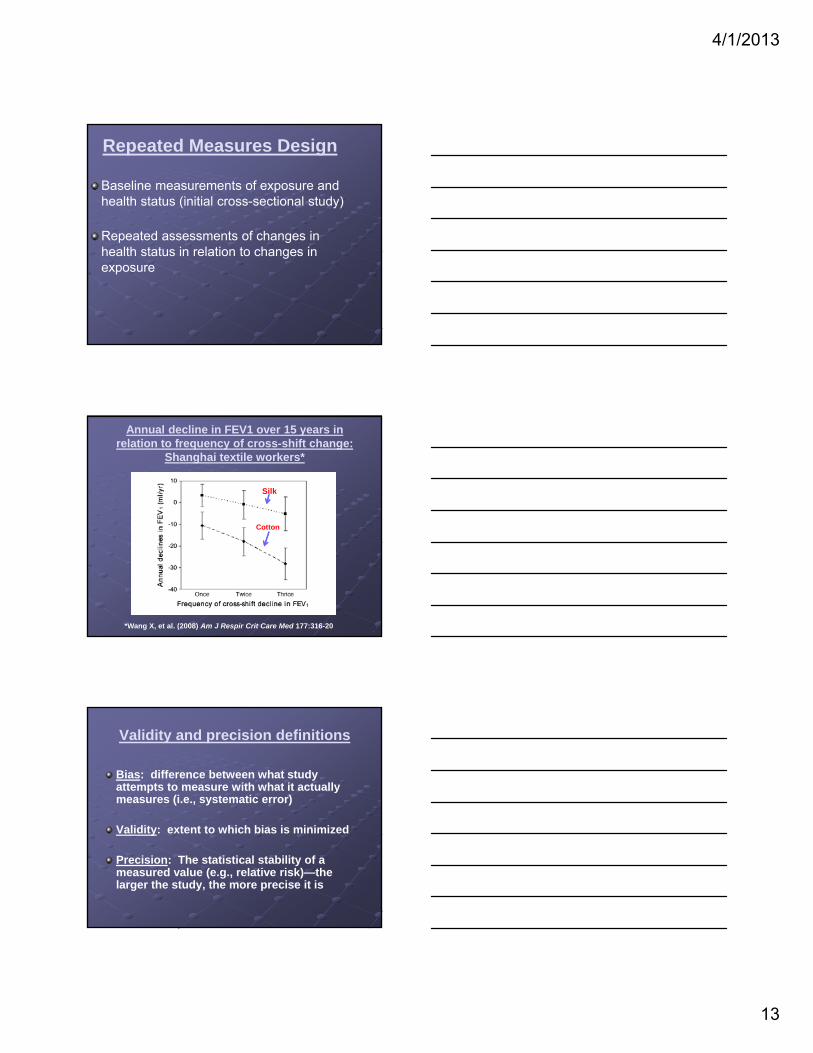
Repeated Measures Design
Baseline measurements of exposure and health status (initial cross-sectional study)
Repeated assessments of changes in health status in relation to changes in exposure
Annual decline in FEV1 over 15 years in relation to frequency of cross-shift change:
Shanghai textile workers*
Silk
Cotton
*Wang X, et al. (2008) Am J Respir Crit Care Med 177:316-20
Validity and precision definitions
Bias: difference between what study attempts to measure with what it actually measures (i.e., systematic error)
Validity: extent to which bias is minimized
Precision: The statistical stability of a measured value (e.g., relative risk)—the larger the study, the more precise it is

4/1/2013
14
Confounding
Definition: mixing of effects of exposure of interest with effects of extraneous factors
Criteria: independent risk factor for health
outcome of interest associated with exposure under study not intermediate in exposure/outcome
pathway
Examples of confounding
Demographic factors: age, gender, ethnicity
Lifestyle exposures: smoking, diet, alcohol
Personal characteristics: medical history
Co-occurring occupational or environmental exposures (e.g., solvent mixtures)
Methods to control confounding
Direct statistical adjustment when confounder data are available
Stratification by confounder status
Restriction of study to persons with single level of confounder (e.g., only non-smokers)
Indirect assessments Examine risks for other conditions related to
confounder Hypothetical calculation of confounder effects
4/1/2013
15
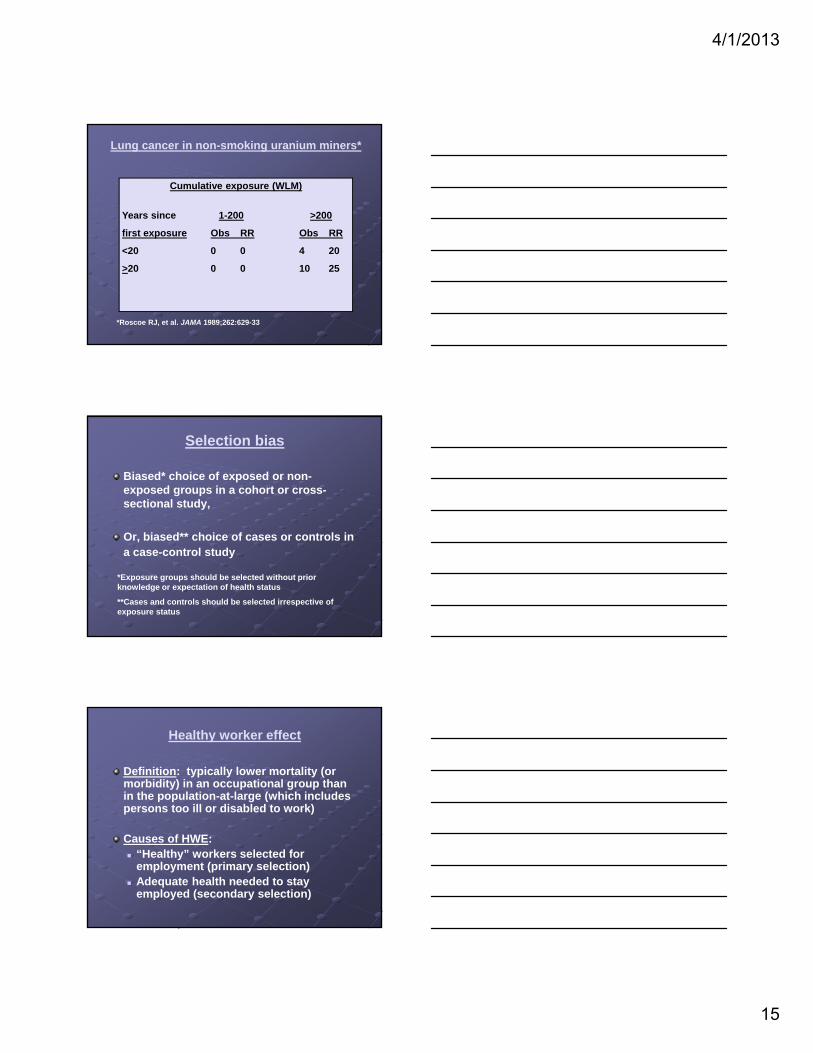
Lung cancer in non-smoking uranium miners*
Cumulative exposure (WLM)
Years since 1-200 >200
first exposure Obs RR Obs RR
<20 0 0 4 20
>20 0 0 10 25
*Roscoe RJ, et al. JAMA 1989;262:629-33
Selection bias
Biased* choice of exposed or non-exposed groups in a cohort or cross-sectional study,
Or, biased** choice of cases or controls in a case-control study
*Exposure groups should be selected without prior knowledge or expectation of health status
**Cases and controls should be selected irrespective of exposure status
Healthy worker effect
Definition: typically lower mortality (or morbidity) in an occupational group than in the population-at-large (which includes persons too ill or disabled to work)
Causes of HWE: “Healthy” workers selected for
employment (primary selection) Adequate health needed to stay
employed (secondary selection)
4/1/2013
16
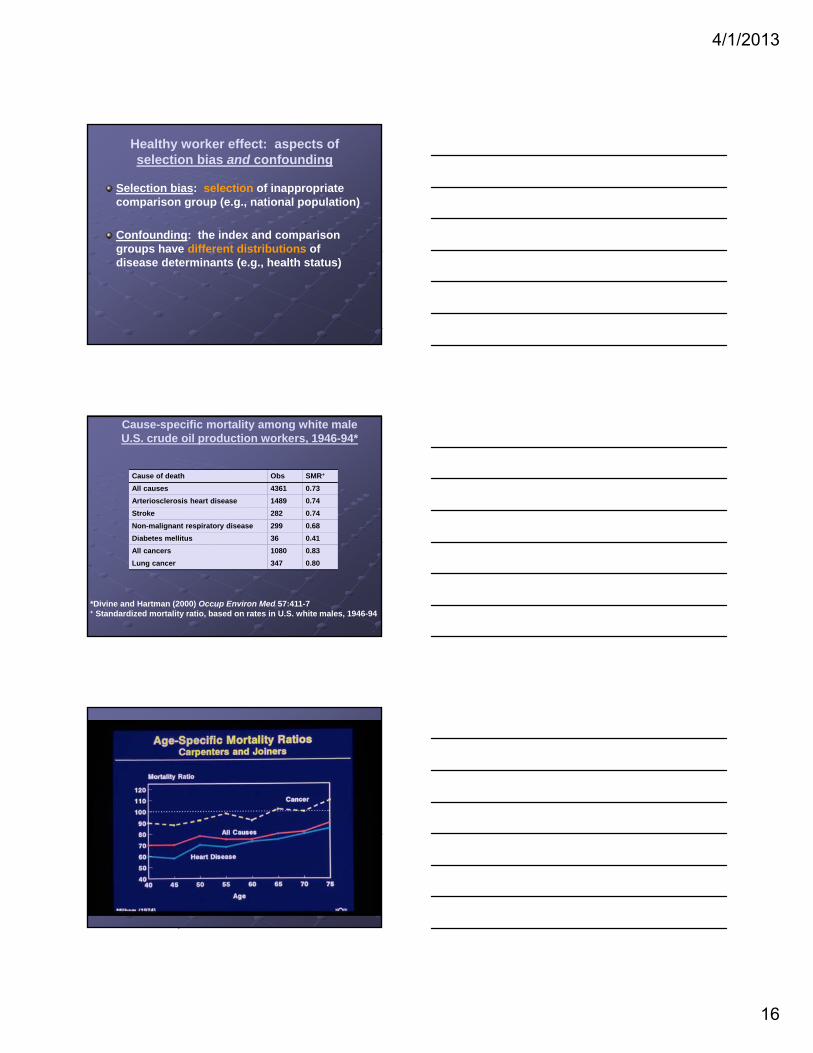
Healthy worker effect: aspects of selection bias and confounding
Selection bias: selection of inappropriate comparison group (e.g., national population)
Confounding: the index and comparison groups have different distributions of disease determinants (e.g., health status)
Cause-specific mortality among white male U.S. crude oil production workers, 1946-94*
Cause of death Obs SMR+
All causes 4361 0.73
Arteriosclerosis heart disease 1489 0.74
Stroke 282 0.74
Non-malignant respiratory disease 299 0.68
Diabetes mellitus 36 0.41
All cancers 1080 0.83
Lung cancer 347 0.80
*Divine and Hartman (2000) Occup Environ Med 57:411-7+ Standardized mortality ratio, based on rates in U.S. white males, 1946-94
4/1/2013
17
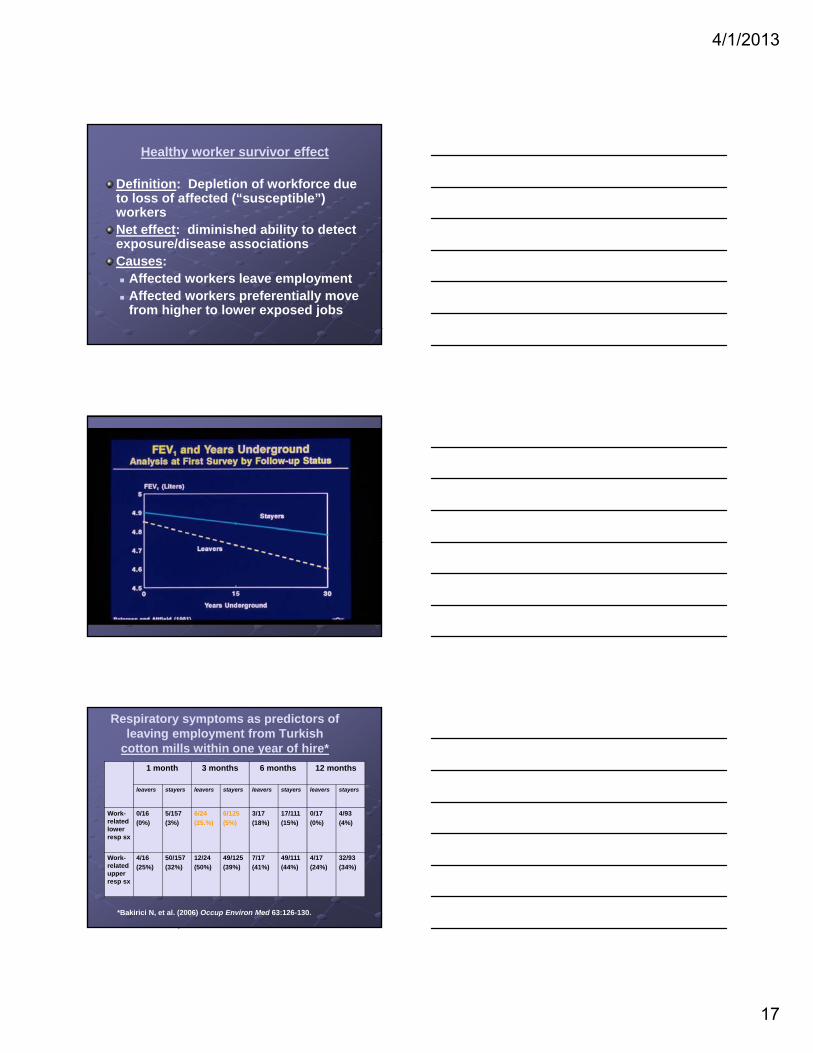
Healthy worker survivor effect
Definition: Depletion of workforce due to loss of affected (“susceptible”) workersNet effect: diminished ability to detect exposure/disease associationsCauses: Affected workers leave employment Affected workers preferentially move
from higher to lower exposed jobs
Respiratory symptoms as predictors of leaving employment from Turkish
cotton mills within one year of hire*
1 month 3 months 6 months 12 months
leavers stayers leavers stayers leavers stayers leavers stayers
Work-related lower resp sx
0/16
(0%)
5/157
(3%)
6/24
(25.%)
6/125
(5%)
3/17
(18%)
17/111
(15%)
0/17
(0%)
4/93
(4%)
Work-related upper resp sx
4/16
(25%)
50/157
(32%)
12/24
(50%)
49/125
(39%)
7/17
(41%)
49/111
(44%)
4/17
(24%)
32/93
(34%)
*Bakirici N, et al. (2006) Occup Environ Med 63:126-130.
4/1/2013
18
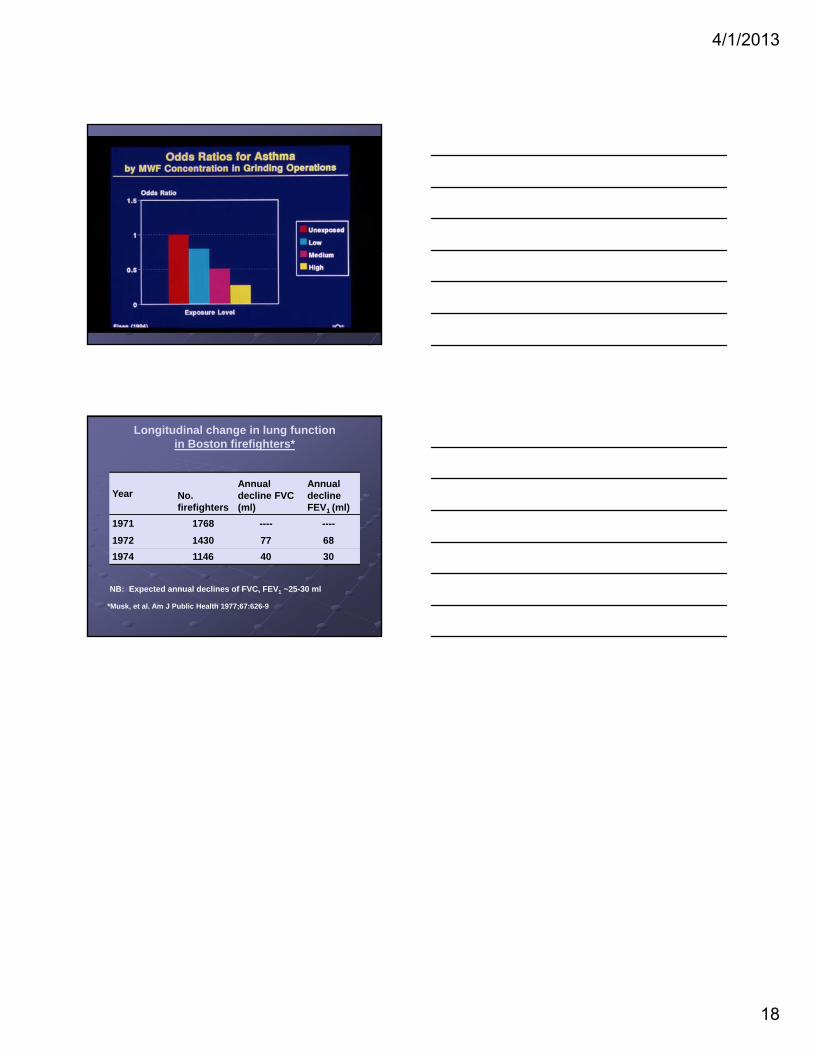
Longitudinal change in lung function in Boston firefighters*
Year No. firefighters
Annual decline FVC (ml)
Annual decline FEV1 (ml)
1971 1768 ---- ----
1972 1430 77 68
1974 1146 40 30
NB: Expected annual declines of FVC, FEV1 ~25-30 ml
*Musk, et al. Am J Public Health 1977;67:626-9


![[PPT]Lecture 1 Course Overview - University of California, …robotics.eecs.berkeley.edu/.../HoweLecture1.Overview.ppt · Web viewLecture 1 Course Overview Lecture 1 Introduction](https://static.fdocuments.us/doc/165x107/5aa949527f8b9a90188c9c62/pptlecture-1-course-overview-university-of-california-viewlecture-1-course.jpg)