(April 1 – December 31, 2011)...zMedical-use picture archiving and communication systems,...
24
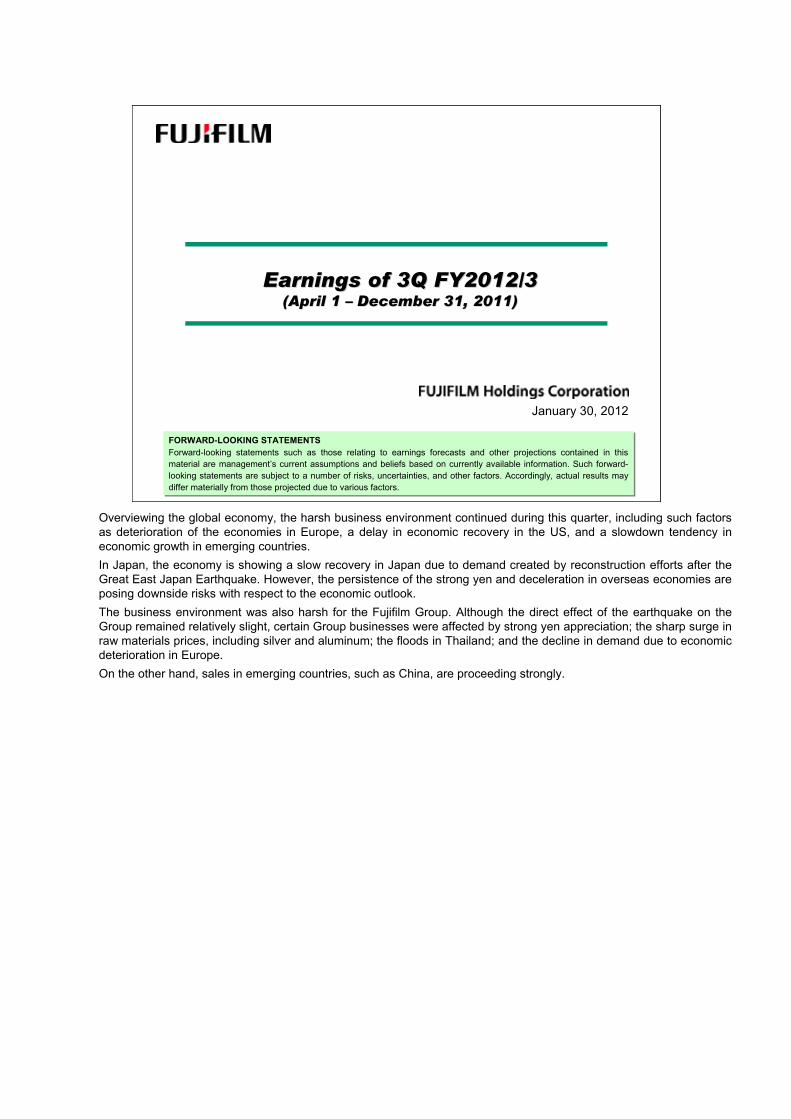
FORWARD-LOOKING STATEMENTS Forward-looking statements such as those relating to earnings forecasts and other projections contained in this material are management’s current assumptions and beliefs based on currently available information. Such forward- looking statements are subject to a number of risks, uncertainties, and other factors. Accordingly, actual results may differ materially from those projected due to various factors. January 30, 2012 Earnings of 3Q FY2012/3 Earnings of 3Q FY2012/3 (April 1 (April 1 – December December 31, 2011) 31, 2011) Overviewing the global economy, the harsh business environment continued during this quarter, including such factors as deterioration of the economies in Europe, a delay in economic recovery in the US, and a slowdown tendency in economic growth in emerging countries. In Japan, the economy is showing a slow recovery in Japan due to demand created by reconstruction efforts after the Great East Japan Earthquake. However, the persistence of the strong yen and deceleration in overseas economies are posing downside risks with respect to the economic outlook. The business environment was also harsh for the Fujifilm Group. Although the direct effect of the earthquake on the Group remained relatively slight, certain Group businesses were affected by strong yen appreciation; the sharp surge in raw materials prices, including silver and aluminum; the floods in Thailand; and the decline in demand due to economic deterioration in Europe. On the other hand, sales in emerging countries, such as China, are proceeding strongly.
Transcript of (April 1 – December 31, 2011)...zMedical-use picture archiving and communication systems,...
FORWARD-LOOKING STATEMENTSForward-looking statements such as those relating to earnings forecasts and other projections contained in this material are management’s current assumptions and beliefs based on currently available information. Such forward-looking statements are subject to a number of risks, uncertainties, and other factors. Accordingly, actual results may differ materially from those projected due to various factors.
FORWARD-LOOKING STATEMENTSForward-looking statements such as those relating to earnings forecasts and other projections contained in this material are management’s current assumptions and beliefs based on currently available information. Such forward-looking statements are subject to a number of risks, uncertainties, and other factors. Accordingly, actual results may differ materially from those projected due to various factors.
January 30, 2012
Earnings of 3Q FY2012/3Earnings of 3Q FY2012/3(April 1 (April 1 –– DecemberDecember 31, 2011)31, 2011)
Overviewing the global economy, the harsh business environment continued during this quarter, including such factors as deterioration of the economies in Europe, a delay in economic recovery in the US, and a slowdown tendency in economic growth in emerging countries.In Japan, the economy is showing a slow recovery in Japan due to demand created by reconstruction efforts after the Great East Japan Earthquake. However, the persistence of the strong yen and deceleration in overseas economies are posing downside risks with respect to the economic outlook.The business environment was also harsh for the Fujifilm Group. Although the direct effect of the earthquake on the Group remained relatively slight, certain Group businesses were affected by strong yen appreciation; the sharp surge in raw materials prices, including silver and aluminum; the floods in Thailand; and the decline in demand due to economic deterioration in Europe.On the other hand, sales in emerging countries, such as China, are proceeding strongly.

Performance Summary for 3Q FY2012/3Both revenue and operating income have declined due to such factors as strong yen appreciation, a
decline in demand caused by the earthquake, and the impact of floods in Thailand.
1
3Q FY2010/3(Apr. - Dec. 2009)
3Q FY2011/3(Apr. - Dec. 2010)
3Q FY2012/3(Apr. - Dec. 2011)
Change
Amount %
Revenue 100.0% 1,597.1 100.0% 1,651.7 100.0% 1,618.5 (33.2) (2.0)
Operating Income (0.2)% (2.4) 7.4% 122.5 5.3% 85.6 (36.9) (30.1)
Income before Income Taxes (0.0)% (0.7) 6.6% 109.1 3.6% 57.7 (51.4) (47.1)
Net Income Attributable to FUJIFILM Holdings
(0.4)% (7.0) 3.5% 58.4 1.5% 23.7 (34.7) (59.4)
Net Income Attributable to FUJIFILM Holdings per Share
¥(14.31) ¥119.72 ¥49.19 ¥(70.53)
Exchange Rates US$€
¥93¥133
¥87¥113
¥79¥110
¥(8)¥(3)
Billions of yen
Consolidated revenue during the third quarter of the fiscal year was ¥1,618.5 billion, down 2.0% from the same quarter of the previous year. The Group took measures such as the launch of new products and the reinforcement of sales promotion in emerging countries, but the strong yen appreciation, causing a negative impact of ¥ 40.5 billion, the decline in domestic demand due to the earthquake, and the effect of the floods in Thailand led to this decline.Excluding the impact of the yen appreciation, revenue was at the same level as in the previous year.
Operating income was ¥85.6 billion, down 30.1% from the previous year. The strong yen appreciation and the sharp surge in raw materials prices, such as silver and aluminum, had a negative impact despite the Company’s efforts for making cost cuts and expense reductions.
In addition, impairment losses on investment securities amounted to ¥17.8 billion, and income before income taxes was ¥57.7 billion, down 47.1% from the previous year.

2
Billions of yen
Raw materials prices
Exchange ratefluctuations
3Q FY2012/3(Apr.-Dec. ’11)
Analysis of Operating Income in 3Q FY2012/3(Change from previous fiscal year)
Performance Summary for 3Q FY2012/3
3Q FY2011/3(Apr.-Dec. ’10)
Decrease in sales and others
122.5
85.6-8.9
-21.2
-6.8
The strong yen appreciation caused a negative impact of ¥6.8 billion, and the sharp surge in raw materials prices, including silver and aluminum, caused a negative impact of ¥21.2 billion.

3
Imaging Solutions
Although sales of digital cameras were strong, revenue declined due to strong yen appreciation and other factors.Impact of forex: - ¥11.8 billion
¥248.8 billion (YoY: -3.3%)(excluding the impact of forex: YoY +1.3%)
RevenueRevenue
Operating IncomeOperating Income
Operating Segments
*Note: After elimination of intersegment transactions
Revenue*/Operating IncomeRevenue*/Operating Income
[ ]: Operating Margin( ): YoY Comparison
RevenueOperating Income
-¥3.8 billion (fallen to deficit)
Billions of yen
3Q FY2011/3(Apr.-Dec. ‘10)
3Q FY2012/3(Apr.-Dec. ‘11)
Despite measures for cost reductions, the yen appreciation and the sharp surge in raw materials prices, including silver and aluminum, caused the decline.
[1.4[1.4%%]]
((--3.33.3%%))
3.7
257.3248.8
-3.8
Revenue in the Imaging Solutions segment, adversely affected by strong yen appreciation and other factors, was ¥248.8 billion, down 3.3% from the previous year.As a result of sales promotions, sales of digital cameras were strong, and the market share in the photo imaging business expanded, resulting in a 1.3% increase from the previous year, excluding the negative impact of forex.
Despite cost reduction measures, operating income was affected by the strong yen appreciation and the sharp surge in raw materials prices, including silver, by ¥12.6 billion, and the segment recorded a loss of ¥3.8 billion, down ¥7.5 billion from the previous year.

4
Photo ImagingPhoto Imaging
ElectronicImaging
Operating Segments
Billions of yen
Sub-segment RevenueSub-segment Revenue
Electronic ImagingElectronic Imaging ¥93.1 billion (YoY: +2%)
%: Proportion of sub-segment revenue
Imaging Solutions
PhotoImaging
¥155.7 billion (YoY: -6%)Sales decreased due to strong yen appreciation and the impact of the earthquake.Strong sales were seen in color paper, resulting in increases in revenue and market share.
Despite the decline in overall demand, the sales volume for the third quarter of FY2012/3 reached approximately 9.5 million units, up 7% from the previous year.Sales of mid-ranged and high-end distinctive products, such as FUJIFILM X100and FinePix F600EXR, were strong. FUJIFILM X10, released in October 2011, is also showing a positive start.The target for digital camera sales volume for this year is set at 13 million units, up 16% from the previous year.
248.8
9393..11
3737%%
155155..77
6363%%
257.3
9191..44
3535%%
165165..99
6565%%
3Q FY2011/3(Apr.-Dec. ‘10)
3Q FY2012/3(Apr.-Dec. ‘11)
The condition of sub-segment businesses was as shown.
In photo imaging business, sales decreased due to strong yen appreciation and the impact of the earthquake.However, sales of color paper were strong and the market share expanded.
In electronic imaging business, sales of mid-ranged and high-end distinctive products were strong, including FUJIFILM X100and FinePix F600EXR, resulting in an increase in revenue. The FUJIFILM X100, a high-end compact digital camera, especially showed considerable sales beyond the Company’s expectations and reached the annual sales target for the first year of 0.1 million units in nine months. In addition, sales of FUJIFILM X10, released in October 2011 as a second model of the X series, are showing a positive start.Despite the overall decline in digital camera demand from the previous year, sales volume increased by approximately 7%, reaching 9.5 million units.The sales volume target for this year will be set at 13 million units, up 16% from the previous year.

5
Information SolutionsOperating Segments
*Note: After elimination of intersegment transactions
RevenueRevenue
Operating IncomeOperating Income
Revenue*/Operating IncomeRevenue*/Operating Income
Despite measures for cost reductions, operating income decreased due to such factors as the decline in sales, strong yen appreciation, and the surge in raw materials prices, including silver and aluminum.
¥646.5 billion (YoY: -3.8%)(excluding the impact of forex: YoY -0.9%)
The strong yen appreciation and the decline in demand caused by the earthquake led to a decrease in revenue of the main businesses.Sales of flat panel display materials declined compared to the previous year, when the demand was strong.Impact of forex: -¥19.2 billion
Billions of yen
[ ]: Operating Margin( ): YoY Comparison
RevenueOperating Income
¥49.8 billion (YoY: -40.6%)
49.8
((--40.640.6%)%)
[12.5[12.5%%]]
((--3.83.8%)%)
[7.7[7.7%%]]
671.8 646.5
83.8
3Q FY2011/3(Apr.-Dec. ‘10)
3Q FY2012/3(Apr.-Dec. ‘11)
Revenue in the Information Solutions segment amounted to ¥646.5 billion, down 3.8% from the previous year.This was owing to strong yen appreciation, a decline in demand caused by the earthquake, and a decrease in sales of flat panel display materials compared with the same quarter of the previous year, when the demand was strong.Excluding the impact of the forex factor, revenue would be down 0.9%, at approximately the same level as in the previous year.
Operating income of ¥49.8 billion was recorded, down 40.6% from the previous year. Although the Company took measures to reduce costs, strong yen appreciation and the sharp surge in raw materials prices, especially silver and aluminum, had a negative impact of ¥19.7 billion, while revenue in major businesses declined.

6
Medical Systems/Life SciencesMedical Systems/Life Sciences
Graphic ArtsGraphic Arts
Operating Segments
Medical Systems/ Life Sciences
GraphicArts
FPD Materials
RecordingMediaIndustrial Materials/Electronic Materials & Others
Billions of yen
FPD MaterialsFPD Materials
Sub-segment RevenueSub-segment Revenue
¥198.5 billion (YoY: +9%)
¥173.5 billion (YoY: -2%)
¥139.3 billion (YoY: -17%)
%: Proportion of sub-segment revenue
Information Solutions
Sales declined compared to the previous year, when demand for LCD TVs was strong owing to Japan’s Eco-Point system and Chinese government policies for promoting the ownership of household electronic products.
Sales decreased due to strong yen appreciation and the decline in demand caused by the earthquake.The market share of CTPs has increased due to sales promotion of environment-friendly CTPs.Jet Press 720, a next-generation inkjet digital printing system, was released in December.
Despite the yen appreciation, revenue increased owing to expansion of sales in cosmetics and pharmaceuticals.Sales of FCR PRIMA T, a low-priced/small-sized FCR, were strong.Lineups have been expanded, such as CALNEO flex, a DR that doesn’t need to be connected with X-ray producing equipment.Medical-use picture archiving and communication systems, including SYNAPSE, maintained
their top share in the domestic market.In life sciences business, the base makeup series within the ASTALIFT line were launched into the market.Sales of Zosyn* were strong in the pharmaceuticals field. Application for approval in Japan of T-705, an anti-influenza virus agent, is being submitted.
*Zosyn: Pharmaceuticals applicable to the treatment of blood poisoning, pyelonephritis, complex cystitis, and pneumonia **BaFe: Barium ferrite
Optical Devices
Industrial Materials/Electronic Materials & Others Industrial Materials/Electronic Materials & Others ¥59.9 billion (YoY: -1%)Electronic materials, such as Color Mosaic for image sensors and ArF immersion photoresists, expanded their sales.
Optical DevicesOptical Devices ¥40.0 billion (YoY: -21%)A sales decline in camera phone lenses resulted in a decrease in revenue.
646.5
3131%%
2727%%
198198..55
173173..55
139139..33
4040..005959..99 99%%
55%%
66%%
671.8
2727%%
2626%%
2525%%
183183..00
17177.67.6
168168..33
5050..66
660.50.53131..88
88%%
99%%
55%%2222%%
3Q FY2011/3(Apr.-Dec. ‘10)
3Q FY2012/3(Apr.-Dec. ‘11)
335.35.3
Recording MediaRecording Media ¥35.3 billion (YoY: +11%)Sales of data tapes using BaFe** magnetic materials and professional videotapes increased.
The condition of sub-segment businesses was as shown.
In medical systems/life sciences business, despite the yen appreciation and the decline in demand caused by the earthquake, revenue increased owing to expanding sales in life sciences business and pharmaceuticals business.In medical systems business, sales steadily increased in the modality field.As for the network system field, SYNAPSE medical-use picture archiving and communication systems continued to maintain the top share in the domestic market and are expanding their sales.In life sciences business, the base makeup series within the ASTALIFT line, a lineup of functional cosmetic products, were released.In pharmaceuticals business, sales rose considerably due to strong sales of Zosyn, Ozex, and Geninax from Toyama Chemical.
Regarding graphic arts business, sales decreased owing to the negative impact of strong yen appreciation and the decline in demand caused by the earthquake. However, CTPs increased their market share by expanding sales of environment-friendly CTPs.On the other hand, Jet Press 720, a next-generation inkjet digital printing system, was released on December 2011.In addition, a new CTP plate production line started its operation in January 2012 at FUJIFILM Manufacturing Europe in the Netherlands.
Regarding FPD materials business, a decrease in sales was seen compared with the same quarter of the previous year, when demand was strong owing to Japan’s Eco-Point system and Chinese government policies for promoting the ownership of household electric products.To meet the increasing demand of large-sized LCD TVs, the Company started an operating production line for ultra-wide film in April 2011, following the start of general operations in October 2010. Plans have been made to add two additional lines by December 2012.When the new production line becomes operational, one existing line will be turned into a dedicated line for developing productssuitable for small and medium-sized displays to further reinforce the development and production of new film products designed for tablet computers and smartphones, where demand is rapidly expanding.
As for the recording media business, sales of data backup tapes that use barium ferrite magnetic materials and professional videotapes were strong, increasing overall revenue.
As for the electronic materials business, sales expanded due to strong sales of Color Mosaic for image sensors and ArF immersion photoresists.
Regarding optical devices business, revenue decreased owing to a decline in sales of camera phone lens units.
Set up a joint venture for biosimilars with Kyowa Hakko KirinSet up a joint venture for Set up a joint venture for biosimilars biosimilars with Kyowa Hakko Kirinwith Kyowa Hakko Kirin
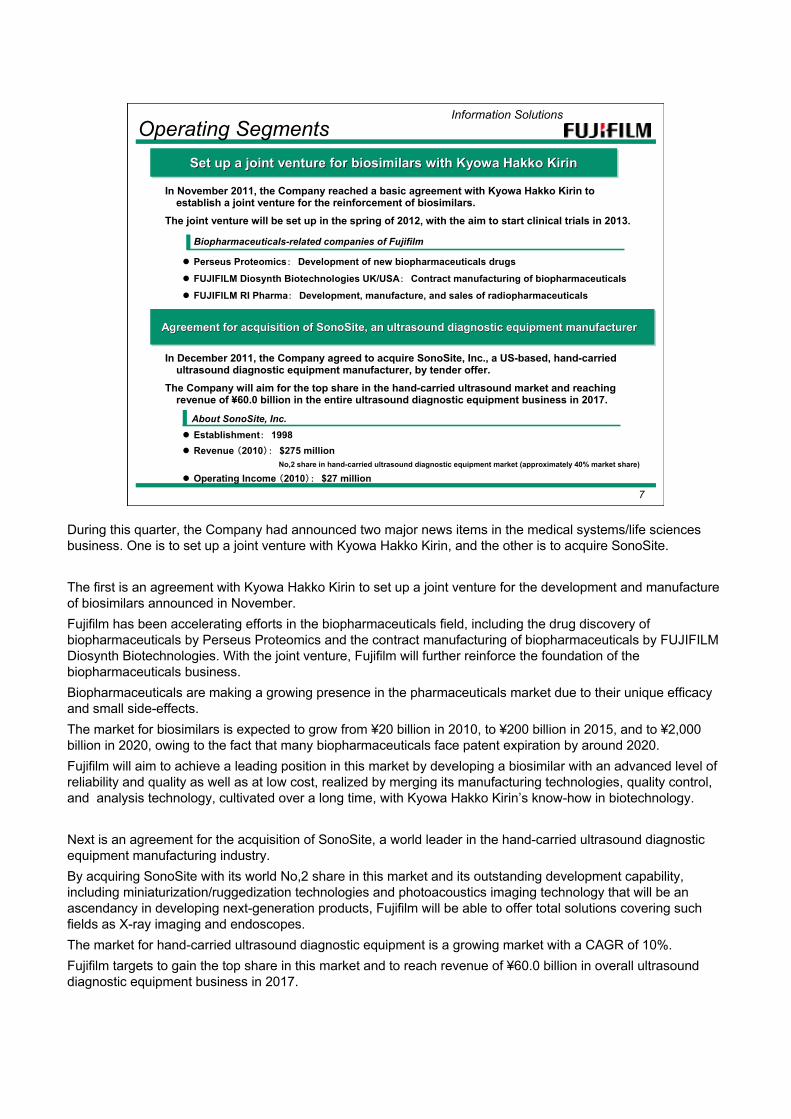
Perseus Proteomics: Development of new biopharmaceuticals drugs
FUJIFILM Diosynth Biotechnologies UK/USA: Contract manufacturing of biopharmaceuticals
FUJIFILM RI Pharma: Development, manufacture, and sales of radiopharmaceuticals
In November 2011, the Company reached a basic agreement with Kyowa Hakko Kirin to establish a joint venture for the reinforcement of biosimilars.
The joint venture will be set up in the spring of 2012, with the aim to start clinical trials in 2013.
Biopharmaceuticals-related companies of Fujifilm
Agreement for acquisition of SonoSite, an ultrasound diagnostic equipment manufacturer Agreement for acquisition of Agreement for acquisition of SonoSiteSonoSite, an ultrasound diagnostic equipment manufacturer , an ultrasound diagnostic equipment manufacturer
Establishment: 1998Revenue (2010): $275 million
No,2 share in hand-carried ultrasound diagnostic equipment market (approximately 40% market share)
Operating Income (2010): $27 million
In December 2011, the Company agreed to acquire SonoSite, Inc., a US-based, hand-carried ultrasound diagnostic equipment manufacturer, by tender offer.
The Company will aim for the top share in the hand-carried ultrasound market and reaching revenue of ¥60.0 billion in the entire ultrasound diagnostic equipment business in 2017.
About SonoSite, Inc.
Operating Segments Information Solutions
7
During this quarter, the Company had announced two major news items in the medical systems/life sciences business. One is to set up a joint venture with Kyowa Hakko Kirin, and the other is to acquire SonoSite.
The first is an agreement with Kyowa Hakko Kirin to set up a joint venture for the development and manufacture of biosimilars announced in November.Fujifilm has been accelerating efforts in the biopharmaceuticals field, including the drug discovery of biopharmaceuticals by Perseus Proteomics and the contract manufacturing of biopharmaceuticals by FUJIFILM Diosynth Biotechnologies. With the joint venture, Fujifilm will further reinforce the foundation of the biopharmaceuticals business.Biopharmaceuticals are making a growing presence in the pharmaceuticals market due to their unique efficacy and small side-effects.The market for biosimilars is expected to grow from ¥20 billion in 2010, to ¥200 billion in 2015, and to ¥2,000 billion in 2020, owing to the fact that many biopharmaceuticals face patent expiration by around 2020.Fujifilm will aim to achieve a leading position in this market by developing a biosimilar with an advanced level of reliability and quality as well as at low cost, realized by merging its manufacturing technologies, quality control, and analysis technology, cultivated over a long time, with Kyowa Hakko Kirin’s know-how in biotechnology.
Next is an agreement for the acquisition of SonoSite, a world leader in the hand-carried ultrasound diagnostic equipment manufacturing industry.By acquiring SonoSite with its world No,2 share in this market and its outstanding development capability, including miniaturization/ruggedization technologies and photoacoustics imaging technology that will be an ascendancy in developing next-generation products, Fujifilm will be able to offer total solutions covering such fields as X-ray imaging and endoscopes.The market for hand-carried ultrasound diagnostic equipment is a growing market with a CAGR of 10%.Fujifilm targets to gain the top share in this market and to reach revenue of ¥60.0 billion in overall ultrasound diagnostic equipment business in 2017.

8
Document Solutions
In spite of the negative impact of the earthquake and the floods in Thailand, an increase in revenue was recorded owing to continuous growth in the Asia-Oceania region. Impact of forex : -¥9.5 billion
Although some costs were used for the impact of the earthquake and the floods in Thailand, operating income increased owing to continuous improvement in productivity and development efficiency.
Operating Segments
¥723.2 billion (YoY: +0.1%)(excluding the impact of forex: YoY +1.4%)
*Note: After elimination of intersegment transactions
RevenueRevenue
Operating IncomeOperating Income
Revenue*/Operating IncomeRevenue*/Operating Income
Billions of yen
[ ]: Operating Margin( ): YoY Comparison
RevenueOperating Income
¥61.3 billion (YoY: +10.4%)
3Q FY2011/3(Apr.-Dec. ‘10)
3Q FY2012/3(Apr.-Dec. ‘11)
[[7.67.6%%]]
((++0.10.1%)%)722.6723.2
55.6
61.3
((++10.410.4%)%)[8.4[8.4%%]]
In the Document Solutions segment, revenue amounted to ¥723.2 billion, almost the same level as in the previous year.This reflected such factors as a second quarter recovery from the first quarter impact of the earthquake, strong sales in the Asia-Oceania region, and the negative impact of the strong yen and the floods in Thailand.Despite costs for the impact of the earthquake and the floods in Thailand, operating income of ¥61.3 billion was recorded, up 10.4% from the previous year, by taking measures to improve cost efficiency.

9
In Japan, sales volume of color products increased.In the Asia-Oceania region, sales volume of both color and monochrome products increased. As for Xerox Corporation, the shipment volume increased due to considerable growth in color products.
Operating Segments
OfficeProducts
OfficePrinters
ProductionServices
GlobalServices
Billions of yen
Office ProductsOffice Products
Office PrintersOffice Printers
Production ServicesProduction Services
Global ServicesGlobal Services
Sales volume increased in Japan due to the effect of new products.In the Asia-Oceania region, although sales volume of color products increased, a decrease in monochrome product sales led to a decline in sales as a whole.
Sales volume in Japan increased, reflecting growth in sales of light production color systems and entry production color systems.In the Asia-Oceania region, strong sales of entry production color systems led to an increase in overall sales volume.
Sub-segment RevenueSub-segment Revenue
%: Proportion of sub-segment revenue
¥379.2 billion (YoY: flat)
¥117.7 billion (YoY: -6%)
¥94.3 billion (YoY: -2%)
¥69.9 billion (YoY: +10%)
Document Solutions
Considerable growth was achieved in the Asia-Oceania region, leading to an increase in revenue. The Enterprise Print Service, which comprehensively manages the companies’ whole output operations, was started up in Japan and the Asia-Oceania region.3Q FY2011/3
(Apr.-Dec. ‘10)3Q FY2012/3(Apr.-Dec. ‘11)
5252%%
1717%%
1313%%
99%%
722.6
378378..55
124124..66
9696..11
6363..77
379379..22
117117..77
5252%%
1616%%
9494.3.31313%%
6969..991010%%
723.2
The condition of sub-segment businesses was as shown.
In office products business, strong sales of the ApeosPort-Ⅳ/DocuCentre-Ⅳ series led to an increase in sales volume in Japan for both color and monochrome products.Copy volume that declined after the earthquake increased from the second quarter, and the overall copy volume grew compared to the previous year.Sales volume in the Asia-Oceania region and the shipment volume for Xerox Corporation also increased.
In office printers business, the sales volume in Japan increased due to the launch of new products.As for the Asia-Oceania region, although sales volume of color products increased, a decrease in sales volume of monochrome products caused a decrease in total sales volume.
With respect to the production services business, strong sales were recorded of the Color 1000 Press/Color 800 Press and DocuColor 1450 GA light production color systems in Japan. In the Asia-Oceania region, sales volume also increased.
With respect to the global services business, a large increase in the Asia-Oceania region led to an increase in revenue.In addition, from July 2011, the Company began providing its Enterprise Print Service, which offers comprehensive management of the companies’ whole output operations.

10
54.0
107.5
136.5
2,290.0
¥78¥109
¥35
¥112.10
2.4%
4.7%
6.0%
100.0%
FY2012/3Forecast
(announced in October)
+¥5¥35¥30Cash Dividends per Share
¥(8)¥(6)
¥78¥107
¥86¥113
Exchange Rates US$€
FY2011/3Actual
FY2012/3Forecast(latest)
Change from the previous year
Amount %
Revenue 100.0% 2,217.1 100.0% 2,200.0 (17.1) (0.8)
Operating Income 6.2% 136.4 5.0% 110.0 (26.4) (19.3)
Income before Income Taxes 5.3% 117.1 3.5% 78.0 (39.1) (33.4)
Net Income Attributable to FUJIFILM Holdings
2.9% 63.9 1.3% 28.0 (35.9) (56.1)
Net Income Attributable to FUJIFILM Holdingsper Share
¥131.30 ¥58.13 ¥(73.17)
Revised Consolidated Financial Forecast for FY2012/3
Forecast
Billions of yen
Impact of exchange rate movements on operating income (full year, ¥1 change) US$: ¥1.1 billion €: ¥0.7 billion
The Company suffered such negative impacts as the strong yen appreciation, sharp surge in raw material prices, deterioration of economies in Europe, and the floods in Thailand.Although the Japanese economy as a whole is slowly improving, there are little possibility that this severe business environment will rapidly improve.
As for the priority business fields, Fujifilm is working to expand products with high competitiveness in the market and to reinforce sales in emerging countries.However, under this severe business environment, business is proceeding under its plan.On this basis, the Company has revised downward the forecast for FY2012/3. The revenue will be set to ¥2,200.0 billion, down 0.8% from the previous year, and the operating income will be ¥110.0 billion, down 19.3% from the previous year.
The projected currency exchange rates for the U.S. dollar and euro against the yen are ¥77 and ¥98.

IR Office, Corporate Planning Div.
We will use leading-edge, proprietary technologies to provide top-quality products and services that contribute to the advancement of culture, science, technology and industry, as well as improved health and environmental protection in society. Our overarching aim is to help enhance the quality of life of people worldwide.
Note: This document is a faithful translation into English of a financial condition-related report prepared in Japanese by FUJIFILM Holdings Corporation in accordance with Tokyo Stock Exchange guidelines.Accordingly, the explanations for each business segment may include references to products that are marketed under different product names overseas or are not marketed overseas and may also include references to product marketing periods that differ by region. “Xerox” is a registered trademark of Xerox Corporation in the U.S. and other countries. All other product names contained in this material are trademarks of their respective companies.
http://www.fujifilmholdings.com/en/index.html

¥90¥133
¥(3.24)
(0.3)%
1.3%
1.1%
100.0%
3Q FY2010/3(Oct.’09-Dec.’09)
(1.6)
7.2
6.2
553.6
3Q FY2011/3(Oct.’10-Dec.’10)
3Q FY2012/3(Oct.’11-Dec.’11)
Change from the previous fiscal year
Amount %
Revenue 100.0% 546.4 100.0% 535.1 (11.3) (2.1)
Operating Income6.7% 36.6 5.0% 26.6 (10.0) (27.5)
Income Before Income Taxes5.9% 32.1 4.7% 25.0 (7.1) (22.4)
Net Income Attributable to FUJIFILM Holdings 3.3% 18.1 1.6% 8.8 (9.3) (51.4)
Net Income Attributable to FUJIFILM Holdings per Share
¥37.23 ¥18.26 ¥(18.97)Exchange Rates US$€
¥83¥112
¥77¥104
¥(6)¥(8)
Performance Summary for 3Q FY2012/3Appendix
12
Billions of yen

2010年度3Q 2011年度3Q
AppendixImaging Solutions
Revenue* /Operating Income (3Months)Revenue* /Operating Income (3Months)
Billions of yen
YoY
Sub-segment Revenue (3Months)Sub-segment Revenue (3Months)
%: Proportion of sub-segment revenue
Billions of yen
[ ]: Operating Margin( ): YoY Comparison
RevenueOperating Income
3Q FY2012/3(Oct.-Dec. ‘11)
3Q FY2011/3(Oct.-Dec. ‘10)
ElectronicImaging
PhotoImaging
*Note: After elimination of intersegment transaction 13
3Q FY2012/3(Oct.-Dec. ‘11)
3Q FY2011/3(Oct.-Dec. ‘10)
((--5.35.3%)%)91.2 86.4
-0.1
[3.8[3.8%%]]3.4
91.2
3232..66-3%
3737%%
86.4
3131..77
3636%%
-7%5858..66
6464%%
5454..66
6363%%

RevenueOperating Income
AppendixInformation Solutions
Billions of yen%: Proportion of sub-segment revenue
Billions of yen
[ ]: Operating Margin( ): YoY Comparison
Medical Systems/ Life Sciences
GraphicArts
FPD Materials
RecordingMedia
Optical Devices
YoY
*Note: After elimination of intersegment transaction 14
Revenue* /Operating Income (3Months)Revenue* /Operating Income (3Months) Sub-segment Revenue (3Months)Sub-segment Revenue (3Months)
3Q FY2012/3(Oct.-Dec. ‘11)
3Q FY2011/3(Oct.-Dec. ‘10)
3Q FY2012/3(Oct.-Dec. ‘11)3Q FY2011/3
(Oct.-Dec. ‘10)
((--1.01.0%)%)213.6211.6
16.1
((--29.329.3%)%)[[7.67.6%%]]
[10.6[10.6%%]]22.8
211.6
3131%%
2626%%
2222%%
6464..77
5656..11
4646..55
1212..551919..99
213.6
2727%%
2828%%
2424%%
5858..33
5858..66
5050..33
1515..662020..001010..88
99%%
+11%
-4%
-8%
+10%
-1%
-20%
66%%
66%%77%%
99%%
55%% 1111..99Industrial Materials/Electronic Materials & Others

1515
Document Solutions
*Note: After elimination of intersegment transaction
Billions of yen
Appendix
YoY
%: Proportion of sub-segment revenue
Billions of yen
[ ]: Operating Margin( ): YoY Comparison
RevenueOperating Income
OfficeProducts
OfficePrinters
ProductionServices
GlobalServices
Revenue* /Operating Income (3Months)Revenue* /Operating Income (3Months) Sub-segment Revenue (3Months)Sub-segment Revenue (3Months)
3Q FY2012/3(Oct.-Dec. ‘11)
3Q FY2011/3(Oct.-Dec. ‘10)
3Q FY2012/3(Oct.-Dec. ‘11)
3Q FY2011/3(Oct.-Dec. ‘10)
((--1.81.8%)%)241.6237.1
17.6
((+3.1+3.1%)%)[[7.47.4%%]]
[7.0[7.0%%]]17.1
5252%%
1717%%
1313%%
99%%
241.6
126126..66
4040..66
3131..88
2222..77
124124..66
3939..00
5353%%
1717%%
2929..551212%%
2323..551010%%
237.1
-2%
-4%
-7%
+4%

3Q FY’11/3 3Q FY’12/3
Ratio(%)
9 Months Ratio(%)
9 MonthsY o Y
Change (%)
Domestic 45.8 757.0 45.1 729.7 (3.6)
The Americas 17.1 282.5 17.1 276.7 (2.0)
Europe 11.8 194.7 12.3 199.9 +2.6
China 7.8 129.0 9.4 151.5 +17.4
Asia and others 25.3 417.5 25.5 412.2 (1.3)
Overseas 54.2 894.7 54.9 888.8 (0.7)
Consolidated total 100.0 1,651.7 100.0 1,618.5 (2.0)
AppendixRevenue from Domestic and Overseas
16
Billions of yen

135.1
195.1
21.999.173.6
0.5
77.9
9.128.540.3
0.0
98.0
143.7
16.273.853.3
0.4
51.0
6.320.324.4
0.0
9Months
34.8
50.0
4.825.319.7
0.2
10.4
2.25.03.20.0
3Q
FY2010/3
106.6
157.1
10.177.465.8
3.8
89.9
8.161.819.5
0.5
77.0
115.0
7.155.449.7
2.8
59.5
5.641.211.1
1.6
9Months
FY2011/3
25.9
38.3
2.218.816.3
1.0
23.1
1.617.9
2.90.7
3Q
7.255.043.3
2.4
2.518.815.4
0.8
ImagingInformationDocumentCorporate
5.644.511.1
2.0
2.311.1
3.60.6
ImagingInformationDocumentCorporate
24.3
37.5
17.6
3Q
100.069.5Depreciation*150.0107.9
Depreciation&Amortization
100.063.2Capex *
(plan)9Months
FY2012/3
■■ Capital Expenditure , , Depreciation & Amortization
Appendix
Billions of yen
*Note: Figures do not include amounts for rental equipment handled by the Document Solutions segment.
17
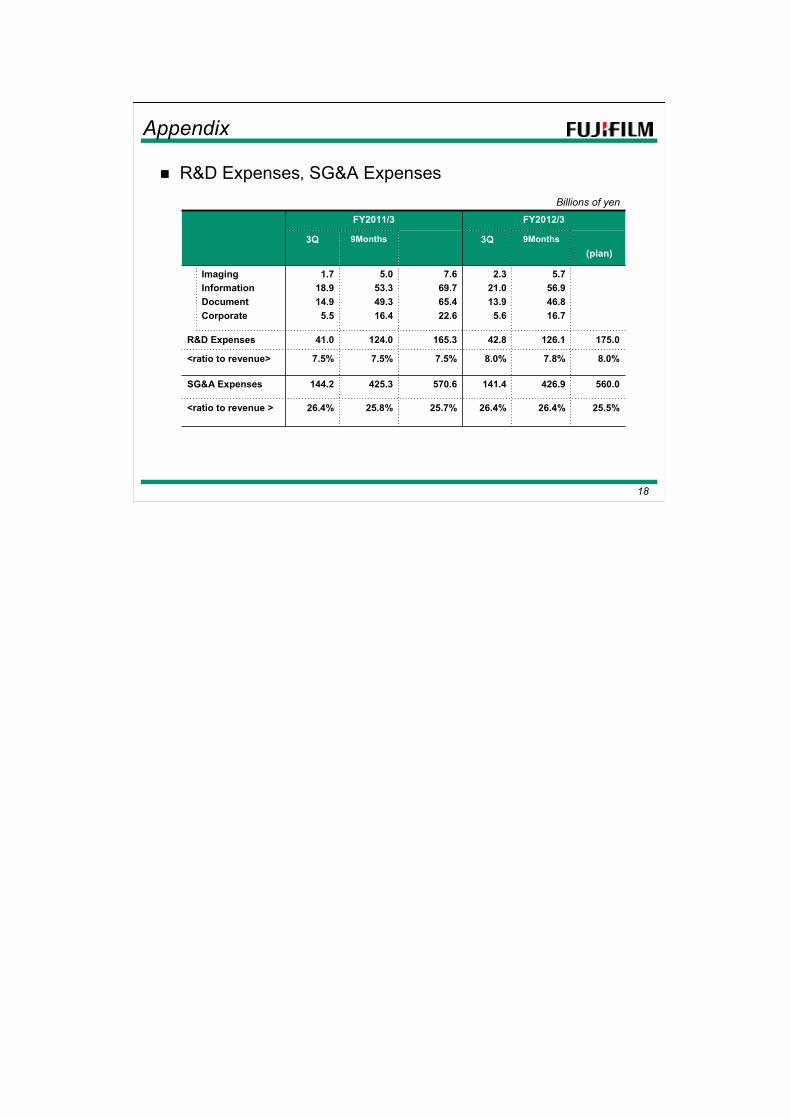
25.7%
570.6
7.5%
165.3
7.669.765.422.6
25.8%
425.3
7.5%
124.0
5.053.349.316.4
9Months
FY2011/3
26.4%
144.2
7.5%
41.0
1.718.914.9
5.5
3Q
8.0%7.8%8.0%<ratio to revenue>
5.756.946.816.7
2.321.013.9
5.6
ImagingInformationDocumentCorporate
26.4%
141.4
42.8
3Q
25.5%26.4%<ratio to revenue >
560.0426.9SG&A Expenses
175.0126.1R&D Expenses
(plan)9Months
FY2012/3
R&D Expenses, , SG&A Expenses
Appendix
Billions of yen
18
19
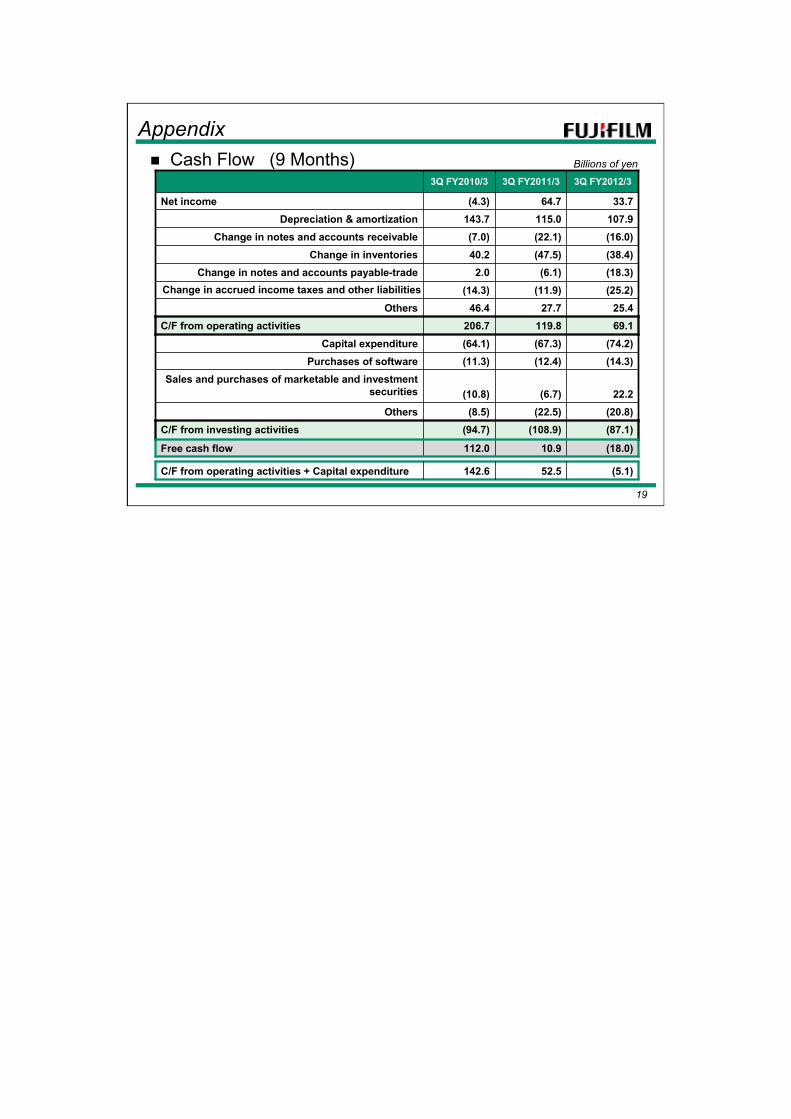
AppendixCash Flow (9 Months)
(14.3)(12.4)(11.3)Purchases of software
(87.1)(108.9)(94.7)C/F from investing activities
(18.0)10.9112.0Free cash flow
(20.8)(22.5)(8.5)Others22.2(6.7)(10.8)
Sales and purchases of marketable and investment securities
(74.2)(67.3)(64.1)Capital expenditure69.1119.8206.7C/F from operating activities25.427.746.4Others
(25.2)(11.9)(14.3)Change in accrued income taxes and other liabilities(18.3)(6.1)2.0Change in notes and accounts payable-trade(38.4)(47.5)40.2Change in inventories(16.0)(22.1)(7.0)Change in notes and accounts receivable107.9115.0143.7Depreciation & amortization33.764.7(4.3)Net income
3Q FY2012/33Q FY2011/33Q FY2010/3
(5.1)52.5142.6C/F from operating activities + Capital expenditure
Billions of yen

Balance SheetAppendix
Billions of yen
Mar.’10 Mar.’11 Dec.’11
Cash and cash equivalents 406.2 313.1 248.5Notes and accounts receivable 495.0 502.2 499.8
Inventories 303.1 342.2 371.8Marketable securities and other 206.2 153.3 163.1
Total current assets 1,410.5 1,310.8 1,283.2Property, plant and equipment 601.7 564.1 543.4
Goodwill, net 325.9 344.4 334.9Investment securities and other 489.3 489.5 428.3Total noncurrentassets 1,416.9 1,398.0 1,306.6
Total assets 2,827.4 2,708.8 2,589.8
Mar.’10 Mar.’11 Dec.’11
Short-term and long-term debt 295.6 189.6 172.8Notes and accounts payable 261.6 261.4 231.4
Other liabilities 394.4 406.9 357.2
Total liabilities 951.6 857.9 761.4Total FUJIFILM Holdings shareholders' equity 1,746.1 1,722.5 1,696.9
Noncontrolling interests 129.7 128.4 131.5
Total equity 1,875.8 1,850.9 1,828.4
Total liabilities and equity 2,827.4 2,708.8 2,589.8
Exchange rates Mar.’10 Mar.’11 Dec.’11US$ 93 83 78Euro 125 118 101
yen
20
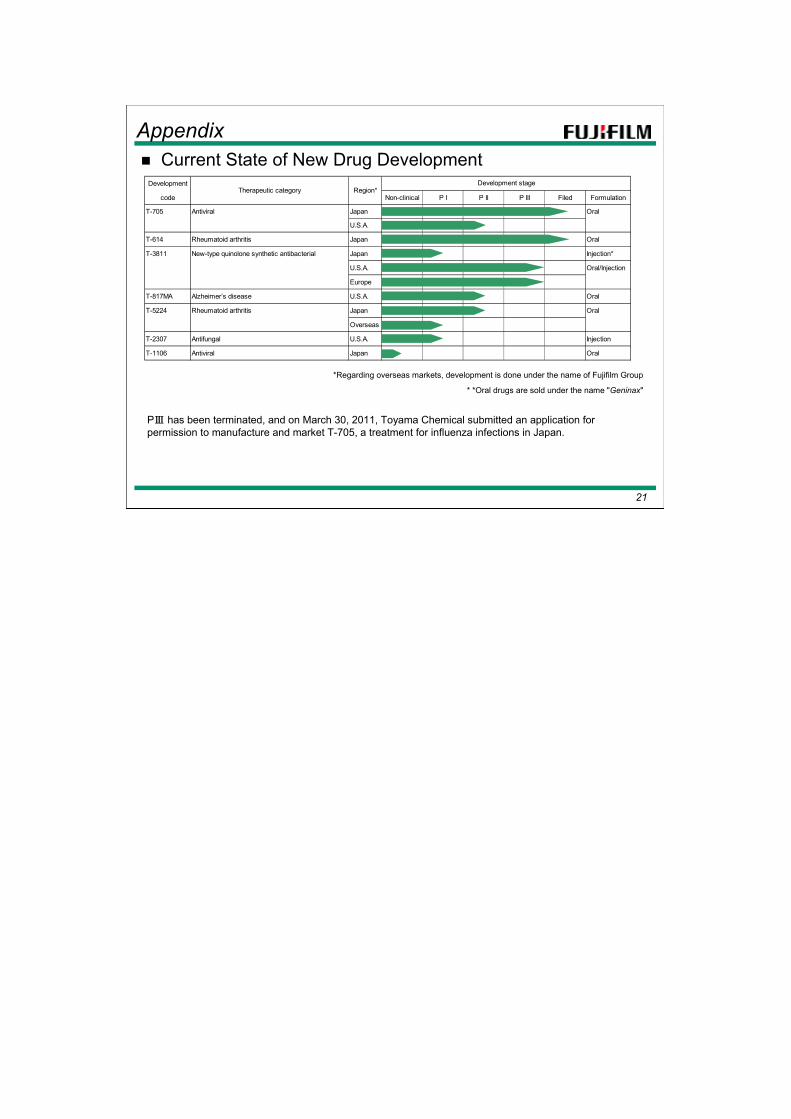
Development
code Non-clinical P I P II P III Filed Formulation
T-705 Antiviral Japan Oral
U.S.A.
T-614 Rheumatoid arthritis Japan Oral
T-3811 New-type quinolone synthetic antibacterial Japan Injection*
U.S.A. Oral/Injection
Europe
T-817MA Alzheimer’s disease U.S.A. Oral
T-5224 Rheumatoid arthritis Japan Oral
Overseas
T-2307 Antifungal U.S.A. Injection
T-1106 Antiviral Japan Oral
Therapeutic category Region*Development stage
21
AppendixCurrent State of New Drug Development
* *Oral drugs are sold under the name "Geninax"
*Regarding overseas markets, development is done under the name of Fujifilm Group
PⅢ has been terminated, and on March 30, 2011, Toyama Chemical submitted an application for permission to manufacture and market T-705, a treatment for influenza infections in Japan.

22
Exchange Rates
Number of Employees
Appendix
Dec. 2010 Mar. 2011 Jun. 2011 Sep. 2011 Dec. 2011
Consolidated Total 78,177 78,862 79,367 81,387 81,316
Yen
Sensitivity of Currency (full year, ¥1 change)Operating
incomeUS$ 1.1Euro 0.7
Billions of yen
107
78
(plan)
110
79
113
87
104
77
3Q
9 Months9 Months
110
78
2Q
FY2011/3 FY2012/3
1Q 2Q 3Q 1Q 4Q(plan)
US$ 92 86 83 86 82 77
Euro 117 111 112 113 117 98

IR Office, Corporate Planning Div.
We will use leading-edge, proprietary technologies to provide top-quality products and services that contribute to the advancement of culture, science, technology and industry, as well as improved health and environmental protection in society. Our overarching aim is to help enhance the quality of life of people worldwide.
Note: This document is a faithful translation into English of a financial condition-related report prepared in Japanese by FUJIFILM Holdings Corporation.Accordingly, the explanations for each business segment may include references to products that are marketed under different product names overseas or are not marketed overseas and may also include references to product marketing periods that differ by region. “Xerox” is a registered trademark of Xerox Corporation in the U.S. and other countries. All other product names contained in this material are trademarks of their respective companies.