
Apresentação do PowerPoint › mz-filemanager › cecb3d3e-6bd6-4edd-b… · EXECUTIVE SUMMARY...
29
1 CORPORATE PRESENTATION AUGUST 2019
Transcript of Apresentação do PowerPoint › mz-filemanager › cecb3d3e-6bd6-4edd-b… · EXECUTIVE SUMMARY...

1
CORPORATE PRESENTATIONAUGUST 2019

DISCLAIMER
2
This presentation contains forward-looking statements. All statements other than statements of historical fact contained in this presentation are forward-looking statements, including, without limitation, statements regarding our drilling and seismic plans, operating costs, acquisition of equipment,expectations of finding oil, the quality of oil we expect to produce and our other plans and objectives. Readers can identify many of these statements bylooking for words such as “expects”, “believe”, “hope” and “will” and similar words or the negative thereof. Although management believes that theexpectations represented in such forward-looking statements are reasonable, there can be no assurance that such expectations will prove to be correct. Bytheir nature, forward-looking statements require us to make assumptions and, accordingly, forward-looking statements are subject to inherent risks anduncertainties. We caution readers of this presentation not to place undue reliance on our forward-looking statements because a number of factors maycause actual future circumstances, results, conditions, actions or events to differ materially from the plans, expectations, estimates or intentions expressedin the forward-looking statements and the assumptions underlying the forward-looking statements.
The following risk factors could affect our operations: the contingent resource and prospective resource evaluation reports involving a significant degree ofuncertainty and being based on projections that may not prove to be accurate; inherent risks to the exploration and production of oil and natural gas;limited operating history as an oil and natural gas exploration and production company; drilling and other operational hazards; breakdown or failure ofequipment or processes; contractor or operator errors; non-performance by third-party contractors; labour disputes, disruptions or declines in productivity;increases in materials or labour costs; inability to attract sufficient labour; requirements for significant capital investment and maintenance expenseswhich PetroRio may not be able to finance; cost overruns and delays; exposure to fluctuations in currency and commodity prices; political and economicconditions in Brazil; complex laws that can affect the cost, manner or feasibility of doing business; environmental, safety and health regulation which maybecome stricter in the future and lead to an increase in liabilities and capital expenditures, including indemnity and penalties for environmental damage;early termination, non-renewal and other similar provisions in concession contracts; and competition. We caution that this list of factors is not exhaustiveand that, when relying on forward-looking statements to make decisions, investors and others should also carefully consider other uncertainties andpotential events. The forward-looking statements herein are made based on the assumption that our plans and operations will not be affected by suchrisks, but that, if our plans and operations are affected by such risks, the forward-looking statements may become inaccurate.
The forward-looking statements contained herein are expressly qualified in their entirety by this cautionary statement. The forward-looking statementsincluded in this presentation are made as of the date of this presentation. Except as required by applicable securities laws, we do not undertake to updatesuch forward-looking statements.

Revenue R$ 357 million R$ 687 million
EBITDA R$ 101 million R$ 265 million
Net profits R$ 73 million R$ 116 million
Enterprise Value R$ 443 million R$ 2.9 billion
FZA-M-539
Manati
EXECUTIVE SUMMARY
FZA-M-254
FradePolvo
• Well positioned to attract capital (Leverage potential;Governance level “Novo Mercado”; Reporting Issuer in Canada)
• Experienced technical team – Qualifcation as an A-Operatorgranted by ANP
• Successful track record in Polvo Field: replicated at Frade Fieldand new projects
• PetroRio seeks to generate value in operating fields via costreduction and operational efficiency
CE-M-715
¹ In boed. Proportional to stake in asset
3
M&A Timeline
The largest independent Oil and Gas producer in brazil
Assets
Field Stake Prod.¹
POLVO 100% 8,000
MANATI 10% 2,900
FRADE 70% 13,700
FZA-M-254 100% -
FZA-M-539 100% -
CE-M-715 50% -
Financial Highlights
1H18 1H19

ASSETS OVERVIEW
1- D&M Certification Report - 31/12/20182- August/19
3- Company estimates
4- Proportional to PetroRio’s interest (100% Polvo ; 70% Frade ; 10% Manati)
4
Frade Polvo Manati PetroRio
Operator PetroRio PetroRio Petrobras -
Working Interest 70% 100% 10% -
1P Reserves (MMboe) (1) (4) 40,627 14,147 3,140 57,914
2P Reserves (MMboe) (1) (4) 63,463 20,548 3,277 87,288
Production (boepd) (2) (4) 13,700 8,000 2,900 24,600
Water Depth 1300m 100m 80m -
Capex per new well (3) US$ 75M US$ 15M - -
% of total production 55.7% 32.5% 11.8% -
Fluids processing capacity (Mbpd) 100,000 90,000 - 190,000
Processing capacity utilization 44.0% 60.0% - 51.6%
Storage capacity (Mbbl) 1,000,000 800,000 - 1,800,000
FPSO fuel 100% gas25% gas
75% diesel- -
Abandonment Forecast (1P) (1) 2032 2025 2025 -

POTENTIAL TO CREATE VALUE
5

Polvo’s estimated decommisioningTimeline (1P)
PETRORIO BUSINESS MODEL
• Significant cost reduction (60%) compared to the previous Operator
• Lean Overhead
Polvo’s Operational Cost - USD MM
• Meticulous reservoir management, extending the asset’s useful life
• Interventions and drillings
• Increased operational efficiency to98%
• Assets seen as “small” by Majorsreceive special attention fromPetroRio
FOCUSCOST REDUCTION 31 2
6
ENHANCED OIL RECOVERY
2017
2020
2022
2023
2023
2025
2013
2014
2015
2016
2017
2018
6
240
102
2013 (BP) 2018 (PetroRio)
- 60%
+8

431
118.8
94.585.0
30.1 24.2 24.0 17.2 11.9 10.5 9.8 8.3 6.4 6.4 5.9 3.2 1.5 0.6
DELIVERING GROWTH
Adding reserves at attractive prices, creatingvalue through acquisitons and investments
Greater representation in Brazilian production
Replacing reserves above the annual productionlevel
2- The Reserve Replacement Ratio divides the added reserves amount by the volume produced in the period
US$/added bbl (1P) EV/bbl (1P)
Reserve Replacement Ratio2
Oil Production Ranking (Mbbl/day)
7
Source: ANP, Monthly Production Bulletin, July 2019
1- Third-party acquisitions taken place in 2019
127%156%
437%
2017 2018 2019e
$13.97
PetroRioJun19
3,8x
3 – 70% interest in Frade

INDICATORS DEVELOPMENT
Decrease in Lifting cost mainly due to theincorporation of Frade’s production andsynergies between Frade and Polvo
Higher EBITDA per barrel puts PetroRio at the same level as the market’s benchmark
Lifting Cost PetroRio (US$/bbl)
EBITDA* per Barrel (US$/boe)
8
30.7 30.7 32.0
40.144.2
34.0
26.630.6 30.8
24.0
1T17 2T17 3T17 4T17 1T18 2T18 3T18 4T18 1T19 2T19
0.1
6.58.0
11.5
4.8
24.127.2
13.1 12.9
30.9
1T17 2T17 3T17 4T17 1T18 2T18 3T18 4T18 1T19 2T19
1Q17 2Q17 3Q17 4Q17 1Q18 2Q18 3Q18 4Q18 1Q19 2Q19
1Q17 2Q17 3Q17 4Q17 1Q18 2Q18 3Q18 4Q18 1Q19 2Q19

MARKET OPPORTUNITIES
Nearly 500 Mbbl per day from fields producing below 50 Mbbl per day, the Company’s M&A niche
Regulatory scenario encourages Petrobras to reduce its participation in Brazilian production, making room for new players and acquisitions
Production per field (Mbbl/d) Total Production - Brazil (Mbbl/d)
9
Split between over 250 fields
799
242 233 191 146 14284 68 63 61 51
477
Source: ANP, Monthly Production Bulletin, July 2019Source: ANP, Monthly Production Bulletin, July 2019
2,420 2,328 2,306 2,250 2,494 2,565 2,672 2,532 2,512 2,636
30193 199 260
311477 489 781 778 671
2010 2011 2012 2013 2014 2015 2016 2017 2018 2019*
Petrobras Other Producers

FRADE FIELD70% PETRORIO
10

13,700bbl/d
99.1%Operational Efficiency
2020 DrillingCampaign
11

17,438 17,123 16,88220,548 19,023 18,897
98.6% 99.0% 98.3% 96.4% 95.6%99.1%
1T18 2T18 3T18 4T18 1T19 2T19
Average Daily Production Operational Efficiency
OPERATIONAL EFFICIENCY
Short-term (3 months)
1) Gas injection (bullhead)
2) Reopening wells- Hydrate- Fine solids
Medium-term (6 months)
3) Water Shutoff
4) Wells stimulation
Measures to reduce natural decline in 2019
Average Daily Production and Operational EfficiencyFrade Field (100%)
12
19,956 19,191 19,214 18,884 19,006 18,978
jan/19 fev/19 mar/19 abr/19 mai/19 jun/191Q18 2Q18 3Q18 4Q18 1Q19 2Q19 jan/19 feb/19 mar/19 apr/19 may/19 jun/19
Average Daily Production – Frade Field (100%)

Short-term reductions: low effort, high impact
*Ongoing
SHORT-TERM: COST REDUCTIONS
Leaner Operation and Management
due to gains in efficiency
Payroll incorporated to PetroRio’s
Chevron International overhead reduction
Maintenance contracts renegotiation*
Materials and inventory reductions*
Logistics Synergies with
Polvo
Shared Logistics with Polvo:
Helicopter1 supply base3 supply boats
Supply boats consumption reduction
13

Phased drillings
Cost per well between US$ 65 MM and U$S 85 MM
MEDIUM-TERM: 2020 DRILLING CAMPAIGN
Global project – 4 producers and 3 injectors
Current producers
Current injectors (disabled)
Scheduled producers
Scheduled injectors
ODP1
ODP4ODIJ
N5I1
N5P1
UPP1
ODP3
MDP1
OUP3
MDP2
MUP5
MUP6
MUP3
MUP2
MUI2
OUP2
MUP2
OUP1 OUI2OUI3
N5I2
OUI1
= 1st phase (3 wells)
FRADE’S REVITALIZATION
14

POLVO FIELD100% PETRORIO
15

8,000bbl/d
97.6%Operational Efficiency
2019 DrillingCampaign

OVERVIEW POLVO FIELD - 100% PETRORIO
Proved (1P)
Proved + Probable (2P)
Proved + Probable + Possible(3P)
14.1
20.5
30.1
POLVO FIELD’S RESERVES OIL (million bbl)
Source: D&M Certification Report – 12/2018
Campos Basin
Export Destination
Polvo field
Reserves
17
• Close to Cabo Frio• Area: 134.24 km² • Depth: 92 - 180m

Drilling duration: 2 months for each well
Total cost: between US$ 30 MM and US$ 60 MM
18 prospects remaining for future Drilling
Campaigns
REVITALIZATION PLANPHASE 3
2019 DRILLING CAMPAIGN
18

MANATI NATURAL GAS FIELD10% PETRORIO
19

2,900boe/d
Steady and predictable cash-flow
“Take-or-pay” contract with Petrobras
Project EBITDA margin: ~70%

Natural Gas Producing Field
MANATI FIELD
Located in the Camamu-Almada basin, 65km from Salvador, Bahia
Referentes à Participação de 10% da PetroRio no Consórcio
2 year payback and IRR of 66%
-76
-11
4949
88118
138155
2017 2018 2019 2020 2021 2022 2023
21
Proved reserves of 3 million boe (net to Petrorio’s 10% stake)
“Take-or-pay” contract makes Company’s cash flow predictable
Manati Cumulative Cash Flow(R$ millions)

EXPLORATORY ASSETS
• Oil asset
• Ongoing studies for potential assessment and drilling campaign
Pirapema/FZA-M-539 (100% PetroRio)
FZA-M-254 (100% PetroRio)
CE-M-715 (50% PetroRio)
22
• Natural Gas Discovery in Foz do Amazonas basin
• Two drilled wells
• Gas reserves estimates of up to 18 Bm³ expandable to 28 Bm³
• Depth: 130m
• Oil asset
• Ongoing studies for potential assessment and drilling campaign

FUNDING THE EXPANSION
23

FUNDING
24
Vendor Finance (Chevron)US$ 224 million2 year termLibor + 3% p.a.Paying for the asset using its own cash flow with vendor finance
PPE (ICBC)US$ 60 million4 year termLibor + 3% p.a.Guarantees Polvoproduction sales to PetroChina
FinepR$ 90 million2.5 year grace period10 year termTJLP + 1.5% p.a.
True Sale (Safra)2 month termLibor + 1.95% p.a.Receivables pre-payment
Loans and Funding(R$ thousand)
870,5
231,1
36,2 103,5
50,4
Vendor Finance (Chevron)
PPE (ICBC)
Finep
True Sale (Safra)
Others (Short Term)85%
3% 8%
4%
Libor + 3% p.a.
TJLP + 1.5% p.a.
Libor + 1.95% p.a.
Others (Short Term)

FUNDING
Loans and Funding(R$ thousand)
Vendor Finance (Chevron)US$ 224 million2 year termLibor + 3% p.a.Paying for the asset using its own cash flow with vendor finance
PPE (ICBC)US$ 60 million4 year termLibor + 3% p.a.Guarantees Polvoproduction sales to PetroChina
FinepR$ 90 million2.5 year grace period10 year termTJLP + 1.5% p.a.
True Sale (Safra)2 month termLibor + 1.95% p.a.Receivables pre-payment
25
< 12 months 2nd year 3rd year 4th year > 5 years
Amortization ScheduleOthers (Short Term)
True Sale (Safra)
Finep
PPE (ICBC)
Vendor Finance(Chevron)
R$ MM624.3
27.7
567
27.744.995%
5%
US$
R$

DELEVERAGING
1.5x net debt/EBITDA leverage takes into account all of the debt incurred with Frade acquisition, but only includes 2Q19 of Frade’s numbers. New cash-generating capacity makes room for finance continued growth
-455 -491 -498 -530
1,001
7143.3X
1.5X
Net Debt Net Debt / Adj. EBITDA ex-IFRS 16
3Q182Q181Q18
Net Debt/LTM EBITDA
26
1Q19 2Q194Q18

Investor Relations
Praia de Botafogo, 37022250-040 Rio de Janeiro/RJ, Brasil
+55 21 3721 2129
ri.petroriosa.com.br
CONTATO
27
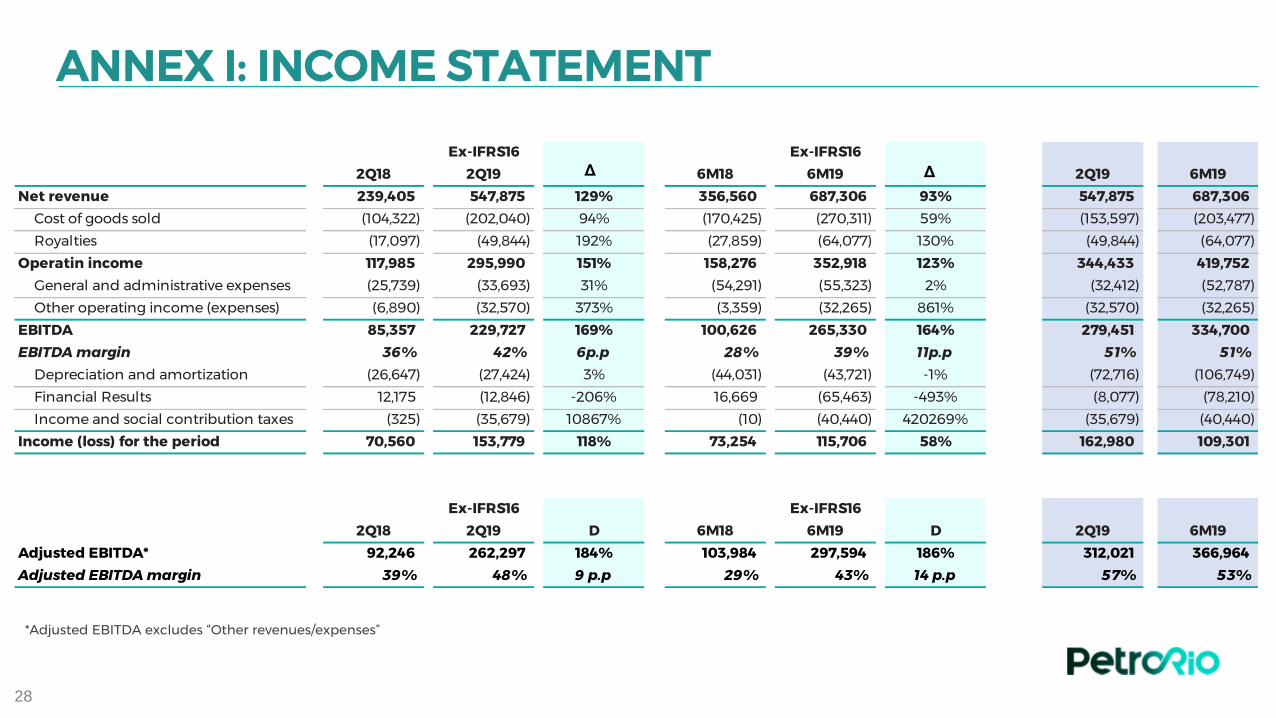
ANNEX I: INCOME STATEMENT
28
Ex-IFRS16 Ex-IFRS16
2Q18 2Q19 D 6M18 6M19 D 2Q19 6M19
Net revenue 239,405 547,875 129% 356,560 687,306 93% 547,875 687,306
Cost of goods sold (104,322) (202,040) 94% (170,425) (270,311) 59% (153,597) (203,477)
Royalties (17,097) (49,844) 192% (27,859) (64,077) 130% (49,844) (64,077)
Operatin income 117,985 295,990 151% 158,276 352,918 123% 344,433 419,752
General and administrative expenses (25,739) (33,693) 31% (54,291) (55,323) 2% (32,412) (52,787)
Other operating income (expenses) (6,890) (32,570) 373% (3,359) (32,265) 861% (32,570) (32,265)
EBITDA 85,357 229,727 169% 100,626 265,330 164% 279,451 334,700
EBITDA margin 36% 42% 6p.p 28% 39% 11p.p 51% 51%
Depreciation and amortization (26,647) (27,424) 3% (44,031) (43,721) -1% (72,716) (106,749)
Financial Results 12,175 (12,846) -206% 16,669 (65,463) -493% (8,077) (78,210)
Income and social contribution taxes (325) (35,679) 10867% (10) (40,440) 420269% (35,679) (40,440)
Income (loss) for the period 70,560 153,779 118% 73,254 115,706 58% 162,980 109,301
Ex-IFRS16 Ex-IFRS16
2Q18 2Q19 D 6M18 6M19 D 2Q19 6M19
Adjusted EBITDA* 92,246 262,297 184% 103,984 297,594 186% 312,021 366,964
Adjusted EBITDA margin 39% 48% 9 p.p 29% 43% 14 p.p 57% 53%
*Adjusted EBITDA excludes “Other revenues/expenses”
Δ Δ

ANNEX II: BALANCE SHEET (R$ thousands)
29
Assets Liabilities and shareholders' equity
Current assets Dec/18 Jun/19 Current liabilities Dec/18 Jun/19
Cash and cash equivalents 154,109 392,879 Suppliers 73,258 126,571
Securities 643,783 132,872 Labor obligations 14,923 32,618
Restricted cash 11,628 60,085 Taxes and social contributions 37,010 85,089
Accounts receivable 34,932 36,023 Loans and financing 222,437 566,985
Oil inventories 56,702 93,764 Debentures 306 9,251
Consumable inventories 2,084 1,622 Advances from partners 6,792 3,116
Derivative Financial Instruments - 1,114 Contractual Charges (Lease IFRS 16) - 195,349
Recoverable taxes 67,011 90,764 Other liabilities 16,260 -
Advances to suppliers 37,949 43,104 Total current liabilities 370,986 1,018,979
Advances to partners 2,922 32,425
Prepaid expenses 1,659 12,097
Other receivables 203 1,237 Non-current liabilities
Total Current assets 1,012,982 897,986 Suppliers 13,413 13,413
Debentures 31,241 -
Loans and financing 25,718 724,663
Provision for abandonment (ARO) 68,713 646,922
Non-current assets available for sale 26,581 26,289 Provision for contingencies 17,441 28,675
1,039,563 924,275 Deferred taxes and social contributions 2,311 2,153
Contractual Charges (Lease IFRS 16) - 775,985
Others 644 644
Non-current assets Total non-current liabilities 159,481 2,192,455
Advances to suppliers 12,596 12,596
Deposits and pledges 19,621 25,084 Minority Interest 1,161
Recoverable taxes 25,711 30,524
Deferred taxes 8,338 9,773 Shareholders' equity
Right-of-yse (Lease CPC 06.R2 IFRS 16) - 966,340 Realized capital 3,273,114 3,307,246
Property, plant and equipment 45,292 1,484,486 Capital reserves 58,183 109,317
Intangible assets 385,943 958,199 Other comprehensive income 18,202 15,721
Total non-current assets 497,501 3,487,002 Accumulated losses (2,547,777) (2,342,903)
Income (loss) for the period 204,875 109,301
Total shareholders’ equity 1,006,597 1,198,682
Total Assets 1,537,064 4,411,277 Total liabilities and shareholders’ equity 1,537,064 4,411,277


![TASCAM%20M-2516[1] - Audiofanzine : Home Studio, … · · 2012-11-15Title: C:\Documents and Settings\fza...LYOWHH\TASCAM%20M-2516[1].pdf Author: fzagar Created Date: 11/15/2012](https://static.fdocuments.us/doc/165x107/5afe6a2c7f8b9a944d8edc59/tascam20m-25161-audiofanzine-home-studio-cdocuments-and-settingsfzalyowhhtascam20m-25161pdf.jpg)


