
Apresentação Institucional (Agosto 2015)
28
Institutional Presentation August 2015
-
Upload
wilsonsonsri -
Category
Investor Relations
-
view
144 -
download
0
Transcript of Apresentação Institucional (Agosto 2015)

Institutional PresentationAugust 2015

2
This information is property of Wilson Sons and can not be used or reproduced without written permission
Disclaimer
This presentation contains statements that may constitute “forward-looking statements”, based oncurrent opinions, expectations and projections about future events. Such statements are also based onassumptions and analysis made by Wilson, Sons and are subject to market conditions which arebeyond the Company’s control.
Important factors which may lead to significant differences between real results and these forward-looking statements are: national and international economic conditions; technology; financial marketconditions; uncertainties regarding results in the Company’s future operations, its plans, objectives,expectations, intentions; and other factors described in the section entitled "Risk Factors“, available inthe Company’s Prospectus, filed with the Brazilian Securities and Exchange Commission (CVM).
The Company’s operating and financial results, as presented on the following slides, were prepared inconformity with International Financial Reporting Standards (IFRS), except as otherwise expresslyindicated. An independent auditors’ review report is an integral part of the Company’s condensedconsolidated financial statements.

This information is property of Wilson Sons and can not be used or reproduced without written permission
Head Office
Terminals
Towage
Offshore
Logistics
Agency
Shipyards
International & Domestic Trade Flow 69% of Client Exposure
Oil & Gas31% of Client Exposure
* Based on 2014 revenues including JV’s
EBITDA*CAGR of 15.3%
* Including Offshore Support Vessels JV
47.9
121.4
199.3
2004
2010
2014FMM*; 77%
Others; 23%
* FMM = Merchant Marine Fund (Fundo da Marinha Mercante)
3.1% Weighted Avg. Cost of Debt in 2014
Including OffshoreSupport Vessels JV
3
Wilson Sons at a Glance

This information is property of Wilson Sons and can not be used or reproduced without written permission
4
Wilson Sons at a Glance
Group overview
� One of the largest port, maritime and logistics operators in Brazil;
� 178 years of experience highlights Wilson Sons’ solid operational know how, reputation and credibility;
� Integration and multiple synergies among its businesses;
� Wilson Sons enjoys an unparalleled geographical reach throughout Brazil;
� Leading volume capacity, superior infrastructure and efficiency;
� Solid customer relationships with a diverse and strong customer base;
� Experienced and innovative management team;
� High profitability and financial strength.
Shareholding structure
Ocean Wilsons Holdings Limited
Free Float
58.25% 41.75%
Bermuda
Brazil
PORT & LOGISTICS SERVICES MARITIME SERVICES
Terminals Logistics Towage OffshoreSupportVessels
Shipyards Agency
Our Growth Drivers

This information is property of Wilson Sons and can not be used or reproduced without written permission
6
International & Domestic Trade Flow
Increasing Container Handling in Brazil (TEU M)Source: Datamar
6.16.6 6.9
6.1
7.48.0
8.69.2
9.6
2006 2007 2008 2009 2010 2011 2012 2013 2014
CAGR: +5.8%
Evolution of International Trade in Brazil (Billion tonnes)Source: Central Bank 2015
Growth of Cabotage in Brazil (TEU M)Source: Datamar
0.91.0
1.1 1.11.2
1.4
1.71.8
2.2
2006 2007 2008 2009 2010 2011 2012 2013 2014
CAGR: +11.8%
526,6580,6 593,4
559,3
658,3692,9 688,0
718,0 742,0
2006 2007 2008 2009 2010 2011 2012 2013 2014
CAGR: +4.4%
Merchandise trade (% of GDP)Source: World Bank
21% 21%23%
18% 18% 20% 21% 22%
43% 43% 45%
37%
42%45% 45% 45%
2006 2007 2008 2009 2010 2011 2012 2013
Brazil G7 (average)

This information is property of Wilson Sons and can not be used or reproduced without written permission
7
International & Domestic Trade FlowDemand for container terminal services will continue growing driven by trade volume growth and containerization
Container Density: 2013 (TEU per '000 habitant)Source: World Bank
70.4
45.0
31.6
30.1
24.6
23.6
21.5
15.5
15.3
14.3
14.0
12.8
11.5
9.7
9.7
9.1
7.7
7.2
5.7
5.6
5.2
5.1
4.7
4.0
2.8
0.9
Netherlands
South Korea
Australia
Spain
High Income Countries Avg.
Germany
Chile
Japan
Canada
United Kingdom
United States
China
Thailand
Turkey
France
World Average
LaAm & Caribbean Avg.
Peru
Emerging Countries Avg.
Colombia
Argentina
Brazil
Poland
Mexico
Russia
India
Containerisation PotentialSource: ILOS; BNDES; Wilson Sons analysis
Containerisation Potential
ActualThroughput
+10% to 13% 35%
20%
20%
15%
10%
Other
Food Grains
Steel Products
Sugar
Fertilizers
The Brazilian Container Terminal Market has…
� Potential growth through further containerisation of bulk cargoes;
� Significant upside through greater container density as it currently lags World, LatAm and Emerging Markets averages.

8
This information is property of Wilson Sons and can not be used or reproduced without written permission
3.016.0
42.0
119.0
169.0
301.0
412.0
2008 2009 2010 2011 2012 2013 2014
Increased Distances to new Oil RigsDemand for Offshore Support Vessels (PSVs)Source: ABEAM 2015
Brazilian Pre-Salt Oil Production (k bpd)Source: Petrobras
Cumulative global deepwater resources discoveredSource: IHS Integrated Energy Briefing (May 2015)
Oil & Gas Industry in Brazil
125 km
300 km
Average Campos Basin Distances
Pre-salt Distances
Foreign Flag Vessels
Brazilian Flag Vessels
Pre-salt fields already
contributes close to
30% of total oil
production in Brazil
6875
8794
101
55
104
88
99106
2010 2011 2012 2013 2014

Our Business

10
This information is property of Wilson Sons and can not be used or reproduced without written permission
Container Terminals
Tecon Rio Grande 10
975,100TEU handled
(2014 Tecon RG + Tecon SSA)
1,880,000TEU capacity
(Tecon RG + Tecon SSA)
US$ 190MNet Revenues
(30% of 2014 Total Revenues)
Rio Grande do Sul

11
This information is property of Wilson Sons and can not be used or reproduced without written permission
Key infrastructure Rio Grande Salvador
Actual Actual
Handling capacity (TEU '000) 1,350 530
Container berths (#) 3 2
Total quay length (m) 900 617 *
Terminal area (m²) 670,000 118,000
Water depth (m) 15 15 *
Quay cranes (# STSs) 6 6
Yard cranes (# RTGs) 14 8
Container throughput (TEU '000)Source: Wilson Sons
Main Cargoes Handled (% of Total 2014 TEU)
Container Terminals
• Container Terminal concessions for 25 + 25 years in the ports of Rio Grande and Salvador
• One of the largest port operators in Brazil, with 10% market share
• Strategically located assets are key competitive advantage
341
561
789 868 862
929 908975
2000 2002 2004 2006 2008 2010 2012 2014
CAGR: +7.8%
Tobacco 8.7%
Resins 8.7%
Frozen Chicken 7.7%
Rice 6.8%
Parts & Pieces 4.6%
Machines 3.8%
Plastics 3.2%
Fresh Fruits 3.1%
Food 2.9%
Furniture 2.5%
Chemicals 2.4%
Frozen Fish 2.4%
Wood 2.3%
Latex 2.2%
Steelwork 2.0%
Pork Meat 1.9%
Leather 1.3%
Cellulose 1.3%
Beef 1.2%
Tires 1.1%
Others 29.9%
Tecon RG
Chemical & Petrochemical 13.8%
Cellulose & Paper 11.7%
Polymers 7.9%
Steel & Metallurgy 5.2%
Ores 4.8%
Tires 4.2%
Fruits 3.9%
Rice 3.9%
Parts & Equipment 3.7%
IT Equipment 3.3%
Undefined Products 3.1%
Paper Products 3.0%
Retail Products 2.6%
Plastics 2.4%
Latex 2.3%
Rubber & Rubber Products 2.3%
Têxtil 1.9%
Wood and Wood Products 1.8%
Packaging 1.7%
Civil Construction Products 1.7%
Others 14.9%
Tecon SSA

12
This information is property of Wilson Sons and can not be used or reproduced without written permission
Container Terminals
12Tecon Salvador
Bahia

13
This information is property of Wilson Sons and can not be used or reproduced without written permission
Rice in Tecon Rio Grande
Celullose in Tecon Salvador
Container Terminals
Shipping Lines Tecon Rio Grande 2014Source: Datamar
Shipping Lines Tecon Salvador 2014Source: Datamar
0.9 2.5
13.117.4 17.1 19.4
22.6 23.9
1%1%
8%
11%
9%10%
12% 12%
0%
2%
4%
6%
8%
10%
12%
14%
00
05
10
15
20
25
30
2007 2008 2009 2010 2011 2012 2013 2014
Celullose (TEU '000) % of Total Full
26.1 26.521.7
32.6 31.6 32.229.4
0%
7% 7%
5%
7% 8% 8%7%
0%
1%
2%
3%
4%
5%
6%
7%
8%
9%
00
05
10
15
20
25
30
35
2000 2008 2009 2010 2011 2012 2013 2014
Rice (TEU '000) % of Total Full
14
This information is property of Wilson Sons and can not be used or reproduced without written permission
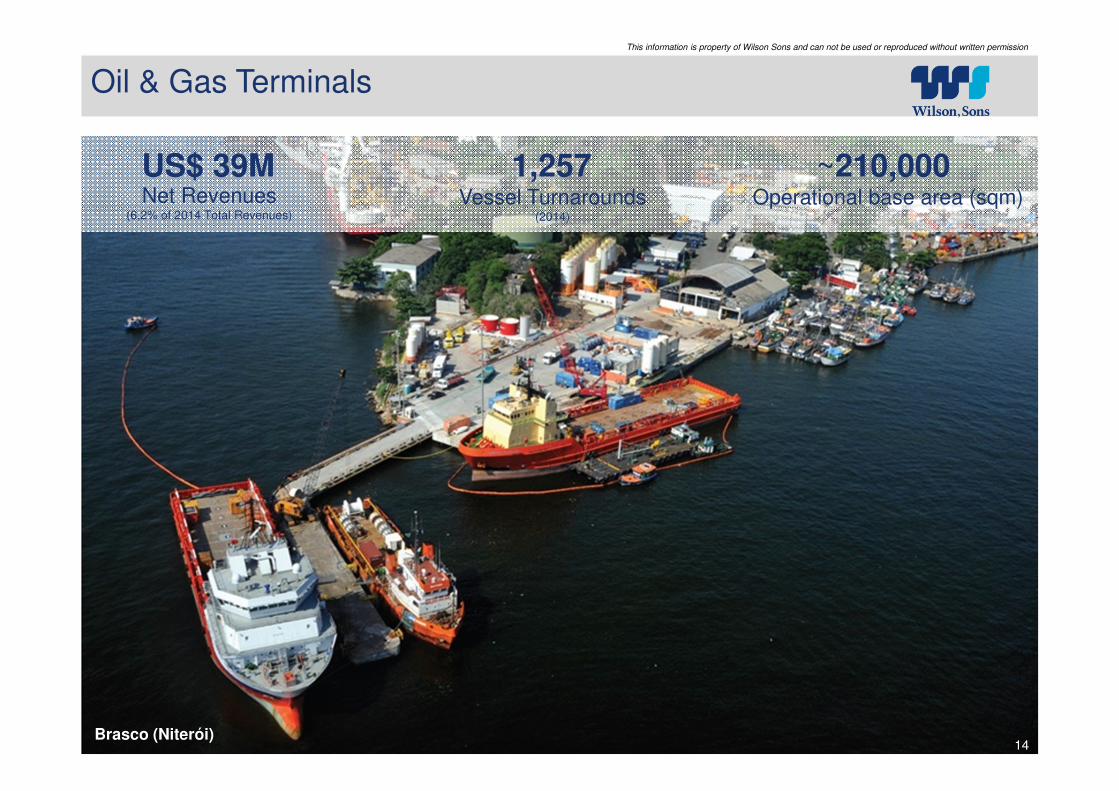
Oil & Gas Terminals
Brasco (Niterói)14
1,257Net Revenues
(6,2% of 2014 Total Revenues)
Vessel Turnarounds (2014)
~210,000Operational base area (sqm)
US$ 39M

15
This information is property of Wilson Sons and can not be used or reproduced without written permission
Campos and Santos BasinsSource: ANP
Blocks by Operator: IOCs increasing positionSource: ANP
Highlights
Oil & Gas Terminals
• Providing support to the Oil & Gas industry, combining own assets and expertise in public ports
• First private Oil & Gas terminal operator in Brazil, with more than 13 years of experience
• Strategically located bases with advantageous access to the pre-salt areas
Campos
Basin
Santos
Basin
Exploration Development Production
Upstream~ 40 years depending on specific area
~ 76% of Oil & Gas production in Brazil
~ 100 Offshore Drilling and Production Rigs
~ 350 Offshore Support Vessels in operation
Base Areas (sqm)
Completed Quay Length (m)
~70,000
180
~60,000
500
# of Berths 3 5/6
n/a
n/a
Brasco(Niterói)
Brasco Cajú*(Briclog)
GuaxindibaDepot
Turnarounds Capacity / year 1,260 1,920 n/a
~80,000
* After expansion with expected completion at 2nd Half of 2015
Strategic Location
Brasco Caju and Brasco Niterói

16
This information is property of Wilson Sons and can not be used or reproduced without written permission
Towage
Phoenix – Feb 1316
US$ 211MNet Revenues
(30% of 2014 Total Revenues)
58,543Manoeuvres
(2014)
62.6Avg. Dwgt Attended
(2014)
76Operational Fleet
(As of Dec 14)

17
This information is property of Wilson Sons and can not be used or reproduced without written permission
Ave
rag
eA
ge
# P
ort
s/T
erm
ina
lsA
tte
nd
ed
221.6
169.2
81.4
Brazilian Towage MarketPrincipal Players
Tugboats Throughout Brazilian´s PortsAs of March/2015
Towage
• Largest fleet in Brazil, approx. 50% share at harbour manoeuvres, operating in all major ports of Brazil
• Regulatory protection ensures priority to Brazilian flag vessels
• Friendly funding available from the FMM (Fundo da Marinha Mercante) – Long-term, Low-cost
North8 tugboats
Northeast33 tugboats
Southeast21 tugboats
South14 tugboats
Fle
et
To
tal P
ow
er*
WS
Competidor (1)
Competidor (2)
Competidor (3)
386.5
Total Power = Total Bollard Pull of fleet (‘000 tons)
76
11.0
30
44
7.5
13
41
16.6
4
21
15.2
8

18
This information is property of Wilson Sons and can not be used or reproduced without written permission
Offshore Support Vessels
PSV Alcatraz – Apr/14 18
US$ 77MNet Revenues
(2014)
19 OSVsOperational Fleet
(As of Dec 14)
6,683Days in Operation
(Own Vessels 2014)
US$ 23,007Average Daily Rate
(As of Dec 14)

19
This information is property of Wilson Sons and can not be used or reproduced without written permission
PT 1607
PT 1624
Offshore Support Vessels
• Regulatory protection ensures priority to Brazilian flag vessels
• Friendly funding available from the FMM (Fundo da Marinha Mercante) – Long-term, Low-cost
• Wilson Sons 100%-owned shipyard is a key competitive advantage
2015 2016 2017 2018 2019 2020 2021 2028 2029 2030
Albatroz Jun/11 4 years
Gaivota Jun/11 4 years
Cormoran Jan/15 2 years
Fragata Apr/07 6+2.5 years
Biguá Feb/10 6+2.5 years
Pelicano Jun/10 6+2.5 years
Atoba Jun/10 6+2.5 years
Petrel Jun/10 6+2.5 years
Skua Jun/10 6+2.5 years
Fulmar Jun/10 6+2.5 years
Talha-Mar Mar/11 6+2.5 years
Torda Oct/11 6+2.5 years
Sterna Mar/12 8+8 years
Batuíra Aug/12 8+8 years
Tagaz Mar/13 8+8 years
Prion Sep/13 8+8 years
Alcatraz Nov/13 8+8 years
Zarapito Apr/14 8+8 years
Mandrião Nov/13 4+4 years
Vessel Start Date Contract
PT 1606 2015 Under Negociation
2016 Under Negociation
2016 Under Negociation
PSV WS134
PSV WS135
Jul/16 6+6 years
Sep/16 6+6 years
Foreign Flag Vessel
In Contract (Petrobras)
In Contract with Client Option automatically maintaining day rate
Contract Option
20
This information is property of Wilson Sons and can not be used or reproduced without written permission
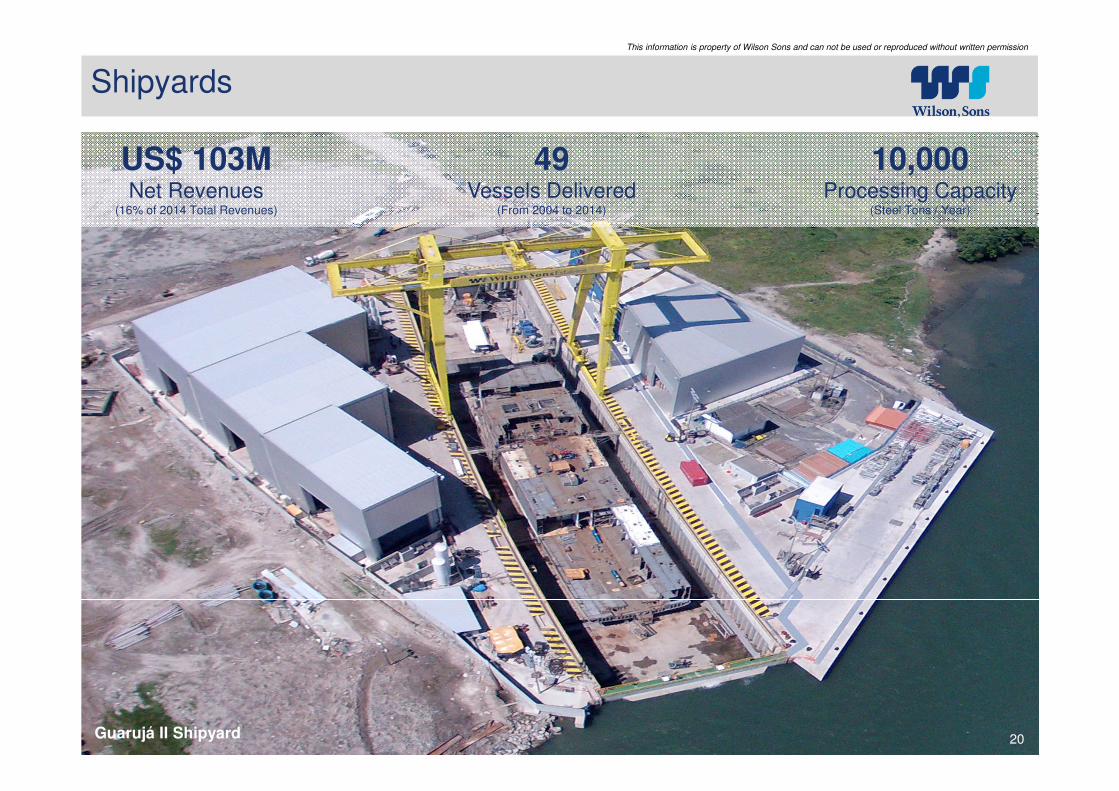
Shipyards
Guarujá II Shipyard 20Guarujá II Shipyard
49Vessels Delivered
(From 2004 to 2014)
10,000Processing Capacity
(Steel Tons / Year)
US$ 103MNet Revenues
(16% of 2014 Total Revenues)

21
This information is property of Wilson Sons and can not be used or reproduced without written permission
Opportunities
Shipyards
Length (m)
Steel Processing Capacity(tons/year)
Dock Type
Vessels Delivered
Indicative Shipyard OrderbookAs of Mar 2015
HighlightsGuarujá I Guarujá II
WSUT* PSV 5,000 2
WS Rebocadores Tugboats 10
Oceanpact OSRV 2
Client Vessels QTY
*50% Owned + 50% Third Party
Area (sqm)
Total
• Combination of third party construction and competitive advantage for the Towage and Offshore businesses
• Friendly funding available from the FMM (Fundo da Marinha Mercante) – Long-term, Low-cost
• Strategically located assets with proven track record
Breadth (m)
22,000 17,000 39,000
4,500 5,500 10,000
Slipway Dry-dock n/a
150 135 n/a
16 26 n/a
Siem Consub OSRV 1
# of Tugboats delivered since 1992: 58
# of OSVs delivered since 2003: 18
• Towage fleet construction – own fleet
• Future Brazilian Flag vessel bids – own fleet and third parties
• Completion of vessels from other shipyards experiencing difficulties –third parties
• Dry docking – own fleet and third parties
• Ship repairs – own fleet and third parties
21
21
56
32 2
1 1 12
3
12
7
54
3
1
32
1
2
2
3
2
2
3
1
199
2
199
3
199
4
199
5
199
6
199
7
199
8
199
9
200
0
200
1
200
2
200
3
200
4
200
5
200
6
200
7
200
8
200
9
201
0
201
1
201
2
201
3
201
4

Financial Highlights

This information is property of Wilson Sons and can not be used or reproduced without written permission
23
Wilson Sons’ Financial Highlights
Net Revenues - Proforma (US$ M)Source: Wilson Sons
EBITDA - Proforma (US$ M)Source: Wilson Sons
Net Revenues by Business - Proforma: 1H15 (%)Source: Wilson Sons
EBITDA by Business - Proforma: 2014 (%)Source: Wilson Sons
211.2278.0
325.7393.3
476.7 439.8
547.6
656.6610.4
660.1 633.5
269.4
6.5
7.28.4
10.7
21.6 38.1
28.0
41.447.0
54.4 76.8
36.1
2004 2005 2006 2007 2008 2009 2010 2011 2012 2013 2014 1H2015
Net Revenues (IFRS)
Net Revenues (Offshore )
2014 CAGR: 12.6%
217.7
285.2334.1
404.0
498.3 477.9
575.6
657.4698.0
714.5 710.3
305.5
Towage35%
Container Terminals
26%
Offshore Support Vessels
12%
Shipyard11%
Logistics9%
Brasco4%
Shipping Agency
3%
Towage43%
Container Terminals
29%
Offshore Support Vessels
17%
Shipyard4%
Logistics3%
Brasco2%
Shipping Agency
2%
43.9 45.773.0
86.9109.8 109.2 108.3
152.0 1900ral
1900ral1900ral
83.94.0 3.4
3.2
4.5
12.9 19.213.1
11.3 16.0
23.1
39.2
19.8
2004 2005 2006 2007 2008 2009 2010 2011 2012 2013 2014 1H2015
EBITDA (IFRS)
EBITDA (Offshore)
2014 CAGR: 15.3%
47.9 49.1
76.2
91.4
122.7128.4
121.4
163.3 162.3
205.9199.3
103.7

24
This information is property of Wilson Sons and can not be used or reproduced without written permission
31.126.4
42.5
58.4 58.7
69.9
97.0
86.4
115.8 113.5118.0
92.0
2004 2005 2006 2007 2008 2009 2010 2011 2012 2013 2014 1 H 2015
Capital Expenditures (US$ M) Briclog Acquisition, Guarujá II Shipyard, Tecon Salvador Expansion Towage and offshore vessel fleet Renewal and Capacity Increases and 3rd berth at
Tecon Rio Grande
20.2 35.4 26.659.3 69.6
116.3 127.5
226.6
128.7 136.9111.2 120.5
0.8 15.6
39.9 23.9
33.339.2
36.3
55.5 49.0
15.3
55.8
2004 2005 2006 2007 2008 2009 2010 2011 2012 2013 2014 2015**
166.7
262.9
20.436.2 42.2
99.2
149.6176.4
126.5
185.9184.2
93.5
Operating Cash Flow (IFRS) US$ M
Operating Cash Flow & CAPEX
Investment Cycle: more than USD 1.0B
From 2012 Offshore Support Vessel JV CAPEX is not consolidated for IFRS. 2015 Budget using USD:BRL exchange rate 3.03
Offshore Vessels JV CAPEX
Wilson Sons CAPEX
CAGR:14.3%

25
This information is property of Wilson Sons and can not be used or reproduced without written permission
20.236.2 42.2
92.6 90.2
139.7162.0
234.0
162.5
106.1 107.5
33.710.9
-9.8
0.2
-34.2 -31.5
-69.8 -65.0
-147.6
-46.7
7.4 10.5
58.3
2004 2005 2006 2007 2008 2009 2010 2011 2012 2013 2014 1 H 2015
Free Cash Flow CAPEX
8.0 8.87.6 8.0
16.0 16.0
22.6
18.1 18.1 18.1
27.029.0
2004 2005 2006 2007 2008 2009 2010 2011 2012 2013 2014 2015
Free Cash Flow (IFRS) US$ M
Distribution to ShareholdersUS$ M
Free Cash Flow and DividendsVoluntarily follow the majority of Novo Mercado rules
CAGR:12.4%
1.72% 3.27% 2.67% 1.30% 1.61% 2.02%
* Dividend Yield: Amount paid per BDR / Closing value of the share on the date of payment
2.52% 4.40%Dividend Yield Since IPO

26
This information is property of Wilson Sons and can not be used or reproduced without written permission
Debt Maturity Schedule (Including Offshore Vessels JV) (as of Dec 14) @PTAX 2.6562
Net Debt/EBITDA*(as of Dec 14)
Debt Profile(as of Dec 14)
Debt Profile
87.0%
13.0%
86.8%
13.2%
36.6%
63.4%
CURRENCY
Denominated in USD
Denominated in BRL
MATURITY
Long Term
Short Term
SOURCEOthers
FMM
92.1%
7.9%
89.5%
10.5%
22.6%
77.4%
IFRSWith Offshore Vessel (50%)
53
42 42 41 38
2820 19 17 16 16 16 16 13
08 06 05 03 01 00
16
16 17 1820
16
16 1616 16 14 14 13
12
0909 09 07 02 01
01
2015 2016 2017 2018 2019 2020 2021 2022 2023 2024 2025 2026 2027 2028 2029 2030 2031 2032 2033 2034 2035
IFRS: USD 399.9M
Embarcações Offshore: USD 257.4M
0.5 x
0.0 x
0.6 x
1.4 x
2.2 x
2.8 x
1.4 x
1.8 x
1.5 x
2007 2008 2009 2010 2011 2012 2013 2014 1 H 2015
Wilson Sons (IFRS)
Wilson Sons (Proforma)
2.4 x
2.6 x
2.4 x

27
This information is property of Wilson Sons and can not be used or reproduced without written permission
2.93
2.43
2.181.95
1.841.99
1.76 1.67
1.962.16
2.35
2004 2005 2006 2007 2008 2009 2010 2011 2012 2013 2014
51.4 51.1 52.7 53.4 53.4 39.4 32.8 31.9 31.8 31.7 29.8 29.8 28.6 25.8
17.4 15.5 14.2 9.8 3.5 0.9 0.7 0
2
4
6
8
10
12
14
16
18
20
0
100
200
300
400
500
600
2015 2016 2017 2018 2019 2020 2021 2022 2023 2024 2025 2026 2027 2028 2029 2030 2031 2032 2033 2034 2035
20
14
EB
ITD
A/C
on
tra
cte
d U
S$
De
bt
Am
ort
isa
tio
n
US
$ D
eb
t A
mo
rtis
ati
on
M
31/12/2014 Contracted US$Denominated Debt Amortisation
2014 EBITDA/ Debt Amortisation
Contracted US$ Debt Amortisation at 31/12/2014 v´s 2014 EBITDA/Contracted US$ Debt Amortisation at 31/12/2014(Including Offshore Vessels JV)
US$ Debt Profile
Estimated (Proforma) Revenue, Costs and EBITDA(Year ended Dec 14)
Annual Average Exchange RatesUS$ - R$
EBITDA
Costs
Revenue
R$ Source/Denominated
US$ Source/Denominated
53% 47%
90% 10%

28
This information is property of Wilson Sons and can not be used or reproduced without written permission
Investor Relations Contact Info
BM&FBovespa: WSON33IR website: www.wilsonsons.com/ir
Twitter: @WilsonSonsIRYoutube Channel: WilsonSonsIR
Facebook: Wilson, Sons
Felipe Gutterres
CFO of the Brazilian Subsidiary and Investor Relations
[email protected]+55 (21) 2126-4112
Michael Connell
IRO, International Finance & Finance Projects
[email protected]+55 (21) 2126-4107
Kelly Calazans
Investor Relations
[email protected]+55 (21) 2126-4105
Júlia Ornellas
Investor Relations
[email protected]+55 (21) 2126-4293


