Apresentação do PowerPoint - European...
19
DG ECFIN Brussels, 24 November 2015 REFORMING SOE’S (The Industry Perspective) Infraestruturas de Portugal - From Hell To Earth António Ramalho CEO
Transcript of Apresentação do PowerPoint - European...
DG ECFIN
Brussels, 24 November 2015
REFORMING SOE’S (The Industry Perspective)
Infraestruturas de Portugal -
From Hell To Earth
António Ramalho
CEO

INDEX
General Overview of Portuguese SOE’s sector
Three Years of Adjustment
A New Challenge
IP Business Plan
01
02
03
04
NOME DA APRESENTAÇÃO | DATA DA MESMA
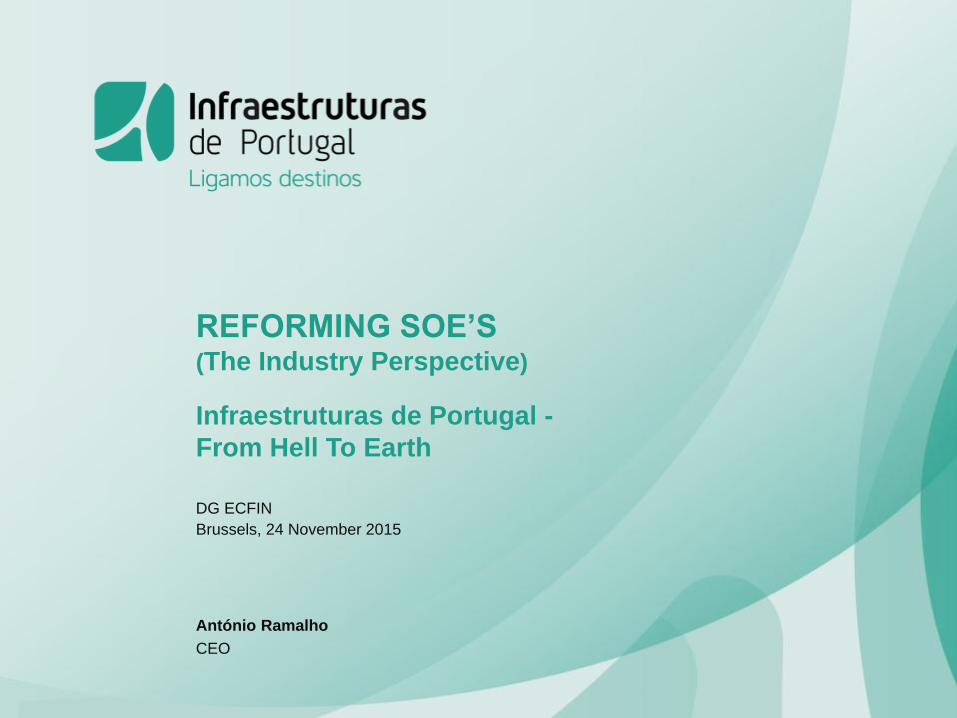
1. General Overview of Portuguese SOE’s Sector

Pág. 4
1. GENERAL OVERVIEW OF PORTUGUESE SOE’S SECTOR
MoU – Economic and Financial Policies (2011)
- Suspend new PPPs during program process
- Renegotiate the most significant PPPs (incl. Estradas
de Portugal PPPs)
- Enhance a annual report on PPPs
- Reduce operating costs in 15%
- Accelerate the privatization program (including CP)
- Better regulation of de SOE’s
- Adopt a strategic plan to rationalize networks and
improve mobility and logistic conditions
Debt situation in 2010
Deficit (% GDP) 11,2%
Public Debt (% GDP) 96,2%
SOE’s Debt (% public debt)* 28%
PPP’s Net Debt per year (% GDP) 0,7%
(*)SOE’s without heath and financial enterprises
Sources: Eurostat e DGTF(SEE)
Infrastructures; 39%
Transportes; 22%
Communication; 1%
Urban Requalification;
3%
Public Utility Services; 12%
Parpublica; 23%
Indebtedness by sector (without Health and Financial sectors) - 2010 (% GDP)
Present value of Gross Charges for
PPP 2011-2051 (M€ and %GDP)
Net Charges of PPP in 2010
1127 M€ (Net Debt 0,7% GDP)
2015-11-24 Reforming SOE’s (The Industry Perspective)
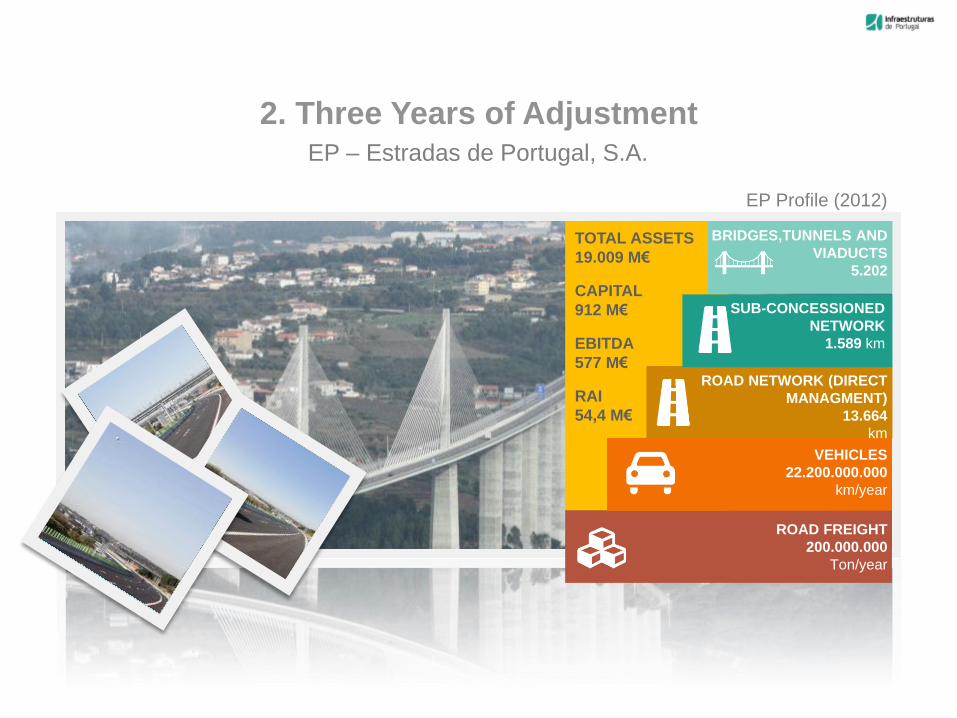
2. Three Years of Adjustment EP – Estradas de Portugal, S.A.
EP Profile (2012)
BRIDGES,TUNNELS AND
VIADUCTS
5.202
ROAD NETWORK (DIRECT
MANAGMENT)
13.664
km
SUB-CONCESSIONED
NETWORK
1.589 km
VEHICLES
22.200.000.000
km/year
ROAD FREIGHT
200.000.000
Ton/year
TOTAL ASSETS
19.009 M€
CAPITAL
912 M€
EBITDA
577 M€
RAI
54,4 M€

Pág. 6 2015-11-24
In 2012, EP Business Plan was clearly
demonstrative of the unsustainability of the
road network management model …
… but in the period
2013/2015 a set of measures
have been implemented to
put the EP in a pre-
sustainability scenario.
Estradas de Portugal (EP) Business Plan
(2012)
2. THREE YEARS OF ADJUSTMENT
0
5
10
15
20
25
201
3
201
5
201
7
201
9
202
1
202
3
202
5
202
7
202
9
203
1
203
3
203
5
203
7
203
9
204
1
204
3
204
5
204
7
204
9
Net Debt / EBITDA
out12_ajust K16@Fev15
0
5
10
15
20
25
30
201
3
201
5
201
7
201
9
202
1
202
3
202
5
202
7
202
9
203
1
203
3
203
5
203
7
203
9
204
1
204
3
204
5
204
7
204
9
Bil
lio
ns
Net Debt
out12_ajust K16@Fev15
21,0X
7,8X
26,7
7,4
Evolution 2012/2015
Reforming SOE’s (The Industry Perspective)
Pág. 7
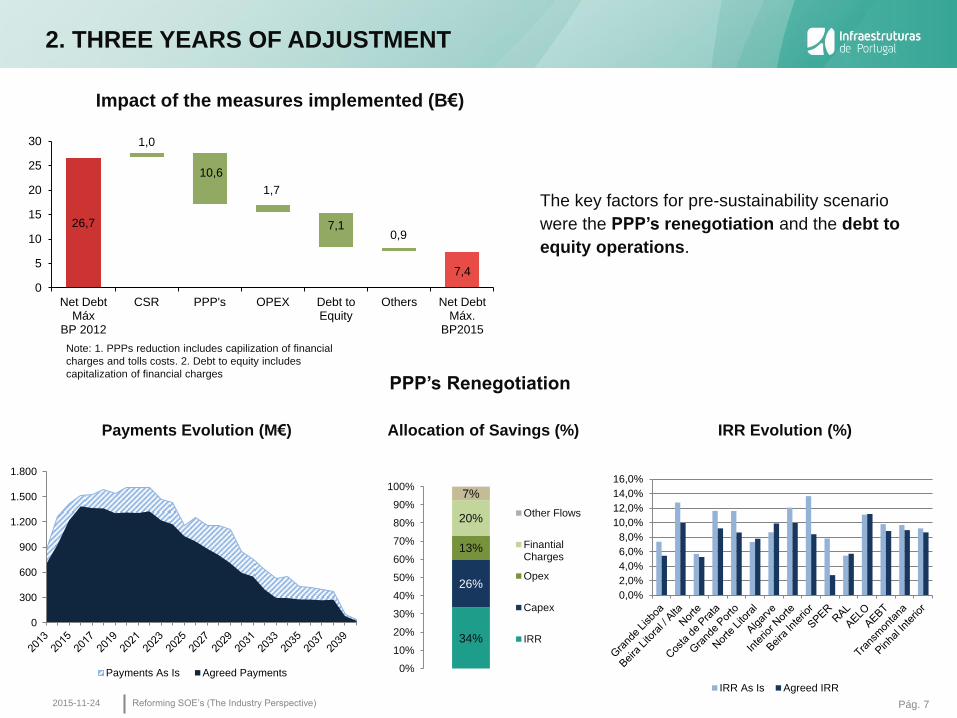
The key factors for pre-sustainability scenario
were the PPP’s renegotiation and the debt to
equity operations.
Impact of the measures implemented (B€)
2. THREE YEARS OF ADJUSTMENT
26,7
1,0
10,6
1,7
7,1 0,9
7,4
0
5
10
15
20
25
30
Net DebtMáx
BP 2012
CSR PPP's OPEX Debt toEquity
Others Net DebtMáx.
BP2015
PPP’s Renegotiation
Payments Evolution (M€)
34%
26%
13%
20%
7%
0%
10%
20%
30%
40%
50%
60%
70%
80%
90%
100%
Other Flows
FinantialCharges
Opex
Capex
IRR
Allocation of Savings (%)
IRR Evolution (%)
0,0%
2,0%
4,0%
6,0%
8,0%
10,0%
12,0%
14,0%
16,0%
IRR As Is Agreed IRR
0
300
600
900
1.200
1.500
1.800
Payments As Is Agreed Payments
2015-11-24
Note: 1. PPPs reduction includes capilization of financial
charges and tolls costs. 2. Debt to equity includes
capitalization of financial charges
Reforming SOE’s (The Industry Perspective)
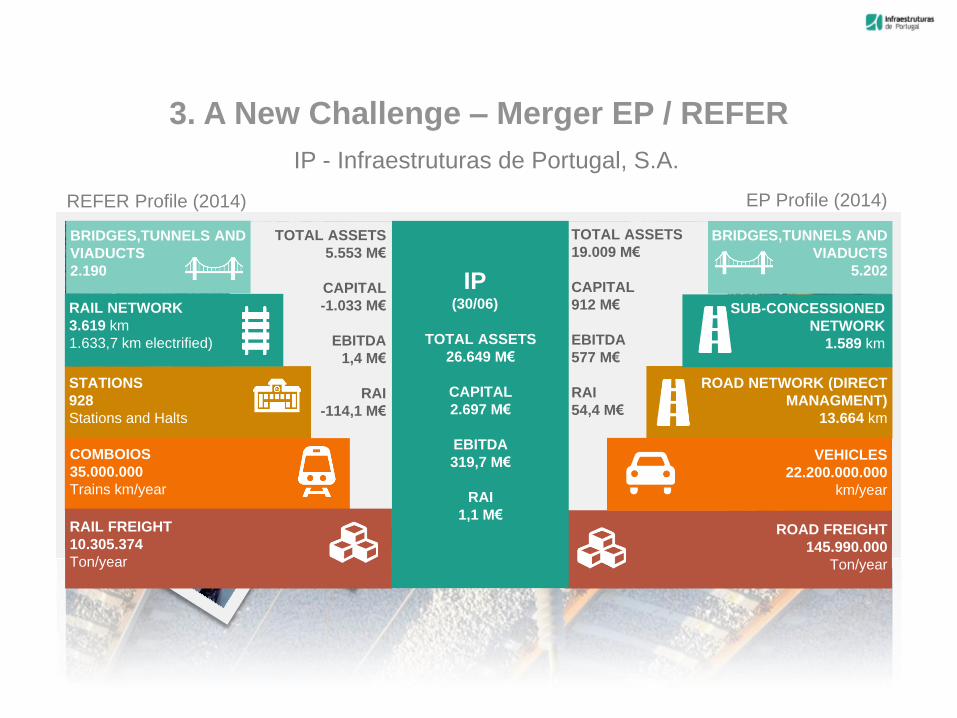
3. A New Challenge – Merger EP / REFER
IP - Infraestruturas de Portugal, S.A.
BRIDGES,TUNNELS AND
VIADUCTS
5.202
ROAD NETWORK (DIRECT
MANAGMENT)
13.664 km
SUB-CONCESSIONED
NETWORK
1.589 km
VEHICLES
22.200.000.000
km/year
ROAD FREIGHT
145.990.000
Ton/year
TOTAL ASSETS
19.009 M€
CAPITAL
912 M€
EBITDA
577 M€
RAI
54,4 M€
EP Profile (2014)
RAIL NETWORK
3.619 km
1.633,7 km electrified)
STATIONS
928
Stations and Halts
REFER Profile (2014)
BRIDGES,TUNNELS AND
VIADUCTS
2.190
COMBOIOS
35.000.000
Trains km/year
RAIL FREIGHT
10.305.374
Ton/year
TOTAL ASSETS
5.553 M€
CAPITAL
-1.033 M€
EBITDA
1,4 M€
RAI
-114,1 M€
TOTAL ASSETS
26.649 M€
CAPITAL
2.697 M€
EBITDA
319,7 M€
RAI
1,1 M€
IP (30/06)

Pág. 9
3. A NEW CHALLENGE – MERGER EP / REFER
If the EP Business Plan chart a solid path in sustainability direction, the merger with REFER (manager of
the Portuguese railway infrastructure), company with chronic operating deficit, strong investment needs
and higher debt to 6 B € implies a new beginning ...
0
10
20
30
40
50
20
13
20
15
20
17
20
19
20
21
20
23
20
25
20
27
20
29
20
31
20
33
20
35
20
37
20
39
20
41
20
43
20
45
20
47
20
49
Mil
Milh
õe
s
Net Debt
REFER EP
0
200
400
600
800
20
13
20
15
20
17
20
19
20
21
20
23
20
25
20
27
20
29
20
31
20
33
20
35
20
37
20
39
20
41
20
43
20
45
20
47
20
49
Net Debt/EBITDA
REFER EP
7,4
42,5
7,8X
616,1X
… reflected in the increase in the peak debt for 29 B € (2035) and NetDebt / EBITDA to 25x.
2015-11-24 Reforming SOE’s (The Industry Perspective)
Pág. 10
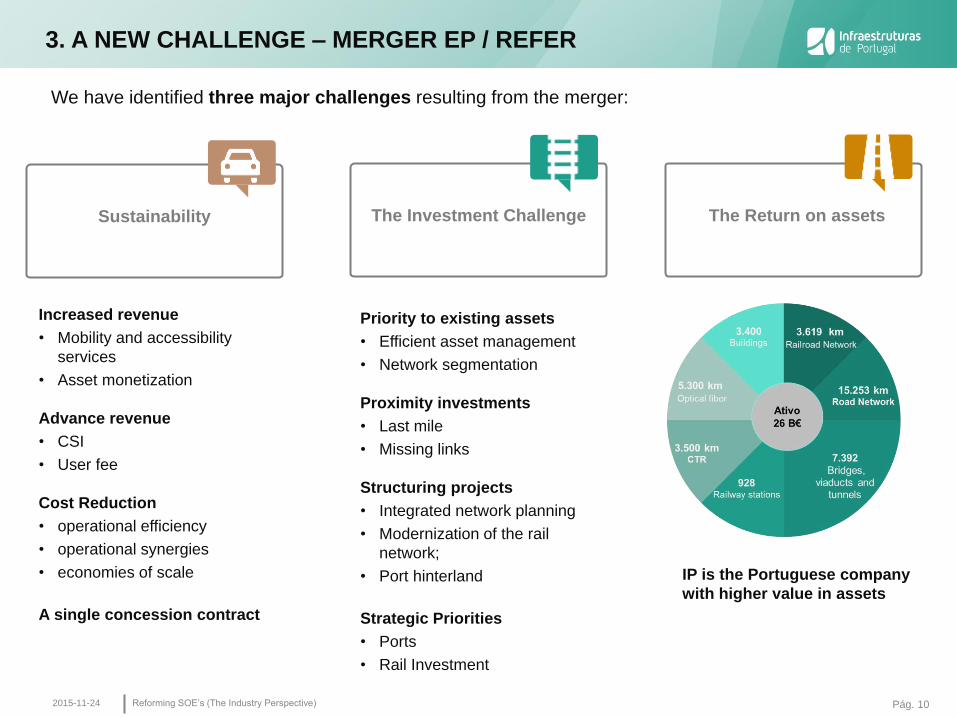
3. A NEW CHALLENGE – MERGER EP / REFER
We have identified three major challenges resulting from the merger:
2015-11-24
Sustainability The Investment Challenge The Return on assets
Increased revenue
• Mobility and accessibility
services
• Asset monetization
Advance revenue
• CSI
• User fee
Cost Reduction
• operational efficiency
• operational synergies
• economies of scale
A single concession contract
Priority to existing assets
• Efficient asset management
• Network segmentation
Proximity investments
• Last mile
• Missing links
Structuring projects
• Integrated network planning
• Modernization of the rail
network;
• Port hinterland
Strategic Priorities
• Ports
• Rail Investment
IP is the Portuguese company
with higher value in assets
Reforming SOE’s (The Industry Perspective)
4. IP BUSINESS PLAN
Pág. 12
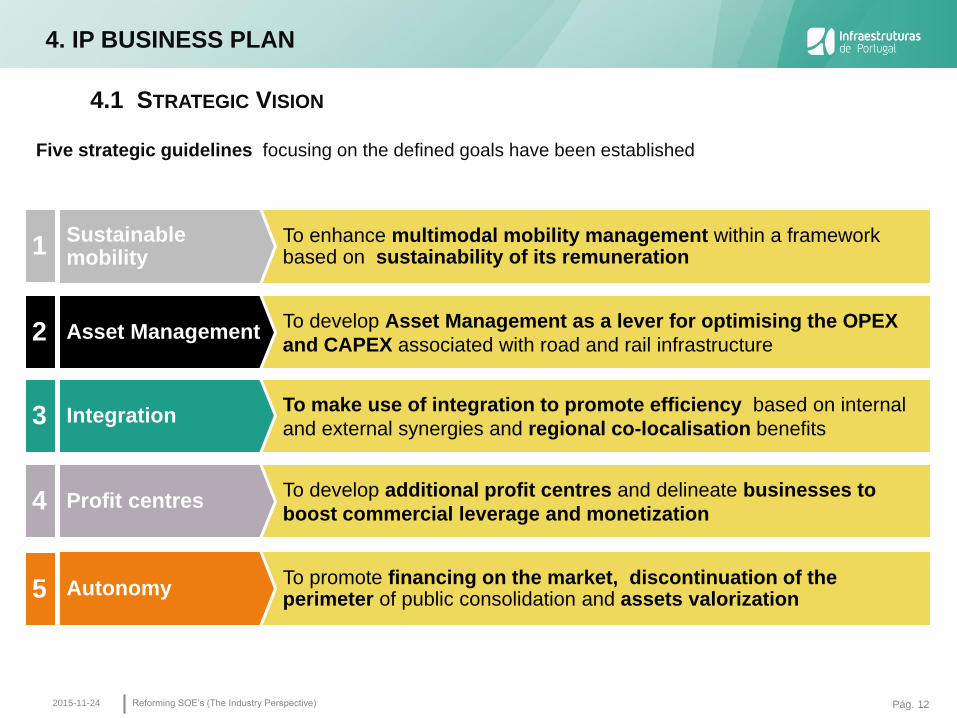
To enhance multimodal mobility management within a framework based on sustainability of its remuneration
To develop Asset Management as a lever for optimising the OPEX
and CAPEX associated with road and rail infrastructure
To make use of integration to promote efficiency based on internal
and external synergies and regional co-localisation benefits
To promote financing on the market, discontinuation of the perimeter of public consolidation and assets valorization
Sustainable mobility
Asset Management
Integration
Autonomy
To develop additional profit centres and delineate businesses to
boost commercial leverage and monetization Profit centres
1
2
4
3
5
Five strategic guidelines focusing on the defined goals have been established
4. IP BUSINESS PLAN
4.1 STRATEGIC VISION
2015-11-24 Reforming SOE’s (The Industry Perspective)
Pág. 13
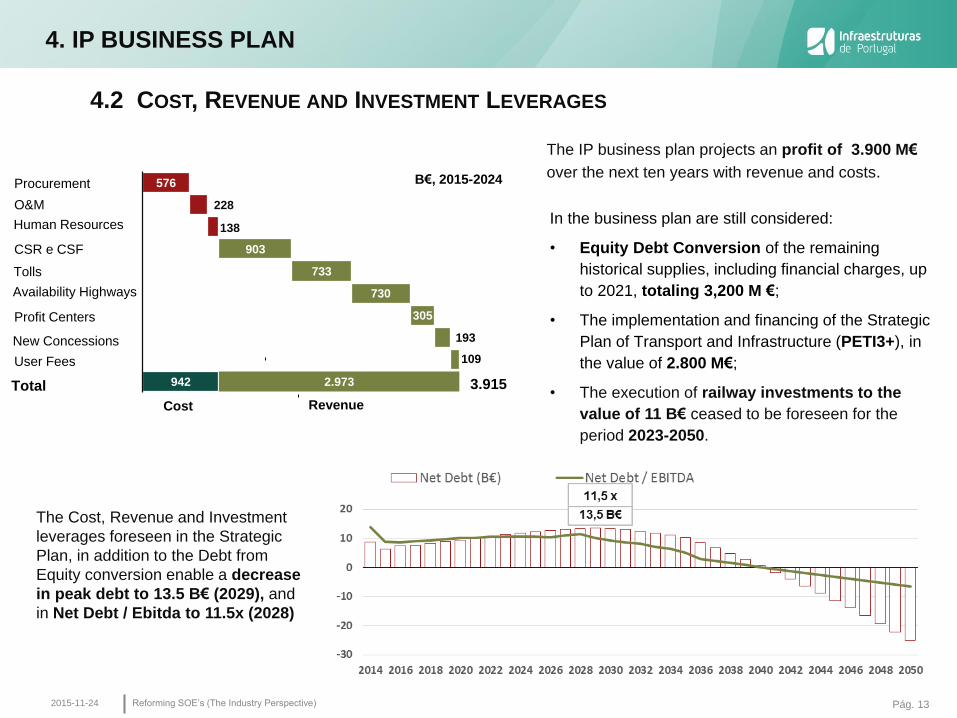
The IP business plan projects an profit of 3.900 M€
over the next ten years with revenue and costs.
4.2 COST, REVENUE AND INVESTMENT LEVERAGES
576
228
138
903
733
730
305
193
109
942 2.973
User Fees
New Concessions
Profit Centers
Tolls
CSR e CSF
Cost Revenue
3.915
Human Resources
O&M
Procurement
Total
Availability Highways
B€, 2015-2024
4. IP BUSINESS PLAN
In the business plan are still considered:
• Equity Debt Conversion of the remaining
historical supplies, including financial charges, up
to 2021, totaling 3,200 M €;
• The implementation and financing of the Strategic
Plan of Transport and Infrastructure (PETI3+), in
the value of 2.800 M€;
• The execution of railway investments to the
value of 11 B€ ceased to be foreseen for the
period 2023-2050.
The Cost, Revenue and Investment
leverages foreseen in the Strategic
Plan, in addition to the Debt from
Equity conversion enable a decrease
in peak debt to 13.5 B€ (2029), and
in Net Debt / Ebitda to 11.5x (2028)
2015-11-24 Reforming SOE’s (The Industry Perspective)
Pág. 14
Business Plan
Key challenges
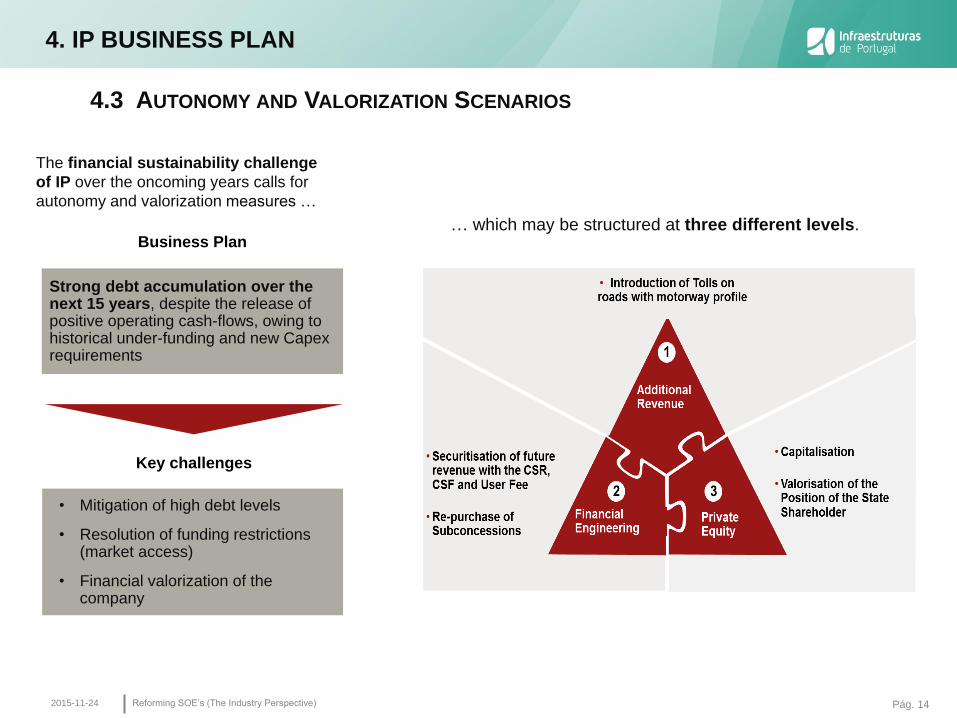
Strong debt accumulation over the next 15 years, despite the release of positive operating cash-flows, owing to historical under-funding and new Capex requirements
• Mitigation of high debt levels
• Resolution of funding restrictions (market access)
• Financial valorization of the company
4. IP BUSINESS PLAN
4.3 AUTONOMY AND VALORIZATION SCENARIOS
The financial sustainability challenge
of IP over the oncoming years calls for
autonomy and valorization measures …
… which may be structured at three different levels.
2015-11-24 Reforming SOE’s (The Industry Perspective)

Pág. 15
Introduction of Tolls in new sections with motorway profile
Main assumptions
• Estimated 35% traffic loss
• Loss of the part corresponding to the availability of a toll-free motorway network
Impact
Allows for a decrease in peak debt (2028) by 2.1 x EBITDA and 1.500 million euros;
Allows for an increase in Enterprise Value by 2.112 million euros
4. IP BUSINESS PLAN
4.3 AUTONOMY AND VALORIZATION SCENARIOS
Securitization of Future Gains
New sections with tolls
• IC22, IC16, A43, A44, A28, EN14, IC2, A33, A20 e IC17
Main assumptions
• Starting year: 2017
• Grace period: 10 years
• Percentage of securitized future revenue: 75%
• Discount rate: 5%
• CSR guaranteed by the State: 10%
• Cost of CSR guarantee by the State: 1%
• Number of instalments received: 5 (1st five years)
Impact
Allows for a decrease in peak debt Allows for a decrease in peak debt (2028) by 3.7x EBITDA and 4.6 thousand million euros.
(2028) by 2.1 x EBITDA and 1.500 million euros;
Allows for an increase in Enterprise Value by 2.112 million euros
Description
• Early upfront cash payment of future revenue of a recurring and earmarking nature: 1 CSF/IC 2 Usage charges (railway) 3 CSR (with State guarantee, eg. 10%)
2015-11-24 Reforming SOE’s (The Industry Perspective)
Pág. 16
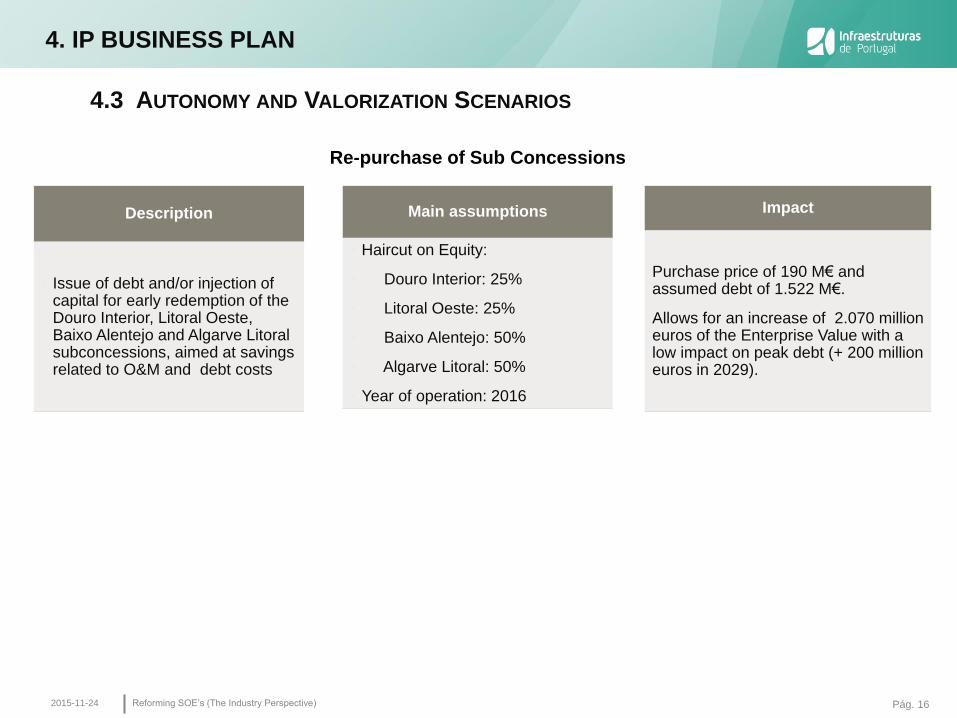
Re-purchase of Sub Concessions
Main assumptions
• Haircut on Equity:
• Douro Interior: 25%
• Litoral Oeste: 25%
• Baixo Alentejo: 50%
• Algarve Litoral: 50%
• Year of operation: 2016
Impact
Purchase price of 190 M€ and assumed debt of 1.522 M€.
Allows for an increase of 2.070 million euros of the Enterprise Value with a low impact on peak debt (+ 200 million euros in 2029).
4. IP BUSINESS PLAN
4.3 AUTONOMY AND VALORIZATION SCENARIOS
Description
• Issue of debt and/or injection of capital for early redemption of the Douro Interior, Litoral Oeste, Baixo Alentejo and Algarve Litoral subconcessions, aimed at savings related to O&M and debt costs
2015-11-24 Reforming SOE’s (The Industry Perspective)
Pág. 17
» Provide Integrated Accessibility
Providing road and rail infrastructure
throughout the national territory, enabling
social and economic development and
territorial cohesion
» Promote Mobility Efficient
Encouraging modal shift in segments and
routes over which the railroad is
uneconomical and environmentally efficient
» Promoting Economy and Exports
By improving the competitiveness of freight
transport, focusing on intermodality,
accessibility to ports and international
connections
» Guarantee integrated development
Managing and executing the investment necessary for
rational development of road and rail networks,
providing them with conditions to meet the overall
goals
» Achieve Financial Sustainability
Ensuring adequate remuneration to the management
and development of infrastructure, supplies and fair
and balanced funding streams and promoting efficiency
» Strengthening Management Capacity
Providing greater predictability, stability and control of
the financial equation and creating conditions for the
securitization of revenue
» Share Risks and Benefits
Maximizing the value added to the state economy,
users and taxpayers and aligning incentives to pursue
the general objectives
2015-11-24
4. IP BUSINESS PLAN
4.4 NEW CONCESSION CONTRACT - MAIN OBJECTIVES
Reforming SOE’s (The Industry Perspective)

Pág. 18
4. IP BUSINESS PLAN
2015-11-24
These measures and the implementation of the new remuneration system linked to the concession
agreement will lower the peak estimate of debt to 9.2 B € (2032), and the NetDebt / Ebitda to 7,9x (2016)
Capital Invested by State
(2013/2021)
10.092 M€
Enterprise Value: 19.770 M€
Equity Value: 13.657 M€
(31/12/2015)
IP results until the 3rd quarter
show a clear improvement over
the results EP / REFER in the
same period 2014
384
482,4
0
100
200
300
400
500
600
EBITDA
2014
2015
-64
12,2
-80
-60
-40
-20
0
20
RAI (M€)
2014
2015
We believe the maximum leverage level will increase, due to company’s scope.
Operational Results improved immediately.
Reforming SOE’s (The Industry Perspective)