APPROVED BY SUPERVISORY COMMITTEE JOSEPH ALBANESI …
135
SEIPIN PROMOTES LIPID DROPLET BIOGENESIS APPROVED BY SUPERVISORY COMMITTEE JOSEPH ALBANESI JOEL GOODMAN JOACHIM SEEMANN JIN YE
Transcript of APPROVED BY SUPERVISORY COMMITTEE JOSEPH ALBANESI …

SEIPIN PROMOTES LIPID DROPLET BIOGENESIS
APPROVED BY SUPERVISORY COMMITTEE
JOSEPH ALBANESI
JOEL GOODMAN
JOACHIM SEEMANN
JIN YE

SEIPIN PROMOTES LIPID DROPLET BIOGENESIS
by
CHRISTOPHER LEE HILTON
DISSERTATION
Presented to the Faculty of the Graduate School of Biomedical Sciences
The University of Texas Southwestern Medical Center
In Partial Fulfillment of the Requirements
For the Degree of
DOCTOR OF PHILOSOPHY
The University of Texas Southwestern Medical Center
Dallas, Texas
August, 2012

DEDICATION
I would like to thank the members of my Graduate Committee, Dr. Joel
Goodman- my mentor, my fellow lab members-past and present, Drs. Tallquist
and Ravnik for help in my application to this institution, and my family and
friends for their love and support..

iv
SEIPIN PROMOTES LIPID DROPLET BIOGENESIS
CHRISTOPHER LEE HILTON, Ph.D.
The University of Texas Southwestern Medical Center, 2012
JOEL GOODMAN, Ph.D.
Seipin is an ER membrane protein that is required for adipogenesis in
mammalians. Humans lacking functional seipin have virtually no visible adipose
tissue. Seipin has been shown to be essential for the later stages of the adipogenic
program in mouse pre-adipocytes. In yeast, the absence of seipin (Fld1p) leads to
clusters of tiny lipid droplets or “supersized” ones, suggesting a role of the protein
in droplet formation. To determine if this is true we created yeast strains that
allowed us to “turn on” lipid droplet synthesis by the regulated expression of
enzymes that create either triacylglycerol (TAG) or sterol ester (SE), the main
neutral lipid components of droplets, in a droplet-null background with seipin
(4KO) or without it (4KOfld1Δ). Using fluorescence microscopy, I showed that
the number of newly formed TAG fluorescent bodies (individual droplets or
clusters of unresolvable small droplets) decreased but their size increased in the
absence of seipin. The large fluorescent bodies in 4KOfld1Δ were fluorescently
dimmer and had an irregular perimeter compared to those in the 4KO strain, while

v
their intracellular membranes stained with BODIPY had brighter fluorescence,
suggesting that seipin is involved in the packaging of TAG. Electron microscopy
showed that the TAG fluorescent bodies were clusters of small droplets. Levels of
whole-cell TAG were generally similar during droplet formation, although
somewhat lower at early time points. Seipin deletion had a milder effect on
formation of SE fluorescent bodies. We conclude that seipin plays a direct role in
normal lipid droplet assembly. Finally, in several side projects, I leaned about a
possible role of seipin in droplet protein composition, the effects of different
detergents on the seipin homo-oligomer, and the lack of a role of seipin in ER
stress.

vi
TABLE OF CONTENTS
ABSTRACT ..................................................................................................................... iv
INTRODUCTION ............................................................................................................ 1
BERARDINELLI- SEIP CONGENITAL LIPODYSTROPHY ................................. 1
SEIPIN ........................................................................................................................ 7
LIPID DROPLET BIOGENESIS ............................................................................ 29
METHODS AND MATERIALS .................................................................................... 41
RESULTS ........................................................................................................................ 50
DE NOVO BIOGENESIS SYSTEM ........................................................................ 50
PROBLEMS WITH PROTOCOLS: LIPID ANALYSIS ......................................... 75
SMALL PROJECTS ................................................................................................. 79
DISSCUSSION ................................................................................................................ 98
SUMMARY .............................................................................................................. 98
FUTURE DIRECTIONS .......................................................................................... 99
CONCLUSION ...................................................................................................... 109

vii
LIST OF TABLES
TABLE ONE YEAST STRAINS AND PLASMIDS .................................................. 114

viii
LIST OF FIGURES
FIGURE ONE TOPOLOGY AND STRUCTURAL DOMAINS OF HUMAN
SEIPIN ............................................................................................................................. 38
FIGURE TWO TOPOLOGY PREDICTION FOR ISOFORM 1 USING THE
TRANSMEMBRANE HIDDEN MARCOV MODEL (TMHMM) PREDICTION
METHOD ....................................................................................................................... 38
FIGURE THREE ALIGNMENT OF SEVERAL SEIPINS USING PROMALS
(PROFILE MULTIPLE ALIGNMENT WITH STRUCTURE)...................................... 39
FIGURE FOUR LENS MODEL OF LD BIOGENESIS ......................................... 39
FIGURE FIVE LD BIOSYNTHESIS MODEL USING COPI COATED VESICLES TO
FORM NASCENT LD .................................................................................................... 40
FIGURE SIX SEIPIN DELETION ALTERS LIPID DROPLET BIOGENESIS OF
TRIACYLGLYCEROL DROPLETS .............................................................................. 84
FIGURE SEVEN SEIPIN DELETION INHIBITS EARLY TAG FORMATION,
INTEGRITY OF FLUORESCENT BODIES, AND POSSIBLY TAG PACKAGING . 86
FIGURE EIGHT SEIPIN DELETION DECREASES TAG DROPLET SIZE AND
INDUCES DROPLET FORMATION IN NUCLEI ........................................................ 88
FIGURE NINE SEIPIN DELETION MODESTLY AFFECTS SE FLUORESCENT
BODY FORMATION ...................................................................................................... 91
FIGURE TEN EFFECTS OF SEIPIN DELETION ON NEUTRAL LIPID LEVELS
BASED AS MEASURED BY VARIATIONS OF LIPID EXTRACTION PROTOCOL ..
.......................................................................................................................................... 92

ix
FIGURE ELEVEN SEIPIN DELETION DOES NOT SEEM TO ENHANCE
SUSCEPTIBILITY TO DEATH DUE TO ER STRESS ................................................ 93
FIGURE TWELVE EFFECT OF DIFFERENT DETERGENTS ON THE SEIPIN
HOMO-OLIGOMER ....................................................................................................... 94
FIGURE THIRTEEN SEIPIN DELETION ALTERS THE PROTEIN COMPOSITION
OF LIPID DROPLETS .................................................................................................... 95
FIGURE FOURTEEN 4KOFLD1Δ CLUSTERS HAVE EVIDENCE OF LENS-LIKE,
FLAT DROPLETS IN COMMUNICATION WITH MEMBRANES AND
PHOSPHOLIPID-DEFINED, MEDIUM ELECTRON DENSITY DROPLETS ........... 96
FIGURE FIFTEEN MORPHOLOGY OF 4KO AND 4KOFLD1Δ FLUORESCENT
BODIES 6 HOURS AFTER SWITCH TO GALACTOSE MEDIUM ......................... 111
FIGURE SIXTEEN LINEAR REGRESSIONS OF DATA FROM FIGURE 6 B AND C
AND FIGURE 7 A......................................................................................................... 112
FIGURE SEVENTEEN (A-C) LINEAR REGRESSIONS OF DATA FROM FIGURE 9
B AND C. (D) COMPARISON OF THE AREA OF FB IN STRAINS EXPRESSING
GAL-DGA1 COMPARED TO THOSE EXPRESSING GAL-ARE1 .......................... 113

x
LIST OF APPENDICES
APPENDIX A ............................................................................................................... 110

xi
LIST OF DEFINITIONS
LD – Lipid droplet
FB – Fluorescent body
TAG – Triacylglycerol
SE – Steryl-ester
DAG-Diacylglycerol
PA – Phosphatidic acid
IGF1 – Insulin-like growth factor 1
PPAR – Peroxisome proliferator-activated receptor
HDEL – Peptide corresponding to the C-terminus of yeast BiP
ADRP – PLIN2: Adipose differentiation-related protein
aP2 – Adipocyte protein 2
GLUT4 – Glucose transporter type 4
C/EBP – CCAAT-enhancer-binding protein
HAC1 – Homologous to Atf/Creb1 (transcription factor that activates UPR when
spliced)
FITC – Fluorescin isothiocyanate
CHAPS – 3-[(3-cholamidopropyl)dimethylammonio]-1-propanesulfonate
DTT – Dithiothreitol, reducing agent
MEF – Mouse embryonic fibroblast
IBMX – 3-isobutyl-1-methylxanthine, a competitive nonselective phosphodiesterase
inhibitor
1
Introduction
My research is focused on the role that seipin, the product of FLD1 in the
yeast Saccharomyces cerevisiae, has in lipid droplet biogenesis. My lab identified
yeast seipin in a lipid droplet morphology screen of a gene knockout library 2.
Seipin is orthologous to the product of BSCL2 (Berardinelli-Seip congenital
lipodystrophy type 2) in humans. Mutation of BSCL2 or knockout of the
analogous genes in mice or flies results in lipodystrophy, or lack of normal
adipose tissue. My introduction will focus on a brief history of Berardinelli-Seip
congenital lipodystrophy, current knowledge of seipin, and current models and
questions of lipid droplet biogenesis.
A. Berardinelli- Seip Congenital Lipodystrophy
BSCL2 was first identified in humans as the second locus of mutations for
the congenital disease Berardinelli- Seip lipodystrophy 3. BSCL2 lipodystrophy is
an autosomal recessive disorder, and most of the mutations identified in patients
are thought to be null mutations or to produce inactive protein. Its prevalence is
only 1 in 10,000,000 people in the United States, but it is much more common in
Lebanon and Portugal with prevalence of 1 in 200,000 and 1 in 500,000
respectively 4. (As a reference point, Severe Combined Immunodeficiency, or
“bubble boy disease”, has a prevalence of 1:100,000-1:50,000 5, with about half

2
of the cases caused by various autosomal recessive mutations 6.) Lipodystrophy,
of which BSCL2 is the most severe form in humans, can be caused by external
factors such as HIV infection 7, 8
, antiretroviral drugs 7, or repeated injections of
insulin or other drugs 9-12
, or by hereditary factors, such as mutations in lamin A/C
or in 1-acyl-sn-glycerol-3-phosphate acyltransferase beta (AGPAT2), causing
BSCL type 1. Most milder lipodystrophies present as abnormal deposits of fat, but
BSCL2 is a practically complete loss of adipose tissue, including mechanical
adipose in and around joints and cushioning the soles of the feet 13
.
The virtual absence of adipose tissue leads to other symptoms of the
disease. Without the ability to store neutral lipids normally, the body stores fat
ectopically in liver, muscle, and other tissues, and in the bloodstream. Storing
lipids in the liver and spillover into the blood leads to early-onset diabetes
mellitus, as it does in many obese individuals. Also common to insulin resistance
14, is acanthosis nigricans, characterized by dark velvety folds of the skin. This is
thought to be a result of insulin spillover into the skin 14, 15
. As the liver
accumulates fat, it can expand in size (hepatomegaly) enough to result in pain.
This can occur in other organs too, such as the spleen. Enlargement of organs in
the abdominal region can lead to umbilical hernias. Loss of adipocytes leads to
underproduction of leptin and adiponectin16
. Hypermetabolic characteristics are
often seen in lipodystrophic individuals, including an increase in appetite, linear
growth, and bone age 4. While leptin deficiency probably contributes to the

3
increase in appetite, accelerated linear growth 17, 18
and bone age 19, 20
may have as
much to do with the ability of insulin to activate IGF1 receptors at high
concentrations 21
. BSCL2 loss of function probably relates to the mental
retardation seen in many sufferers, since BSCL2 is highly expressed in human
brain, although the cause of mental retardation is understudied 3. Van Maldergem
et al. stated that MRI was normal in mentally challenged BSCL2 lipodystrophy
patients, but no data was shown or citation offered 22
. Lastly, a decrease in plasma
HDL is seen in all lipodystrophies, including BSCL2 23
.
Several of the effects in the patients with BSCL2 are seen in any disorder
where pre-pubertal diabetes is a hallmark, including acromegaloid features,
muscle hypertrophy, and many of the problems seen with the female reproductive
system. The features of acromegaly associated with BSCL2 are the enlargement
of the hands, feet, and jaw, and they are linked to diabetes independent of IGF-1
24. Muscle hypertrophy is probably caused by both juvenile diabetes through IGF-
1 signaling 25
and by ectopic neutral lipid storage 26
. Female reproductive
problems of BSCL2 include hirsutism (facial or chest hair), menstrual
irregularities and, in the worse cases, polycystic ovarian syndrome. All three of
these can result from insulin stimulation of IGF-1 receptors in ovaries resulting in
androgen production 14, 27
. In fact, acromegaly, organomegaly, a hypermetabolic
state, and muscle hypertrophy may all be secondary to increased IGF-1 signaling
in BSCL2 lipodystrophy.

4
BSCL2 mutations also have effects on lifespan. One study showed
premature death in BSCL2 lipodystrophy to be as high as 15% 22
. Premature death
can result from diabetes-related renal failure 22
, liver failure 22
resulting from
cirrhosis 26
, hypertrophic cardiomyopathy 22
(in 20-30% of BSLC2 lipodystrophy
presentations), and acute pancreatitis and pancreatic failure (when unmanaged)
resulting from high circulated lipid levels 28, 29
. Hypertrophic cardiomyopathy is
another symptom of BSL2 lipodystrophy that may be caused by increased IGF-1
signaling 14
.
Management of BSLC2 lipodystrophy is limited to treating diabetes and
hyperlipidemia in all BSCL2 individuals, and care of the more severe symptoms
of cardiomyopathy and mental retardation as they occur. Extreme reduction of fat
intake, one of the most effective ways to manage this severe disorder 30
, helps
reverse the hyperlipidemia, and the limitation of saturated fats and cholesterol
improves risk of heart disease. The fibric acid class of PPARα agonists and ω-3
fatty acids (fish oils) also improve hypertriglyceridemia 30
. The complications of
lipodystrophy due to childhood diabetes are treated with insulin. Metformin can
be used to help insulin sensitivity and curb appetite 31
. The PPARγ agonist
troglitazone appeared to improve two patients in clinical trials, even though it did
not promote adipocyte differentiation. (Early experiments with cultured cells
showed that seipin knockdown decreased PPARγ activity, and a PPARγ agonist
promoted adipocyte differentiation in cells in which seipin was knocked-down 32
.)

5
A very beneficial treatment of BSCL2 lipodystrophy, particularly to attenuate
appetite and metabolic disorder, is leptin replacement 33, 34
, although leptin
replacement has led to renal failure and T-cell lymphoma 33
. Management of the
hypertrophic cardiomyopathy usually involve β-blockers 35
, anti-arrhythmia
medicine 36
(if arrhythmia is present), and if severe, myectomy 37
or implanted
pacemakers 38
. Management of intellectual impairment includes special education,
speech therapy, and vocational training as needed. Better understanding of the
causes of the manifestations of the disease and the mechanism of the function of
seipin could lead to better therapies that would improve these peoples’ lives and
possibly those suffering from insulin resistance. If the onset of diabetes could be
delayed, several of the IGF-1-related presentations of BSCL2 lipodystrophy might
be avoided.
A clue to seipin function might be provided by consideration of the other
loci mutated in generalized lipodystrophy. The most closely related to BSCL2 in
terms of disease phenotype is BSCL type 1, caused by mutations in AGPAT2, as
noted above. The enzyme converts lysophosphatidic acid into phosphatidic acid
(PA) by adding an acyl chain to the glycerol backbone. Subsequent
dephosphorylation of PA, and addition of a third acyl chain results in
triacylglycerol (triacylglyceride), one of the two major lipid families in lipid
droplets (the other being steryl-esters). BSCL1 is a less severe disorder than
BSCL2 since mechanical fat develops 13
, mental retardation does not occur, and
6
leptin levels are slightly higher 13, 4
. This implies that seipin may be upstream of
AGPAT2 before a branch-point in the genetic pathway, although BSCL1 has an
additional phenotype of lytic bone lesions 39
. It is important to note that seipin
itself has no homology to any enzymatic domains; human and rodent seipin,
however, have weak homology to midasin, a nuclear chaperone required for
ribosome maturation 40
.
Other causes of congenital generalized lipodystrophy are mutations in
caveolin-1 (one case) and cavin-1 (multiple cases 41, 42
), which allows caveolin-1
to form oligomers and deform the membrane to produce caveolae 43, 44
. The
lipodystrophy caused by caveolin-1 loss-of-function spared bone marrow fat and
had a less severe loss of mechanical fat compared to BSCL2 45
. Additionally,
there was no mental retardation or acromegaly, although the caveolin-1 deficient
patient had mild hypocalcemia. Caveolin-1 deletion in mice also resulted in
lipodystrophy 46
. Cavin-1 loss-of-function lipodystrophy (also called CGL4) is
similar to caveolin-1 lipodystrophy in adipose tissue development, but it is further
characterized by smooth muscle hypertrophy, skeletal myopathy, impaired bone
development, and heart arrhythmias that vary in type between individuals 41, 42, 47
.
Cavin-1 mutations in muscle biopsies or cultured cells cause caveolin 1, 2, and 3
to appear less punctate and even absent at plasma membrane, determined by
immunohistology, and caveolae were also difficult to detect. The pleotropic

7
effects of cavin mutations could explain why there were more defects in the
corresponding patients compared to the one with caveolin-1 deletion.
B. Seipin
Identification
In 2001, Magre et al. first mapped thirteen mutations responsible for
congenital generalized lipodystrophy to a locus with an unidentified open reading
frame that they termed BSCL2 and a gene product that they termed seipin after the
co-discoverer of the syndrome 3. Nine mutations coded for nonsense mutations
resulting in protein truncations, three were large deletions, and one was a
missense mutation. While heterogeneity was evident, they all were assumed to be
loss-of-function alleles. (The authors assumed the A212P missense substitution
led to altered protein folding.) In this report, they also mapped mutations in
patients from twenty families to AGPAT2, a previously identified locus for
congenital, generalized lipodystrophy, furthering the idea that multiple loci were
responsible for the loss of adipose tissue in human development. Finally, they
identified homologues to BSCL2 in mice and flies, and they showed that brain and
testis were the tissues that had the highest expression of seipin mRNA transcripts
in humans.

8
Twenty years later, the field has yet to identify the molecular function of
seipin. In one sense, we have only had two decades to study the function of this
gene, and the field is just now studying knockout mice to determine the function
of the gene in the context of lipodystrophy. In another sense, the seipin field has
already had two decades to study this gene in detail, and while multiple
phenotypes have been described, no one has deduced function. I believe progress
towards identifying function has been made, as discussed in the following section,
although this goal has not yet been achieved.
Topology and Structure
After seipin was discovered, some effort was made to determine its
membrane topology and intracellular location. Before linkage to human seipin
was discovered, yeast seipin was included in a study of thirty-seven
uncharacterized yeast proteins that were predicted, based on primary sequence
and likely secondary structure, to contain two transmembrane domains 48
. To
assess topology, the authors fused either the asparagine-linked glycosylation
motive (active in the ER lumen) and a His4p domain (conferring histidine
prototrophy if facing the cytosol) to the carboxy termini of the proteins. They
concluded from this study that the carboxy terminus, and by inference the amino
terminus, of the proteins were both exposed in the cytosol 48
.

9
A subsequent report assessed the topology of human seipin, specifically
the long 462 amino acid isoform 1 (see below for multiple products). From
expression in vivo, the human protein was found by Windpassinger et al. to be
glycosylated in the sequence, termed the loop, between the two predicted
transmembrane domains 49
. Lundin et al. used in vivo expression and in vitro
reconstitution to confirm this and show that the protein was not glycosylated
when the site was mutated 50
. This indicates that the loop has access to the lumen
of the secretory pathway, consistent with a previous report of ER localization
from a paper on glycosylation mutants of seipin 49
. When Lundin et al. engineered
versions of seipin with glycosylation sites in the N- or C-termini, neither was
glycosylated, indicating that they were facing the cytosol 50
. Therefore, the parts
of the protein are now referred to as N-tail (facing the cytosol), N-transmembrane
domain (NTM), lumenal loop, C-transmembrane domain (CTM), and C-tail (also
facing the cytosol) (Figure 1 50
). One of the interesting findings of this paper was
that the lumenal loop had one weak scoring transmembrane domain (Figure 2 50
),
suggesting that the loop is somewhat hydrophobic, and unpublished data from our
lab shows that the luminal loop expressed separately and targeted to the ER lumen
is tightly associated with the ER membrane.
As previously stated, the first human seipin paper identified mouse and
fruit fly homologues of human BSCL2, and since then, frog, worm, rat, yeast,
several plant, and other seipins have been identified. All of these share secondary

10
structure, especially the transmembrane domains and several sections of the
intervening loop that form secondary structure, as shown in Figure 3 2. While the
core is conserved, species-specific functions and/or interactions, assuming they
exist, may occur outside of this area in the N-tail and C-tail extensions, which
vary in length (4-102aa, and 4-467aa, respectively) and sequence 51
.
Expression
Human seipin has two isoforms, at least in cell culture. Isoform 1 (462
amino acids total) contains an 89 amino-acid-long N-tail and a 138 amino-acid-
long C-tail, while the loop contains 194 amino acids and each transmembrane
domain contains 21 amino acids. Isoform 2 (398 amino acids) contains a
shortened 25 amino acid N-tail, but the rest of the protein is identical to isoform 1.
There are three human transcript variants shown by northern blotting in the Magre
et al. paper that produce these isoforms, two of which were confirmed by
Windpassinger et al. 49
. Transcript one is 2.2 Kb and transcript two is 1.8 Kb,
starting at two different sites in exon 1 49
. The entire gene codes eleven exons,
with transmembrane domains coding from exons 2 and 7. While transcript two is
specifically expressed in the brain and transcript one is nearly ubiquitous, both
can produce either isoform. There is a third transcript in the Magre et al. paper
that is about 1.6 Kb and starts in exon 2. This short transcript presumably just
produces isoform 2 50
, and it was also ubiquitously expressed 3. If cDNA is

11
expressed in vivo, it produces both isoforms, yet if it is expressed in vitro, only the
longer isoform 1 is produced 50
. Additionally, when both isoforms are produced,
the larger isoform is more abundant. The yeast protein contains 285 amino acids
with slightly longer predicted transmembrane domains than in human seipin, each
of 23 amino acids, and a slightly longer loop domain of 218 amino acids
compared to human seipin. The N- and C-tails are both markedly shorter than
human seipin, 12 and 11 amino acids, respectively.
In the Magre et al. paper 3, human seipin mRNA was mostly expressed in
the brain and testis. Subsequent work using a human seipin (hseipin) antibody
revealed brain expression in motor neurons in the spinal cord and cortical neurons
of the frontal lobe, while in the testis, spermatid were stained, peaking at
developmental steps 6 and 7 52
. In contrast, there was considerably less mRNA
expression in (in descending order) the pancreas, kidney, ovary, skeletal muscle,
liver, heart, adipose tissue, colon, and small intestine 3. It is interesting that
expression in adipose tissue, where seipin appears to have a critical function, is
very low. Conversely, it is somewhat surprising that testis expression is so high,
since male sterility is not a phenotype of BSCL2. High expression in the brain
makes some sense, since mental retardation is a fairly common feature of BSCL2,
and mutations in glycosylation of seipin lead to the autosomal dominant disorders
in the nervous system termed seipinopathies (discussed below).

12
In contrast, in mice and flies, adipose tissue had the highest or second-
highest expression among tissues examined 53-55
. Testis had the highest expression
in mice, roughly equal to adipose, yet brain expression is considerably lower, and
is similar to that in the kidney 53, 54
. In the fly, brain had the lowest level of
expression of those tissues they measured 55
. Possibly, seipin is required for
specialized uses of fat, such as the myelin sheath of motor neurons, rather than the
bulk storage of fat. In mice, for example, seipin was expressed at a higher level in
brown adipose tissue than white. Regardless of these differences, expression
patterns should be clues to seipin function that the field has not yet decoded.
Seipinopathies
Seipinopathies are a group of neurodegenerative diseases related to an
impairment of the myelin sheath 56
that are caused by autosomal dominant
mutations in BSCL2. They are often considered gain of function mutations, while
BSCL2 lipodystrophy is caused by loss of function mutations. Seipinopathies
were first described by Windpassinger in the role of BSCL2 in distal hereditary
motor neuropathy and Silver syndrome 49
. Aside from mostly confirming the
work from Magre in tissue expression and showing that expressed seipin localized
to the ER, Windpassinger et al. showed that BSCL2 was the locus of mutation for
these two neurological diseases 49
. The mutations were single amino acid
substitutions that abolished asparagine-linked glycosylation. Lack of
13
glycosylation seemed to cause seipin to form large aggregates, which they
believed was the cause of neurodegeneration. This thread of thought was
continued by Ito and Suzuki. Mutant seipin was probably unfolded in the ER
since it could be pulled down in an immunoprecipitation with the ER chaperone
calnexin. Expression of mutant seipin caused an increase in protein expression of
ER stress proteins in a neural cell line 57
. Mutant seipin also increased tunnel
staining in non-neural cells, indicating that it caused apoptosis and suggesting that
the neurodegeneration was due to cell death caused by ER stress.
Yagi and Suzuki released contradictory evidence, however, when they
published the phenotype of mice expressing mutant seipin. While the animals had
upregulated ER stress markers, similar to what they found earlier in cells, there
was no increase in neuronal death 58
. These data indicate that ER stress is
associated with (they state sufficient for) seipinopathies, but nerve degeneration
appears not to be caused neural death. Most recently, evidence was published that
the aggregates were actually protective 59
. They attenuated ER stress (measuring
the protein CHOP) and cell death (assayed by terminal deoxynucleotidyl
transferase dUTP nick-end labeling) when aggregates were present compared to
cells that were expressing mutant seipin and did not have aggregates (now termed
inclusion bodies). Considering all these data, the model is now that the inclusion
bodies segregate mutant seipin from wild type seipin. Perhaps the neurons that
cannot efficiently do this have decreased function.

14
In summary, while seipinopathies first appeared to be a result of
nonspecific aggregation of unglycosylated seipin, current insight suggests that
neurological manifestations in patients may be due to a specific dominant-
negative effect related to the inclusion bodies themselves, or seipin specifically.
The dominant-negative effect of mutant seipin may sequester wild type seipin to
inclusion bodies, resulting in a loss of wild type seipin function in cells with
inclusion bodies. The inclusion bodies may protect from cell death, but either
dominant-negative effects or inclusion bodies may impair myelin formation and
neurotransmission.
Yeast seipin (Fld1p) discovery and its role in lipid droplet (LD) morphology
As mentioned before, our lab identified yeast seipin, although the gene
name FLD1 (Fewer Lipid Droplets) was given to it slightly later 60
. The name is
somewhat of a misnomer because, while fld1Δ droplets appear fewer than wild
type by fluorescence microscopy, this is not always true when observed by
electron microscopy. Lipid droplets in fld1Δ yeast generally fall into two
morphologies: large droplets (“supersized”), or small droplets in clusters,
although clusters can appear in fluorescence microscopy to be large, irregular (in
shape) droplets. Considering this heterogeneity, not all seipin knockout cells have
fewer droplets than wild type. Electron microscopy reveals that clusters are
comprised of numerous small lipid droplets with electron dense inclusions that

15
appear to be chaotically budding from ER membranes, much like what is seen in
fibroblasts and lymphoblasts from BSCL2 patients 2, 61
. Supersized droplets are
seen more often when yeast are grown in minimal medium to the stationary phase
of growth. This seems to be due to an increase in phosphatidic acid, since PA is
elevated in these cells and supplementing with inositol (which reduces PA)
greatly diminishes the percentage of cells with supersized droplets 62
. It has also
been suggested that supersized droplets are a result of smaller ones fusing, since
this has been shown to occur in vitro 60
. In this paper, Wolinski et al. also
demonstrated the reversibility of the formation of supersized droplets by adding
fresh rich media to fld1Δ yeast, which favors a small droplet cluster phenotype 63
,
indicating that they have the ability to undergo fission as well.
Our group reported that clusters of small droplets are often wrapped by
membranes, the result of local ER proliferation 2. This has been confirmed by
Wolinski et al., who additionally showed that, supersized droplets are in close
proximity to “a bar-like proliferation of the ER,” and “a fraction of LD (small
droplets)…was almost completely enclosed by ER membranes 63
.” They proposed
that these tangles may be the cause of the impairment that they observed in LD
inheritance and intracellular movement in fld1Δ yeast compared to wild type. In
contrast to direct fld1Δ phenotypes, ER wrapping, LD clustering, and supersized
droplets may all be compensatory mechanisms to reduce lipolysis. (Recent
evidence indicates that lipolysis is upregulated in BSCL2-/- mice, which will be

16
discussed below 64
.) Indeed, Wolinski et al. observed a decrease in Tgl3p
localization to LD 63
. They interpreted this as a defect due to fld1Δ, but it could be
an indirect effect of ER proliferation masking the droplet surface. Droplet
proliferation can also be caused by ER stress. However, we have evidence
(discussed in Results) that seipin deletion and the resulting cluster formation does
not cause an ER stress response in yeast.
The clustering of small, aberrant droplets and/or supersized droplet
phenotypes may be yeast-specific, since neither are present in fibroblasts or
lymphoblasts from BSCL2 patients. If seipin has crucial control over an enzyme
related to PA utilization in yeast (and therefore droplet size), the pathway of PA
utilization may be redundant in humans. In BSCL2-/- mice, hepatic tissue has
oversized multilocular lipid droplets 64, 65
. The increase in size is probably simply
due to excess lipidemia and lipid uptake. However, mouse embryonic fibroblasts
from BSCL2-/- mice that are differentiated into adipocytes appear to have larger,
fewer droplets during differentiation (Day 5 to Day 10) compared to those from
the wild type controls. Therefore, in tissues that can make large droplets, seipin
deletion appears to make supersized droplets in mammalian cells as well as yeast.
The actual clustering of the small chaotic lipid droplets in tangles present in fld1Δ
yeast has so far only been seen in yeast.
Seipin oligomerization

17
While over-expressed in cultured cells, seipin localizes widely in the ER,
but it specifically localizes to ER-lipid droplet junctions as puncta when the
chromosomal copy is viewed as a mCherry fusion protein in yeast 2. In
transmission electron microscopy images, seipin localized by immuno-gold
staining was also concentrated at ER-lipid droplet associations. When the fusion
protein is over-expressed on a low-copy plasmid, large patches rather than puncta
are observed. Droplets are always associated with endogenously expressed seipin-
mCherry under basal conditions, but if droplets are induced to increase in size by
adding oleic acid, the seipin puncta outnumber droplets (Adeyo and Goodman,
unpublished data). This may indicate that seipin is involved in droplet birth, but
not droplet expansion. Our evidence that seipin is at this junction suggests that it
is important for this ER-droplet communication. However, since cells still make
droplets in the absence of seipin, it is not required for lipid droplet biogenesis.
Droplet-ER communication appears to be important since most of the
droplets appear to be associated with the ER in yeast. To co-localize droplets and
the ER, we expressed CFP-HDEL as an ER marker, and used BODIPY, a
fluorescent dye that binds to neutral lipid, to mark lipid droplets. Virtually all
lipid droplets (95%+) remained associated with ER. Time-lapse microscopy
showed that droplets could move laterally on the ER plane, which they often did,
but no dissociation from the ER membrane was observed 66
, a result that has been
independently confirmed 63
.

18
Discrete seipin puncta suggest that seipin protein may self-associate, or at
least localize to ER micro-domains. This hypothesis is aided by the fact that
seipin expression is fairly low (about 800 molecules per cell compared to 17700
molecules/cell of Sec63p, another ER membrane protein 67
), but it is still visible
by fluorescence microscopy at endogenous levels in these puncta. Additionally,
immuno-gold transmission electron microscopy revealed seipin concentrated at
LD-ER junctions although it is also seen in other places in the ER. During a study
aiming to find binding partners, we found that seipin indeed oligomerizes 68
.
Detergent-solubilized seipin from crude membranes migrates on detergent
glycerol gradients during centrifugation faster than predicted if it were a
monomer. After correcting for detergent molecules using H2O and D2O sucrose
gradients, both over-expressed seipin-mCherry, endogenous (genome level)
seipin-13xmyc fusion proteins, and over-expressed, untagged seipin migrate at a
velocity in sucrose gradients consistent with a homo-oligomer of 9 molecules 68
.
This rules out the effect of a specific epitope tag, any tag at all, or overexpression
(at least between the two fusion proteins) causing oligomerization. The fact that
the expression level does not change the degree of oligomerization is evidence for
the stability of this nonamer.
The only way to alter the size of the oligomer was to over-express seipin-
mCherry in cells expressing normal seipin-13xmyc at the genome level; this
shifted the migration of seipin-13xmyc to a larger apparent molecular weight 66
.

19
Nearly all the mutations that cause lipodystrophy in humans are nonsense
or frameshift mutations in the lumenal loop domain, resulting in truncated
proteins that are assumed to be either non-functional in the context of adipose
formation, or quickly degraded. One missense mutation towards the end of the
lumenal loop domain, A212P (numbered by isoform 2), causes the formation of
an aberrant but full-length protein 2. Our lab generated the homologous mutation
in yeast, G225P 2.
We showed, using an antipeptide antibody we developed, that
[G225P]seipin is much less abundant than wild type form suggesting it is quickly
degraded 68
. A C-terminal epitope tag increases the stability of [G225P]seipin.
Upon arrest of protein synthesis, [G225P]seipin almost completely degrades
within six hours while wild type hardly changes its. While we could detect
untagged over-expressed [G225P]seipin in concentrated cell extracts with our
antibody, we were unable to detect it after centrifugation to try to assess its
oligomerized form 68
. However, we could sufficiently detect over-expressed
[G225P]seipin-mCherry or [G225P]seipin-13xmyc expressed chromosomally
(from its endogenous promoter). Using these proteins and wild type controls, we
found that both -mCherry and -13xmyc versions still formed oligomers, although
they were reduced to a trimer and hexamer, respectively 68
. Therefore, it was not
surprising that addition of over-expressing [G225P]seipin-mCherry decreased the
oligomeric size of genome-level [wt]seipin-13xmyc oligomer present in

20
membrane preparations between the sizes of the oligomers produced by the two
proteins separately. This implies that seipin self-associates, and that
[G225P]seipin stabilized by C-terminal tags, has a dominant effect on the size of
oligomer. The point mutation in the loop does not change the structure of the
protein enough (while tagged) to discourage seipin-seipin interactions. It will be
interesting to see what parts of the protein can and cannot associate.
One caveat to these studies is the possibility that these oligomers are not
exclusively seipin molecules, and there have been several attempts in our
laboratory to find other binding proteins to seipin. Several proteins were found to
co-migrate in glycerol gradients with seipin, and mass spectroscopic analysis
identified some of these to be mitochondrial ATPase subunits. However, the
ATPase is a similar size as the seipin nonamer. Pull-down studies did not reveal
ans specific binding proteins other than common chaperones (Binns and
Goodman, unpublished data). To more definitively identify any binding partners,
we purified seipin from solubilized crude membranes using a 13xmyc tag version
of seipin with an engineered TEV site between the protein and tag. After binding
the protein to anti-myc beads, we separated seipin from the tag with TEV protease
68. When this preparation was run on SDS-PAGE and silver-stained, seipin was
the major band; minor bands of protein were also detectable, but they were also
seen in parallel extracts from cells not expressing seipin. While we are still
limited by the detection level of silver stain and cannot rule out unstable

21
interactions with seipin (monomer or oligomer), thus far we have been unable to
detect any heterologous binding partners for seipin using these approaches.
To determin if the seipin nonamer macromolecule had visible structure,
purified seipin was subjected to negative staining and electron microscopy. We
saw multiple disk shaped particles that appeared to have holes in the center (like
toroids) 68
. We assume this is the structure of the oligomer, since monomers might
be too small to be visible. There is a discrepancy in that the Stokes’ radius we
calculated for seipin (with the 13xmyc) was about twice the actual radius of the
toroids 68
. However, Stokes’ radius was calculated from data using the 13xmyc
tag, while the toroids had the epitope tag removed before electron microscopy
imaging. The myc epitope is only 10 amino acids, but in the toroid, 13xmyc
would add an additional 1170 amino acids compared to 2565 amino acids of
seipin (both assuming a seipin homo-nonamer). That is not enough to account for
the doubling in radius of the complex, but 13xmyc could be more splayed out
compared to seipin. There are other factors also, such as the amount of detergent
bound, which was a lower percentage in the purification than for the
determination for Stokes’ radius 68
. The toroid is a common shape for RNA
binding proteins 69
, but these are soluble while seipin is an ER protein. Some
chaperones also form toroids 70
. This could be another clue to seipin function: Is
seipin a membrane protein chaperone? If so, why don’t we see binding partners?

22
Unfortunately, we have not yet improved our yield of seipin sufficient enough to
perform detailed structural studies of the toroid macromolecule.
Role of seipin in lipid metabolism
Shortly after we reported yeast seipin, the lab of Hongyuan (Rob) Yang in
Australia (Singapore at the time) published a similar screen of lipid droplet
morphology in which seipin was also identified 60
. Most of Yang’s following
papers follow two lines of the story: 1 -seipin is involved in phospholipid
synthesis, and this related to the supersized droplets observed in yeast (discussed
earlier); 2 -seipin knockdown causes increased oleate incorporation into TAG,
and over-expression causes decreased incorporation into TAG in cell lines and
mouse models. Both of these indicate that seipin is involved in lipid metabolism.
An interesting, but puzzling finding from the Yang lab is that gene chip analysis,
looking for changed expression in the fld1Δ yeast strain, revealed that two
proteins were significantly upregulated: INO1 (inositol 3-phosphate synthase,
upregulated 5-fold) and OPI3 (phospholipid methyltransferase, upregulated
almost 4-fold). Regarding lipid levels, a modest increase in microsomal PA was
present, which has been shown to increase transcription of these genes 71, 72
. The
increase in transcription should, theoretically, shunt PA into PI (synthesis of
which is controlled by INO1) and PC (controlled by OPI3). However, while PA is
increased over wild-type, there have been no reports of an increase in PI or PC.

23
Additionally, total phospholipid/TAG ratio is actually decreased compared to
wild-type, but this may also be influenced by a modest (25%) increase in TAG
(discussed next). So, does fld1Δ up-regulate PA formation, which causes the cell
to compensate by increasing flux into PI/PC? Or does seipin interfere with the
flux of PA into PI/PC, which causes an accumulation of PA and a decrease of
overall phospholipid?
I mentioned above that neutral lipid is increased in fld1Δ cells, and this is
one of the major themes of the Yang lab. The lab reported it first in their LD
morphology screen paper as a supplemental figure that showed that fld1Δ yeast
had twice the whole cell TAG and SE (neutral lipid) as wild type when the cells
were grown in rich media 60
. If grown in minimal media, the lab reported later
that neutral lipid levels only increase about twenty-five percent 62
. The cause of
this increase was not apparent since there was no increase in short-term
incorporation of tritiated oleic acid into TAG, although the amount or rate of
lipolysis was not mentioned. They also reported mild alterations in the
phospholipid-derived fatty acid species as well as the free fatty acid pool. I could
not confirm a large increase in TAG or SE in fld1Δ yeast compared with wild
type. I occasionally noticed a slight increase of TAG in fld1Δ yeast in certain
types of media, such as oleate, but the increase was small. In lymphoblastoid cell
lines generated from primary lymphocytes of seipin patients, the TAG level was
actually reduced 61
.

24
However, analysis of cell lines with altered seipin expression suggested
that seipin negatively regulates neutral lipid levels, supporting Yang’s results.
When seipin is knocked down in HeLa cells or 3T3 fibroblasts (without adipocyte
differentiation) followed by culturing in oleic acid-containing medium, both cell
types had increased steady-state TAG levels and increased the rate (over two
hours) of labeled oleate incorporation into TAG 73
. Conversely, when either
isoform of hseipin, tagged with mCherry, is overexpressed in cells cultured in
oleic acid, both HeLa and 3T3 cells had decreased lipid droplets, decreased TAG,
and decreased incorporation into TAG. Also, a TET promoter (which induces
transcription upon docycycline addition) was employed to show that lower seipin
expression compared to over-expression decreases droplet formation. Over-
expressed [A212P]hSeipin (orthologue to [G225P]ySeipin) was inactive: it did
not inhibit droplet formation or change glycerol release (a measure of lipolysis),
microsomal TAG formation, or expression of lipogenic genes. In these studies,
multiple tags (mCherry, HA, myc) were used to rule out specific effects of a
specific tag on lipids or droplets.
In our experience we usually do not see such effects in yeast over-
expressing hseipin or yseipin 2. When I over-express yseipin-mCherry, I have
seen a decrease in lipid droplets in a very small fraction of cells that have very
intense mCherry signal in certain strains, 4KOfld1Δ and 4KO cells (upon Gal-
DGA1 expression) that will be described in Results, but they differ from wild type

25
in that they are both induced to generate TAG. The HeLa and 3T3 cells in the
previously described experiment were also induced to synthesize TAG, so
perhaps seipin only affects TAG synthesis when cells are induced to promote
TAG storage. Also, the authors always used a tagged version of seipin, which
could influence effects on TAG levels. They partially ameliorate this caveat by
also expressing a native protein in mice, but they chose to over-express human
seipin (short isoform 2).
In mice, over-expression of hseipin (short isoform) increased basal as well
as hormone-stimulated lipolysis in white adipose tissue, measured as glycerol
release from cells 74
. The animals also had less total adipose tissue according to
MRI, as well as smaller adipocytes and droplets. The decreased lipid in
adipocytes is consistent with their findings in cell lines. These mice also had
increased mRNA expression of lipases and all perilipins (mammalian LD proteins
that help control lipolysis) except Plin2 (ADRP) in white adipose tissue. While
only a small increase in non-esterified fatty acids in the bloodstream was shown,
the transgenic mice did have increased ectopic neutral lipid storage in the liver.
Compared to the over-expression studies, ablation of mseipin (deletion of exon 3
only), lead to a much more severe decrease in adipose tissue amount, droplet size,
and resistance to insulin 65
. However, there was no hypertriglyceridemia and only
a small increase in cholesterolemia, both of which are severe in human BSCL2
lipodystrophy. The liver displayed ectopic lipid storage with increased mRNA of

26
fatty acid synthase, Δ9-desaturase (although, as mentioned earlier, desaturated
fatty acids were decreased in cells from human patients 61
), and PPARγ in the
liver.
Chen et al. have also reported the generation of seipin-knockout animals
(again deleting exon 3) 64
. As for the results form the Yang lab 65
, this group also
reported that the animals were lipodystrophic; in addition they found that lipolysis
was increased in white adipose tissue (WAT), as was found for transgenic hseipin
(short isoform) mice. The animals displayed increased hypertriglyceridemia and
plasma NEFA (non-esterified, or “free”, fatty acids) after re-feeding and insulin
resistance. Importantly, in MEFs (mouse embryonic fibroblasts) differentiated
from these mice there was an increase in lipolysis due to an increase in cAMP and
PKA (protein kinase A) activity. Basal (unstimulated) glycerol release and basal
NEFA concentration were both elevated in BSCL2-/- mice WAT. Basal and β3
adrenergic agonist-stimulated glycerol release was higher in adipose explants
from BSCL2-/- mice compared to those from wild type mice. UCP1 and other
brown adipose-related genes were upregulated at both mRNA and protein levels
in BSCL2 -/- remnant white adipose tissue. Lastly, both aerobic and anaerobic
respiration of the mitochondria was elevated in BSCL2-/- mice. This indicates that
the white adipose tissue uncoupled of lipolysis from ATP production, such that
the WAT is behaving like brown adipose tissue (BAT).

27
As a whole, the BSCL2-ablation mice and mice over-expressing short
hseipin have the same phenotype of increased lipolysis in their WAT. The data
derived from the mice that over-express short hseipin may be artifactual since
they are based on over-expression of a human protein in mice. The promoter used
to over-express short hseipin was aP2, which should limit expression to lipid
containing tissues 75
. But what if mice that over-express mouse seipin were to
have the same phenotype as mice expressing human seipin? It would indicate that
there were two different causes in this mouse model for the same lipolysis
phenotype with over-expression of human seipin and ablation of mouse seipin in a
mouse model.
Role of seipin in adipogenesis
The most important finding of the Chen ablation mice (BSCL2-/-) is that
increased cAMP and lipolysis is the reason for the incomplete adipogenesis in
differentiating MEFs. The most well established phenotype for BSCL2 null
organisms is the virtual absence of adipose tissue in patients. Thus, many
investigations are aimed at showing the involvement of seipin in adipogenesis.
Fibroblasts from lipodystrophic patients have decreased levels of PPARγ,
lipoprotein lipase, leptin, and GLUT4 76
, indicating that the differentiation
program is impaired. Two similar studies looked at BSCL2 expression during
adipocyte differentiation, and they found that mRNA increases during

28
differentiation with hormone cocktail 53, 54
. They also both used short hairpin (sh)
RNA to knock down BSCL2 in 3T3 fibroblasts and C3H10T1/2 mesenchymal
stem cells, and this impaired, not early differentiation into preadipocytes, but late
stage differentiation. Genes for lipogenesis are decreased, and lipid accumulation
is decreased when cells were treated with shRNA. Additionally, Chen et al. found
that an agonist of PPARγ could rescue adipogenesis, while not increasing
expression of BSCL2 53
. The rescue of adipogenesis coincided with rescued
expression of late genes in the adipogenic pathway: CEBPα, aP2, and SREBP1c
(to a smaller extent).
MEFs from seipin-ablation mice had many of the same problems with
differentiation as fibroblasts from lipodystrophic patients64
, such as decreased
number and size of lipid droplets and decreased PPARγ, C/EBPα, aP2, and PLIN1
mRNA. However, unlike the previously described studies, adipogenesis was
rescued by a lipase inhibitor, not a PPARγ agonist. Experiments were described
that were consistent with an important role of lipase stimulation in the BSCL2-/-
phenotype. Thus, fibroblasts had increased phosphorylation of Plin1 (perilipin)
and hormone-sensitive lipase (Hsl) by day 4 (D4) of differentiation. By D4, they
also displayed increased total PLIN2 and ATGL expression, and increased cAMP.
A PKA inhibitor increased the TAG level in fibroblasts from BSCL2-/-
mice, and
seemed to rescue D12 Plin1 and aP2 protein levels. Increasing cAMP with
forskolin or IBMX in wild type fibroblasts decreased cellular TAG and PPARγ,

29
C/EBPα, GLUT4, and PLIN1 expression by D10. Unfortunately they did form Oil
red O staining accompanying the change in cAMP. This should show no
differentiation due to increased cAMP with the hormone cocktail that normally
stimulates adipogenesis.
There are a few potential problems with these ex vivo experiments, the
negatively affected differentiation program by D4 caused by rampant lipolysis in
BSCL2-/-
is convincing. However, since lipolysis data were not provided for MEFs
without differentiation cocktail, we have to assume there was no phenotype
without the induction of adipogenesis. WAT had a steady-state increase in
lipolysis, which is good evidence that seipin may actively inhibit lipolysis in
WAT. It would have been helpful to know if seipin inhibits lipolysis in other
tissues. It is clear that seipin promotes adipogenesis, but it is unclear how that
relates to seipin in a non-adipose cell.
C. Lipid droplet Biogenesis
Adipogenesis and lipid droplet biogenesis are closely linked, but there has
been no conclusive evidence that seipin has an important role in LD biogenesis.
LD biogenesis is a basic, but little understood, phenomenon of cell biology.
Interest has grown in this process since it has become clear that LDs are
metabolically active and dynamic organelles. There is a controversy over two
different models of lipid droplet biogenesis, with both having good arguments.
30
The most prevalent model is that neutral lipid, know to be synthesized by
the enzymes in the ER, start to coalesce in between the bilayer leaflets as a lens-
shaped structure, followed by expansion of the neutral lipid depot, which then
pulls away from the inner bilayer leaflet, pinching from the outer ER leaflet, and,
in some cases, budding from the ER (Figure 4). This is the most accepted model
for several reasons. First, lipid droplets are unique organelles in that they have a
phospholipid monolayer surrounding neutral lipid, instead of a phospholipid
bilayer surrounding a lumen. The phospholipid tails are embedded in, or mixed
with, neutral lipid. In order to produce a droplet with a monolayer, forming
between a membrane bilayer seems the most energetically favorable process.
Second, the biosynthetic enzymes for phospholipid and lipid esters (neutral lipid)
reside in the ER, although at least some of them, such as Dgat2 in adipocytes 77
or
Dga1p in yeast 78
can be transferred to the LD surface once these droplets are
made. Thus, the ER is the most likely site for the birth of droplets. Phospholipid
synthesis would be especially critical for this model, since the ER would have to
maintain its membrane integrity, yet the phospholipid area would have to increase
as neutral lipid bulged out from the surface of the ER. Lastly, this model would
allow integral and peripheral proteins to have access to the lipid droplet surface as
it was being formed (still connected to the ER), where they presumably
concentrate by an unknown mechanism on the nascent LD surface. Isolated lipid
droplets have a specific proteome, most likely consisting of proteins that are

31
resident on the droplet surface. It would be difficult to imagine transmembrane
proteins being present in the monolayer with neutral lipids on the trans side.
Consistent with the lens model, proteins with targeting domains to lipid droplets
are first inserted into the ER, retain the ability to localize at lipid droplets with
COPII inhibition (blocking ER to Golgi export), and relocalize to the ER when
droplets are catabolically active 79
. The path of membrane protein targeting from
ER directly to droplets is an argument for droplets being functionally, and
probably physically connected to the ER.
Our lab argues that, at least in yeast, droplets remain connected to the ER
63, 66, and there is also support for this being true in mammals
79. This would allow
the droplets to shrink or grow as the cell requires, with the ER serving as a buffer
for phospholipids, and it would also imply that LDs are a specialized subdomain
of the ER, like the nuclear membrane. It is well known that droplets can travel
long distances directionally and rapidly within the cell in a microtubule-dependent
manner in mammalian and fly cells 80
. If droplets were connected to the ER, they
would have to either move freely across the surface of the ER (while remaining
segregated from it in some way so that LD proteins and phospholipids remain
associated with the LD), or droplets would carry a section of ER around with
them as they moved on microtubules. There is evidence that LD phospholipid
composition is unique from ER 81
, so it seems likely that the droplets are
segregated from the bulk of the ER. In mammalian cells, some believe the ER-to-

32
droplet connection was a tubule stalk of bilayer so that transmembrane proteins
could be closely associated with the droplet but permit other types of proteins to
move freely to the LD surface 82
. This would give more flexibility to the ER-LD
connection.
The problems with the budding model are issues with the expansion,
budding, and segregation steps of the process. The nascent neutral lipid would
have to be restricted to a local area in order to expand the outer phospholipid
leaflet in an environment. There is no known mechanism for restriction of neutral
lipid to focal points within the ER. On the contrary, there is a huge two-
dimensional space of the bilayer in which to diffuse. It has been thought that lipid
rafts may serve to “fence in” neutral lipids 83
. Moreover, what prevents expansion
in the other direction towards the ER lumen? Is there more resistance to
expansion in that space? In sheet-like ER, expansion into the lumen may not
negatively affect cells, but in tubular ER, the bulge could occlude the lumen. It is
probable that phospholipid generation in the cytosolic leaflet, and not the lumenal
leaflet, would encourage the neutral esters to bulge mostly away. This would
require local activation of phospholipid biosynthetic enzymes in the ER. The
other main problem of this model is the energy required to convert a lens of lipid
between the bilayers to a spherical droplet, and then forming the relatively small
neck or stalk between the ER and LD, and perhaps completely pinching off the
droplet from the ER. This is related to restricting the lipid esters to a local area

33
that may best be done at an early step before there is a relatively large amount of
neutral lipid.
Neutral lipid can exist in the membrane up to a few mol% 84, 85
, and if it is
above the solubility limit, it is likely to “oil out” in between the bilayer to form a
mobile aggregate 86
. This aggregate is more likely to spread in the membrane
(more like a lens) than to form a spherical shape 86
. Therefore, there is a need of
protein or lipid raft to exclude neutral lipid from the bulk of ER and into a
localized lipid droplet. Would transmembrane domains of proteins be enough of a
container, or would lipid slip through them like sand through fingers? Protein
channels and intramembrane proteases 87
contain hydrophilic pockets in the
bilayer, and perhaps this design would be a better lipid fence. The main problem
with the model, as stated in reviews 1, 83, 88
, is that the lens has never been directly
observed, nor any neck or stalk (although LDs are often closely associated with
ER membranes and there is evidence for functional interaction 79, 89
), but pores on
LDs (that would have continuity with the ER cytosolic leaflet), stalks, and lipid
ester lenses might be extremely small and difficult to visualize by normal methods
1.
The main alternative model solves the requirement for a protein-based
lipid fence by originating the droplet in a vesicle90
. This organelle of origin is
composed of a limited amount of bilayer, so phospholipid would have to be

34
synthesized and/or lumen membrane would have to be disassembled gradually to
shrink the lumen and allow neutral lipid expansion. The vesicle would transfer to
a close apposition to the ER (where phospholipid is made), described as an egg in
a cup where transfer of materials has been proposed to occur 91, 92
(Figure 5). It
seems unlikely that lipids or non-soluble proteins could diffuse across this space
however small it is. If a protein can span three phospholipid layers and have one
end be hydrophobic, a protein channel across this space could be envisioned, but
the way it could be folded and assembled without the existence of this egg-cup is
difficult to imagine, as is the existence of such a channel. However, there is a
reason for the egg-cup structure, and it occurs commonly, at least in macrophages
92 and 3T3-L1 adipocytes
93. The COP machinery, both COPI and COPII is
present and one of them could be utilized to synthesize the vesicles proposed to
originate the droplets. It is known that COP subunits are required for appearance
of some proteins on the LD 94, 95
. Brefeldin A, which inhibits COPI assembly,
suppresses lipid droplet formation, albeit incompletely 96
, and RNAi of
Drosophila COPI components affected droplet morphology 97
. It seems more
likely, however that COPI machinery are needed indirectly for droplet
formation/maintenance for recycling important factors back to the ER from other
exocytic compartments. It also seems more likely that, if vesicles were the
membrane of origin, that the vesicle would be COPII, which play a role in other
transport processes out of the ER, but there is no evidence for this. However, an

35
attractive element of the egg in cup model is a nascent vesicle/droplet with a
lumen sufficient to accommodate biosynthetic transmembrane proteins such as
DAG acyltransferase (DGA1 in yeast) that can contribute to expanding and
maintaining the droplet. ER invaginations have been seen inside lipid droplets 98
,
although this could be due to a droplet on the end of an ER tubule or other
artifacts.
I have outlined these models to illustrate how little we know about droplet
biogenesis and to illustrate the questions the field faces. We would like to identify
genes (encoding elements of the machinery) that are involved in lipid droplet
biosynthesis and maintenance. Using yeast genetics, we can benefit by finding
phenotypes that can distinguish between models. For example, if we delete the
gene(s) involved in sequestering neutral lipid to a microdomain of the ER, we
would expect to see flat, lens like droplets or no droplets at all.
The first problem is that droplets may just require neutral lipid to be
present to form because the only known way to get a yeast cell with no lipid
droplets is to delete all four acyltransferases and no other genes required for
droplets have been identified. Droplets appear to only need one of the enzymes
that synthesizes neutral lipids, since expression of any one of the four yeast
acyltransferases that generate TAG or SE is sufficient to form LD de novo 89
. As
expected, inhibition of fatty acid synthase with cerulenin results in the net

36
lipolysis of almost all LD in the cell 99
. Another problem may be redundancy of
genes. Lipids can be extremely toxic, especially free fatty acids, and lipid droplets
are thought of as a way to sequester and neutralize these toxic biochemicals 100
.
Besides redundancy, we feel that there may be a back-up, emergency path to
produce ectopic droplets, and, possibly, this is what we see in the fld1Δ (yseipin)
LD phenotype. Some other problems may be the resolution limit of microscopes
and the fact that the most studied droplets are adipocyte or 3T3-L1 droplets rather
than droplets that are formed in other eukaryotic cells. Droplets are not all the
same: there are differences between the morphology, proteome, and metabolic
state of large unilocular droplet in adipocytes and small, multiple, uniform
droplets in other mammalian and yeast cells 1.
Besides the caveats and logical lacunae in the lipid droplet biogenesis
models themselves, there are other questions about droplet biogenesis. Are
droplets initially micro-droplets and then fuse? Are lenses smaller than the limit
of detection? Are droplets created and expanded with the same machinery, or are
these two distinct steps? Are there scaffolds that coordinate phospholipid and
neutral lipid synthesis along with the lipid fence and neck/stalk constriction (and
maybe pinching)? What signal defines a LD birthplace? While my data may not
convincingly prove an existing assembly model or define a machine in detail, I
provide the first evidence that seipin is directly involved in de novo lipid droplet
biosynthesis.

37

38
Figure 1. Topology and structural domains of human
seipin. The N terminal cytoplasmic tail (N-tail), the N
transmembrane domain (NTM), the lumenal loop, the C
transmembrane domain, and the C terminal cytoplasmic tail
(C-tail) make up the structural domains of all seipins. Shown
is the predicted topology of human seipin with the
glycosylation motif at asparagine 152 (isoform 1). The
lumenal loop is probably more closely associated with the ER
membrane than shown. Adapted from Lundin, C. et al.
FEBS Lett 580, 2281-2284 (2006).
Figure 2. Topology prediction for isoform 1 using the transmembrane hidden Marcov model
(TMHMM) prediction method. The Y axis is amino acid number, and the X axis is the probability
of being in a transmembrane domain. Notice the weakly predicted transmembrane domain in the
lumenal loop domain. Reproduced from Lundin, C. et al., loc cit.

39
Figure 4. Lens model of LD biogenesis.
Neutral lipid esters form between the
phospholipid leaflets of the ER, pinch-off, and
possibly bud from the ER (although LD
probably do not bud off in yeast). Reproduced
from Suzuki, M., Shinohara, Y., Ohsaki, Y. & Fujimoto, T. Journal of Electron Microscopy 60, S101-S116 (2011).1
Figure 3. Alignment of several seipins using PROMALS (PROfile multiple alignment with structure).
Alignment based on local structure and amino acid type. Notice that most of the homology is in the
secondary rather than primary structure. Reproduced from Szymanski, K.M. et al. Proc Natl Acad Sci
U S A 104, 20890-20895 (2007).

40
Figure 5. LD Biosynthesis model using COPI coated vesicles to form nascent LD. (I) Normal membrane
trafficking of COP-coated vesicles, including to an egg-cup-situated LD being “nurtured” by the ER. (II)
Model of LD biogenesis through COPI-coated vesicles. Blue is neutral lipid. Yellow is the vesicle lumen.
Reproduced from Kalantari, F., Bergeron, J.J.M. & Nilsson, T. Molecular Membrane Biology 27, 462-
468 (2010).
41
Methods and Materials
Induction system and fluorescence microscopy
Yeast cells inoculated from a colony on a plate into 50 ml of glucose
synthetic complete growth medium (SCD-yeast nitrogen base (Difco) 6.7 g/L, 2%
dextrose, and appropriate base and amino acid supplements: for complete- 40
mg/L adenine, 20 mg/L arginine (HCl), 100 mg/L aspartic acid, 100 mg/L
glutamic acid monosodium salt, 20 mg/L histidine, 60 mg/L leucine, 30 mg/L
lycine (mono-HCl), 20 mg/L methionine, 50 mg/L phenylalanine, 375 mg/L
serine, 200 mg/L threonine, 40 mg/L tryptophan, 30 mg/L tyrosine, 150 mg/L
valine, 20 mg/L uracil) and cultured to stationary phase, about 48 hours. All liquid
cultures were incubated in a rotary shaker at 30 oC and 210 rpm. Cells were
harvested and diluted to 0.25 OD600 / ml into 50 ml raffinose synthetic complete
growth medium (SCR-same as glucose, but 2% raffinose instead of dextrose) and
grown to stationary phase for 20-24 hours. Finally, cells were washed with sterile
water, harvested and diluted to 0.5 OD600 / ml into 50 ml galactose synthetic
complete growth medium (SCG-same as glucose, but 2% galactose instead of
dextrose). Samples (3-5 ml) were removed from the stationary raffinose (SCR)
culture and every hour after dilution into SCG medium. Samples were processed
by harvesting, re-suspending in 50 mM Tris-HCl, pH 7.5, adding 1 μg (1 μg/ μl
stock) BODIPY 493/503 (Invitrogen)/ 500 μl cell suspension, staining 10

42
minutes, concentrating to about 100 μl, and placing 2 μl on a slide, covered with a
coverslip (no sealing), for imaging.
All images for BODIPY were captured with a 100 msec exposure, full
field (no artificial magnification), with FITC filter set (Excitation 490/20;
Emission 528/38) and a 100X 1.3 NA oil objective in a Zeiss Axioplan 2E
microscope equipped with a digital camera (Sensican; Cooke). Three fields of 50-
200 cells (typically 150) were imaged per time point. 10 to 20 z-sections were
imaged per field with a thickness of 0.3 μm. Images were acquired in Slidebook
(version 4.1.0.3; Intelligent Imaging Innovations). The z-sections were
deconvolved using the nearest neighbors method, and then a maximum projection
(so that the maximum intensity within the stack of each pixel is shown) was made
from the deconvolved stacks. Fluorescent body (FB) number was quantified per
cell and per field by visual inspection. “Zero” FB cells were not accounted for in
the ledger for total FB, but they were accounted for when calculating FB / cell,
since the denominator is total cells in a field. Raw FB area was quantified with
ImageJ by adjusting a threshold on a 16-bit image of the BODIPY channel to the
size of FB and then using the software to calculate an area for each FB (used for
Figure 6). The minimum size was set at 1.5 so that every FB 2 pixels2 and larger
were characterized. This was to reduce the number of partial FB getting
characterized, since almost all actual FB were larger than 1 pixel 2 (ImageJ only
reports whole numbers for the individual FB). Corrected FB area characterized

43
only the first 25 FB from each quarter of the total tally created by ImageJ. Then I
flagged and FB that was 11 pixels2 or greater, since that was the threshold for a
normal-sized FB. Then the outline of FB characterized by ImageJ were compared
to the image to make sure each FB was a single FB. If not, that area was divided
by the number of partially resolved FB that existed in that FB (as seen by
ImageJ), and this number was added to the total tally, which was then divided into
the total area of these 100 raw FB for the corrected average FB area (used for
Figure 9). The fraction of cells with FBs was calculated from the number of cells
with at least 1 FB, divided by the total number of cells in that field. Cells on the
edge of the field were characterized only if it was highly likely that more than half
of the cell was in the field.
Fluorescence intensity measurements were performed with ImageJ.
Images saved at equal minimum and maximum intensity, from three independent
experiments, and from 5 hours after switch to galactose medium were used.
Twenty fluorescent bodies or cells (for intracellular membrane intensities) were
quantified by drawing a line over the center of the fluorescent body or twice over
intracellular membranes at two different locations in the cell. Profiles were
obtained across the lines (using “Plot Profile” in the “Analyze” menu of ImageJ),
and ordered pairs describing the profiles were saved. The peak intensity was
calculated by subtracting the highest value from the lowest value of the profile.
When quantifying intracellular membranes, I avoided “holes” (areas of the

44
complete absence of BODIPY signal) created by vacuoles to avoid measuring an
artificially low background signal. The holes’ borders yielded a sharp steep
gradient of signal, so I was able to quantify membranes close to the vacuole
without compromising the intensity measurement. Peak width was measured at
the inflection at the bottom of the slope. The peak angle was drawn with ImageJ:
a vertical line was drawn up from below the peak to the peak, and a second line
was drawn connecting the peak with the lowest inflection of the curve, choosing
the steeper side of the slope. The software then indicated the angle at the peak
between the two drawn lines.
Electron microscopy
Yeast were grown with the induction system described above to 6 hours
post-galactose induction and processed according to the Wright protocol as
previously described 101
. Briefly, cells were pre-fixed in 0.2 M PIPES, pH 6.8, 0.2
M sorbitol, 2 mM MgCl2, 2 mM CaCl2, and 4% fresh glutaraldehyde over a
weekend. Then cells were then post-fixed in 2% potassium permanganate and
stained in 1% uranyl acetate. Cells were dehydrated with a graded ethanol series
and infiltrated with a graded resin series, ending up in pure resin. Particles of cell
were transferred to capsules for embedding and baked in a 60oC oven for 24
hours. Cells were sectioned, re-stained with uranyl acetate, and imaged on an FEI
XL30 ESEM microscope.

45
Lipid analysis
Chloroform/isopropanol extraction basic protocol. My basic method has
been described previously 102
, but the protocol was modified during the project.
Yeast cells were grown from a plate in 50 ml glucose minimal synthetic growth
medium (SD-yeast nitrogen base (Difco), 2% dextrose, and appropriate base and
amino acid supplements) overnight, harvested, and diluted in 200 ml SD medium.
After 1-2 (average 1.5) doublings, cells were harvested in an ice-cold rotor into
pre-weighed ice-cold glass test tubes. Cell pellets were then treated with 2 ml
isopropanol at 70 oC for 30 minutes while covered with foil, and lipids were
extracted as described. The chloroform extract was then evaporated under
nitrogen at 37 oC. Dried lipid extracts were usually stored over night at -20
oC
under nitrogen gas.
Dried lipid extracts were dissolved in chloroform (for the basic protocol)
or 2:1 chloroform methanol (see below) and spotted on Partisil K6 silica plates
(silica gel 60 Å- Whatman) ( baked at 260 oF for 30 minutes and cooled), 5 μl at a
time, at an origin 1.5 cm above the bottom of the plate and 1 cm from each other.
Plates were developed in a TLC jar equilibrated (for at least 30 minutes) with
hexane : diethyl ether : acetic acid at 80 : 20 : 1, filling the tank to 0.5 cm depth,
for 50 minutes. For acid charring, plates were sprayed evenly with 3% cupric
acetate in 8% phosphoric acid and baked for 10 minutes at 260 oF about five

46
times. Lipid spots were scanned in a flat-bed scanner and analyzed using ImageJ.
Mass was calculated from a standard curve of lipids (Nu-Chek Prep, TLC 18-5C)
spotted on the same plate.
Modifications
Zymolyase- Cells were harvested and treated with Zymolyase 100T at 8
mg/1000 OD600 for 45 minutes at 30 oC. Spheroplasts were weighed and subjected
to hot isopropanol, extracted, and analyzed as above.
Glass bead lysis- Yeast pellets were lysed with acid-washed glass beads
(Sigma-Aldrich, G8772, 425-600 μm) in lysis buffer (50 mM Tris-Cl pH 8.0, 1
mM EDTA, 150 mM NaCl, 10% (v/v) glycerol, 0.5mM dithiothreitol) containing
0.1% (v/v) IGEPAL CA630 (Sigma-Aldrich I-3021, equivalent to NP-40) in the
cold room for 30 minutes. The lysed cells were subjected to hot isopropanol,
extracted, and analyzed as above.
Chloroform/Methanol- The chloroform/methanol extraction was a
modified version of Bligh and Dyer 103
. Briefly, cell pellets were lysed with glass
beads as described above, then the volume was adjusted to 1 ml with lysis buffer.
Lysates were treated with 1.25 ml chloroform and 2.5 ml methanol overnight at 4
oC unless otherwise noted. After extractions were warmed to room temperature in
a desiccator, 1.25 ml of chloroform and 1.25 ml of 1 M KCl were added with
vortexing prior and after additions. After organic phase was partitioned and

47
collected, a second washing of the cell debris with 1.9 ml chloroform was
performed and collected. Samples were then evaporated under nitrogen and
treated as above, except the dried extract was resuspended in 50 μl 2:1 chloroform
methanol.
Lipid droplet prep and protein analysis
Highly purified lipid droplets were purified from cells grown to stationary
phase in 4 L of SD medium as described by Leber et al 104
. The lipid droplets
were delipidated as previously described 105
with 2 volumes of diethyl ether. The
organic phase was removed, residual diethyl ether was evaporated under nitrogen
gas, and proteins were precipitated from the aqueous phase with trichloroacetic
acid at a final concentration of 10%. The protein pellet was solubilized in 0.1%
sodium dodecyl sulfate (SDS) in 0.1% absolute NaOH (pellets). The protein was
quantified by the method of Lowry et al 106
. with bovine serum albumin as a
standard. SDS-PAGE was performed according to the Laemmli method 107
, and
the resulting acrylamide gels were silver stained according to Wray et al 108
.
Glycerol gradients of the seipin homo-oligomer with different detergents 68
Membranes were prepared based on a published method 109
with several
modifications 68
: Spheroplasts were generated with Zymolyase 100T. Before
freezing, cells were resuspended at 500 OD600/mL in spheroplast lysis buffer
with protease inhibitors. Dounce homogenization was omitted following the
27000g centrifugation. When necessary to apply to a glycerol gradient, the

48
sucrose in the partially purified ER was removed by first adding an equal volume
HEPES buffer with protease inhibitors, which was mixed by pipetting, and then
centrifuged at 60000 rpm in a Beckman TLA100.3 rotor (RCFav= 152813g), 4
°C, 1 h, to pellet the microsomes.
For glycerol gradients, microsomal membranes were dissolved in
HEPES buffer with 0.5%TritonX-100 (or other detergent as specified), DTT, and
protease inhibitors as described. Instead of 0.5% Triton X-100, we used 0.1%
C12E8 (dodecyl octaethylene glycol ether), 2% sodium cholate, 1% CHAPS, and
1% DDM (dodecyl beta-D-maltoside), all mass/volume, as indicated. C12E8,
CHAPS, and DDM were obtained from Affymetrix. Cholic acid was obtained
from Sigma. Five hundred microliters of the identical buffer containing 15 μL of
solubilized membranes and standards was applied to the gradients. The 10 mL
gradients containing 10–35% glycerol (v/v) were centrifuged in an SW41 rotor at
35000 rpm 4 °C for 18–19 h. Fractions of 0.5 mL were harvested from the bottom
of the gradients, and 19 μL of each was subjected to SDS gel electrophoresis and
immunoblotting. The partial specific volumes used for Figure 12 B were
previously published 110-113
.
ER Stress survival assay
Cells were grown to stationary phase over 48 hours in SD medium, back-diluted
into 50 ml of fresh SD medium, and grown about 4 hours for cell OD600 to double
at least once. Cultures were separated into 5 ml sub-cultures and treated with

49
indicated amounts of tunicamycin for two hours. Cells were then harvested, and
1250 cells were plated on YPD (rich medium) plates in at least 50 μl sterile H2O
in triplicate, assuming an OD600 of 0.1 is equivalent to 3 x 10⁶ cells. Plates were
incubated at 30 oC for 48 hours, images of the plates were taken, and colonies
were counted for entire plates.

50
Results
1. De novo biogenesis system
Our hypothesis was that, since BSCL2 mutations inhibit adipogenesis,
FLD1 deletion will inhibit lipid droplet biogenesis. To test this hypothesis, we
needed a method to control LD biogenesis. We had a strain of yeast that is lacking
the four acyltransferases in yeast that catalyze the final step in neutral lipid ester
formation. These enzymes add the last acyl chain to diacylglycerol to form
triacylglyceride (DGA1 or LRO1) or the only acyl chain to sterol to form steryl-
ester (ARE1 or ARE2). As stated earlier, yeast lacking these four genes have no
lipid droplets, however, expression of one of these four enzymes in this
background is sufficient to produce lipid droplets de novo. This was known since
triple deletion mutants had lipid droplets 114
. Our lab also observed that FLD1
deletion had no interference with formation of TAG (triacylglycerol) droplets in
the are1Δare2Δfld1Δ strain or SE (steryl-ester) droplets in the dga1Δlro1Δfld1Δ
strain (unpublished data), but we knew nothing about the mechanism of
biogenesis of these droplets. In the description of experiments presented in this
chapter, we term dga1Δlro1Δare1Δare2Δ the background strain or “4KO”, and
dga1Δlro1Δare1Δare2Δfld1Δ, which we generated, as “fld1Δ” or “4KOfld1Δ”.

51
We added DGA1 back to these strains behind a galactose inducible
(GAL1-10) promoter on a plasmid (1st generation, previously described by
Jacquier et al. 89
). The GAL1-10 promoter is fairly tightly repressed by glucose,
but induced when the cells are grown on galactose medium without glucose. We
also incubated the yeast in raffinose medium between glucose and galactose as a
transition derepressing medium to decrease the time between glucose repression
and induction. We also expressed GAL1-10-ARE1 in our plasmid biogenesis
system. The expression of DGA1 (as measured by LD occurrence) was not
evident in glucose medium in both log and stationary phases of growth and in
raffinose in log phase growth expressed from a plasmid. However, some
expression of DGA1 was evident in some cells reaching stationary phase in
raffinose (perhaps due to the age of the colonies on the agar plates from which the
liquid cultures were started) in stationary growth in raffinose medium.
Nevertheless, we allowed cells to reach stationary phase before switching to
galactose medium.
The cell preparation and assay for droplet formation is fairly
straightforward and described in detail in Methods. Briefly, cells from plates were
inoculated into glucose complete synthetic medium and grown to stationary phase
( generally 2 days), then transferred to raffinose medium and again grown to
stationary phase. Finally, a sample for “time 0” was taken from the stationary
raffinose culture, and then transferred to galactose medium. At indicated times

52
after transfer of cells into galactose medium, samples were removed from the
culture for imaging. They were washed with a Tris buffer to remove galactose,
and then stained with BODIPY 493/503, a dye with high affinity for neutral lipid,
for ten minutes. Lastly the cells were concentrated by centrifugation and imaged
by epifluorescence microscopy.
As mentioned above, there were a few cells with droplets at time 0
(typically 3-8%), and both the numbers of such cells and average droplet number
per cell are fairly constant until three hours after transfer to galactose medium, at
which time new droplets start to form (Figure 6 A and B). These two parameters
continue to increase until seven hours after induction, when droplet formation
starts to plateau. If samples were taken twenty-four hours after switch to galactose
medium, the numbers were barely higher, although droplets were larger and
stained more intensely (data not shown). This probably indicates that droplet
formation is mostly completed by seven hours after induction, but organelle
expansion is possible after this time.
It is important to note that the GAL1-10 promoter heavily overexpresses
the open reading frame that it is driving, even compared to the PGK promoter we
also use in the lab to overexpress proteins. Therefore, the induction system is
artificial in that unphysiological levels of Dga1p are produced at some point, and
this drives droplet formation. It is possible that more time would be required to

53
form lipid droplets if DGA1 expression were from its natural promoter. It is also
possible that normal cellular capacity of droplets is surpassed in our system, let
alone affected by environmental conditions and cell cycle. Despite these caveats,
we can still compare the 4KO to 4KOfld1Δ strains to determine whether fld1Δ
affects lipid droplet biogenesis. Also, while LD biogenesis may be accelerated in
our system compared to wild type, the same mechanisms are likely employed to
create a droplet in a triple deletion mutant ( i.e., lor1Δare1Δare2Δ) as in our 4KO
expressing DGA1, especially at early time points. Another caveat is that droplets
made only of TAG (or SE) may not use the same machinery for assembly, but the
added strength of our system is the ability to dissect fld1Δ effects on TAG versus
SE packaging by exchanging GAL-ARE1 for GAL-DGA1.
Our lab and that of Yang, characterized droplets in fld1Δ cells (in the wild
type background) as either clusters of small droplets or larger than wild type,
supersized, droplets 2, 60
. The difference between a supersized droplet and a
cluster of small droplets, however, is often not easy to discriminate by
fluorescence microscopy. For this reason, I use the term “fluorescent bodies”
(FBs) to describe generally round spot of BODIPY signal which exceeds
background by eye (sometimes difficult to differentiate, in 4KOfld1Δ). Since a
cluster of droplets, as seen by electron microscopy, may appear as a single
fluorescence spot, I use “fluorescent bodies” (or FB) when interpreting

54
fluorescence data. However, a single fluorescent body may represent a single lipid
droplet in 4KO and some 4KOfld1Δ cells. Therefore, a spot was counted as
multiple fluorescent bodies if I had reason to believe it represented multiple lipid
droplets (i.e. a peanut shape is counted as two, or a three-lobed clover shape as
three). Moreover, if there was a visible decrease in intensity between two irregular
FBs, indicating partial resolution, they were counted as two. Yeast with the FLD1
deletion often had very irregular fluorescent bodies (FBs), for example, a fuzzy or
irregular perimeter, or weaker fluorescence intensity than wild type, but I kept the
same standards for all strains.
A. Seipin deletion inhibits the dynamics of TAG droplet formation
When I first imaged the 4KO and 4KOfld1Δ strains during galactose
induction of Dga1p, later time points had obvious differences between the two
strains, but differences in the early time points were not obvious by superficial
visual inspection (Figure 6 A). Therefore, I quantified FB numbers (Figure 6 B,
left panel) and size (Figure 6 C, left panel) in the two strains during induction. I
found in the 4KOfld1Δ strain a large decrease in average numbers of fluorescent
bodies per cell at all time points from 3 hours after switch to galactose and small,
but nevertheless statistically significant parallel decrease in the fraction of cells

55
with FBs in the same time frame. There was also a large an increase in the
average size of fluorescent bodies (discussed more below) from 4 hours on.
There appeared to be no delay in droplet formation the 4KOfld1Δ strain,
since both strains start to produce droplets at the same time (3 hours after switch
to galactose, T3). Although not apparent on the graph (Figure 2 B, left), the
average FB number per cell increases 3-fold between T2 and T3 (0.259 at T3) and
again 3-fold between T3 and T4 (0.905 at T4). This is similar to the control (4KO)
strain in which a 3-fold increase was seen between T2 and T3 and a 2-fold
increase between T3 and T4. Neither strain increased droplets between 0 and 2
hours. I conclude that 4KOfld1Δ yeast began droplet formation at T3, at the same
time as 4KO yeast. Additionally, GAL-induced Dga1p-myc is detected in a
western blot at T4, but not T2.5 in both 4KO and 4KOfld1Δ cells, indicating that
Dga1p-myc expression occurred in the same time frame as the initiation of FB
production in 4KO and 4KOfld1Δ cells (Derk Binns, unpublished data). Finally,
new FB production in both strains began to plateau at 7 hours, as measured by
FB/cell, fraction of cells with FB, and average FB area (Figure 6 B and C). In
more recent studies in the lab in which the GALpromoter-DGA1 fusion was
placed in the chromosome (at the DGA1 locus) instead of expressed on a plasmid,
a 2-hr delay in FB production in the absence of FLD1 was clear. It is reasonable
that the difference in the two expression systems reflects a fraction of cells with
plasmid-driven expression produces more enzyme from a larger plasmid copy

56
number, and this may buffer the difference in formation dynamics of FB between
4KO and 4KOfld1Δ. With more homogenous, synchronized induction of Dga1p
expression from the chromosome, latent differences in FB dynamics may be
uncovered.
In my system, while the kinetics of FB formation (i.e., the time at which
droplet numbers increase and plateau) was similar for both strains, there were
clearly fewer FBs per cell, statistically significant at all time points starting at 3
hours after switch to galactose medium (Figure 6 B, left panel). This was even
reflected at early time points, although there was no significant difference
between the low numbers of FBs at earlier time points. FBs in 4KO yeast started
at an average of 0.2 per cell, reach about 6 per cell by T7 when droplet formation
plateaued, and slowly climbed to 7 per cell by the end of my measurements
(Figure 6 B, 4KO, left panel). In contrast, 4KOfld1Δ yeast started at an average of
0.1 per cell, reached about 2.4 per cell by T7, and only increased to 2.6 per cell by
the end of the experiment (Figure 6 B, 4KOfld1Δ, left panel). Therefore, there is a
lower starting point and a much lower plateau point of the curve in the 4KOfld1Δ
strain compared to the control.
As mentioned above, there was an apparent lower rate of FB production in
4KOfld1Δ cells compared to 4KO cells (Figure 6 B, left panel). Between 3 hours

57
and 7 hours, 4KO yeast developed fluorescent bodies at a rate of 1.26
FB/cell/hour, compared to 4KOfld1Δ yeast with a rate of 0.54 FB/cell/hour; these
rates are extremely significantly different from each other. But this does not
necessarily imply fewer droplets (as opposed to FB) in the 4KOfld1Δ strain,
which contained clusters of droplets that could not be easily resolved by
fluorescence microscopy. We cannot conclude that less TAG was being packaged
into droplets or that droplets were produced at a slower rate in 4KOfld1Δ yeast.
Therefore, we cannot conclude from these data that seipin is facilitating droplet
formation, by acting as a valve, lipid channel, or another mechanism. Another
interpretation of the data presented in Figure 6 A and B is that the 4KOfld1Δ
droplets were fusing or clustering at a rate high enough to counter LD production
so that the rate of FB formation appeared low. The droplets could also be in a
futile lipolysis/biogenesis cycle, where lipolysis is higher in 4KOfld1Δ compared
to 4KO yeast, resulting in fewer droplets. Another difference could be the
population of cells producing droplets could be lower in 4KOfld1Δ yeast or
4KOfld1Δ yeast are not as healthy, although this is probably not the case since the
rate cell doubling, a good measure of yeast cell “health”, is similar in both strains.
Cell morphology, as visualized by bright field optics under a 100X objective,
suggests that both strains reacted similarly to culture at all time points. There was
no obvious difference in the morphological attributes between the two strains.

58
Cells of both strains had multiple vacuoles or a single large one, and only a small
number of cells displayed a granular cytosolic appearance or an irregular shape
that would suggest “ill health.” Only about 1% of cells from either strain appeared
lysed or dead. (Similarly there was no difference in the number of cells stained
with the vital dye Sytox Green between wild type and fld1Δ (Bethany Cartwright,
unpublished data)). There was no evidence that the 4KO background sensitizes
yeast to the FLD1 deletion, but it is difficult to rule out the possibility that the
4KOfld1Δ yeast have subtle general deficiencies compared to the 4KO control.
To determine whether the difference in the rate of FB formation between
the two strains was caused by a higher fraction of cells with no droplets in the
4KOfld1Δ strain, we determined this parameter. The number of cells with
droplets during the time course was similar in both strains, although the number
of 4KO cells with droplets was slightly, but significantly higher than in the
4KOfld1Δ cells at most time points (Fig. 6B, right). Once formation starts to slow
at the later time points, differences were more obvious. The 4KOfld1Δ mutant
plateaued at 55% with droplets, while 4KO plateaued at 70% (Figure 1 B, right
panel). The slopes from T3 to T7, however, were not significantly different (0.121
for 4KO and 0.107 for 4KOfld1Δ). One possible interpretation to explain the
difference is less tolerance for, or less expression of, plasmids in general in the
4KOfld1Δ strain. It could also indicate that 4KOfld1Δ cells are having more

59
difficulty forming droplets, leading to the lower fraction of cells with any
droplets.
By inspection, the fluorescent bodies in 4KOfld1Δ appeared to be not only
fewer in number, but also much more heterogenous in size, and resulted in a
larger average area in projection images (Figure 6 C, left panel). The average area
was only 14% higher at T0 in 4KOfld1Δ yeast, and this small difference
disappeared in T1-T2. The decrease in average FB size from T0 to T3 was most
obvious between T0 and T1. At T3, the average area of FB in 4KOfld1Δ started to
be larger than FB in 4KO by 25%, and the difference became significant from T4
to T9. At T4 and T9, the difference in average size was 53% and 86% higher in
4KOfld1Δ cells, respectively. Between T3 to T9 the average area grew at the rate
of 1.82 pixels2/ hour in 4KO cells and 4.32 pixels
2/ hour in 4KOfld1Δ cells,
resulting in over a 2.4-fold increase in area. This could represent the fusion or
aggregation of nascent droplets in the 4KOfld1Δ strain. Electron microscopy
suggested that the large FB represent clusters of tiny droplets (see below); we saw
no morphological evidence of fusion at early time points of LD biogenesis,
although fusion likely occurs later in 4KOfld1Δ cells, as suggested in earlier
reports 2, 60
.
60
The cause of the decrease of average size between T0 and T3 is unknown,
but there were probably two contributing factors. First, lipid droplets become
subjected to high rates of lipolysis when stationary cultures are diluted into fresh
medium; we have observed this (unpublished) as have others 63
. This occurs
probably because lipid from droplets is needed for membrane formation during
cell division for daughter cells. In stationary phase lipid can be stored as a
bulwark against starvation or for anticipation of future rounds of division. A
second potential cause for the decrease in volume of droplets in the early hours of
galactose induction of Dga1p is that the FB that were scored do not actually
represent droplets. Some of these were very dim and large, and some of these
appeared to have a higher intensity rim around the outside as if they were labeling
large vesicles. I did not score ones that were obviously vesicles, but I scored the
other ones because they were in both strains, although at a slightly higher
frequency in 4KOfld1Δ yeast. These dim FBs at early time points may be neutral
lipid-pregnant membranes that when viewed at a certain angle appear to form a
spot.
To compare the heterogeneity of FBs in the two strains, I measured FB
area at a single time point, 5 hr after switch to galactose medium (Figure 6 C,
right panel). I measured 255 FB in 4KO and 322 FB in 4KOfld1Δ cells. The peak
of distribution of the average size of FB in 4KO cells was much narrower than in
4KOfld1Δ cells, which was more broad and flat, as expected from visual

61
inspection. The range of areas was 2-24 pixels2 for FB in 4KO cells, compared
with 2-82 pixels2 for FB in 4KOfld1Δ cells. The median was almost two-fold
higher in 4KOfld1Δ cells: 13 compared to 7 pixels2 for 4KO. This raises an
important question. Are these FB in various stated of aggregation, or are the
aggregates in various stages of fusion? In other words, are 4KOfld1Δ droplets
generated simultaneously (like an explosion) from a site on the membrane, or do
they aggregate from different sites to a location in which they will fuse.
In summary, seipin deletion affects lipid droplet biosynthesis of TAG-
filled lipid droplets. Fluorescent bodies were fewer in number per cell and larger
in FB area in 4KOfld1Δ yeast during biogenesis, and seipin deletion causes a
broader distribution of FB areas in yeast.
B. TAG is packaged less efficiently into droplets in 4KOfld1Δ cells
After finding that fluorescent bodies are fewer but larger without seipin in
the 4KO background, we then asked whether levels of TAG are the same. Is the
defect in biogenesis due to TAG packaging, or is the defect in TAG formation by
DGA1? We used the same basic culturing procedure for galactose induction, but
with larger cultures to allow 500 OD600 units of cells for each time point. We used
glass bead lysis to disrupt the cell wall, and then we extracted lipids in
chloroform: methanol overnight. 4KOfld1Δ yeast initially started with less TAG,

62
but by the end of the assay at T5, the TAG levels have almost reached the levels
of 4KO yeast (Figure 7 A, left panel). The slopes were not significantly different
from T3 to T5. I was interested in what the curves would be if the yeast had the
same amount of TAG at the beginning of the galactose incubation. In experiments
performed subsequently by Derk Binns in the lab with the chromosomally
expressed GAL-driven DGA1, TAG levels were virtually undetectable before the
galactose switch and were very similar throughout DGA1 induction although
there was a large delay in droplet formation without seipin (Hilton, Binns and
Goodman, manuscript in preparation). Together, these data indicate that seipin
affects packaging per se.
C. Fluorescent bodies in the absence of seipin have more indistinct
borders and are dimmer, consistent with droplet aggregates.
Seipin deficient cells had fewer fluorescent bodies, but they had equal
TAG levels. Where was the TAG if it was not in droplets? Some of the volume
was compensated by the larger fluorescent bodies that 4KOfld1Δ (and fld1Δ) cells
produced. If a spherical volume was calculated from the average area of
fluorescent bodies measured in Figure 6, mathematically converted into an
average spherical volume of a fluorescent body, and then the average spherical
volume was multiplied by the average number of FB per cell, the volume of
droplets per cell between the two strains was equivalent throughout the time

63
course (Figure 7 A, right panel). This suggested that the amount of TAG in
droplets was equivalent, but it assumed equal densities of TAG within fluorescent
bodies in the two strains, and a spherical shape of the FBs. I first thought that
4KOfld1Δ cells did not have spherical FBs because more of them had irregular,
non-circular shapes, but also they appeared “ghost-like” - dimmer with less
defined borders (Figure 6 A, especially T0 and T4). I used line scans across
fluorescent bodies in maximum projection images from serial image stacks of
4KO and 4KOfld1Δ yeast saved at equal minimum and maximum intensity values.
A line scan will measure the intensity of a channel where the line is drawn, and
the FBs will appear as a peak (as illustrated in Figure 7B, left panel). I could not
use this technique to demonstrate less solid fluorescent bodies, but dimmer FBs
should be apparent by a lower maximum intensity. Also the angle between
vertical at the highest point of the peak and the base of the peak should be greater
if the border of the FB is more diffuse or fuzzy (illustrated in Figure 7 B, left
panel, quantified in Figure 7 C-ii). If the border is sharp, the sides of the peak will
be steep. If the border is diffuse or fuzzy, the slope will be more gradual. That is
indeed what I found in 4KOfld1Δ compared to 4KO FBs. There was a 32.3%
decrease in peak height (Figure 7 C-i), a 41.4% increase in peak width (Figure 7
C-iii), and a two-fold increase in the angle between vertical and the peak base
(Figure 7 C-ii). The averages of many peaks aligned by the maximum value were
graphed in the right panel of Figure 7 B, and it is clear that all three attributes

64
were different in the two strains. This suggests that many 4KOfld1Δ fluorescent
bodies are not single lipid droplets but aggregates; the cytoplasm between the
droplets in the aggregates would make them appear dimmer with less distinct
edges.
D. TAG may remain in membranes in 4KOfld1Δ cells
If we cannot assume the 4KOfld1Δ fluorescent bodies represented solid
lipid droplets, perhaps a fraction of TAG has not been packaged into droplets and
was trapped in membranes. We previously showed that BODIPY very lightly
stained cell membranes allowing their visualization by the dye at a high “gain”
setting with the microscope software 66
. If 4KOfld1Δ membranes have excess
TAG in them, the intensity of BODIPY staining should be higher. Again I
employed line scans, and I tried to cross ER membranes two times with the same
line since they seemed to be different intensities throughout the cell. The
background seemed to differ throughout the cell too. Therefore, I took the highest
intensity reached in the line scan and subtracted the lowest intensity from the line
scan for background. In drawing the lines, I avoided regions of cytoplasm
(presumably vacuoles) when taking measurements. The intensity of staining of
membranes in 4KOfld1Δ at T1 was 10% higher than in the 4KO strain, but the
difference was not statistically significant. However, at T3 and T5 the difference
increased to 29% (at both time points) and this was highly significant (Figure 7

65
D). This strongly suggests that there was more TAG in the membranes in
4KOfld1Δ yeast compared to 4KO yeast. The laboratory is presently comparing
TAG in isolated membranes from the strains to see if my observation can be
confirmed biochemically.
E. Seipin deletion negatively affects LD size and positively affects
FB size
The diffuse morphology and lower BODIPY-stained density of a large
fraction of fluorescent bodies in 4KOfld1Δ suggests that they represent clusters of
small droplets. To confirm this, I next prepared samples for electron microscopy
using permanganate staining to enhance membrane contrast 101
. Cells were
harvested 6 hr after galactose addition. Duplicate samples were processed and
analyzed for 4KO and 4KOfld1Δ cells. Almost no supersized lipid droplets were
seen. There were some large, electron sparse, circular structures in 4KOfld1Δ cells
that are often associated with, and in, what are probably large vacuoles (very
electron-dense structures- Figure 8 H), but they are also present in the 4KO cells
(Figure 8 G). They were equally large in both strains, and some had inclusions of
medium electron density (grey particles). Several of them could represent tears
from sectioning, and they were equally present in both strains. Since both strains
showed these patterns at similar frequency and did not correspond to droplets seen
by fluorescence, I conclude that these structures are probably not lipid droplets,

66
and supersized droplets are rare in our biogenesis system, at least up to 6 hours
after switch to galactose medium.
In contrast, many of the clusters of small electron-sparse structures (
presumably LDs) were seen in 4KOfld1Δ cells, and they were 3-fold more
abundant than the 4KO control (Figure 8 A-D and panel E). A cluster was defined
as 3 LDs in close proximity (~200 nm), so the definition was not very stringent.
However, there was a large difference between a 4KO cluster and a 4KOfld1Δ
cluster in that the density of droplets within the cluster (comparing the number of
droplets within the cluster compared with the overall area of the cluster) in the
4KOfld1Δ strain was 8-fold higher than 4KO clusters (Figure 8 F). These data
from ultrastructure strongly suggest that the large diffuse fluorescent bodies that
characterize the 4KOfld1Δ strain represent abundant clusters of small lipid
droplets. Seipin, therefore, appears to prevent the formation of normal sized
droplets, although I can’t rule out that seipin prevents the fusion of tiny droplets
into larger ones. However, since dense clusters of tiny droplets are virtually
absent in the 4KO strain, I favor the hypothesis that seipin in to prevent the
formation of the clusters of tiny droplets. My data are consistent with droplet
morphology at steady state in fld1Δ cells, characterized by dense clusters of
droplets enwrapped in ER2, 60
. Morphologically chaotic, tiny droplets were also
seen in cells derived from BSCL2 patients 2, 61
.

67
F. Seipin deletion may cause ectopic formation of LD in nuclei
Besides frequent clusters of small droplets, I also observed by electron
microscopy of 4KOfld1Δ cells droplets in the nucleoplasm, usually close to the
membrane envelope. Intra-nuclear droplets within cells were found 40-times more
frequently in 4KOfld1Δ than in the 4KO strain (Figure 8 J). Only 1 in 132 4KO
cell sections that had a nucleus had this phenotype, while 27 out of 125 4KOfld1Δ
sections with a nucleus showed this phenotype. While I view this difference as
meaningful, the result was not statistically significant because the percentage of
nuclear droplets in the 4KOfld1Δ cells differed in the two duplicate samples: 17%
and 32%, compared to 0% and 1.14% for the 4KO strain. Nevertheless,
intranuclear droplets were virtually absent in 4KO and easily observable in the
4KOfld1Δ.
In a manuscript in preparation, our lab will propose that seipin is a valve
that releases neutral lipid into “proper” LDs, and that seipin deletion leads to
increased membrane TAG resulting in bilayer instability, which causes
unregulated ectopic blistering of lipid droplets. If this is the case, droplets in fld1Δ
yeast should be abnormal and possibly dysfunctional in some way without the
seipin-mediated regulation of assembly. There is no evidence with starvation
assays that fld1Δ yeast are less “fit” (Cartwright, unpublished observations).

68
There are some data that I will discuss later that indicate that LD in fld1Δ yeast
have a modified protein composition compared to WT cells, and it is already
known that LDs in fld1Δ yeast are fusogenic and heterogenous in size 2, 60
. My
data from the EM, however, supports our hypothesis, since LDs from 4KOfld1Δ
cells originate from abnormal locations such as the outer leaflet of the inner
nuclear membrane. We cannot rule out the ectopic droplets we observed were due
to improper localization of Dga1p in the absence of seipin. Ectopic droplets may
also have been artifacts of processing the samples for electron microscopy,
although if so they were specific for 4KOfld1Δ. I would argue that if there was a
sectioning artifact and LDs did not bud into the nuclear matrix of living 4KOfld1Δ
cells, they were at least associated with perinuclear ER more often in 4KOfld1Δ
cells compared to 4KO cells, where they appeared to be more dispersed.
G. Seipin TAG clusters are not wrapped by membranes when
they are born
Our laboratory had previously shown that lipid droplet clusters in fld1Δ
cells in the wild type background (at steady state) are often enwrapped in ER
membranes, resembling “tangles” 2. The final interesting observation from my
electron microscopy images, was that TAG LD clusters in 4KOfld1Δ cells did not

69
have membranes wrapped around them, at least not at T6 (Figure 8 D and Figure
14). Therefore, either SE (missing in our 4KO-derived strains) induces the
membrane wrapping that we see in fld1Δ yeast, or, more likely, the membrane
tangles are a cellular compensation/adaptation mechanism. However, even at T6,
the small droplets in a cluster were often associated with membrane fragments we
assume to be of ER origin that were rarely observed in 4KO cells (Figure 14,
arrows). The appearance was often of beads of tiny lipid droplets emanating from
a localized region of the membrane, suggesting chaotic budding clearer here than
we had previously observed in fld1Δ cells continuously grown. It remains to be
seen if a similar scenario emerges from cells expressing GAL-ARE1 in the 4KO
background to rule out a specific effect of TAG itself. Also, it will be useful in the
future to include wild type and fld1Δ controls, grown under parallel culture
conditions to rule out effects of our raffinose-galactose protocol. These controls
should also be performed to understand the lack of supersized droplets (observed
normally in fld1Δ cells in minimal medium toward stationary phase) in our
experiments.
H. Seipin promotes SE droplet formation, but to a lesser extent
than in TAG droplet formation

70
To determine whether seipin is involved specifically with packaging TAG
compared to SE, I repeated the galactose-induction experiment in 4KO and
4KOfld1Δ strains but with the GAL promoter driving expression of the steryl
acyltransferase Are1p. Compared with GAL-DGA1, I had a much harder time
distinguishing differences between the two strains expressing GAL-ARE1 by
visual inspection (Figure 9 A). However, quantifying fluorescent bodies (from
one experiment with three fields each time point) revealed a modest difference in
the two strains (Figure 9 B and C). The results from Gal-ARE1 expression showed
fewer fluorescent bodies in the 4KOfld1Δ, a significant decrease at most time
points, and an increase in the size of fluorescent bodies at later time points. The
experiment was repeated two more times, and the images looked extremely
similar upon visual inspection, but they were not quantified.
There was a significant decrease in the average number of fluorescent
bodies per cell from T3 to T9 (except T4 and T8: Figure 9 B, left panel) in
4KOfld1Δ cells compared to 4KO cells, as we saw during Dga1p induction. Like
Dga1p expression, 4KOfld1Δ initially display a two-fold increase in average FB
per cell (0.12 compared to 0.21), and this decrease in 4KOfld1Δ cells compared to
4KO cells continues from T2 to the end of the time course (the averages are equal
at T1). The slopes of linear regressions, taken from T2 to T6, also differ

71
significantly between the two strains (1.13 FB/cell/hour in 4KO and 0.89
FB/cell/hour in 4KOfld1Δ cells), as expected. An interesting result is that steryl-
ester FB appear slightly earlier than triacylglycerol FBs, between T2 and T3 for
SE (Figure 9 B, left panel) compared to between T3 and T4 for TAG (Figure 1 B,
left panel). This may imply that droplets composed of steryl-ester budded easier,
or faster, or that the time of protein production is shorter for ARE1 than DGA1,
but experiments were not performed to test this idea.
The difference between FB size in the two strains was much smaller for
SE fluorescent bodies in the 4KO and 4KOfld1Δ yeast, and the differences were
only significant from T7 to T9 (Figure 9 C). However differences for other time
points may become statistically significant with quantification of repeats of this
experiment. Similar to GAL-DGA1 expression, there may be growth and lipolysis
of FBs in cells expressing GAL-ARE1 from T0 to T3, since the size of FB in both
strains seemed to rise and fall during this part of the time-course. However, with
GAL-DGA1 expression the size only decreased during this time (Figure 6 C). An
important note about quantifying the area during 0 to 2 hours after switch to
galactose medium is that there were so few droplets, that a really large FB (or a
few small FB) can alter the average significantly. Therefore, quantifying multiple
experiments is important at these early time points. There were enough FBs to
have more confidence in the data at T3 and later time points, when difference in
sizes of FBs between the two strains was clearer, reaching statistical significance

72
at T7, as 4KO droplets become smaller and those in 4KOfld1Δ become larger: A
positive slope (0.17 pixels2 / hour) for 4KOfld1Δ and a negative slope (-0.24
pixels2 /hour) for 4KO. It would be interesting to see if some of the differences for
earlier time-points became significant with more trials, and if the slope of the
change in area during GAL-ARE1 induction in 4KO yeast actually approaches
zero or if it remains negative (i.e., shrink of droplets).
Overall, results from these data demonstrated that seipin deletion droplet
size and number for both TAG and SE fluorescent bodies, but the differences
were more modest for the latter. The best example of this was average FB size,
since the differences did not become significant until T7 when ARE1 is assumed
to be highly over-expressed, and the size of 4KOfld1Δ SE FB does not reach that
of that of TAG FBs in experiments described previously. The slopes of linear
regression of the data from T3 until the end were significantly different, so seipin
deletion still affected the rate of FB growth in size. I would be unable to conclude
that 4KO and 4KOfld1Δ FBs are equal in structure (4KOfld1Δ FBs could still be
clusters, just smaller) without electron microscopy. Another interesting result
from the average size curve was that it does not reach a plateau; it is possible that
the area of 4KOfld1Δ FB may reach that of TAG FB if the experiment continued
for several more hours.
73
The differences in FB number with ARE1 expression echoed the DGA1
data closer than average FB size, but again the differences were smaller. The
fraction of cells with SE droplets was very similar to the fraction of cells with
TAG droplets. However, there did not seem to be a lag with SE droplet
production. A shorter lag was reiterated in FB/Cell, but not in average size, where
the beginning of the linear section of the curve started at T3. If you assume that
seipin deletion causes ectopic droplet formation, do ectopic droplets made of
steryl-ester blister from the membrane more easily than ectopic droplets made of
triacylglycerol? Since cholesterol can increase the stiffness of membranes, and
sterol might be in excess when TAG LD are made (since there is no steryl
acyltransferase in these cells) but not when SE LD are made, steryl-ester droplets
may bud more readily than TAG droplets. If we could use cyclodextran to remove
the excess sterol from 4KOfld1Δ yeast expressing GAL-DGA1, an increased rate
of droplet formation would be consistent with this idea. Another explanation for a
smaller effect of seipin on SE droplet formation compared to formation of TAG
droplets is that seipin functions in TAG packaging but there is an unknown,
partially redundant activity for SE packaging. Finally, if seipin is involved in
inhibiting lipolysis, it is possible that the enzyme that it regulates has more
activity towards TAG than SE.
In summary, seipin deletion affects lipid droplet biosynthesis of SE-filed
lipid droplets, but to less of an extent than TAG LD. Fluorescent bodies were
74
fewer in number per cell and larger in FB area in 4KOfld1Δ yeast during
biogenesis. More experiments expressing GAL-ARE1 need to be quantified to
have full confidence in the data.
2. Problems with Protocols: Lipid Analysis
Fei et al. in 2008 reported differences in neutral lipids between wild type
and fld1Δ yeast 60
. Specifically, they found a two-fold increase in TAG and SE in
log-phase cells growing in rich (YPD) medium, and they stated that this increase
also was found in stationary phase or in minimal medium in both growth phases.
They also reported no difference in radioactive oleate incorporation into TAG, but
a 70% increase of incorporation into SE, compared to wild type cells.
I spent years trying to confirm the steady-state data to begin to study the
mechanism behind the differences. I started by using a lipid extraction protocol
from used in plants by a collaborator in past efforts of the lab, Dr. Kent Chapman
at U. North Texas. The protocol involved initial extraction of a cell pellet in hot
isopropanol without a cell disruption step such as vortexing with glass beads or
digestion of the cell wall with enzymes. Since this was not necessary for the
complete extraction of lipids in plant tissues, we assumed this would be true for
yeast as well. Most published yeast protocols for lipid extraction involved cell
lysis with homogenizers, but since we did not have this equipment in the lab, we

75
were hoping to avoid this step. We also started normalizing our loading of lipid
extracts on TLC plates based on cell wet weight. Fei et al. , after densitometry of
lipid spots on TLC plates, seemed to normalize results based on protein in
extracts, although this is not made clear in the paper 60
. In SD (minimal) medium,
we initially found a 70% increase in TAG with no increase in SE in fld1Δ cells
(wild type background) (8.9 vs. 14.9 nmole lipid / ug protein, Figure 10 A). These
differences in TAG levels varied between these experiments to the extent that the
difference was not significant. Results from Fei et al. in a subsequent paper on
supersized droplets showed that the increase in neutral lipid was only about 25%
in minimal media 62
, indicating some inconsistency in their lab as well.
During my studies on lipid composition in fld1Δ cells, I noticed that there
was an increase in free (non-esterified) fatty acids (FFA) when cells were cultured
in SD minimal medium, and I found this was true for the fld1Δ deletion in two
wild type strain backgrounds: an 80% increase of FFA in the BY4742 strain
(Figure 10 A), and 60% in the MMY011α strain (data not shown). For several
months these differences were reproducible, and so I turned my focus to try to
understand the basis for the FFA increase in fld1Δ. I manipulated the expression
of several genes (including generating gene knockout) to try to understand the
basis for the fld1Δ phenotype of high FFA. However, as these experiments

76
progressed I found that I could no longer reproduce the FFA differences in wild
type vs. fld1Δ. Eventually we learned that cell wall disruption by glass beads or
enzyme digestion before lipid extraction abolished the difference in the amount
FFA recovered in wild type and fld1Δ cells (Figure 10 B). Our initial results could
have been caused by an effect of seipin on cell wall integrity in certain conditions
leading to a more complete extraction of free fatty acids in seipin deficient cells.
Consistent with this idea, I observed the difference of FFA level less often when
the cells were grown to stationary phase when cell wall thickness is increased and
perhaps a more equal extraction occurred 115
.
Besides testing the importance of cell disruption for lipid extraction, I and
others in the lab have tested several other steps of the lipid extraction protocol,
which has led to improvement in the reproducibility of the results. We generally
use chloroform/isopropanol (C/I) extraction (based on the plant protocol) but most
yeast papers describe extraction with chloroform/methanol (C/M) 116
. Another
difference between the protocols is the phase of the extraction that gets washed to
removed impurities or yield more quantitative recovery. The C/I protocol was
based on the Folch method 117
, in which the organic phase of the lipid extraction
is washed several times with 1M KCl to remove impurities. The C/M protocol,
based on the Bligh and Dyer method 103
, re-extracts the remnant solid pellet
residue with chloroform. When I compared the two methods with two cultures of

77
wild type in two independent experiments, TAG was extracted equally, but SE
and FFA were slightly more extracted by 12% and 10%, respectively, with the
C/M method (Figure 10 C). The significance of these small differences are not
clear. I conclude that even though the C/I protocol removes impurities from
organic phase and the C/M protocol may increase yield, there was only a small
difference, if any, in the efficiency of extraction between the two protocols.
We had been lysing cells using glass beads in a lysis buffer in Eppendorf
plastic tubes prior to extraction with organic solvents, but published yeast
protocols usually combined lysis and extraction in one step. However, I was
worried about extracting the plastic of the tube, even though they seem to be
resistant to organic solvents (i.e., they don’t dissolve). Additionally, the amount of
solvent in either protocol was too large for an Eppendorf tube, and samples would
have to be split. For these reasons, we extracted after cell disruption. Another
factor we considered was the extraction time. The plant protocol includes an
overnight extraction with C/I after cell disruption, but many protocols online
extract during cell disruption for only 10 to 30 minutes. Therefore, in a
preliminary experiment I tested the amount of time for glass bead lysis (10 vs. 30
minutes) and for organic solvent extraction (10 minutes vs. O/N) with the C/M
protocol (Figure 10 D). Time of lysis seemed to affect the amount of lipid
extracted more than time of extraction. The sample from a thirty-minute lysis with
overnight extraction contained the most lipid (determined by TLC), so I

78
normalized to that condition. A thirty-minute lysis with overnight extraction
seemed optimal, with the most recovery over the other conditions in every lipid
except sterol or DAG. I conclude that an overnight extraction is beneficial, but a
thirty-minute lysis was more important. However, this experiment should be
repeated to confirm these conclusions.
The final issue that affected the experiment-to-experiment variability
besides the type of extraction was the loading of the lipids, dissolved in
chloroform, onto the TLC plate. Because of the volatility of the solvent, our lab
learned that results were more consistent and reproducible when equal volumes of
sample were loaded. Quantification of lipids per unit cell weight or protein is
then done after the quantification of spots (by densitometry) on the plate.
Chloroform has low surface tension, and it tends to drip out of all pipettes. I
obtained the best results when I quickly spotted 5 µl at a time on a plate. I believe
quickly loading only multiples of five μl, or at least equal amounts, helps to
minimize errors due to evaporation and loss of material.
This was a painful time of my doctoral work, but through these
experiences, and help from Sungwon Han, our postdoctoral fellow, I learned how
to test and develop a protocol. This period also taught me to trust my instincts
since I never was happy with normalizing loading. Finally, I learned that each
step of a protocol can make a difference in results.

79
3. Small Projects
A. Seipin deletion does not cause ER stress
Besides clusters of small droplets seen in fld1Δ yeast, our lab also found
local ER proliferation creating droplet-ER tangles2. Considering the ER
phenotype, I wanted to test whether seipin deletion caused either ER stress or
made cells susceptible to agents that cause ER stress. My colleague, SungKyung
Lee, in the lab had directly tested if fld1Δ yeast had increased HAC1 (XBP1)
splicing (an early event in ER stress is splicing of HAC1/XBP1 by the
endonuclease IRE1) using Northern blotting, and found that there was no increase
over wild type, indicating that ER stress did not accompany deletion of FLD1
(unpublished results).
I then tested whether seipin deletion made yeast susceptible to ER stress.
To this end I created an ire1Δfld1Δ mutant and tested survival with a titration of
DTT and tunicamycin in wild type, fld1Δ, ire1Δ, and ire1Δfld1Δ yeast. Survival
was measured as colony-forming units on rich plates. I treated the cells with
different doses of drug, and plated equal amounts of cells in triplicate on rich
medium plates. Survival of fld1Δ was similar to wild type except at the highest
dose of tunicamycin, where the deletion strain appeared more sensitive. However
survival of fld1Δire1Δ was clearly better than ire1Δ at multiple time points

80
(Figure 11). The ire1Δ strain had an extremely high colony count at a low dose of
tunicamycin, and I believe there was a pipetting error when diluting the cells to
plate them. Therefore, seipin deletion alone had little effect on ER stress, but the
deletion may in fact protect cells from ER stress in the absence of IRE1. This was
only shown with tunicamycin treatment, but DTT treatment had similar results
(data not shown). These results should be confirmed since the experiment was just
performed once.
B. The effect of different detergents on the seipin homo-oligomer
As described earlier, our lab showed that seipin is a homo-oligomer of
about 9 subunits. However, a reviewer of the original submission of the
manuscript questioned the use of a single detergent, Triton X-100, in our
hydrodynamic experiments to determine the molecular mass of the oligomer. In
response, we picked four other detergents with various properties: C12E8, another
nonionic detergent; cholate, an anionic detergent; CHAPS, a zwitterionic (a
positive and negative charge) detergent; and DDM (n-Dodecyl β-D-maltoside), a
third nonionic detergent. All were used at a concentration above the critical
micelle concentration. The three nonionic detergents had different micellar
molecular weights: Triton X-100, 90 KDa; C12E8, 65 KDa; DDM, 50 KDa. Derk
Binns and I performed the gradient centerfugations and immunoblotted the
fractions from the gradients. We learned that different detergents affected the

81
apparent molecular weight (AMW) of the complex (Figure 12 A), and we found
that the effect on the AMW was inversely related to the partial specific volume
(Figure 12 B). Therefore, the less dense/more buoyant the detergent was, the
smaller the AMW (towards 200 KDa). Conversely, since partial specific volume
is the inverse of density, the more dense the detergent, the larger the AMW
(approaching 400 KDa). In conclusion, the density or buoyancy of the detergent
affected the AMW more than it affected the apparent number of monomers in the
complex. Since DDM is an outlier on the curve, it may also alter the number of
monomers in the seipin homo-oligomer. Another intriguing possibility is that it
helps to stabilize a binding partner of the oligomeric complex.
C. Seipin deletion alters the protein composition of lipid droplets
Since our lab believes that seipin deficient droplets are probably ectopic
and dysfunctional, we have been trying to define how they are dysfunctional. One
of the ways might be reflected in an altered protein composition. To test this
possibility, I prepared highly purified lipid droplets from wild type and fld1Δ
yeast, removed the lipids, subjected the proteins to SDS-PAGE, and stained the
resulting gel with silver. I found slight differences in protein composition (Figure
13). In three different purifications, a band around 57 KDa and a band about 24
KDa decreased in fld1Δ cells, and a band at 22 KDa increased in fld1Δ cells. In
two of the three purifications, a band at 30 KDa increased in fld1Δ cells. A

82
collaborator, (Karin Athenstaedt, Graz, Austria), also found the decrease of bands
at 33 and 35 KDa in fld1Δ cells that could represent my band at 24 KDa, although
the large molecular weight differences in the two labs make this possibility
unlikely. She found only a very slight decrease, as I did, of a band at 57 KDa
(except perhaps a very slight decrease). She identified the band around 34 KDa
that was decreased in intensity in fld1 to be Ayr1p, a NADPH-dependent 1-acyl
dihydroxyacetone reductase, involved in PA synthesis. It reduces a ketone group
on 1-acyl dihydroxyacetone to an alcohol (LPA) so that a second acyl chain can
be added at the SN2 position to make PA. It is possible that this reduction of
Ayr1p on fld1Δ LD causes the elevation of cellular PA seen by Fei et al., if there
is more substrate in ER or the enzyme is more active in the ER. Dr. Athenstaedt
did not see any bands increase in fld1Δ yeast, but she also found a moderate
decrease in Erg7p and a slight decrease in Erg6p, enzymes involved in ergosterol
synthesis.
D. Lipid droplet biogenesis may be a two-step process (in cells
with seipin deleted)
In a few of the images of 4KOfld1Δ yeast, I observed three novel
morphologies. Most prominent was that several of the small lipid droplets (100
nm) were more grey than white, but they definitely had a phospholipid border

83
(Figure 14, chevrons). This could signify that the phospholipid layer is created
before neutral lipid is packaged into droplets, which might be captured in 4KO
yeast at an early time point of DGA1 expression. But this may also indicate
cytoplasm above or below the droplet in the thin section, which would be more
likely with tiny droplets. I also saw several lens-like structures connected to
membranes such as those labeled by arrows in Figure 14. Finally, in Figure 14 C,
I captured a circular organelle from which droplets seemed to be emanating. Have
I captured LDs in the process of normal biogenesis or in the process of lipolysis
by a peroxisome, or is this phenomenon very specific for 4KOfld1Δ yeast in
galactose medium only expressing DGA1? I am inclined to think that 4KOfld1Δ
(and probably fld1Δ) droplets are “younger” than normal droplets. Are seipin
droplets less mature, or just smaller? These are questions that could be addressed
in the future.

84
Figure 6. Seipin deletion alters lipid droplet biogenesis of triacylglycerol droplets. (A) Representative
images of 4KO and 4KOfld1Δ cells expressing galactose promoter-driven DGA1 on a plasmid at different
hours after dilution into galactose medium (time zero is in raffinose medium before switch to galactose).
B
C
A
4KO
4KOfld1Δ
0 1 3 42 5 96
Hours after switch to galactose medium
4KO 4KOfld1ΔD

85
Cells were stained with BODIPY. (B) Quantification of four time courses as described in A. Fluorescent
bodies and the fraction of cells in a field with FB were counted and plotted versus time. Left panel shows the
average number of FB per cell. Right panel shows the fraction of cells with at least 1 FB. Three fields per
time point, 4 experiments. (C) FB area was quantified with ImageJ and plotted versus time. Left panel
quantified FB area in fields of cells. Right panel quantified 20 FB per field at 5 hours after switch to
galactose medium. (D) Close-up images of single cells from panel A, 6 hours. For panels B and C *: p-value
<0.05, **: p-value <0.01, ***: p-value <0.001, ****: p-value < 0.0001. Error bars are standard error of the
means.

86
A
D
θ
B
i ii
iii
C

87
Figure 7. Seipin deletion inhibits early TAG formation, integrity of fluorescent bodies, and possibly
TAG packaging. (A) Results from thin layer chromatography of lipid extracts from 4KO and 4KOfld1Δ cells
expressing DGA1 behind a galactose-inducible promoter quantified using densitometry of acid-charred
plates. Results from two independent experiments. (B) and (C) Characterization of line scans of FB in 4KO
and 4KOfld1Δ cells that resulted in peaks of BODIPY intensity over distance. Twenty FB per field of three
fields from three independent experiments were characterized at 5 hours after switch to galactose medium.
The left panel of (B) is an illustration showing the peak width in red and the peak angle, theta, in orange. The
right panel of (B) shows the averages of fifty-two peaks for each strain aligned at the highest intensity pixel.
Panel (C-i) characterizes intensity above background in arbitrary units (AU). Panel (C-ii) characterizes peak
angle, theta, in degrees (See methods for more detail). Panel (C-iii) characterizes peak width in pixels at the
inflection point as indicated in (B) left. (D) BODIPY intensity was quantified as in (B), but for intracellular
membranes. See Figure 6 for explanation of asterisks.

88
4KO
4KO
fld1Δ
4KO
4KO
fld1Δ

89
E F
J
4KO 4KOfldΔ
4KOfldΔ

90
Figure 8. Seipin deletion decreases TAG droplet size and induces droplet formation in nuclei. (A) and
(B) Representative images of cells at 10,000X in the indicated strains expressing DGA1 behind a galactose-
inducible promoter and fixed at 6 hours after switch to galactose medium. Scale bar, 2 μm. Striped boxes
indicate the area shown in the high magnification images below (C) (50,000X) and (D) (60,000X). Bar in
striped boxes, 500 nm. Arrow indicates lens-like structures (or flat LD). (E) Quantification of the percentage
of cells containing LD clusters (a minimum of three cells within ~200 nm of each other. (F) Characterization
of the density of droplets in clusters from 4KO and 4KOfld1Δ cells. (G) and (H)- Images illustrating large
electron sparse structures that are usually associated with vacuoles in both 4KO (G) and 4KOfld1Δ (H) yeast.
Scale bar, 500 nm (60,000X). (I) An example of droplets in the nucleoplasm of 4KOfld1Δ cells (indicated by
an arrowhead). Scale bar, 1000 nm (20,000X). (J) Quantification of percentage of cells with LD in nuclei in
both strains expressing Gal-DGA1. See Figure 6 for explanation of asterisks.

91
Figure 9. Seipin deletion modestly affects SE fluorescent body formation. (A) Representative images of
4KO and 4KOfld1Δ cells expressing galactose promoter-driven ARE1 at different times after switch to
galactose medium (time zero is in raffinose medium immediately before switch to galactose). Cells were
stained with BODIPY. (B) Quantification of one experiment performed as in (A) (including 7 and 8 hours
after switch to galactose medium). Fluorescent bodies and the fraction of cells in a field with FB were
counted and plotted versus time. Left panel shows the average number of FB per cell. Right panel shows the
fraction of cells with at least 1 FB. Three fields per time point, 1 experiment. (C) Area of FBs were quantified
with ImageJ and plotted versus time. (D) Close-up images of single cells from panel A, 6 hours. See Figure 6
for explanation of asterisks.
4KO
4KOfld1Δ
0 1 3 42 5 96
Hours after switch to galactose mediumA
B
C4KO 4KOfld1Δ
D

92
Figure 10. Effects of seipin deletion on neutral lipid levels based as measured by variations of lipid
extraction protocol. (A) Whole cell neutral lipid concentration in minimal medium during log-phase growth
in WT and fld1Δ quantified from acid-charred thin layer chromatography plates. DAG, diacylglycerol; FFA,
free fatty acids; TAG, triacylglycerol; SE, steryl-ester. Cells were extracted using the chloroform/
isopropanol method (see Methods for more details). (B) FFA levels from a single experiment expressed as a
percentage of WT that were quantified as in A. Treatment indicates the method used to disrupt the cell wall
before solvents were added for lipid extraction. (C) Lipid levels from WT cells using two different extraction
methods, chloroform/methanol and chloroform/isopropanol, expressed as a percentage of standard (40 μg of
triolein (TAG), 30 μg of oleic acid (FFA), or 50 μg of cholesteryl oleate (SE)). Results from two experiments
with duplicate cultures. Error bars are standard error of the means. (D) Difference in relative lipid levels
comparing two different lysis times (30 minutes vs. 10 minutes) and two different extraction times (overnight
vs. 10 minutes) that are expressed as a percentage of 30 minute lysis with overnight extraction. Results from a
single experiment.
A B
DC

93
Figure 11. Seipin deletion does not seem to enhance susceptibility to death due to ER stress. Survival
curve of the indicated strains with increasing doses of tunicamycin. Equal cells were plated in triplicate after
30 minute treatment with drug. Colony numbers were counted after two days of growth and expressed as a
percentage of untreated cells. Results are a single experiment plated in triplicate. Error bars are standard error
of the means.

94
Figure 12. Effect of different detergents on the seipin homo-oligomer. (A) Detergent glycerol gradients of
crude membrane preparations solubilized in the same detergent from cells expressing seipin-13xmyc fusion
protein from the genome were fractionated and immunobloted for myc. Apparent molecular weight was
calculated using the standards: t, thyroglobulin (669 KDa); c, catalase (232 KDa); l, lactate dehydrogenase
(140 KDa); a, albumin (67 KDa). (B) The correlation between apparent molecular weight of the seipin
oligomer in each detergent from A and the partial specific volume of those detergents. Figure and legend
A Triton X-100
C12E8
CHAPS
Cholate
DDM
B.

95
reproduced in part from Figure 1 and Supplemental Figure 2 of Binns, D., Lee, S., Hilton, C.L., Jiang, Q.X.
& Goodman, J.M. Biochemistry 49, 10747-10755 (2010).
Figure 13. Seipin deletion alters the protein composition of lipid droplets. Lipid droplets were purified by
separation on density gradients (see Methods). The purified droplets were de-lipidated with ether, subjected
to SDS-PAGE, and the gel was then silver stained. Three independent preparations are aligned and shown. L
indicates ladder of protein standards. Blue stars to the right of lanes indicate changes between WT and fld1Δ
that appear at least twice.
75 kDa
50 kDa
37 kDa
25 kDa
L WT fld1Δ L WT fld1Δ L WT fld1Δ

96

97
Figure 14. 4KOfld1Δ clusters have evidence of lens-like, flat droplets in communication with
membranes and phospholipid-defined, medium electron density droplets. (A-D) Samples processed as in
Figure 3. Images shown are 60,000X. Bar, 500 nm. Arrows indicate lens-like droplets or membranes from
which droplets appear to be emanating. Chevrons indicate droplets of medium electron density droplets
within a membrane.

98
Discussion
Summary
The results are clear that seipin is involved in lipid droplet biogenesis, at
least in our system. Fluorescent body number and size were oppositely affected
(number down, area up) in 4KOfld1Δ yeast, as well as the integrity and regularity
of FB, but in the electron microscopy images, we learned that mutant FB were
actually clusters of small droplets at least at 6 hours after switch to galactose
medium. My data regarding the effect of seipin on whole cell triacylglycerol
levels during induction were inconclusive, but later work with chromosomally
integrated GAL-DGA1 showed that levels of TAG were very similar with or
without seipin during induction. I also have presented fluorescence data of
BODIPY-stained intracellular membranes suggesting that there is more TAG in
membranes. Finally, steryl-ester fluorescent body formation (driven by plasmid-
encoded GAL-ARE1) is inhibited in 4KOfld1Δ yeast, but to a lesser extent than
during TAG FB formation.
In several side projects, I leaned about protocol development and
troubleshooting, a possible role of seipin in droplet protein composition, the
effects of different detergents on the seipin homo-oligomer, and the lack of a role

99
for seipin in ER stress. Lipid yields were extremely affected cell lysis and
extraction conditions. However, there was little difference of isopropanol vs.
methanol in the extraction solvent or in different secondary extraction conditions.
Regarding droplet protein composition, seipin deletion resulted in some
differences in stained bands from SDS-PAGE, but not much reproducibility
between my and Dr. Athaenstadt’s preparations except possibly a reduced amount
of Ayr1p. Different detergents had an effect on the apparent molecular weight of
the seipin homo-oligomer-detergent complex without changing the mass of the
oligomer, with the possible exception of n-dodecyl β-D-maltoside. Seipin deletion
did not cause an increase in the ER stress reaction of HAC1 splicing or
susceptiblity to tunicamycin, indicating that fld1Δ cells did not display an increase
in ER stress. Finally, EM images of 4KOfld1Δ yeast seemed to depict lipid
droplet structures suggestive of the lens model of biogenesis, with the caveats that
the droplets store only TAG, and the lens droplet morphology was only observed
in a strain lacking seipin.
Future Directions
The immediate goal of creating the biogenesis system was to have a tool
to see if seipin was involved in lipid droplet biogenesis or if it was involved in
some downstream maintenance pathway that kept LD normal, and we learned that

100
seipin is involved in both TAG and SE droplet biogenesis. Specifically, we know
seipin is involved with TAG droplet architecture, since a large majority of LD are
nanoLDs (100 nm in diameter) and yet there is equal whole cell TAG. How
directly seipin is involved in lipid droplet biogenesis is still a mystery.
I believe seipin may be a structural component of the ER-droplet sub-
domain, but it is not a coat protein like a COPII component or a perilipin since it
localizes to ER and not droplets. If seipin were a valve, it could explain why
droplets are smaller and there is more lipid in membranes (assuming this is
reflected in my staining measurements) because without the valve, lipid would
freely flow back into ER, decreasing the volume of lipid in droplets. How would
such a valve operate at the molecular level? If the lumenal loop of seipin is
amphipathic enough to exist in a hydrophobic environment (it binds tightly to
membranes when expressed by itself (Hilton, Han, and Cartwright, unpublished
observation)), then the N- and C-tails could still be in the cytoplasm and the rest
of the protein could be completely “submerged” in the neutral lipid in the “neck”
of the droplet, such that the interior of the toroid oligomer (transmembrane
segments and loop) is in the neck while the termini face the cytosol. This
orientation would put the toroid in the right location relative to ER and LD during
droplet formation and maintenance. This orientation is doubtful, however,
because the toroid would have to rotate or alter shape so that the termini remain in
the cytosol and the loop returns to the inner leaflet of the lumen of the ER, when

101
the seipin toroid is “free” of a droplet. The seipin toroid could still surround the
neck with the previous predicted topology 50
during droplet formation and
maintenance, such that the cytoplasmic tails surround the neck, but this places
most of the protein in the leaflets of the ER distal to the droplet. On top of that, a
physical neck of a droplet with respect to the ER has not been observed. An
additional unknown issue is whether seipin acts as a one-way valve or a two-way
channel. Could the toroid exclude lipid with charge or a hydrophilic face (e.g.,
bound to water)? Could it let non-neutral substrates in but keep neutral lipid out of
the plane of the ER?
What evidence would we need to show seipin functions as a valve? One
way is to definitively show that there is more neutral lipid in membranes in
seipin-deficient cells. To this end our lab is currently measuring the density of ER
by isopycnic sucrose gradient sedimentation in 3.5KO and 3.5KOfld1Δ yeast (see
below), since membranes with more lipid should float higher in the gradient. In
my system, we encoded GAL-DGA1 on a plasmid, but we later knocked-in the
GAL1-10 promoter in front of the DGA1 open reading frame in the genome in a
triple deletion background to get more homogenous control over DGA1
expression (referred to as the 2nd generation; my plasmid system described in this
dissertation was the first generation). In this second generation, the background
strain is referred to as 3.5KO, and the fld1Δ strain as 3.5KOfld1Δ. Preliminary

102
experiments indicate that 3.5KOfld1Δ cells expressing DGA1 have relatively more
TAG in the ER and “cytosol” compartments and less in the LD fraction. TAG in
the cytosol may indicate that nano-droplets that do not contain enough lipid, or
are two small, to float all the way to the top during centrifugation.
If lipid precursors bind to seipin, this may suggest that seipin could
channel the precursors. In this regard, we observed in the lab that seipin bound to
several phosphorylated phosphatidyl inositol species, but not neutral lipid. As a
valve, however, it should repel neutral lipid from one side. If neutral lipid is
required for, or enhances, oligomerization or conformation of seipin, I think this
could indicate that seipin is regulated by neutral lipid. Testing this hypothesis will
require structural studies with purified seipin. If a region were to be identified that
were a candidate for valve function, it may be possible to engineer a seipin that
was directionally reversed (assuming a one way valve), that should block LD
formation, since no lipid would be able to go into a droplet, just “out”.
Another way seipin could be promoting formation of larger droplets is by
regulating lipolysis. An increase in lipolytic activity without block of de novo
lipid synthesis results in many small droplets (perhaps to prevent lipotoxicity) 118
,
which is what we mainly see in our biogenesis system in 4KOfld1Δ yeast. It
would also make sense that both supersized droplets and membrane wrapping

103
would be mechanisms to prevent increased lipolysis by physically limiting access
to lipase. The effect on neutral lipid by increased lipolysis may be counteracted
with over-expression of DGA1 in my system (4KO) and that with the
chromosomally-expressed DGA1 construct (3.5KO). In this regard, measuring
lipolysis (by glycerol release) during DGA1 induction should be informative. It is
possible we may not see a difference if the glycerol is efficiently being recycled
into lipid at the same time, so we may have to switch yeast back to glucose
medium that would truncate DGA1 expression and activity. Conversely, adding a
lipase inhibitor may rescue the large FB phenotype. Since the only lipase
inhibitors available are active against pancreatic lipases 119
, we would have to
determine if these inhibitors were active towards yeast lipases. We can also knock
out the lipases in our biogenesis system although the lack of auxotrophies and
antibiotic-resistance markers in our multiply-deleted strains may limit this
approach. If these results become feasible, we can see if Fld1p interacts with any
of the lipases or if some post-translational modification of one of the lipases is
changed in fld1Δ yeast. Indeed, the TAG lipase Tgl3p requires Fld1p for efficient
targeting 63
.
A third way seipin can alter LD size without altering TAG levels is by
altering the protein composition of the LD. Perhaps this alters the coat of a droplet
or actually decreases fusion of nanoLD, although in vitro data implies that seipin

104
null droplets are actually fusogenic 60
. How seipin maintains protein composition
is harder to explain. It could possibly help import certain proteins onto the lipid
droplet, or it could just help maintain the ER-LD junction. If seipin were involved
in protein import or junction maintenance, I would expect to see a larger defect in
LD protein composition. However, if this were the case, over-expression of LD
proteins might rescue the localization of some of these proteins as well as the LD
morphology phenotype. But levels of droplet protein mRNA do not change in
fld1. A complementation screen may be useful, or even overexpressing
proteins deficient in droplets from fld1Δ, such as Ayr1p, Erg6p, and Erg7p from
Dr. Athenstaedt’s LD proteome work. Additionally, the complementation screen
may uncover other functions of seipin.
There are other questions I would like to answer in the biogenesis system.
As discussed earlier, localized ER proliferation and supersized droplets are seen
in fld1Δ cells but not in our de novo droplet system. It would be interesting to see
if membrane wrapping and/or supersized droplets were a product of LD “age”,
presence of steryl-ester, a balance of phospholipid to neutral lipid (which could be
altered directly by LRO1, the other DAG acyltransferase), or a specific culture
medium (± phospholipid precursor head groups such as Fei found 62
). I would,
therefore repeat the electron microscopy study with ARE1 and LRO1 (and DGA1)
in 3.5KO and 3.5KOfld1Δ cells alongside WT and fld1Δ control strains. This may

105
be an overzealous plan, but it should prove definitive in addressing clustered vs.
supersized droplets and membrane wrapping of LDs. An additional observation I
made was the presence of lens-like small droplets in the 4KOfld1Δ strain. To
determine if these structures are only found in fld1Δ strains, a more robust
examination at the electron microscopic level of the 4KO strain during droplet
biogenesis should be undertaken. We performed electron microscopy on cells
fixed at T6, and another group imaged cells at T0 and T4 89
, but what do these
droplets look like at very early times of TAG or SE synthesis? Do we see medium
electron-density droplets bound by a phospholipid layer (assumed to be a
monolayer)? Do we see lens-like or flat droplets like we do in 4KOfld1Δ cells?
Do we ever see a “neck” between LD and ER? We hope that our system can
answer some of these basic questions of LD biogenesis.
An additional issue is the modest effect of FLD1 deletion on droplet
formation driven by ARE1 compared to DGA1 (Figure 6 vs. Figure 9)? I
hypothesize that increased sterol in cells expressing GAL-DGA1 compared to
those expressing GAL-ARE1 (which is converting sterol to steryl-ester) could
make membranes more stiff and increase the intra-bilayer pressure that has to
build up to sprout ectopic droplets (such as those I see in the nucleoplasm). One
way to test this is to add excess sterol to 3.5KO and 3.5KOfld1Δ cells expressing

106
ARE1 to determine whether the phenotype becomes more pronounced and
resembles the GAL-DGA1 system. There may be a problem with the experiment,
however, if the increasing Are1p activity during the induction can convert the
exogenous sterol to the ester. Hopefully we can saturate the enzyme with a
titration of sterol. Another way would be to extract ergosterol from cells
expressing DGA1 possibly with methyl-β-cyclodextrin (previously shown to be
effective in yeast 120
). Cyclodextrin is usually used to extract sterol from plasma
membranes, but presumably the remaining sterol would re-distribute throughout
the cells, thereby decreasing the effective concentration in ER membranes. A
decrease in ER sterol would have to be confirmed biochemically. This experiment
should show whether the phenotype becomes less pronounced in 3.5KOfld1Δ
yeast.
Another possibility to explain the less pronounced size phenotype in ARE1
expression compared to DGA1 in the absence of seipin is that steryl-ester clusters
are smaller and closer to 3.5KO (and in my case, 4KO) steryl-ester LD size due to
the chemical nature of steryl-ester or the size of the pool of steryl-ester that cells
maintain. I believe this may be true because my data indicate that 4KO SE FB are
smaller than 4KO TAG FB, and I assume that the difference in fld1Δ droplets are
proportional. It is not possible to compare SE and TAG (4KO) FB size based on
my graphs because the size was quantified differently: TAG FB area is from raw

107
ImageJ data regardless of morphology. For the SE data when an FB appeared to
be a cluster, the individual smaller droplets were counted separately (compare
Figure 6 C and Figure 9 C). The raw data is saved, so a direct comparison can be
performed, and SE FB in 4KO cells are generally smaller than TAG FB.
Therefore, it is probable that the 4KOfld1Δ droplets in the SE clusters are smaller
as well, and EM analysis of our two strains expressing ARE1 at T6 could show
this. It seems likely that 4KOfld1Δ SE droplets are small enough to decrease the
area of 4KOfld1Δ FB (probably representing LD clusters).
The cause of the smaller effect of fld1Δ on SE vs. TAG droplets, however,
is probably more complicated than simply a smaller LD area. There may be an
organizational difference within clusters in the 4KOfld1Δ in the two droplet types.
The number of FBs per cell differs (in the presence of seipin), with SE FBs
reaching 6.0, while TAG FBs peak at 7.1. In 4KOfld1Δ cells, SE FB number/cell
peaks at 4.2, but TAG FB number/cell peaks at 2.6, which does not correlate with
the corresponding values in the presence of seipin. This does not preclude the
possibility that 4KOfld1Δ clusters composed of SE have fewer droplets than those
composed of TAG due to decreased tethering among droplets, for example. (We
would need EM evidence to test this difference in nanoLD density.) Perhaps

108
hypothetical tethering proteins insert less efficiently into SE droplets than TAG
droplets, and an examination of LD proteins in both strains expressing either
DGA1 or ARE1 may reveal this. In summary, the decrease in area phenotype we
see with SE FB could be directly related to droplet volume in fld1Δ cells based on
lipid species or a change in organization of 4KOfld1Δ clusters (fewer droplets per
cluster and more clusters).
With more time, I would also further validate the conclusions drawn from
some of my data, mainly by quantifying more trials with ARE1, re-characterizing
DGA1 FB area by correcting the raw data, and a third trial of lipid levels in the
DGA1-induction experiment.
Even if over-expressing Ayr1p, Erg6p, or Erg7p, proteins that were under-
represented in the LD proteome studies by Karen Athenstaedt do not rescue the
FB phenotype, I still believe they should be investigated. First, I would see if a
difference in localization of CFP (or mCherry) fusion proteins (with green
BODIPY staining) can be visually distinguished between WT and fld1Δ cells to
further show that there is a difference in LD localization and to possibly track the
re-localization in another compartment of the cell. I think the degradation rates of
these proteins should also be measured in WT and fld1Δ cells to see if the rates
are higher in fld1Δ, which could explain their decrease in LD localization in the

109
seipin mutant. Since continue to search for binding partners of seipin, direct co-
immunoprecipitation should be tested between Fld1p and these proteins.
Conclusion
I am the first to show definitive evidence for seipin being involved in LD
biosynthesis which is different from effects on adipogenesis in professional
mammalian adipocytes. I also show evidence that there is more TAG in
membranes of 4KOfld1Δ cells, suggesting that seipin may work as a valve to
regulate packaging. Finally, I provide the first evidence that nascent TAG droplets
in galactose minimal medium do not have membrane wrapping or supersized
droplets, and that nanoLDs have lens like structures and perhaps “half-filled” LD.
This may lend clues to the general molecular function of seipin apart from (or
connected to) its role in pre-adipocytes as they transition to adipocytes.
Knowledge of seipin’s role in biogenesis may have broader applications. The
biogenesis system allows study of early versus late defects in seipin-deficient
droplets such as proximal membrane wrapping and perhaps alterations of
lipolysis. Finally, I was able to quantify FB area using a combination of computer
software and human correction, optimize lipid extraction in our yeast strains, and
contribute to the LD proteome in the presence and absence of seipin.

110
Appendix A

111
A 4KO B 4KOfld1Δ
C
4KO
D
4KOfld1Δ

112
Figure 15. Morphology of 4KO and 4KOfld1Δ fluorescent bodies 6 hours after switch to galactose
medium. (A) Top: Image from 4KO, Figure 6, panel A, 6 hr with a striped box indicating where the bottom
image was zoomed in from. Bottom: Close-up image of a 4KO single cell expressing Gal-DGA1 from the
striped box in the top image, also in Figure 6, Panel D. (B) Top: Image from 4KOfld1Δ, Figure 6, panel A, 6
hr with a striped box indicating where the bottom image was zoomed in from. Bottom: Close-up image of a
4KOfld1Δ single cell expressing Gal-DGA1 from the striped box in the top image, also in Figure 6, Panel D.
(C) Top: Image from 4KO, Figure 9, panel A, 6 hr with a striped box indicating where the bottom image was
zoomed in from. Bottom: Close-up image of a 4KO single cell expressing Gal-ARE1 from the striped box in
the top image, also in Figure 9, Panel D. (B) Top: Image from 4KOfld1Δ, Figure 9, panel A, 6 hr with a
striped box indicating where the bottom image was zoomed in from. Bottom: Close-up image of a 4KOfld1Δ
single cell expressing Gal-ARE1 from the striped box in the top image, also in Figure 9, Panel D.
Figure 16. Linear regressions of data from Figure 6 B and C and Figure 7 A.
A B
C D

113
Figure 17. (A-C) Linear regressions of data from Figure 9 B and C. (D) Comparison of the area of FB
in strains expressing GAL-DGA1 compared to those expressing GAL-ARE1.
A B
C D
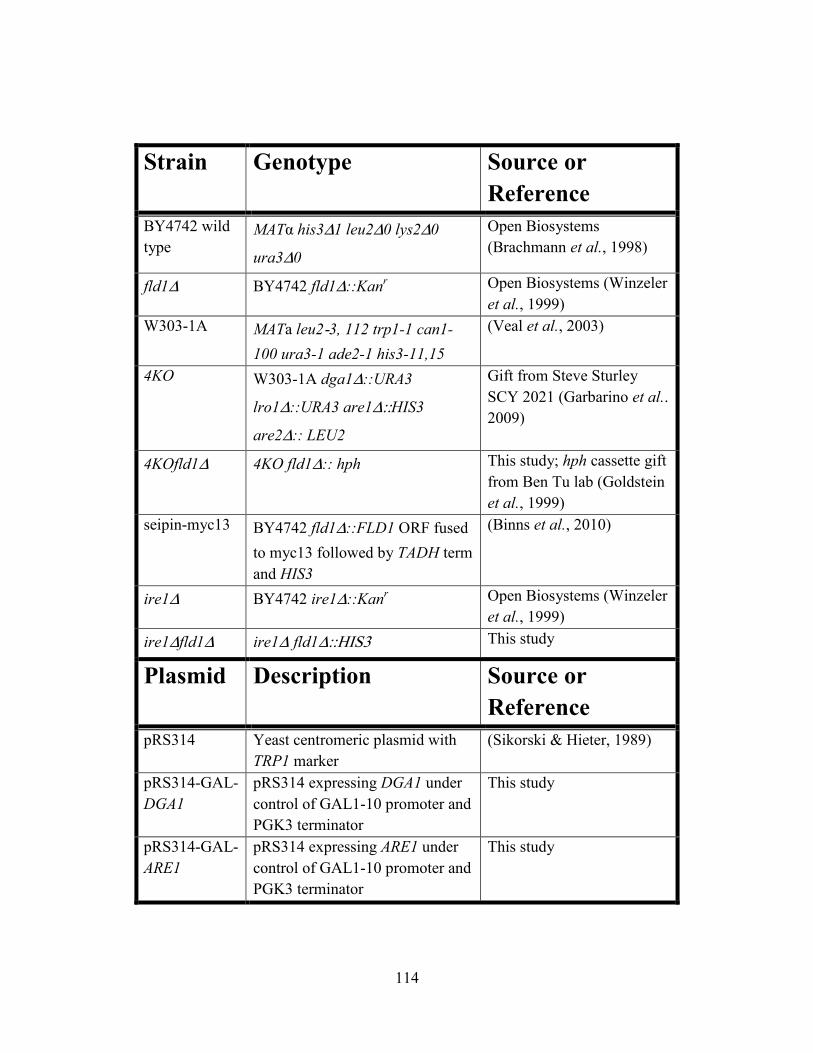
114
Strain Genotype Source or
Reference
BY4742 wild
type MATα his3Δ1 leu2Δ0 lys2Δ0
ura3Δ0
Open Biosystems
(Brachmann et al., 1998)
fld1Δ BY4742 fld1Δ::Kanr Open Biosystems (Winzeler
et al., 1999)
W303-1A MATa leu2-3, 112 trp1-1 can1-
100 ura3-1 ade2-1 his3-11,15
(Veal et al., 2003)
4KO W303-1A dga1Δ::URA3
lro1Δ::URA3 are1Δ::HIS3
are2Δ:: LEU2
Gift from Steve Sturley
SCY 2021 (Garbarino et al..
2009)
4KOfld1Δ 4KO fld1Δ:: hph This study; hph cassette gift
from Ben Tu lab (Goldstein
et al., 1999)
seipin-myc13 BY4742 fld1Δ::FLD1 ORF fused
to myc13 followed by TADH term
and HIS3
(Binns et al., 2010)
ire1Δ BY4742 ire1Δ::Kanr Open Biosystems (Winzeler
et al., 1999)
ire1Δfld1Δ ire1Δ fld1Δ::HIS3 This study
Plasmid Description Source or
Reference
pRS314 Yeast centromeric plasmid with
TRP1 marker
(Sikorski & Hieter, 1989)
pRS314-GAL-
DGA1
pRS314 expressing DGA1 under
control of GAL1-10 promoter and
PGK3 terminator
This study
pRS314-GAL-
ARE1
pRS314 expressing ARE1 under
control of GAL1-10 promoter and
PGK3 terminator
This study

115
116
References
1. Suzuki, M., Shinohara, Y., Ohsaki, Y. & Fujimoto, T. Lipid droplets: size
matters. Journal of Electron Microscopy 60, S101-S116 (2011).
2. Szymanski, K.M. et al. The lipodystrophy protein seipin is found at
endoplasmic reticulum lipid droplet junctions and is important for droplet
morphology. Proc Natl Acad Sci U S A 104, 20890-20895 (2007).
3. Magre, J. et al. Identification of the gene altered in Berardinelli-Seip
congenital lipodystrophy on chromosome 11q13. Nat Genet 28, 365-370
(2001).
4. Agarwal, A.K. et al. Phenotypic and Genetic Heterogeneity in Congenital
Generalized Lipodystrophy. Journal of Clinical Endocrinology &
Metabolism 88, 4840-4847 (2003).
5. Bonilla, F.A. Development of Population-Based Newborn Screening for
Severe Combined Immunodeficiency. Pediatrics 118, S47 (2006).
6. Buckley, R.H. The multiple causes of human SCID. The Journal of
Clinical Investigation 114, 1409-1411 (2004).
7. Miller, J. et al. HIV lipodystrophy: prevalence, severity and correlates of
risk in Australia. HIV Medicine 4, 293-301 (2003).
8. Giralt, M. et al. HIV-1 infection alters gene expression in adipose tissue,
which contributes to HIV- 1/HAART-associated lipodystrophy. Antiviral
Therapy 11, 729-740 (2006).
9. Reeves, W.G., Allen, B.R. & Tattersall, R.B. Insulin-induced lipoatrophy:
evidence for an immune pathogenesis. BMJ 280 (1980).
10. Kayikcioglu, A., Akyürek, M. & Erk, Y.c. Semicircular lipoatrophy
after intragluteal injection of benzathine penicillin. The Journal of
Pediatrics 129, 166-167 (1996).
11. Andre, P. Post corticosteroid lipo atrophy treated by fat grafting. Annales
de Dermatologie et de Venereologie 117, 733-734 (1990).
12. Dahl, P.R., Zalla, M.J. & Winkelmann, R.K. Localized involutional
lipoatrophy: A clinicopathologic study of 16 patients. Journal of the
American Academy of Dermatology 35, 523-528 (1996).
13. Simha, V. & Garg, A. Phenotypic heterogeneity in body fat distribution in
patients with congenital generalized lipodystrophy caused by mutations in
the AGPAT2 or seipin genes. J Clin Endocrinol Metab 88, 5433-5437
(2003).
14. Geffner, M.E. & Golde, D.W. Selective Insulin Action on Skin, Ovary,
and Heart in Insulin-Resistant States. Diabetes Care 11, 500-505 (1988).

117
15. Nguyen, T.T., Sheppard, A.M., Kaye, P.L. & Noakes, P.G. IGF-I and
insulin activate mitogen-activated protein kinase via the type 1 IGF
receptor in mouse embryonic stem cells. Reproduction 134, 41-49 (2007).
16. Antuna-Puente, B. et al. Higher Adiponectin Levels in Patients with
Berardinelli-Seip Congenital Lipodystrophy due to Seipin as compared
with 1-Acylglycerol-3-Phosphate-O-Acyltransferase-2 Deficiency. J Clin
Endocrinol Metab (2010).
17. Baker, J., Liu, J.-P., Robertson, E.J. & Efstratiadis, A. Role of insulin-like
growth factors in embryonic and postnatal growth. Cell 75, 73-82 (1993).
18. Stratikopoulos, E., Szabolcs, M., Dragatsis, I., Klinakis, A. & Efstratiadis,
A. The hormonal action of IGF1 in postnatal mouse growth. Proceedings
of the National Academy of Sciences 105, 19378-19383 (2008).
19. Woods, K.A. et al. Effects of Insulin-Like Growth Factor I (IGF-I)
Therapy on Body Composition and Insulin Resistance in IGF-I Gene
Deletion. Journal of Clinical Endocrinology & Metabolism 85, 1407-1411
(2000).
20. Liu, J.-m. et al. IGF-1 as an early marker for low bone mass or
osteoporosis in premenopausal and postmenopausal women. Journal of
Bone and Mineral Metabolism 26, 159-164 (2008).
21. Zapf, J., Rinderknecht, E., Humbel, R.E. & Froesch, E.R. Nonsuppressible
insulin-like activity (NSILA) from human serum: Recent
accomplishments and their physiologic implications. Metabolism 27,
1803-1828 (1978).
22. Van Maldergem, L. et al. Genotype-phenotype relationships in
Berardinelli-Seip congenital lipodystrophy. J Med Genet 39, 722-733
(2002).
23. Haque, W.A., Shimomura, I., Matsuzawa, Y. & Garg, A. Serum
Adiponectin and Leptin Levels in Patients with Lipodystrophies. Journal
of Clinical Endocrinology & Metabolism 87, 2395 (2002).
24. Arihara, Z., Sakurai, K., Yamada, S., Murakami, O. & Takahashi, K.
Acromegaly with Normal IGF-1 Levels Probably due to Poorly Controlled
Diabetes Mellitus. The Tohoku Journal of Experimental Medicine 216,
325-329 (2008).
25. Rommel, C. et al. Mediation of IGF-1-induced skeletal myotube
hypertrophy by PI(3)K/Akt/mTOR and PI(3)K/Akt/GSK3 pathways. Nat
Cell Biol 3, 1009-1013 (2001).
26. Berardinelli, W. AN UNDIAGNOSED ENDOCRINOMETABOLIC
SYNDROME: REPORT OF 2 CASES. Journal of Clinical Endocrinology
& Metabolism 14, 193-204 (1954).
27. Barbieri, R.L. et al. Insulin Stimulates Androgen Accumulation in
Incubations of Ovarian Stroma Obtained from Women with

118
Hyperandrogenism. Journal of Clinical Endocrinology & Metabolism 62,
904-910 (1986).
28. Miehle, K., Stumvoll, M. & Fasshauer, M. [Lipodystrophy: Mechanisms,
clinical presentation, therapy]. Der Internist 52, 362-373 (2011).
29. Monajemi, H., Stroes, E., Hegele, R.A. & Fliers, E. Inherited
lipodystrophies and the metabolic syndrome. Clinical Endocrinology 67,
479-484 (2007).
30. Agarwal, A.K. & Garg, A. Genetic Basis of Lipodystrophies and
Management of Metabolic Complications. Annual Review of Medicine 57,
297-311 (2006).
31. Agarwal, A.K., Barnes, R.I. & Garg, A. Genetic basis of congenital
generalized lipodystrophy. Int J Obes Relat Metab Disord 28, 336-339
(2004).
32. Arioglu, E. et al. Efficacy and Safety of Troglitazone in the Treatment of
Lipodystrophy Syndromes. Annals of Internal Medicine 133, 263-274
(2000).
33. Chong, A.Y., Lupsa, B.C., Cochran, E.K. & Gorden, P. Efficacy of leptin
therapy in the different forms of human lipodystrophy. Diabetologia 53,
27-35 (2010).
34. Oral, E.A. et al. Leptin-Replacement Therapy for Lipodystrophy. New
England Journal of Medicine 346, 570-578 (2002).
35. Nistri, S. et al. Beta Blockers for Prevention of Exercise-Induced Left
Ventricular Outflow Tract Obstruction in Patients With Hypertrophic
Cardiomyopathy. The American journal of cardiology (2012).
36. Ball, W. et al. Long-Term Survival in Patients With Resting Obstructive
Hypertrophic Cardiomyopathy: Comparison of Conservative Versus
Invasive Treatment. J Am Coll Cardiol 58, 2313-2321 (2011).
37. Lacovoni, A. et al. A contemporary European experience with surgical
septal myectomy in hypertrophic cardiomyopathy. European Heart
Journal (2012).
38. Brady, P.A. Surviving hypertrophic cardiomyopathy: counting the cost of
implantable cardioverter defibrillator therapy to prevent sudden death.
Heart 98, 97-98 (2012).
39. Fu, M. et al. Mutations in Gng3lg and AGPAT2 in Berardinelli-Seip
Congenital Lipodystrophy and Brunzell Syndrome: Phenotype Variability
Suggests Important Modifier Effects. Journal of Clinical Endocrinology &
Metabolism 89, 2916-2922 (2004).
40. Agarwal, A.K. & Garg, A. Seipin: a mysterious protein. Trends Mol Med
10, 440-444 (2004).
41. Rajab, A. et al. Fatal Cardiac Arrhythmia and Long-QT Syndrome in a
New Form of Congenital Generalized Lipodystrophy with Muscle
119
Rippling (CGL4) Due to <italic>PTRF-CAVIN</italic> Mutations. PLoS
Genet 6, e1000874 (2010).
42. Hayashi, Y.K. et al. Human PTRF mutations cause secondary deficiency
of caveolins resulting in muscular dystrophy with generalized
lipodystrophy. Journal of Clinical Investigation 119, 2623-2633 (2009).
43. Williams, T. & Lisanti, M. The caveolin proteins. Genome Biology 5, 214
(2004).
44. Hill, M.M. et al. PTRF-Cavin, a Conserved Cytoplasmic Protein Required
for Caveola Formation and Function. Cell 132, 113-124 (2008).
45. Kim, C.A. et al. Association of a homozygous nonsense caveolin-1
mutation with Berardinelli-Seip congenital lipodystrophy. J Clin
Endocrinol Metab 93, 1129-1134 (2008).
46. Razani, B. et al. Caveolin-1-deficient Mice Are Lean, Resistant to Diet-
induced Obesity, and Show Hypertriglyceridemia with Adipocyte
Abnormalities. Journal of Biological Chemistry 277, 8635-8647 (2002).
47. Shastry, S. et al. Congenital generalized lipodystrophy, type 4 (CGL4)
associated with myopathy due to novel PTRF mutations. American
Journal of Medical Genetics Part A 152A, 2245-2253 (2010).
48. Kim, H., Melén, K. & von Heijne, G. Topology Models for 37
Saccharomyces cerevisiaeMembrane Proteins Based on C-terminal
Reporter Fusions and Predictions. Journal of Biological Chemistry 278,
10208-10213 (2003).
49. Windpassinger, C. et al. Heterozygous missense mutations in BSCL2 are
associated with distal hereditary motor neuropathy and Silver syndrome.
Nat Genet 36, 271-276 (2004).
50. Lundin, C. et al. Membrane topology of the human seipin protein. FEBS
Lett 580, 2281-2284 (2006).
51. Cartwright, B.R. & Goodman, J.M. Seipin: from human disease to
molecular mechanism. Journal of Lipid Research 53, 1042-1055 (2012).
52. Ito, D., Fujisawa, T., Iida, H. & Suzuki, N. Characterization of
seipin/BSCL2, a protein associated with spastic paraplegia 17. Neurobiol
Dis 31, 266-277 (2008).
53. Chen, W. et al. The human lipodystrophy gene product Berardinelli-Seip
congenital lipodystrophy 2/seipin plays a key role in adipocyte
differentiation. Endocrinology 150, 4552-4561 (2009).
54. Payne, V.A. et al. The human lipodystrophy gene BSCL2/seipin may be
essential for normal adipocyte differentiation. Diabetes 57, 2055-2060
(2008).
55. Tian, Y. et al. Tissue-Autonomous Function of Drosophila Seipin in
Preventing Ectopic Lipid Droplet Formation. PLoS Genet 7, e1001364
(2011).

120
56. Luigetti, M. et al. SEIPIN S90L Mutation in an Italian family with
CMT2/dHMN and pyramidal signs. Muscle & Nerve 42, 448-451 (2010).
57. Ito, D. & Suzuki, N. Molecular pathogenesis of seipin/BSCL2-related
motor neuron diseases. Ann Neurol 61, 237-250 (2007).
58. Ito, D. & Suzuki, N. Seipinopathy: a novel endoplasmic reticulum stress-
associated disease. Brain 132, 8-15 (2009).
59. Ito, D., Yagi, T., Ikawa, M. & Suzuki, N. Characterization of inclusion
bodies with cytoprotective properties formed by seipinopathy-linked
mutant seipin. Human Molecular Genetics 21, 635-646 (2012).
60. Fei, W. et al. Fld1p, a functional homologue of human seipin, regulates
the size of lipid droplets in yeast. J Cell Biol 180, 473-482 (2008).
61. Boutet, E. et al. Seipin deficiency alters fatty acid Delta9 desaturation and
lipid droplet formation in Berardinelli-Seip congenital lipodystrophy.
Biochimie 91, 796-803 (2009).
62. Fei, W. et al. A Role for Phosphatidic Acid in the Formation of Supersized
Lipid Droplets. PLoS Genet 7, e1002201 (2011).
63. Wolinski, H., Kolb, D., Hermann, S., Koning, R.I. & Kohlwein, S.D. A
role for seipin in lipid droplet dynamics and inheritance in yeast. Journal
of Cell Science 124, 3894-3904 (2011).
64. Chen, W. et al. Berardinelli-Seip Congenital Lipodystrophy 2/Seipin Is a
Cell-Autonomous Regulator of Lipolysis Essential for Adipocyte
Differentiation. Molecular and Cellular Biology 32, 1099-1111 (2012).
65. Cui, X. et al. Seipin ablation in mice results in severe generalized
lipodystrophy. Human Molecular Genetics 20, 3022-3030 (2011).
66. Adeyo, O. et al. The yeast lipin orthologue Pah1p is important for
biogenesis of lipid droplets. J Cell Biol 192, 1043-1055 (2011).
67. Ghaemmaghami, S. et al. Global analysis of protein expression in yeast.
Nature 425, 737-741 (2003).
68. Binns, D., Lee, S., Hilton, C.L., Jiang, Q.X. & Goodman, J.M. Seipin is a
discrete homooligomer. Biochemistry 49, 10747-10755 (2010).
69. Babitzke, P., Bear, D.G. & Yanofsky, C. TRAP, the trp RNA-binding
attenuation protein of Bacillus subtilis, is a toroid-shaped molecule that
binds transcripts containing GAG or UAG repeats separated by two
nucleotides. Proceedings of the National Academy of Sciences 92, 7916-
7920 (1995).
70. Melville, M.W., McClellan, A.J., Meyer, A.S., Darveau, A. & Frydman, J.
The Hsp70 and TRiC/CCT Chaperone Systems Cooperate In Vivo To
Assemble the Von Hippel-Lindau Tumor Suppressor Complex. Molecular
and Cellular Biology 23, 3141-3151 (2003).
71. Henry, S.A., Patton-Vogt, J.L. & Kivie, M. Genetic Regulation of
Phospholipid Metabolism: Yeast as a Model Eukaryote, in Progress in

121
Nucleic Acid Research and Molecular Biology, Vol. Volume 61 133-179
(Academic Press, 1998).
72. Carman, G.M. & Henry, S.A. Phospholipid biosynthesis in the yeast
Saccharomyces cerevisiae and interrelationship with other metabolic
processes. Progress in Lipid Research 38, 361-399 (1999).
73. Fei, W. et al. Molecular characterization of seipin and its mutants:
implications for seipin in triacylglycerol synthesis. Journal of Lipid
Research 52, 2136-2147 (2011).
74. Cui, X. et al. Overexpression of a short human seipin/BSCL2 isoform in
mouse adipose tissue results in mild lipodystrophy. American Journal of
Physiology - Endocrinology And Metabolism 302, E705-E713 (2012).
75. Urs, S., Harrington, A., Liaw, L. & Small, D. Selective expression of an
aP2/Fatty Acid Binding Protein4-Cre transgene in non-adipogenic tissues
during embryonic development. Transgenic Research 15, 647-653 (2006).
76. Victoria, B. et al. Reduced adipogenic gene expression in fibroblasts from
a patient with type 2 congenital generalized lipodystrophy. Diabetic
Medicine 27, 1178-1187 (2010).
77. Kuerschner, L., Moessinger, C. & Thiele, C. Imaging of lipid
biosynthesis: how a neutral lipid enters lipid droplets. Traffic 9, 338-352
(2008).
78. Sorger, D. & Daum, G.n. Synthesis of Triacylglycerols by the Acyl-
Coenzyme A:Diacyl-Glycerol Acyltransferase Dga1p in Lipid Particles of
the Yeast Saccharomyces cerevisiae. Journal of Bacteriology 184, 519-
524 (2002).
79. Zehmer, J.K. et al. Targeting sequences of UBXD8 and AAM-B reveal
that the ER has a direct role in the emergence and regression of lipid
droplets. Journal of Cell Science 122, 3694-3702 (2009).
80. Welte, M.A. Fat on the move: intracellular motion of lipid droplets.
Biochemistry Society Transactions 37, 991-996 (2009).
81. Tauchi-Sato, K., Ozeki, S., Houjou, T., Taguchi, R. & Fujimoto, T. The
Surface of Lipid Droplets Is a Phospholipid Monolayer with a Unique
Fatty Acid Composition. Journal of Biological Chemistry 277, 44507-
44512 (2002).
82. Zehmer, J.K. et al. A role for lipid droplets in inter-membrane lipid traffic.
PROTEOMICS 9, 914-921 (2009).
83. Kalantari, F., Bergeron, J.J.M. & Nilsson, T. Biogenesis of lipid droplets:
how cells get fatter. Molecular Membrane Biology 27, 462-468 (2010).
84. Gorrissen, H. et al. Deuterium magnetic resonance of selectively
deuterated cholesteryl-esters in dipalmitoyl phosphatidylcholine
dispersions. Biochim Biophys Acta 644, 266-272 (1981).

122
85. Gorrissen, H., Tulloch, A.P. & Cushley, R.J. Deuterium magnetic
resonance of triacylglycerols in phospholipid bilayers. Chem Phys Lipids
31, 245-255 (1982).
86. Khandelia, H., Duelund, L., Pakkanen, K.I. & Ipsen, J.H. Triglyceride
Blisters in Lipid Bilayers: Implications for Lipid Droplet Biogenesis and
the Mobile Lipid Signal in Cancer Cell Membranes. PLoS ONE 5, e12811
(2010).
87. Lemberg, M.K., Bland, F.A., Weihofen, A., Braud, V.M. & Martoglio, B.
Intramembrane Proteolysis of Signal Peptides: An Essential Step in the
Generation of HLA-E Epitopes. The Journal of Immunology 167, 6441-
6446 (2001).
88. Goodman, J.M. The Gregarious Lipid Droplet. Journal of Biological
Chemistry 283, 28005-28009 (2008).
89. Jacquier, N. et al. Lipid droplets are functionally connected to the
endoplasmic reticulum in Saccharomyces cerevisiae. Journal of Cell
Science 124, 2424-2437 (2011).
90. Walther, T.C. & Farese Jr, R.V. The life of lipid droplets. Biochimica et
Biophysica Acta (BBA) - Molecular and Cell Biology of Lipids 1791, 459-
466 (2009).
91. Robenek, H. et al. Topography of Lipid Droplet-Associated Proteins:
Insights from Freeze-Fracture Replica Immunogold Labeling. Journal of
Lipids 2011 (2010).
92. Robenek, H. et al. Adipophilin-enriched domains in the ER membrane are
sites of lipid droplet biogenesis. J Cell Sci 119, 4215-4224 (2006).
93. Ozeki, S. et al. Rab18 localizes to lipid droplets and induces their close
apposition to the endoplasmic reticulum-derived membrane. Journal of
Cell Science 118, 2601-2611 (2005).
94. Beller, M. et al. COPI Complex Is a Regulator of Lipid Homeostasis. Plos
Biology 6, 2530-2549 (2008).
95. Soni, K.G. et al. Coatomer-dependent protein delivery to lipid droplets.
Journal of Cell Science 122, 1834-1841 (2009).
96. Nakamura, N., Banno, Y. & Tamiya-Koizumi, K. Arf1-dependent PLD1 is
localized to oleic acid-induced lipid droplets in NIH3T3 cells.
Biochemical and Biophysical Research Communications 335, 117-123
(2005).
97. Guo, Y. et al. Functional genomic screen reveals genes involved in lipid-
droplet formation and utilization. Nature 453, 657-661 (2008).
98. Dvorak, A.M., Morgan, E.S. & Weller, P.F. RNA is closely associated
with human mast cell lipid bodies. Histol Histopathol 18, 943-968 (2003).
99. Wolinski, H., Bredies, K., Kohlwein, S.D., Gilbert Di, P. & Markus, R.W.
Chapter 16 - Quantitative Imaging of Lipid Metabolism in Yeast: From

123
4D Analysis to High Content Screens of Mutant Libraries, in Methods in
Cell Biology, Vol. Volume 108 345-365 (Academic Press, 2012).
100. Hundová, Z. & Fencl, Z. Toxic effects of fatty acids on yeast cells:
Dependence of inhibitory effects on fatty acid concentration.
Biotechnology and Bioengineering 19, 1623-1641 (1977).
101. Wright, R. Transmission electron microscopy of yeast. Microscopy
Research and Technique 51, 496-510 (2000).
102. Binns, D. et al. An intimate collaboration between peroxisomes and lipid
bodies. The Journal of Cell Biology 173, 719-731 (2006).
103. Bligh, E.G. & Dyer, W.J. A rapid method of total lipid extraction and
purification. Can J Biochem Physiol 37, 911-917 (1959).
104. Leber, R., Zinser, E., Paltauf, F., Daum, G. & Zellnig, G. Characterization
of lipid particles of the yeast, Saccharomyces cerevisiae. Yeast 10, 1421-
1428 (1994).
105. Athenstaedt, K., Zweytick, D., Jandrositz, A., Kohlwein, S.D. & Daum,
G.n. Identification and Characterization of Major Lipid Particle Proteins
of the Yeast Saccharomyces cerevisiae. Journal of Bacteriology 181,
6441-6448 (1999).
106. Lowry, O.H., Rosebrough, N.J., Farr, A.L. & Randall, R.J. PROTEIN
MEASUREMENT WITH THE FOLIN PHENOL REAGENT. Journal of
Biological Chemistry 193, 265-275 (1951).
107. Laemmli, U.K. Cleavage of Structural Proteins during the Assembly of the
Head of Bacteriophage T4. Nature 227, 680-685 (1970).
108. Wray, W., Boulikas, T., Wray, V.P. & Hancock, R. Silver staining of
proteins in polyacrylamide gels. Analytical Biochemistry 118, 197-203
(1981).
109. Shimoni, Y., Schekman, R. & Christine Guthrie, G.R.F. Vesicle budding
from endoplasmic reticulum, in Methods in Enzymology, Vol. Volume 351
258-278 (Academic Press, 2002).
110. Tanford, C., Nozaki, Y. & Rohde, M.F. Size and shape of globular
micelles formed in aqueous solution by n-alkyl polyoxyethylene ethers.
The Journal of Physical Chemistry 81, 1555-1560 (1977).
111. Friesen, R.H.E., Knol, J. & Poolman, B. Quaternary structure of the
lactose transport protein of Streptococcus thermophilus in the detergent-
solubilized and membrane-reconstituted state. Journal of Biological
Chemistry 275, 40658 (2000).
112. Aragon, C., Lopez-Corcuera, B. & Susan, G.A. [1] Purification,
hydrodynamic properties, and glycosylation analysis of glycine
transporters, in Methods in Enzymology, Vol. Volume 296 3-17
(Academic Press, 1998).

124
113. Tanford, C. & Reynolds, J.A. Characterization of membrane proteins in
detergent solutions. Biochimica et Biophysica Acta (BBA) - Reviews on
Biomembranes 457, 133-170 (1976).
114. Sandager, L. et al. Storage Lipid Synthesis Is Non-essential in Yeast.
Journal of Biological Chemistry 277, 6478-6482 (2002).
115. Klis, F.M., Boorsma, A. & De Groot, P.W.J. Cell wall construction in
Saccharomyces cerevisiae. Yeast 23, 185-202 (2006).
116. Schneiter, R., Daum, G. & Xiao, W. Analysis of Yeast Lipids
Yeast Protocol, in, Vol. 313. (ed. J.M. Walker) 75-84 (Humana Press,
2006).
117. Folch, J., Lees, M. & Stanley, G.H.S. A SIMPLE METHOD FOR THE
ISOLATION AND PURIFICATION OF TOTAL LIPIDES FROM
ANIMAL TISSUES. Journal of Biological Chemistry 226, 497-509
(1957).
118. Paar, M. et al. Remodeling Of lipid droplets during lipolysis and growth in
adipocytes. Journal of Biological Chemistry.
119. Brown, J.M. et al. CGI-58 facilitates the mobilization of cytoplasmic
triglyceride for lipoprotein secretion in hepatoma cells. Journal of Lipid
Research 48, 2295-2305 (2007).
120. Du, W. & Ayscough, K.R. Methyl Beta-cyclodextrin reduces
accumulation of reactive oxygen species and cell death in yeast. Free
Radical Biology and Medicine 46, 1478-1487 (2009).