Approval of Air Quality Implementation Plans; Navajo Nation ...
143
Technical Support Document for NGS Proposed BART Determination, rev. February 11, 2013 Cover Memo Approval of Air Quality Implementation Plans; Navajo Nation; Regional Haze Requirements for Navajo Generating Station CORRECTED Technical Support Document for Proposed Rule Docket Number: EPA-R09-OAR-2013-0009 This is a corrected version of the Technical Support Document for the Proposed BART Determination for Navajo Generating Station. The original TSD was dated January 17, 2013 and posted to www.regulations.gov on January 18, 2013 (Item number 0003). The following corrections were made: x On pages 6 and 137, the following correction was made (as shown in red-line/strike through): “This analysis further estimates that the NGS cost of electricity generation as a result of SCR will increase by 16%, or 0.0 6 cents per kilowatt-hour (kWh).” x On page 31, Table 4 was updated: Table 1: Analysis of Available NO x Control Options for NGS Presented by AECOM NO x Control Option Description Technically Feasible? Low NO x Burners (LNB) and Separated Overfire Air Systems (SOFA) Burner modification to stage combustion by controlling air and fuel flow to create fuel-rich/O 2 -poor conditions in the burner and high temperature zones, and staged combustion such that excess air in the burner zone is reduced and additional air is added above the burner zone to complete combustion. Yes Flue Gas Recirculation Recirculation of flue gas into the combustion zone to reduce peak flame temperatures to reduce thermal NO x production. Has been demonstrated on large units but less effective than other combustion controls. Selective Noncatalytic Reduction (SNCR) Ammonia or urea injection without use of a catalyst to reduce NO x to N 2 . Yes Selective Catalytic Reduction (SCR) Ammonia injection in the presence of a catalyst to reduce NO x to N 2 . Yes ` ECOTUBE Hybrid of Separated OFA (SOFA) and ammonia or urea injection, where ammonia or urea injected through retractable lances into the gas flow to improve mixing and combustion characteristics. No, no existing installations exist on similar type or sized facilities. Rotating Opposed Firing Air (ROFA) and ROTAMIX ROFA modifies OFA by adding rotation to improve mixing with the flue gas. The ROTAMIX system adds urea to the flue gas by injection with boosted air. In the appropriate temperature range, urea reduces NO x to N 2 . No, because ROTAMIX has not been demonstrated on large units. x Throughout the document, formatting issues associated with table citations within the text were fixed. x Throughout the document, the PDF version of the TSD does not show apostrophes, dashes, and possibly other punctuation. This has been fixed in the corrected version of the PDF.
-
Upload
hoangxuyen -
Category
Documents
-
view
225 -
download
5
Transcript of Approval of Air Quality Implementation Plans; Navajo Nation ...
Technical Support Document for NGS Proposed BART Determination, rev. February 11, 2013 Cover Memo
Approval of Air Quality Implementation Plans; Navajo Nation; Regional Haze Requirements for Navajo Generating Station
CORRECTED
Technical Support Document for Proposed Rule Docket Number: EPA-R09-OAR-2013-0009
This is a corrected version of the Technical Support Document for the Proposed BART Determination for Navajo Generating Station. The original TSD was dated January 17, 2013 and posted to www.regulations.gov on January 18, 2013 (Item number 0003).
The following corrections were made:
On pages 6 and 137, the following correction was made (as shown in red-line/strike through): “This analysis further estimates that the NGS cost of electricity generation as a result of SCR will increase by 16%, or 0.06 cents per kilowatt-hour (kWh).”
On page 31, Table 4 was updated: Table 1: Analysis of Available NOx Control Options for NGS Presented by AECOM
NOx Control Option Description Technically Feasible?
Low NOx Burners (LNB) and Separated Overfire
Air Systems (SOFA)
Burner modification to stage combustion by controlling air and fuel flow to create fuel-rich/O2-poor conditions in the burner and high temperature zones, and staged combustion
such that excess air in the burner zone is reduced and additional air is added above the burner zone to complete
combustion.
Yes
Flue Gas Recirculation Recirculation of flue gas into the combustion zone to reduce peak flame temperatures to reduce thermal NOx
production.
Has been demonstrated on large units but less effective than other
combustion controls.
Selective Noncatalytic Reduction (SNCR)
Ammonia or urea injection without use of a catalyst to reduce NOx to N2.
Yes
Selective Catalytic Reduction (SCR)
Ammonia injection in the presence of a catalyst to reduce NOx to N2.
Yes
`ECOTUBE Hybrid of Separated OFA (SOFA) and ammonia or urea injection, where ammonia or urea injected through
retractable lances into the gas flow to improve mixing and combustion characteristics.
No, no existing installations exist on similar type or sized facilities.
Rotating Opposed Firing Air (ROFA) and
ROTAMIX
ROFA modifies OFA by adding rotation to improve mixing with the flue gas. The ROTAMIX system adds urea to the flue gas by injection with boosted air. In the appropriate temperature range, urea reduces NOx to N2.
No, because ROTAMIX has not been demonstrated on large units.
Throughout the document, formatting issues associated with table citations within the text were
fixed. Throughout the document, the PDF version of the TSD does not show apostrophes, dashes, and
possibly other punctuation. This has been fixed in the corrected version of the PDF.

Technical Support Document for NGS Proposed BART Determination, rev. February 11, 2013 | Page 1 of 129
Approval of Air Quality Implementation Plans; Navajo Nation; Regional Haze Requirements for Navajo Generating Station
Technical Support Document for Proposed Rule
Docket Number: EPA-R09-OAR-2013-0009
Executive Summary
This document provides the analytical framework and technical justification to support the proposed determination of the Best Available Retrofit Technology (BART) for the Navajo Generating Station (NGS) pursuant to the Regional Haze Rule (RHR). This BART determination is limited to emissions of oxides of nitrogen (NOx) from NGS. 1. Background
Pursuant to the Tribal Authority Rule, EPA Region IX (EPA) finds that the BART requirement
for NOx of the RHR is necessary or appropriate to apply at this time to NGS.1 In making our BART Determination for these facilities, we examined the following factors as prescribed by the Clean Air Act:2
Factor 1 examines the cost of compliance for the technically feasible control technologies; Factor 2 addresses the energy and non-air quality impacts of the control technologies; Factor 3 considers any existing air pollution control technologies at the source; Factor 4 considers the remaining useful life of the source; and Factor 5 assesses the degree of visibility improvement expected to result from the various
control technologies.
These factors are frequently referred to as the �“Five Factor Analysis�” for a BART determination under the RHR. On behalf of Salt River Project (SRP), co-owner and operator of NGS, ENSR Corporation, now AECOM, submitted a BART engineering and visibility analysis (dated November 2007)3 to EPA Region IX. Per requests for additional information and modeling from EPA, SRP submitted a source-specific modeling protocol on June 10, 20084 and a revised BART Analysis for NGS dated January 2009.5 Additional submissions from SRP include: letter dated July 29, 2008,6 letter dated June 3, 2009 with additional information on CALPUFF modeling,7 and a Conceptual Ammonia Monitoring Plan dated June 18, 2009.8 1 40 CFR 49.11(a). 2 42 U.S.C. § 7491(g)(2). 3 BART Analysis for the Navajo Generating Station Units 1 �– 3, Prepared for Salt River Project �– Navajo Generating Station by ENSR|AECOM, Document Number 05830-012-300, November 2007. 4 Source Specific BART Modeling Protocol: Navajo Generating Station by ENSR|AECOM, Document Number 05830-012-300, September 2007. 5 Revised BART Analysis for the Navajo Generating Station Units 1 �– 3, Prepared for Salt River Project �– Navajo Generating Station by ENSR|AECOM, Document Number 05830-012-300, January 2009. 6 Best Available Retrofit Technology (BART) Analysis �– Cost Information Navajo Generating Station, from Kevin Wanttaja to Deborah Jordan, June 29, 2008, and Attachment: Salt River Project Navajo Generating Station, SCR and SNCR Cost Study, Final Report, Prepared by Sargent and Lundy, Project Number 11234-028, rev. 3, July 25, 2008. 7Letter from Kevin Wanttaja to Anita Lee re: May 7, 2009 Meeting on Navajo Generating Station Best Available Retrofit Technology Analysis, dated June 3, 2009 and Attachment: Review of Background Ammonia Concentrations Used in

Technical Support Document for NGS Proposed BART Determination, rev. February 11, 2013 | Page 2 of 129
Based on these analyses, SRP recommended that the installation of new combustion controls on
Units 1 �– 3 represented BART. AECOM did not conduct a BART engineering and visibility analysis for particulate matter (PM) because SRP concluded that the current PM controls at the facility already met BART. A source-specific Federal Implementation Plan for NGS finalized on March 5, 2010 (75 FR 10174) set a PM limit of 0.06 lb/MMBtu on a plant-wide basis. In its January 2009 submittal, SRP recommended a short-term PM BART limit of 0.05 lb/MMBtu. EPA is not proposing to determine that it is necessary or appropriate to determine BART for PM at NGS. On August 28, 2009, EPA published an Advanced Notice of Proposed Rulemaking (ANPRM) in the Federal Register (74 FR 44313) and requested comment on the anticipated visibility improvements at surrounding Class I areas and the cost effectiveness of controls for BART at NGS and the Four Corners Power Plant (FCPP). EPA presented results of visibility modeling and cost analyses submitted by SRP as well as results of visibility modeling conducted by EPA and cost analyses submitted by the National Park Service (NPS). The publication of the ANPRM provided an opportunity to begin consultations with affected tribes and continued an on-going consultation with the Federal Land Managers (FLMs) as required under the RHR (40 CFR §51.308(h)(4)(i)(2)). We will continue to consult with the tribes and the FLMs during the comment period for this proposal.
EPA received requests for consultation and comments on the ANPRM from numerous tribes, including the Ak-Chin Indian Community, Inter Tribal Council of Arizona, Gila River Indian Community, Hopi Tribe, Navajo Nation, Tohono O�’odham Nation, and the Salt River Pima Maricopa Indian Community. Additionally, EPA received comments from Federal and State agencies, numerous industry, utility, and water groups, environmental and community-based organizations, cities and municipalities, U.S. and State Representatives, and the Governor and Treasurer of Arizona. All comments received on the ANPRM are available in the ANPRM docket.9 We have reviewed and considered all comments relevant to NGS and revised our analyses to address comments as we determined appropriate. We have addressed specific comments resulting from our consultations with affected states, tribes, and the FLMs and included a discussion of those comments in this Technical Support Document (TSD), but will not issue a response to comments on the ANPRM.
Subsequent to our publication of the ANPRM, EPA received information from numerous
stakeholders, including SRP, Department of Interior (including the Bureau of Reclamation and the National Park Service), and the Gila River Indian Community. SRP provided numerous submittals of additional information to EPA and affirmed its recommendation that the installation of new combustion controls on Units 1 �– 3 represented BART: letter dated August 18, 2010 with an updated SCR cost study and a cost estimate for baghouses,10 a final report and power point presentation on the ambient air measurements of ammonia,11 letters dated October 15, 2010, and February 22, 2011 with additional Visibility Improvement Modeling for the Navajo Generating Station Regional Haze BART Analysis by Robert Paine, AECOM Environment and Ivar Tombach, Consultant. 8 Conceptual Plan for Ammonia Monitoring in the Vicinity of the Navajo Generating Station, by Robert Paine, AECOM Environment and Ivar Tombach, Consultant, June 18, 2009. 9 See Docket #: EPA-R09-OAR-2009-0598 on www.regulations.gov. 10 SRP Cost Study �– Installation of Selective Catalytic Reduction (SCR) and Baghouses at Navajo Generating Station, from Kevin Wanttaja to Anita Lee, August 18, 2010. Attachment: Salt River Project �– Navajo Generating Station Units 1, 2, 3 SCR and Baghouse Capital Cost Estimate Report, Prepared by Sargent and Lundy, Project Number 12656-001, August 17, 2010. 11 Measurements of Ambient Background Ammonia on the Colorado Plateau and Visibility Modeling Implications, Prepared by Salt River Project, Contributors: Ivar Tombach and Robert Paine, September 2010. Power Point presentation from SRP dated September 28, 2010.

Technical Support Document for NGS Proposed BART Determination, rev. February 11, 2013 | Page 3 of 129
modeling information,12,13 an updated BART analysis on January 20, 2012,14 additional modeling information by letter dated February 27, 2012,15 and by electronic mail on February 28, 2012,16 additional information on SNCR cost information on March 16 and 23, 2012,17 and an analysis of the broader economic impacts of BART controls on the state of Arizona on April 11, 2012.18 On July 20, 2012, SRP submitted additional information on SNCR to confirm that it expected SNCR to achieve NOx emission rates on the upper end of the range it presented in earlier submissions.19
SRP also provided information to EPA outlining several uncertainties that significantly increase
the financial risk of near-term investments in new air pollution controls, including uncertainties in plant ownership and lease agreements. One of the owners of NGS, the Los Angeles Department of Water and Power (LADWP), a public utility located in California, is prohibited from continued participation and long-term investments in NGS beyond its current contract term of 2019, under California law.20 As a result, LADWP has indicated its intention to sell its 21.2 percent ownership stake in NGS. The future owner of LADWP�’s share of NGS is currently uncertain.21
In addition, NGS�’s current site lease with the Navajo Nation, as well as several other agreements
and contracts, expire in 2019. Although the owners of NGS are in negotiations with the Navajo Nation for a lease renewal to extend to 2044 and with Peabody Energy for a renewed coal supply contract, the outcomes of these negotiations are also not yet finalized. Because NGS is located in Indian country, lease and other rights-of-way agreement renewals must be approved by the Department of the Interior. These approvals, which are an unusual requirement for continued operation of a power plant, are federal actions that trigger review under the National Environmental Protection Act (NEPA). For actions significantly affecting the environment, NEPA review requires the development of an Environmental Impact Statement (EIS) and includes a substantial process for public involvement. The Department of the Interior estimated that NEPA review for approval of leases and other rights-of-way agreements may require approximately 5 years to complete.22 Therefore, even if the Navajo Nation and the owners of NGS reach agreement on renewed leases and other rights-of-way shortly, the owners of NGS may not have a lease fully approved by the Department of the Interior until 2017 or later.
To begin discussions of the numerous complexities and stakeholder interests in NGS, following
the ANPRM, in 2011, SRP initiated a series of stakeholder meetings facilitated by EN3 Professionals, LLC with the goal of developing an agreement among key stakeholders on an alternative BART 12 Additional Information Requested During Meeting on September 28, 2010 Best Available Retrofit Technology Determination �– Navajo Generating Station, from Kevin Wanttaja to Anita Lee, October 15, 2010. 13 Visibility Modeling using Upgraded CALPUFF Model �– Salt River Project Navajo Generating Station from Richard Hayslip to Anita Lee, February 22, 2011. 14 Updated Best Available Retrofit Technology Analysis, Navajo Generating Station, from Kelly J. Barr, Esq., to Deborah Jordan, January 20, 2012. 15 Letter from Angelina Cervantes, SRP to Scott Bohning, EPA, dated February 27, 2012. Transmittal of CD of modeling archive files for January 2012. The SRP modeling files are available upon request from EPA because these files cannot be posted to the electronic docket. 16 NGS Modeling Spreadsheet from Grant Smedley to Colleen McKaughan, February 28, 2012, and attachment to email: Navajo BART Emissions and Results from Jan 2012 Archive.xlsx. 17 SNCR Cost Breakdown and Urea Cost Estimate from Grant Smedley to Anita Lee, March 16, 2012 and March 23, 2012. 18 Harvey Economics Report, from Kelly J. Barr, Esq., to Deborah Jordan, April 11, 2012. 19 SNCR Letter from Kelly J. Barr to Deborah Jordan, July 20, 2012. 20 See information on Senate Bill 1368 available from: http://www.energy.ca.gov/emission_standards/ 21 See, for example, 2012 Draft Integrated Resource Plan Executive Summary at https://www.ladwp.com/ladwp/faces/wcnav_externalId/a-p-doc?_adf.ctrl-state=a8ti68apu_29&_afrLoop=234058941927000. 22 See email and attachment from Letty Belin, DOI to Janet McCabe, EPA, dated August 20, 2012, in the docket for this proposed rulemaking.

Technical Support Document for NGS Proposed BART Determination, rev. February 11, 2013 | Page 4 of 129
proposal to present to EPA for consideration.23 The stakeholders did not produce a consensus plan, but during the discussion process, the Department of Interior (DOI) determined that given its various responsibilities related to Navajo Generating Station (through the National Park Service and the Bureaus of Reclamation and Indian Affairs), it would be helpful to contract with the National Renewable Energy Lab (NREL), under the Department of Energy, to develop an NGS-specific evaluation of factors relevant to EPA�’s BART determination (phase I), and conduct a more thorough evaluation of renewable energy options (phase II).24 DOI requested that EPA refrain from proposing a BART determination for NGS until after December 2011 to allow NREL time to complete and submit to EPA phase I of its study. EPA confirmed that we would not propose a BART determination prior to December 2011 because of our on-going technical analyses, consultations with Tribes and meetings with other stakeholders.25 On January 18, 2012, DOI released the phase I NREL report for public comment and on March 29, 2012, provided a compendium of all public comments submitted on the NREL report to EPA.26 On February 13, 2012, Bureau of Reclamation and EPA held a joint conference call to discuss EPA�’s questions related to the Lower Colorado River Development Fund,27 and on April 6, 2012, the National Park Service submitted additional observations on the updated 2012 BART analysis submitted by SRP to EPA and the visibility modeling section of the 2012 NREL report.28
During 2009 �– 2012, representatives from EPA Region IX and the EPA Office of Air and
Radiation held consultation meetings with several tribes in Arizona at various levels of government, including with tribal leaders, tribal councils, and staff and management from tribal environmental departments.29 The Gila River Indian Community (Gila River) contracted with Harvey Economics to conduct an analysis to estimate the potential impacts to Gila River of potential control scenarios for NGS. Gila River provided copies of these reports, dated November 16, 2011 and March 15, 2012, to EPA for consideration in our BART analysis.30 On August 7, 2012, EPA met with Governor Gregory Mendoza and other representatives of the Gila River Indian Community in Sacaton, AZ, and with President Ben Shelly and representatives of the Navajo Nation in San Diego, CA. On August 27, 2012, EPA held a joint consultation session in Phoenix, AZ with interested tribes on NGS and provided the opportunity for tribes to meet individually with EPA.31 Chairman Shingoitewa and representatives from the Hopi Tribe, Vice-Chairman William Antone and representatives of the the Ak-Chin Indian Community, Lt. Governor Stephen Roe Lewis and representatives of the Gila River Indian Community the Tohono O�’odham Nation, the Navajo Nation, the Fort McDowell Yavapai Nation, the Tonto Apache Tribe , the Yavapai-Prescott Tribe, and the Hualapai Tribe attended the consultation meeting. Representatives from the Bureau of Reclamation and the Bureau of Indian Affairs also attended.
23 http://en3pro.com/projects/ngs-project/ 24 Letter from David J. Hayes, Deputy Secretary of the Interior, to Jared Blumenfeld, Regional Administrator, EPA Region IX, July 12, 2011. 25 Letter from Jared Blumenfeld to David J. Hayes, July 18, 2011. 26 Navajo Generating Station and Air Visibility Regulations: Alternatives and Impacts, David J. Hurlbut, Scott Haase, Gregory Brinkman, Kip Funk, Rachel Gelman, Eric Lantz, Christina Larney, David Peterson, Christopher Worley (NREL) and Ed Liebsch (HDR Engineering, Inc.), January 2012, NREL/TP-6A20-53024, produced under direction of the U.S. Department of the Interior under Interagency Agreement R11PG30024. Report and Compendium are available at http://www.doi.gov/navajo-gss/index.cfm 27 See document titled �“Information from Reclamation to EPA�” in the docket for this proposed rulemaking. 28 Letter from Herbert C. Frost, Ph.D., Associate Director, National Resources Stewardship and Science of the National Park Service, to Jared Blumenfeld, April 6, 2012. 29 See document titled �“Timeline of all tribal consultations on BART.docx�” in the docket for this proposed rulemaking. 30 See letter from Edward F. Harvey to Linus Everling, General Counsel, Gila River Indian Community re: Proposed EPA BART Changes to NGS dated November 16, 2011, plus attachment and letter from Edward F. Harvey to Linus Everling, re: Updated Impacts of EPA BART Changes at NGS on the GRIC- Revised Cost of Capital Assumption, dated March 15, 2012. 31 See Agenda and handout from August 27, 2012 Tribal Consultation in the docket for this proposed rulemaking.

Technical Support Document for NGS Proposed BART Determination, rev. February 11, 2013 | Page 5 of 129
2. EPA’s Five-Factor BART Analysis
Appendix Y to Part 51 �– Guidelines for BART Determinations Under the Regional Haze Rule
(BART Guidelines) outlines the process for conducting a five-factor BART analysis (70 FR 39104, July 6, 2005). The BART Guidelines established numerical presumptive limits for NOx for coal-fired EGUs greater than 200 MW located at greater than 750 MW power plants and operating without post-combustion controls (i.e., selective catalytic reduction �– SCR, or selective non-catalytic reduction �– SNCR), differentiated by boiler design and type of coal burned. For the three units tangential-fired boilers burning bituminous coal at NGS, the presumptive limit for NOx is 0.28 lb/MMBtu. Although the BART Guidelines set presumptive limits, the presumptive limits do not obviate the need to identify the best system of continuous emission control technology on a case-by-case basis considering the five factors. EPA considered all of the information submitted by interested stakeholders in our statutory five-factor BART analysis for NGS. The results of our five-factor BART analysis are summarized in Table ES-1.
Table ES-1: Summary of EPA�’s Five Factor BART Analysis for NGS LNB/SOFA SNCR+LNB/SOFA SCR+LNB/SOFA
Emission Limit (lb/MMBtu) 0.24 0.18 0.055
Factor1
Total Capital Cost $45 million �– already spent $84 million $541 million
Annualized Capital Cost $5.2 million $29 million $64 million
Annual O&M Cost $0 $19 million $11.9 million
Total Annual Cost ($/year) $5.2 million $23.5 million $58.8 million
Emissions Reductions (tpy) 10,865 16,608 28,573
Average Cost Effectiveness $486 / ton $1,745 / ton $2,240 / ton
Incremental Cost Effectiveness($/ton) n/a $4,110 / ton (vs. LNB) $3,315 /ton (vs. LNB)
$2,933 (vs. SNCR)
Factor2
Will SCR force NGS to close?(compliance by 2018)
No: Increase in Net Present Value from SCR = $648 million vs. NPV from Low Market = $673million
Electricity Rate in 2018 for SRPCustomers (compliance by 2018)
9.26 ¢/kWh(Baseline) 9.28 ¢/kWh (0.2%) 9.32 ¢/kWh (0.6%)
CAP Water Rates (Energy only)in 2018 (compliance by 2018)
$58 per acre foot (AF)(Baseline)
$61/AF(5% increase for Tribes)
$66/AF(14% increase for Tribes)
3 Existing Controls at NGS LNB/SOFA was installed on all 3 units at NGS over 2009 �– 2011;Hot side ESPs for PM and Wet FGD for SO2
4 Remaining Useful Life of NGS EPA used a default amortization period of 20 years. Owners of NGS are seeking to extend leaseof NGS to 2044 (over 30 years).
5
Largest Single Class I AreaVisibility Improvement 2.1 dv (35% change in dv) 3.1 dv (40% change in dv) 5.4 dv (71% change in dv)
Cumulative VisibilityImprovement (11 Class I areas) 16 dv (33% change in dv) 22 dv (45% change in dv) 35 dv (73% change in dv)
AECOM identified six NOx control technologies and determined that three of those technologies, SCR, SNCR, and low-NOx burners with separated overfire air (LNB/SOFA), are technically feasible for the units at NGS. Of the three technically feasible options, SCR in combination

Technical Support Document for NGS Proposed BART Determination, rev. February 11, 2013 | Page 6 of 129
with LNB/SOFA results in the largest reduction in NOx emissions. EPA is proposing to determine that an SCR system, in combination with LNB/SOFA, can be designed to meet a NOx emission limit of 0.055 �– 0.080 pounds of NOx per million British Thermal Units of heat input (lb/MMBtu) at NGS, depending on the number of catalyst layers in the system, i.e., more layers of catalyst result in greater levels of NOx control. EPA is requesting comment on the impact of these two different control levels (0.055 and 0.08 lb/MMBtu) on the ability of NGS to retain its current 6-year cycle for major outages. The first factor evaluates the cost of controls. EPA finds that even using the cost analysis submitted by Sargent and Lundy (S&L) for SRP, the costs per ton of NOx removed from SCR (average of $2,926 per ton, not including the LNB/SOFA already installed) are within a range that has been determined reasonable for BART. EPA used S&L�’s cost estimates and made several revisions to assumptions based on guidelines in the EPA Control Cost Manual to generate cost projections that are more consistent with the BART guidelines. EPA estimated an average cost effectiveness of less than $2,300 per ton to install SCR+LNB/SOFA on all three units at NGS. EPA estimates that the incremental cost effectiveness of SCR+LNB/SOFA compared to LNB/SOFA (the technology SRP recommended as BART) is about $3,300 per ton, and the incremental cost effectiveness of SCR+LNB/SOFA to SNCR+LNB/SOFA is about $2,900 per ton. Based on the cost data presented by SRP, EPA�’s revisions to SRP�’s cost estimates, and our analysis of average and incremental cost effectiveness, EPA is proposing to determine that SCR in combination with LNB/SOFA at NGS to achieve 0.055 lb/MMBtu is cost effective. The second factor involves consideration of the energy and non-air quality impacts of controls. Because NGS is not located on a commercial rail line, the installation of SCR or SNCR would result in increased truck traffic deliveries of anhydrous ammonia or urea to NGS. EPA conducted analyses of the potential air quality impacts associated with emissions from increased truck traffic, and also considered potential risks associated with transportation and use of anhydrous ammonia, and determined that SCR and SNCR are not likely to result in a significant health risk to the local population. Because of the importance of NGS to the economy of the Navajo Nation and the Hopi Tribe, EPA also considered the concern expressed to EPA that requiring SCR as BART will cause NGS to shut down and result in a loss of jobs at NGS and the Kayenta Mine. The Navajo Nation receives taxes and lease payments directly from NGS, and both the Navajo Nation and Hopi Tribe receive royalties and taxes from Peabody Energy associated with coal mined from the Kayenta Mine and used at NGS. EPA conducted an affordability analysis to determine whether it would be more economical for the owners of NGS to install new NOx controls and continue operating, or to close and purchase an equivalent amount of power on the wholesale power market. Based on this 25-year Net Present Value analysis, the increase in electricity generation costs associated with SCR is expected to be lower than the cost to purchase electricity on the wholesale market, suggesting that the cost increase from SCR should not cause NGS to shut down. This analysis further estimates that the NGS cost of electricity generation as a result of SCR will increase by 16%, or 0.06 cents per kilowatt-hour (kWh). This generation cost increase translates into an increase of less than 1% to electricity customers of SRP.
In addition to impacts on electricity customers, numerous parties submitted comments to EPA that raised concerns about the potential impact to water customers of the Central Arizona Water Conservation District (CAWCD) that operates, maintains, and is responsible for repayment to the Federal Government for the Central Arizona Project (CAP). Reclamation�’s 24% ownership share of power produced by NGS is used by CAP to pump surface water from the Colorado River to municipal, industrial, agricultural, and tribal water users in central Arizona. Excess power owned by Reclamation that is not used by CAP is sold and profits are deposited into the Lower Colorado River Basin Development Fund (Development Fund). This fund was originally authorized under the Colorado River

Technical Support Document for NGS Proposed BART Determination, rev. February 11, 2013 | Page 7 of 129
Basin Act of 1968 for the purpose of repaying the federal government for the cost to build CAP, and subsequent settlement acts with several Indian Tribes located in Arizona authorized use of the fund to pay the delivery portion of the cost of CAP water (fixed operations, maintenance, and replacement, or OM&R, costs) for certain Indian Tribes, and to pay the costs to construct the delivery systems to bring CAP water to those Tribes. Reclamation, CAWCD, and several Tribes submitted detailed comments on the ANPRM outlining the potential effects that requiring SCR as BART for NGS might have on the cost of water and on Indian water settlement agreements. Costs associated with Reclamation�’s share of capital improvements at NGS are passed onto CAP customers in the variable OM&R costs, i.e., �“pumping energy rate�”. Tribal and non-Indian agricultural (NIA) users of CAP water pay only variable OM&R. Municipal and Industrial (M&I) CAP customers pay both the variable OM&R costs and fixed OM&R (delivery charges). EPA estimates that the increased electricity generation cost at NGS from the installation of SCR on all 3 units may result in an energy rate (variable OM&R) increase of $8.40 per acre-foot (AF). Based on projected water rates, an increase of $8.40 per AF represents an estimated 6% increase in the CAP water rate paid by M&I users, and a 14.5% increase in the CAP water rate paid by NIA and Indian water users. EPA understands that at least sixteen tribes in Arizona either have water settlement agreements that allocate CAP water to the tribes in exchange for releasing rights and claims to other surface and groundwater resources in Arizona (see nine tribes listed in first column of Table ES-2), or are in the process of negotiating CAP water settlement agreements (see eight tribes listed in second column of Table ES-2). Additionally, Table ES-2 lists five tribes located in Arizona where EPA lacks information on the tribe�’s relationship to CAP water. EPA understands that all tribes generally each have different CAP allocations and unique water settlement agreements; therefore, potential impacts may be different for each tribe and should be considered individually. EPA�’s preliminary assessments are based on limited available information, and EPA requests comments or additional information from the tribes listed in Table ES-2, and other tribes that may be affected by EPA�’s proposed rulemaking for NGS. Table ES-2: List of Tribes Located in Arizona and Relationships to CAP Water32
Tribes with CAP Allocations Tribes in Process of Developing Water Settlement Agreements
Tribes Where Relationship to CAP is Not Known to EPA
Gila River Indian Community Navajo Nation Colorado River Indian Tribes
Ak-Chin Indian Community Yavapai-Apache Nation (Camp Verde) San Juan Southern Paiute Tribe of Arizona
Tohono O�’odham Nation Hopi Tribe Cocopah Indian Tribe San Carlos Apache Tribe Pascua Yaqui tribe Quechan Indian Tribe
White Mountain Apache Indian Tribe* Tonto Apache Tribe Chemehuevi Indian Tribe of the Chemehuevi Reservation
Fort McDowell Yavapai Nation* Havasupai Tribe of the Havasupai Reservation
Salt River-Pima Maricopa Indian Community*
Hualapai Indian Tribe of the Hualapai Reservation
Navajo Nation Kaibab Band of Paiute Indians of the Kaibab Reservation
Yavapai-Prescott Tribe* 32 Tribes marked with an asterisk (*) lease all or most of their CAP allocations to cities in Arizona. The Navajo Nation has an allocation of CAP water defined in the Arizona Water Settlement Act of 2004, but has not yet reached agreement on the terms of receiving the allocation.

Technical Support Document for NGS Proposed BART Determination, rev. February 11, 2013 | Page 8 of 129
For the second factor, EPA concludes that NGS is unique compared to other coal-fired power
plants in the nation because of its relationship to CAP and tribes located in Arizona. EPA�’s affordability analysis suggests that the cost to produce power at NGS with SCR installed on all units should be below the market prices of wholesale power and therefore SCR should not cause NGS to close. Additionally, increased electricity rates to customers of the utilities that own NGS should be relatively low.
EPA understands that a potential increase in water rates to tribes is a critical issue for them. We
note that, as described in the following section, past pollution control investments at this facility have made use of alternative financing methods that limited impacts on CAP water rates. Furthermore, the NREL report indicated that mechanisms may exist to help avoid or mitigate the estimated level of impact. EPA, in conjunction with DOI and DOE, have committed to work together on several short- and long-term goals, including innovative clean energy options for electricity generation and seeking funding to cover expenses for the federal portion of pollution control at NGS. However, it is not clear at this time whether or what type of mechanisms might be available to lessen increased costs. Therefore, as explained further below, EPA believes that the potential economic impacts discussed in this section argue for thoughtful consideration of how flexibility in the compliance timeframe can be provided consistent with the air quality goals of the Clean Air Act.
EPA is specifically seeking comment on opportunities to reduce and/or avoid significant impacts
on water settlement tribes while maintaining visibility protection for the 11 affected Class 1 areas. In addition, EPA, in conjunction with Interior and the Department of Energy, have committed to work together on several short- and long-term goals, including seeking funding to cover expenses for the federal portion of pollution control at NGS.33 EPA understands that if funds are available to cover Reclamation�’s portion of air pollution control costs at NGS, water rate increases to tribes and others that use CAP water would not occur as a result of BART. The agencies will work together with stakeholders to identify and implement actions that support implementation of BART, including seeking funding to cover expenses for plant pollution control or other necessary upgrades for the federal portion of NGS. The agencies will also work to jointly support a phase 2 report on NGS clean energy options and work with stakeholders to develop a roadmap for accomplishing the goals described above. Although this collaboration may span several years, EPA expects the alternative strategies resulting from the collaboration may also contribute to reductions in NOx emissions at NGS. Factor three explores the existing controls at the source. Units 1 �– 3 at NGS are equipped with flue gas desulfurization units to reduce emissions of sulfur dioxide (SO2) and electrostatic precipitators to reduce emissions of particulate matter. In 2008, EPA issued a pre-construction permit authorizing SRP to install low-NOx burners plus separated overfire air (LNB/SOFA) on Units 1 �– 3 at NGS. Over the 2009 �– 2011 timeframe, one unit per year at NGS was retrofit with new NOx combustion controls to meet a permitted emission limit of 0.24 lb/MMBtu. Because SRP, and Grand Canyon Trust, an environmental organization that filed comments on the proposed permit, agreed that EPA�’s issuance of the PSD permit authorizing SRP to install and operate LNB/SOFA on Units 1 �– 3 should not prejudice the analysis of additional NOx controls under the BART requirement of the Regional Haze Program, EPA has determined that consideration of the existing controls at NGS does not warrant eliminating SCR as the most stringent, technically feasible, cost effective NOx emission control technology in our BART analysis. EPA notes that over the period from 2009 �– 2018, the early installation of LNB/SOFA at NGS will result in over 90,000 tons more NOx reductions than would have been achieved if
33 See Joint Federal Agency Statement Regarding Navajo Generating Station, dated January 4, 2013, in the docket for this proposed rulemaking.

Technical Support Document for NGS Proposed BART Determination, rev. February 11, 2013 | Page 9 of 129
LNB/SOFA were installed in conjunction with a BART determination (i.e., by 2018). EPA is proposing to determine that existing controls at NGS do not warrant elimination of SCR as BART, but that the early NOx reductions achieved from SRP�’s voluntary installation of LNB/SOFA in 2009 �– 2011 warrants further consideration when weighing all five factors. The fourth factor considers the remaining useful life of the facility. Although comments to the ANPRM have cited the age of NGS and impending lease and right-of-way negotiations with the Navajo Nation as a rationale to consider a shorter useful life, EPA is proposing to determine that the default 20-year amortization period is most appropriate to use as the remaining useful life of the facility. Without an enforceable obligation to shut down early, EPA cannot consider a shorter amortization period in our analysis. Additionally, EPA further understands that the owners of NGS are pursuing a lease agreement with the Navajo Nation to operate until 2044. EPA is proposing to determine that there are no issues with the remaining useful life of NGS that warrant rejecting SCR as BART. The fifth factor examines the visibility improvement resulting from controls. The anticipated visibility benefits were modeled using CALPUFF Version 5.8. Background ammonia concentrations assumed in the model are an important component of the visibility impacts model. Based on results from four different ammonia background scenarios, EPA determined that although the assumed concentration impacts the absolute modeled visibility benefits, it does not change the ranking of controls, i.e., the most stringent control technology, SCR+LNB/SOFA, results in the highest modeled visibility improvement. All ammonia background scenarios result in perceptible improvements in visibility at the most impacted Class I areas. EPA�’s modeling shows that the baseline impairment at the eleven Class I areas affected by NGS ranges from over 1 deciview at the least-impacted Class I areas to over 8 deciviews at the most-impacted Class I area. The installation of SCR in combination with LNB/SOFA on all 3 units at NGS is anticipated to reduce the visibility impairment caused by NGS by 5.4 deciviews at the two most-impacted Class I areas (Grand Canyon National Park and Capitol Reef National Park). The greatest visibility benefits from LNB/SOFA alone and SNCR in combination with LNB/SOFA is anticipated to be 2.1 and 3.1 deciviews, respectively. See Table ES-1. EPA is proposing to determine that the visibility benefits of SCR are significant and do not warrant its elimination as the top control option for BART. 3. EPA’s Proposed BART Determination and Proposed BART Alternative
The BART Guidelines give states (and EPA) discretion in determining the relative weight of each factor in making a BART determination. EPA is proposing to determine that the average and incremental costs of SCR are cost effective. Additionally, the visibility benefits from SCR are anticipated to be significant, and given the long expected useful life of NGS (at least until 2044), EPA is proposing to determine that a NOx emission limit of 0.055 lb/MMBtu, achievable with the installation of SCR systems with four layers of catalyst on all three units, in combination with the existing LNB/SOFA, is BART for NGS.
However, as discussed in Factor 2, NGS is unique compared to all other coal-fired power plants
in the nation in terms of its relationship with water and tribal water users in Arizona. Because of the potential adverse economic impacts of higher water costs on tribes located in Arizona, EPA is proposing a BART Alternative consistent with the RHR (40 CFR §51.308(e)(2)). Under the RHR, Alternatives to BART must achieve greater reasonable progress than would be achieved through the installation and operation of BART, and all necessary emission reductions must take place during the period of the first long-term strategy for regional haze, which, for states that were required to submit RH SIPs in December 2007, ends in 2018. EPA is also proposing that consideration of compliance schedules

Technical Support Document for NGS Proposed BART Determination, rev. February 11, 2013 | Page 10 of 129
beyond 2018 for alternative measures at NGS is appropriate for several reasons, including the singular importance of NGS to many tribes located in Arizona and their water settlement agreements with the federal government, the numerous uncertainties facing the owners of NGS, the requirement for NEPA review of a lease extension, and the early and voluntary installation of modern combustion controls over the 2009 �– 2011 timeframe.
We are proposing, as an alternative to BART, to require NGS to meet a NOx limit of 0.055
lb/MMBtu on one unit per year in 2021, 2022, and 2023. As shown in Table ES-3 below, EPA has calculated that the total amount of NOx that will be emitted from NGS over the 2009 - 2044 timeframe under EPA�’s proposed BART determination (i.e., compliance by 2018) will equal 358,974 tons. EPA has also calculated that the total NOx emissions over 2009 �– 2044 under Alternative 1, with credit for the early and voluntary emission reductions, will be 338,189 tons.
EPA is proposing to find that the an alternative is �“better than BART�” if the adjusted total NOx
emissions over the 2009 �– 2044 timeframe (i.e., emissions remaining after subtracting 92,715 tons for the LNB/SOFA credit for early and voluntary emission reductions) are less than total emissions under our proposed BART determination for the same period (i.e., 358,974 tons). Based on its adjusted total NOx emissions, Alternative 1 meets this threshold (i.e. 338,189 tons is less than 358,974 tons). Therefore, EPA is proposing Alternative 1 (compliance with BART emission limits on one unit per year in 2021, 2022, and 2023) as a better-than-BART alternative that results in greater reasonable progress than would be achieved under BART.
Table ES-3: Analysis of Proposed BART Alternative
BART Alternative 1 Installation Years by 2018 2021, 2022, and 2023
Total Emissions over 2009 - 2044 (tons) 358,974 430,904 LNB/SOFA Credit (tons) n/a 92,175 Adjusted Emissions (tons) n/a 338,189
Better than BART? n/a Yes (338,189 tons < 358,974 tons)
EPA recognizes that some limited additional flexibility beyond the 2021 �– 2023 compliance
schedule under Alternative 1 may be appropriate, given the importance of NGS to a broad range of interests. EPA has evaluated two other alternative schedules, using the �“better than BART�” analysis framework described above, to evaluate additional time for compliance, i.e., compliance on one unit per year in 2023, 2024, and 2025 (Alternative 2) and compliance on one unit per year in 2024, 2025, and 2026 (Alternative 3).
As shown in Table ES-4, Alternatives 2 and 3 do not by themselves meet the �“better than
BART�” threshold because the adjusted emissions (accounting for the LNB/SOFA credit) exceed total emissions under BART. In Table ES-4, the amount total emissions from the alternative exceeds BART is the NOx emissions reduction deficit. For Alternatives 2 and 3, the NOx emission reduction deficits are 15,179 tons and 33,160 tons, respectively, showing that as the compliance dates under a given alternative extend further into the future, the NOx emission reduction deficit grows. Because Alternatives 2 and 3 do not meet the �“better than BART�” threshold, EPA views Alternatives 2 and 3 as viable only if the owners of NGS achieve additional emission reductions to bridge the deficit in NOx emission reductions. These additional emission reductions could be implemented as short-term (i.e., for some subset of the period 2009 - 2044) or long-term (i.e., achieved annually until 2044) measures.

Technical Support Document for NGS Proposed BART Determination, rev. February 11, 2013 | Page 11 of 129
Because Alternatives 2 and 3 do not currently meet the �“better than BART�” threshold we are not proposing to approve them in this action, but we are soliciting comment on them. If we receive additional information supporting approval of Alternative 2 and/or 3, we will publish a supplemental proposal.
As shown in Table ES-4, if the owners of NGS complied with the schedule under Alternative 2,
a short-term emission reduction bridge (implemented, for example, over a 10-year period from 2013 �– 2023), the owners of NGS would need to achieve additional NOx emission reductions of 1,518 tons per year. Similarly, implementing a long-term emission reduction bridge (for example, over the period of 2013 �– 2044) would require additional NOx emission reductions of 490 tons per year. The short and long term emission reduction bridges in Table ES-4 provide examples of how additional emission reductions might be distributed over time. The actual annual emission reductions that NGS would need to bridge the NOx deficit would depend, not only on the size of the deficit, but on the specific measures and time periods chosen by the owners of NGS.
Table ES-4: Analysis of Additional Alternatives BART Alternative 2 Alternative 3
Installation Years by 2018 2023, 2024, and 2025 2024, 2025, and 2026 Total Emissions (tons) 358,974 466,869 484,849
LNB/SOFA Credit (tons) n/a 92,175 92,175 Adjusted Emissions (tons) n/a 374,154 392,134
Better than BART? n/a No No Emission Reduction Deficit
(tons) n/a 15,179 33,160
Short-term Emission Bridge (tpy)
(years in place)
n/a 1,518 tpy over 2013-2023 3,015 tpy over 2013-2024
Long-term Emission Bridge (tpy)
(years in place)
n/a 490 tpy over 2013-2044 1,070 tpy over 2013-2044
EPA is requesting comment on technically and economically feasible technologies or
mechanisms to serve as enforceable emission reduction bridges (whether short or long term) that would allow consideration of alternatives that would not otherwise meet the �“better than BART�” threshold for NOx (e.g., Alternatives 2 or 3 or other alternatives suggested by stakeholders during the public comment period for this proposed rule).
In weighing the statutory factors, EPA believes that our BART determination for NOx is appropriate for NGS. NGS is among the largest power plants in the nation, both in terms of its heat input capacity and in terms of total emissions of NOx. Therefore, EPA is proposing that SCR, which is cost effective and will result in significant visibility improvement, is BART for NGS, because it is expected to continue operation for at least three more decades and is surrounded by eleven mandatory Federal Class I areas, including the Grand Canyon National Park. Because of the potential adverse economic impacts to tribes located in Arizona, we are proposing Alternative 1 as a �“better than BART�” Alternative that provides Reclamation and the other owners of NGS flexibility in the schedule for compliance, to resolve outstanding lease and rights-of-way agreements to ensure continued operation of NGS, and to allow time for Reclamation to work with other federal agencies to seek funding for the federal portion of

Technical Support Document for NGS Proposed BART Determination, rev. February 11, 2013 | Page 12 of 129
the cost of controls, recognizing the importance of the continued operation of NGS to numerous tribes located in Arizona and the broader regional economy.

Technical Support Document for NGS Proposed BART Determination, rev. February 11, 2013 | Page 13 of 129
Table of Contents
1. Introduction Page A. Brief History and Description of Navajo Generating Station 18 B. Regional Haze Rule 19 C. Relationship between Air Pollutants and Visibility Impairment 20 D. A BART Determination for NOx is Necessary or Appropriate 21 E. Discussion of BART Presumptive Limits for NOx 24 F. Advanced Notice of Proposed Rulemaking and EPA Approach to Consultation with
Affected States, Tribes, and FLMs 25 G. An Extended Time to Comply with BART is Necessary or Appropriate 26 i. Consideration of Uncertainties 27 ii. Consideration of Impacts to Tribes 27 iii. Consideration of Federal Collaboration 28 2. Technology Available 29 A. NGS Approach to this Factor 29 B. Discussion of Factor in ANPRM 30 C. Affected State, Tribe, and FLM Consultation 31 D. EPA Conclusions Regarding this Factor 31 3. Factor 1: Costs of Compliance 34 A. NGS Approach to this Factor 35 B. Discussion of Factor in ANPRM 36 C. Affected State, Tribe, and FLM Consultation 38 D. EPA Conclusions Regarding this Factor 41 4. Factor 2: Energy and Non-Air Quality Environmental Impacts of Compliance 50 A. NGS Approach to this Factor 50 B. Discussion of Factor in ANPRM 50 C. Affected State, Tribe, and FLM Consultation 51 D. EPA Conclusions regarding this Factor 53 i. Energy and Non-Air Quality Environmental Impacts 53 ii. Economic Impacts of Compliance 56 a. Projected Impacts on Electricity Generation Costs and Retail Rates 57 b. Projected Impacts on Water Rates in Arizona 60 c. Sensitivity to Other Uncertainties 61 d. Potential Impacts to Tribes Located in Arizona 64 e. Potential Impacts to Non-Indian Agriculture Users 75 f. Potential Impacts to Municipal and Industrial Users 76 g. Broader Economic Impacts to Arizona 76 iii. EPA�’s Proposed Determination for Factor 2 77 5. Factor 3: Any Existing Pollution Control Technology at the Source 78 A. NGS Approach to this Factor 78 B. Discussion of Factor in ANPRM 78 C. Affected State, Tribe, and FLM Consultation 78 D. EPA Conclusions regarding this Factor 79 6. Factor 4: Remaining Useful Life of the Source 80 A. NGS Approach to this Factor 80 B. Discussion of Factor in ANPRM 80

Technical Support Document for NGS Proposed BART Determination, rev. February 11, 2013 | Page 14 of 129
C. Affected State, Tribe, and FLM Consultation 80 D. EPA Conclusions regarding this Factor 81 7. Factor 5: Degree of Improvement in Visibility Which May Reasonably Anticipated to
Result From the Use of Such Technology 81 A. BART Guidelines and Modeling Protocols 81 B. Ammonia 90 C. Sulfuric Acid 90 D. NGS Approach to this Factor 91 E. Discussion of Factor in ANPRM 93 F. Affected State, Tribe, and FLM Consultation 98 G. EPA Conclusions regarding this Factor 102 8. Overall BART Determination 121 A. NGS Approach to this Factor 121 B. Affected State, Tribe, and FLM Consultation 121 C. EPA Conclusions regarding this Factor 123

Technical Support Document for NGS Proposed BART Determination, rev. February 11, 2013 | Page 15 of 129
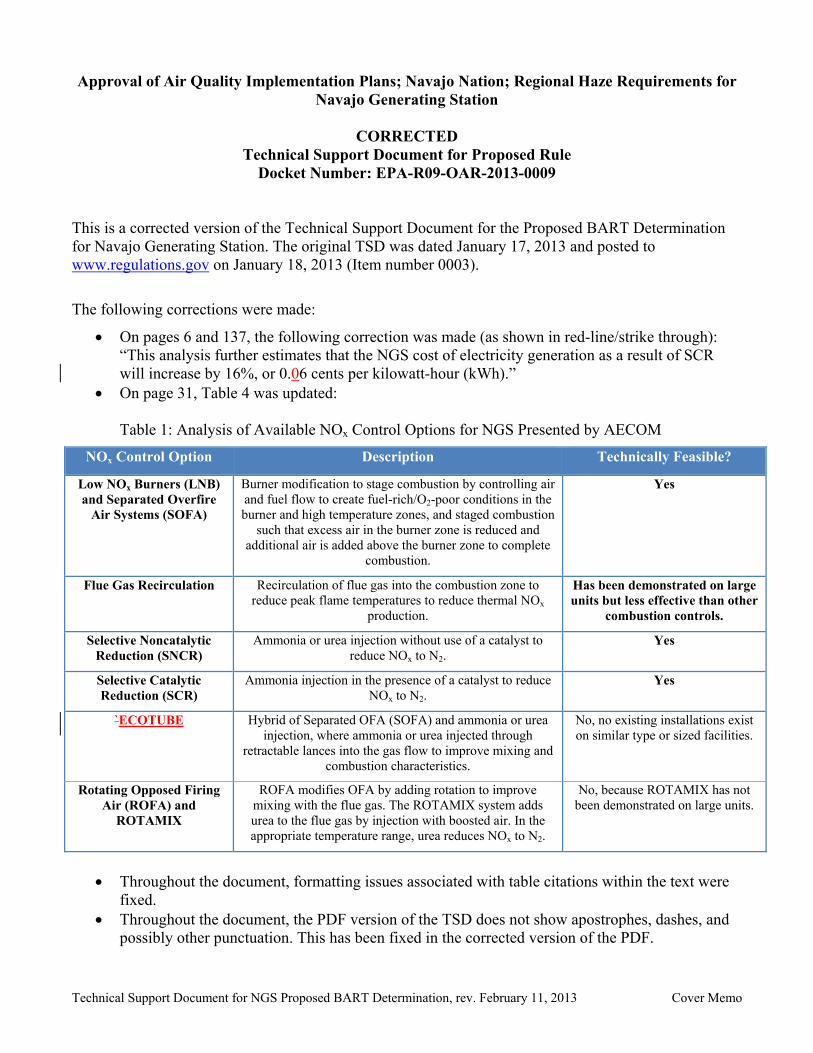
List of Tables Table 1: NGS Operational Characteristics ................................................................................................ 18Table 2: Facility-wide NOx Emissions from NGS from 2001 �– 2012 ...................................................... 22Table 3: Leases and Contract Renewals for NGS and Kayenta Mine ...................................................... 27Table 4: Analysis of Available NOx Control Options for NGS Presented by AECOM ........................... 30Table 5: Annual NOx emissions and Projected Emissions (lb/MMBtu) from Control Options as reported by AECOM in November 2007 Submittal to EPA ................................................................................... 31Table 6: AECOM and S&L Capital and Annual Cost Estimates, Percent Emissions Reductions, and Cost Effectiveness for NOx Controls (from January 2009 revised BART analysis) ........................................ 36Table 7: Cost Estimates for SCR+LNB/SOFA presented in ANPRM ..................................................... 37Table 8: Cost Estimates for LNB/SOFA presented in ANPRM ............................................................... 37Table 9: 2010 Capital and Annual Cost Estimates for SCR and Additional Pollutant Controls Estimated by S&L for SRP ........................................................................................................................................ 39Table 10: Revised SNCR and LNB/SOFA Cost Estimates from SRP in 2012 ........................................ 40Table 11: Cost Effectiveness Calculated by SRP, as reported in its 2012 Revised BART Analysis ....... 41Table 12: Summary of EPA Revisions to S&L Cost Inputs for SCR on Unit 2 ...................................... 41Table 13: EPA Revisions to Cost Estimates for SCR (2010 dollars) ....................................................... 42Table 14: Cost Comparison of SCR+LNB/SOFA Reactor Sizes Based on EPA Revisions to 2010 S&L Costs .......................................................................................................................................................... 45Table 15: Average and Incremental Cost Effectiveness of Dominant Control Options Calculated by EPA................................................................................................................................................................... 48Table 16: Estimated Cost Effectiveness of SCR for Several Western Power Plants................................ 49Table 17: Increase in Electricity Generation Costs ($/kWh) from NOx Controls at NGS Presented in ANPRM .................................................................................................................................................... 51Table 18: Summary of Cost after Installing SNCR and SCR versus Market Trends if Compliance with BART by 2018 .......................................................................................................................................... 58Table 19: Increase in Electricity Generation Costs in 2018 ..................................................................... 59Table 20: Estimated Pumping Cost Increase from SCR ........................................................................... 61Table 21: Lease, Permit and Contract Renewals Required for NGS or Kayenta Mine ............................ 63Table 22: Summary of Tribes with CAP Allocations or Using CAP Water ............................................ 69Table 23: Flue Gas Flow Sequence and Air Pollution Control Equipment at NGS as reported in its July 3, 2008 Part 71 Operating Permit ............................................................................................................. 78Table 24: Measured Visibility Impairment at Class I areas (2006 �– 2008 average), from IMPROVE monitoring network ................................................................................................................................... 81Table 25: Class I Areas in CALPUFF Modeling for NGS ....................................................................... 83Table 26: Selected CALMET settings for NGS ....................................................................................... 88Table 27: AECOM Modeling Inputs (lb/hr) ............................................................................................ 91Table 28: Assumptions Used by AECOM for H2SO4 Emission Estimates .............................................. 92Table 29: Ammonia background concentration in ppb ............................................................................. 92Table 30: Impacts of NGS on Visibility (98th Percentile of daily maximum dv) at Eleven Class I Areas as Modeled by AECOM and as reported by EPA in ANPRM ................................................................. 93Table 31: Ammonia background concentrations in ppb determined by EPA used in ANPRM ............... 95Table 32: Visibility Impairment (98th Percentile dv) of NGS on Eleven Class I Areas as Modeled by EPA as reported in our ANRPM ............................................................................................................... 96Table 33: Percent Improvement in Deciview Impairment based on EPA modeling for Each Class I Area from NOx Controls at NGS as reported in ANPRM ................................................................................. 96Table 34: Alternative Visibility Metric as reported in ANPRM ............................................................... 97

Technical Support Document for NGS Proposed BART Determination, rev. February 11, 2013 | Page 16 of 129
Table 35: NPS Modeling Results �– Average 8th High Baseline and Delta dv Improvement from 2001 �– 2003......................................................................................................................................................... 100Table 36: Assumptions used in Sulfuric acid (H2SO4) Emissions Calculations ..................................... 104Table 37: Class I area groupings for ammonia background used in this proposal ................................. 106Table 38: Ammonia background concentrations in ppb modeled by EPA used in proposal ................. 107Table 39: Ammonia background concentrations in ppb for modeled by EPA for nitrate check ............ 110Table 40: Scenarios Modeled by EPA for our BART Analysis for NGS ............................................... 112Table 41: EPA Modeling Inputs (lb/hr) .................................................................................................. 112Table 42: EPA Modeling Results �– 8th High Delta dv Baseline Impacts of NGS on 11 Class I Areas from 2001 �– 2003 for the Different Ammonia Background Scenarios ........................................................... 115Table 43: EPA Modeling Results �– 8th High Delta dv Improvement and Percent Change in Delta dv Impact Compared to Baseline Impacts from 2001 �– 2003 using Ammonia Background Scenario Am1................................................................................................................................................................. 117Table 44: EPA Modeling Results �– 8th High Delta dv Improvement and Percent Change in Delta dv Impact Compared to Baseline Impacts from 2001 �– 2003 using Ammonia Background Scenario Am2................................................................................................................................................................. 118Table 45: EPA Modeling Results �– 8th High Delta dv Improvement and Percent Change in Delta dv Impact Compared to Baseline Impacts from 2001 �– 2003 using Ammonia Background Scenario Am5................................................................................................................................................................. 119Table 46: Number of days with delta deciview impacts greater than or equal to 0.5 dv in 2001-2003 . 120Table 47: Analysis of Proposed BART Alternative ............................................................................... 127Table 48: Analysis of Additional Alternatives ....................................................................................... 128

Technical Support Document for NGS Proposed BART Determination, rev. February 11, 2013 | Page 17 of 129
List of Commonly Used Acronyms and Abbreviations
AECOM AECOM Environmental ANPRM Advanced Notice of Proposed Rule Making BART Best Available Retrofit Technology CAA Clean Air Act CFR Code of Federal Regulations DV or dv Deciview ENSR ENSR Corporation EPA U.S. Environmental Protection Agency ESP Electrostatic Precipitator FGD Flue Gas Desulfurization FIP Federal Implementation Plan FLM Federal Land Manager FR Federal Register FS U.S. Forest Service FWS U.S. Fish and Wildlife Service H2SO4 Sulfuric Acid LNB Low NOx Burners NAAQS National Ambient Air Quality Standards NGS Navajo Generating Station NH3 Ammonia NOx Oxides of Nitrogen NPS National Park Service NSPS New Source Performance Standard NSR New Source Review OFA Over Fire Air OM&R Operation, Maintenance, and Replacement PJFF Pulse Jet Fabric Filter PM Particulate Matter PSD Prevention of Significant Deterioration RGFF Reverse Gas Fabric Filter SCR Selective Catalytic Reduction S&L Sargent and Lundy SNCR Selective Non-Catalytic Reduction SO2 Sulfur Dioxide SOFA Separated Over Fire Air SRP Salt River Project TPY (tpy) Tons Per Year TSD Technical Support Document

Technical Support Document for NGS Proposed BART Determination, rev. February 11, 2013 | Page 18 of 129
1. Introduction
A. Brief History and Description of Navajo Generating Station
The Navajo Generating Station (NGS) is a mine-mouth coal-fired power plant located on the Navajo Nation Indian Reservation, near Page, Arizona and consists of three 750 megawatt (MW) coal-fired electric utility steam generating units with a total net capacity of 2250 MW (See Table 1). NGS was constructed before many of the statutory programs required by the Clean Air Act Amendments (CAAA) of 1977 such as New Source Review (NSR) and Prevention of Significant Deterioration (PSD). The facilities that predate these preconstruction review programs are generally referred to as �“grandfathered�” facilities and are not required to comply with subsequently enacted statutory provisions.
Units 1, 2, and 3 are over 35 years old and are co-owned by several entities: the U.S.
Bureau of Reclamation (Reclamation) owns 24.3%, Salt River Project (SRP), which also serves as the facility operator owns 21.7%, Los Angeles Department of Water and Power (LADWP) owns 21.2%, Arizona Public Service (APS) owns 14%, Nevada Power Company owns 11.3%, and Tucson Electric Power owns 7.3%. These utilities serve electricity customers in Arizona, California, and Nevada.
Table 1: NGS Operational Characteristics
Unit 1 Unit 2 Unit 3Boiler Type Dry Bottom, Tangential
FiredDry Bottom, Tangential
FiredDry Bottom, Tangential
FiredYear Operation Began 1974 1975 1976
Capacity (net MW) 750 750 750Average Heat input (gross)
(MMBtu/hr)34 8,007 8,420 7,845
Average Operating Hours per year
7,616 8,120 7,913
NOx Baseline emission rate (lb/MMBtu)35
0.36 0.36 0.34
PM Baseline emission rate (lb/MMBtu)36
< 0.03 < 0.03 < 0.03
Federal participation in NGS was authorized in the Colorado River Basin Project Act of
1968 as a preferred alternative to building hydroelectric dams in the Grand Canyon for providing power to the Central Arizona Project.37 The Central Arizona Project (CAP) is a 336-mile water distribution system that was built to deliver about 1.5 million acre-feet (AF) per year of Colorado River water from Lake Havasu in western Arizona to agricultural water users, Indian tribes located in Arizona, and municipal water users in Maricopa, Pinal, and Pima counties in central Arizona.38 This CAP water is used to meet the terms of a number of Indian water rights
34 Average heat input and operating hours reported to EPA Clean Air Markets Division for 2001 �– 2003. 35 Average NOx emissions reported to EPA Clean Air Markets Division for 2001 �– 2003. 36 From ENSR BART Analysis for SRP-NGS, page ES-1. 37 http://www.usbr.gov/projects//ImageServer?imgName=Doc_1303158888395.pdf 38 http://www.cap-az.com/

Technical Support Document for NGS Proposed BART Determination, rev. February 11, 2013 | Page 19 of 129
settlements and to reduce groundwater usage in the region. Electricity from NGS powers the pumps to move CAP water to its destinations along the distribution system.39
Several tribes located in Arizona have allocations of CAP water through water settlement
agreements that have been approved through acts of Congress. In exchange for allocations of CAP water at reduced cost and access to funds for the development of water infrastructure, these tribes have released their claims to other surface or sub-surface water in Arizona. Excess NGS power owned by Reclamation that is not used by CAP is sold and revenues are deposited into a fund to support of water settlement agreements. Reclamation and the Department of Interior play an important role in the development of these settlement agreements and the management of funds for water infrastructure development for tribes. The coal used by NGS is supplied by the Kayenta Mine, operated by Peabody Energy and located on reservation lands of both the Navajo Nation and the Hopi Tribe. Taxes and royalties from NGS and the Kayenta Mine paid to the Navajo Nation and Hopi Tribe contribute significantly to the annual revenues for both governments.
Yet, NGS is located near many of our most treasured National Parks and Wilderness
Areas. Congress mandated heightened protection for these areas in designating them as mandatory Class I Federal areas. The Federal Land Managers of National Parks and Wilderness Areas, the National Park Service and the U.S. Fish and Wildlife Service, under the Department of Interior, and the U.S. Forest Service, under the Department of Agriculture, play important roles in the protection of visibility in the mandatory Class I Federal areas.
B. Regional Haze Rule
The visibility protection requirements in the 1990 CAA amendments were designed to address the large grandfathered sources that have an adverse impact on visibility in National Parks and Wilderness Areas. When Congress enacted Section 169A of the CAA in 1977 to protect visibility, it directed EPA to promulgate regulations that would require applicable implementation plans to include a determination of BART for certain major stationary sources that are �“reasonably anticipated to cause or contribute to any impairment of visibility in any [Class I area].�”40A source is BART-eligible if it is a fossil-fuel fired steam electric plant of more than 250 MMBtu/hr heat input or other listed industrial source that has the potential to emit 250 tons or more of any visibility-impairing pollutant and that came into operation between 1962 and 1977.41 NGS meets these criteria and is a BART-eligible source.
A BART-eligible source with a predicted visibility impact of 0.5 deciviews (dv) or more in a Class I area �“contributes�” to visibility impairment and is subject to BART. See 70 FR at 39161 (July 6, 2005). NGS contributes to visibility impairment at 11 surrounding Class I areas in excess of this threshold, and is thus subject to BART.
In determining BART, states are required to take into account five factors identified in
the CAA and EPA�’s regulations. 42 U.S.C. 7491(g)(2) and 40 CFR 51.308. Those factors are: 1. the costs of compliance,
39 See, for example, NREL report, page 9. 40 42 U.S.C. 7491(b)(2)(A) & (g) 41 Id.

Technical Support Document for NGS Proposed BART Determination, rev. February 11, 2013 | Page 20 of 129
2. the energy and non-air quality environmental impacts of compliance, 3. any pollution control equipment in use or in existence at the source, 4. the remaining useful life of the source, and 5. the degree of improvement in visibility which may reasonably be anticipated to
result from the use of such technology.
EPA�’s guidelines for evaluating BART are set forth in Appendix Y to 40 CFR Part 51, referred to as the BART Guidelines, and must be followed in making BART determinations for fossil fuel-fired electric generating plants larger than 750 MW.
C. Relationship Between Air Pollutants and Visibility Impairment
Particulate matter less than 10 micrometers (millionths of a meter, or microns) in size (PM10) interacts with light. The smallest particles in the 0.1 to 1 micron range interact most strongly as they are about the same size as the wavelengths of visible light. The effect of the interaction is to scatter light from its original path. Conversely, for a given line of sight, such as between a mountain scene and an observer, light from many different original paths is scattered into that line. The scattered light appears as whitish haze in the line of sight, obscuring the view.
Boiler stacks and material handling are sources of primary PM, or PM emitted directly
into the atmosphere. Of primary PM emissions, those in the smaller particle size range, less than 2.5 microns, tend to have the largest impact on visibility. PM emissions from boiler stacks can have varying particle size makeup depending on the PM control technology. PM from material handling, though, tends to be coarse, i.e. around 10 microns, since it is created from the breakup of larger particles of soil and rock.
PM that is formed in the atmosphere from the chemical transformation and condensation
of gaseous chemical pollutants, also called secondary PM, tends to be fine, i.e. smaller than 1 micron, since it is formed from the buildup of individual molecules. This secondary PM tends to contribute more to visibility impairment than primary PM because it is in the size range where it most effectively interacts with visible light. NOx and SO2 emissions from coal fired power plants are two examples of gaseous chemical pollutants that react with other compounds in the atmosphere to form secondary PM.
NOx is a gaseous pollutant that can be oxidized to form nitric acid. In the atmosphere,
nitric acid in the presence of ammonia forms particulate ammonium nitrate. The formation of particulate ammonium nitrate is dependent on temperature and relative humidity, and therefore, varies by season. Particulate ammonium nitrate can grow into the size range that effectively interacts with light by coagulating together and by taking on additional pollutants and water. The same principle applies to SO2 and the formation of particulate ammonium sulfate.
In air quality models, secondary PM is tracked separately from primary PM. The amount
of secondary PM formed depends on temperature, humidity, and background concentrations for other species. Secondary PM can be several times more effective at impairing visibility than primary PM due to its typically smaller size. This is reflected in the equation used to calculate

Technical Support Document for NGS Proposed BART Determination, rev. February 11, 2013 | Page 21 of 129
visibility impacts from concentrations measured by the Interagency Monitoring of Protected Visual Environments (IMPROVE) monitoring network covering Class I areas.42
D. A BART Determination for NOx is Necessary or Appropriate
The numerous Class I areas that surround NGS are sometimes known as the Golden
Circle of National Parks.43 Millions of tourists visit these areas, many visiting from other countries to view the unique vistas of the Class I areas in this region.
As Congress recognized, visibility is an important value and must be protected in these
areas. Yet, air quality and visibility are impaired in the Class I areas surrounding NGS. The National Park Service noted in 2008 that �“[v]isibility is impaired to some degree at all units where it is being measured and remains considerably higher than the target national conditions in many places, particularly on the haziest days.�”44 Of the 11 mandatory Class I Federal areas located within 300 km of NGS, eight national parks, including Grand Canyon, Canyonlands, and Capitol Reef, are among the areas monitored by the National Park Service.45 Id. Appendix B. The RHR requires an assessment of all visibility-impairing pollutants at a source that are emitted in excess of the Prevention of Significant Deterioration (PSD) significance levels (40 CFR §52.21). The BART Guidelines (40 CFR Part 51 Appendix Y) list sulfur dioxide (SO2), oxides of nitrogen (NOx), and particulate matter (PM) as visibility impairing pollutants. The significance thresholds for SO2 and NOx are each 40 tpy, the significance thresholds for PM, PM10, and PM2.5 are 25, 15, and 10 tpy, respectively. Emissions of SO2, NOx, PM, PM10, and PM2.5 from NGS exceed those significance thresholds.46
Based on data from the EPA Clean Air Markets Division (CAMD), from 2001 �– 2012, NGS has consistently ranked among the twenty highest NOx emitters (in terms of total tons of NOx emitted per year) in the United States (see
Table 2). In 2011, NGS was the fifth largest source of NOx emissions in the United States; the largest sources were the Four Corners Power Plant (the other coal-fired power plant located on the Navajo Nation), Hatsfield Ferry Power Station (Pennsylvania), Intermountain Power (Utah), and Keystone Power (Pennsylvania).
The amount of NOx emitted per heat input, or pounds of NOx per million Btu (lb/MMBtu), is a measure of efficiency that considers both the size of the facility and its NOx emissions. emissions. Over 2001 �– 2008, the NOx emission rate at NGS was fairly steady, ranging from 0.24 �– 0.36. �– 0.36. Over 2009 to 2011, NGS voluntarily installed new combustion controls on each of its three units three units (one per year) to reduce emissions of NOx. In 2011, after complete installation of combustion combustion controls on all units, the facility-wide NOx emission rate at NGS was below 0.24 lb/MMBtu,
42 Guidance for Estimating Natural Visibility Conditions Under the Regional Haze Rule, U.S. Environmental Protection Agency", EPA-454/B-03-005, September 2003; http://www.epa.gov/ttn/oarpg/t1pgm.html. 43 See http://www.nps.gov/history/history/online_books/nava/adhi/adhi4e.htm. 44 Air Quality in National Parks, 2008 Annual Performance & Progress Report, National Resource Report NPS/NRPC/ARD/NRR �– 2009/151, September 2009, p. 30. 45 The other three mandatory Class I Federal areas located within 300 km of NGS are Wilderness Areas that are managed by the U.S. Forest Service. 46 For reasons discussed later in this document, EPA is only determining that it is necessary or appropriate to make at BART determination for NOx at this time.

Technical Support Document for NGS Proposed BART Determination, rev. February 11, 2013 | Page 22 of 129
lb/MMBtu, its permitted emission limit.47 In 2011, NGS performed better than many other coal-fired fired power plants in terms of its overall NOx emission rate, i.e., while NGS was ranked fifth largest in largest in terms of total tons of NOx emitted, NGS was ranked number 261 in terms of its lb/MMBtu lb/MMBtu NOx emission rate (see
Table 2). Table 2: Facility-wide NOx Emissions from NGS from 2001 �– 201248 Year NOx
emissions (tons)
Annual Heat Input (MMBtu)
Facility-wide NOx Emission
Rate (lb/MMBtu)
Ranking (tons of
NOx Emissions)
Ranking (NOx
lb/MMBtu)
Ranking (Heat
input in MMBtu)
NOx emission rate of larger (heat
input) coal-fired power plants49
2001 34,019 191,638,695 0.36 16 330 5 0.31 �– 0.53 2002 35,569 199,398,687 0.36 15 286 4 0.16 �– 0.35 2003 31,620 183,478,417 0.34 15 275 9 0.11 �– 0.48 2004 33,986 197,247,286 0.34 11 238 6 0.04 �– 0.36 2005 33,221 191,786,039 0.35 8 219 7 0.04 �– 0.29 2006 34,744 195,629,519 0.36 4 198 8 0.04 �– 0.29 2007 35,253 196,676,299 0.36 5 171 8 0.04 �– 0.37 2008 34,803 199,136,340 0.35 3 165 6 0.05 �– 0.29 2009 30,501 184,315,616 0.33 2 134 7 0.05 �– 0.22 2010 24,427 173,473,615 0.28 3 174 13 0.05 �– 0.24 2011 19,837 180,463,627 0.22 5 261 7 0.05 �– 0.16
201250 12,501 125,175,642 0.20 6 252 8 0.07 �– 0.23
Another way to compare NGS against other facilities is to rank power plants according to size (heat input) and then to compare NOx emission rates of the largest (heat input) coal-fired power plants. Generally, NGS is among the ten largest power plants in the nation in terms of heat input (see Table 2). In 2001, NGS was the fifth largest (heat input) power plant, and based on its NOx emission rate of 0.36 lb/MMBtu, it was among the better performing facilities at the time (NOx emissions from larger heat input facilities ranged from 0.31 �– 0.53 lb/MMBtu). However, beginning in 2002 and continuing into 2011 (after installation of new NOx controls at NGS), while NGS was still among the largest (heat input) power plants, its NOx emission rate was no longer among the better performing units, i.e., in 2011, all of the larger (heat input) coal-fired power plants achieved lower NOx emission rates than NGS.
Figure 1 shows the trends in the facility-wide NOx emission rates from 2001 �– 2012 for
the ten largest (heat input) power plants in 2011. In 2011, NGS was the 7th largest power plant (by heat input). Although the ten largest power plants differ every year (e.g., NGS was ranked 13th in terms of heat input in 2010), the power plants shown in Figure 1 generally represent the largest heat input power plants, and the emission trends for these power plants generally show
47 See final PSD permit issued by EPA Region IX dated November 20, 2008 in the docket for this proposed rulemaking. 48 See spreadsheets titled �“2001 CAMD.xlsx�”, �“2002 CAMD.xlsx�”, �“2003 CAMD.xlsx�”, �“2004 CAMD.xlsx�”, �“2005 CAMD.xlsx�”, �“2006 CAMD.xlsx�”, �“2007 CAMD.xlsx�”, �“2008 CAMD.xlsx�”, �“2009 CAMD.xlsx�”, �“2010 CAMD.xlsx�”, �“2011 CAMD.xlsx�”, and �“2012 prelim CAMD.xlsx�” in the docket for this proposed rulemaking. 49 For facilities larger than NGS in terms of heat input, average NOx emission rates represent only coal-fired units, i.e., WA Parish produces energy from a mix of natural gas-fired units (Units 1-4) and coal-fired units (Units 5-8). Although the NOx emission rate reported here represents only the coal-fired units, the four natural gas-fired units at Parish increase the facility-wide NOx rate (after 2004) because those units are not operated frequently and emit NOx at higher rates than the coal-fired units. See tab titled �“Larger and better performers�” in the spreadsheet titled �“2011 CAMD.xlsx�”, in the docket for this proposed rulemaking. 50 Excludes 4th quarter of 2012 because that data was not yet available as of January 3, 2013.

Technical Support Document for NGS Proposed BART Determination, rev. February 11, 2013 | Page 23 of 129
that over time, the largest power plants have decreased their NOx emission rates to lower levels than NGS. This suggests that although NGS has reduced NOx emissions in recent years through the installation of new combustion controls, it has still not kept pace with the largest coal-fired power plants in terms of reducing emissions of NOx. Therefore, although NGS voluntarily installed LNB/SOFA over the 2009 �– 2011 period, NGS remains among the largest sources of NOx (in terms of total tons of NOx) not only because it is among the largest (heat input) power plants, but also because its NOx emission rate is still relatively high compared to other large coal-fired power plants.
Figure 1: NOx Emission Trends over 2001 �– 2012 for 2011�’s Ten Largest (Heat Input) Power Plants
EPA is proposing to find that a BART determination for NOx emissions from NGS is necessary or appropriate under the TAR. EPA is not proposing that it is necessary or appropriate to address emissions SO2 and particulate matter (PM) under the TAR. Emissions of SO2 and PM are controlled with existing flue gas desulfurization (FGD) units and hot-side electrostatic precipitators. On March 5, 2010, EPA published in the Federal Register the final rule for a source-specific Federal Implementation Plan (FIP) for NGS (75 FR 10174). The purpose of the 2010 FIP was to make federally enforceable emissions limitations which NGS has historically followed for SO2, PM, opacity, and control measures for dust. Thus, the 2010 FIP did not require emissions reductions in the context of BART for NOx and PM. SO2 emission limits in the FIP were 1.0 lb/MMBtu averaged on a plant-wide basis for all three units. The FIP included PM emission limits of 0.06 lb/MMBtu from all units on a plant-wide basis, a 20% opacity limit on each of the stacks for Units 1 �– 3, and a 20% opacity limit on any crusher, grinding mill,
0
0.1
0.2
0.3
0.4
0.5
0.6
0.7
2001 2002 2003 2004 2005 2006 2007 2008 2009 2010 2011 2012
NOxE
mission
Rate
(lb/M
MBtu)
Scherer
James H Miller Jr
W A Parish
Labadie
Martin Lake
Gen J M Gavin
Navajo Generating Station
BruceMansfield
Gibson
Monroe

Technical Support Document for NGS Proposed BART Determination, rev. February 11, 2013 | Page 24 of 129
screening operation, belt conveyor, truck loading or unloading operation, or railcar unloading station. For SO2, the 2010 FIP re-codified an SO2 emission limitation into 40 CFR Part 49 for NGS, that was previously finalized in a 1991 visibility FIP for the state of Arizona that EPA codified in 40 CFR 52.145(d). See 56 FR 50172 (October 3, 1991). The 1991 visibility FIP required NGS to install limestone flue gas desulfurization units (limestone FGDs, also known as scrubbers) to meet the SO2 limit of 1.0 lb/MMBtu, and EPA concluded that the SO2 emission limits achieved greater reasonable progress than would BART, therefore the reasonable progress goals of CAA Section 169A(b)(2) for SO2 at NGS are already satisfied. On February 16, 2012, EPA published in the Federal Register the final rule for the Mercury and Air Toxics Standard (MATS Rule) that set emission limits for mercury, acid gases, and particulate matter (77 FR 9304). The final rule set a filterable PM limit of 0.03 lb/MMBtu. Units 1 �– 3 at NGS must comply with the MATS Rule and the applicable limits within 3 �– 4 years of April 16, 2012.51 All three units at NGS are equipped with hot-side electrostatic precipitators to control PM emissions, and these existing controls already achieve emission levels at or below 0.03 lb/MMBtu. EPA is proposing to find that it is not necessary or appropriate under the TAR to conduct a BART analysis for PM for NGS.
E. Discussion of Presumptive BART Limits for NOx
Appendix Y to Part 51 �– Guidelines for BART Determinations Under the Regional Haze Rule (BART Guidelines) outlines the process for conducting a five-factor BART analysis (70 FR 39104, July 6, 2005). The BART Guidelines established numerical presumptive limits for NOx for coal-fired EGUs greater than 200 MW located at greater than 750 MW power plants and operating without post-combustion controls (i.e., selective catalytic reduction �– SCR, or selective non-catalytic reduction �– SNCR), differentiated by boiler design and type of coal burned. For the three units at NGS, tangential-fired boilers burning bituminous coal, the presumptive limit for NOx is 0.28 lb/MMBtu.
The BART Guidelines (70 FR at 39158) state:
For each source subject to BART, 40 CFR 51.308(e)(1)(ii)(A) requires that States identify the level of control representing BART after considering the factors set out in CAA section 169A(g), as follows: States must identify the best system of continuous emission control technology for each source subject to BART taking into account the technology available, the costs of compliance, the energy and non-air quality environmental impacts of compliance, any pollution control equipment in use at the source, the remaining useful life of the source, and the degree of visibility improvement that may be expected from available control technology.
The preamble to the final BART Guidelines (70 FR 39131), in discussing the
presumptive limits, also states:
51 See 77 FR 9304, February 16, 2012.

Technical Support Document for NGS Proposed BART Determination, rev. February 11, 2013 | Page 25 of 129
States, as a general matter, must require owners and operators of greater than 750 MW power plants to meet these BART emission limits. We are establishing these requirements based on the consideration of certain factors discussed below. Although we believe that these requirements are extremely likely to be appropriate for all greater than 750 MW power plants subject to BART, a State may establish different requirements if the State can demonstrate that an alternative determination is justified based on a consideration of the five statutory factors. In other words, the presumptive limits do not obviate the need to identify the best system
of continuous emission control technology on a case-by-case basis considering the five factors. A state may not simply �“stop�” its evaluation of potential control levels at the presumptive level of control if more stringent control technologies or limits are technically feasible.
F. Advanced Notice of Proposed Rulemaking and EPA Approach to Consultation with
Affected States, Tribes, and FLMs
On August 28, 2009, EPA published in the Federal Register an Advanced Notice of Proposed Rulemaking (ANPRM) that put forth our analyses regarding the anticipated visibility improvements at surrounding Class I areas and the cost effectiveness of controls for BART at NGS and the Four Corners Power Plant (FCPP) and requested comment on our analyses as well as the analyses completed by SRP for NGS and Arizona Public Service (APS) for FCPP. The publication of the ANPRM provided an opportunity to begin consultations with affected Tribes and continued an on-going consultation with the Federal Land Managers (FLMs) as required under the RHR (40 CFR §51.308(h)(4)(i)(2)). During the development phase for this proposal, several Tribes in Arizona requested consultation on NGS. EPA initiated and engaged in several consultation meetings. A list of all meetings, as well as correspondence between EPA and the Tribes, is included in the docket for this rulemaking.52 EPA will continue to consult with affected Tribes and the FLMs during the comment period for this proposal.
EPA received over 6,000 comments on the ANPRM, most of which were generalized
electronic mail messages in support of reducing emissions. All substantive comments and examples of the generalized electronic mail messages have been posted to our docket for the ANPRM. Comment letters generally focused either on both NGS and Four Corners Power Plant (FCPP), or solely on NGS. Any comments received pertaining to FCPP were generally discussed in our proposed BART determination for FCPP on October 19, 2010 (75 FR 64221).
We received comments from the Inter Tribal Council of Arizona, Inc, and from eight
tribes located in Arizona, the Gila River Indian Community, the Pascua Yaqui Tribe, the Tohono O�’odham Nation, the Ak-Chin Indian Community, the Hopi Tribe, the Navajo Nation, the Fort McDowell Yavapai Nation, and the Yavapai-Apache Nation. Generally, comments from the tribes highlighted EPA�’s policy to assure that tribal concerns and interests are considered53 and EPA�’s responsibility to engage in meaningful consultation with tribal officials. EPA responded to all tribal requests for consultation as well as opportunities for on-going consultation, and provided an extension to tribes to submit comments on the ANPRM by March 1, 2010.
52 See document titled �“Timeline of All Tribal Consultation on NGS.docx�” in the docket for this proposed rulemaking. 53 EPA Policy for the Administration of Environmental Programs on Indian Reservations (November 8, 1984)

Technical Support Document for NGS Proposed BART Determination, rev. February 11, 2013 | Page 26 of 129
Comments on NGS from tribes and EPA�’s responses are primarily discussed under Factor 3: Energy, economic, and non-air quality impacts of controls.
In addition to tribes, we received numerous comments from State environmental agencies
and the Federal Land Managers for the impacted Class I areas. The National Park Service (NPS) provided comments on the AECOM BART analysis for NGS just prior to publication of our ANPRM in the Federal Register. EPA was not able to address the comment letter from NPS in our ANPRM but did include it in the docket for the ANPRM. EPA is addressing the comments raised by NPS prior to the ANPRM in this TSD. Several owners of NGS: SRP, Tucson Electric Power Company, and the U.S. Bureau of Reclamation, as well as other industry and utility groups, including Electric Power Research Institute (EPRI) and Utility Air Regulatory Group (UARG) submitted comments that included concerns regarding modeling inputs, visibility metrics, cost estimates, and economic impacts to Arizona and Tribes. We received comments specifically focused on the impacts of SCR at NGS on water cost to Arizona cities and tribes from the Central Arizona Water Conservation District, the U.S. Bureau of Indian Affairs, Governor Janice Brewer of Arizona, the Arizona State Treasurer, and mayors of several Arizona cities. The U.S. Fish and Wildlife Service, the Attorney General of New Mexico, and the Colorado Department of Public Health and the Environment submitted comments requesting an evaluation of mercury (Hg) emission reductions achieved as a co-benefit to NOx and particulate matter controls.
A consortium of environmental and Navajo community organizations54 (Consortium)
submitted comments on the estimates of cost and cost effectiveness at both facilities, visibility modeling, and additional benefits of stringent controls on reducing ozone and nitrogen deposition. The remainder of the comments we received on the ANPRM came from local community-based organizations, water districts, and State and U.S. Representatives in Arizona concerned about impacts of SCR on NGS to water cost, and private citizens writing on their own or in association with �“Take Action�” campaigns by the Sierra Club or the National Parks Conservation Association. The majority of citizen comments were general �“Take Action�” comment letters supportive of stringent controls at both facilities, but we also received numerous citizen comments against stringent controls. Most of the comments we received against stringent controls were concerned about costs to consumers and generally did not provide comments specific to the five-factor analysis. After the close of the public comment period for the ANPRM, over 2012, EPA received approximately 125 postcards supporting stringent controls at NGS.55
We have considered all comments, but will not be issuing a Response to Comments on
the comments received on the ANPRM. We have included responses in this technical support document mainly to comments we relied on to revise or justify our analyses and on substantive comments resulting from our consultation with Tribes, State Air Pollution Control Agencies, and the Federal Land Managers of the affected Class I areas.
In our final determination, EPA will respond to comments submitted on this proposal, but
will not respond to comments submitted on the ANPRM. Those who submitted comments on the
54 Center for Biological Diversity, Dine CARE, Dooda (NO) Desert Rock, Environmental Defense Fund, Grand Canyon Trust, Clean Air Counsel �– National Parks Conservation Association, Natural Resources Defense Council, San Juan Citizens Alliance, Sierra Club, and Western Resource Advocates. 55 See �“2012 Sample Postcards re: NGS.pdf�” in the docket for this proposed rulemaking.

Technical Support Document for NGS Proposed BART Determination, rev. February 11, 2013 | Page 27 of 129
ANPRM will need to resubmit comments on the proposal in order for EPA to consider those comments in finalizing this FIP.
G. An Extended Time to Comply is Necessary or Appropriate
i. Consideration of Uncertainties
SRP, operator and part-owner of NGS, provided information to EPA following our
ANPRM outlining several uncertainties regarding the continued operation of NGS. One of the owners of NGS is Los Angeles Department of Water and Power (LADWP), a public utility located in California. Under California state law, electricity provided to customers in California must meet a greenhouse gas emission standard based on natural gas combustion. NGS and other traditional coal-fired power plants that operate without carbon capture and sequestration do not meet this standard. In 2019, LADWP will be prohibited from continued participation in NGS. As a result, LADWP has indicated its intention to sell its ownership stake in NGS before 2019; however, the future owner of LADWP�’s 21.2 percent share of NGS is currently uncertain.
In addition, the current site lease with the Navajo Nation, as well as several other leases
and contracts, expires in 2019. Table 3 lists several leases and contracts that must be renewed to ensure continued operation of NGS into the future. Although the owners of NGS are in negotiations with the Navajo Nation for a lease renewal to extend to 2044 and with Peabody Energy for a renewed coal supply contract, the outcome of these negotiations are also not yet finalized.
Table 3: Leases and Contract Renewals for NGS and Kayenta Mine
Description Renewal Year Water Service Contract 2014
Peabody Lease Renewal with Navajo Nation and Hopi Tribe 2017 Coal Supply Contract between Peabody and NGS 2019
NGS Project Lease Renewal with Navajo Nation (Federal Rights of Way) 2019 Water Intake/Water Line Renewal (Federal Rights of Way) 2019
Railroad and Transmission Line Renewals (Federal Rights of Way) 2021 Southern Transmission Line Easement (Federal Rights of Way) 2022
Because NGS is located in Indian country, the process for lease renewal is unusual
because the lease must be approved by the Department of Interior. This approval is a Federal action that triggers review under the National Environmental Protection Act (NEPA). NEPA review requires the development of an Environmental Impact Statement (EIS) and includes a substantial process for public involvement. A complete NEPA review may take several years to complete. Therefore, even if the Navajo Nation and the owners of SRP reach agreement on a renewed lease prior to 2019, approval of the lease by the Department of Interior may require several additional years to complete.
ii. Consideration of Potential Impacts to Tribes
EPA received numerous comments on the ANPRM from tribes and tribal organizations,
including the Navajo Nation, Hopi Tribe, Gila River Indian Community, Ak-Chin Indian Community, Tohono O�’odham Nation, Pascua Yaqui Tribe, Fort McDowell Yavapai Nation, Yavapai-Apache Nation, and the Inter Tribal Council of Arizona. Comments from the Navajo

Technical Support Document for NGS Proposed BART Determination, rev. February 11, 2013 | Page 28 of 129
Nation and Hopi Tribe focused on the significant contribution of coal-related royalties, taxes, and employment at NGS and the Kayenta Mine to the economies of the Navajo Nation and the Hopi Tribe. Comments from the Gila River Indian Community, the Tohono O�’odham Nation, and other tribes located in Arizona focused on the importance of continued operation of NGS as a source of power to the Central Arizona Water Conservation District (CAWCD), the operating arm of CAP, in order for the federal government to meet obligations under existing water settlement agreements.. The importance to tribes of continued operation of NGS and affordable water costs cannot be overemphasized.
EPA met with numerous tribes on several occasions to discuss the significance of NGS to
tribal economies and tribal water interests in Arizona.56 Consultations with tribes included potential impacts associated with a BART determination for NGS, as well as potential impacts from EPA�’s MATS rulemaking.
In recognition of the unusual complexity of regulating NGS, representatives from EPA, including the Assistant Administrator and the Deputy Assistant Administrator for the Office of Air and Radiation and the Regional Administrator for Region 9, visited NGS and affected communities in the area. EPA officials also met with numerous additional stakeholders, at various locations, including EPA offices in San Francisco, CA and Washington, DC, and offices of individual Tribal Governing Councils and at the Inter Tribal Council of Arizona.
iii. Consideration of Federal Collaboration
Following the ANPRM, EPA received comments from other federal agencies that have
authority to oversee interests and activities related to NGS. Reclamation, under the Department of the Interior, is a part-owner of NGS. However, Reclamation and four additional Interior agencies (National Park Service, Bureau of Indian Affairs, Office of Surface Mining, and U.S. Fish and Wildlife Service) also have regulatory authorities relating to NGS or the Kayenta coal mine that serves it. The U.S. Forest Service, an agency within the Department of Agriculture, has authority to protect visibility in the Class I areas in its jurisdiction. EPA has Clean Air Act authority to maintain air quality and improve visibility. The Department of Energy (DOE) Office of Energy Efficiency and Renewable Energy, Office of Indian Energy Policy and Programs, and National Laboratories have technical expertise and other resources related to clean energy development and production in Indian country.
In 2011, DOI entered into an Interagency Agreement with DOE to commission the
National Renewable Energy Laboratory (NREL) to conduct a study with the goal of providing an objective assessment of issues related to the power sector that are important for understanding the potential impacts of BART options for NGS. Under phase 1 of an intended two-phase study, NREL conducted an analysis focusing on the potential effects from costs associated with NOx control options or NGS closure on power and water rates. NREL completed the first part of its study in January 2012 and provided public comments it received on the study to EPA in March 2012.57 In June 2012, NREL completed a final chapter as part of its phase 1 study that provides a high-level examination of alternatives to NGS.58
56 See document titled �“Timeline of All Tribal Consultations on NGS�” in the docket for this proposed rulemaking. 57 See NREL report in the docket for this proposed rulemaking and available at http://www.doi.gov/navajo-gss/index.cfm 58 See NREL Alternatives chapter in the docket for this proposed rulemaking and available at http://www.nrel.gov/docs/fy12osti/54706.pdf

Technical Support Document for NGS Proposed BART Determination, rev. February 11, 2013 | Page 29 of 129
Given the extent of federal and tribal interests in NGS, EPA, DOI, and DOE have
committed to collaborate on several short- and long-term goals, including analyzing and pursuing strategies for providing clean, affordable and reliable power, affordable and sustainable water, and sustainable economic development to key stakeholders who currently depend on NGS.59 The agencies will work together with stakeholders to identify and implement actions that support implementation of BART, including seeking funding to cover expenses for pollution control or other necessary upgrades for the federal portion of NGS. The agencies will also work to jointly support a phase 2 report on NGS clean energy options and work with stakeholders to develop a roadmap for accomplishing the goals described above. Although this collaboration may span several years, EPA expects the alternative strategies resulting from the collaboration would also contribute to reductions in NOx emissions at NGS.
2. Technology Available
A. NGS Approach to This Factor
SRP provided results of a BART engineering and cost analysis for NGS conducted by ENSR|AECOM (now AECOM Environment) dated November 2007. Generally, NOx control techniques utilize 1) combustion control to reduce the production of NOx from fuel-bound nitrogen and from reactions between diatomic nitrogen (N2) and diatomic oxygen (O2) from ambient air during high temperature combustion, 2) post-combustion add-on control to reduce the amount of NOx emitted in flue gas by converting NOx to N2, or 3) a combination of combustion and post-combustion controls. AECOM identified six available retrofit technologies to control NOx, but determined that only three control strategies have been demonstrated to achieve significant reductions on units of the same scale and design as the units at NGS (See
59 See Joint Federal Agency Statement Regarding Navajo Generating Station, dated January 4, 2013, in the docket for this proposed rulemaking.

Technical Support Document for NGS Proposed BART Determination, rev. February 11, 2013 | Page 30 of 129
Table 4). AECOM limited its BART analysis to: combustion controls only, i.e., Low NOx Burners with Separated Overfire Air (LNB/SOFA), and two examples of combustion controls operated with post-combustion controls: LNB/SOFA plus Selective Non-Catalytic Reduction (SNCR), and LNB/SOFA plus Selective Catalytic Reduction (SCR). AECOM identified that application of SCR + LNB/SOFA on all three units at NGS would result in the most stringent level of control, followed by application of SCR + LNB/SOFA on Units 1 and 3 and only LNB/SOFA on Unit 2, application of SNCR + LNB/SOFA on all three units, and lastly application of LNB/SOFA on all three units.

Technical Support Document for NGS Proposed BART Determination, rev. February 11, 2013 | Page 31 of 129
Table 4: Analysis of Available NOx Control Options for NGS Presented by AECOM NOx Control Option Description Technically Feasible?
Low NOx Burners (LNB) and Separated Overfire
Air Systems (SOFA)
Burner modification to stage combustion by controlling air and fuel flow to create fuel-rich/O2-poor conditions in the burner and high temperature zones, and staged combustion
such that excess air in the burner zone is reduced and additional air is added above the burner zone to complete
combustion.
Yes
Flue Gas Recirculation Recirculation of flue gas into the combustion zone to reduce peak flame temperatures to reduce thermal NOx
production.
Has been demonstrated on large units but less effective than other
combustion controls. Selective Noncatalytic
Reduction (SNCR) Ammonia or urea injection without use of a catalyst to
reduce NOx to N2. Yes
Selective Catalytic Reduction (SCR)
Ammonia injection in the presence of a catalyst to reduce NOx to N2.
Yes
ECOTUBE Hybrid of Separated OFA (SOFA) and ammonia or urea injection, where ammonia or urea injected through
retractable lances into the gas flow to improve mixing and combustion characteristics.
No, no existing installations exist on similar type or sized facilities.
Rotating Opposed Firing Air (ROFA) and
ROTAMIX
ROFA modifies OFA by adding rotation to improve mixing with the flue gas. The ROTAMIX system adds urea to the flue gas by injection with boosted air. In the appropriate temperature range, urea reduces NOx to N2.
No, because ROTAMIX has not been demonstrated on large units.
In its BART analysis, AECOM evaluated the three emission control strategies using four different option scenarios (See

Technical Support Document for NGS Proposed BART Determination, rev. February 11, 2013 | Page 32 of 129
Table 5). LNB/SOFA on all three units was evaluated as Option 1 and the Option 1 Alternative. Under Option 1, installation of LNB/SOFA would achieve NOx emissions of 0.24 lb/MMBtu, or 0.20 lb/MMBtu under the Option 1 Alternative. AECOM explains that the Option 1 Alternative represents optimal operation of LNB/SOFA. But AECOM states that such operation may not be possible at NGS because the unique western bituminous coal burned at NGS, and the relatively small boiler size at NGS (affecting residence time for effective staging of combustion) may preclude maximum NOx reductions from LNB/SOFA. SNCR + LNB/SOFA was evaluated as Option 2 and estimated to achieve NOx emissions of 0.20 lb/MMBtu. AECOM states that SNCR has been demonstrated to achieve NOx control efficiencies of 25 �– 50% with NOx inlet concentrations of 300 �– 400 parts per million by dry volume (ppmvd) ppmvd, but only 10 �– 25% for inlet concentrations of less than 150 ppmvd. AECOM�’s Option 3 evaluated LNB/SOFA on Unit 2 and SCR + LNB/SOFA on Units 1 and 3, and Option 4 evaluated SCR + LNB/SOFA on all 3 units. AECOM estimated that SCR + LNB/SOFA would achieve NOx emissions of 0.08 lb/MMBtu. Although SCR can achieve control efficiencies as high as 90% with high inlet NOx concentrations, AECOM explains that if inlet NOx concentrations are below 150 ppmvd, SCR can achieve NOx control efficiencies of only 50 �– 70%.

Technical Support Document for NGS Proposed BART Determination, rev. February 11, 2013 | Page 33 of 129
Table 5: Annual NOx emissions and Projected Emissions (lb/MMBtu) from Control Options as reported by AECOM in November 2007 Submittal to EPA Control Option Control Technology Unit 1 Unit 2 Unit 3
Baseline Good Combustion and Close-Coupled Overfire Air
0.49 0.45 0.46
1 LNB/SOFA (Units 1-3) 0.24 0.24 0.241 Alternative LNB/SOFA (Units 1-3) 0.20 0.20 0.20
2 SNCR+LNB/SOFA (Units 1-3) 0.20 0.20 0.203 LNB/SOFA (Unit 2)
SCR + LNB/SOFA (Units 1, 3)0.08 0.24 0.08
4 SCR + LNB/SOFA (Units 1 �– 3) 0.08 0.08 0.08
B. Discussion of Factor in ANPRM
In our ANPRM, we focused on cost effectiveness and visibility improvement from two NOx control options: SCR+LNB/SOFA, the most stringent level of control, and LNB/SOFA, the least stringent of the three emission control strategies. Although we did not provide detailed information in our ANPRM on all of the technologies discussed by AECOM and its technological feasibility determinations for NOx, the AECOM BART analysis was available for review in the ANPRM docket.
EPA additionally states in the ANPRM that AECOM, in presenting its baseline
emissions, uses the same emission rates as used in its visibility modeling. The BART Guidelines (40 CFR Part 51 Appendix Y) require that the modeling inputs be based on the 24-hour average actual emission rate from the highest emitting day, whereas the cost effectiveness of controls should be based on the baseline annual emissions. Thus, the emission rates used in the modeling should be higher than the baseline annual average emission rate. In our ANPRM, rather than use the baseline values reported by AECOM of 0.45 �– 0.49 lb/MMBtu, for calculating cost effectiveness (in Factor 2 of the BART analysis), we relied on baseline NOx emissions reported to CAMD averaged over 2004 �– 2006 of: 0.35 lb/MMBtu (Unit 1), 0.37 lb/MMBtu (Unit 2), and 0.31 lb/MMBtu (Unit 3).
Finally, in the ANPRM, EPA requested comment on an additional NOx control scenario:
the application of SCR on half of the flue gas from Unit 2, which attempted the address the higher cost of the difficult retrofit of Unit 2 due to space limitations of the coal-feed line on one side of the unit.
C. Affected State, Tribe, and FLM Consultation We did not receive comments from affected States or Tribes on additional NOx control options to consider. In a July 24, 2009 letter to EPA on the BART analysis SRP submitted for NGS, the National Park Service (NPS) determined that SRP evaluated a reasonable suite of options for NOx control and agreed with SRP�’s elimination of FGR, ECOTUBE, and ROFA/ROTOMIX

Technical Support Document for NGS Proposed BART Determination, rev. February 11, 2013 | Page 34 of 129
from additional analysis under BART.60 However, NPS also expressed concern regarding AECOM�’s characterization of baseline emissions used in the cost effectiveness calculation, and stated that a more appropriate baseline emission value, based on average emissions over 2000 �– 2007 from CAMD, was 0.36 lb/MMBtu. NPS additionally commented that AECOM and SRP underestimated the control efficiency of SCR, and stated that its review of emissions data from CAMD suggest a limit of 0.05 lb/MMBtu after installing SCR+LNB/SOFA is appropriate for an annual average limit and for cost effectiveness calculations, a limit of 0.06 lb/MMBtu is appropriate on a 30-day rolling average, and 0.07 lb/MMBtu is appropriate on a 24-hour average basis and for modeling purposes.
D. EPA Conclusions regarding This Factor
For the control of NOx emissions, EPA has determined that AECOM has identified the main technically feasible control technologies. Although the AECOM BART analysis submitted by SRP for NGS does not list all of the available technologies identified in the BART analysis for Four Corners Power Plant, e.g., LoTOx, THERMALONOX, and natural gas reburn, all of the missing technologies were determined technically infeasible for large units. Because the three 750 MW units at NGS are rated to the same capacity as Units 4 and 5 at Four Corners Power Plant, EPA has determined that the available technologies not listed in the AECOM BART analysis would similarly be technically infeasible for NGS. On January 20, 2012, SRP submitted an updated BART analysis to EPA.61 In our 2009 ANPRM, EPA had focused on two control technologies, SCR, the most stringent control technology, and LNB/SOFA, the technology SRP recommended as BART. EPA did not address SNCR in the ANPRM because visibility modeling results provided by SRP in its original 2009 BART analysis indicated SNCR would degrade visibility at some Class I areas under certain conditions because of the ammonia slip associated with the SNCR.62 In its updated 2012 BART submittal, SRP reexamined SNCR and suggested that SNCR could achieve better emission rates than originally projected (0.15 �– 0.18 lb/MMBtu instead of 0.20 lb/MMBtu), and the ammonia slip would be significantly lower than originally modeled because the wet scrubbers would provide 90 �– 99% control of the unreacted ammonia. In an April 6, 2012 letter to EPA, the National Park Service (NPS) expressed concern that the effectiveness of SNCR cited in the NREL report (and consistent with the 2012 SRP submittal) is potentially overestimated. NPS reported that based on its review of 126 coal-fired units with SNCR installed and in operation, only 29 units (23%) achieved NOx emission rates in the range estimated by SRP and NREL (0.14 �– 0.18 lb/MMBtu), and that only 5 units (4%) were of a comparable size to NGS. In spring 2012, SRP conducted testing of a temporary SNCR system and determined that at NGS, it expects SNCR to be able to achieve better than 0.18 lb/MMBtu, to meet a limit of 0.20 lb/MMBtu.63 EPA�’s analyses for cost effectiveness and modeling64 evaluated SNCR at 0.15 and
60 Letter from John Bunyak, National Park Service, to Deborah Jordan, EPA on July 24, 2009. This letter was submitted to EPA just prior to EPA�’s August 2009 Advanced Notice of Proposed Rulemaking. See document number 0017 in docket for ANPRM: EPA-R09-OAR-2009-0598. 61 See Letter from Kelly Barr, Esq., SRP, to Dr. Deborah Jordan, EPA, regarding �“Updated Best Available Retrofit Technology Analysis �– Navajo Generating Station�”, dated January 20, 2012, in the docket for this rulemaking. 62 See page ES-2 of the BART Analysis for the Navajo Generating Station Units 1 �– 3, Prepared for Salt River Project �– Navajo Generating Station by ENSR|AECOM, Document Number 05830-012-300, November 2007. 63 Letter from Kelly J. Barr, SRP to Deborah Jordan, EPA dated July 20, 2012.

Technical Support Document for NGS Proposed BART Determination, rev. February 11, 2013 | Page 35 of 129
0.18 lb/MMBtu, however, for simplicity and clarity in this TSD, we only include results for SNCR at 0.18 lb/MMBtu. In January 2012, URS Corporation contacted EPA regarding FMC PerNOxide, a technology that uses hydrogen peroxide to oxidize NOx into compounds that can be captured by a downstream wet scrubber to achieve approximately 50% control of NOx. Information from URS Corporation suggests that PerNOxide can be used in combination with SNCR to achieve a control level of approximately 63%.65 However, PerNOxide relies on certain chemical conditions in the wet scrubber to remove oxidized nitrogen species formed from the reaction of nitrogen monoxide and hydrogen peroxide. EPA understands from URS Corporation that the forced oxidation limestone scrubbers at NGS are not ideal for PerNOxide. In addition, PerNOxide is a technology that has not been demonstrated in practice; therefore, EPA is not including additional information on PerNOxide in our BART analysis for NGS.66 In conducting our BART analysis for NGS, we present cost and modeling results for various scenarios, including a baseline scenario that considers the 2001 �– 2003 period as the baseline and three scenarios for the installation of air pollution controls: LNB/SOFA (which were installed over the 2009 �– 2011 period), SNCR+LNB/SOFA, and SCR+LNB/SOFA. Subsequent to the publication of the ANPRM, in a letter dated August 18, 2010, SRP submitted an updated SCR cost study generated by Sargent & Lundy (S&L). The cost report, discussed in greater detail in Section 3 of this TSD titled Factor 1: Cost of Compliance, includes a discussion of the SCR engineering design characteristics, and states that the SCR system was designed to achieve approximately 0.05 lb/MMBtu under ideal operating conditions in order to ensure compliance with an emission limit of 0.07 - 0.08 lb/MMBtu on a 30-day rolling average. The S&L report states that the margin is provided between the design target and the NOx limit to allow for normal operating fluctuations associated with minor equipment upsets, fuel characteristics impacting NOx generation, and SCR process delays due to load changes. S&L designed the SCR system for each unit to be a 2+2 design, i.e., four-catalyst layer design with two layers loaded with catalyst initially, that uses ultra-low SO2 to SO3 conversion catalysts that limit SO2 to oxidation to less than 0.5% across the SCR reactor. EPA requested information from Hitachi Power Systems regarding guaranteed levels of NOx control and SO2 oxidation from their CX catalyst series.67 Hitachi stated that it could guarantee a reactor system to comply with a NOx emission limit of 0.08 lb/MMBtu with a 2+1 design with an SO2 to SO3 oxidation rate of less than 0.4% for the first 16,000 hours of performance. After the first 16,000 hours of SCR operation, the third catalyst layer would be deployed to maintain NOx performance with an SO2 oxidation rate of 0.5%. Hitachi explains that the SCR system could operate an additional 4 or more years before an original catalyst layer must be replaced. After this time, catalyst layers would be replaced on 2-4 year intervals.
64 See documents titled �“NGS emissions and incremental costs�” and �“NGS_RHFIP_vis_tables.xlsx�” in the docket for this proposed rulemaking. 65 See �“FMC PerNOxide Process: Example Case and Economics�”, dated January 19, 2012, in the docket for this proposed rulemaking. 66 Similarly, EPA was contacted by representatives of APTECH CST, LLC regarding NGS. EPA understands that this technology for reducing NOx emissions has not been demonstrated in practice on units of a similar size to NGS, therefore, EPA is not including additional information on the technologies offered by APTECH CST in our BART analysis for NGS. 67 March 7, 2011 email from Stephen Guglielmo, Hitachi Power Systems America, to Anita Lee, EPA.

Technical Support Document for NGS Proposed BART Determination, rev. February 11, 2013 | Page 36 of 129
Facilities using SCR typically develop a catalyst management plan to keep track of catalyst change out. With a 3+1 design, Hitachi can guarantee a system to comply with a NOx emission limit of 0.05 lb/MMBtu, on a 30-day rolling average, with an SO2 oxidation rate of 0.5%. After 16,000 to 24,000 hours of operation, the additional layer of catalyst would be installed to continue to meet the NOx performance level, but with a rate of SO2 oxidation that is higher by less than 0.2%.68 Hitachi additionally stated that its reactors are designed based on the required NOx performance at the end of the guarantee period, therefore, a guarantee of 0.05 lb/MMBtu would not require an additional compliance margin for the emission limit. EPA understands that Units 1 �– 3 at NGS currently operate on a 3-year outage cycle (with either a major or minor outage on one unit every year). Based on the information provided by Hitachi, EPA believes that NGS can maintain its current 3-year outage cycle if an SCR system with 3 or 4 layers of catalyst were installed and operated on all three units. EPA received numerous comments on our proposed BART determination for the Four Corners Power Plant (see docket EPA-R09-OAR-2010-0683) that our proposed emission limit of 0.098 lb/MMBtu for Units 4 and 5 under the alternative emission control strategy, representing an 80% reduction in emissions, was not stringent enough, and that several coal-fired power plants have achieved emission rates of 0.05 lb/MMBtu or better. Additionally, commenters point to the final BART limit for NOx for the San Juan Generating Station of 0.05 lb/MMBtu on a rolling 30-boiler-operating-day average. Commenters also point to Units 7 and 8 at the WA Parish coal-fired power plant in Texas, which are tangential-fired boilers equipped with advanced combustion controls and SCR that have achieved NOx emission rates consistent with the vendor guarantee of 0.03 lb/MMBtu. However, the Parish units do not achieve 0.03 lb/MMBtu on a consistent basis, and this limit is achieved under a cap and trade program, rather than as required under individual emission limits. In our response to comments on FCPP, EPA noted that the coal-fired units at Parish (units 5 �– 8), equipped with advanced LNB/OFA systems, based on CAMD data from 2001 and 2002, typically achieved 0.14 �– 0.18 lb/MMbtu.69 Following installation with SCR, a vendor guarantee of 0.03 lb/MMBtu represents a 79 �– 83% reduction in NOx emissions, and based on the more typical emission rates of around 0.05 lb/MMBtu from the Parish Units 5 �– 8, the percent NOx reduction ranges from approximately 64 �– 72%. At NGS, after installation of modern combustion controls over 2009 �– 2011, Units 1 �– 3 must meet a permitted emission limit of 0.24 lb/MMBtu. If Units 1 �– 3 at NGS were required to meet a NOx emission limit of 0.08 or 0.05 lb/MMBtu, these limits would represent a 67 �– 77% reduction in NOx from levels achieved using combustion controls, which is generally consistent with reduction efficiencies achieved at the WA Parish units. EPA concludes that SCR + LNB/SOFA is the most stringent NOx control option available for NGS and that the SCR system can be designed to comply with an emission limit of 0.08 or 0.05 lb/MMBtu on a rolling 30-boiler-operating-day average. For clarity in compliance and enforcement, we are using two significant figures when we refer to the emission limit for SCR, therefore, a rate of 0.05 lb/MMBtu is being expressed throughout this document as 0.055 lb/MMBtu. EPA expects that a limit of 0.055 lb/MMBtu will provide an adequate compliance
68 EPA estimates that each catalyst layer represents an SO2 oxidation rate of 0.167%, based on a guarantee from Hitachi of 0.5% oxidation from 3 layers of catalyst. 69 See spreadsheets in document 0236 in Four Corners Power Plant BART docket: EPA-R09-OAR-2010-0683, e.g., �“WA Parish CAMD Monthly 2001-2010�”.

Technical Support Document for NGS Proposed BART Determination, rev. February 11, 2013 | Page 37 of 129
margin for normal operational fluctuations. For the higher rate of 0.08 lb/MMBtu, we are considering this rate at 0.080 lb/MMBtu. EPA anticipates that the use of three versus four layers of catalyst would result in different costs of compliance, different impacts to sulfuric acid emissions, and different impacts to the anticipated visibility improvement from controls. Therefore, EPA evaluated three layers of catalyst to achieve 0.08 lb/MMBtu separately from four of catalyst to achieve 0.055 lb/MMBtu in our factor analysis.
3. Factor 1: Costs of Compliance
In assessing the cost of compliance, the analyses by AECOM and S&L examined the total and annual costs of the control technologies, as well as the cost effectiveness of controls, in terms of 2008 or 2010 dollars per ton of pollutant removed ($/ton) and cost of the visibility improvement, in terms of dollars per average deciview improvement ($/dv). The cost effectiveness of controls should be calculated using emissions based on an annual average emission rate, whereas the degree of visibility improvement should be calculated using emissions based on the highest 24-hour emission rate.70 In this section, we will discuss the estimates of total and annual cost of controls and the cost effectiveness of controls. We discuss visibility improvement from controls in Section 7.
A. NGS Approach to This Factor Prior to ANPRM
AECOM provided cost estimates for control options in its November 2007 BART analysis. SRP submitted to EPA updated cost studies by S&L for SNCR and SCR in 2008. The S&L cost estimates are not based on or equivalent to the EPA Control Cost Manual. The BART Guidelines recommend that cost estimates be based on the OAQPS Control Cost Manual (now known as the EPA Control Cost Manual), where possible, in order to maintain and improve consistency of cost estimates, and require documentation for any information supplied by vendors that affects assumptions regarding elements that differ from the Control Cost Manual. However, the BART Guidelines also recommends taking into account any site-specific design or other conditions identified above that affect the cost of a particular BART technology option. Table 6 lists the total capital and total annual costs provided by AECOM in its January 2009 Revised BART Analysis, and EPA�’s calculation of the percent NOx reduction and the cost effectiveness ($/ton), calculated by dividing the annual cost ($/year) by the NOx emissions reductions (ton NOx/year) based on the information provided by AECOM.
70 Appendix Y to 40 CFR Part 51, �“Guidelines for BART Determinations Under the Regional Haze Rule�” IV.D.4.b. and IV.D.5.; �“Regional Haze Regulations and Guidelines for Best Available Retrofit Technology (BART) Determinations; Final Rule�”, 70 FR 39170, July 6, 2005

Technical Support Document for NGS Proposed BART Determination, rev. February 11, 2013 | Page 38 of 129
Table 6: AECOM and S&L Capital and Annual Cost Estimates, Percent Emissions Reductions, and Cost Effectiveness for NOx Controls (from January 2009 revised BART analysis)71
Option (#) Cost or Cost Effectiveness Unit 1 Unit 2 Unit 3
Baseline Rate 0.49 lb/MMBtu 0.45 lb/MMBtu 0.46 lb/MMBtu SCR + LNB/SOFA (Units 1 – 3) (Option 4)
Total Capital Investment ($) $212,000,000 $281,000,000 $212,000,000 Total Annual Cost ($/yr) $28,951,500 $36,945,000 $28,951,500
Expected Emission (lb/MMBtu) 0.08 0.08 0.08 % NOx Reduction from Baseline 84% 82% 83%
TPY NOx Reduced72 12,500 12,650 11,795 Cost Effectiveness ($/ton) $2,316 $2,921 $2,455
LNB/SOFA on Unit 2, LNB/SOFA + SCR on Units 1 and 3 (Option 3)
Total Capital Investment ($) $212,000,000 $14,000,000 $212,000,000 Total Annual Cost ($/yr) $28,951,500 $1,622,000 $28,951,500
Expected Emission (lb/MMBtu) 0.08 0.24 0.08 % NOx Reduction from Baseline 84% 47% 83%
TPY NOx `Reduced 12,500 7,180 11,795 Cost Effectiveness ($/ton) $2,316 $226 $2,455
LNB/SOFA + SNCR on Units 1 – 3 (Option 2)
Total Capital Investment ($) $26,000,000 $26,000,000 $26,000,000 Total Annual Cost ($/yr) $8,809,333 $8,809,333 $8,809,333
Expected Emission (lb/MMBtu) 0.20 0.20 0.20 % NOx Reduction from Baseline 59% 56% 57%
TPY NOx Reduced 8,842 8,547 8,070 Cost Effectiveness ($/ton) $996 $1,031 $1,092
LNB/SOFA on Units 1 – 3 (Option 1a)
Total Capital Investment ($) $14,000,000 $14,000,000 $14,000,000 Total Annual Cost ($/yr) $1,622,000 $1,622,000 $1,622,000
Expected Emission (lb/MMBtu) 0.20 0.20 0.20 % NOx Reduction from Baseline 59% 56% 57%
TPY NOx Reduced 8,842 8,547 8,070 Cost Effectiveness ($/ton) $183 $190 $201
LNB/SOFA on Units 1 – 3 (Option 1)
Total Capital Investment ($) $14,000,000 $14,000,000 $14,000,000 Total Annual Cost ($/yr) $1,622,000 $1,622,000 $1,622,000
Expected Emission (lb/MMBtu) 0.24 0.24 0.24 % NOx Reduction from Baseline 51% 47% 48%
TPY NOx Reduced 7,622 7,180 6,829 Cost Effectiveness ($/ton) $213 $226 $238
B. Discussion of Factor in ANPRM In our ANPRM, we presented two sets of capital and annual cost estimates for
SCR+LNB/SOFA �– costs estimated by S&L and presented in the AECOM revised BART analysis, and costs estimated by the National Park Service (NPS) using the EPA Control Cost Manual (Table 9). NPS provided cost estimates using the EPA Control Cost Manual because the BART guidelines state that �“[i]n order to improve consistency, cost estimates should be based on
71 The cost estimates presented in the November 2007 BART Analysis were amended in a July 29, 2008 letter from Kevin Wanttaja, Manager of Environmental Services at SRP to Deborah Jordan, EPA Region IX Air Division Director. Costs for LNB/SOFA were revised from $10 million to $14 million per unit, which would increase all total capital cost figures from the November 2007 BART Analysis by an additional $12 million. The cost estimates in Table 12 represent the revised costs for all control scenarios. These revised costs are reflected in AECOM�’s January 2009 Revised BART Analysis for NGS. 72 EPA estimated ton per year (tpy) NOx reductions using baseline and controlled emissions as reported by AECOM, and used average 2001 �– 2003 heat input and operating hours reported to CAMD for each unit. However, as we stated in the ANPRM, EPA believes average, not maximum, baseline emissions should be used in calculating cost effectiveness.
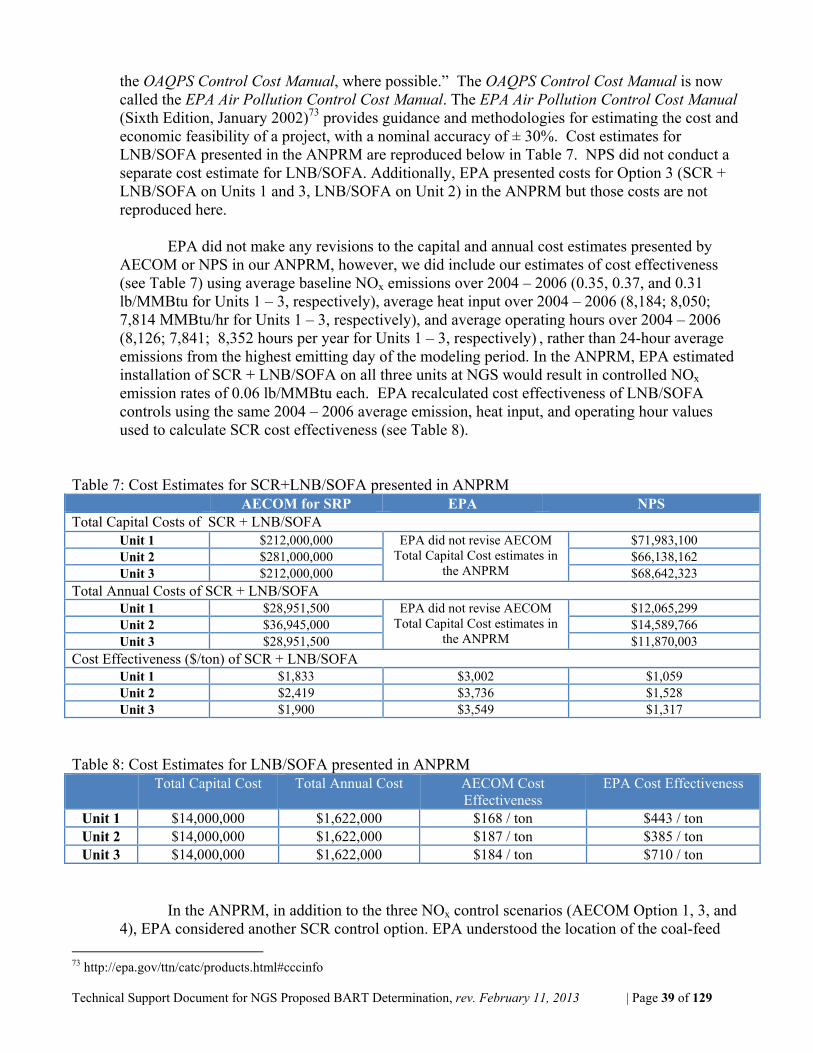
Technical Support Document for NGS Proposed BART Determination, rev. February 11, 2013 | Page 39 of 129
the OAQPS Control Cost Manual, where possible.�” The OAQPS Control Cost Manual is now called the EPA Air Pollution Control Cost Manual. The EPA Air Pollution Control Cost Manual (Sixth Edition, January 2002)73 provides guidance and methodologies for estimating the cost and economic feasibility of a project, with a nominal accuracy of ± 30%. Cost estimates for LNB/SOFA presented in the ANPRM are reproduced below in Table 7. NPS did not conduct a separate cost estimate for LNB/SOFA. Additionally, EPA presented costs for Option 3 (SCR + LNB/SOFA on Units 1 and 3, LNB/SOFA on Unit 2) in the ANPRM but those costs are not reproduced here.
EPA did not make any revisions to the capital and annual cost estimates presented by
AECOM or NPS in our ANPRM, however, we did include our estimates of cost effectiveness (see Table 7) using average baseline NOx emissions over 2004 �– 2006 (0.35, 0.37, and 0.31 lb/MMBtu for Units 1 �– 3, respectively), average heat input over 2004 �– 2006 (8,184; 8,050; 7,814 MMBtu/hr for Units 1 �– 3, respectively), and average operating hours over 2004 �– 2006 (8,126; 7,841; 8,352 hours per year for Units 1 �– 3, respectively) , rather than 24-hour average emissions from the highest emitting day of the modeling period. In the ANPRM, EPA estimated installation of SCR + LNB/SOFA on all three units at NGS would result in controlled NOx emission rates of 0.06 lb/MMBtu each. EPA recalculated cost effectiveness of LNB/SOFA controls using the same 2004 �– 2006 average emission, heat input, and operating hour values used to calculate SCR cost effectiveness (see Table 8).
Table 7: Cost Estimates for SCR+LNB/SOFA presented in ANPRM AECOM for SRP EPA NPS
Total Capital Costs of SCR + LNB/SOFA Unit 1 $212,000,000 EPA did not revise AECOM
Total Capital Cost estimates in the ANPRM
$71,983,100 Unit 2 $281,000,000 $66,138,162 Unit 3 $212,000,000 $68,642,323
Total Annual Costs of SCR + LNB/SOFA Unit 1 $28,951,500 EPA did not revise AECOM
Total Capital Cost estimates in the ANPRM
$12,065,299 Unit 2 $36,945,000 $14,589,766 Unit 3 $28,951,500 $11,870,003
Cost Effectiveness ($/ton) of SCR + LNB/SOFAUnit 1 $1,833 $3,002 $1,059 Unit 2 $2,419 $3,736 $1,528 Unit 3 $1,900 $3,549 $1,317
Table 8: Cost Estimates for LNB/SOFA presented in ANPRM Total Capital Cost Total Annual Cost AECOM Cost
EffectivenessEPA Cost Effectiveness
Unit 1 $14,000,000 $1,622,000 $168 / ton $443 / tonUnit 2 $14,000,000 $1,622,000 $187 / ton $385 / tonUnit 3 $14,000,000 $1,622,000 $184 / ton $710 / ton
In the ANPRM, in addition to the three NOx control scenarios (AECOM Option 1, 3, and 4), EPA considered another SCR control option. EPA understood the location of the coal-feed
73 http://epa.gov/ttn/catc/products.html#cccinfo

Technical Support Document for NGS Proposed BART Determination, rev. February 11, 2013 | Page 40 of 129
line and physical layout of Unit 2 to result in higher capital and annual cost estimates for installing SCR on Unit 2. Therefore, EPA requested comment on installation of SCR to half of the Unit 2 flue gas because as currently configured, the flue gas is already split with each half containing its own separate hot-side electrostatic precipitator (HS-ESP) and flue gas desulfurization unit (FGD). Because EPA anticipated the coal line would not need to be relocated under the �“half-SCR�” option, EPA estimated half-SCR on Unit 2 to require a total capital investment of $106 million, a total annual cost of $14.5 million, with a cost-effectiveness of $2,000/ton. Finally, in the ANPRM, EPA also estimated the increase in electricity generation costs from NOx controls at NGS in terms of dollar per kilowatt-hour ($/kWh). In this TSD, we discuss increased electricity generation costs under Factor 3 �– Energy and Non-Air Quality Impacts (See Section 4).
C. Affected State, Tribe and FLM Consultation
The Arizona Department of Environmental Quality (ADEQ)74 commented that it is inappropriate to include projected costs of controls to consumers in our BART analysis without a description of the unusual circumstances that justify consideration of these costs. Additionally, ADEQ commented that the BART guidelines do not strictly require use of the EPA Control Cost Manual and allow companies to use other sources, such as vendor estimates, when appropriate, that EPA should include an analysis of incremental costs of controls, and that EPA should address the additional cost associated with the use of an ultra-low conversion catalyst.
The Navajo Nation75 recommended that EPA accept the cost estimates provided by SRP because the costs appeared to fall within the scope of the BART guidelines. The Navajo Nation and the Hopi Tribe76 both recommended that EPA include an incremental cost analysis because of the potential importance the high incremental costs of SCR may have on the final BART determination. The Hopi Tribe also noted that the cost estimates did not include the costs of potential releases of ammonia during transportation and storage. NPS77 commented that based on data from the EPA Clean Air Markets Division, SCR retrofits can result in controlled emissions of 0.05 lb/MMBtu. Therefore, NPS recommended setting NOx limits of 0.07 lb/MMBtu on a 24-hour basis, 0.06 lb/MMBtu on a 30-day rolling basis, and 0.05 lb/MMBtu on an annual average basis. NPS recommended using an annual average limit of 0.05 lb/MMBtu for determining cost effectiveness. Additionally, NPS commented that the EPA Control Cost Manual should be the primary source for developing cost analyses that are transparent and consistent, and that without vendor quotes or adequate justification for its cost estimates NPS concluded that the capital and annual costs were overestimated when comparing typical dollar per kilowatt ($/kW) costs from a survey of SCR cost data. SRP78 commented that the cost estimates developed by NPS using the EPA Control Cost Manual are underestimated and fail to consider current-day market prices and unique configuration and erection challenges at NGS. Additionally, in response to EPA�’s request for
74 Letter dated October 28, 2009 from Benjamin Grumbles, ADEQ to EPA Docket Center. 75 Letter dated March 1, 2010 from President Joe Shirley, Jr., Navajo Nation, to Anita Lee, EPA. 76 Letter dated March 1, 2010 from Chairman Leroy Shingoitewa, Hopi Tribal Council to Jared Blumenfeld, EPA. 77 Letter dated July 24, 2009 from John Bunyak, National Park Service, to Deborah Jordan, EPA. 78 Letter dated October 28, 2009 from Richard Hayslip, Salt River Project, to Anita Lee, EPA.

Technical Support Document for NGS Proposed BART Determination, rev. February 11, 2013 | Page 41 of 129
comment on potential installation of SCR on half of the flue gas on Unit 2, SRP commented that this option would not work due to engineering difficulties associated with maintaining similar pressures and temperatures between the split flues from Unit 2. SRP further recommended that EPA account for potential costs associated with Best Available Control Technology (BACT) requirements under the Prevention of Significant Deterioration (PSD) permitting program that might be triggered if SCR caused a significant emissions increase (greater than 7 tons per year) of sulfuric acid mist. SRP stated that if there is chance that sorbent injection would be determined BACT for sulfuric acid mist, EPA should consider the cost of sorbent injection as well as downstream impacts of this technology triggering the additional need for a new polishing baghouse to control the increase in PM resulting from the sorbent injection. Finally, SRP commented that EPA�’s use of 0.06 lb/MMBtu as the NOx emission limit for the cost effectiveness calculations and modeling was inappropriate because the original SCR design was for 2+1 reactor to meet an emission limit of 0.08 lb/MMBtu. To meet an emission limit of 0.06 lb/MMBtu, SRP stated that a 3+1 reactor and would increase capital costs by $10 million per unit. On August 18, 2010, SRP submitted a revised cost estimate report generated by S&L to EPA that provided updated costs for SCR (in 2010 dollars), costs for SCR plus dry sorbent injection (DSI) to control sulfuric acid mist emissions, and costs for SCR plus DSI plus new polishing baghouses. S&L explained that the SCR would be designed as a 2+2 reactor to achieve an actual NOx emission rate of approximately 0.05 lb/MMBtu to ensure compliance with an anticipated NOx emission limit of 0.07 �– 0.08 lb/MMBtu on a 30-day rolling average basis. S&L states that the 40 �– 60% margin of compliance is provided to allow for normal operating fluctuations associated with minor equipment upsets, fuel characteristics that impact NOx formation, and SCR process delays due to load changes. The design and cost estimates for the SCR system include use of ultra low SO2 to SO3 conversion catalysts that will limit SO2 oxidation to below 0.5% across the reactor. The 2010 revised cost estimates for SCR, and the cost estimates provided for SCR plus downstream sulfuric acid and particulate matter controls, are provided in Table 9.
Table 9: 2010 Capital and Annual Cost Estimates for SCR and Additional Pollutant Controls Estimated by S&L for SRP Capital Costs SCR only SCR + DSI SCR + DSI + Baghouse
Unit 1 $151,825,000 $154,946,000 $372,184,000Unit 2 $205,808,000 $209,324,000 $410,919,000Unit 3 $186,528,000 $189,772,000 $347,869,000Total $544,161,000 $554,042,000 $1,130,972,000
Annual Cost Unit 1 $21,579,000 $22,215,000 $50,014,000Unit 2 $27,835,000 $28,518,000 $54,504,000Unit 3 $25,601,000 $26,252,000 $47,196,000Total $75,015,000 $76,985,000 $151,714,000
The 2010 cost estimates generated by S&L for SCR are lower than previous cost estimates. S&L states that costs estimates for the SCR decreased from earlier studies because its most recent 2010 analysis showed that new or upgraded induced draft fan motors and auxiliary power systems would not be required to support the new SCR system. Additionally, the 2010 cost estimates do not include costs for LNB/SOFA (which were voluntarily installed by the

Technical Support Document for NGS Proposed BART Determination, rev. February 11, 2013 | Page 42 of 129
owners of NGS over the 2009 �– 2011 period). On November 20, 2008, EPA issued a final PSD permit to NGS to allow the installation of LNB/SOFA on all three units over 2009 �– 2011. The installation of LNB/SOFA is discussed further in Section 5 of this TSD. Unlike previous cost estimates from S&L, the 2010 costs for Unit 3 also include common costs associated with all three units. On January 20, 2012, SRP submitted revised cost information for LNB/SOFA and SNCR (see Table 10). The updated SRP cost information for SNCR included total facility-wide capital costs and annual O&M and total annual costs. SRP did not provide unit-specific cost information, therefore, EPA assumed in our analysis that total facility-wide LNB/SOFA and SNCR costs would be divided equally between the three units. On March 16, 2012, SRP provided additional information on the SNCR cost estimate, including more detail than was originally provided in the January 20, 2012 SRP submittal on specific capital and annual costs for SNCR.79 On March 23, 2012, SRP submitted additional detail on its estimate for the cost of dry urea, which is almost 80% of the total annual cost of SNCR.80
Table 10: Revised SNCR and LNB/SOFA Cost Estimates from SRP in 2012 Unit 1 Unit 2 Unit 3 Total
LNB/SOFA Total Capital Cost $15,000,000 $15,000,000 $15,000,000 $45,000,000
Annual O&M Costs 0 0 0 0Total Annual Costs $1,738,000 $1,738,000 $1,738,000 $5,214,000
SNCR Total Capital Cost $13,066,667 $13,066,667 $13,066,667 $39,200,000
Annual O&M Costs $6,333,333 $6,333,333 $6,333,333 $19,000,000Total Annual Costs $7,847,333 $7,847,333 $7,847,333 $23,542,000
SNCR+LNB/SOFA (calculated by EPA as the sum of LNB/SOFA and SNCR, above) Total Capital Cost $28,066,667 $28,066,667 $28,066,667 $84,200,000
Annual O&M Costs $6,333,333 $6,333,333 $6,333,333 $19,000,000Total Annual Costs $9,585,333 $9,585,333 $9,585,333 $28,756,000
In its 2010 report, S&L did not directly calculate cost effectiveness of controls, however in its 2012 submittal, SRP did calculate average and incremental cost effectiveness of LNB/SOFA, SNCR at two different emission levels, SCR, and SCR+baghouses. Table 11 shows average and incremental cost estimates calculated by SRP in its 2012 Revised BART Analysis. SRP calculated incremental costs of SNCR against LNB/SOFA, and calculated incremental cost of SCR against the costs of both SNCR cases. Although not explicitly stated in SRP�’s 2012 Revised BART Analysis, it appears that the incremental cost of SCR+baghouses are also calculated against both SNCR cases. Incremental cost is calculated by dividing the difference between total annual costs of two control options (numerator) by the difference between total tons of pollutant reduced of the same two control options (denominator). It appears SRP only included NOx emissions in its average and incremental cost calculations for the SCR+baghouse
79 See document titled �“Email from Grant Smedley, SRP 3-16-12_plus attachments.pdf�” in the docket for this proposed rulemaking. 80 See document titled �“Email from Grant Smedley, SRP 3-23-12 Urea cost breakdown.pdf�” in the docket for this proposed rulemaking.
Technical Support Document for NGS Proposed BART Determination, rev. February 11, 2013 | Page 43 of 129
control case. EPA notes that baghouses do not provide NOx control, and if installed at NGS, would provide control of filterable and condensable particulate matter (including sulfuric acid mist), and mercury, and would not be associated with BART. Therefore, EPA believes SRP�’s inclusion of an SCR+baghouse scenario is not correct.
EPA does not consider dry sorbent injection (DSI) or DSI plus baghouses as costs related to BART compliance. EPA cannot anticipate what a future control technology determination for sulfuric acid mist under PSD or Tribal Minor NSR might require, and the BART Guidelines do not require the inclusion of potential future costs that might be associated with pre-construction permit requirements into the cost estimates for BART. EPA has determined that it is inappropriate to include the cost of DSI and baghouses into our BART cost analysis; however, we do provide some sensitivity discussion of the cost of baghouses, if they needed to comply with MATS, in our affordability analysis (See Section 6 of this TSD).
Table 11: Cost Effectiveness Calculated by SRP, as reported in its 2012 Revised BART Analysis LNB/SOFA SNCR
(0.18 lb/MMBtu)SCR SCR+Baghouses
Average Cost Effectiveness
$519/ton $1,481/ton $2,926/ton $5,918/ton
Incremental Cost Effectiveness
$519/ton $3,135/ton $5,282/ton $13,153/ton
D. EPA Conclusions Regarding This Factor EPA contracted with EC/R Incorporated to conduct a detailed comparison of the capital and annual cost estimates presented by S&L against the EPA Control Cost Manual. The spreadsheets are included in the docket for this proposed rulemaking.81 In general, as recommended by the Navajo Nation, EPA relied on SRP�’s own cost estimates, with the exception of any line item costs that are not explicitly included in the EPA Control Cost Manual (CCM) or where EPA determined alternate costs were more appropriate, e.g., interest rates.82 See Table 12 for the list of revisions EPA made to the cost estimates from SRP.
Table 12: Summary of EPA Revisions to S&L Cost Inputs for SCR on Unit 283
S&L/ SRP EPA Revision EPA Rationale for Revision Owners Construction
Management, O&M Support, Contract Services
$8,163,050 $0 These costs are not included in the CCM and are not included in the revised cost estimate.
Owners Legal Support and Insurance
$5,000,000 $0 CCM does not include legal fees, and states that insurance on an SCR system is a minimal cost and is
included in the capital recovery. Allowance for Funds Used
During Construction (AFUDC)
$4,059,526 $0 CCM sets AFUDC to zero for the retrofit of a SCR.
Interest Rate 9.8% 7% CCM uses 7% interest rate.
81 See spreadsheet titled �“EPA Cost Analysis for NGS.xlsx�” in the docket for this proposed rulemaking. 82 See http://www.whitehouse.gov/omb/circulars_a004_a-4/#e 83 Details for each unit are included in the EPA Cost Analysis spreadsheet. Unit 2 is simply used as an example in this TSD.

Technical Support Document for NGS Proposed BART Determination, rev. February 11, 2013 | Page 44 of 129
EPA generated revised cost estimates based on the comparison of the 2010 S&L cost estimates against the EPA Control Cost Manual. The line item costs EPA revised are listed in Table 12, and the revised capital and annual cost estimates, and estimates of cost effectiveness are shown in Table 13. EPA calculated the cost effectiveness of SCR assuming an emission limit of 0.055 lb/MMBtu. EPA�’s revised total capital costs for SCR on all three units is approximately 9% lower than S&L�’s cost estimate, and the total annual cost for SCR on all three units is 22% lower. The larger difference between annual costs estimated by EPA and S&L is primarily a result of the lower interest rate (7%) used by EPA compared to the rate assumed by S&L (9.8%). EPA did not adjust the annual O&M cost estimate (which does not include annualized cost of capital) by S&L. Annual costs reported in Table 13 below represent the sum of the annual O&M cost for each unit and EPA�’s calculation of the annualized cost of capital.
Table 13: EPA Revisions to Cost Estimates for SCR (2010 dollars) SCR Only SCR+LNB/SOFA Total Capital Cost Total Annual Cost Total Capital Cost Total Annual Cost
Unit 1 $137,527,000 $16,963,576 $152,527,000 $18,701,576 Unit 2 $188,585,000 $21,783,090 $203,585,000 $23,521,090 Unit 3 $170,294,000 $20,056,549 $185,294,000 $21,794,549 Total $496,406,000 $58,803,215 $541,406,000 $64,017,215
The NREL report commissioned by DOI relies on capital and annual cost estimates for SCR from S&L and the National Park Service (NPS) to �“establish high and low bounds of a plausible range of future SCR costs�” for NGS.84 The NPS cost estimates rely on �“the Modified Cost Manual Approach developed by EPA and incorporates several inputs provided by Navajo GS operating partner SRP�”. NPS cost estimates for SCR on Units 1 �– 3 ranged from $134 million to $177 million, totaling $465 million on all three units. Our cost estimate for SCR on all units at NGS is over $30 million higher than the NPS cost estimate reported by NREL (see Table 3-6 of the NREL study). SCR cost estimates from S&L reported by NREL are identical to those we present in Table 9 above for Units 1 and 2, however, NREL cost estimates for Unit 3 ($188.25 million) differs slightly than estimates from S&L and in Table 9 ($186.5 million). NREL reports total capital costs from the S&L study to equal $545.88 million, whereas the S&L study estimates total capital costs of SCR to equal $544.16 million. Our cost estimate for SCR on all units at NGS is roughly $48 million lower than the cost estimate from S&L. The NREL report describes the NPS and S&L capital cost estimates to represent a plausible range for SCR. EPA�’s total capital cost estimate for SCR at NGS is within this plausible range. The NREL report also relied on annual O&M costs (not including annualized capital costs) from NPS and S&L. The annual O&M costs for SCR on Units 1 �– 3 at NGS from NPS were nearly $5 million higher (40% higher) than the S&L annual O&M costs. NPS�’s higher estimate for annual O&M costs results mainly from higher estimated annual maintenance costs.85 EPA used cost estimates for annual O&M costs from S&L. To calculate annualized capital costs, NPS applied a 7% interest rate, and the S&L study applied a 9.8% interest rate. In its economic analysis, NREL applied interest (discount) rates that were specific to each owner, i.e., 5% for Reclamation�’s share (through an assumed municipal bond issued by CAWCD), 6% for LADWP,
84 See Table 3-6 and explanatory text on page 47 of NREL report. 85 See the three �“updated NPS SCR modified cost manual approach�” excel spreadsheets in the docket for this rulemaking.

Technical Support Document for NGS Proposed BART Determination, rev. February 11, 2013 | Page 45 of 129
approximately 8% for the investor-owned utilities (APS, NV Energy, and TEP), and 9.8% for SRP.86 NREL states that the rate provided by SRP includes a risk premium. As discussed above, for the purposes of calculating cost effectiveness, EPA applied an interest rate of 7%, which is recognized as the appropriate interest rate for EPA control cost analyses and was used in the Regulatory Impact Analysis for the BART Guidelines.87 Our application of a 7% interest rate is consistent with other EPA rulemakings and comparable to the ownership-weighted average of the interest rates applied by NREL of 7.3%. However, to create a more refined affordability analysis, as discussed in detail under the Energy and Non-Air Quality Impacts of Compliance Factor, EPA also applied different interest rates to the individual owners of NGS. See Section 4 of the TSD for additional information. Several commenters, including NPS, suggested that the calculations of cost effectiveness should be based on the most stringent level of control possible. NPS stated that data from many existing facilities with SCR controls show annual average emission rates of 0.05 lb/MMBtu. An emission limit of 0.05 lb/MMBtu represents approximately an 86% reduction in NOx emissions compared to the average baseline emission rate over 2001 �– 2003. If we consider the new NOx limit of 0.24 lb/MMBtu (30-day rolling average) set by the PSD permit issued to NGS in 2008 to install advanced combustion controls on each unit, a post-SCR emission limit of 0.055 lb/MMBtu represents nearly an 80% reduction in the permitted NOx emission limit. SRP�’s voluntary installation of LNB/SOFA on Units 1 �– 3 at NGS over 2009 �– 2011 is discussed in more detail in Section 5. In EPA�’s October 19, 2010 proposed BART determination for Four Corners Power Plant, EPA set a NOx emission limit based on NOx reduction efficiency from SCR of 80%. This NOx reduction efficiency was chosen to be conservative and was based on the minimum level of control estimated by Hitachi Power Systems.88 In subsequent correspondence between EPA and Hitachi specific to Navajo Generating Station, Hitachi guaranteed that a 2+1 SCR reactor system could comply with a 0.08 lb/MMBtu emission limit (30-day rolling average), and a 3+1 SCR reactor system could comply with a 0.05 lb/MMBtu emission limit (30-day rolling average). Hitachi explains that its NOx guarantees are based on what the SCR system achieves at the end of the catalyst life,89 therefore, Hitachi designs its systems down to the level of the emission limit, rather than including a large compliance factor (40 �– 60%) as included by S&L.90 Based on (1) the survey of CAMD data from NPS indicating that 0.05 lb/MMBtu on annual average has been achieved on several coal-fired power plants nationally; (2) the information from Hitachi that an 80% NOx reduction efficiency is achievable and conservative; (3) the current NOx limit at NGS, following installation of LNB/SOFA on all three units, is 0.24 lb/MMBtu and a nearly 80% reduction of 0.24 lb/MMBtu is 0.05 lb/MMBtu; (4) the design basis from S&L is a 2+2 reactor to achieve 0.05 lb/MMBtu to provide a wide compliance margin for a limit of 0.07 �– 0.08 lb/MMBtu; (5) based on information related to NGS EPA provided to Hitachi, Hitachi can guarantee compliance with a NOx emission limit of 0.05 lb/MMBtu (30-day rolling average) with a 3+1 reactor; EPA concludes that an emission limit of 0.055 lb/MMBtu is
86 See Table 1-10 of the NREL report. 87 http://www.whitehouse.gov/omb/circulars_a004_a-4/#e 88 Email from Anthony Favale, Hitachi Power Systems, America to Anita Lee, EPA, quotes a reduction efficiency range of 80 �– 90%., April 21, 2010. 89 Email from Stephen Guglielmo, Hitachi Power Systems America, to Anita Lee, EPA, March 7, 2011. 90 S&L in its August 17, 2010 cost report stated that it designed the SCR reactor system as a 2+2 system to achieve 0.05 lb/MMBtu in order to meet an anticipated emission limit of 0.07 �– 0.08 lb/MMBtu on a 30-day rolling average.

Technical Support Document for NGS Proposed BART Determination, rev. February 11, 2013 | Page 46 of 129
achievable at NGS, on a rolling average basis of 30 boiler operating days, and should not require more than four (2+2 or 3+1 reactor design) SCR catalyst layers, thus the capital and annual costs should not be substantially different from the costs estimated by S&L in its 2010 cost analysis and as revised by EPA according to the EPA Control Cost Manual. The design basis associated with the cost estimate (in 2008 dollars) provided in the ANPRM was a 2+1 reactor. In its comment letter on the ANPRM to EPA, SRP stated that an additional layer of catalyst (from 2+1 to 3+1 or 2+2) would increase capital costs by $10 million per unit.91 However, the SCR cost estimates provided in the ANPRM (2008$) for smaller 2+1 reactors are higher than the costs estimated by S&L following the ANPRM in 2010 (2010$) for 2+2 reactors. Because the 2010 SCR cost analysis was for 2+2 reactors (4 layers of catalyst), EPA believes that this cost analysis is generally representative of the reactor system Hitachi guarantees using 3+1 reactors to achieve 0.055 lb/MMBtu. Assuming the $10 million per unit cost for an additional catalyst layer cited by SRP in its comment letter on the ANPRM includes the material and construction costs for housing an additional layer of catalyst and is also applicable to the 2010 costs, EPA infers that increasing the NOx limit to 0.080 lb/MMBtu, thus removing one catalyst layer, would reduce costs by $10 million per unit.
EPA is requesting comment on how the 2010 capital cost estimates would change based on 2+1 reactors, rather than 2+2 reactors. Additionally, EPA understands that Units 1 �– 3 at NGS are currently on a 3-year outage cycle. EPA does not intend to force more frequent outages to accommodate the SCR system, therefore, EPA is also requesting comment on if and how the 0.055 and 0.080 lb/MMBtu emission limits, for 3+1 and 2+1 reactors, respectively, may impact the current 3-year outage schedule and costs of controls. EPA�’s estimated changes to the capital and annual costs and cost effectiveness based on reactor size are shown in
91 This statement was made in reference to EPA�’s use of a 0.06 lb/MMBtu post-SCR NOx emission rate in cost effectiveness and modeling calculations in the August 19, 2009 ANPRM. SRP�’s original pre-ANPRM design was for a 2+1 reactor. The design basis for the SCR system in the 2010 cost analysis conducted by S&L was a 2+2 reactor that included an additional layer of catalyst to further enhance NOx removal.

Technical Support Document for NGS Proposed BART Determination, rev. February 11, 2013 | Page 47 of 129
Table 14. Unless the cost cited by SRP of an additional $10 million per unit for an additional catalyst layer is overestimated, four layers of catalyst (3+1 or 2+2 reactors) are slightly more cost effective in terms of NOx removal than three layers of catalyst (2+1).

Technical Support Document for NGS Proposed BART Determination, rev. February 11, 2013 | Page 48 of 129
Table 14: Cost Comparison of SCR+LNB/SOFA Reactor Sizes Based on EPA Revisions to 2010 S&L Costs
Unit 1 Unit 2 Unit 3 TotalTotal Capital Cost
4 catalyst layers (0.055 lb/MMBtu)
$152,527,000 $203,585,000 $185,294,000 $541,406,000
3 catalyst layers (0.080 lb/MMBtu)
$142,527,000 $193,585,000 $175,294,000 $481,406,000
Total Annual Cost 4 catalyst layers
(0.055 lb/MMBtu) $18,701,576 $23,521,090 $21,794,549 $64,017,215
3 catalyst layers (0.080 lb/MMBtu)
$17,757,647 $22,577,161 $20,850,620 $61,185,427
Average Cost Effectiveness ($/ton)92 4 catalyst layers
(0.055 lb/MMBtu) $2,011 $2,256 $2,464 n/a
3 catalyst layers (0.080 lb/MMBtu)
$2,080 $2,359 $2,584 n/a
EPA recognizes that emissions of sulfuric acid mist may increase with higher levels of NOx control, if the higher levels of NOx control require additional layers of catalyst, representing a potential adverse impact on visibility that would offset visibility benefits from NOx reductions, especially at the Grand Canyon or other nearby Class I areas. EPA also notes that in the 2010 cost estimate for NGS, S&L included in the design the use of ultra-low SO2 to SO3 conversion catalysts to limit SO2 oxidation to below 0.5% across the reactor.93 With three layers of catalyst in use, Hitachi guarantees an SO2 to SO3 conversion rate of 0.5%, thus EPA estimates that each layer of catalyst contributes approximately 0.167% conversion. This means that the addition of another layer of catalyst to further enhance NOx removal would result in additional SO2 to SO3 conversion. In considering NOx emission limits of 0.08 lb/MMBtu and 0.05 lb/MMBtu, Hitachi stated that it can guarantee compliance with a limit of 0.05 lb/MMBtu with a 3+1 reactor and compliance with a limit of 0.08 lb/MMBtu using a 2+1 reactor. EPA modeled the visibility impacts of SCR achieving a limit of 0.05 lb/MMBtu and an SO2 to SO3 conversion rate of 0.67% with 4 total layers of catalyst (3+1) and SCR achieving a limit of 0.08 lb/MMBtu and an SO2 to SO3 conversion rate of 0.5% with 3 total layers of catalyst (2+1). The modeling results are discussed in Section 7 of this TSD.
In assessing the cost of SCR, EPA evaluated cost estimates from SRP against the EPA Control Cost Manual and determined that capital cost estimates for SCR should be reduced by approximately 9% to be consistent with the EPA control cost manual. Because total capital costs of SNCR are low (nearly 14 times lower) in comparison to the total capital costs of SCR, EPA has determined that it is not necessary at this time to evaluate SNCR costs against the EPA Control Cost Manual and will use the total capital costs provided by SRP in our analysis (see
92 Average cost effectiveness of SCR is calculated compared to a 2001-2003 baseline, but includes the total annual cost of LNB/SOFA because the SCR and combustion controls would both contribute to the total estimated NOx reductions. 93 The 2010 S&L study did not appear to specify whether the 0.5% conversion was the design for the reactor using with all four catalyst layers in use, or three catalyst layers in use. To be conservative and consistent with the Hitachi guarantee, EPA assumes a 0.5% conversion over three layers rather than four.

Technical Support Document for NGS Proposed BART Determination, rev. February 11, 2013 | Page 49 of 129
Table 10). In our assessment of total annual costs for SCR, EPA used a 7% interest rate, compared to the 9.8% rate used by SRP, resulting in total annual costs estimated by EPA to be 22% lower than those estimated by SRP. If EPA applied a 7% interest rate to the total capital cost of SNCR and amortized over 20 years, the total annual cost would not change significantly ($22.7 million using a 7% interest rate94 versus $23.5 million using a 9.8% interest rate) because the total annual cost of SNCR is dominated by the annual O&M costs, consisting mostly of expenses associated with dry urea ($18,640,000). Because total annual costs for SNCR would not change significantly using the interest rate recommended in the EPA Control Cost Manual, EPA has determined it is not necessary at this time to revise total annual cost estimates for SNCR and will use the total annual cost estimates provided by SRP in our analysis (see Table 10).
ADEQ suggested that it was inappropriate to include the anticipated increase in electricity costs to consumers in our ANPRM without explanation of the unusual circumstances justifying its consideration. The BART guidelines state that under the Energy and Non-Air Quality Impacts factor, the reviewing authority may consider whether a given alternative would result in significant economic disruption or unemployment. EPA determined that an increase in electricity generation costs warranted review as a potential economic impact and we include this discussion in Section 4 of this TSD. ADEQ also suggested that EPA should address the additional cost associated with the use of an ultra-low conversion catalyst. Because the 2010 S&L study included in its design the use of an ultra low conversion catalyst, and because EPA relied on the 2010 S&L cost estimates, EPA has determined that the new cost estimates appropriately include the cost of the ultra-low conversion catalyst.
The Hopi Tribe commented that the cost estimates did not include the costs of potential releases of ammonia during transportation and storage. S&L included the direct costs of ammonia in its annual cost estimates. EPA has determined that costs associated with potential releases of ammonia during transportation and storage are not included in the EPA Control Cost Manual and should not be included in cost of compliance estimates in a BART determination. However, EPA acknowledges that risks do exist from the transportation and storage of ammonia, and we discuss results from a risk analysis examining emissions of pollutants associated with the transport of ammonia to NGS and risks associated with ammonia itself in Section 4 of this TSD �– Energy and Non-Air Quality Impacts of Compliance (Factor 3).
Many commenters suggested that EPA consider the incremental cost effectiveness, which compares the annual cost and performance level (tons per year reduced) of a control option to those of the next most stringent option. The BART Guidelines require consideration of the costs of compliance, and recommends two types of cost effectiveness calculations �– average cost effectiveness and incremental cost effectiveness. In our ANPRM, we did not present incremental cost comparisons and instead focused on average cost effectiveness because average cost effectiveness is the more commonly used and reported metric to compare costs between different facilities. Thus, average cost effectiveness is generally a more valuable metric in determining whether a given cost is reasonable because it can more easily be compared to other similar facilities. In considering incremental cost effectiveness, comparisons for reasonableness are less comparable between facilities, thus incremental cost effectiveness is generally a more subjective metric than average cost effectiveness. We presented SRP�’s calculations of incremental cost
94 See �“Cost comparisons tab�” in the spreadsheet titled �“EPA cost analysis for NGS.xlsx�” in the docket for this proposed rulemaking.

Technical Support Document for NGS Proposed BART Determination, rev. February 11, 2013 | Page 50 of 129
effectiveness in Table 10 above. Because SRP installed LNB/SOFA on one unit per year at NGS over 2009 �– 2011, consideration of incremental cost of SCR (compared to LNB/SOFA) is particularly useful because it captures the cost effectiveness from the perspective of a different baseline period. The baseline period used in the BART analysis for emissions and meteorological data is 2001 �– 2003. Calculating the incremental cost effectiveness of SCR+LNB/SOFA compared to LNB/SOFA over the 2001 �– 2003 baseline is generally equivalent to the average cost effectiveness of SCR+LNB/SOFA using a baseline period after LNB/SOFA has been installed on all three units (e.g., a baseline of 2011 �– 2013).
The BART Guidelines caution that: �“You should exercise care in deriving incremental costs of costs of candidate control options. Incremental cost-effectiveness comparisons should focus on annualized cost and emission reduction differences between �“dominant�” alternatives�”. The BART BART Guidelines describes the process for generating a graphical plot of total annualized costs for all for all control options on the y-axis and each control options�’ corresponding emission reductions on the on the x-axis. This plot identifies the �“least-cost envelope�”, representing �“a set of options that should be should be dominant in the choice of a specific option�”. See 70 FR at 39167 and 39168. The main control control options that SRP has focused on have been LNB/SOFA, SNCR, and SCR. Of these, SRP identified two possible scenarios for SNCR at equivalent cost (i.e., SNCR may achieve NOx emissions emissions of 0.15 lb/MMBtu or 0.18 lb/MMBtu), and EPA has identified two possible scenarios for for SCR at differing costs (i.e., SCR may achieve NOx emissions of 0.05 lb/MMBtu or 0.08 lb/MMBtu). lb/MMBtu). Of these 3 control options with 5 emission rate scenarios, EPA�’s graphical plot indicates indicates that the �“least-cost envelope�” (dominant) control options are LNB/SOFA, SNCR (at 0.015 0.015 lb/MMBtu), and SCR (at 0.055 lb/MMBtu).95 However, because SRP indicated by letter on July on July 20, 2012 that it expected SNCR to achieve roughly 0.18 lb/MMBtu to meet a limit of 0.20 0.20 lb/MMBtu, we report results based on 0.18 lb/MMBtu for SNCR.
95 See �“least cost envelope�” tab in spreadsheet titled �“NGS emissions and incremental costs.xlsx�” in the docket for this proposed rulemaking.

Technical Support Document for NGS Proposed BART Determination, rev. February 11, 2013 | Page 51 of 129
Table 15 below summarizes average and incremental cost estimates EPA calculated for the dominant control options using EPA�’s cost estimates for SCR (Table 13) and SRP�’s 2012 estimates for LNB/SOFA and SNCR (Table 10). Note that although EPA used the total capital and total annual cost estimates for LNB/SOFA and SNCR from SRP, our calculated average and incremental cost effectiveness of LNB/SOFA and SNCR differ slightly from SRP�’s estimates (Table 11), in part because EPA and SRP likely used slightly different baseline emission values. EPA calculated baseline emissions using average NOx emission rates and heat input values over 2001 �– 2003 for each unit.96 EPA did not find sufficient information in SRP�’s 2012 Updated BART analysis to determine how their baseline emissions (and thus, emission reductions) for NOx were calculated.
96 See spreadsheet titled �“NGS emissions and incremental costs.xlsx�” in the docket for this proposed rulemaking.

Technical Support Document for NGS Proposed BART Determination, rev. February 11, 2013 | Page 52 of 129
Table 15: Average and Incremental Cost Effectiveness of Dominant Control Options Calculated by EPA Unit 1 Unit 2 Unit 3 Average
Average Cost Effectiveness ($/ton)97 LNB/SOFA $475 $424 $560 $486
SNCR+LNB/SOFA $1,747 $1,558 $1,930 $1,745 SCR+LNB/SOFA $2,011 $2,256 $2,464 $2,240
Incremental Cost Effectiveness ($/ton)
SNCR+LNB/SOFA (vs. LNB/SOFA)
$4,290 $3,826 $4,214 $4,110
SCR+LNB/SOFA (vs. SNCR+LNB/SOFA)
$2,392 $3,261 $3,147 $2,933
SCR+LNB/SOFA (vs. LNB/SOFA)
$3,008 $3,444 $3,493 $3,315
The estimated incremental cost of SCR+LNB/SOFA (compared to LNB/SOFA) is similar to the average cost effectiveness of SCR+LNB/SOFA. Additionally, incremental cost effectiveness of SCR+LNB/SOFA (compared to SNCR+LNB/SOFA), is lower than the incremental cost effectiveness of SNCR+LNB/SOFA (compared to LNB/SOFA). The BART guidelines provide a hypothetical example of two control options where the incremental cost effectiveness of Option 1 (compared to Option 2) is $20,000/ton, 11 times larger than the average cost effectiveness of Option 1 of $1,900. In this example, the BART guidelines98 state that:
[w]hile $1,900 per ton may still be deemed reasonable, it is useful to consider both the average and incremental cost in making an overall cost-effectiveness finding. Of course, there may be other differences between these options, such as, energy or water use, or non-air environmental effects, which also should be considered in selecting a BART technology.
Although SRP is correct in stating that the incremental cost effectiveness of SCR (compared to LNB/SOFA) is greater than the incremental cost effectiveness of LNB/SOFA (compared to baseline), the BART guidelines do not provide a threshold for a level of incremental (or average) cost effectiveness that is reasonable or unreasonable. Because the incremental cost effectiveness of SCR, compared to LNB/SOFA and SNCR, is comparable to the average cost effectiveness of SCR, EPA considers the incremental cost effectiveness of SCR to suggest that SCR is cost effective on both an average and incremental basis.
For comparison of average cost effectiveness values,
97 Average cost effectiveness of SNCR and SCR include the total annual cost of LNB/SOFA, which are already installed and aid post-combustion controls in achieving the anticipated NOx reductions. 98 See 70 FR at 39167 (July 6, 2005).

Technical Support Document for NGS Proposed BART Determination, rev. February 11, 2013 | Page 53 of 129
Table 16 shows cost effectiveness for SCR retrofits estimate for several Western power plants. This table simply serves as a means to compare the cost effectiveness estimates between a few different facilities in the West and should not be misconstrued to suggest that SCR was required at all of the facilities listed below.

Technical Support Document for NGS Proposed BART Determination, rev. February 11, 2013 | Page 54 of 129
Table 16: Estimated Cost Effectiveness of SCR for Several Western Power Plants Facility Year of Cost Size Cost Effectiveness ($/ton)
Craig (Unit 2) Not specified 428 MW $6,30099 Hayden Station (Units 1 and 2) 2006 190 and 275 MW $3,400 �– $4,100100
PacifiCorp Naughton (Units 1 �– 3) 2006 160 �– 330 MW $2,751 �– $2,848101 Four Corners Power Plant (Units 4 and 5) 2008 750 MW $2,600 �– $2,900 Four Corners Power Plant (Units 1 �– 3) 2008 170 �– 220 MW $2,500 �– $3,200102
Navajo Generating Station (Units 1 – 3) 2010 750 MW $2,240 San Juan Generating Station (Units 1 �– 4) 2010 350 �– 544 MW $1,987 - $2,652103
In its comment letter on the ANPRM, SRP stated that the costs associated with dry sorbent injection (DSI) and new baghouses must be included in the cost estimate for SCR because DSI and new baghouses might be required as Best Available Control Technology (BACT) in a possible future Prevention of Significant Deterioration (PSD) permit if a BART determination requiring SCR causes a significant emission increase (greater than 7 tpy) of sulfuric acid mist. EPA does not agree that the cost of DSI and baghouses should be included in the cost estimates for SCR as BART. Without undertaking a source-specific top-down PSD BACT analysis, EPA cannot determine what may be required as BACT for potential significant emission increases for sulfuric acid mist. Therefore, EPA cannot speculate what BACT for sulfuric acid mist might be in the event a PSD permit is required for NGS. EPA notes that for a 2009 PSD permit issued to the Coronado Generating Station (CGS) by the Arizona Department of Environmental Quality (ADEQ)104 for the installation of SCR on Unit 2 at CGS, the BACT determination for sulfuric acid mist required use of an ultra-low SO2 to SO3 conversion catalyst, with an interim sulfuric acid mist BACT limit of 0.012 lb/MMBtu. ADEQ required a testing program to determine if DSI would be effective at CGS to consistently reduce the sulfuric acid emission rate to 0.006 lb/MMBtu. If the testing program showed that Unit 2 at CGS could consistently meet the lower limit, the lower limit would become the BACT limit. If Unit 2 at CGS could not meet the lower limit, ADEQ required CGS to conduct a minimization analysis to evaluate additional options to achieve 0.005 lb/MMBtu or less while maintaining PM emissions below the permitted emission limit of 0.03 lb/MMBtu. However, ADEQ stated that the minimization analysis will not require the use of additional PM control equipment, such as a baghouse.105 Although EPA cannot determine at this time what a potential sulfuric acid mist BACT determination for NGS might require, EPA does not agree with SRP that the possibility for additional controls to comply with BACT for PSD warrants the inclusion of those costs under the BART requirement of the Regional Haze Rule. Therefore, EPA does not include DSI or baghouses in the cost of compliance for SCR.
99 See Colorado BART Analysis for Craig Units 1-2, in the docket for this proposed rulemaking. 100 See Colorado BART Analysis for Hayden 1-2, in the docket for this proposed rulemaking. 101 77 FR 33022 (June 4, 2012) 102 The average cost effectiveness reported in the October 19, 2010 proposed FIP for Four Corners Power Plant (75 FR 64221), were based on EPA revisions to cost estimates submitted by Arizona Public Service. 103 The average cost effectiveness, reported in supporting documents (EPA�–R06�–OAR�–2010�–0846-0128) to the October 22, 2011 final FIP for New Mexico (76 FR 52388), were generally based on an EPA Region VI analysis using the EPA Control Cost Manual. 104 See Final PSD Permit for Coronado, in the docket for this proposed rulemaking. 105 Permit Condition II.H.4.a of the January 21, 2009 Final permit for Coronado Generating Station issued by ADEQ. Significant Permit Revision Number #46236.

Technical Support Document for NGS Proposed BART Determination, rev. February 11, 2013 | Page 55 of 129
In addition to the potential need for installation of new baghouses at NGS to comply with a future control technology determination for pre-construction permitting for possible emission increases of sulfuric acid mist, EPA understands that SRP has been evaluating whether installation of one or more new baghouses would be needed at NGS to comply with the recently promulgated National Emission Standard for Hazardous Air Pollutants (NESHAP) for emissions of mercury and other acid gases from electric generating units (EGUs), known as the Mercury and Air Toxics Standard (MATS).106 The final MATS set a mercury emission standard of 1.2 pounds per trillion British thermal units heat input (lb/TBtu).107 Technical information provided with the final MATS rule estimated Hg emissions to range from 1.14 to 1.30 lb/TBtu from Units 1 �– 3 at NGS in 2009.108 However, information reported to the EPA Toxics Release Inventory suggests facility-wide average Hg emissions from NGS to be 3.26 lb/TBtu.109 SRP indicated to EPA that it would be testing units at CGS that are similar to NGS to assess the feasibility of calcium bromide injection without the installation of new baghouses to meet the MATS limit for mercury.110 The MATS compliance date for existing facilities is by April 16, 2015, however, an additional year may be granted at the discretion of the permitting authority for its Part 71 operating permit (Navajo Nation Environmental Protection Agency) if additional time is needed for the installation of new controls. SRP has indicated to EPA that based on initial testing of calcium bromide injection, it is cautiously optimistic that new baghouses will not be needed at NGS to comply with MATS. As stated in the previous paragraph, EPA believes the cost of baghouses, if needed for MATS or for PSD, should not be included as compliance costs for BART. Therefore, EPA has not included the cost of DSI or baghouses in our analysis of cost effectiveness of NOx control technologies under consideration for BART. However, if baghouses are needed at NGS for MATS, these costs would likely be incurred before the installation of any NOx control technologies, therefore, our economic analysis includes some discussion and consideration of possible costs and economic effects of baghouse installation. See Section 4 (Energy and Non-Air Quality Impacts of Compliance) of this TSD for additional information. Based on the cost data presented by SRP, as well as EPA�’s revisions to SRP�’s cost estimates, and our analysis of average and incremental cost effectiveness, EPA has determined that SCR is cost effective; therefore, EPA will continue evaluating SCR in the BART five-factor analysis.
4. Factor 2: Energy and Non-Air Quality Environmental Impacts of Compliance
The BART Guidelines describe the energy and non-air quality impacts of compliance factor as an examination of whether the use of the control technology would result in direct energy penalties or
106 77 FR 9304, February 16, 2012. 107 See Table 2 to Subpart UUUUU of Part 63, 77 FR at 9490, February 16, 2012. 108 See spreadsheet titled �“Emissions Spreadsheet�” and dated 12/16/11 on the following website: http://www.epa.gov/ttn/atw/utility/utilitypg.html, or identical spreadsheet: �“mats_final_current_base_hap_inven.xlsx�” in the docket for this proposed rulemaking. 109 Calculated from total facility Hg emissions of 566 pounds in 2010 and total facility heat input of 173 million MMBtu. See http://www.epa.gov/tri/tridata/index.html, or spreadsheet titled �“NGS TRI 2010 data.xlsx�” in the docket for this proposed rulemaking. 110 Based on MATS discussion on January 6, 2012 between representatives of Salt River Project and several EPA offices: Office of Air and Radiation, Clean Air Markets Division, and Region IX.
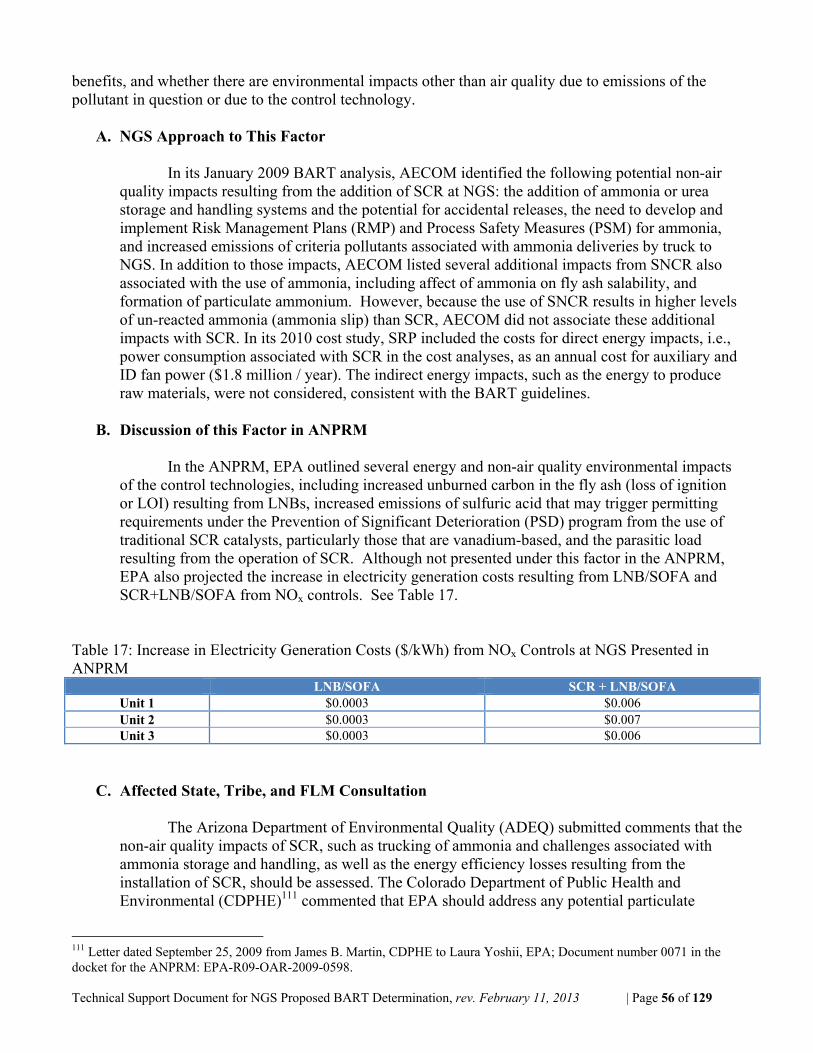
Technical Support Document for NGS Proposed BART Determination, rev. February 11, 2013 | Page 56 of 129
benefits, and whether there are environmental impacts other than air quality due to emissions of the pollutant in question or due to the control technology.
A. NGS Approach to This Factor In its January 2009 BART analysis, AECOM identified the following potential non-air quality impacts resulting from the addition of SCR at NGS: the addition of ammonia or urea storage and handling systems and the potential for accidental releases, the need to develop and implement Risk Management Plans (RMP) and Process Safety Measures (PSM) for ammonia, and increased emissions of criteria pollutants associated with ammonia deliveries by truck to NGS. In addition to those impacts, AECOM listed several additional impacts from SNCR also associated with the use of ammonia, including affect of ammonia on fly ash salability, and formation of particulate ammonium. However, because the use of SNCR results in higher levels of un-reacted ammonia (ammonia slip) than SCR, AECOM did not associate these additional impacts with SCR. In its 2010 cost study, SRP included the costs for direct energy impacts, i.e., power consumption associated with SCR in the cost analyses, as an annual cost for auxiliary and ID fan power ($1.8 million / year). The indirect energy impacts, such as the energy to produce raw materials, were not considered, consistent with the BART guidelines.
B. Discussion of this Factor in ANPRM
In the ANPRM, EPA outlined several energy and non-air quality environmental impacts of the control technologies, including increased unburned carbon in the fly ash (loss of ignition or LOI) resulting from LNBs, increased emissions of sulfuric acid that may trigger permitting requirements under the Prevention of Significant Deterioration (PSD) program from the use of traditional SCR catalysts, particularly those that are vanadium-based, and the parasitic load resulting from the operation of SCR. Although not presented under this factor in the ANPRM, EPA also projected the increase in electricity generation costs resulting from LNB/SOFA and SCR+LNB/SOFA from NOx controls. See Table 17.
Table 17: Increase in Electricity Generation Costs ($/kWh) from NOx Controls at NGS Presented in ANPRM
LNB/SOFA SCR + LNB/SOFAUnit 1 $0.0003 $0.006 Unit 2 $0.0003 $0.007 Unit 3 $0.0003 $0.006
C. Affected State, Tribe, and FLM Consultation
The Arizona Department of Environmental Quality (ADEQ) submitted comments that the non-air quality impacts of SCR, such as trucking of ammonia and challenges associated with ammonia storage and handling, as well as the energy efficiency losses resulting from the installation of SCR, should be assessed. The Colorado Department of Public Health and Environmental (CDPHE)111 commented that EPA should address any potential particulate
111 Letter dated September 25, 2009 from James B. Martin, CDPHE to Laura Yoshii, EPA; Document number 0071 in the docket for the ANPRM: EPA-R09-OAR-2009-0598.

Technical Support Document for NGS Proposed BART Determination, rev. February 11, 2013 | Page 57 of 129
emission control options in a comprehensive context that considers the possible co-benefits of mercury (Hg) emissions reductions. The Attorney General of New Mexico112 commented that EPA should consider the interrelationship between BART controls and Hg emissions, and stated that EPA must initiate Section 7 Consultation under the Endangered Species Act with the U.S. Fish and Wildlife Service for potential increases in air pollutant emissions and because it believes that EPA has discretion to achieve reductions in Hg emissions. The State Treasurer113 and Governor of Arizona114 both commented that power from NGS is used by the Central Arizona Project (CAP) to pump water to much of Arizona. Construction of CAP was authorized by Congress in 1968 under the Colorado River Basin Project Act to deliver the Arizona�’s 2.8 million acre-feet (AF) surface water entitlement of the Colorado River to the state. The 336-mile CAP delivery system was completed in 1993 and delivers 1.5 million AF of water to Maricopa, Pima, and Pinal Counties through a series of canals and pumping stations to lift water up an elevation of 3,000 feet from Lake Havasu to close to the city of Tucson. CAP water currently meets over 20% of Arizona�’s total water demands, and within CAP�’s service area, which encompasses about 80% of Arizona�’s water users and taxpayers, CAP water meets about 50% of the municipal demands. Additionally, 40% of CAP water supply is dedicated to Native American use.
The Navajo Nation (the Nation) submitted comments raising concerns that requiring SCR
as BART for NGS could potentially force the facility to shut down, resulting in great economic harm to the Navajo directly and indirectly, through lost employment at NGS, at the Kayenta Coal Mine that supplies 8.3 million tons of coal to NGS, as well as the revenue to the Nation in the form of royalties and taxes.115 The Nation stated that in 2005-2006, the NGS payroll was $47 million, with 512 permanent employees, 69% of whom are Native American, 300 seasonal employees, 93% of whom are Native American. The Nation reports that the Kayenta Mine payroll is $44 million, with approximately 400 employees, of whom a large percentage are Native American. The Navajo Nation provided additional and updated information during our consultation with tribes prior to our proposed rulemaking for NGS.116 The Navajo Nation reiterated their recommendation that LNB/SOFA be determined BART for NGS to ensure continued operation of the facility and preservation of jobs and revenues, and also highlighted the importance of title V operating permit emission fees from NGS to the continued development of the Air Quality Program at the Navajo Nation EPA.
The Hopi Tribe commented that the Hopi supply coal and water to NGS, thus an
significant fraction of the annual Hopi tribal budget comes from revenue derived or associated with NGS.117 Comments from the Hopi Tribe describe that the tribe is geographically isolated from Arizona, there is no on-site industrial development and because the Hopi have rejected gaming as a potential source of revenue because gaming conflicts with the Hopi culture,
112 Letter dated September 28, 2009 from Seth Cohen, Attorney General of New Mexico, to Anita Lee, EPA; Document number 0072 in the docket for the ANPRM: EPA-R09-OAR-2009-0598. 113 Letter dated October 26, 2009 from Dean Martin, Arizona State Treasurer, to Laura Yoshii, EPA; Document number 0174 in the docket for the ANPRM: EPA-R09-OAR-2009-0598. 114 Letter dated October 13, 2009 from Janice Brewer, Arizona Governor, to Laura Yoshii, EPA; Document number 0078 in the docket for the ANPRM: EPA-R09-OAR-2009-0598. 115 Letter dated March 1, 2010 from Joe Shirley, Jr., President, Navajo Nation, to Anita Lee, EPA; Document number 0209 in the docket for the ANPRM: EPA-R09-OAR-2009-0598. 116 Letter dated September 21, 2012 from Ben Shelly, President, Navajo Nation to Jared Blumenfeld, EPA; Follow up to August 7, 2012 Consultation on Proposed BART Rule for Navajo Generating Station in the docket for this proposed rule. 117 Letter dated March 1, 2010 from Leroy Shingoitewa, Chairman, Hopi Tribal Council, to Jared Blumenfeld, EPA; Document number 0211 in the docket for the ANPRM: EPA-R09-OAR-2009-0598.

Technical Support Document for NGS Proposed BART Determination, rev. February 11, 2013 | Page 58 of 129
employment opportunities on Hopi land are limited. The Hopi stated that the Federal Government has a trust and fiduciary responsibility to Indian Tribes, which includes the duty to administer programs in such as way to avoid adverse impacts to Indian Rights and natural resources owned by Tribes. The Hopi commissioned and provided to EPA a study by ICF International (ICF) to examine the economic viability of NGS if (1) SCR were implemented at NGS by 2015, (2) CO2 controls were implemented by 2012, and (3) stringent Hg controls were required by 2015. ICF concluded that the capital investments associated with SCR, CO2 controls, and Hg controls were required, NGS would not be economically sound and the facility may be retired, assuming natural gas prices were at or below $5.60/MMBtu (in 2008 dollars). The Hopi tribe commented that if NGS closed, the economic impacts to the Tribe would be catastrophic and include curtailment of critical social programs, lost employment, and loss or slowing of critical infrastructure programs. The Hopi Tribe also commented about risks associated with ammonia use for the SCR.
Several Tribes in Arizona sent comments to EPA expressing concern over the potential
impact of BART on Tribal water settlement agreements, rates, and infrastructure development. The Tohono O�’odham Nation118 raised concerns regarding the impact of stringent controls at NGS on the fund that pays for delivery of CAP water. The Ak-Chin Indian Community119 commented that it relies on CAP for its entire water supply, and that EPA must ensure regulation of NGS will not have an adverse impact on its water rights. The Gila River Indian Community (Gila River)120 commented that if EPA requires SCR at NGS, the cost of CAP water will increase significantly, and the revenue generated for the fund created by the 2004 Arizona Water Settlement Act to defray cost of Tribes of obtaining and using its water entitlements will decrease. Gila River stated that requiring SCR has clear environmental justice implications because this determination would have disproportionate impacts on Indian Tribes. Gila River further commented that the loss of CAP water would impact the restrictions on ground water pumping mandated by the 1980 Arizona Groundwater Code. Gila River requested EPA conduct a voluntary Environmental Impact Study (EIS) for the BART rulemaking. The Fort McDowell Yavapai Nation raised concerns about the direct and indirect cost increases if SCR were determined BART for NGS.121 The Pascua Yaqui Tribe submitted comments to EPA on December 14, 2009 raising concerns over the affordability of CAP water and potential impacts on a future water rights settlement agreement.122
After the close of the ANPRM comment period, during the public comment period for
the MATS rule, EPA received requests for consultation from several tribes located in Arizona.123 EPA continued consultation with tribes on BART for NGS, and, at the request of several tribes,
118 Letter dated March 1, 2010 from Ned Norris, Jr., Chairman, Tohono O�’odham Nation, to Jared Blumenfeld, EPA; Document number 0212 in the docket for the ANPRM: EPA-R09-OAR-2009-0598. 119 Letter dated March 1, 2010 from Robert Palmquist, Strickland & Strickland, General Counsel to the Ak-Chin Indian Community, to Jared Blumenfeld, EPA; Document number 0214 in the docket for the ANPRM: EPA-R09-OAR-2009-0598. 120 Letter dated February 23, 2010 from William Rhodes, Governor, Gila River Indian Community, to Jared Blumenfeld, EPA; Document number 0210 in the docket for the ANPRM: EPA-R09-OAR-2009-0598. 121 Letter dated February 26, 2010 from Clinton Pattea, President, Fort McDowell Yavapai Nation, to Jared Blumenfeld, EPA; in the docket for this proposed rulemaking. 122 Letter dated December 14, 2009, from Peter Yucupicio, Chairman, Pascua Yaqui Tribe, to Laura Yoshii, EPA; in the docket for this proposed rulemaking. 123 See letter dated May 20, 2011 from William Rhodes, Governor, Gila River Indian Community, to Lisa Jackson, EPA; letter dated July 14, 2011 from William Rhodes to Lisa Jackson; letter dated June 21, 2011 from William Rhodes to Colleen McKaughan, EPA; undated letter from Ben Shelly, President, Navajo Nation, to Gina McCarthy, EPA; letter dated July 29, 2011 from Ben Shelly to Lisa Jackson, in the docket for this proposed rulemaking.

Technical Support Document for NGS Proposed BART Determination, rev. February 11, 2013 | Page 59 of 129
included consultation discussions related to the national rulemaking for the Mercury and Air Toxics Standard (MATS). EPA sent letters inviting all tribes in Arizona to consult with EPA on NGS in conjunction with the InterTribal Council of Arizona on September 16, 2011.124 Meeting materials associated with consultation meetings on September 16, 2011, February 8, 2012, and two meetings in August 2012, are available in the docket for this proposed rulemaking.125 EPA received additional comment letters from the Yavapai-Apache Nation126 and the Ak-Chin Indian Community.127
D. EPA Conclusions regarding This Factor
i. Energy and Non-Air Quality Environmental Impacts
In its cost analysis for SCR, SRP included the cost of auxiliary power for the SCR
system; therefore EPA did not further consider energy efficiency losses as a result of SCR, as those effects were quantified in the cost analysis.
The cost analysis submitted by SRP for SCR at NGS assumes costs associated with the
use of aqueous anhydrous ammonia, and several commenters raised concerns about the potential risks from the transportation and storage of this chemical. In addition to concerns about anhydrous ammonia itself, because NGS is not located next to a major rail line, commenters also raised concerns that ammonia deliveries would increase heavy-duty truck traffic to and from NGS. Although this factor deals specifically with energy and non-air quality environmental impacts, EPA determined that the potential adverse health impacts of the transportation and storage of anhydrous ammonia at NGS warranted further review.
Commenters estimated that if SCR were required, two additional trucks daily would be
required to transport the anhydrous ammonia from Flagstaff to NGS (approximately 135 miles each way). EC/R estimated emissions from the additional truck trips (728 trucks per year each traveling 270 miles round trip). EC/R used conservative emission factors from the South Coast Air Quality Management District.128 The modeled concentrations of criteria pollutants were compared against the National Ambient Air Quality Standard (NAAQS), and modeled concentrations of hazardous air pollutants were used to estimate cancer risks and a non-cancer hazard quotient for comparison against background. Of the criteria pollutants, emissions of NOx were highest but totaled only 3.76 tons per year, which was modeled to be well below the NAAQS and the Class I increments at the most impacted census block, located in Coconino County, Arizona, with a population of 109 individuals. The modeled impact of the sum of all hazardous air pollutants in the highest impacted census block in Coconino County was estimated to result in a cancer risk of 0.7 excess cancer cases over a lifetime exposure per one million people exposed (7 x 10⁻⁷ risk), and a non-hazard quotient of 0.2, where a quotient of one or
124 Letters dated September 6, 2011 from Jared Blumenfeld, EPA, to Arizona tribal leaders, in the docket for this proposed rulemaking. 125 See document file sets titled �“EPA Consultation with Tribes, 9-6-11�”,�“EPA Consultation with Tribes, 2-8-12�”, and �“EPA consultation with Tribes in August 2012�” in the docket for this proposed rulemaking. 126 Letter dated September 21, 2011 from David Kwail, Chairman, Yavapai-Apache Nation, to Laura Yoshii, EPA; in the docket for this proposed rulemaking. 127 Letter dated October 14, 2011 from Louis Manuel, Jr., Chairman, Ak-Chin Indian Community to Janet McCabe, EPA; in the docket for this proposed rulemaking. 128 See report from EC/R Incorporated titled: �“Ammonia Mobile Source Risk Estimates for Navajo Generating Station.pdf�” in the docket for this proposed rulemaking.

Technical Support Document for NGS Proposed BART Determination, rev. February 11, 2013 | Page 60 of 129
below indicates exposure is not likely to result in adverse health effects. The background cancer risk for Coconino County is 15 excess cancer cases over a lifetime exposure per one million people exposed. For the other impacted census blocks, the modeled risks associated with increased truck traffic were estimated to be as low as 2 x 10⁻¹⁰ and the hazard quotients are estimated to be as low as 0.00007. Based on the information that the increase in risks associated with transportation emissions in the most impacted census block are well below background, EPA has determined that the increase in daily tanker truck traffic to transport anhydrous ammonia to and from NGS for SCR will not result in a significant health risk.
Based on estimates from SRP that installation of SNCR on Units 1 �– 3 at NGS would
require nearly 31,000 tons per year of urea, and assuming each truck can carry nearly 20 tons of urea, roughly 4 trucks per day might be required to transport dry urea to NGS (1,580 truckloads per year) if SNCR was installed and operated at NGS.129 Using a similar analysis as was conducted for SCR, emissions of NOx were projected to be highest of the criteria pollutants, totaling over 8 tons per year, and was modeled to be well below the NAAQS and Class I increments at the most impacted census block. The modeled impacts of SNCR are expected to be greater than the modeled impacts of SCR because SNCR is requires twice the daily truck trips as SCR. The modeled impact of the sum of all hazardous air pollutants in the highest impacted census block in Coconino County, with a population of 230 individuals, was estimated to result in a cancer risk of 1 excess cancer cases over a lifetime exposure per one million people exposed (1 x 10⁻⁶ risk), and a non-hazard quotient of 0.47, where a quotient of one or below indicates exposure is not likely to result in adverse health effects. The background cancer risk for Coconino County is roughly 9 excess cancer cases over a lifetime exposure per one million people exposed (8.8 x 10⁻⁶ risk). Based on the information that the increase in risks associated with transportation emissions in the most impacted census block are well below background, EPA has determined that the increase in daily tanker truck traffic to transport urea to and from NGS for SNCR will not result in a significant health risk.
Commenters additionally cited concerns about the transport and use of anhydrous
ammonia, and in its comments on the ANPRM, SRP stated that it would be required to develop, implement, and maintain and Risk Management Plan (RMP) and Process Safety Management Plan for storage and transport of this chemical. The report from EC/R Incorporated included in the docket for this rulemaking includes a qualitative assessment of risks from the transport and storage of anhydrous ammonia. As discussed in the report, ammonia is widely used in the United States for a variety of purposes, including in agricultural and industrial systems. Anhydrous ammonia is a health hazard if inhaled, and effects can range from lung irritation to severe respiratory injuries, with possible fatality at higher concentrations. There are several federal regulations that require the reporting of the use and release of hazardous materials. The programs administered by EPA include: Section 112(r) of the Clean Air Act, the Emergency Planning and Community Right-to-Know Act (EPCRA), and the Comprehensive Environmental Response, Compensation, and Liability Act (CERCLA). The RMP cited by SRP is required under Section 112(r) of the CAA. The RMP requirements apply only to stationary sources, therefore the transportation of anhydrous ammonia does not fall under an RMP. The U.S. Department of Transportation (DOT) regulates the transportation of anhydrous ammonia under Federal Motor Carrier Safety Administration (FMCSA) regulations. Using an FMCSA-supported risk assessment estimating an annual accident and incident rate for hazardous materials, EC/R estimated that based on the estimated tanker truck miles traveled, one accident or incident in
129 Ibid.

Technical Support Document for NGS Proposed BART Determination, rev. February 11, 2013 | Page 61 of 129
approximately 30 years involving a laden tanker truck might be expected. According to figures from the FMCSA risk assessment, only 28% of such accidents would be expected to involve a spill. Given that the vast majority of the route from Flagstaff to NGS passes through a sparsely populated area, the likelihood of injury to the populace from an accident is small.
The EC/R report further notes that a national database operated by the National Toxic
Substance Incidents Program of the U.S. Agency for Toxic Substances and Disease Registry reports that between 2005 �– 2010, there were 45 incidents involving anhydrous ammonia, and that all incidents were associated with agricultural use of the chemical, and that the vast majority of those incidents were associated with loading operations or soil applications, rather than transport on highways or public areas. There were no incidents involving anhydrous ammonia use at a power plant or transportation to a power plant between 2005 and 2010. EPA further notes that SCR is a widely used control technology at coal and natural gas-fired power plants throughout the country and that SRP might confer with Tucson Electric Power (TEP), one of the co-owners of NGS, in developing an RMP for anhydrous ammonia. TEP has a title V operating permit for Springerville Generating Station in Arizona that describes new anhydrous ammonia storage tanks, therefore TEP likely has already developed an RMP for anhydrous ammonia for the Springerville.130
EPA agrees with CDPHE and NPS that NOx reductions from NGS may have co-benefits
for tropospheric ozone and nitrogen deposition. We have determined that a qualitative acknowledgement of the co-benefit for ozone and nitrogen deposition is sufficient consideration for this factor. The BART guidelines generally focus on adverse environmental impacts of control technologies, such as solid or hazardous waste generation or discharges of polluted water, however, the guidelines further state that �“any important relative environmental impacts (both positive and negative) of alternatives can be compared with each other�”.131 As the most stringent NOx control option, SCR is expected to result in the highest level of co-benefit for reducing ozone and nitrogen deposition.
EPA did not receive comments that specifically raised concerns regarding the impact of
SCR on fly ash salability at NGS. This issue, however, was raised in the context of EPA�’s BART evaluation for FCPP. For our proposed BART rulemaking for FCPP, EPA contracted with EC/R to explore the impact of ammonia on the usability of fly ash. This report from EC/R was included as Appendix C132 of the technical support document for our October 19, 2010 proposed BART determination for FCPP. Ammonia adsorption to fly ash is generally less desirable due to odor but does not impact the integrity of the use of fly ash in concrete. However, EC/R noted that other NOx control technologies, including LNB, also have undesirable impacts on fly ash. LNBs increase the amount of unburned carbon in the fly ash, also known as Loss of Ignition (LOI), which does affect the integrity of the concrete. However, commercial-scale technologies exist to remove ammonia and LOI from fly ash. Therefore, EPA has determined that the impact of SCR on the fly ash at NGS is smaller than the impact of LNB on the fly ash, and in both cases, the impact can be mitigated. ii. Economic Impacts of Compliance
130 See document titled �“Springerville title V permit ADEQ�” in the docket for this proposed rulemaking. 131 See 70 FR 39169 (July 6, 2005). 132 See document titled �“TSD Appendix C: Impact of Ammonia in Fly Ash on its Beneficial Use�”; Document number 0006, in the docket for the proposed rulemaking for Four Corners Power Plant: EPA-R09-OAR-2010-0683.

Technical Support Document for NGS Proposed BART Determination, rev. February 11, 2013 | Page 62 of 129
The BART Guidelines state that under the energy impacts analysis, the reviewing
authority may consider �“whether a given alternative would result in significant economic disruption or unemployment.�” 70 FR at 39169. Additionally, in selecting a �“best�” alternative, the BART Guidelines further state that �“there may be unusual circumstances that justify taking into consideration the conditions of the plant and the economic effects of requiring the use of a given control technology.�” 70 FR at 39171. Although the economic effects are discussed in the context of selecting the �“best�” control technology rather than as a consideration under the energy impacts analysis, EPA is including a discussion of an affordability analysis in the Energy and Non-air quality impacts of compliance factor, as it relates to potential economic disruption.
In addition to the ICF Report commissioned by the Hopi Tribe, EPA received studies
from other groups as well. DOI, SRP, and the Gila River Indian Community commissioned separate studies to examine the impacts of potential BART controls on electricity rates, CAP water rates, and the Gila River Indian Community. The NREL phase I study commissioned by DOI, as discussed previously, examined potential impacts of three main scenarios, (1) SCR installation at NGS for BART, (2) SCR installation for BART plus installation of baghouses in the event baghouses are needed at NGS to comply with other non-BART regulatory requirements, and (3) full closure of NGS, on several groups of stakeholders, including owners of NGS and their retail customers, CAWCD and their water customers, and Tribes. The Harvey Economics reports commissioned by the Gila River Indian Community and SRP focused on CAP water rates and potential impacts to profit margins for agriculture on the Gila River Indian Community in particular, as well as other agricultural and non-agricultural impacts to tribes located in Arizona and the Lower Colorado River Basin Development Fund. Finally, SRP commissioned a study by Arizona State University to examine the broader contributions of NGS and the Kayenta Mine to the economy of Arizona.
Throughout the following section, EPA describes results from these studies as a
comparison with our analyses. Although EPA is including the ICF, NREL, Harvey Economics, and ASU studies in the docket for our proposed rulemaking as additional and supplemental information submitted by interested stakeholders, EPA is not providing a critical review or assessment of the methodologies of those studies.
a. Projected Impacts on Electricity Generation Costs and Retail Rates
EPA contracted with EC/R Incorporated to explore the concerns raised by the Navajo Nation regarding the affordability of SCR. Specifically, EPA requested EC/R to conduct an analysis to estimate the increase in cost to produce electricity if SCR were required for BART, to assess the factors that impact a decision to shut down NGS, and to estimate potential increases to electricity and water rates under possible options for BART. EC/R contracted with Energy Strategies, LLC to conduct the analysis.
Energy Strategies, LLC (ES) created a model to estimate the cost of electricity generation
if new controls were installed on all 3 units at NGS compared with the cost to purchase electricity on the wholesale market, to determine whether it would be more economical for the owners of NGS to install new controls and continue operation, or to close NGS and purchase power on the wholesale market as part of their contractual obligations to retail electricity customers. The model and the final report from ES are available in the online docket for this

Technical Support Document for NGS Proposed BART Determination, rev. February 11, 2013 | Page 63 of 129
proposal.133 The model is a 25-year discounted cash flow model that estimates the net present value (NPV) cost of electricity. ES estimated the current Business As Usual (BAU) cost to produce electricity and modeled the cost to add SNCR or SCR to all 3 units. Because SRP elected to install LNB/SOFA on each unit at NGS over 2009 �– 2011, the BAU case includes the cost of those retrofits. The BAU, SCR, and SNCR cases also include an estimated increase of $15 million per year in the lease costs paid by the owners of NGS to the Navajo Nation.134 ES forecasted the market price to purchase energy on the wholesale market using the Palo Verde price index, which is determined by the most costly source of electricity, in this case, natural gas. Additionally, ES estimated the non-discounted cost of electricity per MWh, which we report here in kWh for consistency with our ANPRM. The model uses EPA�’s revisions to SRP�’s capital cost and operating expense estimates for SCR (See Table 13, total capital cost = $496 million to install SCR on all 3 units). For SNCR, the model uses those reported by SRP. The model uses an amortization rate of 15%, which includes the interest rate and the tax rate on the debt and equity of the project. Thus, the model used for the affordability analysis differs from the EPA Control Cost Manual in that the Cost Manual determines the amortization rate on a pre-tax basis, using only the interest rate and amortization period. The results of the model are shown in Table 18.
LADWP is a publicly-owned utility that currently owns 21.2% of NGS. As discussed
previously, because of state law in California, LADWP will be prohibited from continuing to participate in NGS after 2019. At this time, the EPA understands that LADWP is seeking to sell its ownership share of NGS. Because assumptions related to capital recovery for investor-owned utilities (e.g., Arizona Public Service) differ from publicly-owned utilities (e.g., Salt River Project), the total cost of controls will differ depending on whether LADWP�’s share of NGS is purchased by an investor-owned utility or a publicly-owned utility. The affordability analysis included in the docket for this proposed rulemaking models both scenarios for future ownership of LADWP�’s share and shows that the cost of new controls is higher if LADWP�’s share is purchased by an investor-owned utility because the capital recovery calculation for these types of entities includes a rate of return for investors that would not be included for publicly-owned utilities. Because LADWP is a publicly-owned utility, the results presented in Table 18 are based on continuation of the status-quo (i.e., LADWP�’s share of NGS is purchased by another publicly-owned utility). If the LADWP�’s share of NGS is purchased by an investor-owned utility, the results of the affordability analysis show different results, such that the 25-year NPV for the SCR case becomes more costly than the 25-year NPV case for the low market scenario.
Table 18: Summary of Cost after Installing SNCR and SCR versus Market Trends if Compliance with BART by 2018
SNCR SCR Market Low Market Mid Market High Increase in 25-
year Net Present Value from BAU
($ millions)
$255 $648 $673 $951 $1,040
133 See Energy Strategies report: �“Affordability Analysis for NGS BART Options.pdf�”, and three excel spreadsheets titled �“Model �– NGS BART Affordability Analysis 01-16-13�”, �“M&I User Consolidated water cost impact analysis�”, and �“NIA �– water use and supply projections�”. 134 The owners of NGS and the Navajo Nation are currently in negotiation to renew the site lease for NGS. When the site lease for Four Corners Power Plant was renewed, the lease cost increased by roughly $7 million per year. Although it is not yet known how much the lease costs for NGS will increase, we expect they will increase, and conservatively modeled in the affordability analysis an increase that is roughly double the increase for Four Corners Power Plant. If actual lease costs increase by a smaller amount than $15 million per year, the difference between the SCR and low market cases would be larger than as shown in Table 18.
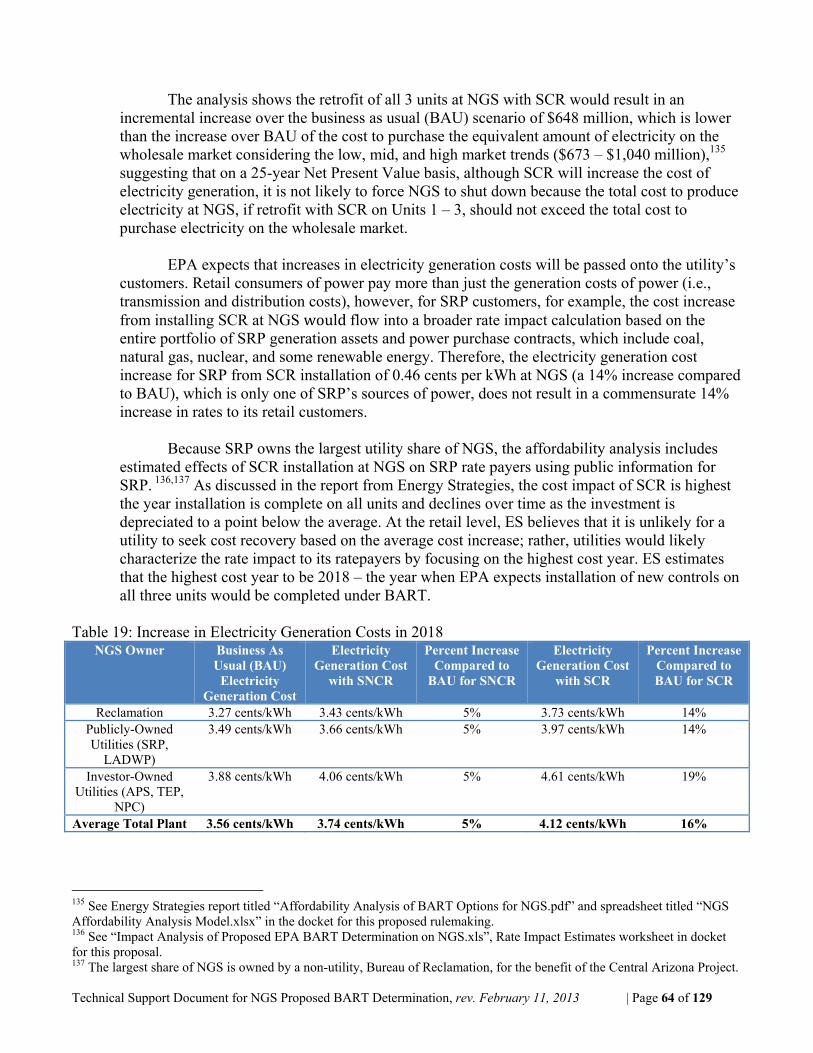
Technical Support Document for NGS Proposed BART Determination, rev. February 11, 2013 | Page 64 of 129
The analysis shows the retrofit of all 3 units at NGS with SCR would result in an
incremental increase over the business as usual (BAU) scenario of $648 million, which is lower than the increase over BAU of the cost to purchase the equivalent amount of electricity on the wholesale market considering the low, mid, and high market trends ($673 �– $1,040 million),135 suggesting that on a 25-year Net Present Value basis, although SCR will increase the cost of electricity generation, it is not likely to force NGS to shut down because the total cost to produce electricity at NGS, if retrofit with SCR on Units 1 �– 3, should not exceed the total cost to purchase electricity on the wholesale market.
EPA expects that increases in electricity generation costs will be passed onto the utility�’s
customers. Retail consumers of power pay more than just the generation costs of power (i.e., transmission and distribution costs), however, for SRP customers, for example, the cost increase from installing SCR at NGS flow into a broader rate impact calculation based on the entire portfolio of SRP generation assets and power purchase contracts, which include coal, natural gas, nuclear, and some renewable energy. Therefore, the electricity generation cost increase for SRP from SCR installation of 0.46 cents per kWh at NGS (a 14% increase compared to BAU), which is only one of SRP�’s sources of power, does not result in a commensurate 14% increase in rates to its retail customers.
Because SRP owns the largest utility share of NGS, the affordability analysis includes
estimated effects of SCR installation at NGS on SRP rate payers using public information for SRP. 136,137 As discussed in the report from Energy Strategies, the cost impact of SCR is highest the year installation is complete on all units and declines over time as the investment is depreciated to a point below the average. At the retail level, ES believes that it is unlikely for a utility to seek cost recovery based on the average cost increase; rather, utilities would likely characterize the rate impact to its ratepayers by focusing on the highest cost year. ES estimates that the highest cost year to be 2018 �– the year when EPA expects installation of new controls on all three units would be completed under BART.
Table 19: Increase in Electricity Generation Costs in 2018
NGS Owner Business As Usual (BAU)
Electricity Generation Cost
Electricity Generation Cost
with SNCR
Percent Increase Compared to
BAU for SNCR
Electricity Generation Cost
with SCR
Percent Increase Compared to BAU for SCR
Reclamation 3.27 cents/kWh 3.43 cents/kWh 5% 3.73 cents/kWh 14% Publicly-Owned Utilities (SRP,
LADWP)
3.49 cents/kWh 3.66 cents/kWh 5% 3.97 cents/kWh 14%
Investor-Owned Utilities (APS, TEP,
NPC)
3.88 cents/kWh 4.06 cents/kWh 5% 4.61 cents/kWh 19%
Average Total Plant 3.56 cents/kWh 3.74 cents/kWh 5% 4.12 cents/kWh 16%
135 See Energy Strategies report titled �“Affordability Analysis of BART Options for NGS.pdf�” and spreadsheet titled �“NGS Affordability Analysis Model.xlsx�” in the docket for this proposed rulemaking. 136 See �“Impact Analysis of Proposed EPA BART Determination on NGS.xls�”, Rate Impact Estimates worksheet in docket for this proposal. 137 The largest share of NGS is owned by a non-utility, Bureau of Reclamation, for the benefit of the Central Arizona Project.

Technical Support Document for NGS Proposed BART Determination, rev. February 11, 2013 | Page 65 of 129
ES used the 2009 FERC F1 filings that report the 2009 total retail sales (in kWh) and 2009 total retail revenues ($) to get an average retail rate over 2009. This methodology involves numerous conservative simplifying assumptions to estimate the affect of new controls on retail rates. Revenues, in nominal dollars, and sales (in kWh) from 2009 were estimated for 2018 (the expected completion date for the installation of new controls on all 3 units) by applying a 1.5% escalation factor each year from 2009 �– 2017. This escalation factor is conservative and within the range of historical increases. This calculation also assumes that 100% of the increase in cost from new controls is passed onto retail customers, and does not include changes in ownership, or life-extending capital investment, or other environmental regulations.
The increase in generation costs resulting from new controls, using the 2018 increase in
generation costs, is multiplied by the utility's share of NGS's electricity generation (in kWh) to calculate SRP�’s share of the increase in cost resulting from new controls. This cost is added to the 2009 retail revenues (escalated to 2018 by 1.5% annually) and then divided by estimated retail sales (kWh) based on 2009 sales (escalated to 2018 by 1.5% annually). This results in the estimated retail rate with installation and operation of SCR and SNCR. The increase in the retail rate is then estimated by subtracting the estimated retail rate without new controls from the estimated rate with new controls. Using this methodology, ES estimates that the increase in retail rates to SRP rate payers from the installation and operation of SCR will be $0.0006/kWh (0.06 cents per kilowatt-hour), a 0.65% increase in the average 2009 estimated retail rate. This is comparable to the retail rate increase projected by NREL for SRP customers of 0.5 �– 0.6%.138
The NREL report states that even with rate increases resulting from SCR, NGS would
still be one of the lowest cost generators in the Desert Southwest. The NREL study and the ES study both suggest that installing SCR (or SNCR) at NGS would likely cost less than shutting down NGS and replacing it with power from elsewhere in the West.
b. Projected Impacts on Water Rates in Arizona
In addition to impacts on electricity customers that purchase power from the owners of
NGS, numerous parties submitted comments on the ANPRM that raised concerns about the potential impact to water customers of the Central Arizona Water Conservation District (CAWCD). As part of our analysis, ES evaluated the potential increases in water costs to various CAP customers. EPA expects that costs associated with Reclamation�’s share of capital improvements at NGS are passed onto CAP customers in the variable OM&R costs, i.e., �“pumping energy rate�”. Based on advisory rates (generated in 2011), CAWCD estimates the pumping energy rate to be $58 per acre-foot ($58/AF) in 2016. In 2016, the fixed OM&R cost (delivery charge) is estimated to be $83 /AF, thus Municipal and Industrial (M&I) CAP customers are estimated to pay at least $141 /AF for water ($58 + $83/AF), whereas non-Indian agricultural (NIA) users and Indian water users are estimated to pay only $58/AF (the pumping energy rate).139
Based on an analysis similar to the one used to estimate potential electricity rate increases
to SRP customers, ES estimated that the increased electricity generation cost at NGS from the
138 See Table 1-12 on page 19 of the NREL report. 139 EPA understands that NIA users pay only the pumping cost of energy per in exchange for limited use of CAP water that will decline to zero over time. See Addendum to Energy Strategies report titled �“Economic Analysis of CAP Water Rates�” and references therein in the docket for this proposed rulemaking.

Technical Support Document for NGS Proposed BART Determination, rev. February 11, 2013 | Page 66 of 129
installation of SCR on all three units may result in an pumping energy rate increase of $8.40/AF (in 2018, the highest impact year). Assuming that water rates in 2018 will not increase from 2016 advisory rates , an increase of $8.40/AF represents an estimated 6% increase in the CAP water rate paid by M&I users, and a 14.5% increase in the CAP water rate paid by NIA and Indian water users, who only pay the pumping energy rate. The actual impact in terms of total water costs to individual CAP customers will depend on whether the customer uses exclusively CAP water, or if it uses CAP water in addition to water from other sources, such as other sources of surface water, groundwater, or reclaimed water. Estimated impacts to various classes of water customers (NIA and M&I) are discussed in more detail below.
For comparison, in its report, NREL estimated a range of potential water cost increases
based on SCR cost estimates from National Park Service (�“low SCR rate�”) and from the S&L report for SRP (�“high SCR rate�”). We report the high SCR rate cost increases in Table 20 below. The increases in water costs calculated by NREL based on the high SCR cost estimates are slightly higher than EPA�’s estimates. A separate analysis for the Gila River Indian Community by Harvey Economics (this analysis is discussed in more detail below) estimated pumping cost increases that are lower than both NREL and EPA estimates.
Table 20: Estimated Pumping Cost Increase from SCR NREL High EPA NREL Low Harvey
Pumping Cost Increase $8.58 / AF $8.40 / AF $7.10 / AF $6.60 / AF % Increase in Water Rates
to M&I 7% 6% 6% Not calculated
% Increase in Water Rates for Tribes and Agriculture
16% 14% 13% 11%
Table 20 shows that our projected increase in pumping energy rates for CAP water is similar, but slightly lower than that projected by NREL for the high SCR rate. The increase in CAP water pumping costs projected by Harvey Economics is considerably lower than the rate increases projected by EPA and NREL.
c. Sensitivity to Other Uncertainties As the Navajo Nation, Hopi Tribe, and other commenters discussed in their comment
letters on the ANPRM, other factors would affect whether the plant owners choose to retire NGS, including lease negotiations, future regulations targeting greenhouse gas emissions, mercury and HCl emissions (Mercury and Air Toxics Standards - MATS), and ash handling (coal combustion residues).
There is considerable uncertainty related to potential future greenhouse gas regulations
and the effect on the remaining owners of NGS when LADWP divests its ownership interest in NGS possible as early as 2015.140 ES describes three types of risk, (regulatory, economic, and market), that each owner must consider when determining whether investment in SCR meets the needs of their stakeholders (rate payers, regulators, owner boards, and shareholders). Because of
140 See, for example, article available at: http://www.power-eng.com/articles/2013/january/ladwp-may-sell-share-in-coal-fired-power-plant-switch-another-to-natural-gas.html

Technical Support Document for NGS Proposed BART Determination, rev. February 11, 2013 | Page 67 of 129
the uncertainty associated with these upcoming regulations and the complexity in determining the appropriate level of risk for each owner, EPA has determined that our BART determination cannot give a significant amount of weight on conjectures regarding the future decisions of NGS owners. In the absence of compelling evidence of closure in the near future resulting from one or more regulatory factors, EPA is relying on the results of our analysis that shows that based on the 25-year NPV, SCR or SNCR will not cause the cost of electricity generation to exceed the wholesale market cost of electricity. EPA understands and is sensitive to the important role NGS plays in the economies of the Navajo Nation and Hopi Tribe. As long as NGS continues to burn coal from the Kayenta Mine to produce electricity, royalties, taxes, lease payments, and other sources of revenue associated with NGS should continue for the Navajo Nation and Hopi Tribe. Because our analysis suggests that SCR or SNCR should not force electricity production costs to be uneconomical compared to market costs of power, EPA does not expect adverse impacts to the Navajo Nation and Hopi Tribe from any of the BART options (SCR, SNCR, and LNB/SOFA) under consideration.
EPA finalized the MATS rule in December 2011, setting emission limits for mercury and
filterable PM, among other pollutants. The final rule was published in the Federal Register on February 16, 2012 (77 FR 9304) and is effective on April 16, 2012. Units 1 �– 3 at NGS generally already meet the filterable PM limit of 0.03 lb/MMBtu. The mercury limit set in the final HAPS rule for coal-fired units not burning low-rank virgin coal is 1.2 pounds per trillion Btu (lb/TBtu). EPA estimated baseline HAP emissions for NGS to be roughly 1.25 lb/TBtu.141 SRP indicated to EPA that it has tested the use of calcium bromide in combination with the existing wet scrubbers for mercury control to determine if NGS, and other similar units owned by SRP, could comply with the mercury standard without the installation of new baghouses. SRP has stated that it is �“cautiously optimistic�” that baghouses will not be needed at NGS because the reaction between mercury and calcium bromide and their subsequent capture in the wet scrubber should be sufficient to meet the mercury limit in MATS. SRP has indicated that they have observed some re-emission of mercury following capture by the wet scrubber, but that they are working through this issue and plan to coordinate with EPA, as appropriate, to implement techniques that will lead to permanent capture of mercury by the wet scrubber. The compliance date for MATS is April 16, 2015, but EPA is encouraging state and local permitting authorities to make widely available, at their discretion, an additional year for compliance (i.e., compliance by April 16, 2016). For completeness, EPA included baghouse costs in our affordability analysis, and determined that, on a 25-year Net Present Value basis, the electricity generation costs after installing SCR and baghouses on all three units at NGS may exceed the wholesale market cost of power.142 However, based on the information provided by SRP on calcium bromide injection, EPA is preliminarily concluding that the comparison of electricity generation costs for SCR against market costs should not include the cost of baghouses, whether for MATS compliance, or for a future PSD permit (as discussed in Section 3.0 Costs of Compliance).
EPA notes that many of the uncertainties (see Table 21) facing NGS that will impact the
decision between investing in new air pollution controls and closure, including, on-going lease and right-of-way negotiations with the Navajo Nation and the renewal of the coal contract with
141 See spreadsheet titled �“mats_final_current_baseline_hap_inventory.xlsx�” from the final MATS rulemaking, also included in the docket for this proposed rule. 142 See report from Energy Strategies titled �“Economic Analysis of Proposed EPA BART Determination�” in the docket for this proposed rulemaking.

Technical Support Document for NGS Proposed BART Determination, rev. February 11, 2013 | Page 68 of 129
Peabody Energy, are unrelated to EPA and are within the control of many of the stakeholders that stand to benefit most from continued operation of NGS.
Table 21: Lease, Permit and Contract Renewals Required for NGS or Kayenta Mine Description Renewal Year or Comments
Water Service Contract 2014 Coal Supply Contract between Peabody and NGS Currently under renegotiation
Peabody Lease Renewal with Navajo Nation and Hopi Tribe 2017 NGS Project Lease Renewal with Navajo Nation (Federal Rights of Way) 2019
Water Intake/Water Line Renewal (Federal Rights of Way) 2019 Railroad and Transmission Line Renewals (Federal Rights of Way) 2021
Southern Transmission Line Easement (Federal Rights of Way) 2022 Mining Permit 2024/25
Mining Plan Approval 2024/25 Permit for small parcel for water intake from Lake Powell 2032
Energy Strategies explored the sensitivity of the affordability analysis to future changes
in wholesale market prices, lease costs, and coal prices. As discussed in more detail in the report included in the docket for this proposed rulemaking, the comparison between 25-year NPV for electricity generation under the BAU, SNCR, and SCR installation cases are compared against purchasing an equivalent amount of electricity on the wholesale market. Thus, the 25-year NPV market prices are sensitive to the market price forecast. In turn, the market price forecast is sensitive to the price of natural gas. The affordability modeling results (as shown in Table 18 and Table 19) are based on a market price forecast that uses the average natural gas price over 2012 (as of November 27, 2012). As discussed in more detail in the Energy Strategies report, a 10% reduction in natural gas price is expected to make the 25-year NPV for SCR more expensive than the low market case, and a 20% increase in the market price would result in the 25-year NPV for the low market case that is 13% higher than the 25-year NPV for the low market case. These results indicate that the affordability analysis is highly influenced by changes in the market prices forecast.
The affordability analysis was conducted with the understanding that the owners of NGS
and the Navajo Nation were undergoing negotiations to renew the site lease for NGS. As noted in the Energy Strategies report, renewal of the lease for the Four Corners Power Plant, also on the Navajo Nation, resulted in an increase of roughly $7 million per year. Energy Strategies elected to conservatively assume that the lease costs for NGS will increase by $15 million per year in 2020 (the year following lease expiration in 2019), affecting the BAU, SNCR, and SCR cases (as shown in Table 18 and Table 19). The sensitivity analysis showed that if site lease costs increased by only $5 million, the 25-year NPV for BAU and SCR cases both decrease slightly,143
Finally, the Energy Strategies report also examined sensitivity of the affordability results
to the cost of coal (fuel costs). Changes in the cost of fuel are expected to affect operating expenses for the BAU and control technology cases (i.e., SNCR and SCR). The results suggest that a 20% reduction in the fuel costs would make SCR much less costly than the low market
143 For comparison, when the lease for the Four Corners Power Plant was renewed by the Navajo Nation in 2011, lease payments increased by $7 million per year.

Technical Support Document for NGS Proposed BART Determination, rev. February 11, 2013 | Page 69 of 129
case. A 20% increase in fuel costs would cause the 25-year NPV for the low market case to be lower than the 25-year NPV for SCR installation.
The ICF Report commissioned by the Hopi Tribe in 2010 used ICF�’s IPM model to
examine whether a combination of several stringent environmental requirements would make continued operation of NGS uneconomical. Similar to EPA�’s analysis comparing the cost of electricity generation against the cost to purchase an equivalent amount of power on the wholesale market, the ICF study examined costs associated with potential environmental regulations against the price of natural gas, however, the ICF study assumed stringent requirements to control mercury under MATS and incorporated assumptions for a cap and trade program for CO2. As there are no plans in place to develop a national, market-based program to reduce greenhouse gas emissions, it would be too speculative to add a price for CO2 allowances into this analysis. Additionally, as stated previously, SRP, the operator and co-owner of NGS, is �“cautiously optimistic�” that baghouses will not be needed at NGS to comply with MATS, therefore, EPA only evaluated baghouses as a sensitivity analysis for our study. The ICF study assumed capital cost of SCR to be $663 million and baghouses and an activated carbon injection system to comply with MATS to be $450 million. The study further assumed stringent requirements for a CO2 trading program with a CO2 allowance price of $102 per ton. Based on these assumptions, the ICF study suggested that if average natural gas prices over the remaining life of NGS were at or below $5.60 per MMBtu, continued operation of NGS would not be economical. The results from the ICF study cannot directly be compared against the results of EPA�’s analysis, however, both studies do suggest that natural gas prices are an important variable, and that SCR in combination with additional capital investments may affect the economics of continued operation compared to the wholesale market.
d. Potential Impacts to Tribes Located in Arizona As discussed previously, CAWCD operates, maintains, and is responsible for repayment
to the Federal Government for the Central Arizona Project (CAP). Reclamation�’s 24.3% ownership share (approximately 4.3 Terawatt-hours,144 or TWh) in power produced by NGS is used by CAP to pump surface water from the Colorado River to municipal, industrial, agricultural, and tribal water users in Arizona. CAP uses about 2.8 TWh of NGS power (92% of CAP�’s power needs) per year. Excess power owned by Reclamation that is not used by CAP (about 1.5 TWh) is sold and profits are deposited into the Lower Colorado River Basin Development Fund (Development Fund). This fund was originally authorized under the Colorado River Basin Act of 1968 for the purpose of repaying the federal government for the cost to build CAP, and subsequent settlement acts with several tribes located in Arizona authorized use of the fund to pay the delivery portion of the cost of CAP water (fixed OM&R costs) for certain Indian Tribes, and to pay the costs to construct the delivery systems to bring CAP water to certain Indian Tribes. Reclamation, CAWCD, and several Tribes submitted detailed comments on the ANPR to EPA outlining the potential effects that requiring SCR as BART for NGS might have on the cost water and Indian water settlement agreements. EPA�’s understanding of the relationship between NGS, Reclamation, NGS, CAP, and tribes is shown in Figure 2.
144 1 Terawatt = 1012 Watts, or 106 Megawatts.

Technical Support Document for NGS Proposed BART Determination, rev. February 11, 2013 | Page 70 of 129
Figure 2: EPA�’s Understanding of the Relationship Between Reclamation, NGS, CAP, and Tribes
Tribal Water Customers
As Tribes use more of their CAP allocations,
NIA water use will decrease and
eventually go to zero
CAWCD Annual Repayment Obligation: ~$55 million per year
Additional Revenues credited to CAWCD�’s annual repayment obligation:
Hoover Dam and Parker Davis Surcharge ($4.25 million per year); NGS O&M revenues, sale of SO2
credits, CAP Land ($2 million per year)
Arizona Water Settlement Act (2004)
$55 million per year (1st cascade)
Any $ in Excess of ~$55 million
(2nd cascade)
Tribes in Arizona with CAP Water Allocations or Using CAP Water Tribe Allocation Gila River 311,800 AF/y Ak-Chin 85,000 Tohono O�’odham 74,000 San Carlos Apache 60,665 White Mountain Apache 23,782 Fort McDowell 18,233 Salt River Pima-Maricopa 13,300 Navajo Nation 6,411 Yavapai-Apache Nation 1,200 Hopi Tribe 1,000 Pascua Yaqui 500 Yavapai-Apache Nation 500 Tonto Apache Nation 128
Bureau of Reclamation
24.3 % Ownership Share (~ 547 MW) in Navajo
Generating Station
Central Arizona Project (CAP) to use Arizona�’s 2.8 million AF entitlement of the Colorado River. CAP is operated by the Central
Arizona Water Conservation District (CAWCD).
Colorado River Basin Project Act (1968) authorized:
~ 2.8 million MWh per year, sold at
production cost, to pump water
Surplus NGS Power Sales (1.6 million MWh). As of Oct 2011, SRP buys select on-peak power for
$25 million + production costs in 20 year contract. WAPA markets the remaining power. Total gets
credited to CAWCD�’s annual repayment obligation. Municipal and Industrial (M&I)
Water Customers
Non-Indian Agricultural Customers (NIA)
First Cascade 1. Fixed OM&R costs for Tribal Water
Deliveries 2. Gila River OM&R Trust Fund
(Aggregate $53 million) 3. GRIC San Carlos Irrigation Project
Rehabilitation ($147 million) 4. New Mexico Unit ($66 million total) 5. Distribution Systems (GRIC, San
Carlos Apache, Tohono O�’odham, Yavapai Apache, Pasqua Yaqui, Tonto Apache)
6. Future Indian Water Settlement Subaccount ($250 million total)
Lower Colorado River Basin Development Fund (Development Fund)
Second Cascade 1. Fixed OM&R costs for Tribal
Water deliveries 2. Final Year�’s Payment on CAP
Repayment Obligation 3. Payment to US Treasury to
reimburse Fixed OM&R Costs for Tribal Water deliveries and Indian Water Rights settlement costs
4. Payment to US Treasury to reimburse 9(d) debt made non-reimburseable under AWSA Apache)
5. US Treasury General Fund

Technical Support Document for NGS Proposed BART Determination, rev. February 11, 2013 | Page 71 of 129
Prior to October 1, 2011, excess Reclamation power not used by CAP (about 1.5 TWh) was sold to SRP under a series of long-term contracts known collectively as the Four-Party Agreements. Under these contracts, in exchange for the use of the excess power, SRP deposited $21.75 million into the Development Fund each year. This amount was credited towards CAWCD�’s annual repayment obligation to the federal government, set by an amortization schedule, of approximately $55 million per year, ending in 2044, with two additional lower payments in 2045 and 2046. Additional miscellaneous revenues to the Development Fund, for example from electricity surcharges from the Hoover Dam and Parker-Davis Dam, are also credited to CAWCD�’s annual repayment obligation. In other words, CAWCD is obligated to ensure that approximately $55 million annually is deposited into the Development Fund, however, numerous additional revenue sources are allowed to be credited against CAWCD�’s payment obligation, so that actual CAWCD annual payments would typically not exceed $33 million. This relationship was described in the NREL report as in a 2009 letter from CAWCD to EPA.145
In its 2009 letter, CAWCD describes how increasing electricity production costs if SCR
were required would reduce annual revenues to the Development Fund from surplus NGS power sales. However, because surplus power sale revenues are credited against CAWCD�’s repayment obligation, if those revenues decline, CAWCD must make up the difference in its annual payments to the Development Fund. Therefore, until the end of its repayment obligation (2044 �– 2046), CAWCD will continue to ensure that approximately $55 million per year will be deposited into the Development Fund. CAWCD�’s annual repayment obligation to the Development Fund is used to pay various prioritized costs, including fixed OM&R costs for CAP Indian Deliveries, tribal irrigation projects, and tribal water distribution systems.146 These priorities are known as the �“first cascade�” of priorities. EPA understands that given CAWCD�’s obligation to ensure annual payments into the Development Fund of approximately $55 million, from the tribal perspective, these �“first cascade�” of priorities for tribal water uses are not in jeopardy if electricity production costs rise at NGS. CAWCD, however, has stated that in order to make up for lower credited revenues from surplus NGS power sales, CAWCD may need to increase water service charges and/or ad valorem taxes. 147 CAWCD further states that SCR would impact potential revenues in excess of CAWCD�’s annual repayment obligation, which are designated to apply to a �“second cascade�” of priorities, which also includes fixed OM&R costs for CAP Indian Deliveries. EPA notes that payments of fixed OM&R costs for CAP Indian Deliveries are the first priority use under both the first and second cascades.
During a conference call between Reclamation and EPA on February 13, 2012,
Reclamation explained that in the event that excess power sales generate revenues in excess of CAWCD�’s annual repayment obligation, paying for fixed OM&R costs out of the second cascade is a benefit to tribes because it offsets that amount that would have been paid under the first cascade, allowing lower priority tribal projects under the first cascade to receive those
145 Letter from David Modeer, CAP to Colleen McKaughan, EPA, re: �“Assessment of Anticipated Visibility Improvements at Surrounding Class I Areas and Cost Effectiveness of Best Available Retrofit Technology for Four Corners Power Plant and Navajo Generating Station: Advanced Notice of Proposed Rulemaking, Docket No. EPA-R09-0AR-2009-0598 - Your Letter of November 25, 2009�”. December 18, 2009. 146 See presentation developed by Reclamation titled �“Development Fund Power Point to EPA (2).pptx�”, and �“BOR Answers to EPA Questions (2).pdf�” in the docket for this proposed rulemaking. 147 CAWCD has authority to levy ad valorem taxes of up to 10 cents per $100 assessed valuation of property within the District�’s service area to fund administrative costs and repayment of CAP construction costs. The current ad valorem tax is set at 6 cents per $100 assessed valuation.

Technical Support Document for NGS Proposed BART Determination, rev. February 11, 2013 | Page 72 of 129
available funds. However, the NREL report states that even if SCR were not required at NGS, the second cascade of priorities will only receive revenues when market power prices are substantially higher than current market prices. 148 Thus, EPA understands that the potential to generate revenues in excess of the CAWCD�’s repayment obligation from surplus NGS power sales are more heavily influenced by market power prices (which are impacted by the price of natural gas) than by additional electricity production costs associated with SCR.
CAWCD�’s letter to EPA was written in 2009, prior to the expiration of the Four-Party
Agreement on September 30, 2011. Thus, EPA understands that CAWCD�’s discussion related to NGS surplus power sale revenues it expected in 2012 and beyond is no longer applicable.149 Under the post-Four Party Agreement arrangement, SRP has signed a contract to receive 220,000 MWh for an annual payment of $25 million in addition to paying for the production costs of that power. The remaining surplus power will be marketed by the Western Area Power Administration on behalf of Reclamation. The total revenues from surplus NGS power sales will still be credited against CAWCD�’s annual repayment obligation; however, these revenues are expected to be highly variable and largely dependent on the market price for power at the time of sale and NGS power production costs.150 Therefore, under the post-October 1, 2011 agreements, EPA understands that $25 million (from SRP for 220,000 MWh) is guaranteed to be credited against CAWCD�’s annual repayment obligation of $55 million, and miscellaneous sources of revenues continue to exist that will also be credited against CAWCD�’s repayment obligation. Additional revenues from the remaining surplus NGS power sales will also be credited to CAWCD, but if remaining surplus power is sold at a loss, CAWCD must cover the loss through its obligation to ensure that $55 million per year is deposited into the Development Fund. Thus, EPA understands that from the perspective of the tribal CAP water users, the change in structure, since October 1, 2011, of how excess NGS power is sold, does not directly affect Tribes; however, it does affect the level of risk borne by CAWCD in terms of how much CAWCD must pay to ensure $55 million goes to the Development Fund.
After CAWCD�’s annual repayment obligation ends (in 2044 or 2046, per its amortization
schedule), the guaranteed revenue of $55 million per year to the Development Fund ends. It is not clear to EPA how the current revenue streams might change if NGS continues to operate beyond 2044. If NGS closes after CAWCD�’s repayment obligation ends (at its projected �“end of useful life�”) or if Reclamation�’s share of NGS power is no longer available to CAWCD after 2044, CAWCD must find a new source of power (that will likely be more expensive if it must purchase at market rate), and substantial revenues to the Development Fund will no longer exist. Even in the absence of new control requirements at NGS, tribes that depend on the Development Fund to subsidize the cost of water, as well as other users of CAP water, will be impacted at the end of NGS�’s useful life, unless Reclamation or Congress creates or approves other sources of revenue for the Development Fund.
EPA understands that at least sixteen tribes in Arizona: (1) have water settlement
agreements that allocate CAP water to the tribes in exchange for releasing rights and claims to other surface and groundwater resources in Arizona; (2) are in the process of negotiating CAP water settlement agreements; or (3) use CAP water through a contract (see Table 22). EPA
148 See page 58 of the NREL report. 149 See footnote 12 of the December 18, 2009 letter to EPA detailing its expectation that after 2012 when a bond indenture expires, it expects NGS surplus power sales to generate $50 million or more towards its $55 million annual repayment obligation. 150 See page 55 of NREL study.

Technical Support Document for NGS Proposed BART Determination, rev. February 11, 2013 | Page 73 of 129
understands that these tribes generally each have different CAP allocations and unique water settlement agreements; therefore, potential impacts may be different for each tribe and should be considered individually. In a letter from CAP to DOI and EPA,151 in addition to the tribes listed in Table 22 below, CAP states that several other tribes have reached only partial settlement of water claims, or still have outstanding or unresolved claims that may seek to rely on CAP water. CAP lists the San Carlos Apache Tribe and the Tohono O�’odham Nation as having partial settlements, and lists the following tribes as also having unresolved water claims: Havasupai Tribe, Hualapai Tribe, Kaibab Band of Paiute Indians, Pascua Yaqui Tribe, San Juan Southern Paiute, Tonto Apache, Yavapai-Apache Nation (see Table 22). Various comment letters and the NREL report discuss CAP water rates in terms of �“fixed�” and �“variable�” OM&R costs. As stated previously, the fixed OM&R costs refer to costs associated with water distribution and delivery costs, which are typically only paid directly by municipal and industrial (M&I) users of CAP water. The variable OM&R costs refer to the cost of energy used to pump CAP water, which are typically paid by M&I users, as well as tribes and agricultural water users.
151 Letter from David V. Modeer, CAP, to David J. Hayes, DOI and Jared Blumenfeld, EPA, re: Comments on the National Renewable Energy Laboratory (NREL) Report, Navajo Generating Station and Air Visibility Regulations: Alternatives and Impacts (the �“Report�”), February 23, 2011 (EPA believes the letter is incorrectly dated as February 23, 2011 �– EPA received the letter in 2012, furthermore the NREL report was not released until 2012).
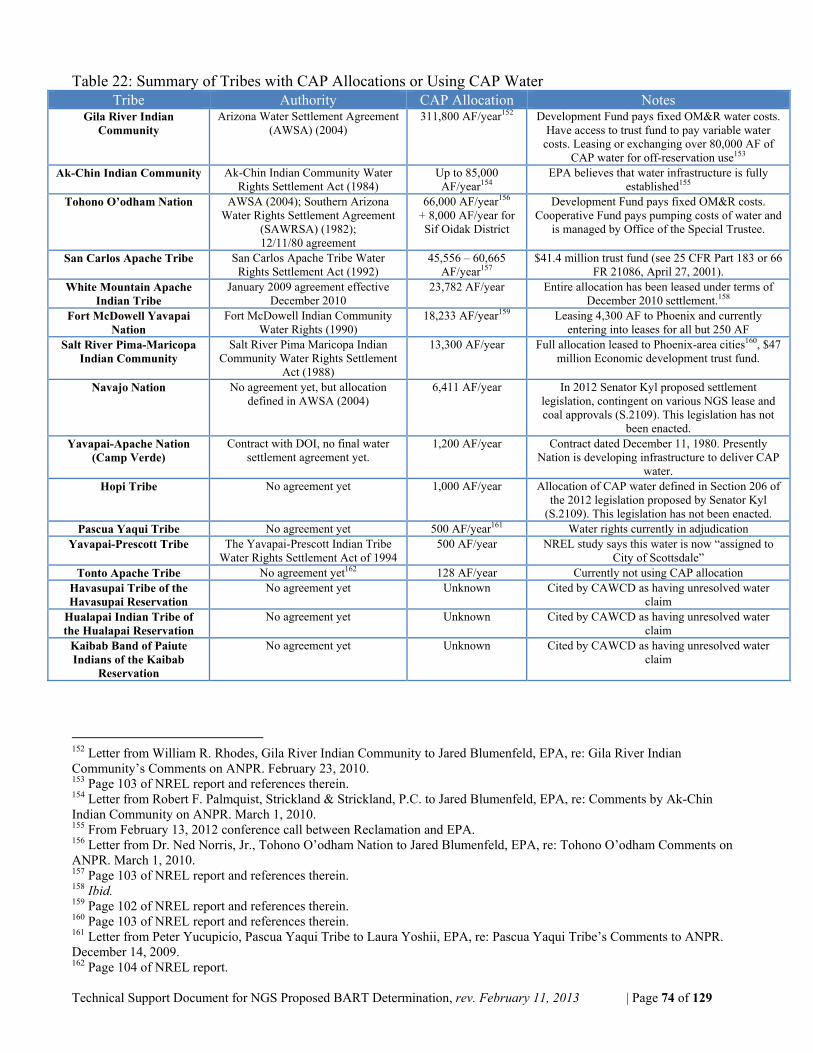
Technical Support Document for NGS Proposed BART Determination, rev. February 11, 2013 | Page 74 of 129
Table 22: Summary of Tribes with CAP Allocations or Using CAP Water Tribe Authority CAP Allocation Notes
Gila River Indian Community
Arizona Water Settlement Agreement (AWSA) (2004)
311,800 AF/year152 Development Fund pays fixed OM&R water costs. Have access to trust fund to pay variable water
costs. Leasing or exchanging over 80,000 AF of CAP water for off-reservation use153
Ak-Chin Indian Community Ak-Chin Indian Community Water Rights Settlement Act (1984)
Up to 85,000 AF/year154
EPA believes that water infrastructure is fully established155
Tohono O’odham Nation
AWSA (2004); Southern Arizona Water Rights Settlement Agreement
(SAWRSA) (1982); 12/11/80 agreement
66,000 AF/year156 + 8,000 AF/year for Sif Oidak District
Development Fund pays fixed OM&R costs. Cooperative Fund pays pumping costs of water and
is managed by Office of the Special Trustee.
San Carlos Apache Tribe San Carlos Apache Tribe Water Rights Settlement Act (1992)
45,556 �– 60,665 AF/year157
$41.4 million trust fund (see 25 CFR Part 183 or 66 FR 21086, April 27, 2001).
White Mountain Apache Indian Tribe
January 2009 agreement effective December 2010
23,782 AF/year Entire allocation has been leased under terms of December 2010 settlement.158
Fort McDowell Yavapai Nation
Fort McDowell Indian Community Water Rights (1990)
18,233 AF/year159 Leasing 4,300 AF to Phoenix and currently entering into leases for all but 250 AF
Salt River Pima-Maricopa Indian Community
Salt River Pima Maricopa Indian Community Water Rights Settlement
Act (1988)
13,300 AF/year Full allocation leased to Phoenix-area cities160, $47 million Economic development trust fund.
Navajo Nation No agreement yet, but allocation defined in AWSA (2004)
6,411 AF/year In 2012 Senator Kyl proposed settlement legislation, contingent on various NGS lease and coal approvals (S.2109). This legislation has not
been enacted. Yavapai-Apache Nation
(Camp Verde) Contract with DOI, no final water
settlement agreement yet. 1,200 AF/year Contract dated December 11, 1980. Presently
Nation is developing infrastructure to deliver CAP water.
Hopi Tribe No agreement yet 1,000 AF/year Allocation of CAP water defined in Section 206 of the 2012 legislation proposed by Senator Kyl
(S.2109). This legislation has not been enacted. Pascua Yaqui Tribe No agreement yet 500 AF/year161 Water rights currently in adjudication
Yavapai-Prescott Tribe The Yavapai-Prescott Indian Tribe Water Rights Settlement Act of 1994
500 AF/year NREL study says this water is now �“assigned to City of Scottsdale�”
Tonto Apache Tribe No agreement yet162 128 AF/year Currently not using CAP allocation Havasupai Tribe of the Havasupai Reservation
No agreement yet Unknown Cited by CAWCD as having unresolved water claim
Hualapai Indian Tribe of the Hualapai Reservation
No agreement yet Unknown Cited by CAWCD as having unresolved water claim
Kaibab Band of Paiute Indians of the Kaibab
Reservation
No agreement yet Unknown Cited by CAWCD as having unresolved water claim
152 Letter from William R. Rhodes, Gila River Indian Community to Jared Blumenfeld, EPA, re: Gila River Indian Community�’s Comments on ANPR. February 23, 2010. 153 Page 103 of NREL report and references therein. 154 Letter from Robert F. Palmquist, Strickland & Strickland, P.C. to Jared Blumenfeld, EPA, re: Comments by Ak-Chin Indian Community on ANPR. March 1, 2010. 155 From February 13, 2012 conference call between Reclamation and EPA. 156 Letter from Dr. Ned Norris, Jr., Tohono O�’odham Nation to Jared Blumenfeld, EPA, re: Tohono O�’odham Comments on ANPR. March 1, 2010. 157 Page 103 of NREL report and references therein. 158 Ibid. 159 Page 102 of NREL report and references therein. 160 Page 103 of NREL report and references therein. 161 Letter from Peter Yucupicio, Pascua Yaqui Tribe to Laura Yoshii, EPA, re: Pascua Yaqui Tribe�’s Comments to ANPR. December 14, 2009. 162 Page 104 of NREL report.

Technical Support Document for NGS Proposed BART Determination, rev. February 11, 2013 | Page 75 of 129
Following the ANPR in 2009, EPA has engaged in discussions, meetings, and consultations with several tribes in Arizona regarding NGS and water. These discussions with tribes and the additional information submitted by the tribes to EPA have been very helpful in understanding this complex issue. 163 The NREL report also provides additional information on tribal water settlement agreements.
The Gila River Indian Community (Gila River) contracted with Harvey Economics
(Harvey) to identify and estimate potential impacts to Gila River of a range of possible retrofit scenarios at NGS.164 Based on its analyses, Harvey estimated the highest impact of SCR on CAP water costs would occur in 2020 and would increase costs by 10.5% from the baseline scenario (pre-LNB/SOFA), a cost increase of $6.60/AF. Harvey estimated the cost increase from SCR plus baghouses ($12.85/AF increase, or 20.4%) to be nearly double the impact of SCR alone, and estimated the water cost increase if NGS closed to be over 55% compared to baseline. In its letter to Gila River, Harvey describes and quantifies Gila River�’s various sources of water and its expectations for water delivery volumes in the future, areas of land devoted to agriculture and the estimated operating margins associated with agriculture over time, personal income and employment losses, and potential impacts to Gila River from reduced revenue from surplus NGS power sales.
In its report, Harvey provides information on five sources of water for the Gila River
Indian Community: CAP, SRP, groundwater, reclaimed water, and the Gila River. In 2011, the Gila River Indian Community used over 37,000 AF of CAP water, representing 17% of its total water resources in 2011. Over time, Gila River projects that it will increase its use of CAP water to 140,000 AF (around 2040), as well as its use of groundwater and reclaimed water, such that CAP water will represent 31% of its total water resources. The ability of Gila River to expand its use of CAP water relies on disbursements from the Development Fund under the first cascade of priorities for Indian water infrastructure. Harvey reports that this increased use of water is projected to support growing water needs for cultivation of agricultural crops, in particular cotton and alfalfa (59% of total water requirements in 2050), and to a lesser extent, small grains, vegetables, and melons (15%). The remaining 26% of total water requirements was estimated to be lost during delivery and irrigation. Harvey further explains that CAP energy charges have increased an average of 4.73% per year over the past 15 years, which exceeds the anticipated growth rate of 3.7% for all costs used in an analysis of the Arizona Water Settlements Act (AWSA) of 2004. Thus, in the absence of any new controls at NGS, pumping rates for water paid by Tribes are still expected to increase annually. Harvey estimated that Gila River�’s agricultural operating margins would decrease by 10% if LNB/SOFA and SCR were required at NGS, nearly 17% if LNB/SOFA, SCR, and baghouses were required and nearly 200% if NGS closed. Harvey further estimated revenue losses to the Development Fund (which would only occur during periods of high market prices that result in excess power sale revenues exceeding CAWCD�’s annual repayment obligation) and projected that excess power sales revenues would not exceed the annual repayment obligation until 2020, and would be over $5.6 million per year if SCR were required. Although Gila River is not the only Tribe affected by this projected revenue loss, Harvey estimates that Gila River would be more impacted than any other Tribe because it has the largest CAP water allocation. Overall, Harvey estimated potential cumulative direct and indirect monetary losses to the Gila River Indian Community of $758 million through
163 See Timeline of all Tribal Consultation on NGS in the docket for this proposed rulemaking. 164 Letters from Edward F. Harvey, Harvey Economics, to Linus Everling, Gila River Indian Community Law Office, re: Proposed EPA BART Changes at NGS. November 16, 2011 and updated on March 15, 2012.

Technical Support Document for NGS Proposed BART Determination, rev. February 11, 2013 | Page 76 of 129
2044 under the LNB/SOFA plus SCR scenario.165 EPA is not providing a critical review of the methods, assumptions, or results from the Harvey Economics study.
The Ak-Chin Indian Community (Ak-Chin) has the second largest CAP water allocation
of 85,000 AF per year. EPA understands that Ak-Chin�’s water settlement does not rely on the Development Fund and that its settlement is fully implemented.166 EPA interprets full implementation to mean that the necessary infrastructure to allow Ak-Chin to use its full CAP entitlement has already been constructed.
In a comment letter to EPA, Dr. Ned Norris, Chairman of the Tohono O�’odham Nation
(Tohono O�’odham), describes his concerns related to the potential impacts of new controls at NGS.167 Under water settlement agreements in 1982 and 2004, the Tohono O�’odham have a CAP water entitlement of 66,000 AF per year, with an additional 8,000 AF per year allocation solely for irrigation to the Sif Oidak District. Chairman Norris explains that water delivery costs (fixed OM&R) are paid for the Nation by the Development Fund, and pumping costs of water (variable OM&R) are paid by a separate fund established by the 1982 and 2004 water settlement agreements called the Cooperative Fund. The Cooperative Fund is only available to the Tohono O�’odham and only interest accrued in the Cooperative Fund can be used. The NREL report states that the Cooperative Fund can also be used as back-up funding for fixed OM&R costs. This fund is managed by the Office of the Special Trustee within the Department of the Interior. If funds are no longer available in the Development Fund for fixed OM&R costs, and if interest accrued in the Cooperative Fund is not sufficient to finance costs of both variable and fixed OM&R costs, the Tohono O�’odham Nation is responsible for the remainder of CAP water charges. This is consistent with a statement in the NREL report that describes the settlement agreements to clarify that if the Development and Cooperative Funds are no longer available, the Tohono O�’odham are responsible for paying all CAP water charges to fulfill the settlement allocations.168 Additionally, the NREL report states that the Tohono O�’odham have not been able to access its CAP allocation because no delivery or distribution systems have been constructed, however, the comment letter from the Tohono O�’odham to EPA does not indicate that it is not receiving its CAP water allocation, nor does it discuss reliance on the Development Fund for the creation of its water infrastructure systems.
The San Carlos Apache Tribe (San Carlos Apache) did not submit comments to EPA on
our ANPR, but representatives of the San Carlos Apache did attend a consultation meeting related to NGS between tribes in Arizona and EPA in Phoenix, on September 16, 2011. EPA has not received information directly from the San Carlos Apache but understands that water rights and claims were settled in 1992 in the San Carlos Apache Tribe Water Rights Settlement Act, and the settlement act established two funds for the benefit of the San Carlos Apache: the San Carlos Apache Tribe Development Trust Fund, and the San Carlos Apache Tribe Lease Fund, administered by the Bureau of Indian Affairs.169 Principal and income from the Trust Fund can be used in several ways, including to put CAP water to beneficial use or to defray costs to the
165 See table on page 27 of the March 15, 2012 Updated Harvey Economics Letter to Gila River Indian Community on NGS Impacts, in the docket for this proposed rulemaking. 166 Letter from Louis J., Manuel, Jr. Ak-Chin Indian Community, to Janet McCabe, EPA, re: Navajo Generating Station Proposed Air Quality Regulations and the Federal Trust Responsibility. October 14, 2011. 167 Letter from Dr. Ned Norris, Jr., Tohono O�’odham Nation to Jared Blumenfeld, EPA, re: Tohono O�’odham Comments on ANPR. March 1, 2010. 168 Page 104 of the NREL report and references therein. 169 See 66 FR 21086, April 27, 2001.

Technical Support Document for NGS Proposed BART Determination, rev. February 11, 2013 | Page 77 of 129
tribe of CAP OM&R costs. Defined uses for the Lease Fund are unrelated to CAP water. Additionally, based on information on the San Carlos Apache in the NREL report, EPA understands that the CAP allocation to the San Carlos Apache is variable, ranging from 45,565 AF to 60,665 AF per year, and that some of the tribe�’s allocation comes from the unused portion of the Ak-Chin allocation. The NREL report further states that the San Carlos Apache are working with Reclamation on a water delivery system, that the Arizona Water Settlement Act (AWSA) provides funding to build a water system sufficient to delivery 12,700 AF per year of CAP water to the San Carlos Apache Tribe, and that currently, the San Carlos Apache lease a total of 26,500 AF per year of water to non-tribal users (the City of Scottsdale and to the Phelps Dodge Morenci Mine). EPA does not have additional information on the status of the San Carlos Apache Trust Fund, and whether the water delivery system the San Carlos Apache and Reclamation are currently working on is funded through the Lower Colorado River Basin Development Fund or through the San Carlos Apache Tribe Development Trust Fund. Because the San Carlos Apache have two separate funds established under a separate settlement act from the Lower Colorado River Basin Development Fund, EPA believes the San Carlos Apache Tribe would not be adversely affected by a requirement from EPA to require additional air pollution controls at NGS. Because EPA has not received information directly from the San Carlos Apache, and it is unclear the degree to which the San Carlos Apache can rely on the Lower Colorado River Basin Development Fund, EPA requests comment from the San Carlos Apache on potential effects of our proposed BART determination for NGS on its water settlement agreement.
The White Mountain Apache Indian Tribe (White Mountain Apache) did not submit
comments to EPA on our ANPRM and did not attend consultation meetings between EPA and tribes located in Arizona in 2011 and 2012. From the NREL report, EPA understands that the White Mountain Apache achieved a water settlement agreement in January 2009 (effective in December 2010), that allocated the tribe 23,782 AF per year of CAP water, and that the entire allocation has been leased under the terms of the settlement.170 If the White Mountain Apache were to use its CAP water allocation, NREL states that fixed OM&R water costs would be paid by the Development Fund, as long as funds are available. Because the tribe�’s full CAP water allocation is leased, EPA believes the White Mountain Apache would not be significantly affected by increased energy generation costs at NGS as a result of BART controls. Because EPA has not received information directly from the White Mountain Apache, and the duration of its lease of CAP water is unclear, EPA requests comment from the White Mountain Apache on potential effects of our proposed BART determination for NGS on its water settlement agreement.
In a comment letter to EPA from Dr. Clinton M. Pattea, President of the Fort McDowell
Yavapai Nation (Fort McDowell), Dr. Pattea described concerns related to CAP water cost increases, and also questioned whether control requirements on NGS would affect Fort McDowell�’s electric power allocation from several Federal hydroelectric generation facilities marketed by the Western Area Power Administration (WAPA). Dr. Pattea states that in order to utilize its electric power allocation, Fort McDowell selected SRP to accept Fort McDowell�’s power allocation and pass through the benefit of the power. EPA believes that a BART rulemaking on NGS would not affect agreements between Fort McDowell, SRP, or WAPA related to electric power allocations from Federal hydroelectric facilities. EPA understands that water claims for Fort McDowell were settled in 1990 (Fort McDowell Indian Community Water
170 See page 104 of the NREL report.

Technical Support Document for NGS Proposed BART Determination, rev. February 11, 2013 | Page 78 of 129
Rights), and the NREL report states that Fort McDowell has a CAP water allocation of 18,233 AF per year, and is currently leasing 4,300 AF to the City of Phoenix. The NREL report also states that the tribe is currently entering into annual leases for all but 250 AF of the balance. If Fort McDowell needs to develop infrastructure to utilize the remaining 250 AF of CAP water, EPA believes that Fort McDowell may be affected by a requirement to install additional air pollution controls at NGS. Because Fort McDowell�’s future intentions for its CAP water allocation are unclear, EPA requests comment from Fort McDowell on potential effects of our proposed BART determination for NGS on its water settlement agreement.
The Salt River-Pima Maricopa Indian Community (Salt River-Pima Maricopa) did not
submit comments to EPA on NGS (but did submit comments on Four Corners Power Plant related to potential effects of post-combustion controls on fly ash), and did not attend consultation meetings on NGS in 2011 or 2012. EPA understands that the Salt River-Pima Maricopa have a water rights settlement for 13,300 AF per year of CAP water, with a $47 million economic development trust fund. The NREL report states that the total Salt River-Pima Maricopa settlement includes water from different sources, totaling 122,400 AF per year, and that its full CAP allocation of 13,300 AF per year is leased to Phoenix-area cities. Thus, assuming the Salt River-Pima Maricopa CAP water allocation is leased under long-term contracts, EPA believes the Salt River-Pima Maricopa Indian Community will not be significantly affected by a requirement to install additional air pollution controls at NGS. Because Salt River-Pima Maricopa�’s future intentions for its CAP water allocation are unclear, EPA requests comment from Salt River-Pima Maricopa on potential effects of our proposed BART determination for NGS on its water settlement agreement.
The Navajo Nation does not have a final water settlement agreement yet, but the Arizona
Water Settlement Act of 2004 defines a CAP allocation of 6,411 AF per year to the Navajo Nation with a requirement that the settlement must be approved by Congress before December 31, 2030. On February 14, 2012, Senator Jon Kyl of Arizona introduced Senate Bill S.2109: �“Navajo-Hopi Little Colorado River Water Rights Settlement Act of 2012�”.171 This bill also defined an allocation of CAP water to the Hopi Tribe of 1,000 AF per year. This bill was not enacted and was referred back to Committee.172 It is unclear at this time when a final water settlement agreement for the Navajo Nation and Hopi Tribe will be implemented, what the terms of that settlement may be, and the degree of reliance of the settlement on CAP or the Development Fund.
The Yavapai-Apache Nation (Yavapai-Apache) submitted comments to EPA and
attended a consultation meeting with EPA on NGS in 2011. The Yavapai-Apache currently have a contract with DOI from December 11, 1980 for the delivery of 1,200 AF of CAP water and currently, the Yavapai-Apache are developing the infrastructure necessary to deliver the CAP contract water to its Reservation lands. If the Yavapai-Apache currently lack infrastructure to receive CAP water, the existing fate of the tribe�’s 1,200 AF of CAP contract water is not clear. The Yavapai-Apache have expressed concern that installation of new air pollution controls at NGS will affect their ability to achieve a final water settlement agreement, as well as the ability of the Development Fund to pay fixed OM&R charges for the tribe and support its water infrastructure development.
171 See Navajo-Hopi Little Colorado River Water Rights Settlement Act of 2012, S.2109, 112th Congress, 2D Session, February 14, 2012. Information also available at http://www.govtrack.us/congress/bills/112/s2109. 172 http://www.govtrack.us/congress/bills/112/s2109

Technical Support Document for NGS Proposed BART Determination, rev. February 11, 2013 | Page 79 of 129
The Pascua Yaqui Tribe (Pascua Yaqui) submitted comments to EPA expressing concern
that requiring additional air pollution controls at NGS would affect the tribe�’s ability to use CAP water and its ability to achieve a final water rights settlement in the future. The Pascua Yaqui currently lease 500 AF of CAP water per year, under a contract with the Department of Interior dated December 11, 1980. The NREL report states that the Pascua Yaqui take delivery of the full amount of contract water via an exchange with the City of Tucson. Although it is not clearly stated in the NREL report, or in the Pascua Yaqui letter to EPA, it appears the fixed OM&R water costs are also paid from the Development Fund for the Pascua Yaqui, therefore, it also appears that the tribe is responsible for variable OM&R water costs, as well as a fee of $15.17 per AF to the City of Tucson for storing the tribe�’s water.173 The NREL report further states that the Pascua Yaqui are currently claiming a water right of 3,520 AF per year and the claim is the subject of current adjudication.
The Yavapai-Prescott Indian Tribe (Yavapai-Prescott) has a water settlement agreement
(Yavapai-Prescott Indian Tribe Water Rights Settlement Act of 1994) that allocates 500 AF per year of CAP water to the Yavapai-Prescott. The NREL report states that the Yavapai-Prescott has �“assigned this water to the City of Scottsdale�”.174 It is unclear to EPA if this �“assignment�” of water represents a permanent lease of the water, and whether the Yavapai-Prescott plan to develop water infrastructure to use its CAP water allocation in the future. The Yavapai-Prescott did not submit comments to EPA on the ANPRM and did not attend consultation meetings on NGS held with tribes in Arizona in 2011 or 2012. Assuming that the Yavapai-Prescott CAP water allocation is leased under long-term contracts or if the Yavapai-Prescott does not plan to use its CAP water allocation, EPA believes the Yavapai-Prescott Indian Tribe will not be significantly affected by a requirement to install additional air pollution controls at NGS.
The Tonto Apache Tribe (Tonto Apache) have not submitted comments to EPA on the
ANPRM and did not attend consultation meetings on NGS held with tribes in Arizona in 2011 or 2012. EPA understands from the NREL report that the Tonto Apache have an allocation and a CAP water contract for 128 AF per year, but have not reached a water rights settlement agreement. The NREL report further states that the Tonto Apache are not using their CAP water allocation, have no existing authority to lease or exchange the water, and lack the infrastructure to receive its CAP allocation. Because the water infrastructure is not yet in place, if the Tonto Apache rely on the Development Fund for infrastructure construction, EPA believes that the Tonto Apache could be adversely affected by a requirement to install additional air pollution controls at NGS. Because EPA has not received information directly from the Tonto Apache, EPA requests comment from the Tonto-Apache on potential effects of our proposed BART determination for NGS on its water settlement agreement.
The Havasupai Tribe of the Havasupai Reservation (Havasupai), the Hualapai Indian
Tribe of the Hualapai Reservation (Hualapai), and Kaibab Band of Paiute Indians of the Kaibab Reservation (Kaibab Band) did not submit comments to EPA on the ANPRM or participate in consultation between EPA and tribes located in Arizona in 2011 and 2012. The letter from the CAWCD to DOI and EPA cited these three tribes as having unresolved water rights claims. The NREL report does not discuss these three tribes, and EPA does not have additional information. Assuming all unresolved water claims use CAP water and the Development Fund for fulfilling
173 See page 103 of NREL report and references therein. 174 See page 104 of NREL report.

Technical Support Document for NGS Proposed BART Determination, rev. February 11, 2013 | Page 80 of 129
settlement agreements (although it is not clear to EPA that the CAP/Development Fund must always be used as a model), then the Havasupai, Hualapai, and Kaibab Band could be adversely affected by a requirement to install additional air pollution controls at NGS, however, EPA requests comments from these tribes regarding specific concerns they may have and potential effects on their tribes of our proposed BART determination for NGS.
The Colorado River Indian Tribes, which includes four distinct tribes: the Mojave,
Chemehuevi, Navajo, and Hopi, did not submit comments to EPA on the ANPRM, but did attend the consultation meetings between EPA and tribes located in Arizona in 2011 and 2012. The NREL report and the letter from CAWCD to DOI and EPA did not discuss the Colorado River Indian Tribes or identify them as having an outstanding or unresolved water claim. EPA is not aware of how the Colorado River Indian Tribes (aside from the Navajo and Hopi portions of the Tribes) they may be affected by our BART determination for NGS. EPA requests comments from the Colorado River Indian Tribes regarding specific concerns they may have and potential effects on their tribes of our proposed BART determination for NGS.
In the preceding paragraphs, EPA discussed potential impacts to sixteen tribes in
Arizona. Of these tribes, EPA understands that nine tribes: Gila River, Ak-Chin, Tohono O�’odham, San Carlos Apache, White Mountain Apache, Fort McDowell, Salt River Pima-Maricopa, Navajo Nation, and the Yavapai-Prescott, have allocations to CAP water that have been finalized in settlement agreements. Of these nine tribes, four tribes several currently lease all or most of their CAP water allocations: White Mountain Apache, Fort McDowell, Salt River-Pima Maricopa, and Yavapai-Prescott. Eight tribes appear to be in the process of developing water settlement agreements: Hopi Tribe (and Navajo Nation, as required under the terms of their CAP allocation in the 2004 AWSA), Pascua Yaqui Tribe, Tonto Apache Tribe, and the Havasupai, Hualapai, and the Kaibab Band of Paiute Indians. EPA requests comments or supplemental information from these sixteen tribes, as well as other tribes located in Arizona where specific information was not available: the Colorado River Indian Tribes, the San Juan Southern Paiute Tribe of Arizona, Cocopah Indian Tribe, Quechan Indian Tribe, and the Chemehuevi Indian Tribe of the Chemehuevi Reservation.
d. Potential Impacts to Non-Indian Agriculture Users Agricultural water users in Arizona, referenced by CAWCD as the Non-Indian
Agriculture (NIA) users, pay only for the energy pumping costs of CAP water (variable OM&R). In its letter to DOI and EPA, CAWCD states that a critical component of the Arizona Water Settlement Act of 2004 was the relinquishment of CAP�’s NIA users of long-term entitlements to CAP water, allowing the DOI to settle water claims and reserve water for future settlement agreements. CAWCD states that �“in return, the NIA users expected to receive a quantity- and time-limited pool of CAP water at a price they could afford�”.175
According to CAWCD in its February 2012 letter, NIA users take delivery of
approximately 400,000 AF per year of CAP water, while tribal agricultural users take delivery of about 140,000 AF per year of CAP water and are increasing their use. The sum of all known tribal CAP allocations and contracts (as listed in Table 22) totals nearly 600,000 AF per year,
175 See February 23, 2012 from CAP to DOI and EPA regarding CAP�’s comments on the NREL report, page 11, in the docket for this proposed rulemaking.

Technical Support Document for NGS Proposed BART Determination, rev. February 11, 2013 | Page 81 of 129
however, as discussed above, many tribes with CAP water allocations cannot or do not use their full allocations and many tribes lease their allocations, in full or in part, to Arizona cities. EPA understands NIA users of CAP water are concerned about potential impacts of increasing costs of CAP water.176 Over the short term, EPA also understands that irrespective of a BART determination on NGS, variable OM&R water rates for CAP water have generally increased annually and are projected to continue to increase into the future. It is unclear to EPA how long NIA users expect to continue using CAP water, and whether the existing NIA users intend and are allowed to return to groundwater when the transition from NIA use of CAP water to Indian agriculture use of CAP water occurs, or if CAWCD and the farmers expect NIA users to cease operations when CAP water is no longer available for NIA use.
e. Potential Impacts to Municipal and Industrial Users The addendum to the report by Energy Strategies discusses potential impacts to the major
municipal users of CAP water.177 The addendum identifies the cities of Tucson, Phoenix, Scottsdale, and Mesa to have the largest municipal allocations of CAP water, and together represent roughly 60% of the CAP M&I water user allocations. As discussed above, the installation of SCR on all units at NGS is expected to increase water rates to M&I users by 6%. However, the impact to an individual M&I user�’s total water cost will depend on the amount of CAP water a given entity uses and the percentage the CAP water represents of the entity�’s total portfolio. The city of Tucson relies entirely on CAP for its water supply, therefore Tucson will experience the full 6% increase in its total water costs. In contrast, the cities of Phoenix, Scottsdale, and Mesa have several sources of water, and rely on CAP for 45 �– 70% of their individual water supplies. Thus, the 6% increase in water rates will be somewhat mitigated and increases in total water costs to those cities are expected to range from 4 �– 5%.
f. Broader Economic Impacts to Arizona
In addition to the NREL and Harvey Economics studies discussed above, SRP
commissioned a study by the Seidman Research Institute at Arizona State University (Navajo Generating Station and Kayenta Mine: an Economic Impact Study).178 This study is included in the docket for this proposed rulemaking, and EPA is including a summary of the main conclusions from the study, but we are not providing a critical review of this study�’s methodologies or conclusions.
The study was a macroeconomic assessment of the impact NGS and the Kayenta Mine
have on the Arizona economy, examining the contributions of the power plant and mine to values such as employment, income, and tax revenue. It also provides an assessment of these impacts at the county specific level. The study differs from those previously discussed in that it concentrates on the overall value of NGS and the Kayenta Mine to the Arizona economy and did not attempt to measure changes in power and water rates resulting from new capital investment at the power station. Accordingly, it did not conduct different scenarios reflecting various BART related capital expenditures, but instead, took current prevailing data and provided estimations of
176 See letter from August 10, 2010 letter from Tempe Farming Co. to EPA, in the docket for this proposed rulemaking. 177 See Addendum to Energy Strategies report on Economic Impacts to CAP Water users in the docket for this proposed rulemaking. 178 See document titled: �“2012_0202 Final ASU Report.pdf�” in the docket for this proposed rulemaking.

Technical Support Document for NGS Proposed BART Determination, rev. February 11, 2013 | Page 82 of 129
future job, income and taxes that would be attributable to the plant and mine�’s continued operation.
The model estimated that over 2011 �– 2044, approximately 113,000 full-time job years
(one person working one full year) were attributable to the plant and mine�’s operation. Of this number, nearly 33,000 were directly related to the two facilities. Additionally, Gross State Product was estimated to increase by roughly $20.5 billion and Real Personal Disposal Income by over $11 billion during the time frame. The report�’s conclusions suggest that, over the time frame noted, the operation of the plant and mine result in a significant macroeconomic benefit to the state.
iii. EPA’s Proposed Determination for Factor 2: Energy, Non-Air Quality, and Economic Impacts of Compliance Factor
EPA understands that the timing of regulatory compliance is an important consideration
given that the current term of NGS�’s lease with the Navajo Nation expires in 2019. Based on public statements made by stakeholders, and as indicated in the NREL report, the owners of NGS intend to pursue a renewed lease that extends to 2044. However, until a renewed lease that supports continued long-term operation of NGS is negotiated and approved, significant capital investment needed to modernize NGS with new air pollution controls is viewed as a risky business decision without sufficient certainty that the costs can be recovered over 20 years.
Based on our economic analyses, the cost to produce power at NGS with SCR installed
on all units should be below the market prices of wholesale power, and increased electricity rates to customers of the electric utilities that own NGS should be relatively low. EPA understands that a potential increase in water rates to tribes is a critical issue for them. We note that, as described in the following section, past pollution control investments at this facility have made use of alternative financing methods that limited impacts on CAP water rates. Furthermore, the NREL report indicated that mechanisms may exist to help avoid or mitigate the estimated level of impact. EPA, in conjunction with DOI and DOE, have committed to work together on several short- and long-term goals, including innovative clean energy options for electricity generation and seeking funding to cover expenses for the federal portion of pollution control at NGS. However, it is not clear at this time whether or what type of mechanisms might be available to lessen increased costs. Therefore, as explained further below, EPA believes that the potential economic impacts discussed in this section argue for thoughtful consideration of how flexibility in the compliance timeframe can be provided consistent with the air quality goals of the Clean Air Act.
5. Factor 3: Any Existing Pollution Control Technology at the Source
A. NGS Approach to This Factor
The existing air pollution control equipment, listed in order of flow through the physical flue gas configuration, as reported in its Part 71 Operating Permit from July 3, 2008, is shown in Table 23. Prior to 2009, to control NOx emissions, NGS used close-coupled over fire air (CCOFA). NGS currently uses hot-side electrostatic precipitators (hot-side ESPs) to control PM. To reduce emissions of SO2, SRP installed wet limestone flue gas desulfurization units (FGDs)

Technical Support Document for NGS Proposed BART Determination, rev. February 11, 2013 | Page 83 of 129
over 1997 �– 1999 on each unit, as required under a visibility FIP issued by EPA on October 3, 1991 (56 FR 50172), codified at 40 CFR 49.5513 to remedy visibility impairment at the Grand Canyon National Park that was reasonably attributable to NGS. The 1991 FIP set an emission limit for SO2 of 0.10 lb/MMBtu on a plant-wide rolling annual average basis. On March 5, 2010 (75 FR 10174), EPA issued a gap-filling FIP for NGS to federalize emission limits for PM of 0.06 lb/MMBtu on a plant-wide 3-hour average basis, opacity limit of 20%, and a short-term 3-hour average SO2 limit of 1 lb/MMBtu. From the SO2 emission limit in the final 2010 FIP, actual SO2 emissions from NGS will remain 90% lower on an annual basis than they were before the scrubbers were installed to comply with the 1991 visibility FIP.
Table 23: Flue Gas Flow Sequence and Air Pollution Control Equipment179 at NGS as reported in its July 3, 2008 Part 71 Operating Permit
Unit 1 Unit 2 Unit 3Boiler �– Close Coupled Overfire Air
(CCOFA) (NOx) Boiler �– CCOFA (NOx) Boiler �– CCOFA (NOx)
Economizer Economizer Economizer Dry Hot-Side Electrostatic
Precipitator (PM) Dry Hot-Side Electrostatic
Precipitator (PM) Dry Hot-Side Electrostatic
Precipitator (PM)Air Preheater Air Preheater Air Preheater
Limestone Flue Gas Desulfurization (SO2)
Limestone Flue Gas Desulfurization (SO2)
Limestone Flue Gas Desulfurization (SO2)
Stack Stack Stack
B. Discussion of this Factor in the ANPRM
In our August 28, 2009 ANPRM, EPA reported in Table 38 that existing controls for PM and SO2 at NGS consisted of hot-side ESPs and wet FGDs. Additionally, although the controls did not exist at the time of publication, we reported that NGS uses LNB/SOFA as NOx controls and noted that on November 20, 2008, EPA Region IX issued a PSD permit authorizing NGS to install LNB/SOFA on Units 1 �– 3 over 2009 �– 2011. This modification is discussed further in Section 5.D. below.
C. Affected State, Tribe, and FLM Consultation We did not receive comments on the existing air pollution controls for NOx at NGS from affected states, Tribes, or FLMs.
D. EPA Conclusions regarding This Factor In its comment letter (see p. 25) on the ANPRM, SRP stated that �“[t]he ANPR makes no mention of the fact that SRP recently obtained authorization from EPA to voluntarily install LNB/SOFA on each of the units at NGS between 2009 and 2011�”. EPA notes that the ANPRM does report that EPA Region IX issued a PSD permit authorizing NGS to modify Units 1 �– 3
179 Air Pollution Control Equipment listed in regular text and the pollutant controlled is listed in parentheses.

Technical Support Document for NGS Proposed BART Determination, rev. February 11, 2013 | Page 84 of 129
with LNB/SOFA over 2009 �– 2011 (see footnote 29 in the ANPRM). EPA further notes that although the ANPRM was published in the Federal Register in August 2009, before SRP began its retrofit of any of the Units at NGS with the LNB/SOFA, in the ANPRM, EPA listed LNB/SOFA as the NOx control method used at NGS (See Table 38 �– Existing Air Pollution Controls at NGS in the ANPRM). When SRP and AECOM submitted its BART analysis to EPA in 2008 (dated November 2007), NOx controls on each unit consisted of close-coupled over fire air (CCOFA)180. In April 2009, SRP submitted a Prevention of Significant Deterioration (PSD) permit application to EPA Region IX to voluntarily install and operate advanced combustion controls (LNB/SOFA) on Units 1 �– 3. This modification triggered PSD review for significant increases in emissions of carbon monoxide (CO). Because SRP submitted its permit application for the LNB/SOFA modification after EPA had begun its BART analysis for NGS, in the Ambient Air Quality Impact Report (AAQIR)181 for our proposed PSD permit (AZ 08-01), we stated that:
The early installation of the LNB/SOFA systems will not affect the baselines for cost or visibility improvements in the BART determination, and therefore will not influence EPA�’s determination of the proper NOx reductions required to be achieved from BART.
Additionally, in an agreement182 regarding the EPA proposed permit AZ 08-01signed November 19, 2008 by Bill Heddon, Executive Director of Grand Canyon Trust (GCT) and Richard Hayslip, Associate General Manager of SRP, GCT agreed to withdraw its November 14, 2008 comment letter to EPA with the SRP understanding that:
Grand Canyon Trust stands by its support for the installation of low-NOx burners and separated overfire air at the Navajo Generating Station as long as their installation and operation will not prejudice in any way the implementation of more effective NOx and particulate matter controls (including SCR or SNCR, and baghouse technology) to more fully address Navajo�’s visibility impacts under the reasonable attribution and regional haze programs.
SRP installed LNB/SOFA combustion controls on Unit 3 in 2009, on Unit 2 in 2010 and Unit 3 in 2011. Therefore, all three units currently operate with modern advanced combustion controls and are required to meet the NOx limit set in the final PSD permit issued by EPA on November 20, 2008 of 0.24 lb/MMBtu on a 30-day rolling average.183
In issuing the 2008 PSD permit to authorize the LNB/SOFA modifications to achieve early NOx reductions in advance of our proposed BART determination, EPA, GCT, and SRP agreed that the installation of advanced combustion controls would not prejudice our BART determination for NGS. Therefore, the cost effectiveness of SCR in Section 3 was compared against the baseline emission rate from 2001 �– 2003, prior to the installation of the LNB/SOFA. However, because EPA�’s proposed BART 180 See Part 71 Operating Permit (Permit # NN-ROP-05-06) issued by the Navajo Nation Environmental Protection Agency, dated July 3, 2008, in the docket for this proposed rulemaking. 181 See EPA�’s Ambient Air Quality Impact Report, dated October 2008, for the proposed PSD permit for NGS, in the docket for this proposed rulemaking. 182 See Agreement between Grand Canyon Trust and Salt River Project on NGS dated November 19, 2008, in the docket for this proposed rulemaking. 183 See final PSD permit issued by EPA Region IX dated November 20, 2008.

Technical Support Document for NGS Proposed BART Determination, rev. February 11, 2013 | Page 85 of 129
determination is being put forth for public comment in 2013, after the installation of advanced combustion controls has been completed on all units, EPA is also providing cost effectiveness values using LNB/SOFA as a baseline (essentially equivalent to incremental cost of SCR compared to LNB/SOFA) discussed in the incremental cost effectiveness estimates in Section 3 of this TSD.184 The economic analysis, discussed in Section 4 above, considers the installation of advanced combustion controls as expenditures that have already occurred, therefore, additional calculations for the economic analysis using LNB/SOFA as baseline are not needed. The average cost effectiveness of SCR or SNCR using emissions resulting from installation of LNB/SOFA as a baseline are the same as the incremental cost effectiveness values for SCR+LNB/SOFA (compared to LNB/SOFA) and SNCR+LNB/SOFA (compared to LNB/SOFA) reported in
184 See spreadsheet titled �“NGS emissions and incremental costs.xlsx�” in the docket for this proposed rulemaking.
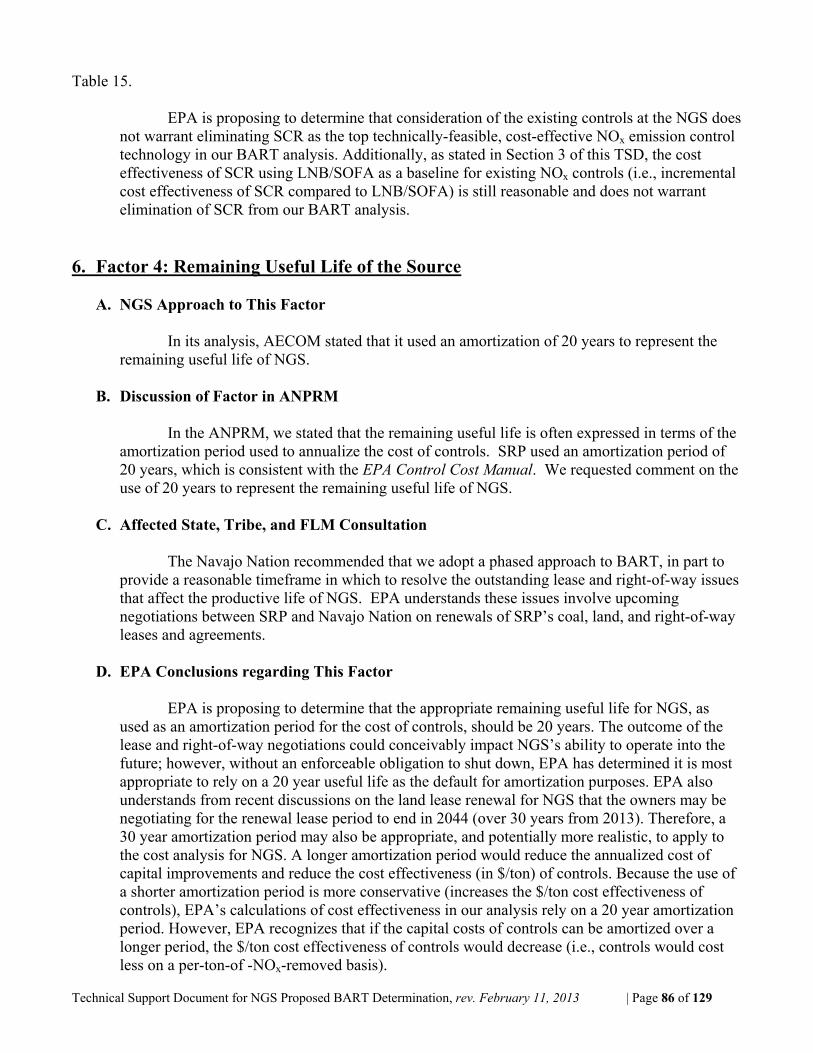
Technical Support Document for NGS Proposed BART Determination, rev. February 11, 2013 | Page 86 of 129
Table 15. EPA is proposing to determine that consideration of the existing controls at the NGS does not warrant eliminating SCR as the top technically-feasible, cost-effective NOx emission control technology in our BART analysis. Additionally, as stated in Section 3 of this TSD, the cost effectiveness of SCR using LNB/SOFA as a baseline for existing NOx controls (i.e., incremental cost effectiveness of SCR compared to LNB/SOFA) is still reasonable and does not warrant elimination of SCR from our BART analysis.
6. Factor 4: Remaining Useful Life of the Source
A. NGS Approach to This Factor
In its analysis, AECOM stated that it used an amortization of 20 years to represent the remaining useful life of NGS.
B. Discussion of Factor in ANPRM
In the ANPRM, we stated that the remaining useful life is often expressed in terms of the
amortization period used to annualize the cost of controls. SRP used an amortization period of 20 years, which is consistent with the EPA Control Cost Manual. We requested comment on the use of 20 years to represent the remaining useful life of NGS.
C. Affected State, Tribe, and FLM Consultation
The Navajo Nation recommended that we adopt a phased approach to BART, in part to provide a reasonable timeframe in which to resolve the outstanding lease and right-of-way issues that affect the productive life of NGS. EPA understands these issues involve upcoming negotiations between SRP and Navajo Nation on renewals of SRP�’s coal, land, and right-of-way leases and agreements.
D. EPA Conclusions regarding This Factor
EPA is proposing to determine that the appropriate remaining useful life for NGS, as used as an amortization period for the cost of controls, should be 20 years. The outcome of the lease and right-of-way negotiations could conceivably impact NGS�’s ability to operate into the future; however, without an enforceable obligation to shut down, EPA has determined it is most appropriate to rely on a 20 year useful life as the default for amortization purposes. EPA also understands from recent discussions on the land lease renewal for NGS that the owners may be negotiating for the renewal lease period to end in 2044 (over 30 years from 2013). Therefore, a 30 year amortization period may also be appropriate, and potentially more realistic, to apply to the cost analysis for NGS. A longer amortization period would reduce the annualized cost of capital improvements and reduce the cost effectiveness (in $/ton) of controls. Because the use of a shorter amortization period is more conservative (increases the $/ton cost effectiveness of controls), EPA�’s calculations of cost effectiveness in our analysis rely on a 20 year amortization period. However, EPA recognizes that if the capital costs of controls can be amortized over a longer period, the $/ton cost effectiveness of controls would decrease (i.e., controls would cost less on a per-ton-of -NOx-removed basis).
Technical Support Document for NGS Proposed BART Determination, rev. February 11, 2013 | Page 87 of 129
7. Factor 5: Degree of Improvement in Visibility which May Reasonably be
Anticipated to Result from the Use of Such Technology
A. BART Guidelines and Modeling Protocols
The final factor to consider for BART is the degree of visibility improvement that may be reasonably anticipated to result from the BART control options. CAA §169A(g)(2). The BART Guidelines recommend use of the CALPUFF air quality dispersion model to estimate the visibility improvements at each Class I area, typically within a 300 km (186 mile) radius of the source, of alternative control technologies, and to compare these to each other and to the impact of the baseline, or current, source configuration. AECOM conducted the modeling for NGS and included eleven Class I Areas in their modeling analysis. These are listed in and

Technical Support Document for NGS Proposed BART Determination, rev. February 11, 2013 | Page 88 of 129
Table 25 and shown in Figure 3. The measured visibility impairment (in deciviews) at each Class I area is presented in
Table 24 as a range of the 10th and 90th percentiles, averaged for 2006 through 2008. Table 24: Measured Visibility Impairment at Class I areas (2006 �– 2008 average), from IMPROVE monitoring network185
Class I Area IMPROVE monitor
Average 20% Best Days Deciview Impairment
Average 20% Worst Days Deciview Impairment
Arches NP CANY1 2.8 11.0 Bryce Canyon NP BRCA1 2.1 11.5 Canyonlands NP CANY1 2.8 11.0 Capitol Reef NP CAPI1 2.8 11.5
Grand Canyon NP GRCA2 2.2 11.1 Mazatzal WA IKBA1 5.3 13.5
Mesa Verde NP MEVE1 3.2 10.9 Petrified Forest NP PEFO1 4.8 12.3 Pine Mountain WA IKBA1 5.3 13.5
Sycamore Canyon WA SYCA1 5.2 14.9 Zion NP ZION1 (N.A. for Zion; see Bryce) (N.A. for Zion; see Bryce)
185 Regional Haze Rule Summary data, Revised (New) IMPROVE Algorithm, Means for Best, Middle, and Worst 20% Visibility Days, http://vista.cira.colostate.edu/improve/Data/IMPROVE/summary_data.htm. For calculated visibility impairment using the old IMPROVE equation, see �“measured_vis_table_old_IMPROVE.doc�”; and data/calculations in �“group_means_NE_11_09_NGS_2006-2008.xls�” in the docket for this proposed rulemaking.

Technical Support Document for NGS Proposed BART Determination, rev. February 11, 2013 | Page 89 of 129
Figure 3: Map of Class I Areas 300 km from NGS

Technical Support Document for NGS Proposed BART Determination, rev. February 11, 2013 | Page 90 of 129
Table 25: Class I Areas in CALPUFF Modeling for NGS Class I Area Abbreviation State Agency IMPROVE
monitor186 Distance to
NGS (km)187 Arches NP arch UT NPS CANY1 245
Bryce Canyon NP brca UT NPS BRCA1 96 Canyonlands NP cany UT NPS CANY1 173 Capitol Reef NP care UT NPS CAPI1 90
Grand Canyon NP grca AZ NPS GRCA2 29 Mazatzal WA maza AZ USFS IKBA1 279
Mesa Verde NP meve CO NPS MEVE1 253 Petrified Forest NP pefo AZ NPS PEFO1 235 Pine Mountain WA pimo AZ USFS IKBA1 287
Sycamore Canyon WA syca AZ USFS SYCA1 204 Zion NP zion UT NPS ZION1 134
Under the BART guidelines, the measure of the visibility improvement to be used in comparisons between various control scenarios is the 98th percentile of impacts is expressed as 24-hour averages of delta deciviews relative to natural background, as estimated using the CALPUFF air quality modeling system. The meaning of this is described next, followed by specific details of the application of CALPUFF to the NGS BART determination. Under the RHR, visibility is measured in deciviews. Visibility is traditionally described in terms of visual range in kilometers or miles. However, the visual range scale does not correspond to how people perceive visibility: a given increase in visual range is perceived differently depending on how good the original visibility was (that is, it is not on a linear scale). The deciview scale is designed to address this problem. It is linear with respect to perceived visual changes over its entire range, analogous to the decibel scale for sound: a given change in deciviews will be perceived as the same amount of visibility change, whatever the original visibility was. The defining equation is: deciviews = 10*ln(bext / 10), where ln is the natural logarithm, and the extinction coefficient, bext, is the fraction of light scattered out of a viewing path. Extinction increases with the amount of pollution (bext is in units of 1/Mm, �“inverse megameters�”). Lower deciview values represent better visibility, more pristine atmospheres, and greater visual range, while increasing deciview values represent increasingly poor visibility. An increase of 1 deciview corresponds to about a 10% increase in extinction.188 An eligible BART source with a predicted impact of 0.5 dv or more of impairment in a Class I area �“contributes�” to visibility impairment and is subject to BART. 70 FR 39104, 39121 (July 6, 2005). Under the BART guidelines, deciviews are estimated using the CALPUFF air quality model. CALPUFF predicts 24-hour average pollutant concentrations based on source emissions and how they disperse in the atmosphere. The CALPUFF model includes source emissions of the following visibility-impairing pollutants: SO2, SO4, NOx, secondary organic aerosol (SOA), fine particulate matter (PMF), coarse particulate matter (PMC), and elemental carbon (EC). CALPUFF incorporates a semi-empirical chemical module that simulates the conversion of SO2 to particulate sulfate and NOx to particulate nitrate, at a rate dependent on meteorological
186 For a Class I area without an IMPROVE monitor of its own, the nearest monitor in another area is used; �“IKBA�” is Ike�’s Backbone IMPROVE site, located in the northern Mazatzal Wilderness. 187 Distance is calculated between Unit 1 of NGS and the nearest model receptor location in the Class I area. 188 Deciviews are related to the more traditional visual range according to dv = 10*ln(391 / visual range (km))
Technical Support Document for NGS Proposed BART Determination, rev. February 11, 2013 | Page 91 of 129
conditions and background ozone concentration. The CALPOST post-processor (part of the CALPUFF modeling system) converts these concentrations to extinction, and then to deciviews. CALPOST�’s conversion of the CALPUFF concentrations to extinction, bext, is done by applying the IMPROVE189 equation. The IMPROVE equation has an old and a revised version, implemented in CALPOST as �“Method 6�” and �“Method 8 (mode 5)�”, respectively. The old IMPROVE or Method 6 equation is:
bext = 3 * f(RH) * [sulfate] + 3 * f(RH) * [nitrate] + 4 * [organic mass] + 10 * [elemental carbon] + 1 * [fine soil] + 0.6 * [coarse mass] + 10
Each term in the equation is the extinction due to a particular measured component; bracketed quantities are concentrations as predicted by CALPUFF (or as measured at an IMPROVE monitor). The 10 is for Rayleigh scattering, which is due to the interaction of light with molecules of air itself with no pollutants, and the old IMPROVE equation assumes this value to be the same for all locations. The revised (new) IMPROVE equation allows for site-specific values for Rayleigh scattering, typically ranging from 9 �– 11. For the revised (new) IMPROVE equation, EPA assumed this value to be 10. The f(RH) is a water growth factor for sulfate and nitrate; its value depends on relative humidity (RH), ranging from 1 at low humidity to 18 at 98% humidity. The revised (new) IMPROVE or Method 8 equation is:
bext = 2.2 * fS(RH) * [small sulfate] + 4.8 * fL(RH) * [large sulfate] + 2.4 * fS(RH) * [small nitrate] + 5.1 * fL(RH) * [large nitrate] + 2.8 * [small organic mass] + 6.1 * [large organic mass] + 10 * [elemental carbon] + 1 * [fine soil] + 1.7 * fSS(RH) * [sea salt] + 0.6 * [coarse mass] + Rayleigh scattering (site-specific) + 0.33 * [NO2 (ppb)]
Sulfate is assumed to be all �“large sulfate�” if total sulfate is over 20 g/m3, otherwise its fraction of the total is assumed to increase uniformly between 0 and 1 when the total is in the range between 0 and 20, i.e., large sulfate = (total sulfate/20)*total. A similar definition applies for nitrate and for organic mass. The fS, fL, fSS are water growth factors for small (�“S�”) and large (�“L�”) fractions of sulfate and nitrate, and for sea salt (�“SS�”). Their values depend on relative humidity, ranging from 1 at low humidity to over 5 at 95% humidity. The additional refinements
189 Interagency Monitoring of Protected Visual Environments (IMPROVE) is a network of monitors in various Class I Areas, established to assess visibility impairment and its causes. The IMPROVE equation is used to converted monitored concentrations into extinction, a measure of visibility. See: http://vista.cira.colostate.edu/improve/
Technical Support Document for NGS Proposed BART Determination, rev. February 11, 2013 | Page 92 of 129
for size fractions and site-specific measurements in the revised IMPROVE equation results in less bias in matching visibility measurements under high and low visibility conditions.190 Finally, CALPOST takes the extinction from the IMPROVE equation and converts it to the delta deciviews ( dv) to represent the impact on visibility in deciviews of the source being evaluated. It is the change, or �“delta�”, between deciviews with and without the source. Under the BART guidelines, delta deciviews is the difference between deciviews including the impact of the source and natural background, and deciviews of the natural background alone. Each modeled day and location in the Class I area will have an associated delta deciview. For each day, the model finds the maximum visibility impact of all locations (receptors) in the Class I area. From among these daily values, the BART Guidelines recommend use of the 98th percentile, roughly equivalent to the 8th highest day, for comparing the base case and the effects of various controls. The 98th percentile is recommended rather than the maximum value to avoid undue influence from unusual meteorological conditions (BART Guidelines, 70 FR at 39121). For this proposal, EPA generally relied on the 98th percentile of all three years�’ data taken together, but results for the average of the three individual years�’ 98th percentiles are also provided in spreadsheet tables in the docket.191 The natural background used in computing delta deciviews may reflect either the annual average, or the best 20 percent of days; these may be referred to as �“a�” and �“b�”. A facility�’s impact will stand out more under better visibility conditions (�“b�”). Thus, modeled facility impacts and control benefits appear smaller when �“a�” is used than when �“b�” is used. EPA Guidance allows for the use of either �“a�” or �“b.�”192 For visibility method 6, annual average background concentrations to be used for all Class I areas in the West are available in EPA guidance.193 Best 20% concentrations are not provided, but can be estimated by scaling the annual concentrations by the ratio of best 20% and annual average extinction, which are provided in the EPA guidance document.194 For visibility method 8, both annual average and best 20% for individual Class I areas are available in the �“FLAG 2010�” guidance document from the Federal Land Managers.195 Considering visibility method and natural background together, one may use Method 6 or Method 8, and background �“a�” or �“b�”, for a total of four combinations: 6a, 6b, 8a, and 8b. All of these were modeled by EPA, and results for all are provided in spreadsheet tables in the docket for this proposal. However, EPA primarily relied on method �“8b�”, that is, the revised IMPROVE equation, and impacts relative to the best 20 percent of natural background days. This is most consistent with our current understanding of how best to assess source specific visibility impacts,
190 Pitchford, Marc, 2006, �“New IMPROVE algorithm for estimating light extinction approved for use�”, The IMPROVE Newsletter, Volume 14, Number 4, Air Resource Specialists, Inc.; web page: http://vista.cira.colostate.edu/improve/Publications/news_letters.htm direct link: http://vista.cira.colostate.edu/improve/Publications/NewsLetters/IMPNews4thQtr2005.pdf 191 See NGS RH FIP TSD_vis_Tables in the docket for this proposed rulemaking. 192 �“Regional Haze Regulations and Guidelines for Best Available Retrofit Technology (BART) Determinations�”, memorandum from Joseph W. Paisie, EPA OAQPS, July 19, 2006, p.2 193 Table 2-1 of Guidance for Estimating Natural Visibility Conditions Under the Regional Haze Rule, U.S. Environmental Protection Agency, EPA-454/B-03-005, September 2003, on web page http://www.epa.gov/ttn/oarpg/t1pgm.html, with direct link http://www.epa.gov/ttn/oarpg/t1/memoranda/rh_envcurhr_gd.pdf; 194 This scaling for best 20% concentrations is implemented in the docket spreadsheet �“EPA_avg_natural_bg.xls�” 195 Federal Land Managers’ Air Quality Related Values Work Group (FLAG) Phase I Report—Revised (2010), U.S. Forest Service, National Park Service, U.S. Fish And Wildlife Service, October 2010. Often referred to as �“FLAG 2010�”. See http://www.nature.nps.gov/air/Permits/flag/ Direct link: http://www.nature.nps.gov/air/Pubs/pdf/flag/FLAG_2010.pdf

Technical Support Document for NGS Proposed BART Determination, rev. February 11, 2013 | Page 93 of 129
and is consistent with current Federal Land Manager Guidance on assessing visibility impacts, the FLAG 2010 document as well as with the initial EPA recommendations for BART assessments.196
AECOM conducted modeling for NGS according to modeling protocols submitted to EPA.197 The modeling analysis generally followed the BART protocol developed by the Western Regional Air Partnership (WRAP), except as noted below.198 The WRAP protocol received extensive scrutiny during 2005-2006 by various States, EPA Regions, and Federal Land Managers (FLMs). Some key features of the protocol are listed here. Meteorological fields were derived from the MM5 prognostic meteorological model, using a 36 km grid resolution, for the years 2001, 2002, and 2003 and with the continental United States as the modeling domain. Subdomains were extracted for use by individual states, such as Arizona and New Mexico. The MM5 fields were then processed using CALMET (meteorological pre-processor, part of the CALPUFF modeling system) as preparation for use in the CALPUFF air quality model, using a 4 km grid resolution. After much discussion, WRAP elected to blend meteorological station observations into the MM5 fields, instead of relying on the CALMET �“no observations�” (�“no obs�”) mode. For visibility calculations, the pollution concentration predictions of CALPUFF are used in two post-processing steps. First, POSTUTIL considers ammonia background concentrations, temperature, and humidity to determine how much nitrate ends up as particulate ammonium nitrate; this is to reflect the competition between sulfate and nitrate for available ammonia. Ammonia background is discussed further below. Second, CALPOST uses the adjusted concentrations to calculate visibility using the IMPROVE equation, as described above. For the particular way of applying it, the WRAP protocol specified visibility calculation �“Method 6�” in CALPOST, the original EPA-recommended approach that uses monthly average humidity. For this proposal, however, EPA relied on �“Method 8�”, as discussed above. The AECOM modeling protocol mainly followed the WRAP protocols. CALMET and CALPUFF settings were almost all the same; the WRAP-defined Arizona and New Mexico subdomains were used; all Class I Areas within 300 km of NGS were included. However, the AECOM protocol differed in several important respects. First, AECOM used the CALMET and CALPUFF versions recommended by EPA because they do not have the problems identified in the versions used by WRAP. Second, when blending in meteorological station wind observations, AECOM used a lower radius of influence for stations (R1, R2, RMAX1). As shown in the wind field illustrations provided by AECOM, this resulted in smoother wind fields than those used for WRAP, which had some abrupt changes as one leaves the zone of influence of a given meteorological station. After initial input from the Federal Land Managers, EPA requested that certain other CALMET option settings be changed. These changes resulted in a more refined approach that is more consistent with approaches used in PSD permit application
196 BART Guidelines, 70 FR 39125, July 6, 2005. �“Finally, these final BART guidelines use the natural visibility baseline for the 20 percent best visibility days for comparison to the �‘cause or contribute�’ applicability thresholds.�” 197 See Modeling Protocol for NGS dated September 2007 and submitted to EPA in June 2008 in the docket for this proposed rulemaking. 198 �“CALMET/CALPUFF Protocol for BART Exemption Screening Analysis for Class I Areas in the Western United States�”, Western Regional Air Partnership (WRAP); Gail Tonnesen, Zion Wang; Ralph Morris, Abby Hoats and Yiqin Jia, August 15, 2006. Available on UCR Regional Modeling Center web site, BART CALPUFF Modeling, http://pah.cert.ucr.edu/aqm/308/bart.shtml

Technical Support Document for NGS Proposed BART Determination, rev. February 11, 2013 | Page 94 of 129
modeling. The revised modeling has more extensive use of meteorological station observations (e.g. IEXTR=-4 to extrapolate surface observations up to higher layers), and thus is responsive to the FLM concerns regarding the �“no observations�” mode mentioned above. Various relevant CALMET option settings are listed in Table 26. For meteorological input to CALPUFF, EPA used the AECOM CALMET results, which used the settings in the �“Revised modeling�” column of Table 26.

Technical Support Document for NGS Proposed BART Determination, rev. February 11, 2013 | Page 95 of 129
Table 26: Selected CALMET settings for NGS Option Description EPA
default WRAP Original
modeling199Revised
modeling200Comments
version CALMET version 5.8, level 070623
6.211, level 060414
5.8, level 070623
5.8, level 070623
NOOBS No Observation Mode
0 0 or 1 implied
1 0 Change per FLM recommendation: use both surface and upper air
observations ICLOUD gridded cloud fields 0 0 0 IWFCOD diagnostic winds 1 1 1 IFRADJ Froude wind adj. 1 1 1 IKINE kinematic effects 0 0 0 IOBR O'Brien vertical wind
adj. 0 0 0
ISLOPE slope flows 1 1 1 IEXTRP extrapolate wind to
upper air -4 1 1 -4 Change per FLM recommendation: to
extrapolate up from surface ICALM extrapolate calm to
upper air 0 0 0
BIAS layer biases sfc vs. UA
NZ*0 NZ*0 NZ*0
IPROG gridded initial prognostic
0 14 14 Use prognostic inputs from MM5
RMAX1 max surface radius of influence
NA 50 30 Gives smoother wind fields, per AECOM
RMAX2 max aloft radius of influence
NA 100 100
RMAX3 max over-water radius of influence.
NA 100 100
RMIN min wind radius of influence.
0.1 0.1 0.1
RMIN2 min dist sfc winds extrap
4 4 4
TERRAD terrain radius of in influence
NA 10 10
R1 weight surface Step 1 vs. obs
NA 100 18 Gives smoother wind fields, per AECOM
R2 weight aloft Step 1 vs. obs
NA 200 20 Gives smoother wind fields, per AECOM
ITPROG 3D T from obs or prognostic
0 1 or 2 implied
2 1 Change per FLM recommendation: use surface station temperatures
TRADKM radius of influ. for T interp.
500 500 500
IAVET spatial T averaging 1 0 1 Smoothing turned on (WRAP thought MM5 already smooth enough)
JWAT1 starting land use for T interp. over water
999 51 51 This area has very little "water" land use; may set to 999 to disable overwater feature, and avoid a
CALMET bug JWAT2 ending land use for T
interp. over water 999 55 55
As mentioned above, the BART guidelines recommend that impacts of sources be estimated in deciviews relative to natural background. EPA initially used background concentrations from Table 2-1 of �“Guidance for Estimating Natural Visibility Conditions Under
199 January 29, 2008 200 December 16, 2009 (ENSR/AECOM report dated November 2008)

Technical Support Document for NGS Proposed BART Determination, rev. February 11, 2013 | Page 96 of 129
the Regional Haze Rule�”.201 Although the concentration for each pollutant is a single value for the year, this method allows for monthly variation in its visibility impact, which changes with relative humidity. The resulting backgrounds in deciviews differ by roughly 1% from those resulting from the method originally used by AECOM.202 As discussed above, EPA ultimately relied on area-specific natural background concentrations for the best 20% of days, from the FLAG 2010 document.
In addition to the general modeling procedures, we must address two additional
pollutants when estimating the impact of various control technologies on visibility improvement: ammonia (NH3) and sulfuric acid (H2SO4).
B. Ammonia
Ammonia is important because it is a precursor to particulate ammonium sulfate and ammonium nitrate, both of which degrade visibility. It is present in the atmosphere from both natural and anthropogenic sources. The latter may include livestock operations, fertilizer application associated with farming, and ammonia slip (or un-reacted ammonia) from its use in SCR or SNCR to control NOx emissions.
In the CALPUFF modeling inputs, EPA and AECOM both assumed that the remaining
ammonia in the flue gas following SCR reacts with sulfuric acid to form ammonium sulfate or ammonium bisulfate before exiting the stack. This particulate ammonium is represented in the modeling as sulfate (SO4) emissions. Thus, EPA and AECOM both accounted for ammonia slip through additional sulfate emissions, rather than by incorporating ammonia slip into the ambient background ammonia concentrations.
C. Sulfuric Acid
Sulfuric acid (H2SO4) is formed from coal-fired power plants from the oxidation of sulfur dioxide (SO2) to sulfur trioxide (SO3) and the subsequent reaction of SO3 with water vapor (SO3 + H2O = H2SO4). Sulfuric acid (also known as sulfuric acid mist) can combine with ammonia to form particulate ammonium sulfate, which is an important contributor to visibility impairment. CALPUFF models emissions of H2SO4 as inorganic particulate sulfate.
Sulfuric acid emissions from power plants must be reported to the Toxic Release
Inventory (TRI) and can be calculated by estimating the amount of H2SO4 produced and the amount of H2SO4 removed by control equipment using information from the Electric Power Research Institute (EPRI).203 These calculations rely on assumed values for the amount of fuel sulfur converted to SO2, the amount of SO2 oxidized to SO3, and the amount of H2SO4 lost to (or mitigated by) the air preheater and applicable control equipment, such as hot-side ESPs and
201 U.S. Environmental Protection Agency, EPA-454/B-03-005, September 2003, on web page http://www.epa.gov/ttn/oarpg/t1pgm.html, with direct link http://www.epa.gov/ttn/oarpg/t1/memoranda/rh_envcurhr_gd.pdf 202 AECOM�’s modeling of FCPP used the annual average deciviews from the guidance document, and calculated the background soil concentrations that would yield those deciviews; the soil concentrations were used by AECOM in the CALPOST visibility, a single value for the entire year irrespective of relative humidity. 203 Sulfuric acid emissions can also be measured using source tests, but source tests are typically not required unless the facility has a sulfuric acid emissions limit. NGS does not have a sulfuric acid emission limit, and is therefore not required to measure sulfuric acid emissions. However, SRP agreed to conduct sulfuric acid source tests on each unit in 2009. We discuss the results of these tests later in this TSD.

Technical Support Document for NGS Proposed BART Determination, rev. February 11, 2013 | Page 97 of 129
FGDs. The assumed values are based on averages from a limited number of measurements, or in some cases, single measurement points, and are not specific to NGS or coal from the Kayenta Mine. Limited stack test data of H2SO4 emissions from NGS are available, however it is not possible to know the individual production and loss terms for H2SO4 in the system because separate measurements of H2SO4 up and downstream of the various ductwork components were not conducted. Therefore, baseline and post-SCR estimates of H2SO4 from NGS are based on the best current information available from EPRI204 and other sources.
D. NGS Approach to This Factor
1. AECOM Modeling Inputs
In our ANPRM, we summarized the emission inputs and modeling results AECOM submitted for NGS. Although AECOM included SNCR in addition to LNB and SCR in their modeling, we focused on the LNB and SCR control scenarios. The inputs for the baseline case (Scenario A), and LNB/SOFA (Scenario B), and SCR (Scenarios C �– E) control scenarios are reproduced here in
204 Electric Power Research Institute, Estimating Total Sulfuric Acid Emissions from Stationary Power Plants, 1016384, Technical Update, March 2008.

Technical Support Document for NGS Proposed BART Determination, rev. February 11, 2013 | Page 98 of 129
Table 27. The modeling scenarios specifically presented in the ANPRM were: Aa = Baseline Visibility Impacts modeled by AECOM, Ae = Baseline Visibility Impacts modeled by EPA, Ba = Visibility Impacts after LNB+SOFA applied to Units 1 �– 3 modeled by AECOM, Be = Visibility Impacts after LNB+SOFA applied to Units 1 �– 3 modeled by EPA, Ca = Visibility Impacts after SCR+LNB+SOFA on Units 1 and 3, LNB+SOFA on Unit 2
modeled by AECOM, Ce = Visibility Impacts after SCR+LNB+SOFA on Units 1 and 3, LNB+SOFA on Unit 2
modeled by EPA, De205 = Visibility Impacts after SCR+LNB+SOFA on Units 1 and 3, Half-SCR+LNB+SOFA on
Unit 2 modeled by EPA, Ea = Visibility Impacts from SCR+LNB+SOFA on Units 1 �– 3 modeled by AECOM, and Ea = Visibility Impacts from SCR+LNB+SOFA on Units 1 �– 3 modeled by EPA.
205 AECOM did not model this scenario.

Technical Support Document for NGS Proposed BART Determination, rev. February 11, 2013 | Page 99 of 129
Table 27: AECOM Modeling Inputs (lb/hr) Scenario A – Baseline
Unit 1 Unit 2 Unit 3 SO2 487.75 526.92 576.17 SO4 4.18 4.48 4.36 NOx 4,271.42 4,207.50 4,181.67 SOA 35.18 37.69 36.63
PM fine 63.86 55.27 79.28 PM coarse 86.89 75.20 107.87
EC 2.45 2.12 3.05 Scenario B – LNB/SOFA on Units 1 – 3
Unit 1 Unit 2 Unit 3 SO2 487.75 526.92 576.17 SO4 4.18 4.48 4.36 NOx 2,110.74 2,261.63 2,197.78 SOA 35.18 37.69 36.63
PM fine 63.86 55.27 79.28 PM coarse 86.89 75.20 107.87
EC 2.45 2.12 3.05 Scenario C – SCR + LNB/SOFA on Units 1 and 3, LNB/SOFA on Unit 3
Unit 1 Unit 2 Unit 3 SO2 487.75 526.92 576.17 SO4 64.01 4.48 66.65 NOx 703.58 2,261.63 732.59 SOA 35.18 37.69 36.63
PM fine 63.86 55.27 79.28 PM coarse 86.89 75.20 107.87
EC 2.45 2.12 3.05 Scenario E – SCR + LNB/SOFA on Units 1 – 3
Unit 1 Unit 2 Unit 3 SO2 487.75 526.92 576.17 SO4 64.01 68.59 66.65 NOx 703.58 753.88 732.59 SOA 35.18 37.69 36.63
PM fine 63.86 55.27 79.28 PM coarse 86.89 75.20 107.87
EC 2.45 2.12 3.05
Note that although the control technology scenarios may be the same (e.g., SCR on Units 1 �– 3), the assumptions and % control levels may differ between the modeling conducted by AECOM and EPA. For example, AECOM and EPA made different assumptions in calculating emissions of H2SO4, which resulted in different SO4 emission rate inputs for the modeling.

Technical Support Document for NGS Proposed BART Determination, rev. February 11, 2013 | Page 100 of 129
Table 28 outlines the assumptions used by AECOM for the sulfuric acid calculation.

Technical Support Document for NGS Proposed BART Determination, rev. February 11, 2013 | Page 101 of 129
Table 28: Assumptions Used by AECOM for H2SO4 Emission Estimates Units 1 – 3
Maximum Sulfur content of coal 0.593 Conversion of SO2 to H2SO4 via SO3 due to combustion (%) 0.11%
Conversion of SO2 to SO3 due to SCR (%) 1% H2SO4 penetration206 through air preheater 0.9 H2SO4 penetration through hot-side ESP 0.63
H2SO4 penetration through wet FGD 0.47
As discussed above, in addition to emissions from the facility, the background ammonia concentrations must be specified for the model. The IWAQM default value for ammonia background is 1 ppb year-round (discussed below). AECOM used background ammonia concentrations based on concentrations used for the PSD ambient air quality impacts analysis for the Desert Rock Energy Center. Table 29 compares the IWAQM default values with the ammonia values used by AECOM.
Table 29: Ammonia background concentration in ppb
Jan Feb Mar Apr May Jun Jul Aug Sep Oct Nov Dec IWAQM default 1.0 1.0 1.0 1.0 1.0 1.0 1.0 1.0 1.0 1.0 1.0 1.0 AECOM values 0.2 0.2 0.5 0.5 1.0 1.0 1.0 1.0 1.0 0.5 0.5 0.2
2. Results of AECOM CALPUFF modeling
AECOM presented various control scenarios�’ visibility improvements in terms of the 98th percentile (8th highest) of the daily maximum delta deciviews from CALPUFF for each Class I area, averaged over 2001 �– 2003. As outlined in the 1999 Regional Haze rule (64 FR 35725, July 1, 1999), a one deciview change in visibility impairment is a small but perceptible change under most circumstances when viewing scenes in a Class I area.
206 Sulfuric Acid removal efficiency = (1 - Penetration ) x 100%

Technical Support Document for NGS Proposed BART Determination, rev. February 11, 2013 | Page 102 of 129
Table 30 presents the impact of NGS on visibility at each Class I area, based on the 98th percentile of daily maxima from 2001 �– 2003, as modeled by AECOM. SRP assessed visibility impacts individually for each Class I area, however, in our ANPRM, we summed the impacts at all Class I areas as part of the assessment of the overall impact of NGS on visibility.

Technical Support Document for NGS Proposed BART Determination, rev. February 11, 2013 | Page 103 of 129
Table 30: Impacts of NGS on Visibility (98th Percentile of daily maximum dv) at Eleven Class I Areas as Modeled by AECOM and as reported by EPA in ANPRM
Visibility Impact (dv) after applying: Baseline (A) LNB+SOFA (B) SCR+LNB+SOFA
and LNB+SOFA (C) SCR+LNB+SOFA
(E) Arches 2.05 1.51 1.19 0.99
Bryce Canyon 2.00 1.58 1.36 1.23 Canyonlands 2.47 1.96 1.53 1.35 Capitol Reef 2.68 2.31 2.06 1.89
Grand Canyon 2.56 2.29 2.25 2.29 Mazatzal 0.71 0.47 0.41 0.38
Mesa Verde 1.42 1.04 0.77 0.58 Petrified Forest 1.52 1.14 0.92 0.76 Pine Mountain 0.66 0.46 0.38 0.34
Sycamore Canyon 1.31 0.92 0.78 0.63 Zion 1.83 1.47 1.26 1.10
Sum of Class I areas 19.29 15.15 12.88 11.54
E. Discussion of Factor in EPA ANPRM
1. Sulfuric Acid Emission Estimates
In our ANPRM, we disagreed with certain assumptions used by AECOM for NGS to
calculate the sulfuric acid emissions, in particular, the rate of SO2 to SO3 oxidation from the SCR catalyst and the amount of sulfuric acid that penetrates through (or is lost to) the air preheater. We used an air preheater penetration factor of 0.49 in the ANPRM, whereas AECOM assumed 0.9, and we used an SO2 to SO3 conversion rate of 0.5% from the SCR catalyst, whereas AECOM assumed 1%. Although it is not discussed specifically in the Federal Register Notice for the ANPRM, EPA also revised the control efficiency of sulfuric acid in the hot-side ESP from 37% used by AECOM to 0%.
2. Ammonia Background Concentrations
In our ANPRM, we described the method we used to a estimate ammonia background concentrations that we determined to be appropriate for the CALPUFF modeling to represent the amount of available ammonia that emissions from NGS would encounter on the way to a given Class I area. Because very little monitored ammonia data is available, the IWAQM Phase 2 document207 recommends a default ammonia background value, which is 1 ppb for arid regions. Alternative levels may be used if supported by data. In their January 2008 BART modeling protocol (p. 4-1) SRP expressed the concern that CALPUFF over-predicts ammonium nitrate in winter. On the other hand, the USDA Forest Service expressed the concern that ammonia levels used by AECOM were too low, partly based on measurements in the Four Corners area.208
207 Interagency Workgroup On Air Quality Modeling (IWAQM) Phase 2 Summary Report And Recommendations For Modeling Long Range Transport Impacts (EPA-454/R-98-019), EPA OAQPS, December 1998, http://www.epa.gov/scram001/7thconf/calpuff/phase2.pdf 208 Personal communication, Rick Graw, USDA Forest Service to Scott Bohning, EPA, February 2, 2009.

Technical Support Document for NGS Proposed BART Determination, rev. February 11, 2013 | Page 104 of 129
To address these concerns using an objective approach based on monitored data, EPA estimated ammonia background for all Class I areas (except Mesa Verde National Park, see below) by a back-calculation from measurements at monitors run by the IMPROVE program.209 IMPROVE monitors do not measure ammonia directly; rather, they measure particulate sulfate and nitrate. In the atmosphere, particulate sulfate and nitrate are essentially all in the form of ammonium sulfate and ammonium nitrate, respectively. Using the chemical formulas of these compounds, EPA calculated the amount of ammonia needed to combine with gaseous sulfate and nitrate in order to form the measured particulate sulfate and nitrate. The formulas are respectively (NH4)2SO4 and NH4NO3, so there must be two ammonia molecules (NH3) for each sulfate (SO4), and one ammonia for each nitrate (NO3). The IMPROVE measurements are in µg/m3 (NH3 mass per volume of air), while CALPUFF ammonia input must be in ppb (NH3 volume per volume of air), so results must be converted to ppb using the ideal gas law, which depends on temperature and pressure. Since temperature and pressure are not available at IMPROVE sites, a standard atmosphere was assumed210 (pressure of 1 atm = 101.325 kPa; temperature = 298.16 K = 25° C). The result of the calculation is a 24-hour average ammonia estimate in ppb for each monitor and for each measurement day (typically every 3rd calendar day).
The monthly values required by CALPUFF were based on these daily values, as
described below. The estimate represents a lower bound on the ammonia that must have been present; it does not include any ammonia remaining in gaseous form, since the latter is not reflected in the particulate sulfate and nitrate measured at the monitor. For the ANPRM and this proposal EPA consulted with the FLMs on using this method. EPA recognizes that it is not perfect, but the lack of monitored ammonia data and the limitations in how the CALPUFF model uses ammonia make it a reasonable approach that does rely on available measured data.
For the ANPRM, EPA performed this back-calculation using 2005-2007 data for all 14
IMPROVE monitors at Class I areas in the modeling domains. For each monitor, EPA used the maximum calculated value for each calendar month to represent the month. Then, for each month, EPA averaged over all monitors,211 resulting in a single value for each of the 12 calendar months. For the months of May and July, this back-calculation resulted in a somewhat lower value than the IWAQM default of 1 ppb which was also used by SRP; for these months EPA used 1 ppb. The back-calculation results ranged from 0.7 ppb in the winter to 1 ppb in summer, except for the value of 1.3 ppb in June.
As a basic check in the ANPRM on the reasonableness of the ammonia background
concentrations, EPA compared the nitrate measured at the Grand Canyon with the nitrate predicted by CALPUFF for Navajo Generating Station. EPA found that the predicted values were within the range of observed values, though at the high end. Thus they have a degree of conservatism while remaining realistic. In the real atmosphere, NOx from many sources competes with NGS for the available ammonia. But for purposes of modeling visibility impacts relative to natural background, i.e. the situation for which there are no anthropogenic sources, it is reasonable to assume the ammonia is all available for reacting with the pollutants in the plume from NGS.
209 Interagency Monitoring of Protected Visual Environments http://vista.cira.colostate.edu/improve/ 210 The Class I areas are at higher elevations than used in the standard atmosphere, so pressure and also temperature would be lower. Since these work in opposite directions in the formula for converting to ppb, these effects tend to cancel each other. In any case the net effect is small relative to that of the other uncertainties and assumptions in the method. 211 Results from Zion were not used, as they were incomplete and also appeared anomalous.
Technical Support Document for NGS Proposed BART Determination, rev. February 11, 2013 | Page 105 of 129
Ammonia background concentrations for Mesa Verde National Park were derived from
measured ammonia concentrations in the Four Corners area, as described in Sather et al., (2008).212 Monitored data was available within the park, but because particulate formation happens within a pollutant plume as it travels, rather than instantaneously at the Class I area, EPA also examined data at locations outside the park itself. Monitored 3-week average ammonia at the Substation site, some 30 miles south of Mesa Verde, were as high as 3.5 ppb, though generally levels were less than 1.5 ppb. Maximum values in Mesa Verde were 0.6 ppb, whereas other sites' maxima ranged from 1 to 3 ppb, but generally values were less than 2 ppb. EPA used values estimated from Figure 5 of Sather et al., (2008), in the mid-range of the various stations plotted. The results ranged from 1.0 ppb in winter to 1.5 ppb in summer. See Table 31.
Table 31: Ammonia background concentrations in ppb determined by EPA used in ANPRM
Jan Feb Mar Apr May Jun Jul Aug Sep Oct Nov Dec All Class I areas 0.8 0.7 0.7 1.0 1.0 1.3 1.0 1.0 1.0 1.0 1.0 0.9
Values for Mesa Verde only
1.0 1.0 1.3 1.3 1.3 1.3 1.5 1.5 1.5 1.5 1.3 1.0
3. Hydrogen Chloride and Hydrogen Fluoride
AECOM did not include estimates of hydrogen chloride (HCl) or hydrogen fluoride (HF) in their visibility modeling. During discussions with the FLMs prior to our ANPRM, the National Park Service (NPS) recommended that we address HCl and HF emissions for their potential to impact visibility. HCl is known to have the capacity to react with ammonia to form particulate ammonium chloride. Therefore, although HCl and HF emissions are not included in the WRAP modeling protocol, EPA estimated emissions of these compounds and included them in the visibility modeling as fine PM,213 and provided a detailed discussion of our emissions estimates in the ANPRM.
4. Alternative Visibility Metrics
In the ANPRM, we presented four ways to express the visibility improvement from the NOx and PM control technologies: (1) deciview impairment at each Class I area, (2) the sum of the impairment at all areas, (3) the percentage change in deciview impacts compared to the baseline at each area, and (4) a metric that accounts for the size of the land area over which controls provide visibility benefits. The visibility benefits reported in the ANPRM are reproduced below (see Table 32, Table 33, and
212 Mark E. Sather et al., 2008. �“Baseline ambient gaseous ammonia concentrations in the Four Corners area and eastern Oklahoma, USA�”. Journal of Environmental Monitoring, 2008, 10, 1319-1325, DOI: 10.1039/b807984f 213 NPS recommended HCl and HF be included in the category �“condensable organic PM�”. For CALPUFF modeling, EPA included HCl and HF into fine PM instead of condensable organic PM because they are inorganic, and because they are not subject to the chemistry in CALPUFF that is specific to organic compounds.

Technical Support Document for NGS Proposed BART Determination, rev. February 11, 2013 | Page 106 of 129
Table 34). Note that these tables from the ANPRM report the anticipated visibility impairment after applying NOx controls, where as other tables in this document report the visibility improvement after applying controls (Visibility Improvement = Baseline Visibility Impairment �– Visibility Impairment after Controls). Each visibility metric described above has advantages and disadvantages. Their absolute worth is somewhat in the eye of the beholder, but all of them provide useful information on visibility impacts, as long as their inherent limitations are understood. Deciview improvement at each Class I area is the primary metric under the BART guidelines. The third and fourth of the metrics, percentage and land area weighting, are described below.
Table 32: Visibility Impairment (98th Percentile dv) of NGS on Eleven Class I Areas as Modeled by EPA as reported in our ANRPM
Visibility Impact (dv) after applying: Baseline
(dv) LNB (B) SCR (C) (SCR
1&3) SCR (D)
(1/2 SCR) SCR (E)
(SCR 1 �– 3) Arches 3.25 2.08 1.33 1.16 0.89
Bryce Canyon 3.66 2.44 1.57 1.39 1.10 Canyonlands 4.37 2.98 1.90 1.65 1.25 Capitol Reef 5.48 4.08 2.97 2.71 2.04
Grand Canyon 5.41 4.35 3.34 3.06 2.46 Mazatzal 1.16 0.73 0.48 0.45 0.37
Mesa Verde 2.24 1.33 0.78 0.67 0.52 Petrified Forest 2.62 1.54 1.00 0.86 0.66 Pine Mountain 1.08 0.64 0.42 0.38 0.32
Sycamore Canyon 1.96 1.28 0.80 0.71 0.59 Zion 3.73 2.65 1.65 1.44 1.05
Sum of Class I areas
34.95 24.10 16.25 14.48 11.23
Table 33: Percent Improvement in Deciview Impairment based on EPA modeling for Each Class I Area from NOx Controls at NGS as reported in ANPRM
Visibility Impact (dv) after applying: LNB (B) SCR (C)
(SCR 1&3) SCR (D)
(1/2 SCR) SCR (E)
(SCR 1 �– 3) Arches 36% 60% 65% 74%
Bryce Canyon 26% 47% 53% 63% Canyonlands 32% 56% 62% 71% Capitol Reef 25% 48% 53% 63%
Grand Canyon 22% 43% 48% 58% Mazatzal 38% 60% 65% 72%
Mesa Verde 40% 63% 68% 76% Petrified Forest 36% 60% 65% 74% Pine Mountain 38% 59% 64% 71%
Sycamore Canyon 36% 59% 64% 72% Zion 31% 54% 60% 69%

Technical Support Document for NGS Proposed BART Determination, rev. February 11, 2013 | Page 107 of 129
Table 34: Alternative Visibility Metric as reported in ANPRM214 Visibility Impairment (dv-km2) after applying: Baseline
(dv-km2) LNB (B) SCR (C)
(SCR 1&3) SCR (D)
(1/2 SCR) SCR (E)
(SCR 1 �– 3) Arches 812 514 336 293 223
Bryce Canyon 495 324 212 187 147 Canyonlands 4649 3071 2022 1741 1320 Capitol Reef 4184 3127 2233 2031 1566
Grand Canyon 21,399 17,219 13,157 12,033 9698 Mazatzal 978 618 410 367 297
Mesa Verde 383 226 135 115 87 Petrified Forest 847 515 313 270 217 Pine Mountain 72 44 28 25 22
Sycamore Canyon 390 235 162 144 120 Zion 1574 1104 739 649 494
Sum of Class I areas
35,783 26,997 19,747 17,855 14,191
The motivation for the second and fourth metrics, which involve sums over Class I areas, is to provide a single number for comparing control scenarios to each other. There are multiple Class I areas, with different visibility impacts for each, but there is no established metric for expressing visibility impact considering all areas together in a single number. The overall impact can be assessed more or less intuitively, weighing the various area impacts and the number of affected Class I areas. As an alternative to such intuitive or implicit weighing, in the ANPRM, EPA presented two explicit metrics, described below. For the percentage metric, EPA used least-squares regression analyses of the visibility modeling results from the 2001 �– 2003 modeling period to determine the percent change in deciview impacts resulting from the application of control technologies compared to the baseline. The percent change is equal to one minus the slope from linear regression of the control scenario�’s daily delta deciviews against those of the baseline. Data from all modeled days was used, not just the highest impact days. Based on the modeling we conducted for the ANPRM, we estimated delta deciview improvements of 58 �– 76% from SCR+LNB/SOFA on all 3 units, and 22 �– 40% from LNB/SOFA on all 3 units. The percentage metric is not intended to represent the visibility improvement relative to current conditions, which include impacts from other anthropogenic and nonanthropogenic sources; 76% improvement does not mean that visibility impairment in the current atmosphere is reduced by that amount. Rather, it represents improvement in just the NGS contribution to impairment. By the nature of percentages, a feature of this metric is that when baseline impacts are small, even a small deciview benefit from controls may give a large percentage improvement. Conversely, when baseline impacts are high, even a relatively large deciview improvement may
214 In the ANPRM, EPA mistakenly reported the sum of all Class I areas for the alternative visibility metric for Baseline (reported as 24,943), Scenario B (19,708), Scenario C (19,708), Scenario D (15,716), and Scenario E (19,708). Table 34: Alternative Visibility Metric as reported in ANPRMreports the correct sums over all Class I Areas for the alternative visibility metric.

Technical Support Document for NGS Proposed BART Determination, rev. February 11, 2013 | Page 108 of 129
give only a modest percentage improvement. This metric emphasizes relative improvements in NGS�’s impairment contribution over absolute deciview improvements in visibility. For the land area metric, we multiplied the 98th percentile delta deciviews for each Class I area by its land area in km2, giving a size-weighted measure of visibility improvement. We presented these for each Class I area, and also the sum of these for all Class I areas together. This weighting by land area reflects the fact that a larger Class I area will have a visibility improvement at more locations than a smaller area. The Grand Canyon has a land area of 3972 km2, so this metric gives substantially more weight to improvements there than to the Black Canyon of the Gunnison, with an area of only 53 km2, whereas a simple sum of deciviews weights them equally. The main effect of the land area metric, as compared to a simple sum of deciviews, is to give greater weight to the larger Class I areas such as Canyonlands, Capitol Reef, West Elk, and especially the Grand Canyon. The simple sum of delta deciviews considers each Class I area to be equally important, while the land area weighted sum considers larger areas to be more important, reflecting the fact that a larger Class I area will have a visibility improvement at more locations than a smaller area. A feature of the metric is that a relatively small improvement at a large area would count more than a large improvement at a small area. Weighting by land area can seem reasonable or not, depending on how relevant one considers the particular sizes of the Class I areas defined by Congress, and how relevant the magnitude of an improvement is in comparison with the land area experiencing that improvement. A defect of the land area metric is that it assumes that the visibility improvement is the same at every location within a given Class I area; in reality visibility impacts and improvements vary in time and space. A more elaborate metric could consider this variation, and even the number of visitors at various times of year, the specific locations they visit, and the degree of enjoyment they experience. The weighted land area metric considers the relative sizes of Class I areas, but in a way that can easily be calculated, unlike those elaborations.
F. Affected State, Tribe, and FLM Consultation
1. Baseline Visibility Impacts of NGS The Navajo Nation commented that coal-fired power plants are relatively small contributors to regional haze in the surrounding Class I areas based on studies by the Grand Canyon Visibility Transport Commission and the Western Regional Air Partnership (WRAP), which estimated that NOx emissions from stationary sources probably cause 2 �– 5% of visibility impairment on the Colorado Plateau.215 The estimate from the initial WRAP assessment of the visibility impairment from stationary sources is based on the 20% worst visibility days on the Colorado Plateau. WRAP determined that on those worst visibility days, visibility impairment from particulate nitrates is 6 �– 18%. Because stationary sources contributed 25% of the WRAP NOx emissions inventory, WRAP estimated that stationary sources were responsible for 25% of the visibility impairment
215 Stationary Source NOx and PM Emissions in the WRAP Region: An Initial Assessment of Emissions, Controls, and Air Quality Impacts �– Final Report of the WRAP Market Trading Forum. October 1, 2003. http://www.wrapair.org/forums/mtf/nox-pm.html.
Technical Support Document for NGS Proposed BART Determination, rev. February 11, 2013 | Page 109 of 129
(i.e., 25% of 6 �– 18% = 2 �– 5%). However, the 2003 WRAP report further states that upon cursory examination of the daily data collected in 2001 on the Colorado Plateau, some of the 20% worst days are dominated by particulate nitrate and exceed the annual average. WRAP provided a few examples of nitrate contributions to visibility impairment ranging from 31 �– 55%. EPA notes that there is likely to be much greater variability in the nitrate contribution to visibility impairment than suggested by the WRAP estimate of 2 �– 5% based on a 20% subset of annual data.
2. Sulfuric Acid Emission Estimates The Navajo Nation supported the penetration factor for the air preheater relied on by SRP in its calculations for sulfuric acid emissions, but encouraged EPA to use measurement data when available. The Nation pointed to EPA�’s request to SRP to conduct source tests to measure current (baseline) sulfuric acid emissions from Navajo Generating Station and recommended we review the test results and revise the modeling as necessary.
3. Ammonia Background Levels The Arizona Department of Environmental Quality (ADEQ) stated216 that since the back-calculation method only indirectly estimates ammonia via measurements of sulfate and nitrate, it may not qualify as �“specific data�… available for the modeling domain�”, which the IWAQM Phase 2 document recommends if alternatives to the 1 ppb default are to be used.217 This can be interpreted as an implicit ADEQ recommendation for staying with the 1 ppb default. ADEQ also expressed concern that the back-calculation method for estimating ammonia background may over-estimate the concentration, because it relies on particulate sulfate and nitrate measurements that a) already include the effect of NGS emissions, leading to �“double-counting�”, and b) may have formed due to distant sources, rather than having been formed locally. Finally, ADEQ further recommended additional ammonia monitoring for assessment of the accuracy of the back-calculation method.
The National Park Service and the U.S. Forest Service (NPS and FS, and together, FLMs218) supported the back-calculation methodology and results we presented in the ANPRM. The FLMs determined the back-calculation method was more comprehensive because it considers both ambient ammonia measurements at specific locations within the modeling domain and the amount of ammonia that must have been present along the transport path from the emissions sources to the Class I areas. Because CALPUFF uses of only a single value for monthly concentrations to represent ammonia, which shows significant spatial and temporal variability, the FLMs determined that it is most appropriate to consider the amount of ammonia along the regional transport path in the ammonia background value. Additionally, the FLMs recommended that the modeling results be used in a relative sense for comparing control
216 ADEQ, October 28, 2009 comment letter to EPA�’s ANPRM docket, comments 12- 17 (electronic file �“10-28-09 Grumbles.pdf�”) 217 IWAQM Phase 2 document, section 2.2.2, p.14 218 The U.S. Fish and Wildlife Service is also a Federal Land Manager in charge of National Wildlife Refuge Class I areas. No refuges are within the 300 km modeling domain of FCPP and EPA did not receive comments on our ANPRM from the U.S. FWS �– National Wildlife Refuge System �– Branch of Air Quality, therefore we use the term FLM in this proposal to refer only to the National Park Service and the Forest Service. The FWS �– New Mexico Biological Services Field Office did submit comments on the ANPRM, but in the capacity of a FLM of an impacted Class I area.

Technical Support Document for NGS Proposed BART Determination, rev. February 11, 2013 | Page 110 of 129
technologies rather than continue disagreement over the absolute values used for the background ammonia. However, the Forest Service still recommended placing more emphasis on the visibility results from EPA modeling using back-calculated ammonia values. The Navajo Nation supported the use of ambient measurements where possible and noted that Salt River Project (SRP), primarily in the interest of Navajo Generating Station, has installed ammonia monitors near Grand Canyon National Park to better inform background ammonia levels for CALPUFF modeling. SRP provided the results of the monitoring study to EPA in September 2010.219
4. Additional Modeling Results During our consultations with the FLMs prior to our ANPRM, NPS commented that AECOM likely underestimated visibility impacts of the facilities because AECOM modeled inorganic condensable particulate matter as only sulfuric acid mist. NPS conducted their own CALPUFF modeling analysis (See Table 35) to estimate visibility benefits of controls and used AECOM estimates for SO2 and NOx and NPS estimates of PM emissions and background ammonia. Although NPS supported our use of back-calculated ammonia background values, for comparison purposes, NPS used a year-round background ammonia concentration of 1 ppb, consistent with the IWAQM default. NPS submitted its comments on AECOM�’s BART analysis for NGS to EPA by letter dated July 24, 2009, just prior to EPA�’s publication of the ANPRM. EPA posted the NPS letter and appendices220 to the docket for the ANPRM.
Table 35: NPS Modeling Results �– Average 8th High Baseline and Delta dv Improvement from 2001 �– 2003
Class I Area Baseline Impact Improvement from LNB/SOFA
Improvement From SCR + LNB/SOFA
Arches 3.857 1.360 2.643 Bryce Canyon 4.222 1.058 2.377 Canyonlands 5.104 1.689 3.365 Capitol Reef 6.127 1.047 3.034
Grand Canyon 6.609 1.131 2.893 Mazatal 1.121 0.442 0.693
Mesa Verde 2.154 0.867 1.523 Petrified Forest 2.784 1.006 1.930 Pine Mountain 1.195 0.474 0.808
Sycamore Canyon 2.261 0.885 1.550 Zion 3.808 1.099 2.386
Total 39.242 11.058 23.201
5. Visibility Metrics
The FLMs supported our consideration in the ANPRM of the cumulative visibility improvement anticipated at all of the impacted Class I areas. However, the FLMs did not support the alternative visibility metric we introduced in the ANPRM that multiplies the 98th
219 Measurements of Ambient Background Ammonia on the Colorado Plateau and Visibility Modeling Implications, Prepared by Salt River Project, Contributors: Ivar Tombach and Robert Paine, September 2010. 220 See document IDs 0017 and 0036 in the ANPRM docket: EPA-R09-OAR-2009-0598 at www.regulations.gov

Technical Support Document for NGS Proposed BART Determination, rev. February 11, 2013 | Page 111 of 129
percentile change at the highest receptor by the land area of the Class I areas because the metric values larger Class I areas more than smaller Class I areas. Instead, NPS and FS discussed alternatives to our area-weighted visibility metrics. FS discussed two different techniques for accounting for visibility impacts over multiple days at multiple Class I areas. The first technique sums the daily maximum receptor deciview impacts, over 365 days, at all Class I areas in the modeling domain to yield a metric in units of $/Class I area dv-day (dollar per Class I area deciview-day). The second technique is similar to the first, but the single daily maximum receptor is chosen from all of the Class I areas in the modeling domain pooled together, yielding a metric in units of $/dv-day. NPS introduced another visibility metric called the pollutant effectiveness (PE) factor, which is the visibility improvement (in dv) divided by the annual emission reduction (in tons). NPS uses the PE factor to estimate visibility improvement resulting from the proposed controls on each EGU individually, without modeling each EGU separately. NPS then uses the estimated visibility improvement from each EGU to derive unit-specific dollar per dv values for the various control scenarios. Based on their modeling and cost analyses, NPS estimates that the cost effectiveness of SCR ranges from $1.9 �– 2.7 million per dv, in contrast to SRP�’s cost effectiveness of $12.7 �– 17.4 million per dv. NPS asserts that SRP�’s costs for SCR are overestimated and visibility benefits are underestimated, but acknowledge that there are considerable uncertainties and differences between the approaches used by SRP and NPS to derive their cost estimates. To create a �“middle-ground�” estimate, NPS combined the cost estimates from SRP and their own visibility modeling results to calculate cost effectiveness values of $4.9 �– 6.6 million per dv. Considering a $17 million per dv reasonable cost benchmark based on other facilities, NPS determined that all estimates of cost effectiveness, including SRP�’s upper range cost estimates for SCR and lower range estimates for visibility improvements, are at or below the benchmark, and thus NPS concluded that SCR is BART for all units at NGS.
Various ANPRM commenters objected to our use of the land area weighted metric described in the ANPRM on grounds of its seeming artificiality, its complexity, and its unfamiliarity. Any metric entails judgements about the relative importance of the magnitude, frequency, and spatial coverage of visibility improvements; this is especially so for a metric that combines impacts from multiple Class I areas, since it assigns an importance to each area relative to the others. Without guidance or general agreement on these various judgements, discussion tends to focus on the merits of the metric itself rather than on the visibility implications of its calculated value. For this proposal EPA did not calculate or consider the land area weighted metric.
G. EPA Conclusions Regarding this Factor EPA remodeled the visibility impacts of NGS using emission inputs based on revisions to (1) our sulfuric acid emissions calculation �– the hot-side ESP penetration factor (from 1 to 0.63), the air preheater penetration factor (from 0.49 to 0.50), and the SO2 to SO3 conversion efficiency of the SCR catalyst (from 0.5% to 0.67%), (2) HCl and HF emissions in the fine PM input to CALPUFF, (3) background ammonia estimates using the IWAQM 1 ppb default, and (4) two NOx control levels to 0.08 lb/MMBtu and 0.05 lb/MMBtu, as discussed in Section 3.D of this TSD.
1. Sulfuric Acid Emission Estimates

Technical Support Document for NGS Proposed BART Determination, rev. February 11, 2013 | Page 112 of 129
SRP submitted comments regarding our assumptions in the ANPRM. The following
discussion provides a brief summary of each assumption used in the sulfuric acid emissions calculation, and a more detailed rationale for the two cases where EPA disagreed with the assumption used by AECOM, i.e., SO2 to SO3 oxidation from the SCR catalyst and loss in the air preheater.
The amount of fuel sulfur that is oxidized to SO2 is estimated for three different coal
types. Hardman et al. (1998)221 report sulfur conversion to SO2 (based on AP-42) to be 0.95 for bituminous coal, 0.875 for subbituminous coal, and 0.55 �– 0.85 for lignite coal, based on sodium (Na) content. AP-42 explains that the alkaline nature of sub-bituminous coal ash results in some of the sulfur to form sulfate salts, reducing the amount of SO2 in the flue gas. EPA agrees with SRP that the ash generated at NGS has relatively low available alkalinity,222 therefore AECOM and EPA both rely on the value of 0.95 for estimating SO2 production from fuel sulfur.
For coal-fired power plants without SCR, SO3 is only formed during the combustion
process. The amount of SO2 that is oxidized to SO3 during combustion depends on coal type and the type of boiler. Measurements of SO3 production show a wide range (0.00111 �– 0.016) but many of the values reported in the EPRI 2008 document are based on single measurements. EPRI 2008 and Harrison 2005223 both report the SO3 production factor from Western bituminous coal from dry bottom boilers to be 0.00111, or 0.111% of SO2 production, and AECOM and EPA both used this value.
For coal-fired power plants with SCR, SO3 is also formed as a result of oxidation of SO2 to SO3 on the SCR catalyst. As discussed in Section 3 of this document, AECOM assumed a 1% conversion of SO2 to SO3 across the SCR catalyst layers, whereas EPA used 0.5% conversion efficiency in our ANPRM because low conversion catalysts are commercially available to specifically reduce H2SO4 formation following the application of SCR. In its comment letter to EPA on the ANPRM, SRP agrees with EPA that ultra low oxidation catalyst can be used. In 2010, based on information EPA submitted to Hitachi Power Systems America regarding NGS, Hitachi guaranteed that a total 0.5% conversion of SO2 to SO3 using 3 layers of CX series catalyst, can be achieved while controlling NOx by 80 �– 90%.224 After an initial 16,000 hours of use, an additional layer of catalyst would be used, adding an additional 0.167% conversion. In our ANPRM, we did not account for the additional conversion resulting from the 4th layer of catalyst. Therefore, we now use 0.67% SO2 to SO3 conversion in our calculations, which is the maximum conversion rate when using 4 layers of catalyst assuming a 3+1 system to achieve 0.05 lb/MMBtu. In our modeling, we also include a scenario where we assume a 2+1 system to achieve 0.08 lb/MMBtu with a 0.5% SO2 to SO3 conversion rate. Although comments submitted by the Environmental Consortium recommend using a 0.1% conversion rate, EPA relied on the vendor guarantee. EPA recognizes that the rate achieved may be lower than the guarantee, however, to be conservative, EPA has determined that maximum conversion rate with all layers in use is most appropriate for our sulfuric acid estimates used in the visibility modeling. EPA notes that SRP revised its cost analysis to include the cost of the ultra low conversion catalyst.
221 Hardman, R., R. Stacy, E. Dismukes. Estimating Total Sulfuric Acid Emissions from Coal-Fired Power Plants. Southern Company Services, Revised September 1998. 222 APS Comments on ANPRM (See EPA-R09-OAR-2009-0598-0195). 223 Harrison, K.E., L.S. Monroe, J.E. Cichanowicz, Estimating Total Sulfuric Acid Emissions from Stationary Power Plants: Revision 3 (2005). Southern Company Services, October 2005. 224 Anthony Favale, Hitachi Power Systems America to Anita Lee, electronic mail, April 21, 2010.

Technical Support Document for NGS Proposed BART Determination, rev. February 11, 2013 | Page 113 of 129
At NGS, H2SO4 removal can occur in the hot-side ESPs, air preheaters, and wet FGDs. In its modeling for NGS, AECOM assumed a sulfuric acid removal efficiency through the hot-side ESP of 37% (or a penetration factor of 0.63). In the modeling EPA conducted for the ANRPM, EPA assumed a penetration factor of 1, i.e., no sulfuric acid removal by the hot-side ESP. Although EPA inadvertently did not provide an explanation in the ANPRM for our use of a penetration factor of 1 for the hot-side ESP, EPA expected that temperatures within the hot-side ESP would be too high for efficient capture of sulfuric acid in the hot-side ESP. In its comment letter to EPA on the ANPRM (see page 42), SRP stated that a control efficiency from the hot-side ESP of 37% should be used. The 2008 EPRI report similarly recommends use of a control efficiency of 37% for hot-side ESPs and all coal types based on one measurement at one facility. EPA believes there is also considerable uncertainty regarding how much sulfuric acid will be lost to the hot-side ESP, however, the best available information on hot-side ESP control efficiencies for sulfuric acid appears to be the only available information, therefore, as recommended by SRP, EPA used a control efficiency of 37% in our modeling (penetration actor of 0.63), and is requesting comment on this penetration factor and whether additional information on removal efficiencies from hot-side ESPs is available. Specific air preheater removal efficiencies were not available from EPRI 2008 and other references for non-Powder River Basin (PRB) Western bituminous coal, and only one datum point is available for PRB coal. EPRI 2008 reports penetration factors of 0.49 (Low Sulfur Eastern Bituminous coal), 0.85 (Med-High Sulfur Eastern Bituminous coal) and 0.56 (PRB coal). Most data is available for low-sulfur Eastern bituminous coal: measurements from eight units show a range of percent removal from 0 �– 69%. Before calculating the average % removal of H2SO4 observed from low-sulfur Eastern bituminous coal, EPRI 2008 and Harrison 2005 excluded the 0% removal value because �“the data point showing 0% removal at approximately 600 ppm SO2 is believed suspect, as an identical companion unit firing the same coal exhibited sulfuric acid capture of 38%�”. Because data from other coal types was not available, EPRI 2008 and Harrison 2005 suggested that western coals with acidic ash (e.g., bituminous) may consider adopting the low sulfur, eastern bituminous value of 0.49 for the H2SO4 penetration (1- removal), which is equivalent to 51% removal. EPA used the 0.49 value for the air preheater penetration factor for our analysis presented in the ANPRM. This was consistent with SRP�’s statement cited above that their ash has low alkalinity. In its analysis for NGS, AECOM used an air preheater penetration factor of 0.9 (10% removal). The 0.9 penetration factor is consistent with the value for PRB coal in Harrison 2005 and for Western bituminous and subbituminous coal in Hardman 1998, but inconsistent with the value for PRB coal from EPRI 2008. The values in EPRI 2008 document are identical to those in Harrison 2005, except for the change from 0.9 to 0.56. AECOM chose to use the earlier PRB value from Harrison 2005 rather than EPRI 2008. SRP submitted comments to EPA regarding our use of 0.49, stating that SRP considered the use of this factor and determined that it was not appropriate because (1) removal in the air preheater is limited by the hot-side ESP, which removes fly ash, located upstream of the air preheater, because low-dust air preheaters have cleaner internal baskets resulting in less surface area to collect sulfuric acid, and (2) the low alkalinity ash at NGS suggests that less sulfuric acid would be removed.225 For these reasons, SRP concludes that it is more appropriate to rely on the
225 See SRP Comment letter on ANPRM, document number 0126 in ANPR docket.

Technical Support Document for NGS Proposed BART Determination, rev. February 11, 2013 | Page 114 of 129
value of 0.9 in Hardman 1998. However, Harrison 2005 associates the 0.9 value specifically with PRB coal. Because Harrison 2005 is the updated version of the Hardman 1998 publication from Southern Company Services, EPA concludes that the PRB coal is the appropriate categorization for the 0.9 value. EPA was not able to determine from Hardman 1998 or Harrison 2005 how many measurements the 0.9 value was based on, however, given that no standard deviation was reported for this value (but a standard deviation was reported for the six units on which the Eastern low-sulfur bituminous value was based) in Harrison 2005, EPA concludes that the 0.9 value is based on a very limited number of data points.
The 2010 EPRI update226 to its 2008 publication revised the air preheater penetration factor for PRB coal down from 0.49 (2008 version) to 0.36 (2010 version). Given the high alkalinity of PRB ash, we expect removal of H2SO4 from PRB coal to provide more than just 10% removal of H2SO4, and the revised EPRI report is consistent with this expectation. Formation of SO3 is highly dependent on coal and boiler type and ash characteristics, and PRB coal and NGS coal are not identical. EPA believes it is inappropriate to rely on the penetration factor for PRB coal for NGS because of the expected difference in ash alkalinity. EPA also notes that the 2010 EPRI update also does not list an air preheater penetration factor of 0.9 for any coal type, but does list an air preheater penetration factor of 0.85 for medium to high sulfur (>2.5%) eastern bituminous coal. The coal used by NGS is clearly not medium to high sulfur coal (<1%). The remaining air preheater penetration factor is 0.50 for low sulfur eastern bituminous coal. The 2010 EPRI update recommends the use of this factor for other coal types if the ash is acidic. Because of the relatively low alkalinity of the ash produced at NGS, EPA believes that the best available data from the 2010 EPRI update suggests using the air preheater penetration factor of 0.50. EPA�’s modeling assumes a penetration factor from the air preheater of 0.50.
Downstream of the air preheater, H2SO4 is additionally lost to SO2 control equipment.
EPA and AECOM used the EPRI-recommended penetration factor of 0.47 through a wet spray tower FGD reported for eastern bituminous coal.
Table 36: Assumptions used in Sulfuric acid (H2SO4) Emissions Calculations
AECOM EPA (ANPRM) EPA (Proposal) Fuel Impact Factor (SO3 formation from combustion) 0.00111 0.00111 0.00111
Coal sulfur content (%) 0.772 0.772 0.772 Coal S conversion to SO2 0.95 0.95 0.95
Conversion of SO2 to SO3 from SCR catalyst (%) 1 0.5 0.67 Penetration factor227 through the Hot-side ESP 0.63 1 0.63
Penetration factor through Air Preheater 0.9 0.49 0.50 Penetration factor through wet spray tower 0.47 0.47 0.47
In its comment letter, the Navajo Nation recommended we consider the results of the
sulfuric acid emissions testing SRP conducted at NGS. The source tests provide a useful baseline for sulfuric acid emissions, however the testing protocol was not designed to measure inlet and outlet concentrations at each potential sulfuric acid control point (e.g., air preheater, hot-side ESP, etc.), therefore, it is not possible, based solely on exit emission rates from the stack, to determine which of the many assumptions used in the sulfuric acid emissions calculations requires revision.
226 Electric Power Research Institute, Estimating Total Sulfuric Acid Emissions from Stationary Power Plants, Version 2010a, 1020636, Technical Update, April 2010. 227 Penetration factor = 1 - Control Efficiency

Technical Support Document for NGS Proposed BART Determination, rev. February 11, 2013 | Page 115 of 129
However, we agree with the Navajo Nation that it is instructive to examine predicted and measured sulfuric acid emissions from NGS. NGS conducted source tests on November 16 �– 17, 2009 to measure baseline sulfuric acid emissions from all three units using the controlled condensate method.228 These baseline emissions represent sulfuric acid emissions without SCR. From three units, NGS reported an average emission rate of 0.00009 lb/MMBtu (9 x 10⁻⁵). The three units show significant variability (9.43 x 10⁻⁵, 1.64 x 10⁻⁴, and 1.75 x 10⁻⁵), but are all below emissions predicted by the EPRI model using both EPA�’s and SRP�’s assumptions for the EPRI calculation (4.2 x 10⁻⁴ and 4.9 x 10⁻⁴ lb/MMBtu).229 These source tests from NGS suggest that the cumulative result of all the assumptions is that the EPRI model overpredicts sulfuric acid emissions compared to measurements. Because EPA used a lower penetration factor for the air preheater than AECOM, the EPA estimate is closer to the measured values.230 Again, there are numerous assumptions and control points in the EPRI calculation methodology, and EPA believes the source tests do not provide enough information to inform which of the many assumptions in the EPRI methodology result in the overprediction of sulfuric acid emissions in the model compared to measurements. However, EPA can conclude that the source test results do suggest that EPA�’s choice of air preheater penetration efficiency, in addition to other assumptions, were generally more conservative and appropriate than those used by SRP.
2. HCl and HF Estimates
EPRI submitted comments231 on the ANPRM stating that the inclusion of HCl and HF as
fine PM is inappropriate and provided calculations suggesting that after emission into the atmosphere, HCl and HF tend to remain in the gas phase, not the particulate phase, and also that the solubility of chloride and fluoride ions into water-containing particles would be inhibited by the presence of sulfate, whose solubility is orders of magnitude higher. Therefore, in this proposal, EPA removed HCl and HF emissions from our modeling inputs for fine PM.
3. Ammonia Background Values For ammonia background concentrations in this proposal, EPA used the IWAQM default of 1 ppb, and corroboration from modeling using ammonia levels from a back-calculation procedure relying on sulfate and nitrate measurements at Class I areas. EPA considered various objections to the back-calculation procedure raised by commenters on the ANPRM. EPA also strongly considered the opinions of the FLMs, who generally favored the back-calculation approach. EPA has determined that the 1 ppb default and corroboration from the back-calculation results are a reasonable basis for assessing visibility impacts, in light of the uncertainties involved in estimating ammonia. However, EPA also performed sensitivity modeling using the lower ammonia concentrations originally used by SRP in their modeling. Below we describe the approach used, and then address various concerns over the back-calculation procedure.
228 Salt River Project Navajo Generating Station �– Acid Mist Emissions Test Report by Catalyst Air Management, Inc. Report Number 264-001 (December 31, 2009). 229 Note that for the hot-side ESP at NGS, EPA assumed a penetration factor of 1, whereas AECOM assumed a penetration factor of 0.63, thus the difference in the air preheater penetration factor used by EPA (0.49) and AECOM (0.9) is less apparent compared to FCPP, which does not use hot-side ESPs. 230 If we included additional penetration from the hot-side ESP, EPA�’s estimated sulfuric acid emissions would be closer to measurements. 231 Comments submitted by Eladio Knipping, EPRI dated October 26, 2009.

Technical Support Document for NGS Proposed BART Determination, rev. February 11, 2013 | Page 116 of 129
Based on comments we received on the ANPRM, we reexamined the ammonia background values. For this proposal, EPA used the IWAQM default of 1 ppb, with corroboration from a variant of the back-calculation procedure that was used for the ANRPM, described above. In the back-calculation for this proposal, instead using of the maximum for each month, EPA used the mean plus two standard deviations. (For the normal distribution, this represents the 97.5th percentile.) This remains a conservative estimate, but compared to the maximum it is more in line with the BART Guidelines principle of avoiding unusual meteorological conditions (the rationale in the BART Guidelines for using the 98th percentile delta deciviews instead of the maximum), and partly addresses some commenters�’ concerns that the method is overly conservative. The monthly average was also considered, but was felt to be too low to represent the daily high impact conditions that can occur and that are the focus of visibility assessments under the BART guidelines. Also, instead of averaging over all Class I areas, EPA used different sets of values for each of five different groups of Class I areas. The groups were defined geographically, with one for each of the directions northwest, northeast, southeast, southwest, and with the Grand Canyon in a group by itself. Areas that are nearer to each other geographically and have broadly similar ammonia estimates are grouped together, providing a better match to particular areas than the single average over all areas used in the ANPRM. The groups are listed in Table 37 and the ammonia background concentrations are in

Technical Support Document for NGS Proposed BART Determination, rev. February 11, 2013 | Page 117 of 129
Table 38. For the northwest areas, the values range from 0.6 to 1.0 ppb; for the northeast the range is 0.4 to 0.8 ppb; for the Grand Canyon and the southeast group the range is 0.5 to 1.1 ppb; and for the southwest it is 0.6 to 1.3 ppb. The lower values are in the winter, and the higher ones in summer.
Table 37: Class I area groupings for ammonia background used in this proposal
Grouping IMPROVE monitors Class I Areas Grand Canyon GRCA2 Grand Canyon northwest areas BRCA1, CANY1, CAPI1 Arches, Bryce Canyon, Canyonlands, Capitol Reef northeast areas GRSA1, WEMI1, WHPE1,
WHRI1 Black Canyon of the Gunnison*232, Great Sand Dunes*, La Garita*, Maroon Bells Snowmass*, Pecos*, Weminuche*,
West Elk*, Wheeler Peak* southeast areas BAND1, SAPE1 Bandelier*, San Pedro Parks* southwest areas IKBA1, PEFO1, SYCA1 Mazatzal, Petrified Forest, Pine Mountain, Sycamore Canyon
232 Areas denoted with a �“*�” were not modeled for NGS, but monitors included in ammonia calculation as nearest to the areas modeled

Technical Support Document for NGS Proposed BART Determination, rev. February 11, 2013 | Page 118 of 129
Table 38: Ammonia background concentrations in ppb modeled by EPA used in proposal Ammonia scenario Jan Feb Mar Apr May Jun Jul Aug Sep Oct Nov Dec
Am1: IWAQM default 1.0 1.0 1.0 1.0 1.0 1.0 1.0 1.0 1.0 1.0 1.0 1.0 Am2: AECOM values 0.2 0.2 0.5 0.5 1.0 1.0 1.0 1.0 1.0 0.5 0.5 0.2 Am3: EPA average of
max233 0.8 0.7 0.7 1.0 1.0 1.3 1.0 1.0 1.0 1.0 1.0 0.9
Am4: Mesa Verde only 1.0 1.0 1.3 1.3 1.3 1.3 1.5 1.5 1.5 1.5 1.3 1.0 Am5gc234: Grand
Canyon only 0.52 0.46 0.63 0.97 1.02 1.12 0.93 0.98 0.77 0.82 0.83 0.58
Am5nw: northwest areas 0.74 0.79 0.56 0.94 0.84 0.99 0.91 0.83 0.65 0.61 0.73 0.90 Am5ne: northeast areas 0.43 0.49 0.49 0.75 0.70 0.81 0.66 0.66 0.61 0.68 0.59 0.45 Am5se: southeast areas 0.80 0.66 0.62 0.82 0.79 1.14 0.94 1.11 1.00 1.01 0.81 0.50
Am5sw: southwest areas 0.71 0.67 0.76 1.11 1.09 1.27 1.05 1.10 1.05 0.99 1.04 0.61
EPA could rely solely on the IWAQM default, but believes the back-calculation method is also useful, since it is an objective approach and relies on monitored data at the Class I areas where visibility is being assessed, and has a degree of conservatism. EPA is aware of various limitations inherent to the method, some of which were raised by ANPRM commenters. Per the ADEQ comment on the ANPRM stated above (in section F.c.), for an alternative to default ammonia levels, the context in the IWAQM Phase 2 document does seem to envisage measurement of ammonia itself, rather than of other compounds that indirectly imply ammonia concentrations via a calculation: �“However, given all the uncertainties in ammonia data, IWAQM recommends use of the background levels provided above, unless specific data are available for the modeling domain that would discredit the values cited�”.235 For this proposal, EPA is considering visibility impacts estimated using the 1 ppb ammonia default. This is consistent with BART analyses carried out in many other parts of the country. However, EPA continues to believe that the indirect back-calculation method provides a useful estimate that is based on measured data, and helps ensure the robustness of the BART determination. As noted in the IWAQM Phase 2 document, ammonia concentrations vary with temperature by a factor of 3 �– 4, and also vary strongly with soil pH, and with the presence of local ammonia sources.236 Thus ammonia is expected to vary temporally and spatially. Unfortunately, there is relatively little monitored ammonia data available to determine typical concentrations or their variation. Expanded ammonia monitoring would be desirable, but the BART guidelines do not envisage the initiation of a new monitoring program as necessary for BART determinations; that would be a much larger undertaking than the analysis procedures described in the guidelines. Other than the IWAQM default supplemented by available measurements, there is not an accepted method for estimating ammonia for use in CALPUFF visibility modeling. In addition, even if such data were available, CALPUFF accepts only a single ammonia value for each modeled month for the whole modeling domain, so it uses little temporal variation, and no spatial variation. There are substantial uncertainties associated with
233 Am3 is the average over all areas of the maximum calculated ammonia; used in the ANPRM, but not in this current proposal. 234 Am5xx is the average over areas in group xx of the mean plus two standard deviations of calculated ammonia. 235 IWAQM Phase 2 document, section 2.2.2, p.14 236 IWAQM Phase 2 document, section 2.2.2, pp.14-15

Technical Support Document for NGS Proposed BART Determination, rev. February 11, 2013 | Page 119 of 129
the background ammonia concentration, and also compromises involved in any approach to estimate it. New ammonia monitoring data was collected by SRP at several sites between NGS and the two nearest Class I areas, Capitol Reef National Park and Grand Canyon National Park, from December 2009 through April 2010. The monitoring report237 describes a surprisingly high spatial variability in ammonia concentrations. The two monitors in the Cameron area south of NGS (and east-southeast of the Grand Canyon) showed consistent concentration differences despite being less than 5 miles from each other; this may be due to relatively localized ammonia sources. These sites also showed consistently lower measurements than the Hall�’s crossing site, north of NGS (and southwest of Capitol Reef). The range in concentrations was comparable to the range seen between the AECOM values at the low end, EPA�’s back-calculated values at the high end. Unfortunately, because of the variability and its unknown causes, the data collected did not lead to a clear picture of appropriate and representative ammonia background concentrations to use with CALPUFF. EPA views the back-calculation method as providing a reasonable objective indicator of ammonia concentrations that the emission source�’s plume can encounter as it travels to a Class I area, and not necessarily as a definitive estimate of ammonia concentration within the Class I area itself. It is not definitive because it is not a direct ammonia measurement, but rather an indirect estimate based on integrated 24-hour sulfate and nitrate measurements. An effect of the indirectness is that it can only account for ammonia that is present at the monitor in the form of particulate ammonium (NH4
+), and not any that is present as free gaseous ammonia (NH3). The method thus provides a lower bound on the total amount of ammonia present, and tends to underestimate the total ammonia available to interact with the source plume. (Conversely, a direct measurement of free ammonia does not include particulate ammonium, and so would also tend to underestimate the total ammonia available.)
While the method may tend to underestimate the total ammonia available because it does not account for gaseous ammonia, another aspect of the method is that it assumes that all of that ammonia is available to interact with emissions from the single source being modeled. In the real atmosphere, SOx and NOx emissions from multiple sources compete for the available ammonia. But CALPUFF modeling using the ammonia back-calculated from those measurements assumes all that ammonia is available to interact with the NGS plume. This procedure would not be appropriate for assessing the actual impact of NGS in the real atmosphere as part of a source apportionment; in that case it might be considered �“double counting�”, since the calculated ammonia includes ammonium from NGS itself as well as from other sources. But for BART modeling it is acceptable because the assumption that all the ammonia is available to NGS emissions is comparable to assuming that there are no competing sources, similar to natural background conditions. EPA believes that the back-calculation method is in accord with the BART Guidelines�’ recommendation to assess visibility impacts relative to natural conditions. The above-mentioned 24-hour integration aspect of the back-calculation method is desirable in that concentrations in the source plume when it arrives at the Class I area are the cumulative (integrated) result of conditions the plume has encountered on the way. The
237 �“Measurements of Ambient Background Ammonia on the Colorado Plateau and Visibility Modeling Implications�”, Salt River Project, Dr. Ivar Tombach, Consultant, and Robert Paine, AECOM Environment, September 2010

Technical Support Document for NGS Proposed BART Determination, rev. February 11, 2013 | Page 120 of 129
IMPROVE concentrations reflect particulate ammonium formation that resulted from various gaseous ammonia concentrations and various meteorological conditions encountered, which is desirable for estimating 24-hour visibility impacts.238 On the other hand, an undesirable aspect of the integration is that for different hours within a given day, the sulfate and nitrate at the IMPROVE monitor may have arrived via different routes. Some of those routes may have little relevance for the plume of the source being assessed, but the method assumes ammonia along all routes is available to interact with the source plume. The same issue arises considering different days: some days�’ transport routes to the monitor will have little relevance for the source plume, yet their back-calculated ammonia is assumed to be available for that plume. That is, ammonium sulfate transported to the monitor from a completely different direction than NGS adds to the ammonia calculated as available to the NGS plume. Two considerations lessen the severity of these issues. First, other things being equal, these other transport routes would be just as likely to encounter below-average ammonia concentrations as to encounter above-average ammonia. The various contributions to an IMPROVE monitor within a day and over multiple days tend to balance each other in the overall distribution of calculated ammonia values, especially since averages over several monitors are used. Second, this potential source of inaccuracy is lessened by considering multiple years of data; in the aggregate the range of ammonia values derived from the method for hundreds of days is likely to be seen by the source�’s plume at various times during that span. In any case, to properly assess the net effect of these potential problems would require a much more complex analysis than envisaged under the BART guidelines, involving modeling of multiple sources, the development of an ammonia inventory, and a model with more complete chemistry than CALPUFF. In view of the lack of available ammonia data, and counterbalancing tendencies for under- and overestimation within the back-calculation method, EPA believes that it remains useful as a �“ballpark�” estimate of ammonia concentrations contributing to particulates at IMPROVE monitors, since it is based on actual measured data, is easily computed, and on many days would be expected to represent ammonia concentrations encountered by the source�’s plume. It appears to be conservative, while remaining realistic. Some conservatism is warranted given the BART guidelines�’ emphasis on the higher (98th percentile) impacts, and also given that ammonia has generally been trending upward over the past decade.239 As a rough check on the appropriateness of the ammonia background concentration estimates, EPA compared CALPUFF predictions of nitrate impacts from NGS to nitrate measurements at IMPROVE monitors in Grand Canyon National Park. If the assumed ammonia is too high, then too much ammonium nitrate will be simulated in the model, and predicted nitrate will exceed the nitrate measured at the IMPROVE monitors. Given the uncertainty in the ammonia estimates, some over-prediction is acceptable, but consistently large over-predictions would be grounds for concern. Particular receptor points were selected based on their high modeled nitrate impacts, and then a 2001-2003 time series of daily nitrate was generated for each
238 Since nitrate has a fast equilibrium between gaseous and particulate forms, it could be argued that for nitrate the spatial integration over the plume path is less relevant than conditions in the immediate vicinity of the Class I area. By this argument, for nitrate the 24-hour values could be considered as more of a temporal integration of conditions at the area, which is still desirable for estimating 24-hour visibility with CALPUFF. 239 Christopher M. B. Lehmann et al., �“Monitoring Long-term Trends in Sulfate and Ammonium in US Precipitation: Results from the National Atmospheric Deposition Program / National Trends Network�”, Water, Air, & Soil Pollution: Focus, Volume 7, Numbers 1-3, March, 2007, DOI:10.1007/s11267-006-9100-z

Technical Support Document for NGS Proposed BART Determination, rev. February 11, 2013 | Page 121 of 129
Graphical comparisons were made between these predictions and the GRCA2 Grand Canyon IMPROVE monitor measurements, an alternative ammonia scenario.240 The nitrate check scenario was modeled prior to the main CALPUFF visibility modeling for this proposal. It is comparable to the Am5 scenario, but uses a just single set of monthly values, instead of separate monthly values for various groups of areas; the single set is derived from an ammonia back-calculation considering all the Class I areas instead of just values for a particular grouping.
Table 39: Ammonia background concentrations in ppb for modeled by EPA for nitrate check
Ammonia scenario Jan Feb Mar Apr May Jun Jul Aug Sep Oct Nov Dec NGS nitrate check 0.8 0.7 0.7 1.0 1.0 1.3 1.0 1.0 1.0 1.0 1.0 0.9
EPA concluded from these checks that nitrate predictions were somewhat high in that high values occurred more frequently than in the measured IMPROVE data, but their maxima were in the range of maxima seen in the measured data. Since the values used in the proposal�’s Am5 scenario are comparable to or lower than those used in this check, a comparable check using Am5 would be expected to show better agreement with measured data. This provides support for the Am5 scenario used as corroboration in this proposal, and some evidence against using Am2 (the AECOM values). In addition, EPA conducted more extensive checking of nitrate predictions for the BART proposal for the Four Corners Power Plant (FCPP).241 EPA found that the predicted highs were comparable to the measured highs, based on the maximum, the 98th percentile, and inspection of peaks on the time series graphs. At the higher impacts which are of the most regulatory interest, there was general agreement between the model predictions and the measurements. While this additional checking was conducted for FCPP rather than NGS, it does lend support to the back-calculation methodology Am5 used as corroboration in this proposal, and also corroborates the results of the Am3x checks that were performed for NGS. EPA concludes that there is not any systematic overprediction of nitrate highs using either of the ammonia background scenarios Am1 or Am5 considered by EPA for this proposal. Finally, there may be an additional increment of ammonia from �“ammonia slip�”, that is, ammonia added to control NOx as part of the SCR and SNCR, but which remains unreacted. Some of this unreacted ammonia can react with sulfuric acid created from oxidation of sulfur in the coal fuel, including oxidation by the SCR catalyst. The ammonia and the sulfuric acid can react to form ammonium bisulfate and ammonium sulfate; the amounts of these and of any leftover ammonia and sulfuric acid depends on the relative amount of ammonia and sulfuric acid present originally. Following the EPRI 2010 sulfuric acid estimation document,242 EPA calculated the amounts of the various reaction products in the emission calculation spreadsheet cited below. For purposes of visibility modeling, the relative amounts of sulfuric acid,
240 See Excel spreadsheets entitled �“NH3_scenarios_ANPRM.xls�” and �“NO3_compare_ANPRM.xls�”. Note that these spreadsheets use a different ammonia scenario numbering scheme than that used in the notice for this proposal and in this TSD. In the spreadsheets, �“am3�” is the scenario that appears in this TSD as �“NGS nitrate check�”. The spreadsheet�’s �“am1�” is the same as the �“Am2: 0.5 �– 1 ppb�” scenario here, and �“am4�” is identical to �“Am4�” here. The spreadsheet�’s �“am2�” was a high ammonia test case, and is not being used for this proposal. 241 �“Technical Support Document, Proposed Rule: Source Specific Federal Implementation Plan for Implementing Best Available Retrofit Technology for Four Corners Power Plant: Navajo Nation�”, Docket Number: EPA-R09-OAR-2010-0683. EPA Region 9, October 10, 2010. 242 EPRI 2010, op. cit.

Technical Support Document for NGS Proposed BART Determination, rev. February 11, 2013 | Page 122 of 129
ammonium bisulfate, and ammonium sulfate in the end products (that is, the partitioning of the starting sulfate into these end products) does not matter, since all of these are conservatively assumed to be sulfate (�“SO4�”) in the CALPUFF modeling. However, the amount of ammonia remaining, the net ammonia slip, may matter, because it may cause formation of additional ammonium sulfate and ammonium nitrate downwind. For SCR, there is sufficient sulfuric acid that all of the ammonia slip is consumed, leaving no net ammonia slip, and no effect on the visibility modeling. For SNCR, however, some net ammonia slip remains. To account for its effect on visibility, EPA followed the same procedure as SRP did for NGS. First EPA applied 90% ammonia control from the wet FGD at NGS.243 Then EPA used CALPUFF to model ammonia as an inert pollutant, and determined the 8th highest (cf. 98th percentile) ammonia concentrations at the Class I areas within 300 km. The result could be added to the ammonia background used in the main CALPUFF visibility modeling. However, the concentrations were about 0.01 ppb or less; this is only 1% of the values EPA used for ammonia scenario Am1 (1 ppb), and about 5% of the lowest for scenario Am2 (0.2 ppb). EPA then assessed the visibility effect of this additional ammonia at Grand Canyon and Capitol Reef, the two nearest Class I areas and the ones with the largest predicted inert ammonia concentrations; this was done only for scenario Am2, since the 1% addition relative to Am1 and Am5 are negligible. The effect on the 8th high delta deciviews prediction was about 0.06 dv or less. If this were included in the main CALPUFF visibility modeling, for ammonia scenario Am2 this could potentially increase estimates of post-SNCR impacts by 0.1 dv, and correspondingly decrease the estimates of the benefit from SNCR by 0.1 dv. As discussed below, the benefits from SNCR under ammonia scenario Am2 range are above 2 dv for multiple Class I areas; therefore, including this net ammonia slip effect would have essentially no effect on EPA�’s assessment of SNCR, especially since EPA is mainly relying on scenario Am1.
4. Revised Emission Inputs for CALPUFF Modeling
For this proposal, we remodeled the anticipated visibility improvement from the use of LNB+SOFA, SCR, or SNCR on Units 1 �– 3 for NOx control. The emission inputs we used are listed in listed in Table 34 and are provided in more detail in the docket.244 Because the modeling files are in a are in a format that cannot be uploaded to www.regulations.gov, these files are not in our online docket docket but are available upon request. EPA modeled several SCR control cases assuming varying levels levels of NOx control and catalyst layers (which affect sulfuric acid emissions), as well as a scenario scenario using the air preheater penetration factor supported by SRP, and SCR on a limited number of number of units at NGS. The modeling scenarios are described in
243 �“Estimating Ammonia Emissions from Stationary Power Plants�”, Electric Power Research Institute (EPRI), Palo Alto, CA: 2009, Report No. 1017985. http://my.epri.com/portal/server.pt?Abstract_id=000000000001017985 244 See Excel spreadsheet entitled �“NGS_BART_Scenarios_Emissions_EPA_proposal.xls�”.

Technical Support Document for NGS Proposed BART Determination, rev. February 11, 2013 | Page 123 of 129
Table 40.

Technical Support Document for NGS Proposed BART Determination, rev. February 11, 2013 | Page 124 of 129
Table 40: Scenarios Modeled by EPA for our BART Analysis for NGS Code Name Description
N0 Baseline 2001 - 2003 baseline N1 Control Option 1 LNB/SOFA on Units 1 - 3, NOx = 0.24 lb/MMBtu N2 Control Option 2 SCR+LNB+SOFA on Unit 1 �– 3, NOx = 0.05 lb/MMBtu, SO2 to SO3 conversion =
0.67% N3 Control Option 3 SCR+LNB+SOFA on Unit 1 �– 3, NOx = 0.08 lb/MMBtu, SO2 to SO3 conversion =
0.5% N4 Control Option 4 SCR+LNB+SOFA on Unit 1 �– 3, NOx = 0.05 lb/MMBtu, SO2 to SO3 conversion =
0.67%, with SRP's air preheater penetration value of 0.9 N5 Control Option 5 SCR+LNB+SOFA on Unit 1 (0.05 lb/MMBtu); LNB+SOFA on Unit 2, 3 N6 Control Option 6 SCR+LNB+SOFA on Unit 1, 3 (0.05 lb/MMBtu); LNB+SOFA on Unit 2 N7 Control Option 7 SCR+LNB+SOFA on Unit 1 �– 3, same as for N2, but SCR placed after ESP N8 Control Option 8 SNCR+LNB+SOFA on Unit 1 �– 3 (0.18 lb/MMBtu) N9 Control Option 9 SNCR+LNB+SOFA on Unit 1 �– 3 (0.15 lb/MMBtu)
Table 41: EPA Modeling Inputs (lb/hr) Scenario N0 – Baseline
Unit 1 Unit 2 Unit 3 SO2 487.75 526.92 576.17 SO4 2.32 2.49 2.42 NOx 4,271.42 4,207.50 4,181.67 SOA 35.18 37.69 36.63
PM fine 63.86 55.27 79.28 PM coarse 86.89 75.20 107.87
EC 2.45 2.12 3.05 Scenario N1 – Control Option 1 – LNB/SOFA on Units 1 – 3
Unit 1 Unit 2 Unit 3 SO2 487.75 526.92 576.17 SO4 2.32 2.49 2.42 NOx 2,110.74 2,261.63 2,197.78 SOA 35.18 37.69 36.63
PM fine 63.86 55.27 79.28 PM coarse 86.89 75.20 107.87
EC 2.45 2.12 3.05 Scenario N2 – Control Option 2 – SCR + LNB/SOFA on Units 1 – 3, NOx = 0.05 lb/MMBtu
Unit 1 Unit 2 Unit 3 SO2 487.75 526.92 576.17 SO4 16.35 17.52 17.03 NOx 439.74 471.17 457.87 SOA 35.18 37.69 36.63
PM fine 63.86 55.27 79.28 PM coarse 86.89 75.20 107.87
EC 2.45 2.12 3.05 Scenario N3 – Control Option 3 – SCR + LNB/SOFA on Units 1 – 3, NOx = 0.08 lb/MMBtu
Unit 1 Unit 2 Unit 3 SO2 487.75 526.92 576.17 SO4 12.79 13.71 13.32 NOx 703.58 753.88 732.59 SOA 35.18 37.69 36.63

Technical Support Document for NGS Proposed BART Determination, rev. February 11, 2013 | Page 125 of 129
PM fine 63.86 55.27 79.28 PM coarse 86.89 75.20 107.87
EC 2.45 2.12 3.05 Scenario N4 – Control Option 4 – SCR + LNB/SOFA on Units 1 – 3, NOx = 0.05 lb/MMBtu,
Air Preheater Penetration = 0.9 Unit 1 Unit 2 Unit 3
SO2 487.75 526.92 576.17 SO4 29.44 31.54 30.65 NOx 439.74 471.17 457.87 SOA 35.18 37.69 36.63
PM fine 63.86 55.27 79.28 PM coarse 86.89 75.20 107.87
EC 2.45 2.12 3.05 Scenario N5 – Control Option 5 – SCR + LNB/SOFA on Units 1, LNB+SOFA on Units 2 and 3
Unit 1 Unit 2 Unit 3 SO2 487.75 526.92 576.17 SO4 16.35 2.49 2.42 NOx 439.74 2,261.63 2,197.78 SOA 35.18 37.69 36.63
PM fine 63.86 55.27 79.28 PM coarse 86.89 75.20 107.87
EC 2.45 2.12 3.05 Scenario N6 – Control Option 6 – SCR + LNB/SOFA on Units 1 and 3, LNB/SOFA on Unit 2
Unit 1 Unit 2 Unit 3 SO2 487.75 526.92 576.17 SO4 16.35 2.49 17.03 NOx 439.74 2,261.63 457.87 SOA 35.18 37.69 36.63
PM fine 63.86 55.27 79.28 PM coarse 86.89 75.20 107.87
EC 2.45 2.12 3.05 Scenario N7 – Control Option 7 – same as N2 but SCR after ESP
Unit 1 Unit 2 Unit 3 SO2 487.75 526.92 576.17 SO4 24.59 26.35 25.61 NOx 439.74 471.17 457.87 SOA 35.18 37.69 36.63
PM fine 63.86 55.27 79.28 PM coarse 86.89 75.2 107.87
EC 2.45 2.12 3.05 Scenario N8 – Control Option 8 – SNCR+LNB+SOFA on Unit 1 – 3 (0.18 lb/MMBtu) Unit 1 Unit 2 Unit 3
SO2 487.75 526.92 576.17 SO4 2.32 2.49 2.42 NOx 1583.06 1696.22 1648.34 SOA 35.18 37.69 36.63
PM fine 0.03 0.02 0.03 PM coarse 86.89 75.2 107.87
EC 2.45 2.12 3.05 Scenario N9 – Control Option 9 – SNCR+LNB+SOFA on Unit 1 – 3 (0.15 lb/MMBtu) Unit 1 Unit 2 Unit 3

Technical Support Document for NGS Proposed BART Determination, rev. February 11, 2013 | Page 126 of 129
SO2 487.75 526.92 576.17 SO4 2.32 2.49 2.42 NOx 1319.21 1413.52 1373.61 SOA 35.18 37.69 36.63
PM fine 0.03 0.02 0.03 PM coarse 86.89 75.2 107.87
EC 2.45 2.12 3.05
5. Baseline Visibility Impacts of NGS
Modeled impacts on the Class I areas of NGS without additional controls for each ammonia scenario are shown in
Technical Support Document for NGS Proposed BART Determination, rev. February 11, 2013 | Page 127 of 129
Table 42. The table shows the 98th percentile delta deciview impacts, considering days from all three modeled years together (rather than separate 98th percentiles for each of the modeled years as was done by SRP). Impacts depend strongly on the background ammonia assumed, increasing as ammonia does. From lowest to highest, the ammonia concentrations as well as the impacts are in the order Am2 (AECOM values), Am5 (the back-calculated mean plus two standard deviations), Am1 (IWAQM 1 ppb default).245 Scenario Am2 impacts are roughly half of the other scenarios, which are fairly close together. The Am5 scenario is a refined version of the Am3 variant in the ANPRM Both are based on the back-calculation approach, but Am5 assigns ammonia for several groups of Class I areas individually, whereas Am3 lumped all areas together. Impacts generally decline with distance from NGS, as would be expected since the plume disperses as it travels, though conditions can be more or less favorable for transport to Class I areas in particular directions. The Grand Canyon is the closest area and has the highest impact, while Pine Mountain is the second most distant and has the lowest impact. The northwestern areas of Arches and Canyonlands have impacts a bit high for their distance, while Sycamore Canyon impacts are a bit low for its distance. For all areas and ammonia scenarios, the modeled impact of NGS without additional controls exceeds 1 deciview (except for Mazatzal and Pine Mountain for Am2, with impacts of 0.8 dv), confirming that NGS causes visibility impairment in a large number of Class I areas.
245 As for the other tables, Mesa Verde impacts in the Am5 column is actually Am4, with concentrations derived from ammonia measurements rather than the back-calculation method.

Technical Support Document for NGS Proposed BART Determination, rev. February 11, 2013 | Page 128 of 129
Table 42: EPA Modeling Results �– 8th High Delta dv Baseline Impacts of NGS on 11 Class I Areas from 2001 �– 2003 for the Different Ammonia Background Scenarios
Class I Area Baseline Impacts Am1
(1 ppb IWAQM default) Am2
(AECOM) Am5
(back-calculation) Arches NP 4.5 2.6 4.1
Bryce Canyon NP 4.9 3.0 4.4 Canyonlands NP 6.0 3.6 5.4 Capitol Reef NP 7.7 3.7 7.1
Grand Canyon NP 8.4 4.3 6.4 Mazatzal WA 1.5 0.8 1.3
Mesa Verde NP 3.2 2.0 3.2 Petrified Forest NP 3.4 2.0 3.2 Pine Mountain WA 1.3 0.8 1.2
Sycamore Canyon WA 2.4 1.6 2.3 Zion NP 4.4 2.3 4.0
Total 47.8 26.7 42.8
6. Anticipated Visibility Improvement Based on New Modeling For assessing visibility improvement for this proposals, EPA relied primarily on the ammonia scenario with the IWAQM 1 ppb default (Am1), corroborated by a scenario with the back-calculated mean plus two standard deviations (Am5) or measured data for Mesa Verde (Am4, but for convenience listed in tables under �“Am5�”), with the other scenario (Am2) considered as a sensitivity analysis. Also, EPA mainly considered improvement in delta deciviews relative to the baseline, with additional consideration of its percent improvement. The delta dv improvement and percent change for each ammonia background scenario are shown in Table 43, Table 44, and Table 45. Additional tables, including comparisons of alternative ammonia, other background concentrations and visibility methods, and the number of days having impacts over 0.5 and 1.0 dv, are in the docket for this proposed rulemaking.246 The following summarizing results for LNB/SOFA, SCR at 0.05 lb/MMBtu, and SNCR at 0.18 lb/MMBtu. The visibility improvement from applying SCR is about twice as large as that from applying LNB/SOFA, while the improvement from SNCR is about a third larger than that from LNB/SOFA. Improvements from the Am2 ammonia assumption are about half of those for Am1; improvements from Am5 are less than those from Am1, but still substantially larger than for Am2. For ammonia scenario Am2, (suggested by SRP), the absolute deciview improvements for Am2 are only about half of those for the other ammonia scenarios. Improvements range from 0.25 dv to 0.86 dv for LNB/SOFA, and 0.48 dv to 2.37 dv for SCR. All SCR benefits are at about 0.5 dv or higher, except for Pine Mountain. The 0.5 dv level is an amount considered to be perceptible and to �“contribute�” to visibility impairment under the BART Guidelines (p. 39120). So, even for the lowest ammonia scenario, AECOM�’s Am2, the visibility improvement from SCR is significant, especially considering that 14 Class I areas would experience that improvement. By contrast, improvements from LNB/SOFA are below or approximately at the 0.5 dv level for five areas. Improvements from SNCR range from 0.70 to 3.09 dv, with all but two areas having improvements over 1.0 dv.
246 See Excel spreadsheet entitled �“NGS_RHFIP_TSD_vis_tables.xlsx�” in the docket for this proposed rulemaking.

Technical Support Document for NGS Proposed BART Determination, rev. February 11, 2013 | Page 129 of 129
For Am1 (IWAQM 1 ppb default) visibility improvements from LNB/SOFA, SNCR+LNB/SOFA, and SCR+LNB/SOFA are roughly double those for Am2. LNB/SOFA improvements range from to 0.54 to 2.12 dv, with all areas experiencing more than a 0.5 dv improvement, and two areas showing improvements over 2 dv. For SCR+LNB/SOFA, benefits range from 0.99 to 5.45 dv, with all areas having an improvement of about 1 dv or greater. Eight have more than a 2 dv improvement, and three have more than a 4 dv improvement. Thus both LNB/SOFA and SCR+LNB/SOFA result in visibility improvements above the �“contribute to impairment�” or just perceptible level of 0.5 dv at all 16 Class I areas. However the benefits of SCR+LNB/SOFA are generally more than twice as high as for LNB/SOFA, and are all at or above the BART Guidelines �“cause impairment�” level of 1.0 dv; these changes would be definitely noticeable by most observers at the Class I areas. Improvements from SNCR+LNB/SOFA range from 0.63 to 2.65 dv, with all areas having improvements over 0.5 dv.
For Am5 (back-calculated mean plus two standard deviations, except Mesa Verde from measurements), the LNB/SOFA improvements range from 0.49 dv to 1.96 dv; all 11 areas�’ improvements are at 0.5 dv or above. The SCR+LNB/SOFA improvements are again about twice as high as for LNB/SOFA, ranging from 0.87 dv to 4.89 dv. All the SCR+LNB/SOFA improvements are above 0.5 dv; 9 of the 11 areas have improvements over 1.0 dv, and two have more than a 4 dv improvement. While the modeled improvements are less than for the Am1 case, the conclusion is similar: LNB/SOFA benefits would be perceptible and significant, and for SCR+LNB/SOFA much more so, with improvements definitely noticeable by most observers at the Class I areas. Improvements from SNCR+LNB/SOFA range from 0.63 to 2.65 dv, with all areas having improvements over 0.5 dv. Despite uncertainty over background ammonia concentrations, several conclusions can be drawn. Installation of LNB/SOFA, SNCR+LNB/SOFA, or SCR+LNB/SOFA at NGS would all contribute to visibility improvement, except that the LNB benefit is under 0.5 dv for one area for the low-ammonia Am2 scenario.247 The benefit of SCR+LNB/SOFA is significantly greater than for LNB/SOFA, improving visibility by a perceptible amount even for the lowest ammonia scenario for 9 of the 11 nearby Class I areas, and by substantially larger amounts for the other ammonia scenarios, which EPA believes give more accurate estimates. The benefit of SNCR+LNB/SOFA is intermediate between LNB/SOFA and SCR+LNB/SOFA, though closer to those from LNB/SOFA. The visibility benefit of SCR+LNB/SOFA is double that of LNB/SOFA, and the benefit of SNCR+LNB/SOFA is about a third higher than that of LNB/SOFA. Based on the anticipated improvement in visibility that may be reasonably expected from controls, EPA is proposing to find that the substantial visibility benefit of installing SCR+LNB/SOFA at NGS does not warrant elimination of SCR as the top control option for BART.
247 Even though that improvement would not be perceptible in itself, it is still worth considering as part of the overall regional haze planning process, since it would occur cumulatively with improvements due to controls on other sources.

Technical Support Document for NGS Proposed BART Determination, rev. February 11, 2013 | Page 130 of 130
Table 43: EPA Modeling Results �– 8th High Delta dv Improvement and Percent Change in Delta dv Impact Compared to Baseline Impacts from 2001 �– 2003 using Ammonia Background Scenario Am1 Vis. method /ammonia
ControlScenario
vm8b / am1: 1ppb
n0:Baseline
n1: LNB n2: SCR 0.05lb/MMBtu
n3: SCR0.08, SO30.5%
n4: SCR,APH p=0.9
n5: SCR on1, LNB on
2&3
n6: SCR on1&3, LNB on
2
n7: SCRafter ESP
n8: SNCR0.18
lb/MMBtu
n9: SNCR0.15
lb/MMBtu
Class I AreaDelta dvImpact
Deltadv % Delta
dv % Deltadv % Delta
dv % Deltadv % Delta
dv % Deltadv % Delta
dv % Deltadv %
Arches NP 4.5 1.7 37% 3.5 77% 3.2 70% 3.4 76% 2.2 48% 2.8 62% 3.4 77% 2.2 50% 2.5 56%
Bryce Canyon NP 4.9 1.6 33% 3.6 74% 3.3 66% 3.5 72% 2.2 45% 2.9 59% 3.6 73% 2.3 46% 2.6 52%
Canyonlands NP 6.0 2.1 35% 4.6 76% 4.2 69% 4.5 75% 2.8 47% 3.7 61% 4.6 76% 2.9 48% 3.3 54%
Capitol Reef NP 7.7 2.1 28% 5.4 71% 4.8 62% 5.3 69% 3.0 39% 4.0 52% 5.4 70% 3.1 40% 3.5 45%
Grand Canyon NP 8.4 1.9 23% 5.4 64% 4.7 56% 5.2 62% 2.8 33% 3.9 47% 5.3 63% 2.9 35% 3.4 40%
Mazatzal Wild. 1.5 0.6 41% 1.1 75% 1.0 70% 1.1 73% 0.7 50% 0.9 62% 1.1 74% 0.8 52% 0.8 58%
Mesa Verde NP 3.2 1.3 42% 2.6 81% 2.4 75% 2.6 80% 1.7 54% 2.2 67% 2.6 80% 1.8 55% 2.0 61%Petrified ForestNP 3.4 1.4 41% 2.7 78% 2.5 74% 2.6 77% 1.8 53% 2.2 66% 2.6 77% 1.8 54% 2.0 60%Pine MountainWild. 1.3 0.5 41% 1.0 75% 0.9 71% 1.0 74% 0.7 52% 0.8 64% 1.0 74% 0.7 54% 0.8 60%Sycamore CanyonWild. 2.4 0.9 37% 1.8 75% 1.7 70% 1.8 74% 1.2 49% 1.5 62% 1.8 74% 1.2 50% 1.4 57%
Zion NP 4.4 1.4 31% 3.3 76% 3.0 68% 3.3 75% 1.9 44% 2.6 58% 3.3 75% 2.0 45% 2.3 52%Total ddv orAverage % 47.8 15.6 35% 35.1 75% 31.7 68% 34.3 73% 21.1 47% 27.5 60% 34.6 74% 21.6 48% 24.5 54%
Table uses 98th percentile for the three-year period 2001-2003.

Technical Support Document for NGS Proposed BART Determination, rev. February 11, 2013 | Page 131 of 131
Table 44: EPA Modeling Results �– 8th High Delta dv Improvement and Percent Change in Delta dv Impact Compared to Baseline Impacts from 2001 �– 2003 using Ammonia Background Scenario Am2 Vis. method /ammonia
ControlScenario
vm8b / am2: 0.2�– 0.5 ppb
n0:Baseline
n1: LNB n2: SCR 0.05lb/MMBtu
n3: SCR0.08, SO30.5%
n4: SCR,APH p=0.9
n5: SCR on1, LNB on
2&3
n6: SCR on1&3, LNB on
2
n7: SCRafter ESP
n8: SNCR0.18
lb/MMBtu
n9: SNCR0.15
lb/MMBtu
Class I AreaDelta dvImpact
Deltadv % Delta
dv % Deltadv % Delta
dv % Deltadv % Delta
dv % Deltadv % Delta
dv % Deltadv %
Arches NP 2.6 0.7 28% 1.8 68% 1.6 61% 1.7 67% 1.0 37% 1.3 51% 1.8 67% 1.0 39% 1.2 46%
Bryce Canyon NP 3.0 0.7 24% 1.8 59% 1.5 49% 1.7 56% 0.9 30% 1.2 39% 1.7 57% 0.9 32% 1.1 37%
Canyonlands NP 3.6 0.9 24% 2.4 66% 2.1 58% 2.3 64% 1.3 35% 1.8 50% 2.3 65% 1.3 36% 1.6 44%
Capitol Reef NP 3.7 0.7 18% 2.0 53% 1.6 43% 1.9 50% 1.0 26% 1.3 35% 1.9 51% 1.0 28% 1.2 32%
Grand Canyon NP 4.3 0.7 16% 1.9 45% 1.6 38% 1.8 41% 1.1 26% 1.4 32% 1.8 42% 1.2 27% 1.3 31%
Mazatzal Wild. 0.8 0.3 34% 0.5 61% 0.5 58% 0.5 58% 0.3 42% 0.4 53% 0.5 59% 0.4 45% 0.4 50%
Mesa Verde NP 2.0 0.6 29% 1.5 73% 1.3 65% 1.5 71% 0.8 40% 1.1 54% 1.5 72% 0.8 41% 1.0 48%Petrified ForestNP 2.0 0.5 26% 1.3 67% 1.2 60% 1.3 65% 0.8 40% 1.1 54% 1.3 66% 0.8 42% 1.0 49%Pine MountainWild. 0.8 0.3 33% 0.5 63% 0.4 59% 0.5 61% 0.3 44% 0.4 53% 0.5 62% 0.4 46% 0.4 51%Sycamore CanyonWild. 1.6 0.5 32% 1.1 65% 1.0 59% 1.0 64% 0.7 42% 0.9 53% 1.0 64% 0.7 45% 0.8 50%
Zion NP 2.3 0.5 22% 1.4 61% 1.2 52% 1.3 58% 0.8 34% 1.0 43% 1.4 59% 0.8 36% 0.9 40%Total ddv orAverage % 26.7 6.3 26% 16.0 62% 14.0 55% 15.4 60% 8.9 36% 11.8 47% 15.6 60% 9.4 38% 10.9 43%
Table uses 98th percentile for the three-year period 2001-2003.

Technical Support Document for NGS Proposed BART Determination, rev. February 11, 2013 | Page 132 of 132
Table 45: EPA Modeling Results �– 8th High Delta dv Improvement and Percent Change in Delta dv Impact Compared to Baseline Impacts from 2001 �– 2003 using Ammonia Background Scenario Am5 Vis. method /ammonia
ControlScenario
vm8b / am5:back calculation
n0:Baseline
n1: LNB n2: SCR 0.05lb/MMBtu
n3: SCR0.08, SO30.5%
n4: SCR,APH p=0.9
n5: SCR on1, LNB on
2&3
n6: SCR on1&3, LNB on
2
n7: SCRafter ESP
n8: SNCR0.18
lb/MMBtu
n9: SNCR0.15
lb/MMBtu
Class I AreaDelta dvImpact
Deltadv % Delta
dv % Deltadv % Delta
dv % Deltadv % Delta
dv % Deltadv % Delta
dv % Deltadv %
Arches NP 4.1 1.5 36% 3.2 76% 2.8 69% 3.1 75% 1.9 46% 2.5 60% 3.1 76% 2.0 47% 2.2 54%
Bryce Canyon NP 4.4 1.3 29% 3.2 72% 2.9 65% 3.1 69% 1.7 39% 2.5 55% 3.1 70% 1.8 41% 2.2 49%
Canyonlands NP 5.4 1.7 31% 4.0 74% 3.6 67% 4.0 73% 2.4 44% 3.1 58% 4.0 74% 2.4 44% 2.8 51%
Capitol Reef NP 7.1 2.0 28% 4.9 69% 4.2 59% 4.7 66% 2.5 36% 3.5 50% 4.8 67% 2.6 37% 3.1 44%
Grand Canyon NP 6.4 1.2 18% 3.5 55% 3.0 46% 3.4 53% 1.7 26% 2.4 37% 3.4 54% 1.8 28% 2.1 34%
Mazatzal Wild. 1.3 0.5 38% 0.9 73% 0.9 67% 0.9 71% 0.6 48% 0.8 60% 0.9 72% 0.6 50% 0.7 55%
Mesa Verde NP 3.2 1.4 42% 2.6 81% 2.4 75% 2.6 80% 1.8 54% 2.2 67% 2.6 80% 1.8 55% 2.0 61%Petrified ForestNP 3.2 1.2 39% 2.4 77% 2.3 73% 2.4 75% 1.6 51% 2.1 65% 2.4 76% 1.7 52% 1.9 59%
Pine MountainWild. 1.2 0.5 41% 0.9 73% 0.8 69% 0.9 72% 0.6 51% 0.8 64% 0.9 73% 0.6 53% 0.7 59%
Sycamore CanyonWild. 2.3 0.9 38% 1.8 75% 1.6 70% 1.7 73% 1.2 50% 1.5 63% 1.7 74% 1.2 51% 1.3 57%
Zion NP 4.0 1.3 31% 2.9 73% 2.6 65% 2.9 72% 1.6 41% 2.2 55% 2.9 73% 1.7 42% 1.9 48%Total ddv orAverage % 42.8 13.3 34% 30.3 73% 27.2 66% 29.6 71% 17.7 44% 23.4 58% 29.9 72% 18.3 46% 21.0 52%
Table uses 98th percentile for the three-year period 2001-2003.

Technical Support Document for NGS Proposed BART Determination, rev. February 11, 2013 | Page 133 of 133
Table 46: Number of days with delta deciview impacts greater than or equal to 0.5 dv in 2001-2003
Vis. method /ammonia Control Scenario
vm8b / am1: 1 ppb
n0: Baseline n1:LNB/SOFA
n8:SNCR+LNB/SOFA0.18 lb/MMBtu
n3:SCR+LNB/SOFA0.08 lb/MMBtu,
SO3 0.5%
n2:SCR+LNB/SOFA0.05 lb/MMBtu
Class I Area Sum Avg Sum Avg Sum Avg Sum Avg Sum Avg
Arches NP 242 81 188 63 154 51 107 36 81 27Bryce Canyon NP 169 56 138 46 121 40 92 31 79 26Canyonlands NP 390 130 308 103 259 86 210 70 174 58Capitol Reef NP 368 123 318 106 287 96 252 84 224 75Grand Canyon NP 368 123 331 110 313 104 294 98 281 94Mazatzal Wild. 61 20 41 14 30 10 20 7 8 3Mesa Verde NP 208 69 137 46 114 38 59 20 40 13Petrified Forest NP 170 57 114 38 93 31 58 19 44 15Pine Mountain Wild. 55 18 39 13 33 11 15 5 7 2Sycamore CanyonWild. 124 41 78 26 68 23 36 12 28 9Zion NP 137 46 113 38 97 32 66 22 50 17
Maximum 390 130 331 110 313 104 294 98 281 94Cumulative (sum) 2292 764 1805 602 1569 523 1209 403 1016 339

Technical Support Document for NGS Proposed BART Determination | Page 134 of 134
8. Overall Proposed BART Determination
The final step in the BART analysis is to synthesize these factors and reach an overall proposed
determination of BART. A. NGS Approach to This Factor
In the summary of its BART analysis, which included technology and cost analyses by S&L and visibility modeling analyses by AECOM, SRP recommended that BART limits for NOx be 0.24 lb/MMBtu for Units 1 �– 3. These limits are based on the installation of LNB/SOFA on all units. AECOM and SRP explained that they rejected SNCR and SCR because its modeling analysis indicated that the visibility improvement from SNCR and SCR would be small. Additionally, AECOM and SRP cited the high capital and O&M costs for SCR and SNCR, and other considerations associated with the shipping, storage, and injection of anhydrous or aqueous ammonia. The BART Guidelines provide presumptive NOx limits for coal-fired EGUs, greater than 200 MW, located at power plants with a capacity that exceeds 750 MW, and operated without post-combustion controls. At NGS, Units 1 �– 3 are now equipped with advanced combustion controls (LNB/SOFA) with a permitted emission limit of 0.24 lb/MMBtu, which is lower than the presumptive NOx limit of 0.28 lb/MMBtu for tangential-fired boilers firing bituminous coal, therefore, SRP contends its existing controls represent BART.
B. Affected Tribe, State, and FLM Consultation
EPA began consulting with affected tribes after publication of our ANPRM in 2009. Since that time, representatives from EPA have met with tribal leaders and tribal representatives on numerous occasions to discuss their concerns regarding an EPA rulemaking on NGS. In recognition of the unusual complexity of regulating NGS, representatives from EPA, including the Assistant Administrator and the Regional Administrator for Region 9, visited NGS and affected communities in the area. EPA officials also met with numerous additional stakeholders, at various locations, including EPA offices in San Francisco, CA and Washington, DC, and offices of individual Tribal Governing Councils and at the Inter Tribal Council of Arizona. A timeline of EPA consultations with tribes on NGS is included in the docket for this proposed rulemaking. The timeline also lists consultations with the Navajo Nation on Four Corners Power Plant.248 On several occasions, consultations with the Navajo Nation on FCPP also included discussion of NGS. However, the majority of the consultations and correspondence listed in the timeline focused solely on NGS.
In its comment letter on the ANPRM, as an extension of the cost of compliance factor of
the five factor analysis, the Navajo Nation stressed the importance of NGS on the Navajo economy. Specifically, the Navajo Nation stated that in 2005 �– 2006, NGS employed 512 permanent full-time employees, 69% of whom are Native American, and 300 seasonal employees,
248 See document titled �“Timeline of Consultation and Correspondence on Navajo BART FIPs�” in the docket for this proposed rulemaking.

Technical Support Document for NGS Proposed BART Determination | Page 135 of 135
93% of whom are Native American, with a total payroll of $47 million. SRP stated that it employs 545 full time employees, 80% of whom are Navajo, with annual payroll and benefits of $52 million. SRP further stated that the Kayenta Mine, which supplies coal solely to NGS (and NGS is similarly its sole customer), employs 422 tribal members, and expects that in 2009, NGS and the Kayenta Mine will contribute $140 million in revenue and wages to the Navajo Nation, and $12 million to the Hopi Tribe. Additionally, the Navajo Nation cited that NGS annually burns 8.3 million tons of coal from the Peabody Kayenta Mine, which provides jobs to approximately 400 workers, a large percentage of whom are Native American, with a total payroll of $44 million.
The Navajo Nation commented that the intent of the BART requirement of the RHR was to
provide a measured response to emissions from aging power plants, and that requiring expensive controls would be inconsistent with the law and regulations governing the BART process, particularly in light of the high incremental cost of SCR and the impacts to economic interests of the Navajo Nation. The Nation recommended a phased approach to reducing emissions at NGS to allow time for resolution of lease and right of way issues and to allow interested parties to review measurements rather rely on modeling results before determining the most stringent control option is appropriate. The Nation concluded that combustion controls represent BART at this time.
The Hopi Tribe commented that it supplies both coal (the Kayenta Mine is located on both
Navajo and Hopi land) and water to NGS, and derives a significant portion of its annual tribal budget from NGS-derived revenue. Because the Hopi Tribe is geographically isolated from employment opportunities in Arizona, the Hopi state that there is no industrial development on its land, and the Hopi have also rejected gaming as a potential source of revenue. The Hopi Tribe stressed EPA�’s trust and fiduciary responsibilities to Indian Tribes and stated that if NGS closed, the economic impacts would be catastrophic and include curtailment of critical social programs, lost employment, and loss or slowing of critical infrastructure programs. In its comment letter on the ANPRM, the Hopi Tribe submitted a report it commissioned from ICF International to examine the potential for BART, in combination with other possible regulatory requirements, to cause NGS to close. Although EPA is including this report in the docket for our proposed rulemaking, EPA has not conducted a critical review of the analysis or report.
The Gila River Indian Community commissioned a report by Harvey Economics to
examine potential impacts of several air pollution control scenarios and closure of NGS on water rates, and thus the agricultural economy of the Gila River. Although EPA is including this report in the docket for our proposed rulemaking, EPA has not conducted a critical review of the analysis or report. Comments submitted in writing and concerns expressed in consultation by other tribes generally focused on potential increases to water rates and the potential that regulatory requirements might cause NGS to close. Comments received from the state of Arizona and local governments generally echo the concerns raised by tribes.
Comments and concerns raised by tribes and state and local governments during our
extended and on-going consultation on NGS reinforced the need for EPA to provide flexibility to the owners of NGS in reducing emissions of NOx because of the potential far-reaching impacts of increased water costs and because of the critical importance of NGS to the regional economy.
The National Park Service concluded in its comment letter on our ANPRM that SCR to
control NOx emissions at NGS is technically feasible, cost effective, and will substantially improve visibility in the impacted Class I areas. NPS compiled BART analyses across the U.S.

Technical Support Document for NGS Proposed BART Determination | Page 136 of 136
and found that the average cost per dv proposed by either a state or a BART-subject facility is $10 �– 17 million / dv. The Park Service applied the cumulative approach to assessing visibility impacts and determined that SCR at NGS resulted in a cost per dv of $1.9 �– 2.7 million / dv.
C. EPA Conclusions regarding This Factor
1. BART Guidelines In making a BART determination for the Regional Haze Rule, the BART Guidelines allow states to determine that an alternative level of control, beyond presumptive limits, may be appropriate based on careful consideration of the statutory factors. See 70 FR 39171. The presumptive NOx limits for tangential-fired boilers using bituminous coal is 0.28 lb/MMBtu. The presumptive limits are not binding requirements for BART, rather they are included in the BART guidelines as limits that most EGUs can meet through the use of current combustion control technologies. Indeed, NGS has shown that with the installation of modern LNB/SOFA, each unit at NGS can meet its permitted emission limit of 0.24 lb/MMBtu. However, the BART guidelines further state that the reviewing authority may determine that an alternative control level is appropriate based on the careful consideration of the statutory factors. The RHR allows reviewing authorities to determine the weight prescribed to each BART factor independently and on a case-by-case basis.
2. Summary of Five Factor Analysis
The first factor evaluates the cost of controls. EPA finds that even using the cost analysis submitted by Sargent and Lundy (S&L) for SRP, the costs per ton of NOx removed for SCR ($2,528 per ton - $3,172 per ton) are within a range that has been determined reasonable for BART. EPA used S&L�’s cost estimates and made several revisions to assumptions based on guidelines in the EPA Control Cost Manual to generate cost projections that are more consistent with the BART guidelines. EPA estimated an average cost effectiveness of less than $2,500 per ton to install SCR on all three units at NGS to achieve a NOx limit of 0.055 lb/MMBtu. EPA estimates that the incremental cost effectiveness of SCR+LNB/SOFA compared to LNB/SOFA (the technology SRP recommended as BART) is less than $3,400 per ton (average of Units 1 �– 3), and the incremental cost effectiveness of SCR+LNB/SOFA to SNCR+LNB/SOFA is less than $3,000 per ton (average of Units 1 �– 3). Based on the cost data presented by SRP, EPA�’s revisions to SRP�’s cost estimates, and our analysis of average and incremental cost effectiveness, EPA is proposing to determine that SCR+LNB/SOFA at NGS to achieve 0.055 lb/MMBtu is cost effective. The second factor involves consideration of the energy and non-air quality impacts of controls. Because NGS is not located on a commercial rail line, the installation of SCR or SNCR would result in increased truck traffic deliveries of anhydrous ammonia or urea to NGS. EPA conducted analyses of the potential air quality impacts associated with emissions from increased truck traffic, and also considered potential risks associated with transportation and use of anhydrous ammonia, and determined that SCR and SNCR are not likely to result in a significant health risk to the local population. Because of the importance of NGS to the economy of the Navajo Nation and the Hopi Tribe, EPA also considered the concern expressed to EPA that

Technical Support Document for NGS Proposed BART Determination | Page 137 of 137
requiring SCR as BART will cause NGS to shut down and result in a loss of jobs at NGS and the Kayenta Mine. The Navajo Nation receives taxes and lease payments directly from NGS, and both the Navajo Nation and Hopi Tribe receive royalties and taxes from Peabody Energy associated with coal mined from the Kayenta Mine and used at NGS. EPA conducted an affordability analysis to determine whether requiring SCR at NGS would cause electricity generation costs to exceed the cost to purchase wholesale power on the open market. Based on this analysis, on a 25-year Net Present Value analysis, the increase in electricity generation costs associated with SCR is expected to be lower than the cost to purchase electricity on the wholesale market, suggesting that the cost increase from SCR should not cause NGS to shut down. This analysis further estimates that the NGS cost of electricity generation as a result of SCR will increase by 16%, or by 0.06 cents per kilowatt-hour (kWh). This generation cost increase translates into an increase of less than 1% to electricity customers of SRP.
In addition to impacts on electricity customers, numerous parties submitted comments on the ANPRM that raised concerns about the potential impact to water customers of the Central Arizona Water Conservation District (CAWCD) that operates, maintains, and is responsible for repayment to the Federal Government for the Central Arizona Project (CAP). Reclamation�’s 24% ownership share in power produced by NGS is used by CAP to pump surface water from the Colorado River to municipal, industrial, agricultural, and tribal water users in Arizona. Excess power owned by Reclamation that is not used by CAP is sold and profits are deposited into the Lower Colorado River Basin Development Fund (Development Fund). This fund was originally authorized under the Colorado River Basin Act of 1968 for the purpose of repaying the federal government for the cost to build CAP, and subsequent settlement acts with several tribes located in Arizona authorized use of the fund to pay the delivery portion of the cost of CAP water (fixed OM&R costs) for certain Indian Tribes, and to pay the costs to construct the delivery systems to bring CAP water to those Tribes. Reclamation, CAWCD, and several Tribes submitted detailed comments on the ANPRM outlining the potential effects that requiring SCR as BART for NGS might have on the cost of water and on Indian water settlement agreements.
Costs associated with Reclamation�’s share of capital improvements at NGS are passed onto CAP customers in the variable OM&R costs, i.e., �“pumping energy rate�”. Tribal and non-Indian agricultural (NIA) users of CAP water pay only variable OM&R. Municipal and Industrial (M&I) CAP customers pay both the variable OM&R costs and fixed OM&R (delivery charges). EPA estimates that the increased electricity generation cost at NGS from the installation of SCR on all 3 units may result in an energy rate (variable OM&R) increase of $8.15 per acre-foot (AF). Based on projected water rates, an increase of $8.40 per AF represents an estimated 6% increase in the CAP water rate paid by M&I users, and a 14.5% increase in the CAP water rate paid by NIA and Indian water users. NIA and Indian water users experience a higher percentage increase in water rates than M&I users because NIA and Indian water users pay less for water than M&I users. EPA understands that at least sixteen tribes in Arizona either have water settlement agreements that allocate CAP water to the tribes in exchange for releasing rights and claims to other surface and groundwater resources in Arizona (see nine tribes listed in first column of Table ES-2), or are in the process of negotiating CAP water settlement agreements (see eight tribes listed in second column of Table ES-2). Additionally, Table ES-2 lists five tribes located in Arizona where EPA lacks information on the tribe�’s relationship to CAP water. EPA understands that all tribes generally each have different CAP allocations and unique water settlement agreements;

Technical Support Document for NGS Proposed BART Determination | Page 138 of 138
therefore, potential impacts may be different for each tribe and should be considered individually. EPA�’s preliminary assessments are based on limited available information, and EPA requests comments or additional information from the tribes listed in Table ES-2, and other tribes that may be affected by EPA�’s proposed rulemaking for NGS.
In summary, for Factor 2, EPA�’s affordability analysis suggests that the cost to produce power at NGS with SCR installed on all units should be below the market prices of wholesale power and therefore SCR should not cause NGS to close. Additionally, increased electricity rates to customers of the utilities that own NGS should be relatively low. EPA understands that a potential increase in water rates to tribes is a critical issue for them. We note that past pollution control investments at this facility have made use of alternative financing methods that limited impacts on CAP water rates. Furthermore, the NREL report indicated that mechanisms may exist to help avoid or mitigate the estimated level of impact. EPA, in conjunction with DOI and DOE, have committed to work together on several short- and long-term goals, including innovative clean energy options for electricity generation and seeking funding to cover expenses for the federal portion of pollution control at NGS. However, it is not clear at this time whether or what type of mechanisms might be available to lessen increased costs.
Given the extent of federal and tribal interests in NGS, EPA, DOI, and DOE have
committed to collaborate on several short- and long-term goals, including analyzing and pursuing strategies for providing clean, affordable and reliable power, affordable and sustainable water, and sustainable economic development to key stakeholders who currently depend on NGS.249 The agencies will work together with stakeholders to identify and undertake actions that support implementation of BART, including seeking funding to cover expenses for pollution control or other necessary upgrades for the federal portion of NGS. The agencies will also work to jointly support a phase 2 report on NGS clean energy options and work with stakeholders to develop a roadmap for accomplishing the goals described above. EPA is proposing to determine that energy, non-air quality environmental impacts, and potential impacts to tribes of SCR, do not warrant elimination of SCR as the top control option under BART, however, the uniqueness of NGS does justify an exploration of alternatives to BART, within the framework of the Regional Haze Rule, to provide additional flexibility to allow the Department of Interior, affected tribes, and other stakeholders additional time to secure funding for Reclamation�’s share of capital costs, or to develop a plan to mitigate potential economic harm to tribes. Factor three explores the existing controls at the source. Units 1 �– 3 at NGS are equipped with flue gas desulfurization units to reduce emissions of sulfur dioxide (SO2) and electrostatic precipitators to reduce emissions of particulate matter. In 2008, EPA issued a pre-construction permit authorizing SRP to install low-NOx burners plus separated overfire air (LNB/SOFA) on Units 1 �– 3 at NGS. Over 2009 �– 2011, one unit per year at NGS was retrofit with new NOx combustion controls to meet a permitted emission limit of 0.24 lb/MMBtu. Because EPA, SRP, and Grand Canyon Trust, an environmental organization that filed comments on the proposed permit, agreed that EPA�’s issuance of the PSD permit authorizing SRP to install and operated LNB/SOFA on Units 1 �– 3 should not prejudice the analysis of additional NOx controls under the BART requirement of the Regional Haze Program, EPA has determined that consideration of the existing controls at the NGS does not warrant eliminating SCR as the most stringent, technically
249 See Joint Federal Agency Statement Regarding Navajo Generating Station dated January 4, 2013, in the docket for this proposed rulemaking.

Technical Support Document for NGS Proposed BART Determination | Page 139 of 139
feasible, cost effective NOx emission control technology in our BART analysis. EPA notes that over the period from 2009 �– 2018, the early installation of LNB/SOFA at NGS will result in over 90,000 tons more NOx reductions than would have been achieved if LNB/SOFA were installed in conjunction with a BART determination (with a five-year compliance timeframe by 2018). EPA is proposing to determine that existing controls at NGS do not warrant elimination of SCR as BART, but that the early NOx reductions achieved from SRP�’s voluntary installation of LNB/SOFA in 2009 �– 2011 warrants further consideration when weighing all five factors. The fourth factor considers the remaining useful life of the facility. Although comments to the ANPRM have cited the age of NGS and impending lease and right-of-way negotiations with the Navajo Nation as a rationale to consider a shorter useful life, EPA is proposing to determine that the default 20-year amortization period is most appropriate to use as the remaining useful life of the facility. Without an enforceable obligation to shut down early, EPA cannot consider a shorter amortization period in our analysis. Additionally, EPA further understands that the owners of NGS are pursuing a lease agreement with the Navajo Nation to operate until 2044. EPA is proposing to determine that there are no issues with the remaining useful life of NGS that warrant rejecting SCR as BART. The fifth factor examines the visibility improvement resulting from controls. The anticipated visibility benefits were modeled using CALPUFF Version 5.8. Background ammonia concentrations assumed in the model are an important component of the visibility impacts model. Based on results from four different ammonia background scenarios, EPA determined that although the assumed concentration impacts the absolute modeled visibility benefits, it does not change the ranking of controls, i.e., the most stringent control technology, SCR, results in the highest modeled visibility improvement. All ammonia background scenarios result in perceptible improvements in visibility at the most impacted Class I areas. EPA�’s modeling suggests that the baseline impairment at the eleven Class I areas affected by NGS ranges from over 1 deciview at the least-impacted Class I areas to over 8 deciviews at the most-impacted Class I area. The installation of SCR in combination with LNB/SOFA on all 3 units at NGS is anticipated to reduce the visibility impairment caused by NGS by over 5 deciviews at the two most-impacted Class I areas (Grand Canyon National Park and Capitol Reef National Park). The greatest visibility benefits from LNB/SOFA alone and SNCR in combination with LNB/SOFA is anticipated to be 2 and 3.5 deciviews, respectively. EPA is proposing to determine that the visibility benefits of SCR are significant and do not warrant its elimination as the top control option for BART.
3. EPA’s Proposed BART Determination
The BART Guidelines give states (and EPA) discretion in determining the relative weight of each factor in making a BART determination. EPA is proposing to determine that the average and incremental costs of SCR are cost effective and comparable to other facilities where SCR has been determined BART. Additionally, the visibility benefits from SCR are anticipated to be significant, and given the long expected useful life of NGS (at least until 2044), EPA is proposing, as BART, an emission limit of 0.055 lb/MMBtu, achievable with installation and operation of SCR within five years of the effective date of a final rulemaking.
However, as discussed in Factor 2, NGS is unique compared to all other coal-fired power
plants in the nation in terms of its relationship with water and tribal water users in Arizona.

Technical Support Document for NGS Proposed BART Determination | Page 140 of 140
Because of the potential adverse economic impacts of higher water costs on tribes located in Arizona, EPA is proposing a BART Alternative consistent with the RHR (40 CFR §51.308(e)(2)).
Under the RHR, Alternatives to BART must achieve greater reasonable progress than would be achieved through the installation and operation of BART, and all necessary emission reductions must take place during the period of the first long-term strategy for regional haze, which, for states that were required to submit RH SIPs in 2008, ends in 2018. EPA is proposing that consideration of compliance schedules beyond 2018 for alternative measures at NGS is appropriate for several reasons, including the singular importance of NGS to many tribes located in Arizona and their water settlement agreements with the federal government, the numerous uncertainties facing the owners of NGS, the requirement for NEPA review of a lease extension, and the early and voluntary installation of modern combustion controls over the 2009 �– 2011 timeframe. EPA is proposing to find that an alternative is �“better than BART�” if the adjusted total NOx emissions over the 2009 �– 2044 timeframe (i.e., emissions remaining after subtracting 92,715 tons for the LNB/SOFA credit for early and voluntary emission reductions) are less than total emissions under our proposed BART determination for the same period (i.e., 358,974 tons).
We are proposing, as an alternative to BART, to require NGS to meet a NOx limit of 0.055
lb/MMBtu on one unit per year in 2021, 2022, and 2023. EPA expects that the uncertainties related to renewals of leases and other agreements would be sufficiently resolved to allow the owners of NGS to install new air pollution controls beginning in 2021 with certainty that NGS would continue to operate at least until 2044. As shown in Table 47 below, EPA has calculated that the total amount of NOx that will be emitted from NGS over the 2009 - 2044 timeframe under EPA�’s proposed BART determination (i.e., compliance by 2018) will equal 358,974 tons. EPA has also calculated that the total NOx emissions over 2009 �– 2044 under Alternative 1, with credit for the early and voluntary emission reductions, will be 338,189 tons. Based on its adjusted total NOx emissions, Alternative 1 meets the �“better than BART�” threshold (i.e. 338,189 tons is less than 358,974 tons). Therefore, EPA is proposing Alternative 1 (compliance with BART emission limits on one unit per year in 2021, 2022, and 2023) as a better-than-BART alternative that results in greater reasonable progress than would be achieved under BART.
Table 47: Analysis of Proposed BART Alternative
BART Alternative 1 Installation Years by 2018 2021, 2022, and 2023
Total Emissions over 2009 - 2044 (tons) 358,974 430,904 LNB/SOFA Credit (tons) n/a 92,175 Adjusted Emissions (tons) n/a 338,189
Better than BART? n/a Yes (338,189 tons < 358,974 tons)
EPA recognizes that some limited additional flexibility beyond the 2021 �– 2023
compliance schedule under Alternative 1 may be appropriate, given the importance of NGS to a broad range of interests. EPA has evaluated two other alternative schedules, using the �“better than BART�” analysis framework described above, to evaluate additional time for compliance, i.e., compliance on one unit per year in 2023, 2024, and 2025 (Alternative 2) and compliance on one unit per year in 2024, 2025, and 2026 (Alternative 3).

Technical Support Document for NGS Proposed BART Determination | Page 141 of 141
As shown in Table 48, Alternatives 2 and 3 do not meet the �“better than BART�” threshold because the adjusted emissions (accounting for the LNB/SOFA credit) exceed total emissions under BART. In Table 48, the amount total emissions from the alternatives exceed BART are NOx emissions reduction deficits. For Alternatives 2 and 3, the NOx emission reduction deficits are 15,179 tons and 33,160 tons, respectively, showing that as the compliance dates under a given alternative extend further into the future, the NOx emission reduction deficit grows. Because Alternatives 2 and 3 do not meet the �“better than BART�” threshold, EPA views Alternatives 2 and 3 as viable only if the owners of NGS achieve additional emission reductions to bridge the deficit in NOx emission reductions. These additional emission reductions could be implemented as short-term (i.e., for some subset of the period 2009 - 2044) or long-term (i.e., achieved annually until 2044) measures.
As shown in Table 48, if the owners of NGS complied with the schedule under Alternative 2, a short-term emission reduction bridge (implemented, for example, over a 10-year period from 2013 �– 2023), the owners of NGS would need to achieve additional NOx emission reductions of 1,518 tons per year. Similarly, implementing a long-term emission reduction bridge (for example, over the period of 2013 �– 2044) would require additional NOx emission reductions of 490 tons per year. The short and long term emission reduction bridges in Table 48 provide examples of how additional emission reductions might be distributed over time. The actual annual emission reductions that NGS would need to bridge the NOx deficit would depend, not only on the size of the deficit, but on the specific measures and time periods chosen by the owners of NGS.
Table 48: Analysis of Additional Alternatives
BART Alternative 2 Alternative 3 Installation Years by 2018 2023, 2024, and 2025 2024, 2025, and 2026
Total Emissions (tons) 358,974 466,869 484,849 LNB/SOFA Credit (tons) n/a 92,175 92,175 Adjusted Emissions (tons) n/a 374,154 392,134
Better than BART? n/a No No Emission Reduction Deficit (tons) n/a 15,179 33,160 Short-term Emission Bridge (tpy)
(years in place) n/a 1,518 tpy over 2013-2023 3,015 tpy over 2013-2024
Long-term Emission Bridge (tpy) (years in place)
n/a 490 tpy over 2013-2044 1,070 tpy over 2013-2044
EPA is requesting comment on technically and economically feasible technologies or
mechanisms to serve as enforceable emission reduction bridges (whether short or long term) that would allow consideration of alternatives that would not otherwise meet the �“better than BART�” threshold for NOx (e.g., Alternatives 2 or 3 or other alternatives suggested by stakeholders during the public comment period for this proposed rule).
The Black Mesa Water Coalition and the To Nizhoni Ani, two Navajo non-governmental
organizations (NGOs) provided to EPA their recommendations related to a just transition of Navajo Generating Station and the Kayenta Mine to tribal renewable energy projects at Black

Technical Support Document for NGS Proposed BART Determination | Page 142 of 142
Mesa.250 In general, the two NGOs recommended a replacement of Reclamation�’s share of NGS with a large-scale renewable energy project at the Black Mesa Mine by 2019, retirement of the shares of NGS owned by LADWP and Nevada Power, and continued operation of the shares of NGS owned by SRP, APS, and TEP until 2029. After 2029, the groups recommend complete retirement of NGS and conversion to solar energy. EPA does not have authority to require Reclamation or other owners of NGS to transition away from NGS or coal-fired power. EPA encourages interested stakeholders to work collaboratively to explore additional Alternatives to BART that satisfy requirements under the CAA as well as goals of the stakeholders, and submit these alternatives as comments to EPA. As stated previously, if stakeholders develop an alternative recommendation that meets CAA requirements, EPA may issue a Supplemental Proposal to put forth that alternative, along with EPA�’s analysis of the alternative, for public review and comment.
In weighing the statutory factors, EPA believes that our BART determination for NOx is appropriate for NGS. NGS is among the largest power plants in the nation, both in terms of its heat input capacity and in terms of total emissions of NOx. Therefore, EPA is proposing that SCR, which is cost effective and will result in significant visibility improvement, should not be eliminated as BART for NGS, because it is expected to continue operation for at least three more decades and is surrounded by eleven mandatory Federal Class I areas, including the Grand Canyon National Park. Because of the potential adverse economic impacts to tribes located in Arizona, we are proposing Alternative 1 as a �“better than BART�” Alternative that gives Reclamation and the other owners of NGS flexibility in the schedule for compliance, to resolve outstanding lease and rights-of-way agreements to ensure continued operation of NGS, and to allow time for Reclamation to work with other federal agencies to seek funding for the federal portion of the cost of controls, recognizing the importance of the continued operation of NGS to numerous tribes located in Arizona and the broader regional economy.
250 See �“Recommendation for Just Transition of the Navajo Generating Station and Peabody Coal Mines for the Black Mesa to Tribal Renewable Energy Project at Black Mesa�”, in the docket for this proposed rulemaking. Black Mesa and To Nizhoni Ani also provided two additional documents related to the Navajo Aquifer: one is a resolution that the Navajo Aquifer be designated a sole-source aquifer, and one is an issue paper written by the Natural Resources Defense Council. Both documents are also provided in the docket for this proposed rulemaking.