Approaching Start-Up of a State of the Art, Sustainable … 27, 2010 Pacific Northwest Clean Water...
71
October 27, 2010 Pacific Northwest Clean Water Association 77 th Annual Conference & Exhibition, Bend, Oregon The Home Stretch: The Home Stretch: Approaching Start Approaching Start - - Up of a State of the Art, Up of a State of the Art, Sustainable MBR Sustainable MBR Jason Diamond, P.Eng. GE – ZENON Membrane Solutions
Transcript of Approaching Start-Up of a State of the Art, Sustainable … 27, 2010 Pacific Northwest Clean Water...

October 27, 2010
Pacific Northwest Clean Water Association77th Annual Conference & Exhibition, Bend, Oregon
The Home Stretch:The Home Stretch: Approaching StartApproaching Start--Up of a State of the Art, Up of a State of the Art, Sustainable MBRSustainable MBR
Jason Diamond, P.Eng.
GE –
ZENON Membrane Solutions
2 /
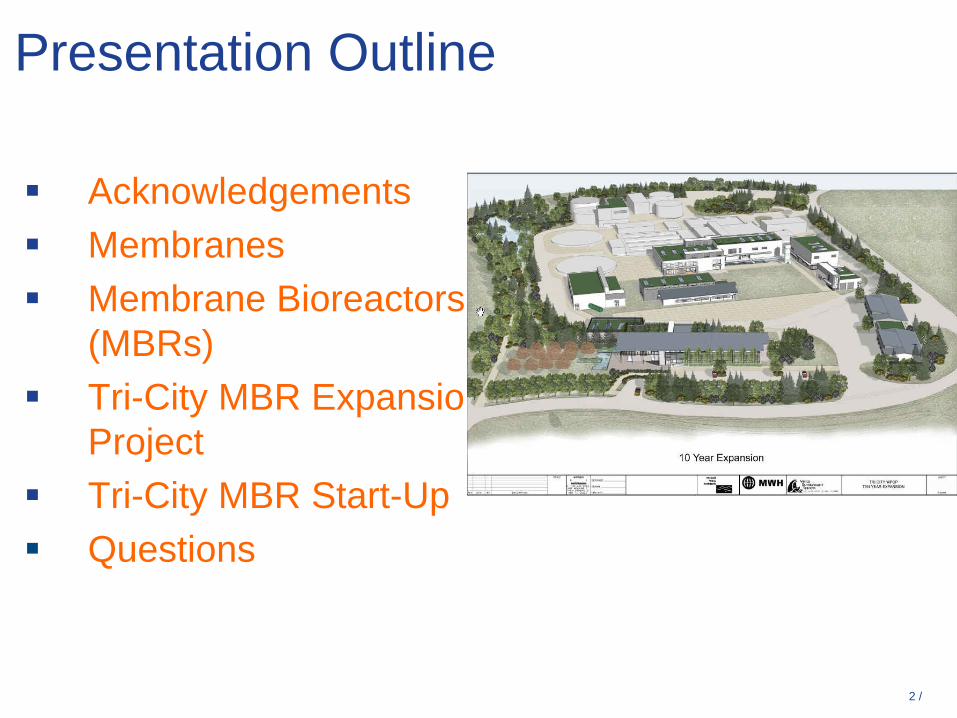
Presentation Outline
AcknowledgementsMembranesMembrane Bioreactors (MBRs)Tri-City MBR Expansion ProjectTri-City MBR Start-UpQuestions

AcknowledgementsAcknowledgements

4 /
Thanks!
Jude D. Grounds, MWH
Michael Trent, WES - Clackamas County
Dale Richwine, Richwine Environmental, Inc.
Chris Allen, GE-ZENON
Sharina Naidoo, GE-ZENON

MembranesMembranes
6 /
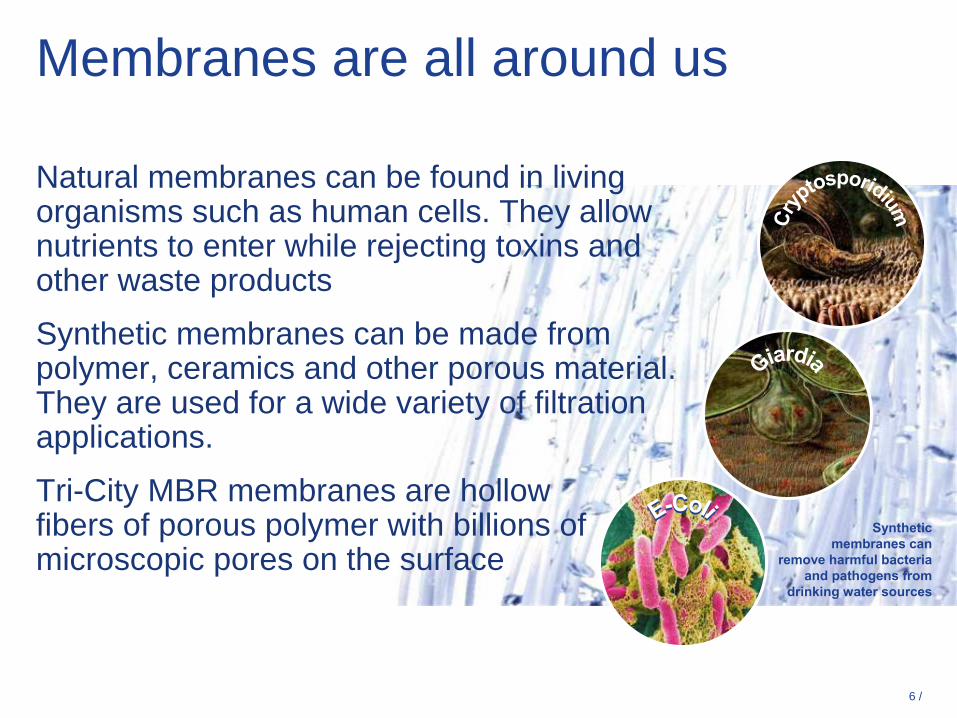
Membranes are all around us
Synthetic membranes can
remove harmful bacteria and pathogens from
drinking water sources
Natural membranes can be found in living organisms such as human cells. They allow nutrients to enter while rejecting toxins and other waste products
Synthetic membranes can be made from polymer, ceramics and other porous material. They are used for a wide variety of filtration applications.
Tri-City MBR membranes are hollow fibers of porous polymer with billions of microscopic pores on the surface

7 /
Membrane Configurations
Spiral wound/tubular: best suited to NF/RO
Hollow fiber: best suited for MF/UF
Sand filtrationSand filtration
MicrofiltrationMicrofiltration
UltrafiltrationUltrafiltration
NanofiltrationNanofiltration
Reverse OsmosisReverse Osmosis
0.0001 0.001 0.01 0.1 1 10 100um
Flat plate
Reverse Osmosis
Tri-City MBR membrane range
8 /
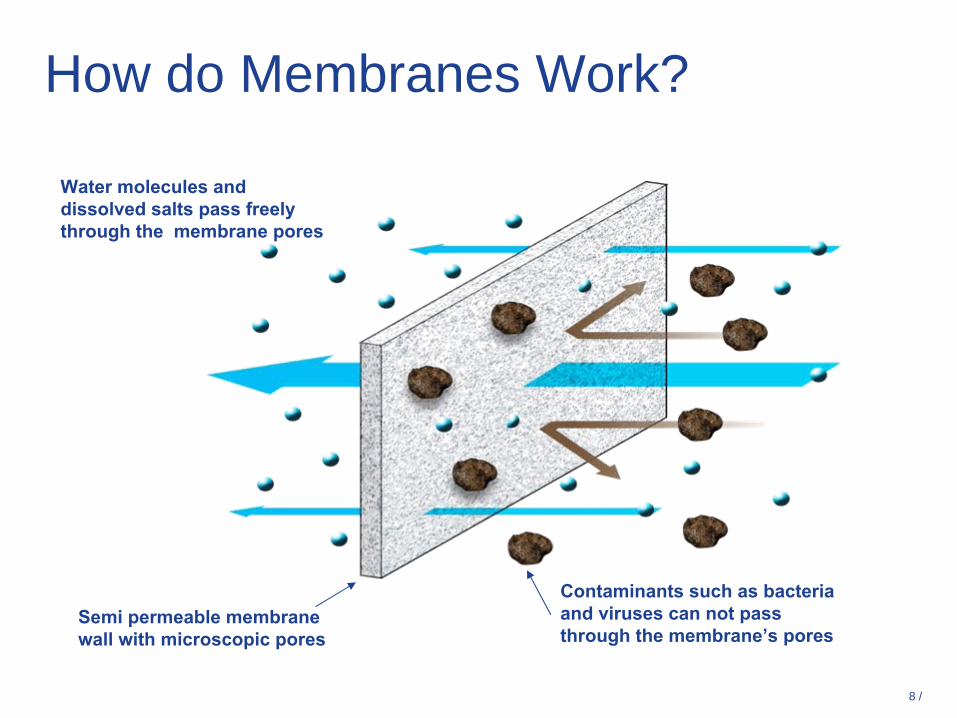
How do Membranes Work?
Contaminants such as bacteria and viruses can not pass through the membrane’s pores
Water molecules and dissolved salts pass freely through the membrane pores
Semi permeable membrane wall with microscopic pores

Membrane Bioreactors Membrane Bioreactors (MBRs)(MBRs)
10 /
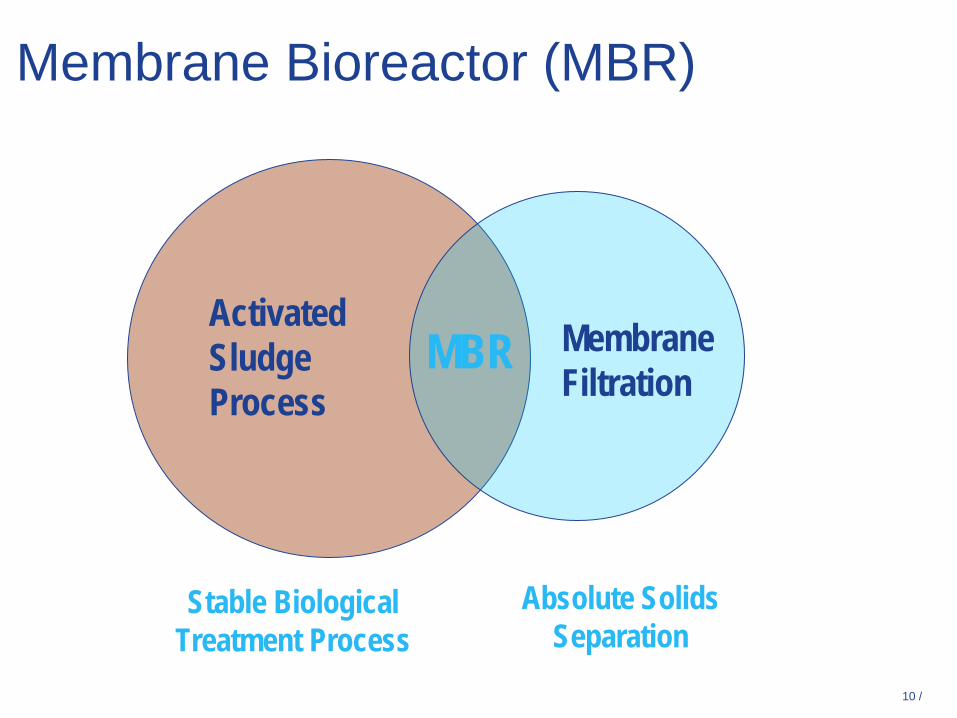
Membrane Bioreactor (MBR)
ActivatedSludgeProcess
MembraneFiltration
MBR
Stable BiologicalTreatment Process
Absolute SolidsSeparation

11 /
MBR System Overview
Distribution Channel
Membrane Aeration
Permeate PumpingMixed Liquor RecirculationBioreactor

12 /
MBR Drivers
Rapid population growth & urban sprawlNew and very stringent discharge & reuse limitsTight budgetsLimited spaceInfrastructure upgradesEnvironmental restoration

13 /
The MBR System
Fiber

14 /
Membrane Cassette
15 /
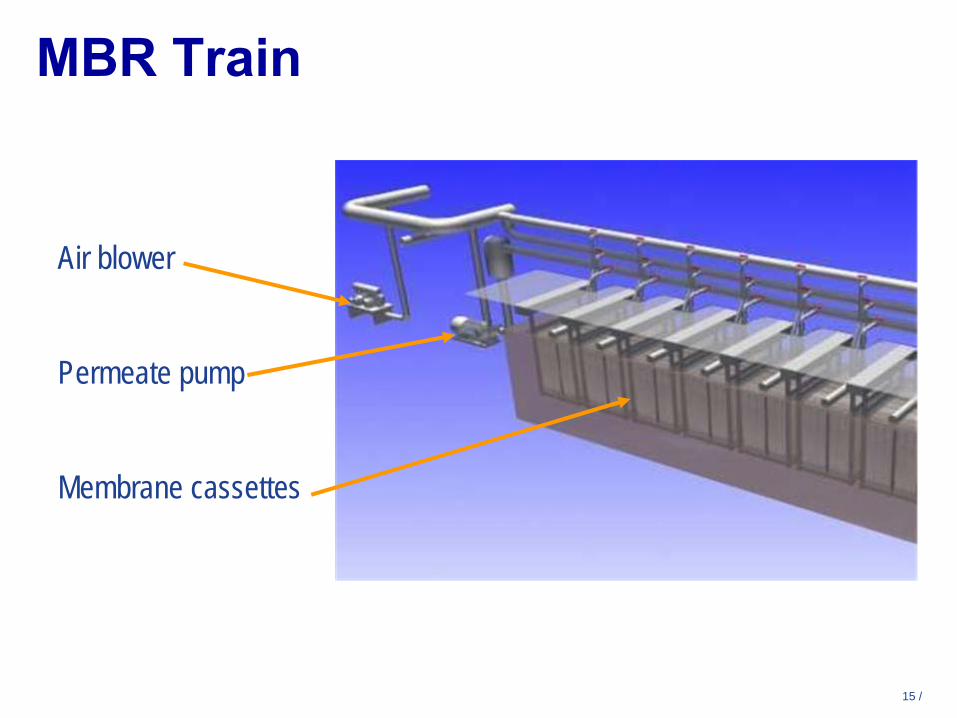
MBR Train
Air blower
Permeate pump
Membrane cassettes
16 /
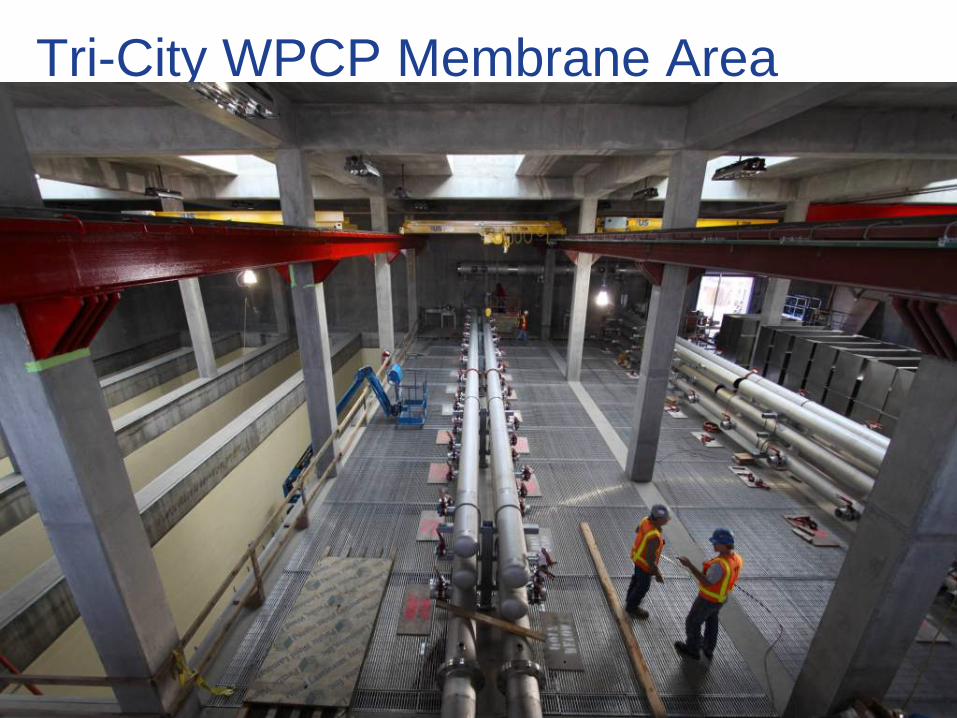
Tri-City WPCP Membrane Area
17 /
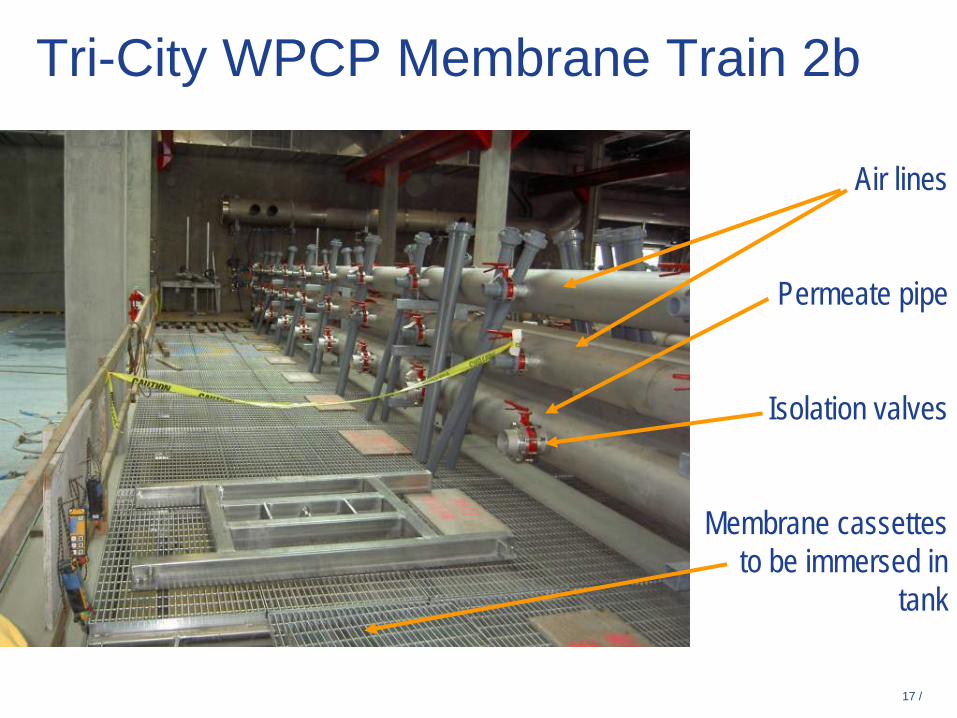
Tri-City WPCP Membrane Train 2b
Air lines
Permeate pipe
Isolation valves
Membrane cassettes to be immersed in
tank

18 /
Basic MBR System Design Comparisons with ASPs
Conv.
MBRMLSS
<3000 mg/l <15000 mg/l
HRT
12 – 20 hrs 2 – 6 hrs
SRT
<15 d 10+ d
Biological sludge yield
>80% <80%
Bioreactor volume
4 times smaller
Clarifier
Primary / Secondary None (Primary optional)
Tertiary treatment
Sand filtration / UV UF permeate
Overall footprint
>4 times smaller
Process stability
Settlement problems Not susceptible
19 /
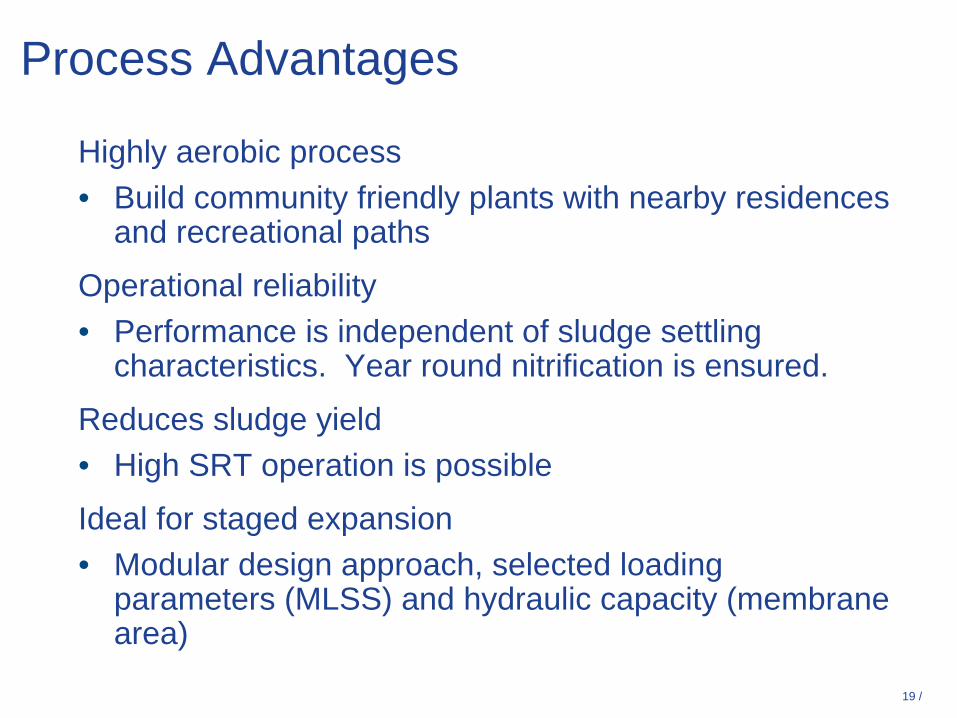
Process Advantages
Highly aerobic process• Build community friendly plants with nearby residences
and recreational paths
Operational reliability• Performance is independent of sludge settling
characteristics. Year round nitrification is ensured.
Reduces sludge yield• High SRT operation is possible
Ideal for staged expansion• Modular design approach, selected loading
parameters (MLSS) and hydraulic capacity (membrane area)

20 /
Conventional Treatment Membrane Treatment
Reduced Footprint - Wastewater
Comparison for a 7.5 mgd WWTP

21 /
• BOD < 3 mg/L (typically non-detectable)• TSS < 3 mg/L (typically non-detectable) • NH3-N < 0.5 mg/L • TP < 0.05 mg/L (requires coagulant addition)• TN < 3 mg/L (may require supplemental carbon)• Turbidity < 0.2 NTU
MBR Effluent Quality
22 /
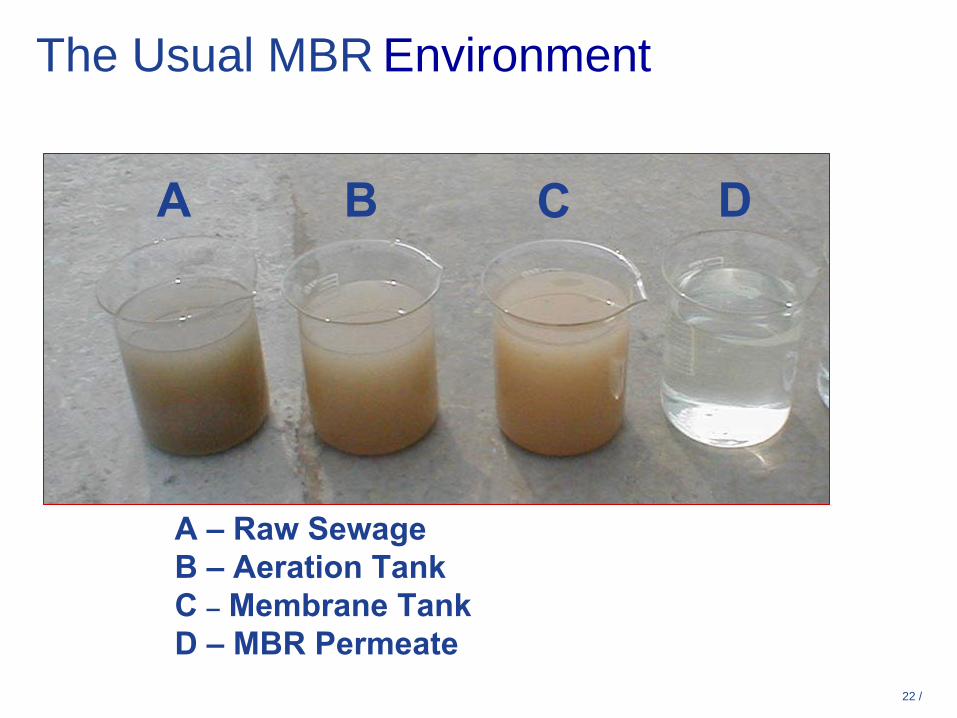
The Usual MBR Environment
A B C D
A –
Raw Sewage B –
Aeration Tank
C –
Membrane Tank D –
MBR Permeate

TriTri--CityCity WPCP MBR ExpansionWPCP MBR Expansion
Bioreactor
Membrane Trains
Effluent to Discharge
24 /
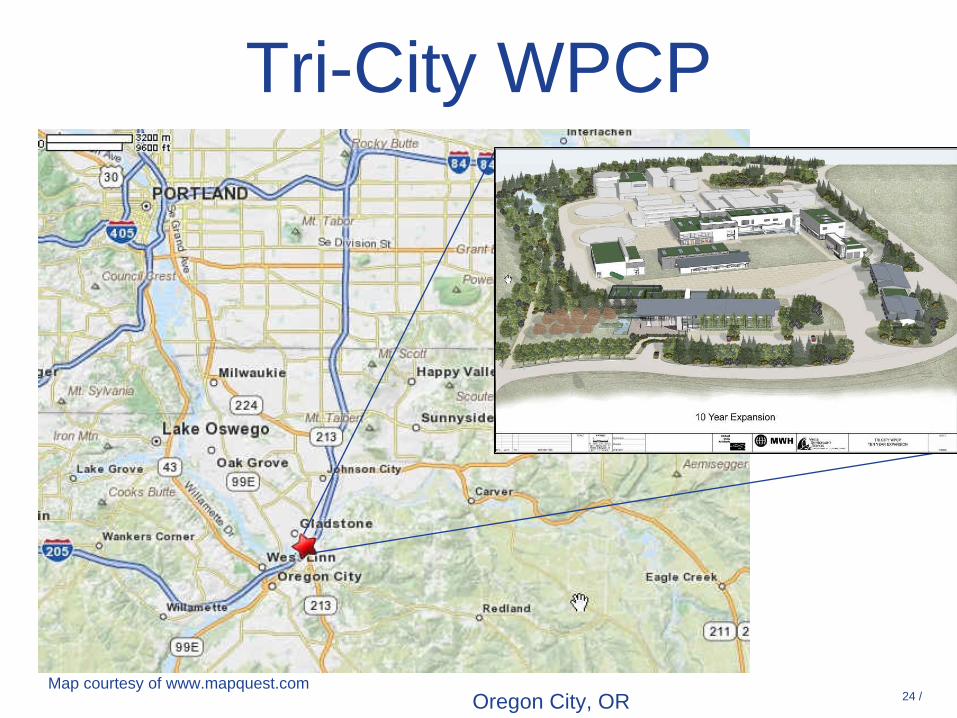
Tri-City WPCP
Oregon City, ORMap courtesy of www.mapquest.com
25 /
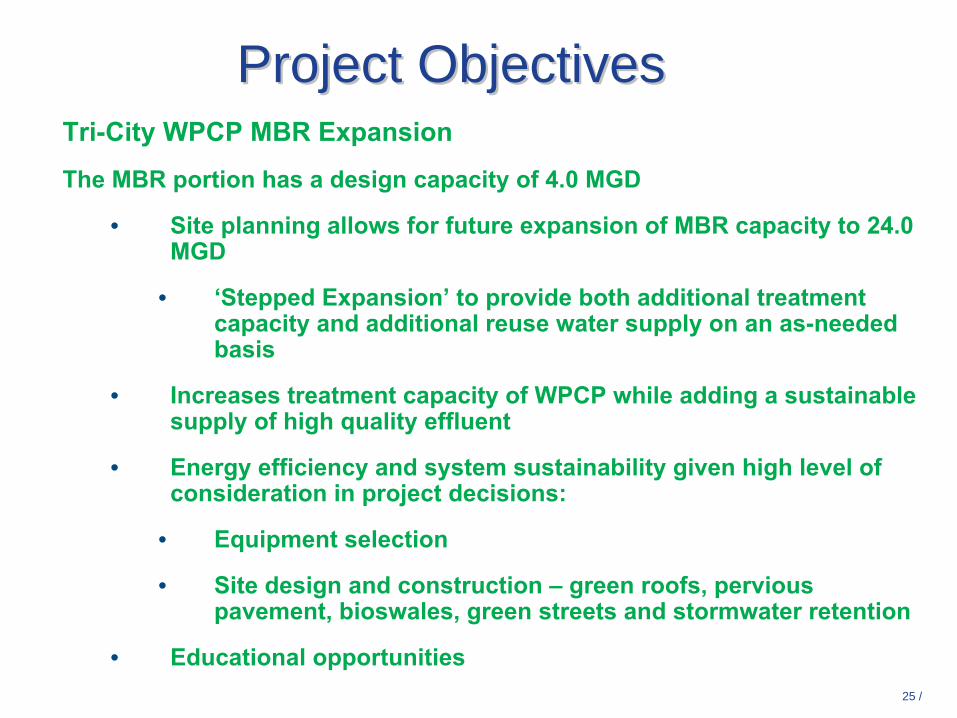
Project ObjectivesProject ObjectivesTri-City WPCP MBR Expansion
The MBR portion has a design capacity of 4.0 MGD
• Site planning allows for future expansion of MBR capacity to 24.0 MGD
• ‘Stepped Expansion’
to provide both additional treatment capacity and additional reuse water supply on an as-needed basis
• Increases treatment capacity of WPCP while adding a sustainable supply of high quality effluent
• Energy efficiency and system sustainability given high level of consideration in project decisions:
• Equipment selection
• Site design and construction –
green roofs, pervious pavement, bioswales, green streets and stormwater
retention
• Educational opportunities

26 /
ObjectivesObjectives
To develop an innovative and compact MBR system by minimizing plant footprint
To meet stringent reuse water quality and increase capacity
To achieve cost-effective and reliable solutions efficiently and sustainably
Include planning for future expansions

27 /
TriTri--City WPCPCity WPCP
MBR Expansion

28 /
TriTri--City WPCP City WPCP –– Interim Interim ExpansionExpansion
29 /
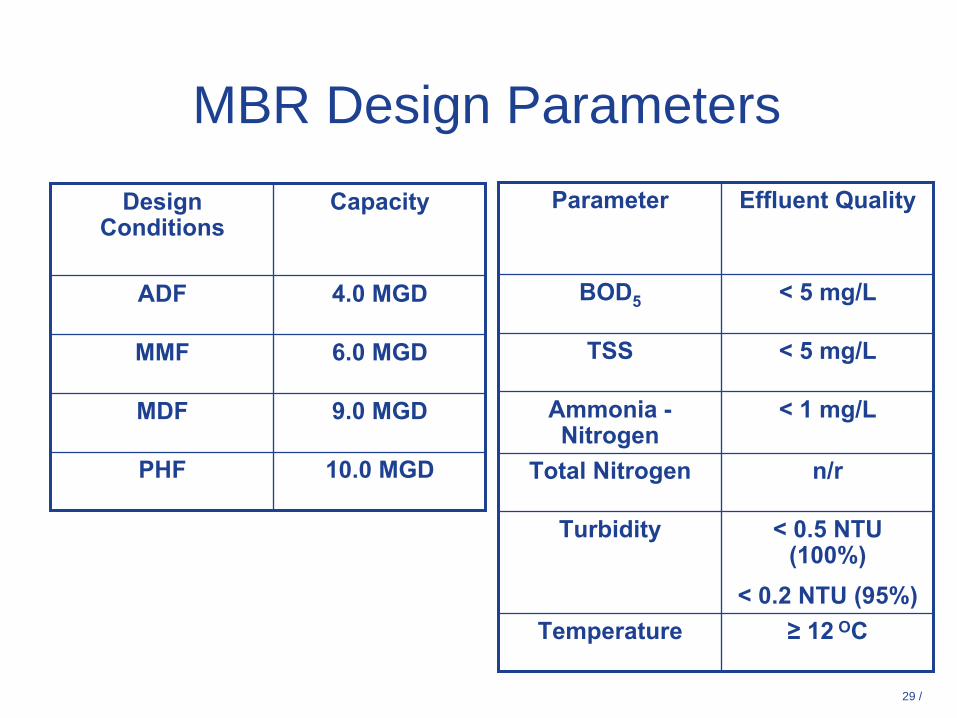
MBR Design ParametersParameter Effluent Quality
BOD5 < 5 mg/L
TSS < 5 mg/L
Ammonia -
Nitrogen
< 1 mg/L
Total Nitrogen n/r
Turbidity < 0.5 NTU (100%)
< 0.2 NTU (95%)Temperature ≥
12
OC
Design Conditions
Capacity
ADF 4.0 MGD
MMF 6.0 MGD
MDF 9.0 MGD
PHF 10.0 MGD
30 /
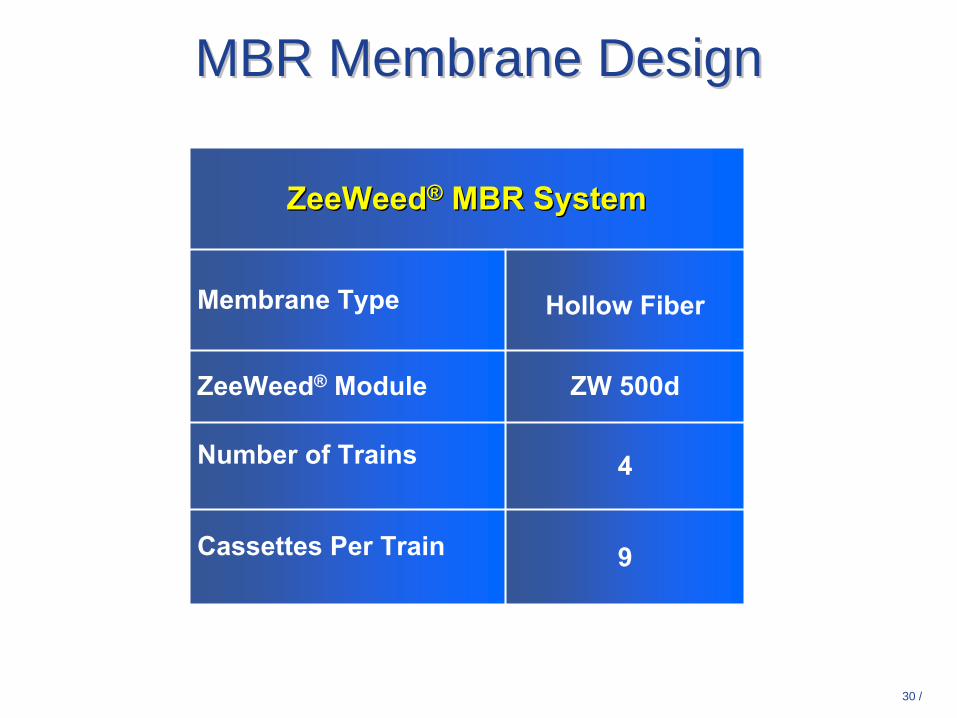
MBR Membrane DesignMBR Membrane Design
ZeeWeedZeeWeed®®
MBR SystemMBR System
Membrane Type Hollow Fiber
ZeeWeed®
Module ZW 500d
Number of Trains 4
Cassettes Per Train 9

31 /
Existing Plant StructureExisting Plant StructureOperating at up to 8.4 MGD
Existing Conventional Activated Sludge Process included:
– Influent pumping station– Headworks– Primary clarifiers– Aeration basins– Secondary clarifiers– Disinfection– Solids handling
32 /
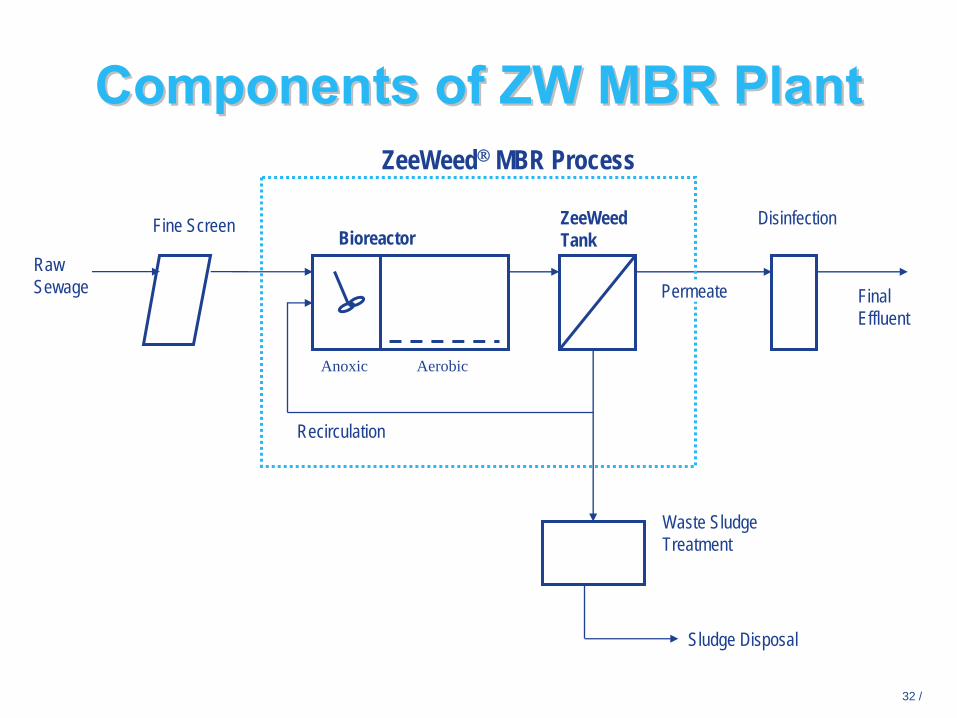
Components of ZW MBR PlantComponents of ZW MBR PlantZeeWeed® MBR Process
BioreactorZeeWeedTank
RawSewage
Fine Screen
Waste SludgeTreatment
Permeate FinalEffluent
Disinfection
Sludge Disposal
Recirculation
Anoxic Aerobic
33 /
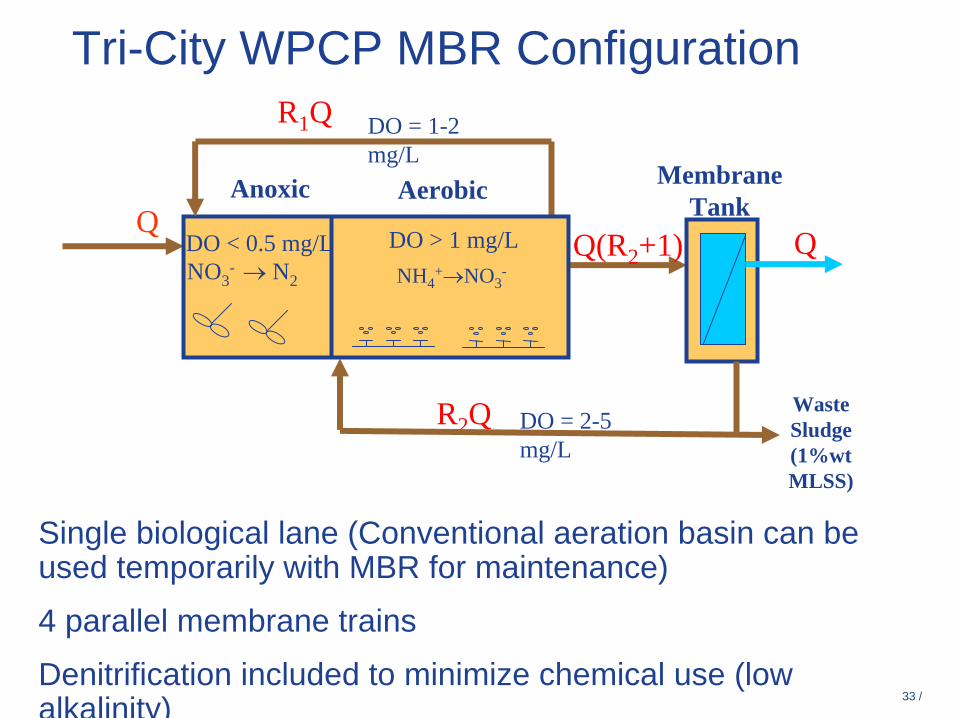
Tri-City WPCP MBR Configuration
Single biological lane (Conventional aeration basin can be used temporarily with MBR for maintenance)
4 parallel membrane trains
Denitrification included to minimize chemical use (low alkalinity)
R2 Q
QQ Q(R2 +1)
Anoxic Aerobic
DO > 1 mg/LNH4
+→NO3-NO3
- → N2
DO < 0.5 mg/L
Waste Sludge (1%wt MLSS)
MembraneTank
DO = 2-5 mg/L
R1 Q DO = 1-2 mg/L

34 /
HeadworksHeadworks
Headworks
JWC 2-mm internally fed travelling band screens
35 /
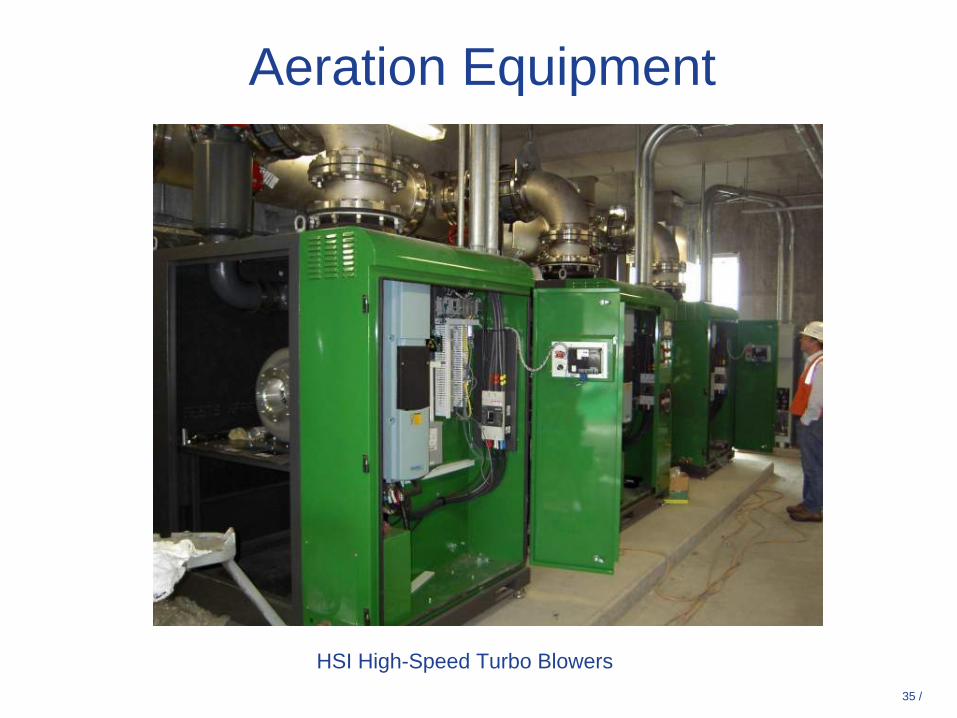
Aeration Equipment
HSI High-Speed Turbo Blowers
36 /
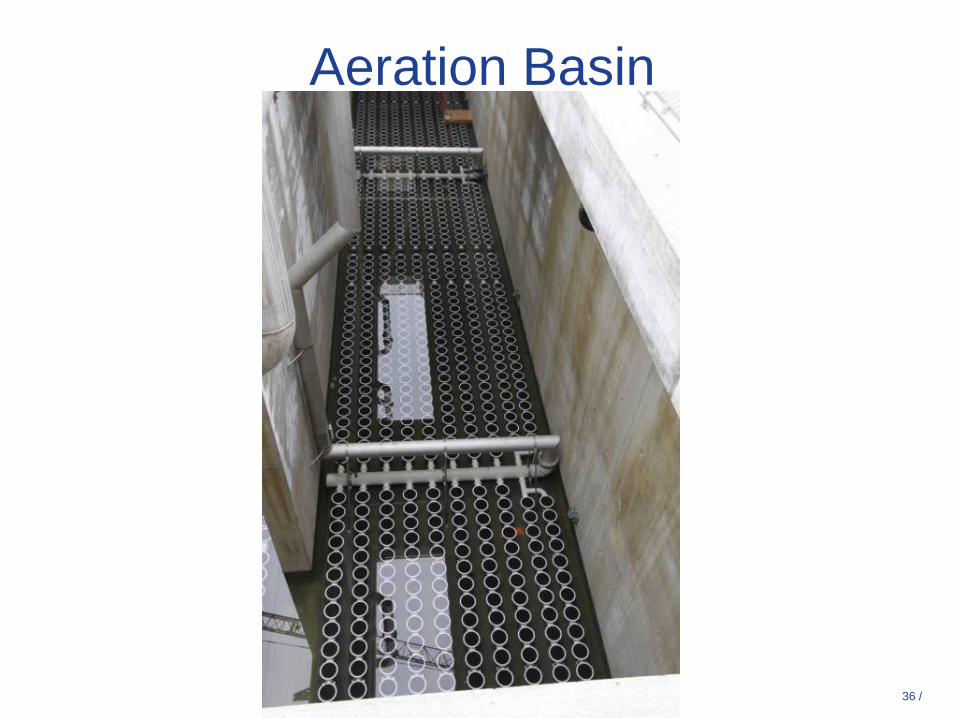
Aeration Basin
37 /
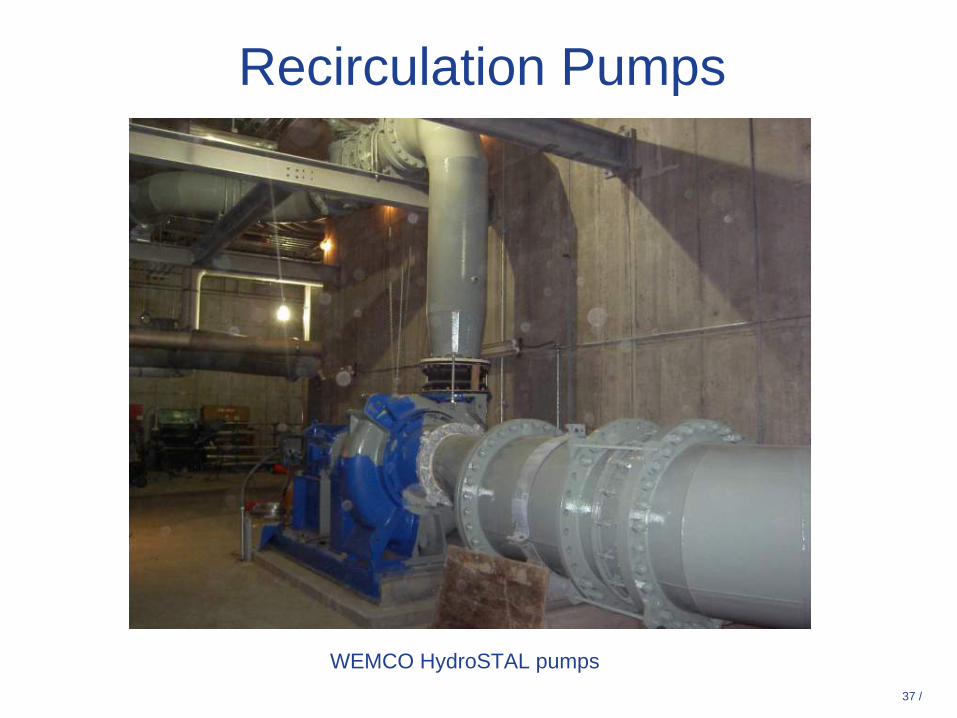
Recirculation Pumps
WEMCO HydroSTAL pumps

38 /
Membrane AreaMembrane Area
Membrane Zone

39 /
Filtrate Pumps
Goulds 3196

40 /
Filtrate DisinfectionFiltrate Disinfection
Disinfection & Discharge
IDI Aquaray® 3X UV Disinfection
41 /
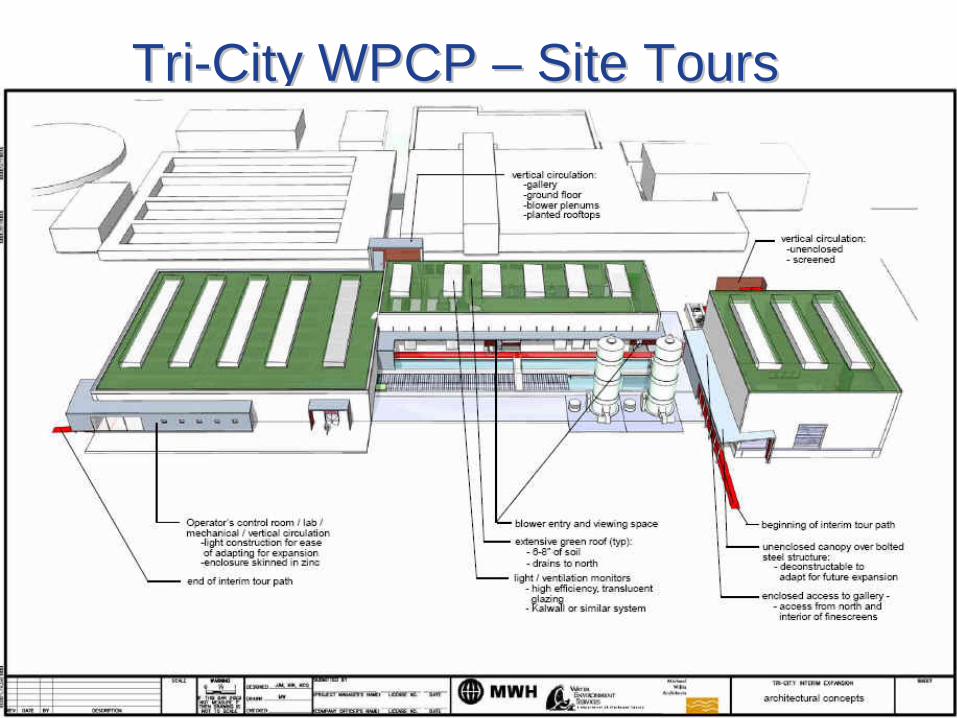
TriTri--City WPCP City WPCP –– Site ToursSite Tours

42 /
Effluent QualityEffluent Quality
ParameterParameter InfluentInfluent[mg/L][mg/L]
EffluentEffluent[mg/L][mg/L]
BODBOD55 170170 ≤≤
5.05.0
TSSTSS 150150 ≤≤
5.05.0
AmmoniaAmmonia 5050 ≤≤
11
TurbidityTurbidity N/AN/A ≤≤
0.2 NTU0.2 NTU
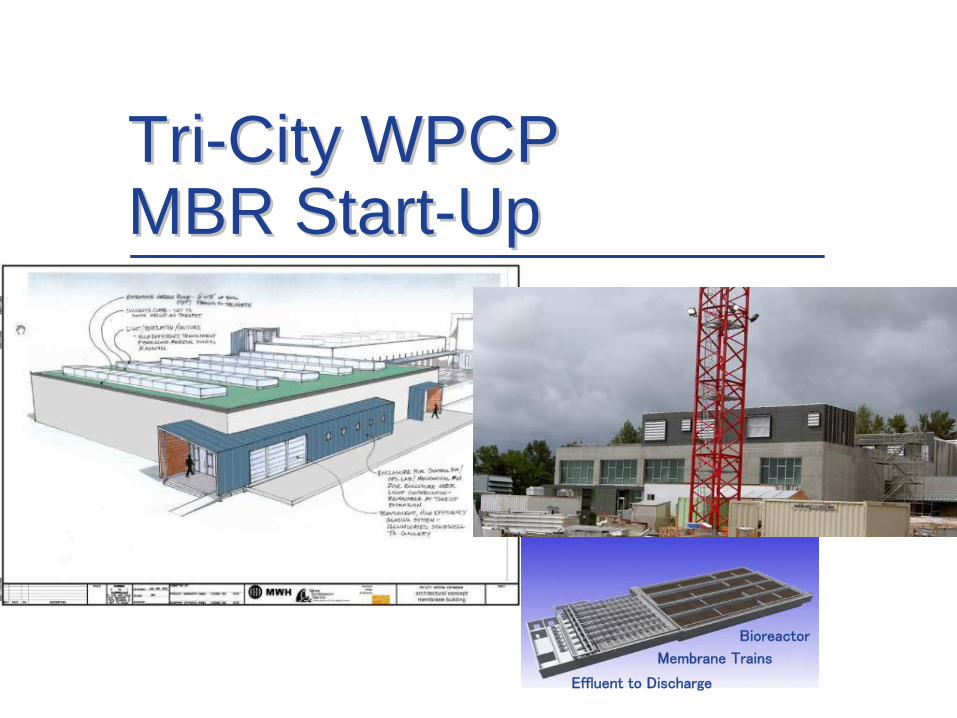
TriTri--City WPCPCity WPCP MBR StartMBR Start--UpUp
Bioreactor
Membrane Trains
Effluent to Discharge

Membrane Bioreactor Commissioning, Seeding and
Start-Up
45 /
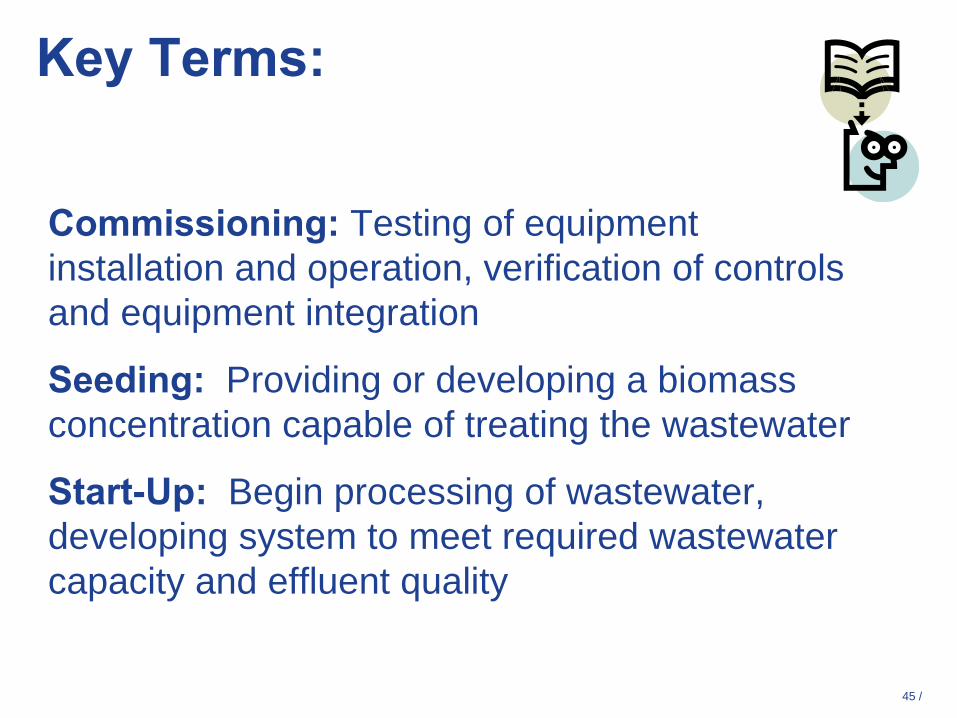
Key Terms:
Commissioning:
Testing of equipment installation and operation, verification of controls and equipment integration
Seeding:
Providing or developing a biomass concentration capable of treating the wastewater
Start-Up:
Begin processing of wastewater, developing system to meet required wastewater capacity and effluent quality

Tri-City WPCP MBR Commissioning

47 /
CommissioningMajor construction complete or at a stage sufficient to start testing MBR equipment
GE-ZENON Field Service Representative (FSR) on-site to perform the following tasks:
– Installation Verification– I/O Verification– Membrane Installation– Scenario Testing With Clean Water
Install membranes

48 /
Typical MBR Fine Screens
In-channel Rotary Drum ScreenInternally Fed Rotary Drum Screen
Rotating Brush Screen
Traveling Band Screenafter Primary Clarifier
49 /
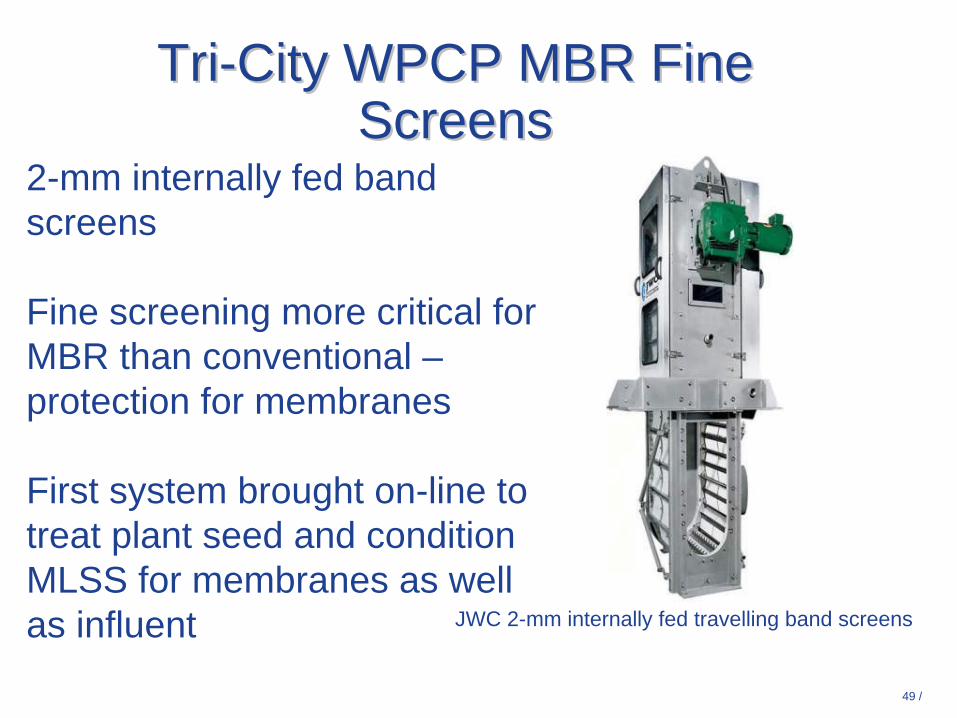
TriTri--City WPCP MBR Fine City WPCP MBR Fine ScreensScreens
JWC 2-mm internally fed travelling band screens
2-mm internally fed band screens
Fine screening more critical for MBR than conventional – protection for membranes
First system brought on-line to treat plant seed and condition MLSS for membranes as well as influent

50 /
TriTri--City WPCP MBR Fine City WPCP MBR Fine ScreensScreens
JWC 2-mm internally fed travelling band screens
Existing conventional system meant mixed liquor was available on-site for seeding plant quickly

51 /
Commissioning Complete / Pre-Seeding Checklist
Seeding and Start-Up Workplan (site specific) developed?
System fully water tested (Controls 100% complete)?
Influent screen functioning properly (if required)?
Recirculation pumps functioning properly (3 – 10Q, typical 5Q)?
Blowers functioning properly?
Aeration pattern – fine bubble diffuser grid?
Aeration patter – membranes?
Analytical test equipment – site lab or external lab.?
Calibrate on-line analytical equipment – DO, pH etc?
Dial out alarm?
Logsheet, spreadsheet with graphs?
Operator Training?
52 /
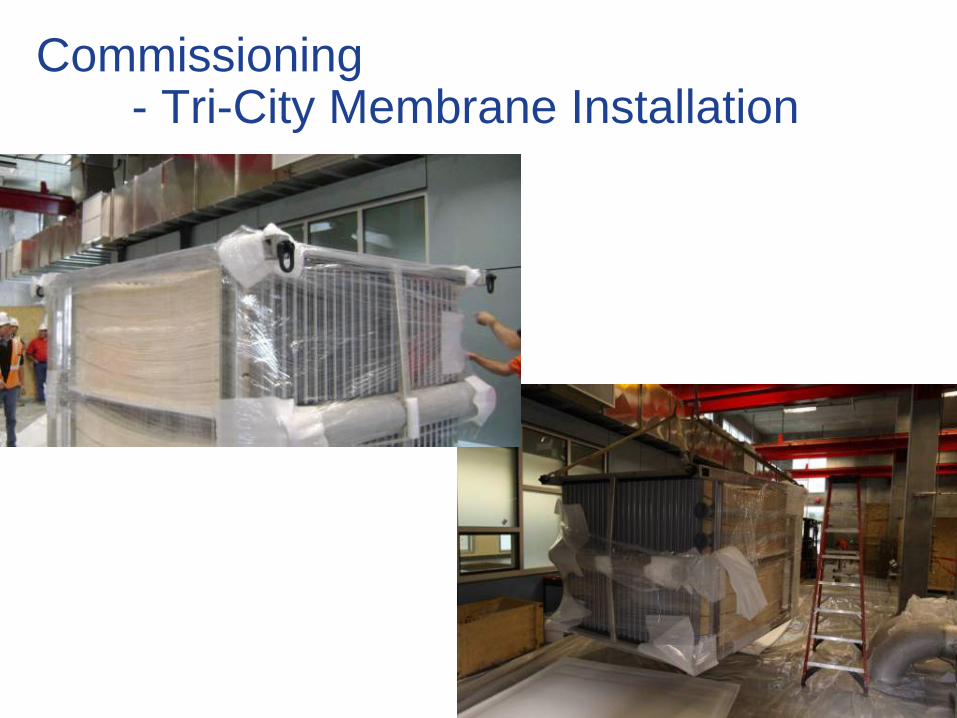
Commissioning - Tri-City Membrane Installation

53 /
Commissioning - Tri-City Membrane Installation

54 /
Commissioning - Tri-City Membrane Installation

Tri-City WPCP MBR Seeding
56 /
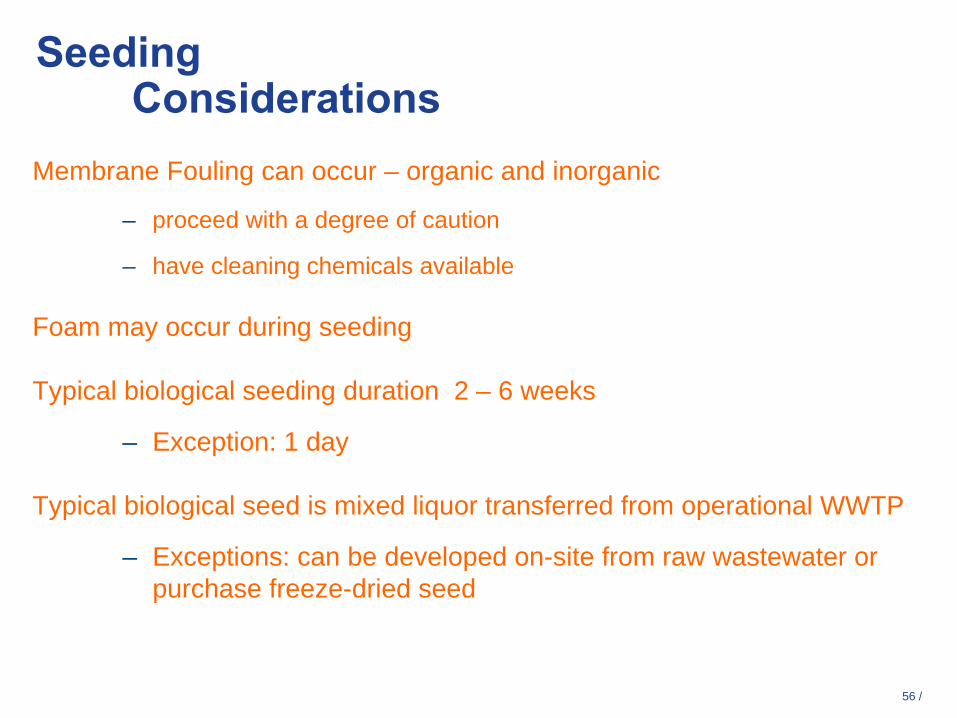
Seeding Considerations
Membrane Fouling can occur – organic and inorganic
– proceed with a degree of caution
– have cleaning chemicals available
Foam may occur during seeding
Typical biological seeding duration 2 – 6 weeks
– Exception: 1 day
Typical biological seed is mixed liquor transferred from operational WWTP
– Exceptions: can be developed on-site from raw wastewater or purchase freeze-dried seed
57 /
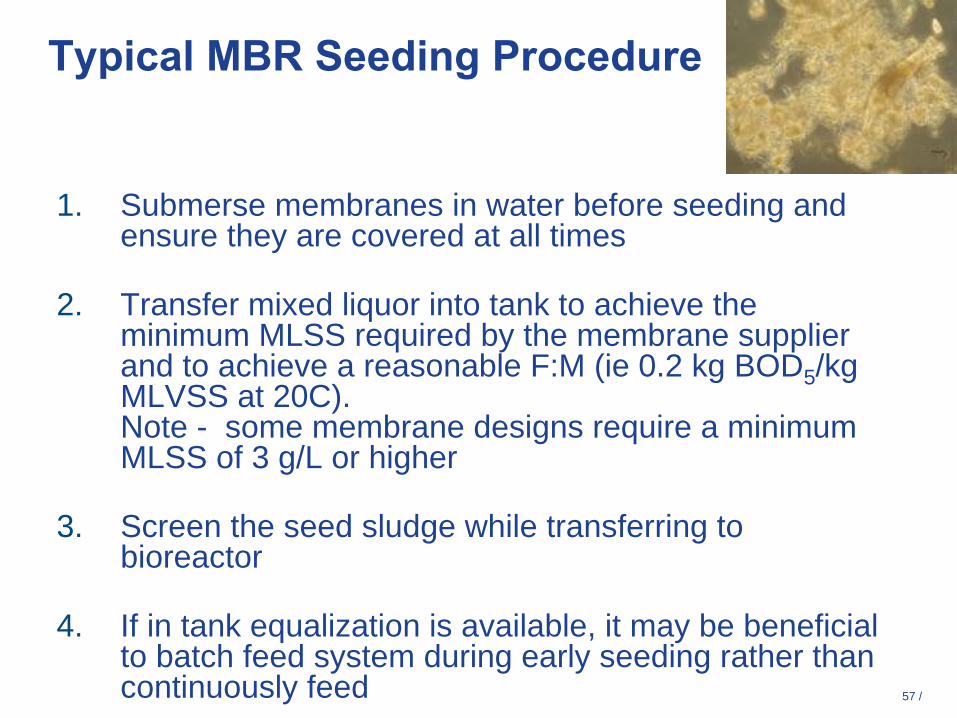
Typical MBR Seeding Procedure
1. Submerse membranes in water before seeding and ensure they are covered at all times
2. Transfer mixed liquor into tank to achieve the minimum MLSS required by the membrane supplier and to achieve a reasonable F:M (ie 0.2 kg BOD5 /kg MLVSS at 20C). Note - some membrane designs require a minimum MLSS of 3 g/L or higher
3. Screen the seed sludge while transferring to bioreactor
4. If in tank equalization is available, it may be beneficial to batch feed system during early seeding rather than continuously feed

58 /
Typical MBR Seeding Procedure
5. Maintain reasonable F:M while increasing the flow and MLSS.
6. Operate initially at a reduced flux to minimize membrane fouling
7. Monitor MLSS, effluent ammonia, COD and/or other indicators before increasing the influent flow.

59 /
Tri-City WPCP MBR Seeding Procedure
Transfer MLSS from operational conventional plant through fine screens

Tri-City WPCP MBR Start-Up –
Operation and
Monitoring

61 /
Key Terms:
Flux:
Amount of flow per day per square foot of membrane GFD (Gallons/sqft/day)
TMP:
Transmembrane Pressure. Amount of Vacuum drawn across membrane (psi)
Permeability:
Permeability is a measure of how much water is being drawn per unit of pressure (gfd/psi)
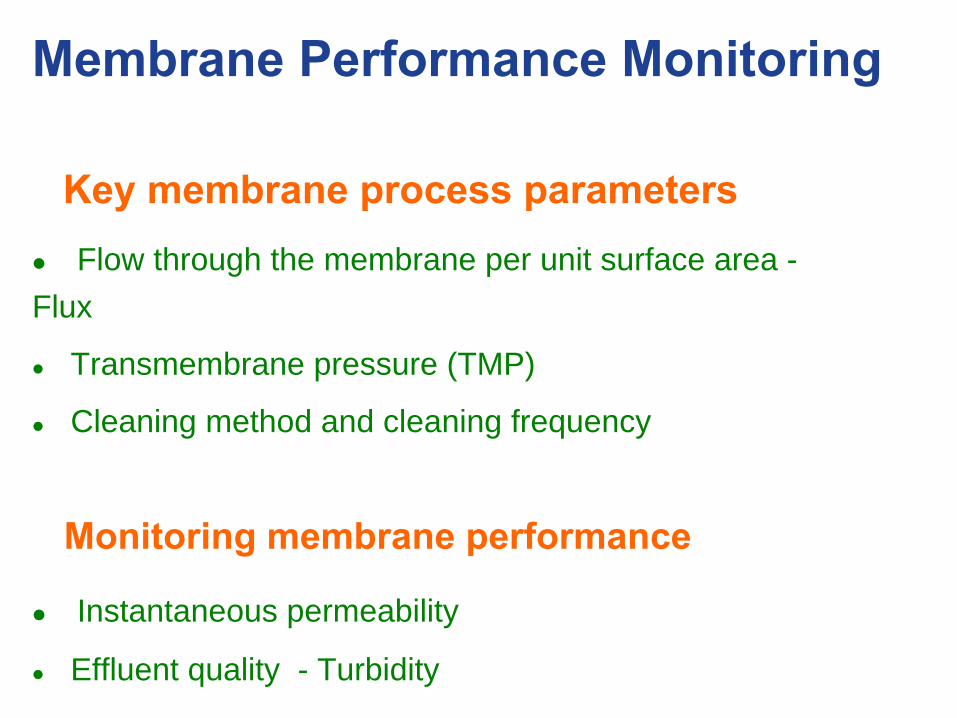
Membrane Performance Monitoring
Key membrane process parametersFlow through the membrane per unit surface area -
Flux
Transmembrane pressure (TMP)
Cleaning method and cleaning frequency
Monitoring membrane performance
Instantaneous permeability
Effluent quality - Turbidity
63 /
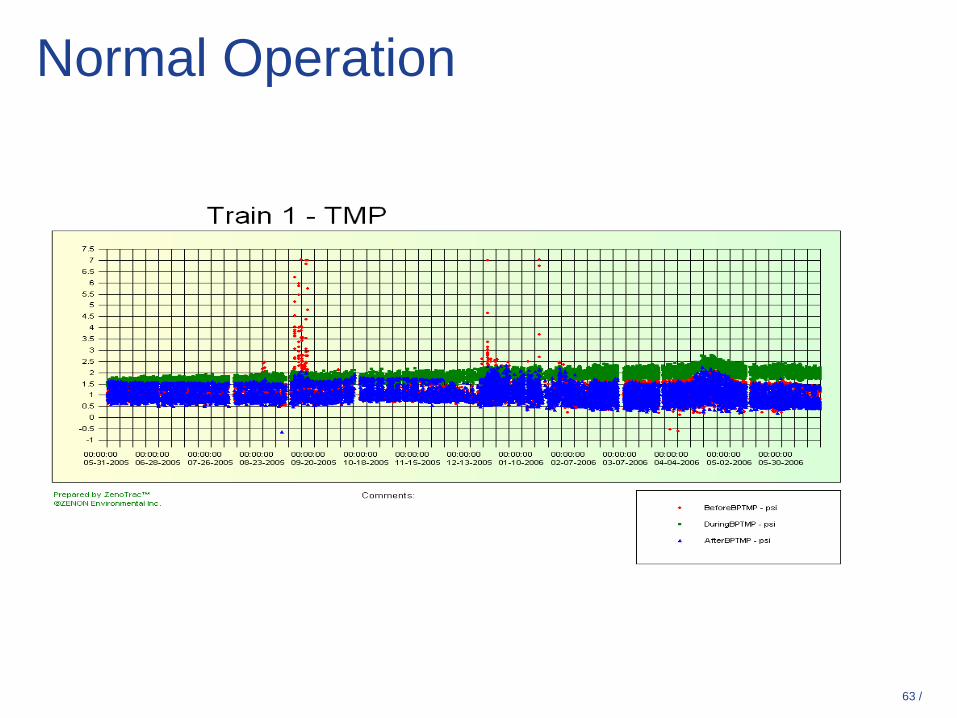
Normal Operation

64 /
MLSS Distribution – 8 g/L in bioreactor
0
2
4
6
8
10
12
14
16
1 2 3 4 5 6 7 8 9 10
Recycle Rate (RQ)
Mem
bran
e Ta
nk M
LSS
(g/L
)
Design
MLSSmembrane
tank = (R+1)
x MLSSbioreactorR

65 /
Analytical Tools
COD
NH3 , NO3
MLSS, MLVSS
DO
Time to Filter (TTF)
OUR
pH
Alkalinity
Turbidity

66 /
Typical Analytical Objectives
OUR: 20 - 100 mg/L/hr
pH: 6.5 – 8.0
Permeate COD: 20-50 mg/L (industrial could be 1000 mg/L)
Permeate NH3 -N: <1 mg/L
Permeate NO3 : 1 – 30 mg/L (denitrification required?)
Alkalinity: > 50 mg/L
Time To Filter (TTF) < 150 seconds

67 /
Ensure nitrification (i.e. NH3 < 1 and SRT > 12-d)
DO > 1.5 mg/L in the aerobic and membrane tank
Avoid sudden changes in environmental conditions (pH, loading, etc.)
Monitor Time-To-Filter (TTF)
How to Promote Good Membrane Performance and Sludge Filterability

68 /
Physical Operating Conditions
Inspect and maintain influent screensOperate membranes at proper relax or backpulse frequenciesEnsure proper membrane aerationPlugging or clean aeratorsRecirculation Rate and solids balanceInspect cassettes Perform membrane cleaning as recommended by vendor

69 /
Work with vendor to develop a start up plan and ideally have them on site.
Ensure pretreatment is operating at seeding, startup and operation
Be aware that the biological performance is integral to membrane performance• Monitor key parameters
Allow time for seeding and time to build solids before any deadlines
Start-Up Key Points

Project CompletionProject Completion
Construction wrapping up
Membranes installed and wet-testing
Seeding and wastewater processing expected for November

71 /
Thank You!Thank You!
Questions?Questions?