ijopec.co.ukijopec.co.uk/wp-content/uploads/2018/04/ICS.VOL2_16JAN...Engineering Approaches on...
176
Engineering Approaches on Sustainability Engineering Approaches on Sustainability Editors Zehra Semra Can Barış Yılmaz Seval Genç Candeniz Seçkin In general terms, sustainability is the act of meeting our own needs today without compromising the ability of future generations to meet their own needs (World Commission on Environment and Development, 1987). Obviously, the ability of natural resources and environmental systems to support our needs is limited. erefore, the major challenge for engineers today is to design and/or operate systems that use energy and natural resources sustainably. Designing for the environment is crucial. is book presents the recent engineering approaches to sustainability from research and practice. e chapters included in this volume are from the first International Sustainability Congress organized by International Center of Sustainability (ICS) between 1-3 December 2016 in Istanbul, Turkey. All chapters are peer-reviewed by both the editors and at least two independent scholars from fields relevant to the manuscript's subject area. ICS is a research and academic center for sustainability founded in 2015 and dedicated to build resilience of communities and ecosystems to environmental and socio-economic risks. ICS has an integrated approach and defines sustainability not only in terms of environment but also in terms of socio-economic process. Its mission is to produce information, to research and to practice at Micro and Macro levels in Sustainable Development with a holistic and cross-disciplinary approach. Engineering Approaches on Sustainability
Transcript of ijopec.co.ukijopec.co.uk/wp-content/uploads/2018/04/ICS.VOL2_16JAN...Engineering Approaches on...

Engineering Approaches on SustainabilityEngineering Approaches
on Sustainability
EditorsZehra Semra CanBarış YılmazSeval GençCandeniz Seçkin
In general terms, sustainability is the act of meeting our own needs today without compromising the ability of future generations to meet their own needs (World Commission on Environment and Development, 1987). Obviously, the ability of natural resources and environmental systems to support our needs is limited. �erefore, the major challenge for engineers today is to design and/or operate systems that use energy and natural resources sustainably. Designing for the environment is crucial. �is book presents the recent engineering approaches to sustainability from research and practice.
�e chapters included in this volume are from the first International Sustainability Congress organized by International Center of Sustainability (ICS) between 1-3 December 2016 in Istanbul, Turkey. All chapters are peer-reviewed by both the editors and at least two independent scholars from fields relevant to the manuscript's subject area. ICS is a research and academic center for sustainability founded in 2015 and dedicated to build resilience of communities and ecosystems to environmental and socio-economic risks. ICS has an integrated approach and defines sustainability not only in terms of environment but also in terms of socio-economic process. Its mission is to produce information, to research and to practice at Micro and Macro levels in Sustainable Development with a holistic and cross-disciplinary approach.
Engi
nee
ring
App
roac
hes o
n S
ust
ainab
ility

Engineering Approaches on Sustainability
EditorsZehra Semra CanBarış YılmazSeval GençCandeniz Seçkin

ENGINEERING APPROACHES ON SUSTAINABILITY
Edited By
Dr. Zehra Semra Can Marmara University, İstanbul/Turkey
Dr. Barış Yılmaz Marmara University, İstanbul/Turkey
Dr. Seval Genç Marmara University, İstanbul/Turkey
Dr. Candeniz Seçkin Marmara University, İstanbul/Turkey

Dr. Zehra Semra Can received her BSc degree in Chemistry in 1991 from Marmara University (MU), Turkey. She received her MSc degree in Environmental Sciences from Boğaziçi University, Turkey in 1994. She received a second MSc degree in Environmental Sciences from Drexel University, Philadelphia in 1997, and her PhD degree from the same university in 1999. In 2000, she started teaching at MU, Environmental Engineering Department (EED). During 2004-2005, she taught graduate and undergraduate courses at San Diego State University, Civil and Environmental Engineering Department as a visiting professor. Currently, she carries out her teaching and research activities at MU, EED as full professor. Her research interests are oxidation and advanced oxidation techniques, micropollutants and emerging contaminants.
Dr. Barış Yılmaz received his Bachelor of Science degree in Nuclear Engineering in 1999 from Hacettepe University, Ankara, Turkey. In the same year, she was recruited to Marmara University (MU), Engineering Faculty, Mechanical Engineering Department (MED) as a Research Assistant. He received his Master of Science degree in Mechanical Engineering from MU, Institute of Pure and Applied Sciences in 2002, Istanbul, Turkey. He received his PhD degree from the Université d’Orleans, France and MU, Turkey within the frame of a joint PhD program in 2010. In 2010, he started teaching at MU, Faculty of Engineering, Thermal Sciences Division of MED as an Assistant Professor. Currently, he carries out his teaching and research activities at the same department. His research interests are combustion, computational fluid dynamics, heat transfer, thermodynamics, specifically, design and modeling of refrigeration systems.
Dr. Seval Genç is an Assistant Professor in Metallurgical and Materials Engineering in Marmara University. She received her BSc degree in Physics Education from Marmara University. In the same year, she started working as a research assistant in Engineering Faculty, Marmara University. She received her MSc in Physics from Boğaziçi University and earned her PhD degree in Materials Science and Engineering from University of Pittsburgh, USA. Her teaching and research interests are in the area of materials science, biomaterials, magnetic fluids, nanomaterials, magnetic, electrical and optical properties of materials.
Dr. Candeniz Seçkin received her Bachelor of Science degree in Mechanical Engineering in 2002 from Istanbul Technical University (ITU), Istanbul, Turkey. In 2003, she was recruited to ITU, Energy Institute as a Research Assistant. She received her Master of Science degree in Energy Science and Technology from ITU, Energy Institute in 2006, Istanbul, Turkey. She received her PhD degree from the same university in 2013. She was a visiting researcher in Universita Degli di Roma “La Sapienza”, Mechanical Engineering Department, Rome, Italy between 2010-2012. Currently, she carries out her teaching and research activities at Marmara University, Mechanical Engineering Department as an Assistant Professor. Her research interests are refrigeration systems, solar energy systems, resource accounting in energy generation.
IJOPEC Publication International Journal of Politics & Economics London, United Kingdom 3 Bassingbourn, HouseSutton Dwellings Upper Street, London N1 1UB
www.ijopec.co.uk E-Mail: [email protected]: (+44) 73 875 2361 (UK)(+90) 488 217 4007 (Turkey)
Engineering Approaches on Sustainability First Edition, December 2016 IJOPEC Publication No: 32
ISBN: 978-0-9932118-2-9
No part of this book may be reproduced, stored in a retrieval system, transmitted in any form or by any means electronically without author’s permission. No responsibility is accepted for the accuracy of information contained in the text, illustrations or advertisements. The opinions expressed in these chapters are not necessarily those of the editors or publisher.
A catalogue record for this book is available from Nielsen Book Data, British Library and Google Books.
The cover illustration is designed by Res. Assist. Neslihan Alpay, Marmara University, Metallurgical and Materials Engineering Department
Printed in Turkey. Kayhan Printing Co Ltd. Merkez Efendi Mh. Fazıl Paşa Cd. No: 8/2 Zeytinburnu / İstanbul, Turkey Phone: (+90) 212 576 0136
Composer: IJOPEC Art Design London, UK [email protected]
Engineering Approaches on Sustainability (Edited by: Dr. Zehra Semra Can, Dr. Barış Yılmaz, Dr. Seval Genç, Dr. Candeniz Seçkin )
3
CONTENTS
Editorial Advisory Board .......................................................................................................... …………...5
List of Contributers ................................................................................................................................ 7-12
Introduction Engineering Approaches on Sustainability ................................................................................................ .13 Zehra Semra Can, Barış Yılmaz, Seval Genç, Candeniz Seçkin
1. Solution in Energy: Energy End-Use Efficiency Based 100% Renewable Community Power ....... 15-31 Tanay Sıdkı Uyar
2. Prediction of Renewable Energy Consumption in Turkey Using Artificial Neural Networks ....... 33-43 Ayşe Ayçim Selam, Ahmet Kubilay Atalay, M. Övül Arıoğlu Akan
3. Environmental Remediation Cost of Industrial Solid Waste in Terms of Extended Exergy ........... 45-63 Candeniz Seçkin
4. Maximizing Overall Energy Performance of a Multiple Use Building by IntegratingAdvanced Building System ............................................................................................................ 65-75 Hatice Sözer, Ergin Kükrer
5. Life Cycle Impact Assessment Analysis on a Cooling System ........................................................ 77-88 Zehra Özçelik, Yavuz Özçelik, Nazlı Yaşar Tunca
6. Performance Analysis of a Cascade Refrigeration System with the Replacement of HFCRefrigerants with Natural Ones .................................................................................................. 89-101 B. Yılmaz, E. Mançuhan, N. Erdönmez, M. K. Sevindir, D. Yılmaz
7. Removal of Pb (II) ion From Aqueous Solution by Adsorption Processonto Paper Mill Sludge: Isotherm and Kinetics ......................................................................... 103-112 Ali Yaraş, Hasan Arslanoğlu
8. Application of Pervaporation in Environmental Engineering:VFA Separation via Commercial and Manufactured Membranes .............................................. 113-124 Caglar Kullu, Hatice Taner Hatice Yesil, Adile Evren Tugtas
9. Treatment of A Textile Dye in Aqueous Solution usingFe0/GAC Micro-Electrolysis System ........................................................................................ 125-133 Belgin Karabacakoğlu, Duygu Yamaç
10. Production of Polyester Composite Material Using Pine Cone Powder as Reinforcement ........ 135-142 Duygu Gökdai, Alev Akpınar Borazan

4
11. Management of Domestic Wastewater through Segregated Streams as an Aid towardsSustainability of Natural Resources and Sustainable Agriculture/Food Production ................... 143-149 Bilsen Beler Baykal
12. Environmental and Economic Analysis of a Rainwater Harvesting Systemat Marmara University .............................................................................................................. 151-157 Recep Önder Sürmeli
13. Environmentally Sustainable De-icer Management for an Airport ............................................ 159-164 Sinem Aksit Sahinkaya, Fatos Germirli Babuna
14. Some Remarks on Sustainable Fisheries Management in Turkey .............................................. 165-173 Didem Göktürk, Tomris Deniz, Nurdan Cömert

Engineering Approaches on Sustainability (Edited by: Dr. Zehra Semra Can, Dr. Barış Yılmaz, Dr. Seval Genç, Dr. Candeniz Seçkin )
5
EDITORIAL ADVISORY BOARD
Abdülkerim Kar, Marmara University, Turkey
Abdurahman Kılıç, Istanbul Technical University, Turkey
Adile Evren Tuğtaş, Marmara University, Turkey
Ali Kurultay, Birer Kurultay Architects, Turkey
Aslıhan Albostan, Georgia State University, USA
Asuman Çelik Küçük, Marmara University, Turkey
Ayşe Ayçim Selam, Marmara University, Turkey
Barış Çallı, Marmara University, Turkey
Bilge Alpaslan Kocamemi, Marmara University, Turkey
Deniz Yılmaz, Istanbul Arel University, Turkey
Ebru Mançuhan, Marmara University, Turkey
Elif Soyer, Marmara University, Turkey
Emre Alpman, Marmara University, Turkey
Esra Erdim, Marmara University, Turkey
Gökçen Alev Çiftçioğlu, Marmara University, Turkey
Hatice Sözer, Istanbul Technical University, Turkey
Kozet Yapsaklı Bakırcı, Marmara University, Turkey
Mahmure Övül Arıoğlu Akan, Marmara University, Turkey
Mustafa Kemal Sevindir, Yıldız Technical University, Turkey
Neşet Kadırgan, Marmara University, Turkey
Neslihan Semerci, Marmara University, Turkey
Ömer Ziya Cebeci, Marmara University, Turkey
Orhan Gökyay, Marmara University, Turkey
Recep Artır, Marmara University, Turkey
Semih Özel, Marmara University, Turkey
Sinan Keskin, Marmara University, Turkey
Ümit Arpacıoğlu, Mimar Sinan University of Fine Arts, Turkey

Engineering Approaches on Sustainability (Edited by: Dr. Zehra Semra Can, Dr. Barış Yılmaz, Dr. Seval Genç, Dr. Candeniz Seçkin )
7
LIST OF CONTRIBUTORSThis is a list of those who contributed to Engineering Approaches on Sustainability.
Zehra Semra Can received her BSc degree in Chemistry in 1991 from Marmara University, Turkey. She received her MSc degree in Environmental Sciences from Boğaziçi University, Turkey in 1994. She received a second MSc degree in Environmental Sciences from Drexel University, Philadelphia in 1997, and her PhD degree from the same university in 1999. In 2000, she started teaching at Marmara University, Environmental Engineering Department. During 2004-2005, she taught graduate and undergraduate courses at San Diego State University, Civil and Environmental Engineering Department as a visiting professor. Currently, she carries out her teaching and research activities at Marmara University, Environmental Engineering Department as full professor. Her research interests are oxidation and advanced oxidation techniques, micropollutants and emerging contaminants.
Barış Yılmaz received his Bachelor of Science degree in Nuclear Engineering in 1999 from Hacettepe University, Ankara, Turkey. In the same year, she was recruited to Marmara University, Engineering Faculty, Mechanical Engineering Department as a Research Assistant. He received his Master of Science degree in Mechanical Engineering from Marmara University, Institute of Pure and Applied Sciences in 2002, Istanbul, Turkey. He received his PhD degree from the Université d’Orleans, France and Marmara University, Turkey within the frame of a joint PhD program in 2010. In 2010, he started teaching at Marmara University, Faculty of Engineering, Thermal Sciences Division of Mechanical Engineering Department as an Assistant Professor. Currently, he carries out his teaching and research activities at the same department. His research interests are combustion, computational fluid dynamics, heat transfer, thermodynamics, specifically, design and modeling of refrigeration systems.
Seval Genç is an Assistant Professor in Metallurgical and Materials Engineering in Marmara University. She received her BSc degree in Physics Education from Marmara University. In the same year, she started working as a research assistant in Engineering Faculty, Marmara University. She received her MSc in Physics from Boğaziçi University and earned her PhD degree in Materials Science and Engineering from University of Pittsburgh, USA. Her teaching and research interests are in the area of materials science, biomaterials, magnetic fluids, nanomaterials, magnetic, electrical and optical properties of materials.
Candeniz Seçkin received her Bachelor of Science degree in Mechanical Engineering in 2002 from Istanbul Technical University, Istanbul, Turkey. In 2003, she was recruited to Istanbul Technical University, Energy Institute as a Research Assistant. She received her Master of Science degree in Energy Science and Technology from Istanbul Technical University, Energy Institute in 2006, Istanbul, Turkey. She received her PhD degree from the same university in 2013. She was a visiting researcher in Universita Degli di Roma “La Sapienza”, Mechanical Engineering Department, Rome, Italy between 2010-2012. Currently, she carries out her teaching and research activities at Marmara University, Mechanical Engineering Department as an Assistant Professor. Her research interests are refrigeration systems, solar energy systems, resource accounting in energy generation.
Mahmure Övül Arıoğlu Akan is a lecturer in the Industrial Engineering Department of Marmara University. She holds a BSc. degree in Environmental Engineering from Istanbul Technical University, and MSc. and PhD. degreesin Industrial Engineering from Marmara University. Her main research areas include sustainable supplier selection and evaluation, sustainable supply chain management, corporate sustainability management, social sustainability, renewable energy policies, agent-based service and performance management, and multivariate statistical quality control.
Hasan Arslanoğlu is a Research Assistant in the Department of Chemical Engineering at the University of Fırat where he has been a faculty member since 2010. Throughout the years, during his career, he had the

List of Contributors
8
opportunity to improve himself by participating in various projects. His main fields of interests are sugar technology, removal of heavy metals from waste water, metallurgical waste consideration and hydrometallurgy.
Ahmet Kubilay Atalay is a research assistant and a PhD. student in the Electrical Engineering Department of Istanbul Technical University. He holds a BSc. degree in Electrical Engineering and a MSc. degree in electrical Engineering from Istanbul Technical University. His main research areas include nature inspired algorithms and renewable energy sources.
Fatos Germirli Babuna who has 30 year experience in the field of environmental engineering, received her BSc degree in Chemical Engineering from Bogazici University and her MSc and Doctorate (PhD) degrees in Environmental Engineering, both from Istanbul Technical University (ITU). From 1990 to 1992 she was a Postdoctoral Researcher at ENEA, Bologna, Italy, by the grant received from the Italian Government. Between years 2002-2004, she was the chair of ITU Environmental Engineering Department. In year 1999, she received an incentive award in engineering branch from the Scientific and Technical Research Council of Turkey (TUBITAK). She has published an international book and over 80 scientific papers; her publications have received more than 1200 citations.
Bilsen Beler Baykal is professor at Istanbul Technical University, Department of Environmental Engineering, Turkey. She holds BS and MS degrees in Chemical Engineering from Bogazici University (BU), Turkey, an MSE degree in Environmental Engineering from the University of Michigan Ann Arbor (UM), USA, and a PhD degree in Environmental Engineering from Istanbul Technical University (ITU), Turkey. She was employed by BU as teaching assistant and researcher; by UM as teaching assistant and research assistant; by ITU as research assistant, assistant professor, associate professor, professor, deputy department chair, department chair and graduate program coordinator. She was Visiting Professor at Technical University of Hamburg-Harburg, Germany for three years. Her research interests include segregated streams/ECOSAN, nutrient removal/recovery, adsorption/ion exchange, natural zeolites in Environmental Engineering.
Alev Akpinar Borazan is an assistant professor at Chemical and Process Engineering department at Bilecik Seyh Edebali University. She was graduated from Food Engineering Department, Hacettepe University (1984-1989). She worked at Bilecik Vocational High School of Anadolu University as an instructor from 1990 to 2007. She received her PhD and MSc in Chemical Engineering from Anadolu University in 1999 and 2008, respectively. Her research focuses on solid waste management and food processing. Research of solid waste management includes recovery of the waste from forest and agricultural/ industrial production by manufacturing polyester composite. Research of Food processing interest includes drying and fermentation, and processing effect on the antioxidant.
Nurdan Cömert graduated from Mustafa Kemal University, Faculty of Marine Sciences and Technology, Department of Aquaculture Engineering in 2014. Her graduation thesis was on fish oils and ingredients sold in the market. She is currently pursuing her master's degree in Department of Fisheries Technology, in Fisheries and Seafood Processing Technology Division, Faculty of Fisheries, at Istanbul University. Her master's thesis is about by-catch and discard fisheries in deep water trawl fisheries in Turkey. Her main fields of interest are fisheries, fisheries technologies, sustainable marine ecology and fish nets.
Tomris Deniz graduated from Faculty of Fisheries, Istanbul University in 1988. She received her MSc (1991) and PhD (1996) in Fisheries Technology from Istanbul University. She is an Associate Professor and a lecturer in the Department of Fisheries Technology, in Fisheries and Seafood Processing Technology Division, Faculty of Fisheries, at Istanbul University. Her main fields of interests are fisheries, fisheries management, fishing gears, fisheries technology and fish biology. She has more than 50 international and national publications on her research area.
Nasuh Erdönmez was born in Eskişehir in 1988. He received his Bachelor of Science degree from Marmara University, Faculty of Engineering, Department of Mechanical Engineering in 2012. At the same year, he started his Master of Science in Mechanical Engineering in Marmara University, Institute of Pure and Applied Sciences. He received his Master of Science degree in 2016 with the thesis entitled “Development
Engineering Approaches on Sustainability (Edited by: Dr. Zehra Semra Can, Dr. Barış Yılmaz, Dr. Seval Genç, Dr. Candeniz Seçkin )
9
and Experimental Validation of a Numerical Model for a Corbon-Dioxide Cascade Refrigeration System” under co-supervision of Dr. Barış YILMAZ and Dr. Ebru Mançuhan. He is working at Ministry of Finance as an Assistant Tax Inspector since 2015.
Duygu Gökdai is a research assistant in department of Chemical and Process Engineering at Bilecik Seyh Edebali University since 2013. In 2011 she was graduated from Gazi University as a chemical engineer and she started to work at Ankara University as a project specialist. In 2014 she got her master degree from Ankara University in field of Chemical Engineering. She is doing her PhD on boron doped thin films. In general her research interests are boron compounds, high tech boron products, composite materials and thin films.
Didem Göktürk received her B.S. degree from Istanbul University, Faculty of Fisheries in Department of Basic Sciences in 2001. She has also associate degree from Marmara University, Department of Aquatic Products (1997) and Department of Laboratory and Veterinary Assistance Services, Anadolu University (2012). She earned her M.Sc. (2005) in Department of Marine Biology and Ph.D. degrees (2012) in Fisheries Technology from Istanbul University. She has been working as a research assistant for the Department of Fisheries Technology, Faculty of Fisheries in Istanbul University since 2005. She has also PADI Dive Master Certificate (Professional Association of Diving Instructors, 2009, UK). Her research interest is mainly concentrated on fisheries, fisheries management, fisheries biology, marine biodiversity and marine ecology.
Belgin Karabacakoğlu is an associate professor in the Department of Chemical Engineering at the University of Eskişehir Osmangazi. She graduated from Anadolu University and received her PhD from Eskişehir Osmangazi University. Her research interests are electrochemical treatment methods, membrane processes such as electrodialysis and adsorption. She has 8 SCI papers related to research interest, and she has presented many papers in national and international congresses. She was also involved in several national research projects.
Çağlar Kullu is a master student at Marmara University Environmental Engineering Department. In 2010, he graduated from Kocaeli University Faculty of Arts and Sciences Chemistry Department, Kocaeli, Turkey and received a Bachelor’s degree in Chemistry. Kullu has worked in different jobs for a while after graduation. In 2014 he has decided to study in environmental engineering and his application to master degree for Environmental Engineering in Marmara University was accepted in that year. Kullu is now about to finish his master degree at Marmara University, Environmental Engineering Department. His current research interests are sustainable waste management and membrane applications in biosystems for material recovery. He may be contacted at [email protected].
Ergin Kükrer is a Turkish researcher in environmental and engineering sciences. Kükrer obtained his MSc. in Mechanical Engineering from Istanbul Technical University (ITU) and currently continues his PhD. in Mechanical Engineering Department of ITU. His main fields of interest are integration of renewable energy, sustainability, design of HVAC systems and thermal comfort. At present, he works for ITU Energy Institute, Dr. Sözer’s Research Group as a project supported research assistant in R2CITIES, a large-scale research project funded by the EU 7th Framework Program which aims to develop and demonstrate replicable strategies in district for designing nearly zero energy cities.
Ebru Mançuhan received her Bachelor of Science degree in Mechanical Engineering in 1981 from Uludağ University, Bursa, Turkey. She received her Master of Science degree in Mechanical Engineering from the same department in 1985. She received her PhD degree from Yıldız Technical University, Department of Mechanical Engineering in 1997. Between 2000 and 2013, she has taught at Marmara University, Mechanical Engineering Department as an Assistant Professor. In 2013, she became an associate professor. She started teaching in Chemical Engineering Department of Marmara University. Currently, she carries out her teaching and research activities at the same department. Her research interests are thermodynamics, heat transfer, energy analysis of drying systems and design and modeling of HVAC systems.
Yavuz Özçelik is a Professor in chemical engineering at the Ege University. He has worked on the design, modeling and optimisation of chemical processes and development of the solution algorithms of nonlinear

List of Contributors
10
and mixed integer nonlinear programming problems. Professor ÖZÇELİK earned an MS and a PhD degree in chemical engineering from Ege University and undergraduate degree in chemical engineering from the Middle East Technical University.
Zehra Özçelik is an Associate Professor of Chemical Engineering Department in Ege University. She earned her BS degree from the Middle East Technical University and her MSc and PhD degrees from Ege University, both in chemical engineering. She works on energy integration, heat integrated distillation columns, computer-aided chemical engineering design, modeling and simulation, energy-exergy and thermoeconomic analysis and optimization of chemical processes. Renowned for her pioneering works in the area of sustainable energy technologies, she has authored and co-authored many papers, refereed journal and conference papers, and technical reports.
Sinem Aksit Sahinkaya is an Environmental Engineer with MSc Degree from Istanbul Technical University (ITU), Turkey. She earned her graduate degrees from the Dual Degree Program of Environmental Engineering at ITU and University at Buffalo (UB), USA (2011). Her work focuses specifically on environmental sustainability and impacts of carbon emissions. She published and presented multiple academic papers in respected international journals and conferences. Besides her academic studies, she has 5 years of professional experience in industry. Sinem who was an organizational director of ITU Solar Car Team, achieved several awards from various races as a team (2007-2009). She is also trained in Classical Music and Opera as an Opera Singer.
Ayşe Ayçim Selam is a lecturer in the Industrial Engineering Department of Marmara University. She holds a BSc. degree in Mechanical Engineering, and a MSc. in Engineering Management from Istanbul Technical University, and a PhD. degree in Industrial Engineering from Marmara University. Her main research areas include sustainable project management, renewable energy, sustainable energy, bee colony optimization and project scheduling.
Mustafa Kemal Sevindir received his Bachelor of Science degree in Mechanical Engineering in 1996 from Yıldız Technical University, Istanbul, Turkey. He received his Master of Science degree in Mechanical Engineering from Yıldız Technical University, Institute of Pure and Applied Sciences in 1999. He received his PhD degree from Yıldız Technical University, Department of Mechanical Engineering in 2007. He has started to work at Yıldız Technical University, Mechanical Engineering Department as a Research Assistant since 1996. Currently, she carries out his teaching and research activities at the same department. His research interests are thermodynamics, heat transfer, design and calculations of HVAC systems.
Hatice Sözer is a licensed architect and Associate Professor at the Energy Institute of Istanbul Technical University, Turkey. While attaining her degrees, she held the distinction of full scholar and research fellow, sponsored by the Higher Educational Council in Turkey. She received her Doctoral degree in Illinois Institute of Technology and her Master of Architecture degree in University of Colorado. During her Ph.D. studies, which focused on “Identification of Barriers to the Building Integrated Photovoltaic Design Process as Applied to Curtain Wall”, she worked with pioneer architects and engineers on various tall building projects. After graduation, she taught at the Illinois Institute of Technology for over two years with involvement in Ph. D. research activities, projects, and courses. She was an invited researcher at ICARE-CNRS, France between 2008-2009 to develop strategies for sustainable energy management, as well as for improving the energy efficiency of large scale buildings. Recently she has two big scale projects supported by European Union under the FP7.
Recep Önder Sürmeli started his academic career in Environmental Engineering department of Bartın University as a research assistant in 2013. In the meanwhile, he became a MSC student in Marmara University, Environmental Engineering Department. Currently, he is a research assistant in the department of Environmental Engineering of Marmara University since 2014. He received his MSc degree in 2016 and then he started his PhD in the same department. His main fields of interest are solid waste management, anaerobic digestion, composting and vermicomposting, rainwater harvesting, waste recycle and recovery applications and renewable energy technologies.
Engineering Approaches on Sustainability (Edited by: Dr. Zehra Semra Can, Dr. Barış Yılmaz, Dr. Seval Genç, Dr. Candeniz Seçkin )
11
Hatice Taner works as a project assistant at Turkish Water Institute (SUEN). She was awarded from a Bachelor’s degree (2012) and a Master of Science degree (2016) in Environmental Engineering from Marmara University, Istanbul, Turkey. Her current research interests are river basin management and sustainable water management. She may be contacted at [email protected].
A. Evren Tugtas received a Bachelor’s degree in Environmental Engineering from Marmara University in 2001, where she graduated ranking highest in her class. She earned her MS and PhD degrees in Environmental Engineering from Georgia Institute of Technology in 2005 and 2007, respectively. After working in a research institute and a university for two years in Turkey, she worked at the Advanced Water Management Centre at the University of Queensland, Australia for a year. She is currently an associate professor at Marmara University Environmental Engineering Department. Her current research interests are anaerobic digestion, material recovery, and membrane applications. She may be contacted at [email protected]
Nazlı Yaşar Tunca earned her BS degree University and her MSc degree from Ege University, Chemical Engineering Department. She studied on Modelling, Simulation and Optimization of Solar Assisted Absorption Cooling Systems. She visited Universidad Rovira I Virgili, Tarragona as an Erasmus Exchange Student for 3 months to carry out the GAMS modeling program. She worked in an automotive supplier companies as laboratory engineer.
Tanay Sıdkı Uyar is Professor of Renewable Energy, Energy Section Head, Marmara University BSc EE, MSc NE, PhD ME, Member of Board of Directors, International Center of Sustainability of Marmara University; Vice President, WWEA (World Wind Energy Association); Vice President, EUROSOLAR (European Association for Renewable Energies); Vice President, WBA (World Bioenergy Association); Member, Committee of Chairpersons, WCRE (World Council for Renewable Energy); Ambassador, Global Campaign on 100 % Renewable Energy; President, EUROSOLAR Turkey (Renewable Energy Association of Turkey); President, BİYODER (Bioenergy Association of Turkey); President, KADOS (Kadıköyü Friends of Science, Culture and Art Association); Coordinator, TÜRÇEP (Environmental NGOs Platform of Turkey); Coordinator, TEP (Clean Energy Platform of Turkey); Founding Member, Turkish Wind Energy Association and Solar Energy Society of Turkey.
Duygu Yamaç was born in Istanbul in 1988. After finishing primary education in Istanbul, she completed her high school education in Eskişehir. In 2006, she entered Mining Engineering at the Eskişehir Osmangazi University. She also did a double major in Chemical Engineering. She graduated from both departments in 2012. In the same year, she worked for 1 year at the completion of the Lifetime Electrical Electronic Waste Recycling facility. During this period, she also completed Success Psychology training. She finished her Master's degree in 2016 with her dissertation titled "Electrochemical Methods of Textile Dyes From Aqueous Solutions with Removal".
Ali Yaraş gained his BS and MS in Chemical Engineering from Firat University, Elazıg, Turkey in 2007 and 2010, respectively. In 2016, he received his Ph.D. degree in Chemical Engineering from Gazi University, Turkey. During his Ph.D. studies, he worked on topics of boron technology and flame retardant cellulosic materials. Now, he is serving as Associate Professor in Department of Metallurgy and Material Engineering in Bartin University, Turkey. His main fields of interest are adsorption, hydrometallurgy, boron compounds, cellulosic materials and industrial wastes. He published a lot of international journal papers and presented international conference papers and received second prize in Masters and Ph.D. thesis applicable to industry category in 2012 by UTİB.
Hatice Yesil works as a research assistant at Marmara University Environmental Engineering Department. In 2011, she graduated ranking highest in her class from Marmara University, Istanbul, Turkey where she received a Bachelor’s degree in Environmental Engineering. Yesil was awarded a Master of Science degree (2013) in Environmental Engineering from Marmara University, Istanbul, Turkey. She is still a PhD student at Marmara University, Environmental Engineering Department. Her current research interests are sustainable waste management and membrane applications in biosystems for material recovery. She may be contacted at [email protected] or [email protected]

List of Contributors
12
Deniz Yılmaz received her Bachelor of Science degree in Mechanical Engineering in 2000 from Kocaeli University, Faculty of Engineering, Turkey. She received her Master of Science degree in Mechanical Engineering from Yıldız Technical University, Institute of Pure and Applied Sciences in 2003, Istanbul, Turkey. She received her PhD degree from İstanbul Technical University, Department of Mechanical Engineering in 2011. At the same year, she started teaching at Arel University, Mechanical Engineering Department as a Research Assistant. In 2012, she appointed as an Assistant Professor at the same department. Meanwhile, she has started work in FrigoBlock Soğutma Sistemleri A.Ş. company as R&D Manager. Her research interests are thermodynamics, heat transfer, design and experimentation of HVAC systems.

Engineering Approaches on Sustainability (Edited by: Dr. Zehra Semra Can, Dr. Barış Yılmaz, Dr. Seval Genç, Dr. Candeniz Seçkin )
13
Introduction Engineering Approaches on Sustainability Zehra Semra Can Barış Yılmaz Seval Genç Candeniz Seçkin
ustainability undoubtedly is among the most critical challenges that our modern world faces today. Being aware of this fact, Marmara University International Center of Sustainability (ICS) organized an international congress between 1-3 December 2016 in İstanbul, Turkey, in order to facilitate expert
discussions about recent innovations in sustainability. The main themes of the discussions were environmental, economic and social sustainability with a focus on recent innovations in these areas.
This book is prepared to present you with the selected topics of engineering approaches addressed during the congress. Each chapter in the book is dedicated to one selected engineering article. All chapters are peer-reviewed by both the editors and at least two independent scholars from fields relevant to the manuscript's subject area.
The issues discussed in each chapter deals with a different aspect of environmental sustainability. Here in this book you will find topics mainly related to
I. renewable community power which allows communities to develop, deliver and benefit from sustainable energy,
II. other sustainable energy aspects such as; gaining energy from waste, more efficient energy consumption, energy efficient buildings, and eco-friendly, energy efficient refrigeration systems,
III. sustainable environmental engineering practices such as; using waste to treat wastewater, separation of valuable materials from wastewater, innovative water and wastewater treatment techniques,
IV. sustainable production of raw materials from waste to reduce and manage solid waste
V. environmentally sustainable management systems such as; innovative domestic wastewater management via segregated streams, rainwater harvesting, and more specific management systems such as airport deicer management, and fisheries management.
We would like to express our sincere thanks to all our contributors for their support. Without their contributions, the publication of this book would not have been possible.
December 2016
S


Engineering Approaches on Sustainability (Edited by: Dr. Zehra Semra Can, Dr. Barış Yılmaz, Dr. Seval Genç, Dr. Candeniz Seçkin )
15
1
Solution in Energy: Energy End-Use Efficiency Based 100% Renewable Community Power Tanay Sıdkı Uyar
Abstract
Solution in Energy is energy end use efficiency as a priority with which the size of the problem can be reduced. Countries with lower environmental standards have been a destination for the inefficient and polluting end-use technologies that are cast off, with the support of export credits, from more industrialized countries. Countries highly dependent on fossil fuels are in a position to face a heavy burden on their state budgets. The solution is to promote energy end-use efficiency by using the best available technologies and supply all of the energy needed with renewable energy, supported by renewable energy storage and smart grid technologies. Keywords: Community Power, Energy End-Use Efficiency, 100% Renewable Energy,
Introduction
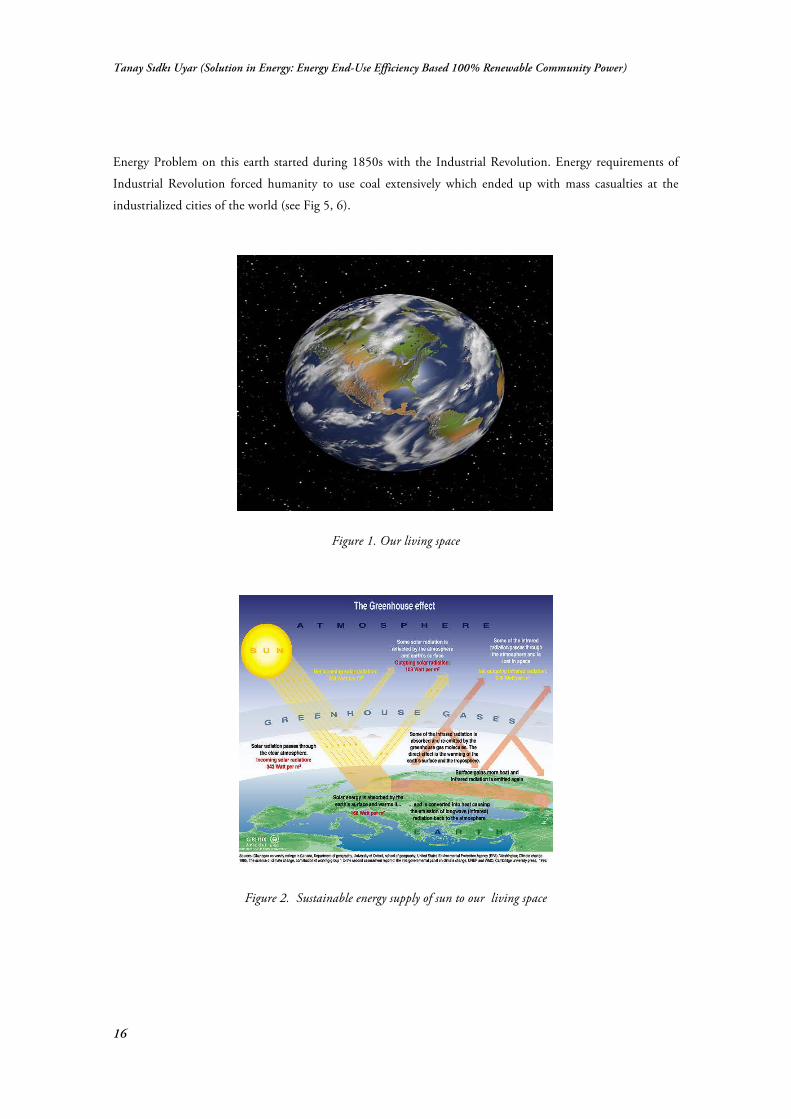
uman beings must come to a consensus regarding the sun’s role in providing a living space for
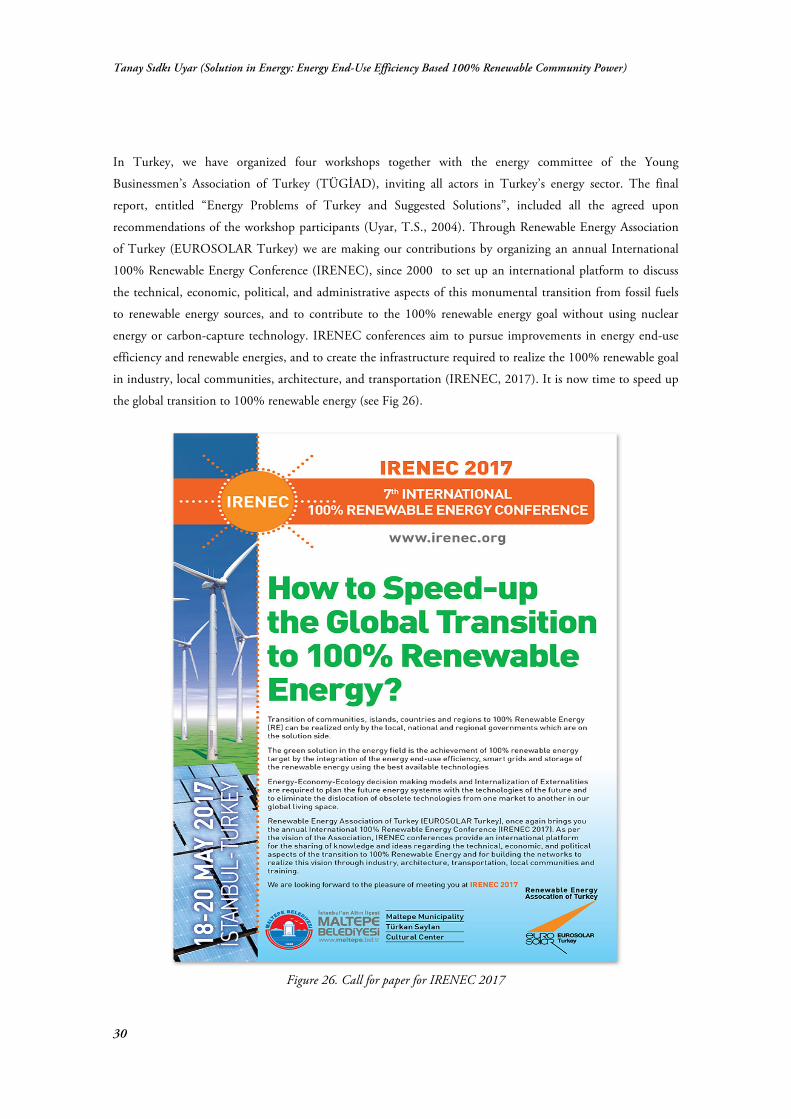
human beings on earth (see Fig 1). The world is like a cell surrounded by a blanket of greenhouse
gases that give it an atmosphere with an average temperature of 16°C, in the middle of a space
with an average temperature of -60°C (see Fig 2). Considering its natural solar, wind and biomass potential,
world definitely has more renewable energy resources annually than the total fossil and uranium resources (see
Fig 3, 4).
H
Tanay Sıdkı Uyar (Solution in Energy: Energy End-Use Efficiency Based 100% Renewable Community Power)
16
Energy Problem on this earth started during 1850s with the Industrial Revolution. Energy requirements of
Industrial Revolution forced humanity to use coal extensively which ended up with mass casualties at the
industrialized cities of the world (see Fig 5, 6).
Figure 1. Our living space
Figure 2. Sustainable energy supply of sun to our living space

Engineering Approaches on Sustainability (Edited by: Dr. Zehra Semra Can, Dr. Barış Yılmaz, Dr. Seval Genç, Dr. Candeniz Seçkin )
17
Figure 3. Comparison of total energy consumption on earth with the annual renewable energy resources, fossil and
nuclear fuel reserves.
6
Figure 4. Renewable resources were available before, are available today and will be available in the future
Humanity has witnessed the death of about 4500 individuals as a result of the London Fog in 1952 due to
the extensive coal combustion in London (Pojer, Susan M., 2017) (see Fig 7, 8). As a solution petroleum
became popular and all the policies were adjusted accordingly to control the countries with petroleum
resources. OECD countries using petroleum tried to control petroleum trade to protect themselves from the
OPEC countries. With the petroleum crisis nature forced human beings to save energy without any other

Tanay Sıdkı Uyar (Solution in Energy: Energy End-Use Efficiency Based 100% Renewable Community Power)
18
alternative available. IEA was established by OPEC countries to monitor politically the fight against OPEC
countries.
By: Ms. Susan M. PojerHorace Greeley HS Chappaqua, NY
1800 1 ton of coal 50, 000 miners
1850 30 tons 200, 000 miners
1880 300 million tons 500, 000 miners
1914 250 million tons 1, 200, 000 miners
Coal Mining in Britain:1800-1914
Indus trial Staffords hire
The New Indus trial City
Fig. 5, 6, 7, 8: The polluted cities of UK as a result of coal combustion to supply energy
need of the industrial revolution
Meanwhile the technology of nuclear weapon production facilities so called nuclear reactors were invented,
designed and manufactured to dominate the world by super powers of the world between 1950s and 1970s.
Petroleum crisis and commercially unavailable renewable energy technologies of today helped the owners of
the nuclear weapon material producing nuclear reactors to convince the decision makers of that time to invest
on nuclear power plants to use the waste heat produced during the process for solving the energy problems of
the world. We have witnessed the construction of almost all of the nuclear reactors between 1973 and 1978.
After 1978 OECD countries who have practiced that the nuclear option is not working effectively, initiated
technology agreements between Energy Ministries of OECD countries to develop safe nuclear, clean coal and
renewable energy technologies. They have also initiated Technology Agreements on energy end use efficiency
and local and national decision support tool development such as ETSAP (Energy Technology Systems
Analysis Program).

Engineering Approaches on Sustainability (Edited by: Dr. Zehra Semra Can, Dr. Barış Yılmaz, Dr. Seval Genç, Dr. Candeniz Seçkin )
19
To justify benefits of energy end use efficiency and renewable energy utilization and to demonstrate the
environmental and health effects of conventional energy production and consumption on agricultural
products, forests and human health became a topic to be investigated by environmental economists.
The externalities of energy consumption and production were not internalized globally. European countries
beginning with Olaf Hohmeyer in Germany and David Pearce in UK initialized the social costs calculations
in 1993 with EXTERNE project.
With the UNFCCC (United Nations Framework for Climate Change Convention) in 1994 signed with
sufficient number of countries, fossil fuel combustion even with clean coal technologies became obsolete. Safe
nuclear did not convince anybody on earth after Chernobyl and Fukushima nuclear accidents.
Decommissioning time of the existing nuclear reactors arrived and now we understand that cradle to grave
costs of nuclear power plants are too high to afford for any country on earth. We have started to hear that
Global Nuclear Energy Partnership was designed by nuclear powers to shift some of the nuclear waste
recycling and storage facilities to countries who are willing to host nuclear facilities in their countries. We
have heard that 4th International Nuclear Decommissioning and Nuclear Waste Management Conference will
take place in UK on 1 March 2017.
Problem
We know that up until the 1850s, human activities were carried out in substantial harmony with nature. The
local damage caused by human activities was rarely irreparable and did not overstep the limits of the natural
carrying capacity. Beginning in the 1850s, rising energy demand driven by the industrial revolution forced
humanity to start consuming more fossil fuels. During the 1950s, thousands of people died from respiratory
problems due to coal burning in the big cities of the world. As a result, “clean coal technologies” were devised
to prevent such deaths. Burning coal with fewer externalities became one of the options for the future of the
energy industry. After the Rio Conference in 1992, when it was acknowledged that the real threat to the
atmosphere is the global warming caused by fossil fuel combustion, the arguments for clean coal combustion
became obsolete.
According to Sierra Club,”the 100000-MW milestone was surpassed when Houston-
based Dynegy announced it will retire 1877 MW of coal-fired power assets, phasing out Units 1 and 3 at its
Baldwin Power Station and Unit 2 at its Newton Power Station, both in Illinois.”(Power-Eng., 2017) Nick
Engelfried from greenanswers.com reported that a new coal power plant near Purdue University, canceled in
February 2011 and presented in Table 1, “was the 150th new coal plant to be cancelled since then-Vice
President Dick Cheney unrolled plans to build a new fleet of coal-fired power plants in 2001.” (Engelfried,
Nick, 2017) The Chinese authorities have halted construction on 30 large coal-fired power plants with a
combined capacity of 17 GW (see Fig 9).(Cleantechnica, 2017)

Tanay Sıdkı Uyar (Solution in Energy: Energy End-Use Efficiency Based 100% Renewable Community Power)
20
Fig. 9: Scaled down coal power bases and stopped coal power projects in China
The global coal boom has started to slow, a new report says, as more plans for new power plants are now
being shelved than completed (Carbonbrief, 2017).
Table 1. Proposed global coal-fired generating capacity 2014 by region (megawatts).
Region Halted (Shelved or Cancelled) Completed
Ratio of Halted to Completed
East Asia 194 625 227 650 1:1 South Asia 313 420 80 340 4:1 Europe/Turkey 96 600 14 599 7:1 United Stated and Canada 23 653 14 677 2:1 Southeast Asia 22 260 13 701 2:1 Latin America 17 890 4 016 4:1 Other 41 504 1 883 22:1
World Total 709 952 356 866 2:1 Source: Global Coal Plant Tracker, January 2015
The 1970 petroleum crisis convinced the energy decision-makers that dependence on petroleum is not a wise
energy strategy. The first solution that human beings naturally adopted under those circumstances was using
less energy than before. Countries that learned from this have initiated energy end-use efficiency programs,
which ended up generating some of today’s best available technologies. They consume ten times less energy
than technologies of the 1970s, but provide the same transportation, industrial, and residential services. In

Engineering Approaches on Sustainability (Edited by: Dr. Zehra Semra Can, Dr. Barış Yılmaz, Dr. Seval Genç, Dr. Candeniz Seçkin )
21
1973, the decision-makers were convinced that the waste heat from nuclear weapon production facilities
could be a way to supply the total energy requirements of the world. The majority of the existing nuclear
power plants were built during this period. After the Three Mile Island nuclear disaster in 1978, the United
States was the first country where plans to build new nuclear power plants were stopped. Approximately 100
nuclear power plants that had been ordered between 1973 and 1978 were also canceled. The main argument
behind these actions was explained by Mark Halt: “No nuclear power plants have been ordered in the United
States since 1978, and more than 100 reactors have been canceled, including all ordered after 1973. The most
recent U.S. nuclear unit to be completed was TVA’s Watts Bar 1 reactor, ordered in 1970 and licensed to
operate in 1996. Reasons for the 30-year halt in U.S. nuclear plant orders include high capital costs, public
concern about nuclear safety and waste disposal, and regulatory compliance costs.” (Holt, M., 2009)
Steps taken Towards the Solution
Beginning in the 1970s, the OECD countries started trying to define the energy problem and find feasible
solutions to it. In 1974, to counter the Organization of the Petroleum Exporting Countries (OPEC), OECD
countries established the International Energy Agency (IEA) as a political union of rich countries that would
take measures such as ensuring a mandatory three-month store of petroleum in each country. The IEA
decided also to initiate 40 multilateral technology initiatives (Implementing Agreements) for facilitating
energy technology cooperation between the scientists and researchers of OECD countries. (Implementing
Agreements on technologies such as bio-energy, geothermal energy, photovoltaic power systems, renewable
energy technology deployment, solar heating, and cooling and wind energy systems contributed a lot to the
research, development, and commercialization of renewable energy technologies. (IEA, 2017)
Figure 10. Targets of Germany for 100% renewable energy usage by 2050

Tanay Sıdkı Uyar (Solution in Energy: Energy End-Use Efficiency Based 100% Renewable Community Power)
22
A typical plan from H. Lehmann, Wuppertal Institute for climate environment and energy published by
Bundesverband Windenergie e.V., Germany targeting 100% renewable energy usage by 2050 and energy
demand decrease targeted in different sectors can be seen in the figures below (see Fig 10, 11).
Energy Demand in diff. sectors
Germany 2008 and 2050898
557
974
135
35% 22% 38% 5%0
100
200
300
400
500
600
700
800
900
1000
TWh
76
427
667
106
6% 33% 52% 8%0
100
200
300
400
500
600
700
800
900
1000
TWh
2008 2050
Figure 11. Energy demand decrease targets in different sectors of Germany
Figure 12. Wind turbine technology development

Engineering Approaches on Sustainability (Edited by: Dr. Zehra Semra Can, Dr. Barış Yılmaz, Dr. Seval Genç, Dr. Candeniz Seçkin )
23
Technological research and development efforts accelerated after 1980 in industrialized countries, expediting
the development of renewable energy technologies. Supporting wind power with tax credits contributed
greatly to the establishment of a market for wind turbines in the U.S. After 1996, we saw Germany and the
European Union give huge support to megawatt-scale wind turbine commercialization. Today, we know of
10MW prototype production efforts in the U.S. (Next Big Future, 2017) (see Fig 12).
The European Union, making use of the existing experience of Denmark and Netherlands on renewable
energy, has followed Germany. In March 2007, the EU’s leaders endorsed an integrated climate and energy
policy that aims to combat climate change and increase the EU’s energy security while strengthening its
competitiveness. They committed Europe to transforming itself into a highly energy-efficient, low carbon
economy. To kick-start this process, the EU heads of state and government set a series of demanding climate
and energy targets to be met by 2020, known as the “20-20-20” targets (EC Europa, 2017). These are: 1. A
reduction in EU greenhouse-gas emissions of at least 20% below 1990 levels 2. 20% of EU energy
consumption to come from renewable resources 3. A 20% reduction in primary energy use compared with
projected levels, to be achieved by improving energy efficiency. The targets for 2030 is more improved up to
40%, 27% and 27 % respectively (see Fig 13). An important result of this development was the 8.1 million
people working in the renewable energy industry globally at the end of 2015 (see Fig 14).
Figure 13. EU 2030 framework for climate and energy

Tanay Sıdkı Uyar (Solution in Energy: Energy End-Use Efficiency Based 100% Renewable Community Power)
24
Figure 14. Global jobs in renewable energy
Wind power global capacity has reached to 433 GW with leading countries as China, USA, Germany and
India at the end of 2015. Solar PV global capacity has reached to 227 with leading countries as China,
Germany, Japan and USA at the end of 2015 (see Fig 15, 16, 17, 18).
Figure 15, 16. Wind power and solar PV global capacity and annual additions (2005-2015)

Engineering Approaches on Sustainability (Edited by: Dr. Zehra Semra Can, Dr. Barış Yılmaz, Dr. Seval Genç, Dr. Candeniz Seçkin )
25
Figure 17, 18. Wind power an solar PV capacity and additions top 10 countries 2015
Today coal is becoming more cheap and readily available in the market as the local and global externalities of
coal burning in the atmosphere become more apparent (see Fig 19).
Figure 19. Bench mark thermal coal prices
Investments in newer, renewable technologies tend to stop large-scale projects and promote decentralized
alternatives. This contradicts the marketing bias toward large-scale projects. To justify the necessity of large-
scale projects, the implementation of energy end-use efficiency and renewable energy technologies is
consistently delayed. The existing distribution networks are designed for large-scale, centralized power plants.
The main barrier to the full implementation of renewable energy technologies in many countries is the
unwillingness of the energy transmission authority to redesign the grid so that it can accept more of the

Tanay Sıdkı Uyar (Solution in Energy: Energy End-Use Efficiency Based 100% Renewable Community Power)
26
decentralized energy produced. Long-term estimates for the energy mix of the world demonstrate that
renewable energy utilization is inevitable, as shown in the figure below (see Fig 20). The question today is,
which countries will be in which part of the picture. Department of Energy in USA declared that renewable
energy revolution started (see Fig 21).
Figure 20. Changes in the global energy mix to 2100

Engineering Approaches on Sustainability (Edited by: Dr. Zehra Semra Can, Dr. Barış Yılmaz, Dr. Seval Genç, Dr. Candeniz Seçkin )
27
Figure 21. Revolution Now: Accelerating clean energy deployment at USA
The decrease in on shore wind levelised cost ($/MWh) and solar pv module cost ($/W) can be seen from
wind and solar experience curves given in figure 22.

Tanay Sıdkı Uyar (Solution in Energy: Energy End-Use Efficiency Based 100% Renewable Community Power)
28
Figure 22. Wind and Solar experience curves
Danish renewable energy developer Pure & Better Energy awarded 20 MW of solar PV capacity in latest
cross-border auction for cost of DKK 12.89/MWh (PV Magazine, 2017) (see Fig 23) IRENA study shows
globally prices of utility –scale solar PV in key markets.
Figure 23. Prices of utility-scale solar PV in key markets

Engineering Approaches on Sustainability (Edited by: Dr. Zehra Semra Can, Dr. Barış Yılmaz, Dr. Seval Genç, Dr. Candeniz Seçkin )
29
Solar farm costs are shrinking and solar and wind generated electricity is becoming the cheapest electricity on
earth in 10 years (see Fig 24, 25).
Figure 24. Solar farm cost according to years
Figure 25. Predicted prices for solar, wind, CCGT and coal
Tanay Sıdkı Uyar (Solution in Energy: Energy End-Use Efficiency Based 100% Renewable Community Power)
30
In Turkey, we have organized four workshops together with the energy committee of the Young
Businessmen’s Association of Turkey (TÜGİAD), inviting all actors in Turkey’s energy sector. The final
report, entitled “Energy Problems of Turkey and Suggested Solutions”, included all the agreed upon
recommendations of the workshop participants (Uyar, T.S., 2004). Through Renewable Energy Association
of Turkey (EUROSOLAR Turkey) we are making our contributions by organizing an annual International
100% Renewable Energy Conference (IRENEC), since 2000 to set up an international platform to discuss
the technical, economic, political, and administrative aspects of this monumental transition from fossil fuels
to renewable energy sources, and to contribute to the 100% renewable energy goal without using nuclear
energy or carbon-capture technology. IRENEC conferences aim to pursue improvements in energy end-use
efficiency and renewable energies, and to create the infrastructure required to realize the 100% renewable goal
in industry, local communities, architecture, and transportation (IRENEC, 2017). It is now time to speed up
the global transition to 100% renewable energy (see Fig 26).
Figure 26. Call for paper for IRENEC 2017

Engineering Approaches on Sustainability (Edited by: Dr. Zehra Semra Can, Dr. Barış Yılmaz, Dr. Seval Genç, Dr. Candeniz Seçkin )
31
References
Carbonbrief, (2017), Accessed Jan 6, 2017, from: https://www.carbonbrief.org/more-coal-plants-are-being-cancelled-than-built
Cleantechnica, Accessed Jan 6, 2017, from: https://cleantechnica.com/2016/10/25/china-halts-construction-17-gw-coal-fired-plants/
EC Europa, (2017), Accessed from: http://ec.europa.eu/clima/policies/package/index_en.htm Engelfried, Nick. 150th New Coal Plant Cancelled in US., August 2, 2011, from:
http://greenanswers.com/news/219859/150th-new-coal-plant-cancelled-us Holt, M., “RL33558 CRS Report for Congress, Prepared for Members and Committees of Congress.” Nuclear Energy
Policy, Congressional Research Service 7-5700, December 10, 2009, Accessed from: www.crs.gov IEA, International Energy Agency, (2017), Accessed Jan 7, 2017, from: http://www.iea.org/techno /index.asp (IRENEC) International Renewable Energy Conference, (2017), Accessed from: www.irenec.org Next Big Future, (2017), Accessed from: http://www.nextbigfuture.com/2011/04/20-megawatt-wind-turbine-designs-
based.html Power-Eng, (2017), Accessed Jan 5, 2017, from: http://www.power-eng.com/articles/2016/05/sierra-club-more-than-
100-000-mw-of-coal-power-retired-since-2010.html PV Magazine, (2017), Accessed from: https://www.pv-magazine.com/2016/12/28/danish-solar-auction-delivers-
european-low-cost-of-us-1-81-centskwh/ Susan M. Pojer. Industrial Revolution, (2017), Accessed Jan 5, 2017, from: http://www.pptpalooza.net/PPTs
/EHAP/Industrialization.ppt Uyar, T.S.. Energy Problems and Solution Suggestions for Turkey, Ajans-Türk Basım ve Basım A.Ş., January 2003.
TÜGİAD 2004.


Engineering Approaches on Sustainability (Edited by: Dr. Zehra Semra Can, Dr. Barış Yılmaz, Dr. Seval Genç, Dr. Candeniz Seçkin )
33
2 Prediction of Renewable Energy Consumption in Turkey Using Artificial Neural Networks
Ayşe Ayçim Selam Ahmet Kubilay Atalay M. Övül Arıoğlu Akan
Abstract
Due to the concern for sustainability, renewable energy sources have become the fastest growing source of world energy. Turkey, as a developing country which imports over 70% of its primary energy supply, is in the middle of different climates enabling the use of a variety of these sources. Therefore, the government provides support tools, including fiscal incentives and public finances to promote wide use of renewable energy. The development of effective renewable energy policies requires reliable consumption data. In this paper, renewable energy consumption in Turkey is predicted using Artificial Neural Networks. The renewable energy indicators (some of which are total primary energy supply, electricity consumption, electricity production, energy imports, gross domestic product, population etc.) are evaluated as independent variables using historical data from 1990 to 2012. The results indicate that Artificial Neural Networks is a powerful technique in energy demand forecasting as stated by similar studies in the literature.
Keywords: Renewable energy, Renewable energy consumption, Prediction, Artificial neural networks

Ayşe Ayçim Selam, Ahmet Kubilay Atalay, M. Övül Arıoğlu Akan (Prediction of Renewable Energy Consumption in Turkey Using Artificial Neural Networks)
34
Introduction
enewables, excluding large hydro, accounted for 9.1% of world electricity generation in 2014, up
from 8.5% in 2013, with a corresponding increase of 17% in global investment ($270.2 billion
invested in 2014 in renewable power and fuels excluding large hydro-electric projects)(McCrone,
2015). They have become the fastest growing source of world energy with their share of electric power
generation increasing from 10%–15% in 2010, while the fossil fuel sources grew 3% or 4% (EIA, 2012). The
reason behind this is the concern for sustainability resulting from factors, including but not limited to, the
depletion of natural resources, life-threatening levels of pollution, global warming, climate change and the
ever-increasing worldwide energy consumption (Komor & Bazilian, 2005; Apergis & Payne, 2010).
The Renewable Energy Working Party of the International Energy Agency (IEA) defines renewable energy as
follows: “Renewable Energy is derived from natural processes that are replenished constantly. In its various
forms, it derives directly or indirectly from the sun, or from heat generated deep within the earth. Included in
the definition is energy generated from solar, wind, biofuels, geothermal, hydropower and ocean resources,
and biofuels and hydrogen derived from renewable resources” (IEA, 2013a).
In line with the above definition, renewable energy sources can be classified under the following categories
(IEA, 2013a):
• Hydroelectricity
• Geothermal
• Solar
• Tide / Wave / Ocean
• Wind
• Solid biofuels, biogases, liquid biofuels
• Renewable municipal waste
As is the case with other developing countries; the energy consumption in Turkey is constantly increasing due
to the economic developments, population growth, increasing urbanization and industrialization (Öztürk,
Bezir, & Özek, 2009; Kotcioğlu, 2011), and thus, it is in a position to import over 70% of its primary energy
supply (with oil and natural gas having the biggest shares) (Kaya & Kılıç, 2012). On the other hand, Turkey
has a substantial amount and wide range of renewable energy sources, and it is located in an advantageous
geographical position that enables their effective utilization (Barış & Küçükali, 2012; Benli, 2013; Yüksel &
Kaygusuz, 2011). Moreover, the primary energy production is increasing and the most significant
developments are observed in hydropower, geothermal, solar energy and coal production (Yüksel & Arman,
2014). Despite these developments, the share of renewable energy in electricity generation was only 17.4% by
the end of 2008 (Yüksel, 2013). The renewable energy potential in Turkey (hydropower, solar, biomass and
wind power) is sufficient to meet the accelerated demand (Kotcioğlu, 2011), but it has not been efficiently
utilized, leaving the country with an urgent need for effective energy policies.
R
Engineering Approaches on Sustainability (Edited by: Dr. Zehra Semra Can, Dr. Barış Yılmaz, Dr. Seval Genç, Dr. Candeniz Seçkin )
35
Due to the above-stated reasons, energy efficiency has become a significant issue in the government’s agenda.
Hence, since 2005, the Turkish Government has taken steps to improve the energy efficiency and develop
renewable energy sources (RES), among which are the Law on Utilization of RES for the Purpose of
Generating Electrical Energy (2005), the Energy Efficiency Law (2007), accession to the International
Renewable Energy Agency (IRENA) in June 2009, the adoption of the Ministry of Energy and Natural
Resources (MENR) Strategic Plan (2010–2014) and the Energy Efficiency Strategy Paper published in
February 2012 (IEA, 2013b; ECS, 2014). Turkey’s energy policies mainly include meeting demand as much
as possible through indigenous resources, diversifying energy supplies and avoiding dependence on a single
source or country and adding new and renewable sources (geothermal heat, solar, wind, etc.) as soon as
possible to the energy supply system (Öztürk, Bezir, & Özek, 2009).
The development of effective renewable energy policies requires reliable consumption data. Thus, the aim of
this study is to predict the renewable energy consumption in Turkey using Artificial Neural Networks
(ANN). Artificial networks, which can be defined as information-processing systems that have common
performance characteristics with biological neural networks, have been developed as “generalizations of
mathematical model of human cognition” (Kialashaki & Reisel, 2014). Ahmad et al. (2014) have categorized
the most widely used methods for forecasting building energy consumption into three groups, which are
Engineering, Statistical and Artificial Intelligence (AI) methods. They have identified ANNs as the most
commonly implemented method. Among the advantages of ANNs, which they have pointed out are the
following (Ahmad et al., 2014):
• The ability to execute tasks that linear programs cannot;
• A parallel nature enabling them to carry on working when an element fails;
• The ability to learn and not needing to be programmed;
• The fact that they can be executed in any application.
The ANN technique has been reported as a reliable and powerful technique in energy demand forecast
(Kialashaki & Reisel, 2014). The independent variables in the present model are the renewable energy
indicators including but not limited to total primary energy supply (TPES), electricity consumption,
electricity production, energy imports, gross domestic product (GDP) and population.
Artificial Neural Network Application
The researchers used different methods and indicators to evaluate governments and their policies on
renewable energy. Some methods used in evaluation of renewable energy are:
• Data envelopment analysis (Chien & Hu, 2007; Wang et al., 2012),
• Granger causality tests (Apergis & Payne, 2010; Jinke, Hualing, & Dianming, 2008;
Nazlioğlu, Lebe, & Kayhan, 2011),
• Empirical studies, interviews (Hirschl, 2009; Martins & Pereira, 2011; Nagy & Körmendi,
2011),
Ayşe Ayçim Selam, Ahmet Kubilay Atalay, M. Övül Arıoğlu Akan (Prediction of Renewable Energy Consumption in Turkey Using Artificial Neural Networks)
36
• General evaluations (Barış & Küçükali, 2012; Valentine, 2011),
• Other (Liddle, 2012; Reuter et al., 2012), etc.
Escrivá-Escrivá et al. (2011) proposed an adaptive algorithm based on ANNs for the short-term prediction of
total power consumption in buildings with several independent processes. The model, which is able to adjust
a load curve for a particular facility and use it to predict the power consumption for the other days, was used
to predict the whole consumption expressed as 96 active energy quarter-hourly values of the Universitat
Politècnica de València with very accurate results. The consumption forecasts were obtained from the
prediction of each end-use of the total consumption. This model was later upgraded by Roldán-Blay et al.
(2013) by using a time temperature curve forecast model. The new model, which was validated with the
consumption forecast of the Universitat Politècnica de València for an entire year, improved the relationship
between expected consumption and temperatures. However, the authors state the fact that it requires more
information to make a consumption forecast than the previous method.
Ahmad et al. (2014) reviewed the building electrical energy forecasting method using AI methods such as
support vector machine (SVM) and ANN, which led them to the conclusion that the hybrid approach using
these two forecasting methods promises more accurate results. Oğcu et al. (2012) compared the performance
of Support Vector Regression (SVR) model, which is an extended version of SVM used for general estimation
and prediction problems, and ANN for predicting electricity output in Turkey within 2010 and 2011. They
showed that although both methods perform well, seasonal SVR slightly outperforms ANN in terms of
forecasting the real consumption, which they stated to be consistent with Mean Absolute Percentage Error
(MAPE) results of the training data.
In this study, ANN is used for prediction of renewable energy use in Turkey. For this purpose, a set of input
variables are selected. These are provided from energy evaluating articles. Here, unit and definition about the
selected variables are referred from the World Bank & International Energy Agency. Apart from that
information, literature is surveyed with the aim of analyzing how the selected indicators are used for energy
evaluation.
In the model, renewable energy consumption is the output variable and provided by the share in total final
energy consumption. The TPES is the most frequent and basic indicator used to evaluate energy among
researchers. This value is calculated by (TPES = Indigenous production + imports - exports - international
marine bunkers - international aviation bunkers +/- stock changes) (World Bank, 2014). In other words, this
value provides a country’s energy usage.
One of the electric-related indicators is electricity consumption which is obtained by (Gross production +
Imports - Exports – Losses). Natural gas is an important source of energy in Turkey, especially in heating,
therefore in this study electricity production form natural gas is added to the model as an input variable.
Engineering Approaches on Sustainability (Edited by: Dr. Zehra Semra Can, Dr. Barış Yılmaz, Dr. Seval Genç, Dr. Candeniz Seçkin )
37
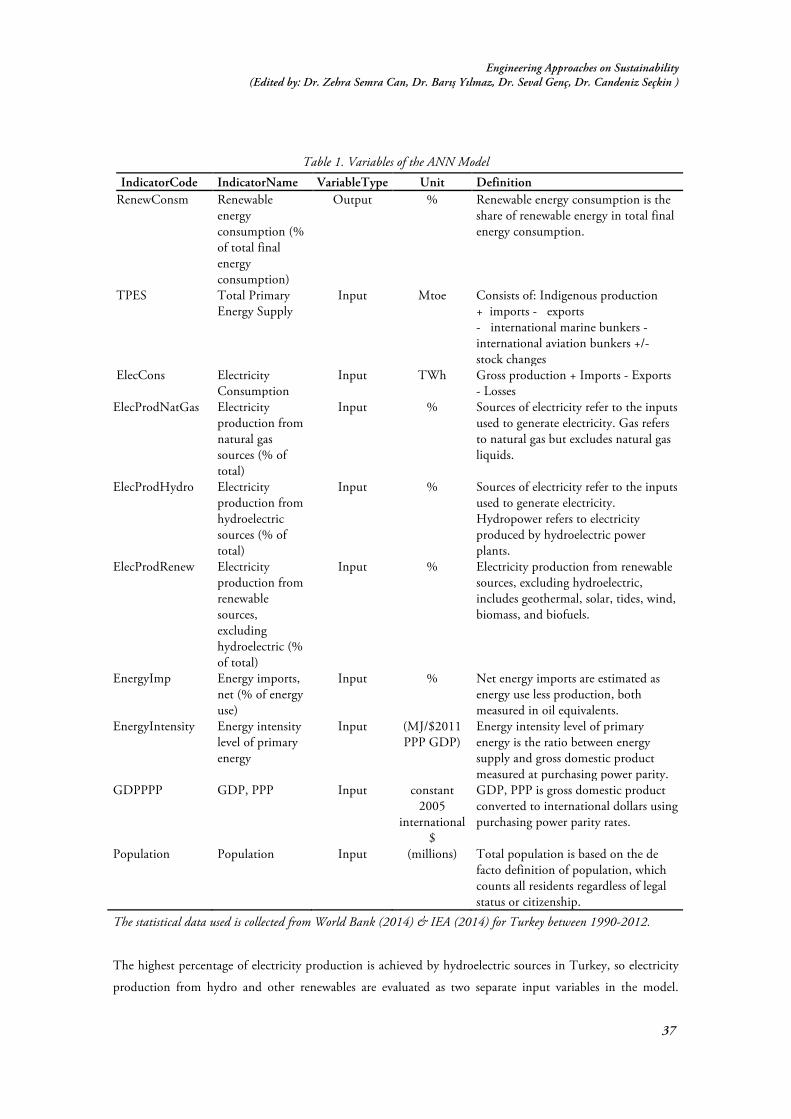
Table 1. Variables of the ANN Model IndicatorCode IndicatorName VariableType Unit Definition
RenewConsm Renewable energy consumption (% of total final energy consumption)
Output % Renewable energy consumption is the share of renewable energy in total final energy consumption.
TPES Total Primary Energy Supply
Input Mtoe Consists of: Indigenous production + imports - exports - international marine bunkers - international aviation bunkers +/- stock changes
ElecCons Electricity Consumption
Input TWh Gross production + Imports - Exports - Losses
ElecProdNatGas Electricity production from natural gas sources (% of total)
Input % Sources of electricity refer to the inputs used to generate electricity. Gas refers to natural gas but excludes natural gas liquids.
ElecProdHydro Electricity production from hydroelectric sources (% of total)
Input % Sources of electricity refer to the inputs used to generate electricity. Hydropower refers to electricity produced by hydroelectric power plants.
ElecProdRenew Electricity production from renewable sources, excluding hydroelectric (% of total)
Input % Electricity production from renewable sources, excluding hydroelectric, includes geothermal, solar, tides, wind, biomass, and biofuels.
EnergyImp Energy imports, net (% of energy use)
Input % Net energy imports are estimated as energy use less production, both measured in oil equivalents.
EnergyIntensity Energy intensity level of primary energy
Input (MJ/$2011 PPP GDP)
Energy intensity level of primary energy is the ratio between energy supply and gross domestic product measured at purchasing power parity.
GDPPPP GDP, PPP Input constant 2005
international $
GDP, PPP is gross domestic product converted to international dollars using purchasing power parity rates.
Population Population Input (millions) Total population is based on the de facto definition of population, which counts all residents regardless of legal status or citizenship.
The statistical data used is collected from World Bank (2014) & IEA (2014) for Turkey between 1990-2012.
The highest percentage of electricity production is achieved by hydroelectric sources in Turkey, so electricity
production from hydro and other renewables are evaluated as two separate input variables in the model.

Ayşe Ayçim Selam, Ahmet Kubilay Atalay, M. Övül Arıoğlu Akan (Prediction of Renewable Energy Consumption in Turkey Using Artificial Neural Networks)
38
Energy imports are attained in percentage by (energy use – energy production). Energy intensity is an
indication of how much energy is used to produce one unit of economic output (World Bank, 2014). The
lower this ratio is the less energy is used to produce one unit of output. The two final input variables are
GDP, PPP as an economic indicator and population as a social indicator. In Table 1 below, the list of
variables is provided with their unit and definitions.
In the first step of the prediction, an ANN with a single hidden layer is used. The data is randomly separated
by %60, %20 and %20 for training validation and test respectively. The number of neurons in the hidden
layer is varied from 2 to 20 in order to find the optimum number of neurons for the best prediction
performance. Levenberg-Marquart algorithm is used for training of ANN. Stopping parameters are given in
Table 2.
Table 2. Stopping Parameters
Parameter Value Maximum # of epochs to train 50 Performance goal 0 Maximum validation failures 50 Minimum performance gradient 1e-10
The method is quite coincidental so training procedure of each ANN architecture is repeated 500 times and
averages of mean squared errors and correlation of test data are calculated for a fair comparison in the
determination of optimum number of neurons in hidden layer. The averages of the mean squared error values
of training, validation and test data and correlation of test data for each ANN architecture is provided as a
performance index in Table 3.
It can be seen from Table 3 that, an ANN with 9 neurons figures out best prediction performance. Average
mean squared error of test data is lowest and average correlation is high as well, which means that coefficient
of determination is high in this architecture. In addition to that the performance index exhibits that the
average mean squared error of test data is increasing while average mean squared error of train data is
decreasing with respect to an increase in number of neurons in hidden layer with a hidden layer size greater
than 9 neurons. At this point it can be stated that an ANN with a hidden layer size greater than 9 neurons is
not learning but memorizing. For this reason, an ANN with more neurons in hidden layer is not investigated.

Engineering Approaches on Sustainability (Edited by: Dr. Zehra Semra Can, Dr. Barış Yılmaz, Dr. Seval Genç, Dr. Candeniz Seçkin )
39
Table 3. Performance Index
Hidden Layer Neurons
Average MSE train
Average MSE validation
Average MSE test
Average correlation test
2 0.8516 1.2108 2.0871 0.9387 3 0.6469 1.1218 2.0871 0.9561 4 0.6782 1.0718 1.9645 0.9625 5 0.9343 0.9651 1.8273 0.9618 6 0.4960 0.9792 1.5312 0.9672 7 0.3853 1.1056 1.4579 0.9679 8 0.3590 1.1246 1.6806 0.9705 9 0.3100 1.0544 1.4127 0.9703 10 0.2885 1.2506 1.6648 0.9606 11 0.3033 1.2837 1.7621 0.9650 12 0.3362 1.5755 1.9555 0.9612 13 0.3253 1.5979 1.8524 0.9627 14 0.4066 1.7623 2.1893 0.9549 15 0.3777 1.9177 2.2228 0.9501 16 0.3504 2.2628 2.1366 0.9519 17 0.2586 1.9983 2.3682 0.9557 18 0.5874 2.2632 2.8486 0.9412 19 0.4453 2.2994 2.6908 0.9494 20 0.3885 2.6914 3.3061 0.9367
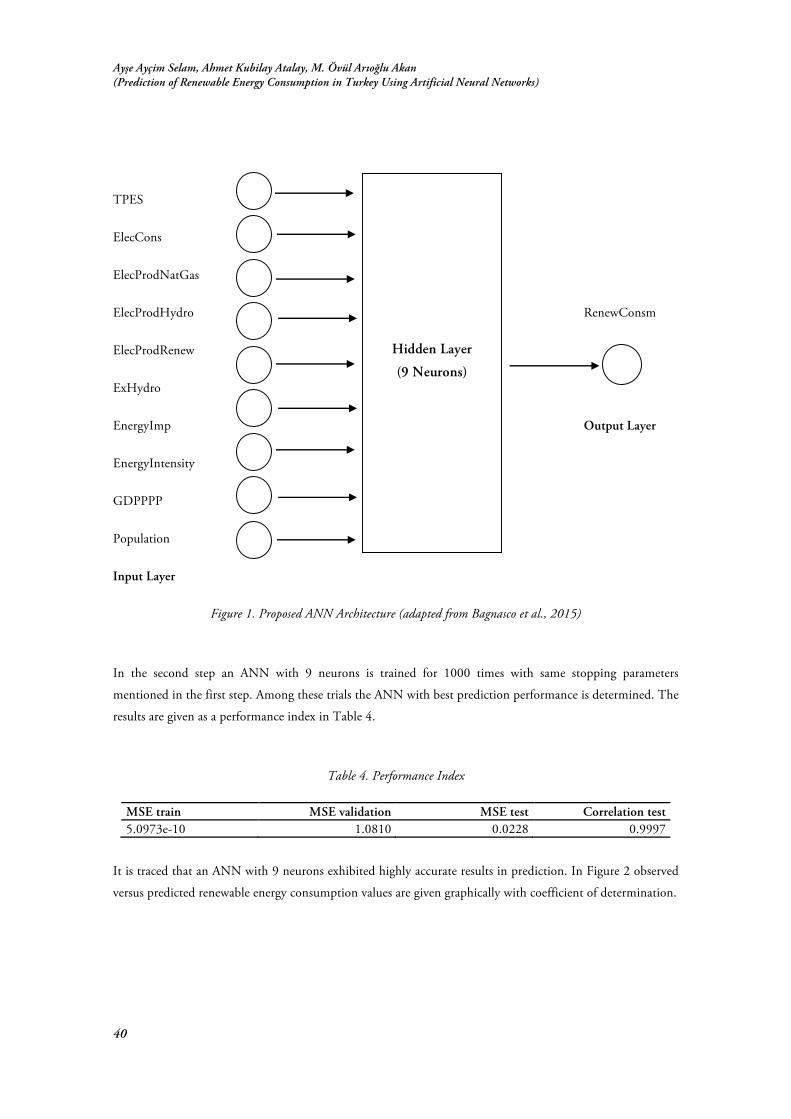
The size of the hidden layer is determined as 9 in the first stage. Beyond this point the second stage is focused
on the acquisition of the best ANN with 9 neurons in hidden layer. The final architecture of the proposed
ANN is given in Figure 1.
Ayşe Ayçim Selam, Ahmet Kubilay Atalay, M. Övül Arıoğlu Akan (Prediction of Renewable Energy Consumption in Turkey Using Artificial Neural Networks)
40
TPES
ElecCons
ElecProdNatGas
ElecProdHydro RenewConsm
ElecProdRenew
ExHydro
EnergyImp Output Layer
EnergyIntensity
GDPPPP
Population
Input Layer
Figure 1. Proposed ANN Architecture (adapted from Bagnasco et al., 2015)
In the second step an ANN with 9 neurons is trained for 1000 times with same stopping parameters
mentioned in the first step. Among these trials the ANN with best prediction performance is determined. The
results are given as a performance index in Table 4.
Table 4. Performance Index
MSE train MSE validation MSE test Correlation test 5.0973e-10 1.0810 0.0228 0.9997
It is traced that an ANN with 9 neurons exhibited highly accurate results in prediction. In Figure 2 observed
versus predicted renewable energy consumption values are given graphically with coefficient of determination.
Hidden Layer
(9 Neurons)
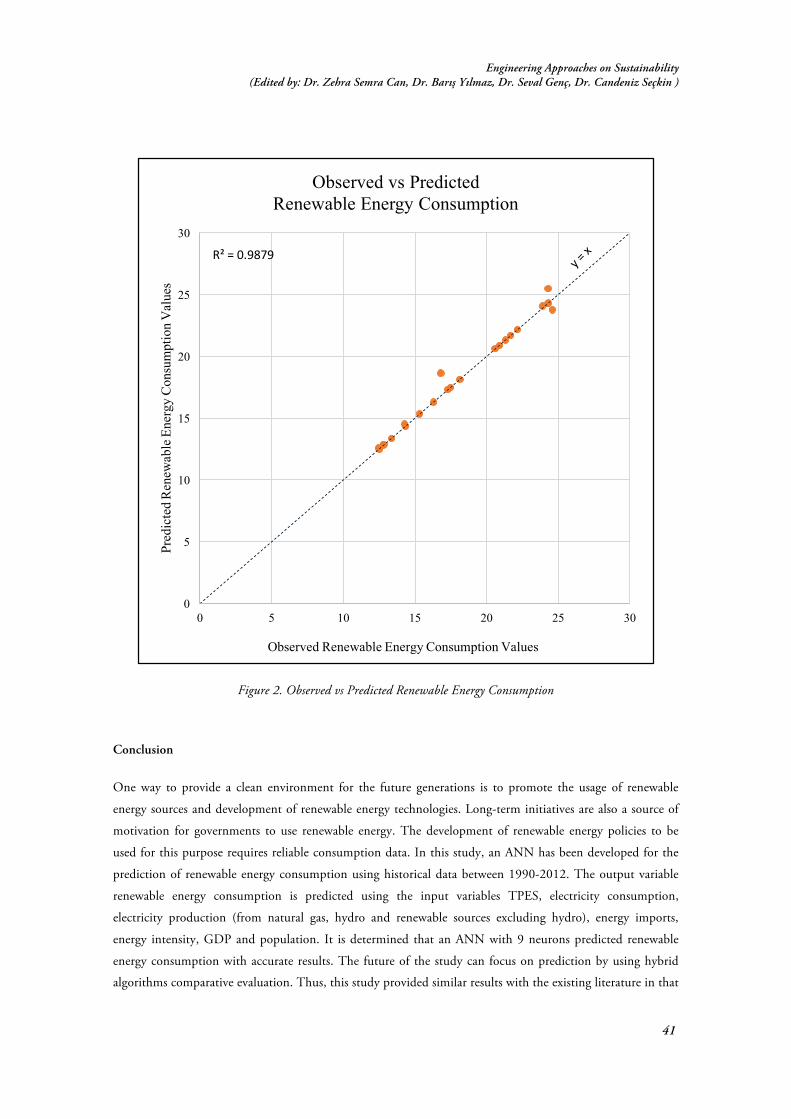
Engineering Approaches on Sustainability (Edited by: Dr. Zehra Semra Can, Dr. Barış Yılmaz, Dr. Seval Genç, Dr. Candeniz Seçkin )
41
Figure 2. Observed vs Predicted Renewable Energy Consumption
Conclusion
One way to provide a clean environment for the future generations is to promote the usage of renewable
energy sources and development of renewable energy technologies. Long-term initiatives are also a source of
motivation for governments to use renewable energy. The development of renewable energy policies to be
used for this purpose requires reliable consumption data. In this study, an ANN has been developed for the
prediction of renewable energy consumption using historical data between 1990-2012. The output variable
renewable energy consumption is predicted using the input variables TPES, electricity consumption,
electricity production (from natural gas, hydro and renewable sources excluding hydro), energy imports,
energy intensity, GDP and population. It is determined that an ANN with 9 neurons predicted renewable
energy consumption with accurate results. The future of the study can focus on prediction by using hybrid
algorithms comparative evaluation. Thus, this study provided similar results with the existing literature in that
R²=0.9879
0
5
10
15
20
25
30
0 5 10 15 20 25 30
Pred
icte
d R
enew
able
Ene
rgy
Con
sum
ptio
n V
alue
s
Observed Renewable Energy Consumption Values
Observed vs Predicted Renewable Energy Consumption

Ayşe Ayçim Selam, Ahmet Kubilay Atalay, M. Övül Arıoğlu Akan (Prediction of Renewable Energy Consumption in Turkey Using Artificial Neural Networks)
42
ANN is a powerful technique in energy demand forecasting. A future research area for this particular study is
comparing ANN with certain other methods used in energy demand forecasting such as ANFIS, Multiple
Linear Regression. Moreover, the use of hybrid models, combining ANN with SVM, for example, is a
promising research area in this field.
Nomenclature
AI artificial intelligence
ANN artificial neural networks
GDP gross domestic product
IEA International Energy Agency
IRENA International Renewable Energy Agency
MAPE mean absolute percentage error
MENR Ministry of Energy and Natural Resources
RES renewable energy sources
SVM support vector machine
SVR support vector regression
TPES total primary energy supply
References
Ahmad, A. S., Hassan, M. Y., Abdullah, M. P., Rahman, H. A., Hussin, F., Abdullah, H., & Saidur, R. (2014). A review on applications of ANN and SVM for building electrical energy consumption forecasting. Renewable and Sustainable Energy Reviews, 33, 102-109.
Apergis, N., & Payne, J. E. (2010). Renewable energy consumption and economic growth: evidence from a panel of OECD countries. Energy policy, 38(1), 656-660.
Avunduk, E., Tumac, D., & Atalay, A. K. (2014). Prediction of roadheader performance by artificial neural network. Tunnelling and Underground Space Technology, 44, 3-9.
Bagnasco, A., Fresi, F., Saviozzi, M., Silvestro, F., & Vinci, A. (2015). Electrical consumption forecasting in hospital facilities: An application case. Energy and Buildings, 103, 261-270.
Baris, K., & Kucukali, S. (2012). Availibility of renewable energy sources in Turkey: Current situation, potential, government policies and the EU perspective. Energy Policy, 42, 377-391.
Benli, H. (2013). Potential of renewable energy in electrical energy production and sustainable energy development of Turkey: Performance and policies. Renewable Energy, 50, 33-46.
Chien, T., & Hu, J. L. (2007). Renewable energy and macroeconomic efficiency of OECD and non-OECD economies. Energy Policy, 35(7), 3606-3615.
ECS (Energy Charter Secretariat), (2014). In-Depth Energy Efficiency Policy Review of the Republic of Turkey. Retrieved October 26, 2015, from http://www.energycharter.org/fileadmin/DocumentsMedia/IDEER/IDEER-Turkey_2014_en.pdf
EIA (U.S. Energy Information Administration Office), (2012). Annual Energy Outlook 2012 with Projections to 2035. Retrieved April 2, 2013, from www.eia.gov/forecasts/aeo
Escrivá-Escrivá, G., Álvarez-Bel, C., Roldán-Blay, C., & Alcázar-Ortega, M. (2011). New artificial neural network prediction method for electrical consumption forecasting based on building end-uses. Energy and Buildings, 43(11), 3112-3119.
Hirschl, B. (2009). International renewable energy policy—between marginalization and initial approaches. Energy Policy, 37(11), 4407-4416.

Engineering Approaches on Sustainability (Edited by: Dr. Zehra Semra Can, Dr. Barış Yılmaz, Dr. Seval Genç, Dr. Candeniz Seçkin )
43
IEA (International Energy Agency), (2013a). Renewables Information 2013 - IEA Statistics. Paris: IEA. IEA (International Energy Agency), (2013b). Energy Policy Highlights. Paris: IEA. IEA (International Energy Agency), (2014). Key World Energy Statistics 2014. Paris: IEA. Jinke, L., Hualing, S., & Dianming, G. (2008). Causality relationship between coal consumption and GDP: difference of
major OECD and non-OECD countries. Applied Energy, 85(6), 421-429. Kaya, D., & Kiliç, F. Ç. (2012). Renewable Energies and their subsidies in Turkey and some EU countries-Germany as a
Special Example. Journal Of International Environmental Application And Science, 7(1), 114. Kialashaki, A., & Reisel, J. R. (2014). Development and validation of artificial neural network models of the energy
demand in the industrial sector of the United States. Energy, 76, 749-760. Komor, P., & Bazilian, M. (2005). Renewable energy policy goals, programs, and technologies. Energy Policy, 33(14),
1873-1881. Kotcioğlu, İ. (2011). Clean and sustainable energy policies in Turkey. Renewable and Sustainable Energy Reviews, 15(9),
5111-5119. Liddle, B. (2012). Breaks and trends in OECD countries' energy–GDP ratios. Energy Policy, 45, 502-509. Martins, F. R., & Pereira, E. B. (2011). Enhancing information for solar and wind energy technology deployment in
Brazil. Energy Policy, 39(7), 4378-4390. Nagy, K., & Körmendi, K. (2012). Use of renewable energy sources in light of the “New Energy Strategy for Europe
2011–2020”. Applied energy, 96, 393-399. McCrone, A., & Finance, B. N. E. GLOBAL TRENDS IN RENEWABLE ENERGY INVESTMENT 2015. Nazlioglu, S., Lebe, F., & Kayhan, S. (2011). Nuclear energy consumption and economic growth in OECD countries:
Cross-sectionally dependent heterogeneous panel causality analysis. Energy Policy, 39(10), 6615-6621. Oğcu, G., Demirel, O. F., & Zaim, S. (2012). Forecasting electricity consumption with neural networks and support
vector regression. Procedia-Social and Behavioral Sciences, 58, 1576-1585. Ozturk, M., Bezir, N. C., & Ozek, N. (2009). Turkey's energy production, consumption, and policies, until 2020.
Energy Sources, Part B, 4(3), 315-331. Reuter, W. H., Szolgayová, J., Fuss, S., & Obersteiner, M. (2012). Renewable energy investment: Policy and market
impacts. Applied Energy, 97, 249-254. Roldán-Blay, C., Escrivá-Escrivá, G., Álvarez-Bel, C., Roldán-Porta, C., & Rodríguez-García, J. (2013). Upgrade of an
artificial neural network prediction method for electrical consumption forecasting using an hourly temperature curve model. Energy and Buildings, 60, 38-46.
Valentine, S. V. (2011). Japanese wind energy development policy: Grand plan or group think?. Energy Policy, 39(11), 6842-6854.
Wang, Z. H., Zeng, H. L., Wei, Y. M., & Zhang, Y. X. (2012). Regional total factor energy efficiency: an empirical analysis of industrial sector in China. Applied Energy, 97, 115-123.
World Bank, (2014). World Development Indicators. Retrieved August 28, 2016 from http://data.worldbank.org/indicator
Yuksel, I. (2013). Renewable energy status of electricity generation and future prospect hydropower in Turkey. Renewable energy, 50, 1037-1043.
Yüksel, I., & Arman, H. (2014). Energy and environmental policies in Turkey. Energy Sources, Part B: Economics, Planning, and Policy, 9(1), 57-69.
Yuksel, I., & Kaygusuz, K. (2011). Renewable energy sources for clean and sustainable energy policies in Turkey. Renewable and Sustainable Energy Reviews, 15(8), 4132-4144.

Engineering Approaches on Sustainability (Edited by: Dr. Zehra Semra Can, Dr. Barış Yılmaz, Dr. Seval Genç, Dr. Candeniz Seçkin )
45
3 Environmental Remediation Cost of Industrial Solid Waste in Terms of Extended Exergy
Candeniz Seçkin Abstract
The objective of this study is determination of environmental remediation cost (EEENV) of industrial solid waste in terms of “Extended Exergy”. Extended Exergy Accounting (EEA) is an exergoeconomic methodology which proposes a computation technique to determine the resource consumption equivalent of immaterial/nonenergetic production factors (labor, capital, and environmental remediation costs) in terms of a unified metric: exergy. Since all the material, energetic and immaterial/nonenergetic factors are taken into account, EEA provides more reasonable and directive results on “resource consumption” side of the issue. EEENV is represented by the cumulative exergetic consumption of resources to attain an ideal, zero-impact disposal of the effluent. This is the first study in the literature that EEENV of industrial solid waste is obtained in accordance with the original methodology of EEA. The waste treatment system consists of material recycling, incineration, anaerobic digestion and landfilling. The waste treatment procedure is applied to Turkish industrial waste composition. Keywords: Extended exergy accounting, EEA, Industrial waste, Ecological accounting, Environmental
remediation cost
Candeniz Seçkin (Environmental Remediation Cost of Industrial Solid Waste in Terms of Extended Exergy)
46
Introduction
n the last decades, scientists, researchers and engineers paid a great attention to the concept of exergy and
routinely applied exergy analysis to various industrial processes. “Exergy” (available energy) is defined as
the maximal amount of work that can be extracted from the system in the process of reaching
equilibrium with the environment (dead state) (Szargut, Morris, & Steward, 1988). This definition
underlines the impossibility of obtaining further work from a system which is in equilibrium with the dead
state. Hence, exergy can be regarded as the part of the physical resource used (consumed) in all types of
anthropic activities and serves as a rationally unified measure of utility and scarcity. The exergy content of a
natural resource characterizes “the measure for potential usefulness” (in other words, quality), i.e., its ability to
perform “useful work” (Ayres & Ayres, 1999). The main advantage of an exergy based analysis compared with
the more traditional energy analysis is the identification and quantitative assessment of global and local
irreversibilities, which result in a measure of resource degradation in the processes. Besides, the exergy concept
provides a unified quantifier which can be used in the evaluation of resource quality (material or immaterial).
Exergy is not a direct measure of pollution (Sciubba, 2009) but indicates the potential to cause change in the
environment since it is also a measure of distance between a released substance and the environmentally
neutral (pseudo-equilibrium) state. It ought to be noticed that exergy does not directly measure, for instance,
toxicity (Sciubba, 2009; Zhang & Chen, 2010).
Extended Exergy Accounting (EEA) is an exergy based resource use analysis methodology in which material
and/or immaterial commodities are represented by extended exergy (EE) which is equal to exergy of resources
consumed to generate them (Sciubba, 2001, 2003a). EEA proposes a novel calculation procedure to express
the resource equivalent of externalities (labour, capital and environmental impact) in terms of exergy, and
externalities are accounted for in the EE of a commodity. In other words, summation of the resource
equivalent of “materials, energy carriers, capital and labour consumed during the production of the
commodity and environmental remediation cost (EEENV)” is named extended exergy (EE) of a commodity
(Sciubba, 2003a, 2005). In EEA theory, all consumed materials, energy carriers and also
immaterial/nonenergetic production fluxes (capital, labour, and environmental damage) are represented in
terms of exergy and provides a good measure of resource which are irreversibly consumed in the life cycle of a
material or immaterial commodity. Thus, the global problem of resource depletion and environment damage
can be monitored by EEA, which is in essence a carefully and rigorously defined extension not of the concept
of exergy but of its application to measure different fluxes (Sciubba, 2003a, 2003b, 2011). Once the
numeraire of extended exergy (which is a strictly thermodynamic quantity that expresses the amount of
equivalent exergy “embodied” in a commodity) is employed as the sole measure of resource consumption, it is
automatically followed with minimization of exergy use and destruction which are essential for improving the
degree of sustainability. Hence, EEA offers more insight than other exergy based methods in the literature
(Sciubba, Bastianoni, & Tiezzi, 2008).
The present paper focuses on the determination of “environmental remediation cost (EEENV)” of solid waste
originated by Turkish industrial sector in the year 2010. In theoretical structure of EEA methodology, the
I
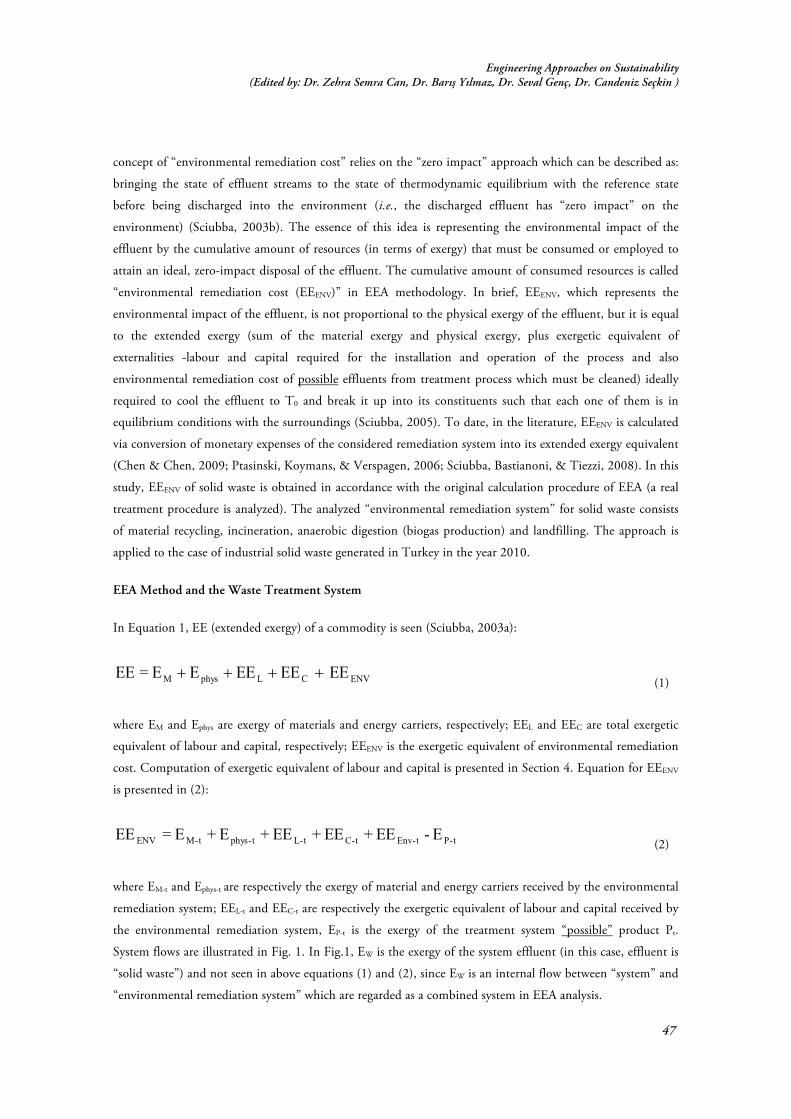
Engineering Approaches on Sustainability (Edited by: Dr. Zehra Semra Can, Dr. Barış Yılmaz, Dr. Seval Genç, Dr. Candeniz Seçkin )
47
concept of “environmental remediation cost” relies on the “zero impact” approach which can be described as:
bringing the state of effluent streams to the state of thermodynamic equilibrium with the reference state
before being discharged into the environment (i.e., the discharged effluent has “zero impact” on the
environment) (Sciubba, 2003b). The essence of this idea is representing the environmental impact of the
effluent by the cumulative amount of resources (in terms of exergy) that must be consumed or employed to
attain an ideal, zero-impact disposal of the effluent. The cumulative amount of consumed resources is called
“environmental remediation cost (EEENV)” in EEA methodology. In brief, EEENV, which represents the
environmental impact of the effluent, is not proportional to the physical exergy of the effluent, but it is equal
to the extended exergy (sum of the material exergy and physical exergy, plus exergetic equivalent of
externalities -labour and capital required for the installation and operation of the process and also
environmental remediation cost of possible effluents from treatment process which must be cleaned) ideally
required to cool the effluent to T0 and break it up into its constituents such that each one of them is in
equilibrium conditions with the surroundings (Sciubba, 2005). To date, in the literature, EEENV is calculated
via conversion of monetary expenses of the considered remediation system into its extended exergy equivalent
(Chen & Chen, 2009; Ptasinski, Koymans, & Verspagen, 2006; Sciubba, Bastianoni, & Tiezzi, 2008). In this
study, EEENV of solid waste is obtained in accordance with the original calculation procedure of EEA (a real
treatment procedure is analyzed). The analyzed “environmental remediation system” for solid waste consists
of material recycling, incineration, anaerobic digestion (biogas production) and landfilling. The approach is
applied to the case of industrial solid waste generated in Turkey in the year 2010.
EEA Method and the Waste Treatment System
In Equation 1, EE (extended exergy) of a commodity is seen (Sciubba, 2003a):
ENVCLphysM EEEE EE E E =EE ++++ (1)
where EM and Ephys are exergy of materials and energy carriers, respectively; EEL and EEC are total exergetic
equivalent of labour and capital, respectively; EEENV is the exergetic equivalent of environmental remediation
cost. Computation of exergetic equivalent of labour and capital is presented in Section 4. Equation for EEENV
is presented in (2):
t-Pt-Envt-Ct-Lt-physt-MENV E - EE+EE+EE+E+E =EE (2)
where EM-t and Ephys-t are respectively the exergy of material and energy carriers received by the environmental
remediation system; EEL-t and EEC-t are respectively the exergetic equivalent of labour and capital received by
the environmental remediation system, EP-t is the exergy of the treatment system “possible” product Pt.
System flows are illustrated in Fig. 1. In Fig.1, EW is the exergy of the system effluent (in this case, effluent is
“solid waste”) and not seen in above equations (1) and (2), since EW is an internal flow between “system” and
“environmental remediation system” which are regarded as a combined system in EEA analysis.

Candeniz Seçkin (Environmental Remediation Cost of Industrial Solid Waste in Terms of Extended Exergy)
48
The definition of environmental remediation cost is presented in Section 1. Since, in reality, there is no
totally “clean” technology (Sciubba, 2003b) or present treatment technologies don’t always produce effluents
in equilibrium with the surroundings, choosing the minimum environmentally hazardous technology, i.e.,
"consciously accepted" level of pollution, is a reasonable approach (Sciubba, 2002) and applied in this study.
Figure 1. A commodity-producing process with flows considered in EEA methodology
Recycling of industrial waste can be classified into two parts: 1) heat & energy generation by using the
combustible part as a fuel; 2) recycling and reusing of the recyclable part.
Most of the combustible components in industrial solid waste are also biodegradable, thus, a combustible gas
can be obtained from a biological conversion process (UNEP, 2005). The AD process can be briefly described
as: a biological process during which the complex organic matter is decomposed by anaerobic microorganisms
in the absence of oxygen (i.e., under anaerobic conditions). The products are primarily methane (CH4) with
an accompanying production of other gases (mainly CO2) (United Nations Environment Programme, 2005).
Anaerobic digestion reduces the quantity of organic waste ending up in landfills and also methane emissions
from landfill areas. Among the other methods, anaerobic digestion (AD) has very special importance due to
its ability of biogas generation (which is composed of 60–70 vol.% of methane, CH4) and providing the
option of energy generation via biogas utilization (Appels et al., 2008). This energy gain by biogas utilization
provides cost effectiveness and minimizing the mass and volume of final sludge disposal (Tchobanoglous,
Burton, & Stensel, 2002). Another advantage of AD process is: the residue (digestate) can be composted
further to produce “compost” (a kind of fertilizer) which is another product of AD process (MREC, 2003;
EEA, 2002; Poschl, Ward, & Owende, 2010). The digestate contains compounds of agricultural value: it is
rich in nitrates and performs well as fertilizer (Corrado, Fiorini, & Sciubba, 2006). As a result, due to its cost
EM
EEPEphys
System
EEL EEC
EM-t
Ephys-t
EEEnv-tEEL- EEC-
EEP-t
EEENVEW
Environmental
remediation
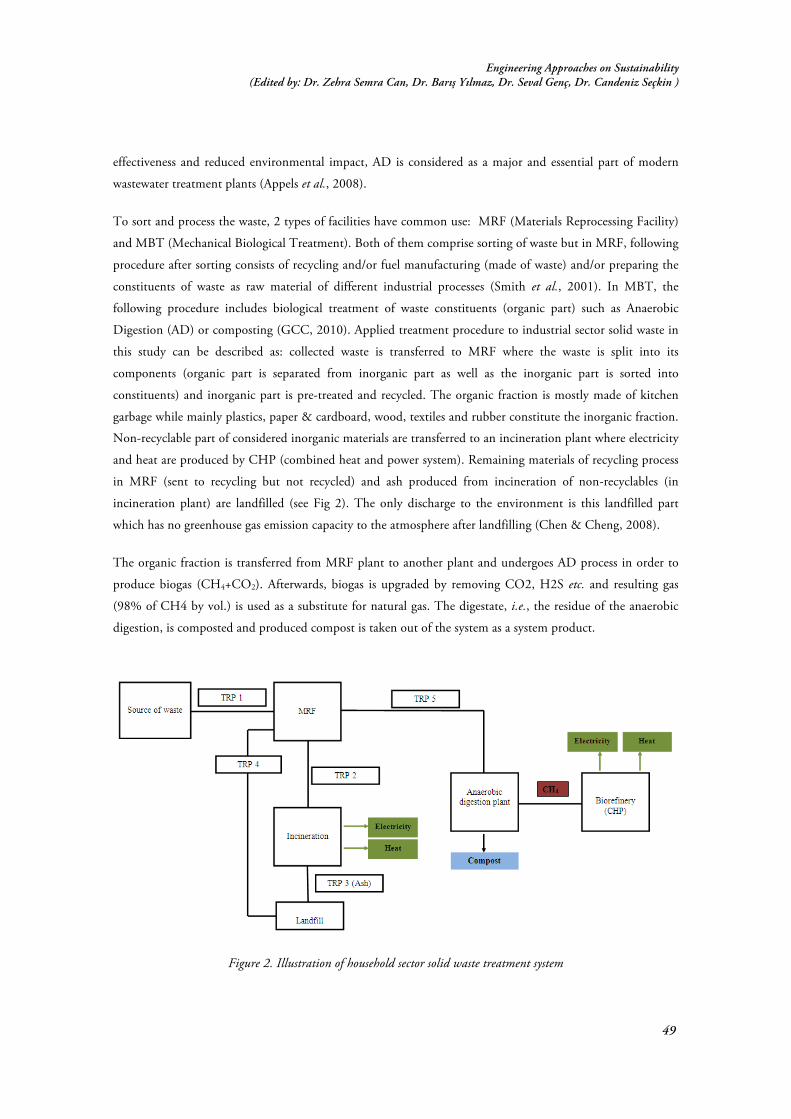
Engineering Approaches on Sustainability (Edited by: Dr. Zehra Semra Can, Dr. Barış Yılmaz, Dr. Seval Genç, Dr. Candeniz Seçkin )
49
effectiveness and reduced environmental impact, AD is considered as a major and essential part of modern
wastewater treatment plants (Appels et al., 2008).
To sort and process the waste, 2 types of facilities have common use: MRF (Materials Reprocessing Facility)
and MBT (Mechanical Biological Treatment). Both of them comprise sorting of waste but in MRF, following
procedure after sorting consists of recycling and/or fuel manufacturing (made of waste) and/or preparing the
constituents of waste as raw material of different industrial processes (Smith et al., 2001). In MBT, the
following procedure includes biological treatment of waste constituents (organic part) such as Anaerobic
Digestion (AD) or composting (GCC, 2010). Applied treatment procedure to industrial sector solid waste in
this study can be described as: collected waste is transferred to MRF where the waste is split into its
components (organic part is separated from inorganic part as well as the inorganic part is sorted into
constituents) and inorganic part is pre-treated and recycled. The organic fraction is mostly made of kitchen
garbage while mainly plastics, paper & cardboard, wood, textiles and rubber constitute the inorganic fraction.
Non-recyclable part of considered inorganic materials are transferred to an incineration plant where electricity
and heat are produced by CHP (combined heat and power system). Remaining materials of recycling process
in MRF (sent to recycling but not recycled) and ash produced from incineration of non-recyclables (in
incineration plant) are landfilled (see Fig 2). The only discharge to the environment is this landfilled part
which has no greenhouse gas emission capacity to the atmosphere after landfilling (Chen & Cheng, 2008).
The organic fraction is transferred from MRF plant to another plant and undergoes AD process in order to
produce biogas (CH4+CO2). Afterwards, biogas is upgraded by removing CO2, H2S etc. and resulting gas
(98% of CH4 by vol.) is used as a substitute for natural gas. The digestate, i.e., the residue of the anaerobic
digestion, is composted and produced compost is taken out of the system as a system product.
Figure 2. Illustration of household sector solid waste treatment system
Candeniz Seçkin (Environmental Remediation Cost of Industrial Solid Waste in Terms of Extended Exergy)
50
EEA analysis of the industrial solid waste treatment system
The approach is applied to the case of solid waste generated in Turkish industrial sector in the year 2010. The
composition of IN sector solid waste is presented in Table 1. The composition is estimated based on data
(SWAP, 2005) due to the fact that there is neither official data nor study in the literature for average
composition of Turkish IN sector waste. Unfortunately, in Turkey, hazardous waste is mostly landfilled and
very limited amount is recycled and reused. Uncontrolled production of hazardous waste and illegal dumping
or discharging to receiving water bodies are one of the primary problems arising along with industrial
activities in Turkey (Salihoglu, 2010). As a result, treatment of hazardous waste is a very important issue for
the country, but, since it takes special technologies and detailed analyses, it is taken out of the scope of this
thesis. In other words, since the hazardous waste has a little share in the total composition of IN sector solid
waste, environmental remediation cost of relevant part is neglected.
In EEA methodology, IN sector covers all manufacturing industry including construction. Mining &
quarrying activities, energy generation and fuel production processes (heat and electricity generation, all
refinery activities, coal processing activities) are covered by other sectors.
Table 1. Composition of IN sector waste (based on data in Switzerland Global Enterprise, 2015; Turkstat, 2011).
Composition Percent (% wt.) Amount (Ton) Organic 18.21 2490945.9 Paper&Cupboard 32.38 4429260.2 Textile 2.19 299570.1 Plastic 20.06 2744007.4 Glass 0.55 75234.5 Metal (Al) 0.23 31461.7 Metal (Fe) 10.31 1410304.9 Other metals (Cu) 0.12 16414.8 Wood 3.61 493811.9 Other combustibles 4.38 599140.2 Ash 3.97 543056.3 Hazardous waste 3.99 545792.1 Total 100 13679000
Summarizing tables of EEA analysis for industrial sector solid waste treatment system which report the results
of the material, energy carrier, capital and labour inflows into the sector, are seen between Table 2- 6.
The necessary truck numbers for each transportation line and exergetic content of the trucks are presented in
Table 2 (exergy of one truck is computed as 0.045 TJ/truck in a different study of the author (Seckin,
Sciubba, & Bayulken, 2013) and is inserted into the computation here). In Table 2, TRP lines signify the
transportation lines seen in Fig. 2. In calculation of material influxes (except trucks), since no sufficiently
reliable data were available on the exact material composition of the used items in the system, and thus an
analytical analysis was impossible, the corresponding portion of EEENV is computed by converting the known

Engineering Approaches on Sustainability (Edited by: Dr. Zehra Semra Can, Dr. Barış Yılmaz, Dr. Seval Genç, Dr. Candeniz Seçkin )
51
monetary cost of the process into exergetic equivalent by means of eeK (J/$). Computation and numerical
value of eeK is presented in Section 4. The exergy of material flow pertaining to other systems or processes
except TRP lines are computed as explained above and presented in Table 3. (Exchange rate between $, € and
TL: 1,8 TL= 1 €= 1,26 $ for 2010).
Table 2. Number of trucks and their exergetic content
Transportation line Number of trucks Exergy (TJ) TRP-1 2415 108.68 TRP-2 26 1.17 TRP-3 14 0.63 TRP-4 48 2.16 TRP-5 115 5.18 Total 2617 117.77
Table 3. Material exergy (EM-t) of systems and processes except transportation lines
System/Process Capital Ref. Equivalent exergy (TJ) MRF plant 100 €/Ton Smith et al., 2001 30527.47 Incineration plant 64 €/Ton Smith et al., 2001 4515.57 Anaerobic digestion plant 65 €/Ton Smith et al., 2001 5201.14 Upgrading of biogas 0,26 €/m3 De Hullu et al., 2008 2727.18 Biorefinery 7000 $/KWel EIA, 2012 13429.19 Seperation, composting 35 €/Ton Smith et al., 2001 1120.25 Total 57520.80
1 The cost of MRF plant includes preliminary sorting, pre-treatment of recyclable materials and recycling 2 Anaerobic digestion plant includes mixing, sterilization and anaerobic digestion part
In conclusion, exergy of material transfers (EM-t) into the system is the sum of Table 2 and Table 3 which is
57638.56 TJ.
The only exergy inflow of energy carriers (physical exergy) are the diesel fuel consumption of transportation
lines. Calculation of diesel fuel consumption for each line is computed based on data presented in (Berglund
& Borjesson, 2006) and the results are presented in Table 4. (Exergy of diesel fuel is 46366,71 MJ/Ton).
Table 4. Physical exergy (Ephys-t) inflow of the environmental remediation system
Diesel Consumption (Ton) Exergy of diesel consumption (TJ) TRP-1 315726.39 14639.20 TRP-2 2771.12 128.49 TRP-3 1385.56 64.24 TRP-4 4826.98 223.81 TRP-5 10475.78 485.73 Total 15541.47

Candeniz Seçkin (Environmental Remediation Cost of Industrial Solid Waste in Terms of Extended Exergy)
52
In capital flows, capital investment of the system (Investment cost, IC) is assumed to be supplied by bank
credit with annual interest rate of 20% and payback time of 10 years. Annual payment is calculated using the
methodology presented by (Bejan, Tsatsaronis, & Moran, 1996) (annual payment is 23.85% of capital
investment, calculation is presented in (3) and (4)). Annual “fixed and varying operation costs” (including
insurance, wages, maintenance etc., totally abbreviated as “OP”) are assumed to be 20% of capital investment.
Capital flow of the system is sum of “annualized investment cost plus OP” of each process and system, results
are seen in Table 5-7.
úúúúú
û
ù
êêêêê
ë
é
÷÷ø
öççè
æ+
-=
n)r1(11
rx)IC(valueesentPrtcosAnnualized
(3)
where r is the annual interest and n is the number of pay back years.
239.0
0.2)(111
0.2x(IC)valuePresentcostAnnualized
10
=
úúúú
û
ù
êêêê
ë
é
÷÷ø
öççè
æ+
-=
(4)
Table 5. Exergetic equivalent of the capital of processes
System/Process Capital Exergetic equivalent
of IC (TJ)
Exergetic equivalent of
annualized IC (TJ)
Exergetic equivalent
of OP (TJ)
Annualized IC+OP (TJ)
MRF plant1 100 €/Ton 30527.47 7296.07 6105.49 13401.56 Incineration plant 64 €/Ton 4515.57 1079.22 903.11 1982.33 Anaerobic digestion plant2 65 €/Ton 5201.14 1243.07 1040.23 2283.30 Upgrading of biogas 0,26€/m3 2727.18 651.80 545.44 1197.23 Biorefinery 7000 $/KWel 13429.19 3209.58 2685.84 5895.42 Separation, composting 35 €/Ton 1120.25 267.74 224.05 491.79 Landfilling 10 €/Ton 586.06 140.07 117.21 257.28 Total 25508.91
1 The cost of MRF plant includes preliminary sorting, pre-treatment of recyclable materials and recycling 2 Anaerobic digestion plant includes mixing, sterilization and anaerobic digestion part Use of trucks with an accompanying consumption of diesel fuel brings about capital inputs into the system.
The number of trucks and diesel fuel consumption in each TRP line are presented in Table 6 and Table 7,
respectively. It is assumed that investment cost of 1 truck is 100000 TL (69930,07 $) as well as annual
operation and maintenance cost (OP) is 20% of the investment cost. Density of diesel fuel is taken as 0.835
kg/lt and for the year 2010, the price of diesel fuel is 2.1 TL/l (1.47 $/l) (BP, 2016). Diesel fuel cost is
accounted in OP cost. As a result, its capital equivalent is not annualized in calculations.

Engineering Approaches on Sustainability (Edited by: Dr. Zehra Semra Can, Dr. Barış Yılmaz, Dr. Seval Genç, Dr. Candeniz Seçkin )
53
Table 6. Exergetic equivalent of the capital of trucks
Transportation line Number of trucks
Exergetic equivalent of IC
(TJ)
Exergetic equivalent of annualized IC
(TJ)
Exergetic equivalent of OP (TJ)
Annualized IC+OP (TJ)
TRP-1 2415 4306.55 1027.21 861.31 1888.53 TRP-2 26 46.36 11.06 9.27 20.33 TRP-3 14 24.97 5.95 4.99 10.94 TRP-4 48 85.60 20.42 17.12 37.54 TRP-5 115 205.07 48.91 41.01 89.93 Total 2617 2047.27
Table 7. Exergetic equivalent of the capital of diesel fuel consumption
Transportation line Diesel Consumption (l) Exergetic equivalent of diesel cost (TJ) TRP-1 378115434.25 14173.66 TRP-2 3318705.07 124.40 TRP-3 1659347.82 62.20 TRP-4 5780810.42 216.69 TRP-5 12545838.76 470.28 Total 15047.23
Due to the lack of data on landfilling, material input coming from landfilling process (tractors, excavators,
etc.), energy consumption with accompanying emissions are disregarded in this study. In conclusion, sum of
capital fluxes is the sum of Table 5, 6 and 7 which amounts to 42603.41 TJ.
In the matter of the labour consumption of the system, labour consumed by TRP lines are calculated based
on driven distance and average speed of the trucks which are assumed based on (Berglund & Borjesson,
2006). For the left of the system, it is assumed that labour of a CHP system is 200 workers per 1000 MWh+el
generated energy, based on data in (Bezdek & Wendling, 2010). Considering the whole system, number of
workers is assumed to be 400 workers per 1000 MWh+el with 1800 workhours/year workload for each worker.
Generated electricity and heat power is presented later in Table 14 as 20701.61 TJel and 24841.92 TJh.
Generated power is computed as:
36.155060340x24x60x
10)x 24841.92 (20701.61 (s) time workingAnnual)(MJenergy Generated
)MW(powerGenerated6
helhel =
+== +
+
(5)
Hence, labour consumed in the system (excluding transportation) is:
[ ] [ ])MW(powerGeneratedxhoursworkAnnualxMW1000
skerwor400 = /year)(workhoursLabour hel+ú
û
ùêë
é
(6)

Candeniz Seçkin (Environmental Remediation Cost of Industrial Solid Waste in Terms of Extended Exergy)
54
TJ171.84MJ 92171848720.153.95x1116263.21(MJ/hours)ee x )(workhours loadLabour EE LL
====
[ ] [ ])MW(36.1550xker)woryear/hours(1800x)MW(1000
)skerwor(400 = )(workhoursLabour ú
û
ùêë
é
(7)
hours1116263.21 =Labour
The exergetic equivalent of the labour is computed by means of eeL:
(8)
Resulting labour consumption and exergetic equivalent are presented in Table 8.
Table 8. Labour consumption and exergetic equivalent (EEL)
Transportation line Labour (workhours) Exergetic equivalent of labour (TJ) TRP-1 7731483.28 1190.28 TRP-2 70673.37 10.88 TRP-3 36407.49 5.61 TRP-4 120465.96 18.54 TRP-5 260563.42 40.12 The left of the system 171.84 Total 1437.27
Environmental remediation cost of the system (EEENV-t) stems mainly from transportation as well as processes
like anaerobic digestion, incineration etc. The emission gasses are obtained based on (Eggleston et al., 2006)
and presented in Table 9. Due to lack of sufficiently disaggregated data and great variety of emission gasses,
three types of greenhouse gasses (CO2, CH4, N2O) are considered in this study.
Table 9. Greenhouse gas emissions from the processes
Emission (Ton) CO2 N2O CH4 TRP-1 1001109.37 52.69 52.69 TRP-2 8786.70 0.46 0.46 TRP-3 4393.34 0.23 0.23 TRP-4 15305.44 0.81 0.81 TRP-5 33216.72 1.75 1.75 Incineration plant 2780827.81 121.30 909.76 Anaerobic digestion 8850.87 3515.22 Upgrading of biogas 279559.22 2273.18 Biorefinery 309955.22 0.55 5.53 Composting 131492.19 298.84 3984.61 Total 4573496.87 476.63 10744.24

Engineering Approaches on Sustainability (Edited by: Dr. Zehra Semra Can, Dr. Barış Yılmaz, Dr. Seval Genç, Dr. Candeniz Seçkin )
55
The environmental remediation cost (EEENV) of considered emission gases are computed in a different study
of the same author (Seckin, Sciubba, & Bayulken, 2013). But, since the goal of the present study is
determining the environmental remediation cost for solid waste, presenting the computation for gas treatment
would be deviation from the subject. Hence, EEENV of considered gases are inserted into Table 10 to obtain
the EEENV-t for the whole solid waste treatment system.
Table 10. Environmental remediation cost of emission gasses (EEENV)
CO2 emissions (Ton) 4573496.87 N2O emission (Ton) 476.63 CH4 emission (Ton) 10744.24 CO2 eeENV-g (TJ/Ton CO2) 0.043 N2O eeENV-g (TJ/Ton N2O) 0.01 CH4 eeENV-g (TJ/Ton CH4) 0.267 CO2 EEENV-g (TJ) 196660.37 N2O EEENV-g (TJ) 4.77 CH4 EEENV-g (TJ) 2868.71 Total EEENV-t (TJ) 199533.84
As it is seen in Fig.2, the products of the whole treatment system are 1) electricity and heat produced by
incineration of non-recyclable part of the inorganic waste and 2) electricity and heat produced in biorefinery
3) recycled materials and 4) compost. The ash generated in considered processes are assumed to have zero
exergy. Hence, its exergetic content is not included in exergy of products. The amount of non-recyclables and
their energy content are presented in Table 11. The amount of the materials in Table 11 is derived based on
data in (Rigamonti, Grosso, & Giugliano, 2009).
Table 11. Low heating value (LHV) of the non- recyclables
Material (Ton) LHV (MJ/kg) Total energy content (TJ) Paper & Cupboard 642242.73 11.50 7385.79 Textile 121325.89 14.60 1771.36 Plastic 1134921.46 31.50 35750.03 Glass 4514.07 0.00 0.00 Metal (Al) 3665.29 0.00 0.00 Metal (Fe) 349755.61 0.00 0.00 Other metals (Cu) 1641.49 0.00 0.00 Wood 71602.72 18.46 1321.79 Total 2329669.26 46228.96
Efficiencies of heat and electricity production and produced energy via incineration are seen in Table 12.

Candeniz Seçkin (Environmental Remediation Cost of Industrial Solid Waste in Terms of Extended Exergy)
56
Table 12. Properties of incineration process
Electricity Heat Energy of non-recyclables (TJ) 46228.96 Efficiencies 0.40 0.48 Produced energy (TJ) 18491.58 22189.90
The composition of biogas utilized in the biorefinery involved in the system is 98% CH4 and 2% CO2. The
biorefinery is a CHP plant and the efficiencies of heat and electricity generation are assumed to be same as
those in Table 12. The amount of the biogas utilized in biorefinery and produced energy can be seen in Table
13. LHV (low heating value) of CO2 is almost zero (De Hullu et al., 2008).
Table 13. Properties of biogas utilization
CH4 (m3) 163839264.48 CO2 (m3) 3343658.46 LHV of CH4 (MJ/m3) 33.73 LHV of CO2 (MJ/m3) 0.00 LHV of biogas (TJ) 5526.30 Electricity generation efficiency 0.40 Heat generation efficiency 0.48 Generated electricity (TJ) 2210.52 Generated heat (TJ) 2652.62
As stated earlier, the energy need (both of heat and electricity) is met by the generated energy in the system,
i.e., output of biorefinery and incineration process. The energy balance of the environmental treatment
system is presented in Table 14. In the Table, it is assumed that produced heat is at the temperature of 100 C.

Engineering Approaches on Sustainability (Edited by: Dr. Zehra Semra Can, Dr. Barış Yılmaz, Dr. Seval Genç, Dr. Candeniz Seçkin )
57
Table 14. Energy balance of the system
Description Consumption Production Electricity
(TJ) Heat (TJ)
Electricity (TJ) Heat (TJ)
MRF plant preliminary sorting 196.07 MRF plant pretreatment of recyclable materials
and recycling 4129.53 6726.68
Incineration plant
832.12 18491.58 22189.90
Anaerobic digestion
mixing, sterilization 538.05
Anaerobic digestion
anaerobic digestion 88.42 663.15
Upgrading of biogas
359.10 117.52
Biorefinery 99.45 2210.03 2652.02 Composting Separation, drying, composting 586.47 Total 6829.21 7507.35 20701.61 24841.92 Net production 13872.41 17334.57 Exergy of production
13872.41 3484.10
Recycling of the materials is analyzed in accordance with technical details of recycling processes given in
(Rigamonti, Grosso, & Giugliano, 2009). Amount of recycled materials and exergy contents are reported in
Table 15. Produced compost from residue of the AD process (digestate) is presented in Table 16.
Table 15. Amount and exergy of recycled materials
Recycled material (Ton) Specific exergy (MJ/Ton)
Exergy (TJ)
Paper& cardboard 3787017.47 17000 64379.297 Textile 178244.21 13904.76 2478.44292 Plastic 1609085.94 32502.16 52298.7687 Glass 70720.43 131.48 9.2983224 Metal (Al) 27796.41 32928.09 915.282752 Metal (Fe) 1060549.29 6740.69 7148.83399 Other metals (Cu) 14773.31 2112.06 31.202125 Wood 422209.18 20658.24 8722.09851 Total 135983.224

Candeniz Seçkin (Environmental Remediation Cost of Industrial Solid Waste in Terms of Extended Exergy)
58
Table 16. Amount and exergy of produced compost
Amount of produced compost (Ton) 398461.19 Exergy of compost (MJ/Ton) 18373.31 Exergy of total produced compost (TJ) 7321.05
Calculation of exergy equivalent of externalities
The exergetic equivalent of labor (eeL) is defined as the exergy used to generate one work-hour and calculated
as (9):
wh
inL N
Exee
a=
(9)
where, eeL(MJ/hour), exergetic equivalent of labor; a, the fraction of the primary exergy embodied into
labour; Ein (MJ/year), global exergy influx and Nwh (hours/year), cumulative number of work hours (Sciubba,
2011).
The unit exergetic equivalent of capital (eeK) is defined as the equivalent primary exergy resource embodied in
one monetary unit and calculated as (10):
(10)
where, eeK (MJ/$), exergetic equivalent of capital; β, an amplification factor that accounts for the creation of
wealth due to exclusively financial activities (TalensPeiró, 2010); M2 ($/year), money + quasi-money
circulation; S ($/year), global wages and salaries in a country.
Exergetic equivalent of labour and capital is calculated as:
LL eexLEE = (11)
KC eexCEE = (12)
where, L(hours), workhours; C($), capital; EEL and EEC are defined in Section 1.
To calculate the econometric factors a and b, (13-16) are occupied:
hsurvused N x e x fx365 = E (13)
S)-(ME ×β × α
=ee2
inK
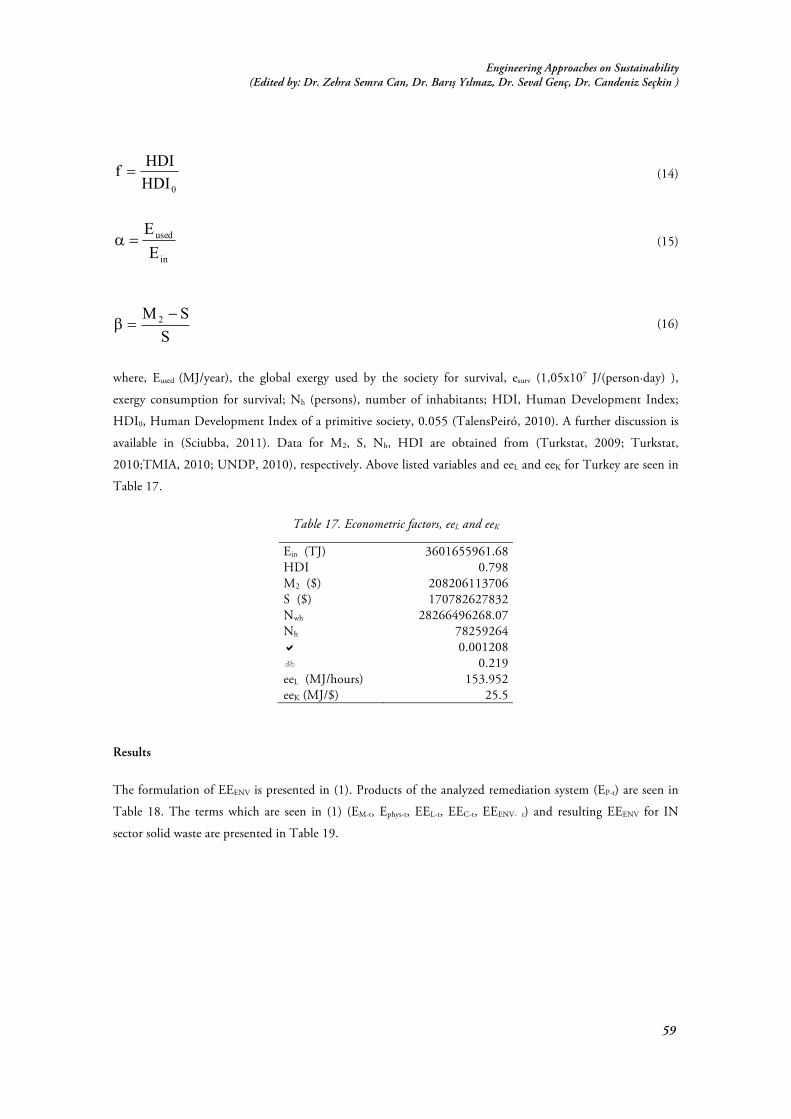
Engineering Approaches on Sustainability (Edited by: Dr. Zehra Semra Can, Dr. Barış Yılmaz, Dr. Seval Genç, Dr. Candeniz Seçkin )
59
0HDIHDIf =
(14)
in
used
EE
=a
(15)
SSM2 -=b
(16)
where, Eused (MJ/year), the global exergy used by the society for survival, esurv (1,05x10⁷ J/(person·day) ),
exergy consumption for survival; Nh (persons), number of inhabitants; HDI, Human Development Index;
HDI0, Human Development Index of a primitive society, 0.055 (TalensPeiró, 2010). A further discussion is
available in (Sciubba, 2011). Data for M2, S, Nh, HDI are obtained from (Turkstat, 2009; Turkstat,
2010;TMIA, 2010; UNDP, 2010), respectively. Above listed variables and eeL and eeK for Turkey are seen in
Table 17.
Table 17. Econometric factors, eeL and eeK
Ein (TJ) 3601655961.68 HDI 0.798 M2 ($) 208206113706 S ($) 170782627832 Nwh 28266496268.07 Nh 78259264 a 0.001208 b 0.219 eeL (MJ/hours) 153.952 eeK (MJ/$) 25.5
Results
The formulation of EEENV is presented in (1). Products of the analyzed remediation system (EP-t) are seen in
Table 18. The terms which are seen in (1) (EM-t, Ephys-t, EEL-t, EEC-t, EEENV- t) and resulting EEENV for IN
sector solid waste are presented in Table 19.
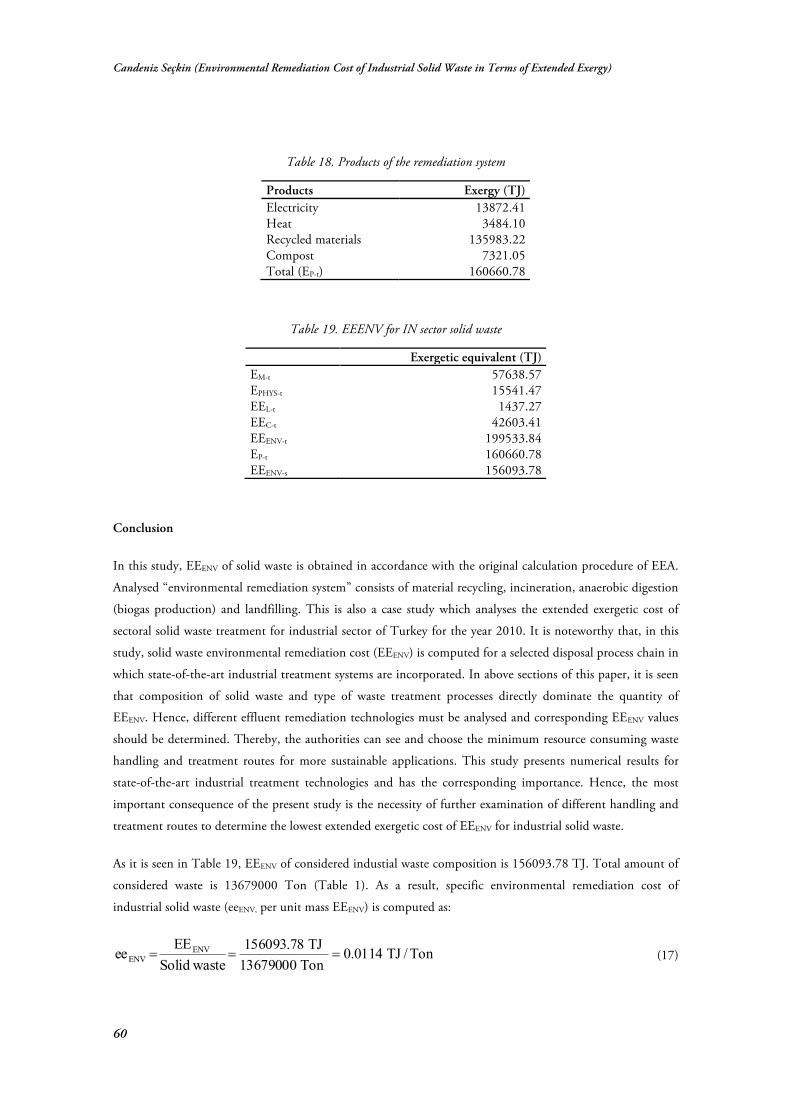
Candeniz Seçkin (Environmental Remediation Cost of Industrial Solid Waste in Terms of Extended Exergy)
60
Table 18. Products of the remediation system
Products Exergy (TJ) Electricity 13872.41 Heat 3484.10 Recycled materials 135983.22 Compost 7321.05 Total (EP-t) 160660.78
Table 19. EEENV for IN sector solid waste
Exergetic equivalent (TJ) EM-t 57638.57 EPHYS-t 15541.47 EEL-t 1437.27 EEC-t 42603.41 EEENV-t 199533.84 EP-t 160660.78 EEENV-s 156093.78
Conclusion
In this study, EEENV of solid waste is obtained in accordance with the original calculation procedure of EEA.
Analysed “environmental remediation system” consists of material recycling, incineration, anaerobic digestion
(biogas production) and landfilling. This is also a case study which analyses the extended exergetic cost of
sectoral solid waste treatment for industrial sector of Turkey for the year 2010. It is noteworthy that, in this
study, solid waste environmental remediation cost (EEENV) is computed for a selected disposal process chain in
which state-of-the-art industrial treatment systems are incorporated. In above sections of this paper, it is seen
that composition of solid waste and type of waste treatment processes directly dominate the quantity of
EEENV. Hence, different effluent remediation technologies must be analysed and corresponding EEENV values
should be determined. Thereby, the authorities can see and choose the minimum resource consuming waste
handling and treatment routes for more sustainable applications. This study presents numerical results for
state-of-the-art industrial treatment technologies and has the corresponding importance. Hence, the most
important consequence of the present study is the necessity of further examination of different handling and
treatment routes to determine the lowest extended exergetic cost of EEENV for industrial solid waste.
As it is seen in Table 19, EEENV of considered industial waste composition is 156093.78 TJ. Total amount of
considered waste is 13679000 Ton (Table 1). As a result, specific environmental remediation cost of
industrial solid waste (eeENV, per unit mass EEENV) is computed as:
Ton/TJ0114.0Ton 13679000
TJ78.156093 wasteSolid
EEee ENV
ENV ===
(17)

Engineering Approaches on Sustainability (Edited by: Dr. Zehra Semra Can, Dr. Barış Yılmaz, Dr. Seval Genç, Dr. Candeniz Seçkin )
61
Similar analyses are performed for municipal solid waste and tertiary sector solid waste in earlier studies for
the year 2006 (Seckin & Bayulken, 2012a, 2012b). Results are 0.0216 TJ/ton-waste and 0.023 TJ/ton-waste
for tertiary sector and municipal solid waste, respectively. eeENV determined for industrial solid waste in this
study is relatively lower due to the different waste composition of the sector. It is concluded that low organic
waste and relatively higher recyclable portion (primarily paper & cupboard and plastics) in total waste content
results in higher recycled materials in system products (as presented in Table 18), hence, lower EEENV (based
on (1)) and lower specific environmental remediation cost for industrial solid waste.
Nomenclature
AD anaerobic digestion
CExC cumulative exergy consumption, J
CHP combined heat and power
E exergy, J
EE extended exergy, J
ee specific extended exergy, J/(hour, mass, $,...)
EEA extended exergy accounting
EEENV environmental remediation cost, J
Ein global exergy influx, J/year
Eused the global exergy used by the society for survival (J/year)
HDI human development index
IC investment cost, $
LHV low heating value, J
M2 money + quasi-money circulation, $/year
Nh population
Nwh cumulative number of work hours, hours
OP operation and maintenance cost, $
P product
S global wages and salaries in a country, $/year
T0 ambient temperature, °C
TRP transportation line
Greek symbols
$ Dollar
€ Euro
b an amplification factor represents the creation of wealth due to exclusively financial activities
a fraction of the primary exergy embodied into labour

Candeniz Seçkin (Environmental Remediation Cost of Industrial Solid Waste in Terms of Extended Exergy)
62
Subscripts and superscripts
C capital
el electrical
ENV environmental remediation
h heat
L labour
M material
phys physical
t for treatment system
References
Appels, L., Baeyens, J., Degreve, J., & Dewil R. (2008). Principles and potential of the anaerobic digestion of waste-activated sludge. Prog Energy Combust Sci, 34, 755–81.
Ayres, R. U., & Ayres, L. W. (1999). Accounting for resources 2: The life cycle of materials. Cheltenham, UK: Edward Elgar Publishing.
Bejan, A, Tsatsaronis, G., & Moran, M. (1996). Thermal Design and Optimization. New York: John Wiley & Sons. Berglund, M., & Borjesson, P. (2006). Assessment of energy performance in the life-cycle of biogas production. Biomass
and Bioenergy, 30, 254-266. Bezdek, R. H., & Wendling, R.M. (2010). Establishing benchmarks for environmental comparison 2008. Retrieved
October 12, 2016, from http://www.misi-net.com/publications/ModernPowerSystems-1206.pdf BP (2017). BP pompa fiyatlari. Retrieved December 15, 2016, from http://www.bppompafiyatlari.com Chen, G. Q., & Chen, B. (2009). Extended-exergy analysis of the Chinese society. Energy, 34,1127-44. Chen, T. C., & Cheng, F. L. (2008). Greenhouse gases emissions from waste management practices using Life Cycle
Inventory model. Journal of Hazardous Materials, 155, 23–31. Corrado, A., Fiorini, P., & Sciubba, E. (2006) Environmental assessment and extended exergy analysis of a ‘‘zero CO2
emission’’ high-efficiency steam power plant. Energy, 31, 3186-98. De Hullu, J., Maassen, J. I. W., Van Meel, P. A., & Shazad, S. (2008). Comparing different biogas upgrading techniques.
Final report 2008. Retrieved October 12, 2016, from http://students.chem.tue.nl/ifp24/BiogasPublic.pdf Eggleston, S., Buendia, L., Miwa, K., Ngara, T., & Tanabe, K. (2006). IPCC Guidelines for National Greenhouse Gas
Inventories. IPCC National Greenhouse Gas Inventories Programme, Institute for Global Environmental Strategies, Hayama, Kanagawa, Japan. Retrieved October 12, 2016, from http://www.ipcc-nggip.iges.or.jp/public/2006gl/index.html
EEA. (2002, March 21). Biodegradable municipal waste management in Europe, Part 3: Technology and market issues. Topic report No 15/2001, European Environment Agency. Retrieved October 12, 2011, from http://scp.eionet.europa.eu/publications/topic15_2001
EIA. (U. S. Energy Information Administration). (2012). Updated Capital Cost Estimates for Electricity Generation Plants 2010. Retrieved October 12, 2016, from http://www.mit.edu/~jparsons/current%20downloads/EIA%202010%20updated%20capital%20costs.pdf
GCC. (2010). Waste Awareness Sustainability Technology Environment Strategy 2009. Glasgow City Council. Retrieved March 12, 2013, from http://www.glasgow.gov.uk/NR/rdonlyres/FC2FE19A-3FAE-44EF-9ACE-9333DD882DF4/0/WasteStrategy101Jpublishedversion.pdf
MREC. (2003). Anaerobic digestion of farm and food processing residues, Good Practice Guidelines. Midwest Rural Energy Council. Retrieved October 12, 2016, from http://www.mrec.org/biogas/adgpg.pdf
Poschl , M., Ward, S., & Owende, P. (2010). Evaluation of energy efficiency of various biogas production and utilization pathways. Applied Energy, 87:3305–3321.
Ptasinski, K. J., Koymans, M. N., & Verspagen, H. H. G. (2006). Performance of the Dutch energy sector based on energy, exergy and extended exergy accounting. Energy, 31, 3135-44.
Engineering Approaches on Sustainability (Edited by: Dr. Zehra Semra Can, Dr. Barış Yılmaz, Dr. Seval Genç, Dr. Candeniz Seçkin )
63
Rigamonti, L., Grosso, M., & Giugliano, M. (2009). Life cycle assessment for optimising the level of separated collection in integrated MSW management systems. Waste Management, 29, 934–944.
Salihoglu, G. (2010). Industrial hazardous waste management in Turkey: Current state of the field and primary challenges, Journal of Hazardous Materials, 177, 42–56.
Sciubba, E. (2001). Beyond thermoeconomics? The concept of extended exergy accounting and its application to the analysis and design of thermal systems. Exergy Int J., 1, 68–84.
Sciubba, E. (2002). Using exergy to evaluate environmental externalities. Paper presented at the meeting of IV NTVA Seminar of Industrial Ecology, Trondheim, Norway.
Sciubba, E. (2003a). Cost analysis of energy conversion systems via a novel resource based quantifier. Energy, 28, 457–477.
Sciubba, E. (2003b). Extended exergy accounting applied to energy recovery from waste: The concept of total recycling. Energy, 28, 1315–1334.
Sciubba, E. (2005). Exergo-economics: thermodynamic foundation for a more rational resource use. Int J Energy Res., 29, 613–636.
Sciubba, E. (2009). Exergy-based Ecological Indicators: a necessary tool for Resource Use assessment studies. In: Paper presented at the meeting of IEEES, Sharjah, UAE.
Sciubba, E. (2011). A revised calculation of the econometric factors a and b for the extended exergy accounting method. Ecol Model., 222, 1060–1066.
Sciubba, E., Bastianoni, S., & Tiezzi, E. (2008). Exergy and extended exergy accounting of very large complex systems with an application to the province of Siena, Italy. J Environ Manage., 86, 372–382.
Seckin, C., & Bayulken, A. R. (2012a). Environmental Remediation Cost of Solid Waste in EEA Methodology – An Application to Turkish Tertiary Sector Solid Waste. Paper presented at the meeting of GCGW 2012 (Global Conference on Global Warming 2012), 8–12 July 2012, Istanbul, Turkey.
Seckin, C. & Bayulken, A. R. (2012b). Determination of environmental remediation cost of municipal waste in terms of extended exergy. Paper presented at the meeting of ECOS 2012 (25th International Conference on Efficiency, Cost, Optimization, Simulation and Environmental Impact of Energy Systems), 26–29 June 2012, Perugia, Italya.
Seckin, C., Sciubba, E., & Bayulken, A. R. (2013). Extended exergy analysis of Turkish transportation sector. J Clean Prod., 47, 422-436.
Smith, A., Brown, K., Steve, O., Kathryn, R., & Bates J. (2001). Waste Management Options and Climate Change Final report to the European Commission. Retrieved October 13, 2016, from http://ec.europa.eu/environment/waste/studies/pdf/climate_change.pdf
SWAP (Save Waste & Prosper). (2005). Commercial and industrial waste in the Yorkshire and Humber Region. Retrieved October 13, 2016, from http://www.lgyh.gov.uk/dnlds/CI%20Final%20Report%20V5.pdf
Switzerland Global Enterprise, (2015). Market report: Waste Management In Turkey. Retrieved October 13, 2016, from http://www.s- ge.com/sites/default/files/private_files/BBK_Waste_management_report_Turkey_0.pdf
Szargut, J., Morris, D. R., & Steward, F. R. (1988). Exergy Analysis of Thermal, Chemical and Metallurgical Processes. New York, USA: Hemisphere Pub.
TalensPeiró, L., Villalba Méndez, G., Sciubba E., & Gabarrelli Durany, X. (2010). Extended exergy accounting applied to biodiesel production. Energy, 35, 2861-69.
Tchobanoglous, G., Burton, F. L., & Stensel, H. D. (2002). Wastewater engineering treatment disposal reuse. 4th ed. Boston: McGraw-Hill and Metcalf & Eddy Inc.
TMIA. (2010). Turkish Ministry of the Interior Affairs. Retrieved October 13, 2016, from http://www.nvi.gov.tr. Turkstat (2009). Annual Industry and Service Statistics. Ankara, Turkey: Turkish Statistical Institute. Turkstat (2010). Statistical Indicators 1923-2007. Ankara, Turkey: Turkish Statistical Institute. Turkstat (2011). İmalat Sanayi Atık Göstergeleri. Ankara, Turkey: Turkish Statistical Institute. UNDP. (2010). Human development indices report 2008. United Nations Development Programme. Retrieved October
13, 2016, from http://hdr.undp.org/en/media/HDI_2008_EN_Tables.pdf UNEP. (2005). Solid Waste Management. United Nations Environment Programme. Retrieved October 13, 2016, from
http://www.unep.or.jp/ietc/publications/spc/solid_waste_management/index.asp Zhang, B., & Chen, G. Q. (2010). Physical sustainability assessment for the China society. Renewable and Sustainable
Energy Reviews, 14, 1527-45.


Engineering Approaches on Sustainability (Edited by: Dr. Zehra Semra Can, Dr. Barış Yılmaz, Dr. Seval Genç, Dr. Candeniz Seçkin )
65
4 Maximizing Overall Energy Performance of a Multiple Use Building by Integrating Advanced Building System Hatice Sözer Ergin Kükrer Abstract
According to recent studies, building consumption covers nearly 30-40% of total energy consumption in developed countries. Considering this in the city scale, building energy efficiency has become more significant in the case of energy consumption and carbon footprint reduction. In this study, a set of renovation intervention’s strategies were investigated in a multiple used building as a case study. The renovation strategies were based on detailed existing building energy performance analysis which has 18.108 m2 conditioned area with a multifunctional use including a restaurant, gymnasium, doctor rooms, terraces and 228 residential rooms for elderly accommodation. The existing building’s systems have conventional type of heating and cooling systems; air cooled chiller for cooling, and natural gas boilers for heating and DHW needs. In the study, existing case conditions were improved by proposed interventions which are integration of insulation and replacement of lighting systems and windows. Also major renovation has done to improve the mechanical systems by integrating renewable systems such as solar thermal and heat pump systems as well as monitoring and controlling systems. The detailed energy performance analysis of the building and systems were introduced in this paper. As a result of the proposed interventions and advanced building system integration, more than 60% improvement in energy and correspondingly a 70 kg/m2year approximate greenhouse gas emission reduction were estimated throughout whole year period in the building. Keywords: Energy Efficiency, Energy Efficient Building Design, Sustainability, Zero Energy Buildings

Hatice Sözer, Ergin Kükrer (Maximizing Overall Energy Performance of a Multiple Use Building by Integrating Advanced Building System)
66
Introduction
evelopment in the technology and industry fields has led the energy consumption increase in the
recent years. Since the global need for energy has been increasing with each passing day, its
environmental effects and energy consumption have become greater unavoidably. According to
International Energy Agency statistics, CO2 emissions from fuel combustion has increased by 130% from
1971 to 2013 (IEA, 2015). Furthermore, researches reveal that buildings are responsible for nearly 40% of the
total energy consumption in developed countries (UNEP, 2009; Perez-Lombard et al., 2008). Considering
this in the city scale, building energy efficiency has become more significant in the case of energy
consumption and carbon footprint reduction. Accordingly, energy efficiency in buildings is regarded as one
of the most critical and significant topics in the field of energy. The main aim is to investigate how to
maximize energy savings and reach better efficiencies by utilizing renewable energy sources for building’s
energy needs (Aksamija, 2016). In the literature, a variety of researches can be found referring to optimization
of building energy consumption. Rose and Thomsen have investigated energy saving potential of non-
residential buildings in Denmark by applying a wide range of energy efficiency measures ranging from the
application of renewable systems to optimization of building envelope (Rose and Thomsen, 2015).
Retrofitting activities are resulted with 45 to 85% less energy consumption amongst four exemplary project.
Using a similar approach but referring residential buildings this time, Wang and Holmberg weighed the
energy saving potential of four retrofitted Swedish buildings. Within the retrofitting activities, energy
reduction was found out to be 36 to 54% (Wang & Holmberg, 2015). Additionally, Lam, Wang and Yang
investigated the consumption profile of 10 office-buildings in China. (Lam, Wang & Yang, 2008) According
to the consumption profiles of the buildings; a variety of Energy Conservation Measures (ECMs) are
identified. Using a parametric and sensitivity analysis by dynamic building simulation techniques, it is found
out that up to 14% electricity savings is possible. In another research by Causone et al., zero energy building
concept is addressed in a residential building (Causone et. al., 2014). To obtain the maximum energy
performance, high thermal performance building envelope materials have been used as well as application of
renewable technologies and passive strategies such as free cooling or natural ventilation in a pilot single family
house. The building’s performance is obtained monthly via energy simulation. Results have revealed that a big
portion of the energy consumption can be covered by applying convenient technologies and control strategies
and accordingly energy efficiency can be increased. Similar approach have been conducted in Alajmi et al.’s
study, yet, in a hot climate. (Alajmi, et.al., 2016) Using the renewable technologies, nearly zero energy
building target is obtained in a building placed in Kuwait. The study has resulted with lower consumption
ratios and up to 848 tons of CO2 reduction. Also in economic aspect, a considerable number of researches
have proved that when appropriate technologies are applied considering a number of parameters such as
building type, climatic conditions or occupant profiles, building are improved not only on the basis of energy
and environmental issues but also economically in long term. (Zavadskas et.al, 2016; Goggins et. al; 2016;
Ferrara et. al., 2016)
The objective of this study is to investigate and maximize the overall performance of a multiple-use building
by integrating different interventions and strategies. In the paper, a set of renovation intervention’s strategies
D
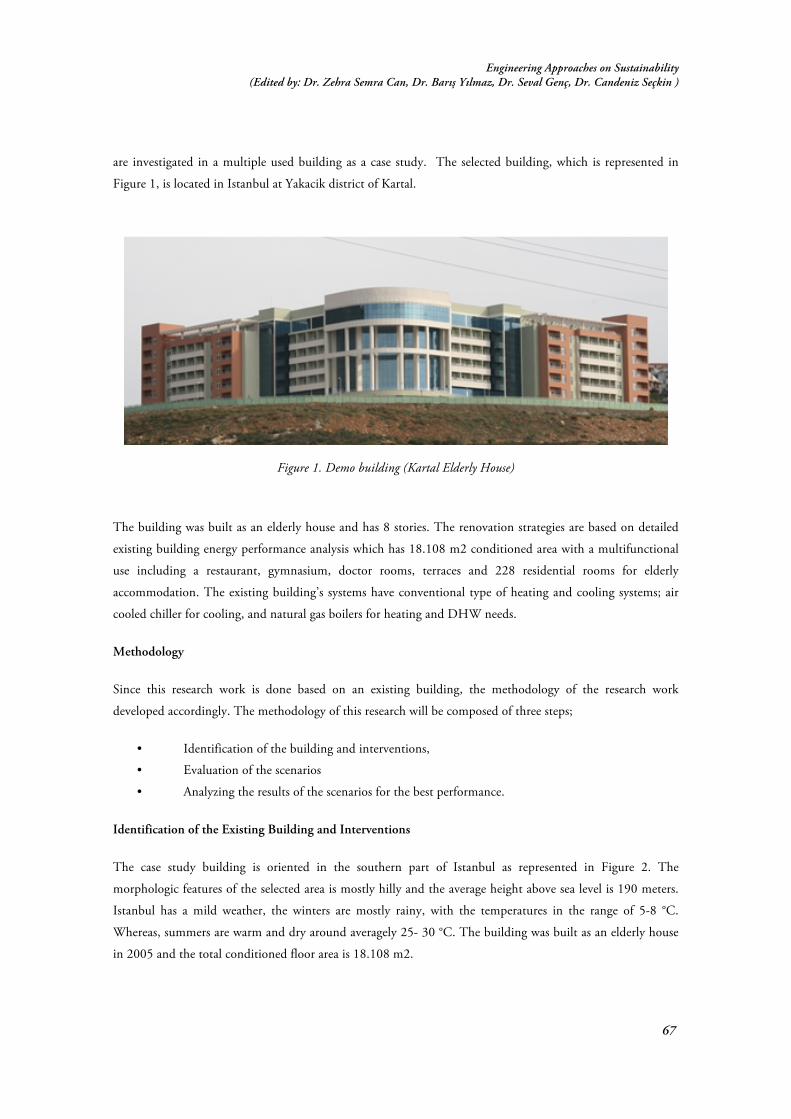
Engineering Approaches on Sustainability (Edited by: Dr. Zehra Semra Can, Dr. Barış Yılmaz, Dr. Seval Genç, Dr. Candeniz Seçkin )
67
are investigated in a multiple used building as a case study. The selected building, which is represented in
Figure 1, is located in Istanbul at Yakacik district of Kartal.
Figure 1. Demo building (Kartal Elderly House)
The building was built as an elderly house and has 8 stories. The renovation strategies are based on detailed
existing building energy performance analysis which has 18.108 m2 conditioned area with a multifunctional
use including a restaurant, gymnasium, doctor rooms, terraces and 228 residential rooms for elderly
accommodation. The existing building’s systems have conventional type of heating and cooling systems; air
cooled chiller for cooling, and natural gas boilers for heating and DHW needs.
Methodology
Since this research work is done based on an existing building, the methodology of the research work
developed accordingly. The methodology of this research will be composed of three steps;
• Identification of the building and interventions,
• Evaluation of the scenarios
• Analyzing the results of the scenarios for the best performance.
Identification of the Existing Building and Interventions
The case study building is oriented in the southern part of Istanbul as represented in Figure 2. The
morphologic features of the selected area is mostly hilly and the average height above sea level is 190 meters.
Istanbul has a mild weather, the winters are mostly rainy, with the temperatures in the range of 5-8 °C.
Whereas, summers are warm and dry around averagely 25- 30 °C. The building was built as an elderly house
in 2005 and the total conditioned floor area is 18.108 m2.

Hatice Sözer, Ergin Kükrer (Maximizing Overall Energy Performance of a Multiple Use Building by Integrating Advanced Building System)
68
Figure 2. Demo building location in Istanbul
The existing building walls have two different characteristics:
• External walls of the residence rooms are insulated with 5 cm low density expanded polystyrene
(EPS), yet, in most of the rooms material is either damaged or in a bad condition.
• External walls of the common spaces do not have any level of thermal insulation.
Building has a pitched roof with asphalt based water insulation and EPS thermal insulation. There are
different types of windows in terms of glasses and window frames depending on the area of the building.
Residential rooms are equipped with double glazed windows with aluminum frame and common areas have
double glazed windows with vinyl frame. Residential rooms have also curtains to protect from extra solar
radiation and heat gain as well as to respect residents’ privacy.
Also as far as mechanical systems are addressed, two-pipe fan-coil units are used for heating and cooling
purposes in the entire building. In addition to these systems, air handling units are used for heating, cooling
& ventilation in the restaurant (located on fifth floor), in the swimming pool and the conference room
(located on first basement floor). In the existing case, common spaces use fluorescence lamps while bedrooms
use incandescent lamps. Fire protection sensors and electrical boards are located on each unit.
After identification of the existing building specifications, a set of interventions are proposed to enhance
energy efficiency in the building. In the study, existing case conditions are improved by proposed
interventions which are integration of insulation and replacement of lighting systems and windows. Also
major renovation has done to improve the mechanical systems by integrating renewable systems such as solar
thermal and heat pump systems as well as monitoring and controlling systems. All interventions are
summarized in Table 1 in terms of Energy Conservation Measures (ECMs).

Engineering Approaches on Sustainability (Edited by: Dr. Zehra Semra Can, Dr. Barış Yılmaz, Dr. Seval Genç, Dr. Candeniz Seçkin )
69
ECM1 and ECM6 thermal insulation application and windows replacement aim to improve thermal
performance of the building envelope and accordingly reduce heat losses. Regarding insulation of envelope,
four alternatives are investigated considering their specifications. Analysis results have shown that higher
energy savings are provided by optimization of U-values. On the basis of the results, 0.327 W/m2K has been
found out the optimum value for building’s exterior wall. Whereas, considering replacement of glazing,
ECM6 is accepted which includes all glazing; both resident windows and curtain walls. ECM2 includes
application of radiant heating and cooling systems. The purpose of this intervention is reduce space heating
loads with a modern and energy efficient system while providing comfortable indoor spaces which is called as
radiant heating and cooling. Additionally, solar thermal system (ECM3) is accepted due to its high
contribution potential. Simulations have suggested that installation of solar thermal system is beneficial for
Istanbul climate in terms of producing DHW. Existing lighting system leads to inefficiency since existing
building has incandescent lightings. Consequently, ECM4 which is LED lighting with sensor is determined
due to its energy saving potential in terms of electricity. Energy automation and monitoring system
application (ECM5) is another intervention that is applied to the demo building which offers an instant
monitoring and controlling of the mechanical systems; consequently better automation.
Table 1. Interventions applied to the demo building
Interventions Code Thermal insulation application ECM1 Radiant heating and cooling system application ECM2 Solar thermal system application ECM3 Efficient building appliances and lighting system (LED) application ECM4
Energy automation and monitoring system application ECM5 Windows replacement application ECM6 Water saving systems application ECM7 Geothermal heat pump application ECM8
With respect to water saving system ECM7 is induced. The intervention includes grey water reuse, rain water
reuse and installation of water efficient equipment. Lastly, heat pump application (ECM8) is considered to
integrate renewable resources and accordingly enhance efficiency of the building by minimizing the thermal
energy consumption.
Taking the all ECMs described and on the basis, six different scenarios combining different interventions are
identified and given in Table 2.
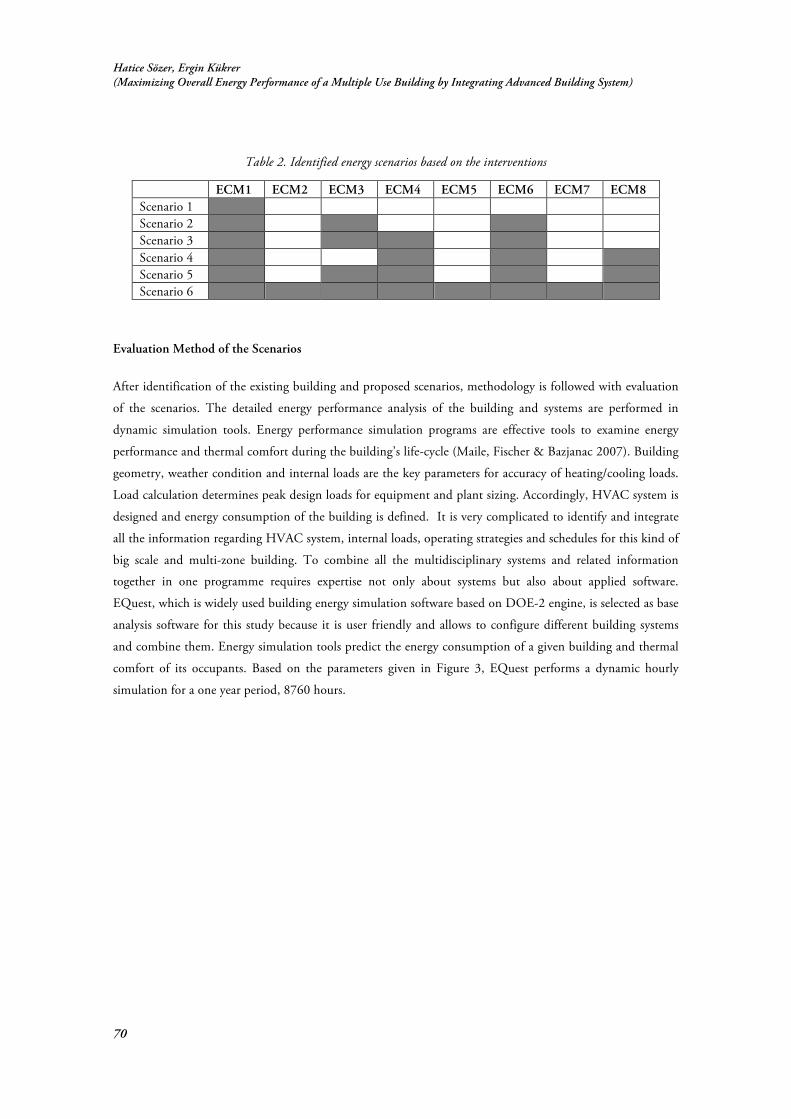
Hatice Sözer, Ergin Kükrer (Maximizing Overall Energy Performance of a Multiple Use Building by Integrating Advanced Building System)
70
Table 2. Identified energy scenarios based on the interventions
ECM1 ECM2 ECM3 ECM4 ECM5 ECM6 ECM7 ECM8 Scenario 1 Scenario 2 Scenario 3 Scenario 4 Scenario 5 Scenario 6
Evaluation Method of the Scenarios
After identification of the existing building and proposed scenarios, methodology is followed with evaluation
of the scenarios. The detailed energy performance analysis of the building and systems are performed in
dynamic simulation tools. Energy performance simulation programs are effective tools to examine energy
performance and thermal comfort during the building’s life-cycle (Maile, Fischer & Bazjanac 2007). Building
geometry, weather condition and internal loads are the key parameters for accuracy of heating/cooling loads.
Load calculation determines peak design loads for equipment and plant sizing. Accordingly, HVAC system is
designed and energy consumption of the building is defined. It is very complicated to identify and integrate
all the information regarding HVAC system, internal loads, operating strategies and schedules for this kind of
big scale and multi-zone building. To combine all the multidisciplinary systems and related information
together in one programme requires expertise not only about systems but also about applied software.
EQuest, which is widely used building energy simulation software based on DOE-2 engine, is selected as base
analysis software for this study because it is user friendly and allows to configure different building systems
and combine them. Energy simulation tools predict the energy consumption of a given building and thermal
comfort of its occupants. Based on the parameters given in Figure 3, EQuest performs a dynamic hourly
simulation for a one year period, 8760 hours.
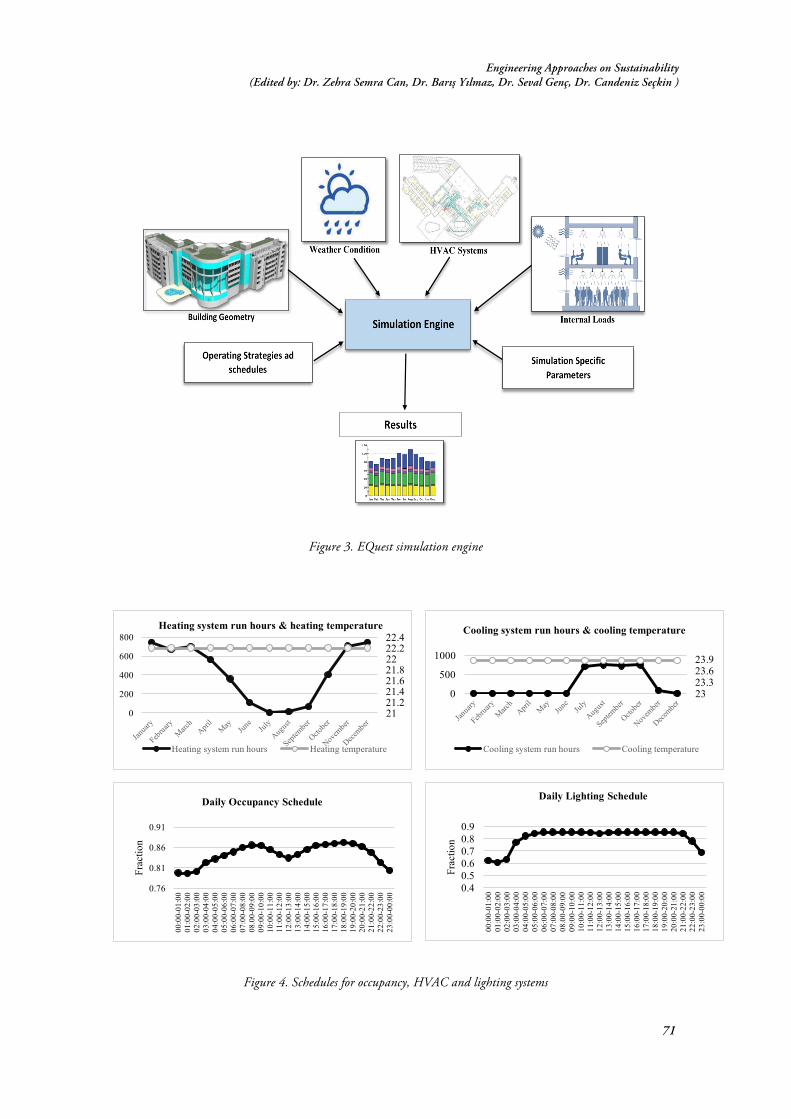
Engineering Approaches on Sustainability (Edited by: Dr. Zehra Semra Can, Dr. Barış Yılmaz, Dr. Seval Genç, Dr. Candeniz Seçkin )
71
Figure 3. EQuest simulation engine
Figure 4. Schedules for occupancy, HVAC and lighting systems
0.40.50.60.70.80.9
00:0
0-01
:00
01:0
0-02
:00
02:0
0-03
:00
03:0
0-04
:00
04:0
0-05
:00
05:0
0-06
:00
06:0
0-07
:00
07:0
0-08
:00
08.0
0-09
:00
09:0
0-10
:00
10:0
0-11
:00
11:0
0-12
:00
12:0
0-13
:00
13:0
0-14
:00
14:0
0-15
:00
15:0
0-16
:00
16:0
0-17
:00
17:0
0-18
:00
18:0
0-19
:00
19:0
0-20
:00
20:0
0-21
:00
21:0
0-22
:00
22:0
0-23
:00
23:0
0-00
:00
Frac
tion
Daily Lighting Schedule
0.76
0.81
0.86
0.91
00:0
0-01
:00
01:0
0-02
:00
02:0
0-03
:00
03:0
0-04
:00
04:0
0-05
:00
05:0
0-06
:00
06:0
0-07
:00
07:0
0-08
:00
08.0
0-09
:00
09:0
0-10
:00
10:0
0-11
:00
11:0
0-12
:00
12:0
0-13
:00
13:0
0-14
:00
14:0
0-15
:00
15:0
0-16
:00
16:0
0-17
:00
17:0
0-18
:00
18:0
0-19
:00
19:0
0-20
:00
20:0
0-21
:00
21:0
0-22
:00
22:0
0-23
:00
23:0
0-00
:00
Frac
tion
Daily Occupancy Schedule
2121.221.421.621.82222.222.4
0
200
400
600
800Heating system run hours & heating temperature
Heating system run hours Heating temperature
2323.323.623.9
0
500
1000
Cooling system run hours & cooling temperature
Cooling system run hours Cooling temperature

Hatice Sözer, Ergin Kükrer (Maximizing Overall Energy Performance of a Multiple Use Building by Integrating Advanced Building System)
72
As it is indicated in the Figure 4, building geometry, weather condition and internal loads are the key
parameters for accuracy of heating/cooling loads. Load calculation determines peak design loads for
equipment and plant sizing. Accordingly, HVAC system is designed and energy consumption of the building
is defined. Considering schedules and thermal properties of building envelope according to actual state, which
are illustrated in the Figure 4 and Table 3, building simulation model has been created.
Table 3. Thermal properties of the building envelope
Exterior walls Underground walls Roof Floor Windows U-value (W/m2K) 0,327 0,482 0,4 2,4 1,6
Analyzing results of the scenarios for the best performance
In the evaluation phase, generation of the simulation model is explained. All factors that affect heating and
cooling loads are modelled in detail to get precise results for the energy consumption. After building’s
simulation model generation, the model is performed to get both existing condition’s and energy scenarios’
results. Simulation model of the building is represented in Figure 5.
Figure 5. Simulation model of the building
Results are collected under varied titles such as lighting, misc. equipment, space heating, space cooling,
pumps, ventilation fans domestic hot water (DHW).

Engineering Approaches on Sustainability (Edited by: Dr. Zehra Semra Can, Dr. Barış Yılmaz, Dr. Seval Genç, Dr. Candeniz Seçkin )
73
Figure 6. Total annual energy consumption of the existing case and scenarios
As a result of proposed interventions in this research, more than 60% energy performance improvement and
correspondingly a 70 kg/m2year approximate greenhouse gas emission reduction are estimated throughout
whole year period. Energy consumption breakdown on the basis of scenarios is represented in Figure 5 as it
follows.
In addition to lighting systems, building thermal energy systems are renovated. As other researches have
revealed, geothermal heat pumps offer up to 30-55% efficient systems based on climatic conditions and
application (Morrone, Coppola & Raucci, 2014; Self, Reddy & Rosen 2013). Similarly, in this study, scale of
the thermal consumption is reduced dramatically due to the integration of the heat pump system to the
building in Scenario 4. In the baseline case all the heating was being covered with the conventional boilers
that works with natural gas. As a consequence of geothermal and air source heat pump installation, thermal
peak load of the building is reduced substantially. Renewable heat pump systems that use site ground water
have led approximately 50% efficiency in thermal consumption in comparison with the existing conditions.
In addition to new HVAC system, solar thermal applications are applied for domestic hot water preparation.
According to researches, climatic conditions are highly favourable for solar thermal applications especially for
hot water heating in the region. (Benli, 2016) Consequently, in Scenario 5, solar thermal collectors are placed
to the building. Integration of solar thermal technologies has increased the efficiency by lowering DHW
consumption by 33%, as results have proved. Finally, Scenario 6 which is the combination of all proposed
interventions has been found out to be the best scenario for the building with approximately 60% less energy
consumption compare to the existing case of the building.
0
1000000
2000000
3000000
4000000
5000000
6000000
7000000
8000000
9000000
ExistingCase Scenario1 Scenario2 Scenario3 Scenario4 Scenario5 Scenario6
EnergyCon
sumption(kWh)
Lights Misc.Equip SpaceHeating SpaceCooling Pumps VentFan DomesticHotWater

Hatice Sözer, Ergin Kükrer (Maximizing Overall Energy Performance of a Multiple Use Building by Integrating Advanced Building System)
74
Conclusion
The research emphasizes the significance of sustainable development in the city environment which is very
complex and requires advanced integration of building systems and interventions in different categories. The
findings of this investigation have a number of important implications for future practice. Both existing
condition of the case building and defined interventions are identified based on its critical parameters and
explained in detail. The result of each scenario showed that there is dramatic reduction on total energy
consumption of the building. As illustrated in the results, improvement on energy was basically coming from
the integration of major energy sources (such as heat pump systems, solar collectors or LED) which was the
result of major building renovation. With the careful design strategies of all the mentioned building systems
final energy consumption reduction is up to 60%. In comparison to other studies referred in this study, the
saving percentage is convenient since it is an outcome of major renovation works; both in the field of building
envelope and integration of an advanced building system. This value can be taken into account as a
representative percentage of how energy consumption can be diminished in such big scale buildings that have
different types of systems. Another critical issue to get this dramatic improvement is that the applied
interventions are mainly depend on renewable sources. This also has major effect on the environmental index
by reducing the CO2 emissions. 70 kg/m2year approximate greenhouse gas emission reduction is expected
within the renovation activities.
Acknowledgements
This paper is produced based on a FP7 project called “R2CITIES: Renovation of Residential urban spaces:
Towards nearly zero energy CITIES, Grant Agreement No: 314473”.
References
Aksamija A. (2016). Regenerative design and adaptive reuse of existing commercial buildings for net-zero energy use, Sustainable Cities and Society, 27, pp. 185 – 195.
Alajmi A., Abou-ziyan H., & Ghoneim A. (2016). Achieving annual and monthly net-zero energy of existing building in hot climate. Applied Energy, 165, 511–521.
Aman M. M., Jasmon G.B., Mokhlis H & Bakar A.H.A. (2013). Analysis of the performance of domestic lighting lamps, Energy Policy, 52, pp. 482 – 500.
Benli H. (2016). Potential of solar water heaters for hot water production in Turkey, Renewable and Sustainable Energy Reviews, 54, pp. 99 – 109.
Causone F., Carlucci S., Pagliano L., & Pietrobon M. (2014). A zero energy concept building for the Mediterranean climate, Energy Procedia, 62, pp. 280–288.
Ferrara M., Fabrizio E., Virgone J. & Filippi M. (2016) Energy systems in cost-optimized design of nearly zero-energy buildings, Automation in Construction, 70, pp. 109 – 127.
Goggins J., Moran P., Armstrong A. & Hajdukiewicz M. (2016). Lifecycle environmental and economic performance of nearly zero energy buildings (NZEB) in Ireland, Energy and Buildings, 116, pp. 622 – 637.
International Energy Agency. (2015). Key trends in CO2 emissions : CO2 emissions from fuel combustion, Paris, France. Lam J. C., Wan K. K. W., & Yang L. (2008). Sensitivity analysis and energy conservation measures implications, Energy
Conversion and Management, 49, pp. 3170–3177. Maile T., Fischer M., & Bazjanac V. (2007). Building Energy Performance Simulation Tools – A Life-Cycle and
Interoperable Perspective Center for Integrated Facility Engineering, Stanford, CA.

Engineering Approaches on Sustainability (Edited by: Dr. Zehra Semra Can, Dr. Barış Yılmaz, Dr. Seval Genç, Dr. Candeniz Seçkin )
75
Morrone B., Coppola G. & Raucci V. (2014). Energy and economic savings using geothermal heat pump in different climates, Energy Conversion and Management, 88, pp. 189 – 198.
Perez-Lombard L., Ortiz J. & Pout C. (2008). A review on buildings energy consumption information, Energy and Buildings, 40, pp. 394 – 398
Principi P. & Fioretti R. (2014). A comparative life cycle assessment of luminaries for general lighting for the office – compact fluorescent (CFL) vs Light Emitting Diode (LED) – a case study, Journal of Cleaner Production, 83, pp. 96 – 107.
Rose J. & Thomsen K. E. (2015). Energy saving potential in retrofitting of non-residential buildings in Denmark, 6th International Building Physics Conference, pp. 1009 – 1014, Torino, Italy.
Self S. J., Reddy B. V. & Rosen M. A. (2013). Geothermal heat pump systems: Status review and comparison with other heating options, Applied Energy, 101, pp. 341 – 348.
United Nations Environmental Programme. (2009). Buildings and Climate Change: Summary for decision-makers, Paris, France.
Wang Q. & Holmberg S. (2015). A methodology to assess energy demand savings and cost effectiveness of retrofitting in existing Swedish residential buildings, Sustainable Cities and Society, 14, pp. 254 – 266.
Zavadskas E. & Raslanas S. (2008). The selection of effective retrofit scenarios for panel houses in urban neighbourhoods based on expected energy savings and increase in market value : The Vilnius case, Energy and Buildings, 40, pp. 573–587.


Engineering Approaches on Sustainability (Edited by: Dr. Zehra Semra Can, Dr. Barış Yılmaz, Dr. Seval Genç, Dr. Candeniz Seçkin )
77
5 Life Cycle Impact Assessment Analysis on a Cooling System
Zehra Özçelik Yavuz Özçelik Nazlı Yaşar Tunca Abstract
The system that was investigated within this chapter consists of two subsystems one of which are the absorption cycle where cooling is produced and the heat production subsystem where the required heat is supplied to the first system as hot water. The function of a solar assisted absorption system is to produce 100 kW cooling. Solar radiation is the main heat source of solar cooling systems. The goal of using these systems in real life is to produce cooling and to determine the environmental and economic performance of the solar cooling system following the Life Cycle Assessment (LCA) methodology. The Eco-indicator 99 accounts for 10 different categories such as carcinogenic effects, climate change, ionizing radiation, ozone layer depletion, respiratory effects, acidification and eutrophication, toxic emissions, land occupation, extraction of minerals, extraction of fossil fuels that are combined under three types of damages which are human health damages, ecosystem quality damages, damages to resources. Minimum and maximum total costs are calculated as 2034346.08€ and 3366998.48€, when total environmental impacts are at its maximum and minimum which are 280633.14 and 70652.09. Keywords: Life Cycle Assessment; Absorption Cooling System; Solar Assisted cooling system; environmental
impacts

Zehra Özçelik, Yavuz Özçelik, Nazlı Yaşar Tunca (Life Cycle Impact Assessment Analysis on a Cooling System)
78
Introduction
ooling demand is rapidly increasing in many parts of the world, especially in moderate climates.
The temperature can reach up to 40-45 °C in various regions of Turkey. The scientists announced
that due to the global warming, the average global temperature has increased 0.6 °C during the 20th
century. Also, the average global temperature rise is predicted to be between 1.4 and 5.8 °C until the year
2100, unless the emission of greenhouse gases is avoided. This results in a dramatic increase in electricity
demand in hot summer days, which threatens the stability of electricity grids and causes an unwanted increase
in the use of fossil fuels and nuclear energy. Current fossil-fuel based energy supply systems are not sustainable
as they contribute substantially to the climate change and mainly depend on the resources of only a few
countries. Hence, energy research can play an essential role in finding solutions to current environmental
problems and fulfilling the need for more sustainable cooling systems (Tunca, 2014).
Solar radiation is the main heat source of solar cooling systems. However, as solar radiation is variable due to
the seasonal changes, additional back-up heat sources may be integrated to the system such as fossil fuel or
waste heat recovered from other thermal systems. Although, absorption technologies have many
environmental advantages, they have the drawback a higher capital cost compared to conventional
compression systems since they include higher number of units for the required heat production subsystem,
which includes the solar collectors as well as the auxiliary heating system along with the absorption cycle itself
(Gebreslassie, et.al,2009b). Because solar cooling is not yet widely used and available, the awareness of solar
cooling will become a key to the growth in the near future. It is important to understand its barriers to
growth and develop solutions to optimize the performance of these systems taking into account also their
environmental impact in order to become a real alternative.
Literature Review
Many studies were performed on modeling and simulation of solar assisted absorption coolers and also there
are many studies are present in the literature on the improvement of performance of these systems.
The energy and environmental performance of solar thermal collectors for sanitary warm water demand
following Life Cycle Assessment methodology considering production process of the collectors, installation,
maintenance, transports and disposal has been studied by Ardente et al. (2005).
Solar assisted absorption cooling systems can be improved by integrated heating system. Mateus et al. (2009)
evaluated the potential of integrated solar absorption cooling and heating systems for applications in different
building types and in three different locations; Berlin, Lisbon and Rome. According to Mateus, minimum
costs depend on the building type and location. Additionally, the single-family house and the hotel are the
building types that the system has higher economic feasibility. They also pointed out that, although the
operation cost of integrated solar assisted cooling and heating systems are lower compared to conventional
systems, the total cost including the investment, operation and maintenance costs is much higher.
C
Engineering Approaches on Sustainability (Edited by: Dr. Zehra Semra Can, Dr. Barış Yılmaz, Dr. Seval Genç, Dr. Candeniz Seçkin )
79
Gebreslassie et al. (2009b) performed an economic analysis for the design of an absorption cooling system
under uncertainty in the energy cost the solution to which is given by a set of pareto optimal solutions via the
epsilon constraint method.
Hong et al. (2010) indicates that the coefficient of performance of a single effect absorption refrigeration cycle
system can be improved by introducing an expander-compressor.
The global warming potential of solar assisted absorption cooling systems are studied by Gebreslassie et al.
(2012). They concluded that without considering governmental subsides, the use of solar energy for cooling
applications is not profitable. In another study, Gebreslassie et al. (2010b) addressed the minimization of the
total cost of a solar assisted absorption cooling system and its associated total life cycle impact accounting for
the damage caused in all the stages over its entire life span. They showed that significant reductions in the
environmental impact can be achieved when solar collectors are used.
Operation Principle of Solar Assisted Cooling System
In this study, the equipment of absorption cycle (Figure 1-a) are the absorber (AB), condenser (CON),
desorber (D), evaporator (E), refrigerant sub cooler (SC), refrigerant expansion valve (RV), solution heat
exchanger (SHX), solution pump (P) and solution expansion valve (SV). The vapour refrigerant (Stream 9) is
separated from water by heating the concentrated water-refrigerant solution in desorber under high pressure
and then condensed completely in condenser. The liquid refrigerant (Stream 10) is sub cooled (Stream 11) in
the sub cooler by the superheating stream (Stream 13) coming from evaporator. The liquid refrigerant flows
through refrigerant expansion valve so the pressure is decreased and then evaporated under low pressure by
the heat taken from the environment. The vapour refrigerant (Stream 13) is heated by stream 10 and enters to
the absorption column. The refrigerant is absorbed in the weak water-refrigerant solution and leaves the
column as a rich solution (Stream 1). The absorption process is exothermic therefore, the absorber requires
constant cooling to maintain in its temperature. Stream 1 passes through pump and enters to the solution
heat exchanger to be heated by weak solution (Stream 4) before entering desorber. Stream 3 enters to the
absorber, heated by the hot water coming from solar collector part in order to separate the refrigerant from
water. Since the boiling point of the ammonia is lower than water (-33 0C) almost all of the ammonia is
evaporated with a trace amount of water. The fraction of ammonia is estimated to be constant at 0.99.
Streams 15-22 are external heat transfer fluids. Stream 17 carries the required hot water from the heat
production system and stream 18 brings back the cooled water in order to be heated.
The solar system where solar collectors and auxiliary heating system which is a gas fired heater operating with
natural gas, is demonstrated in Figure 1-b.

Zehra Özçelik, Yavuz Özçelik, Nazlı Yaşar Tunca (Life Cycle Impact Assessment Analysis on a Cooling System)
80
a) b)
Figure 1 Absorption cycle (a) and solar system (b)
Life Cycle Assessment
Life cycle assessment (LCA) is one of several environmental management techniques. Risk assessment,
environmental performance evaluation, environmental impact assessment analyses are other examples of
environmental management techniques. According to ISO Standard (Iram-Iso 14040, 2006), LCA is a
technique for assessing the environmental aspects and potential impacts associated with a product. LCA
studies the environmental aspects through a product’s entire life span. The life begins with the gathering of
raw materials from the earth and ends at the point when all the materials return to earth.
LCA Phases
LCA has four main phases and these phases are required to be defined clearly. The phases may have feed
backs and feed forwards between each other.
In Goal and scope definition phase the reason of LCA analysis should be clearly defined. To whom the
results of the study may affect shall be established. The following descriptions should be defined well to
understand the goal and scope of the study.
The Function of a system is the main purpose of its usage. According to ISO 14040 the functional unit is
defined as measure of the performance of the functional outputs of the product system. The primary purpose
of a functional unit is to provide a reference to which the inputs and outputs are related. In this study the
function of a solar assisted absorption system is to produce 100 kW cooling.
Engineering Approaches on Sustainability (Edited by: Dr. Zehra Semra Can, Dr. Barış Yılmaz, Dr. Seval Genç, Dr. Candeniz Seçkin )
81
The System boundaries determine which unit processes shall be included within the LCA. The selection of
the inputs and outputs are shall be consisted with the goal of the study. An input and output is described as
the material or energy that enters and leaves a system, respectively.
Data quality requirements specify in general terms the characteristics of the data needed for the study. Since
the selected data affects directly the results of the study, the selection of the data is important. The data
quality should address;
• The time coverage that the data is valid,
• The geographical area that the data covers,
• The technology that the data represents,
• The production group that the data covers etc.
Performing an LCA can be resource and time intensive. Depending upon how thorough an LCA the user
wishes to conduct, gathering the data can be problematic, and the availability of data can greatly impact the
accuracy of the final results. Therefore, it is important to weigh the availability of data, the time necessary to
conduct the study, and the financial resources required against the projected benefits of the LCA.
Life Cycle Inventory Analysis (LCI)
Inventory analysis involves data collection and calculation procedures to quantify relevant inputs and outputs
of a product system. These inputs and outputs may include the use of resources and releases to air, water and
land associated with the system (e.g., air emissions, solid waste disposal, and waste water discharge). The data
collection shall be performed for each unit process included in the system boundaries (Tunca, 2014).
Life Cycle Impact Assessment (LCIA)
In this phase the potential environmental impacts are evaluated using the results of inventory analysis. The
impact categories point out the areas that the product or system affects (e.g., climate change, ozone layer
depletion, carcinogenic effects etc.). The impact assessment phase may include the following elements (Iram-
Iso 14040, 2006);
• Assigning of inventory data to impact categories (classification)
• Modeling of the inventory data within impact categories (characterization)
• Possibly aggregating the results in very specific cases and only when meaningful (weighting).
The environmental performance is measured by the Eco-indicator 99 metric taken from Ecoinvent Database.
Ecoinvent supplies Life cycle inventory (LCI) data and offers science based, industrial, international life cycle
assessment (LCA) and life cycle management (LCM) data and services (Ardente, 2005, The Ecoinvent
Center, 2011, Tunca, 2014).
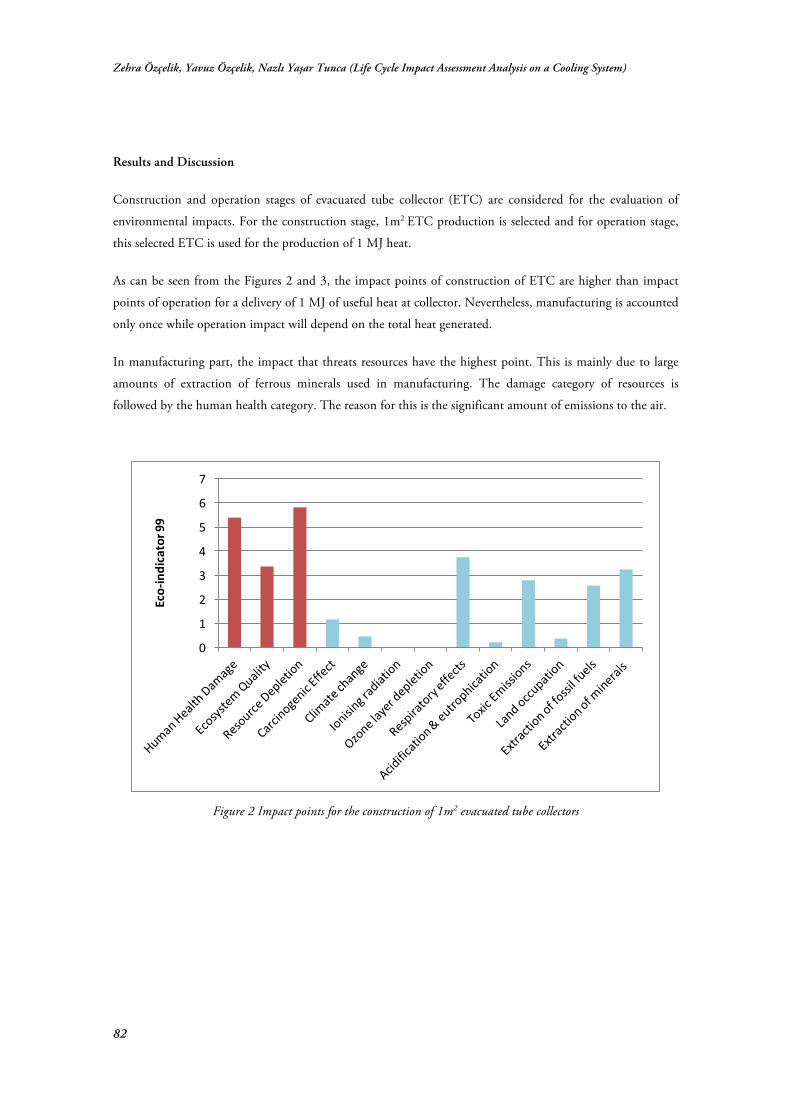
Zehra Özçelik, Yavuz Özçelik, Nazlı Yaşar Tunca (Life Cycle Impact Assessment Analysis on a Cooling System)
82
Results and Discussion
Construction and operation stages of evacuated tube collector (ETC) are considered for the evaluation of
environmental impacts. For the construction stage, 1m2 ETC production is selected and for operation stage,
this selected ETC is used for the production of 1 MJ heat.
As can be seen from the Figures 2 and 3, the impact points of construction of ETC are higher than impact
points of operation for a delivery of 1 MJ of useful heat at collector. Nevertheless, manufacturing is accounted
only once while operation impact will depend on the total heat generated.
In manufacturing part, the impact that threats resources have the highest point. This is mainly due to large
amounts of extraction of ferrous minerals used in manufacturing. The damage category of resources is
followed by the human health category. The reason for this is the significant amount of emissions to the air.
Figure 2 Impact points for the construction of 1m2 evacuated tube collectors
0
1
2
3
4
5
6
7
Eco-indicator99

Engineering Approaches on Sustainability (Edited by: Dr. Zehra Semra Can, Dr. Barış Yılmaz, Dr. Seval Genç, Dr. Candeniz Seçkin )
83
Figure 3 Impact points of operation of ETC per 1MJ of heat produced
Air emissions during the production of collectors include mostly CO2 emission, indirect emissions related to
the raw material production and direct emissions of some metal pollutants consisting of iron, manganese,
chromium and molybdenum etc. related to the dominant production processes which are plasma cutting,
coating and welding.
Figure 4 Pareto set of optimal solutions for total environmental impact (Total EI99) and
corresponding damage categories.
00.000050.0001
0.000150.0002
0.000250.0003
0.000350.0004
Eco-indicator99

Zehra Özçelik, Yavuz Özçelik, Nazlı Yaşar Tunca (Life Cycle Impact Assessment Analysis on a Cooling System)
84
The same order of impact points is observed in the operation part. The Eco-indicator 99 of the operation part
is considered for the delivery of 1 MJ of heat at collector including the necessary auxiliary heating,
maintenance and electricity use for operation. In order to produce high amount of heat at collectors, more
electricity is consumed to operate the pump in the collector part.
The total environmental impact and total cost are minimized simultaneously and the set of Pareto solutions
that satisfy both objective functions are shown in Figure 4. Three damage categories that correspond to each
Pareto solution are presented in the same figure as well. It is obvious that there is a trade-off between total
cost and environmental impact. Concerning the damage categories, damage to natural resources follows the
same tendency of total environmental impact. This is quite easy to understand because the minimum point of
total impact corresponds to a design with many collectors that supply heat to the cycle and they contribute to
less fossil fuels utilization. Also, it should be noticed that resource depletion and human health damage has
similar tendency as the total Eco-indicator, whereas ecosystem quality damage has an opposite direction that
increases as total impact decreases. The reason for this is the emissions of heavy metals associated with the
manufacture of solar collectors as mentioned before. The emissions of these metals have ecotoxic effects and
thus lead to an increase in ecosystem quality.
Figure 5 Set of solutions for minimum total Eco-indicator 99 and corresponding environmental impacts
Figure 5 presents the details on the impact categories for the Pareto curve corresponding to the total
environmental impact – total cost objective function. Logarithmic scale is used in the following figures to
show tendencies of all impacts, as their order of magnitude can be very different. It can be observed from the
Figure 5 that, some of the impact categories have lower values in the minimum cost solution; however, the
B
A
1
10
100
1000
10000
100000
1000000
1500000 2500000 3500000
Eco-indicator99
Totalcost [Euro]
TotalEI99
Carcinogeniceffect
Climatechange
Ionizingradiation
Ozonelayerdepletion
Respiratoryeffects
Acidification&eutrophicationToxicemissions
Landoccupation
Extractionofminerals

Engineering Approaches on Sustainability (Edited by: Dr. Zehra Semra Can, Dr. Barış Yılmaz, Dr. Seval Genç, Dr. Candeniz Seçkin )
85
opposite happens for other impact categories. Points A and B represent the minimum cost and minimum
environmental impact designs, respectively. In both designs ozone layer depletion makes the lowest
contribution to the total impact. This is due to the fact that instead of CFC’s and HCFC’s, water and
ammonia are used as working fluids in the system. In any case, it can be seen that the main contributors to
the total environmental impact are extraction of fossil fuels and climate change in the minimum cost design
and respiratory effects in the minimum environmental impact design.
In Table 1, the number of collectors, total area of collectors and total area of the cycle at each minimum point
of impact category, total cost and total Eco-indicator 99 can be seen. It is observed that, 630 solar collectors
exist in the design of minimum total environmental impact, climate change, ozone layer depletion,
acidification and eutrophication and extraction of fossil fuels. However, no collector is chosen in minimum
solutions of the rest functions.
Figure 6 depicts the contribution of several parameters and units (shown in the right hand side of the figure)
for each minimum impact category designs. The impact for the pump, which is the solution pump in the
absorption cycle, includes the sum of construction and electricity consumption for its operation. In the
minimum carcinogen, ionizing radiation, respiratory effects, toxic effects, land occupation, mineral extraction
and minimum cost solutions the main contributor to those impact categories is natural gas. In these solutions
where there are no solar collectors, natural gas is burned to supply the required heat for the cycle. Since the
pump consumes more electricity to circulate the solution in absorption cycle, it also contributes to total of
each impact category.
Table 1 Associated number of solar collectors, total area of collectors and the total area of equipments in the
absorption cycle with minimum solution of total environmental impact, total cost and each impact category
Minimization of each category Number of Collectors
Total Area of Collectors (m2)
Total area of the Cycle (m2)
Total EI99 630 619.9 799.1
Total Cost 0 0 97.4
Carcinogenic effect 0 0 97.3
Climate Change 630 619.9 801.4
Ionization Radiation 0 0 97.4
Ozone Layer Depletion 630 619.9 802.7
Respiratory Effects 0 0 97.4
Acidification and Eutrophication 630 619.9 854.3
Toxic Emissions 0 0 97.4
Land Occupation 0 0 97.4
Extraction of Fossil Fuels 630 619.9 802.8
Extraction of Minerals 0 0 97.4

Zehra Özçelik, Yavuz Özçelik, Nazlı Yaşar Tunca (Life Cycle Impact Assessment Analysis on a Cooling System)
86
In Figure 7, normalized values of each impact are plotted in ordinate and the set of objective functions are
shown in x axis. Normalization is performed by dividing each solution of objective function by its maximum.
Each line corresponds to a different design and associated normalized impact values of each of the 10
category, total Eco-indicator and total cost. As an example; the brown line with square markers corresponds
to the design with minimum total cost, minimum carcinogenic effect, minimum ionizing radiation,
minimum respiratory effects, minimum toxic emissions, minimum extraction of minerals, while at the same
time maximum climate change, maximum ozone layer depletion, maximum acidification and eutrophication,
maximum extraction of fossil fuels and maximum total environmental impact. Also, the line with circular
markers corresponds to the design with maximum cost where there is minimum environmental impact. The
other curves correspond to intermediate solutions of all functions. It is interesting to notice that, one can
reduce total environmental impact 75%, extraction of fossil fuels 77%, climate change and ozone layer
depletion 76% by increasing total cost approximately 20% as can be seen from the line with triangular
markers.
Figure 6 Contribution of several parameters to the total impacts at minimum points of each single impact.
0% 10% 20% 30% 40% 50% 60% 70% 80% 90%
100%
Eco-indicator99
OperationofcollectorsconstructionofcollectorsPUMP
ConstructionofboilerStainlesssteel

Engineering Approaches on Sustainability (Edited by: Dr. Zehra Semra Can, Dr. Barış Yılmaz, Dr. Seval Genç, Dr. Candeniz Seçkin )
87
* 1: total cost, 2: carcinogenic effects, 3:climate change, 4: ionizing radiation, 5: ozone layer
depletion, 6: respiratory effects, 7: acidification and eutrophication, 8: toxic emissions, 9: land
occupation, 10: extraction of minerals, 11: extraction of fossil fuels, 12: total environmental
impact.
Figure 7 Two-dimensional Pareto sets in parallel coordinates
Conclusion
In this study, the environmental performance analysis of a solar assisted absorption cooling system is
presented based on formulating a nonlinear programming (NLP) problem. It is aimed to minimize total
environmental impact and 10 single impact categories simultaneously with total cost using the Eco-indicator
99 metric. LCA principles have been used while performing environmental analysis.
It has been shown that there is an obvious trade-off between total cost and total environmental impact,
damage to climate change, ozone layer depletion, acidification and eutrophication and damage to fossil fuels.
This is accomplished by introducing more collectors to the system. On the other hand, after optimizing the
rest of the impact categories simultaneously with the total cost, the solutions are not presented by a Pareto
curve but by one minimum point since those functions have a similar trend as the total cost.
Minimum total cost is calculated as 2034346.08 € when total environmental impact is at its maximum which
is 280633.14. The minimum total environmental impact is calculated as 70652.09 when the total cost is at its
maximum value which is 3366998.48 €. It is clear that there is a conflict between total cost and
environmental impact. As the environmental impact decreases, the total cost of the system increases. Decision
makers can choose the best design according to their requirements and environmental constraints.
0
0.1
0.2
0.3
0.4
0.5
0.6
0.7
0.8
0.9
1
1 2 3 4 5 6 7 8 9 10 11 12

Zehra Özçelik, Yavuz Özçelik, Nazlı Yaşar Tunca (Life Cycle Impact Assessment Analysis on a Cooling System)
88
References
Ardente F., Beccali G., Cellura M. and Branco VL., (2005), Life cycle assessment of a solar thermal collector, Renewable Energy, 30 (7),1031-1054pp.
The Ecoinvent Center, a Competence Centre of Eth, Psi, Empa& Art, Access from:< www.ecoinvent.ch/. ecoinvent data v2.2/ March, 03 2011>.
Florides, G.A., Kalogirou S.A., Tassou S.A. and Wrobel L.C., (2002), Modeling, simulation and warming impact assessment of a domestic-size absorption solar cooling system, Applied Thermal Engineering, 22:1313-1325.
Gebreslassie, B.H., Gosálbez G.G., Jiménez L. and Boer D., (2009b), Economic performance optimization of an absorption cooling system under uncertainty, Applied Thermal Engineering, 29:3491-3500.
Gebreslassie, B.H., Gosálbez G.G., Jiménez L. and Boer D., (2010b), A systematic tool for the minimization of the life cycle impact of solar assisted absorption cooling systems, Energy, 35:3849-3862.
Gebreslassie, B.H., Gosálbez G.G., Jiménez L. and Boer D., (2012), Solar assisted absorption cooling cycles for reduction of global warming: a multi-objective optimization approach, Renewable Energy, 86:2083-2094.
Hong D., Tang L., He Y. and Chen G., 2010, A novel absorption refrigeration cycle, Applied Thermal Engineering, 30:2045-2050pp.
Iram-Iso 14040, Environmental Management-Life Cycle Assessment-Principles and Frame Work. 2006. Mateus T. and Oliveira A.C., 2009, Energy and economic analysis of an integrated solar absorption cooling and heating
system in different building types and climates, Applied Energy, 86:949-957pp. Tunca, N.Y., (2014), Modeling, simulation and optimization of solar assisted absorption cooling systems, (Unpublished
Master’s Thesis), Ege University, Chemical Engineering Department.

Engineering Approaches on Sustainability (Edited by: Dr. Zehra Semra Can, Dr. Barış Yılmaz, Dr. Seval Genç, Dr. Candeniz Seçkin )
89
6 Performance Analysis of a Cascade Refrigeration System with the Replacement of HFC Refrigerants with Natural Ones
B. Yılmaz E. Mançuhan N. Erdönmez
M. K. Sevindir
D. Yılmaz Abstract
The replacement of synthetic refrigerants such as R132a or R404A in refrigeration applications with natural ones gains recently more attention due to their harmful effects on environment. Conversely, these refrigerants have better thermo-physical properties than the natural ones. Therefore it is important to compare performance of the systems operating partially or fully with the natural refrigerants with that of synthetic refrigerants. Moreover, an appropriate selection of refrigerants to operate the low and high temperature cycles should be made in order to obtain high coefficient of performance (COP) besides lowering the trace of the refrigerants on the environment during operation, leakage and recharge. For this purpose, one solution may be using CO2 in the low temperature cycle (LTC) of the refrigeration system whereas the high temperature cycle(HTC) of a cascade refrigeration system may use ammonia, propane or R404A. First two proposals represent fully natural refrigerant solution however the last option corresponds to partial use of natural refrigerants. In this study, the performance and the environmental considerations of three different refrigerant pairs in a cascade refrigeration have been investigated. CO2 is assumed to be the refrigerant of LTC while HTC refrigerant is varied from partially to fully natural refrigerant options. In order to realize an energy efficient and environmentally friendly refrigeration system, CO2/R404A, CO2/NH3 and

B. Yılmaz, E. Mançuhan, N. Erdönmez, M. K. Sevindir, D. Yılmaz (Performance Analysis of a Cascade Refrigeration System with the Replacement of HFC Refrigerants With Natural Ones)
90
CO2/R290 pairs of refrigerants are examined. Their performances and mass flow requirements are analyzed and compared for different operating conditions. Keywords: Cascade system, Natural refrigerants, Performance coefficient
Introduction
onventional refrigerants are being phased out worldwide because of the risk of ozone layer depletion
(ODP) and global warming potential (GWP) considerations. Natural refrigerants are increasingly
used in low temperature refrigeration applications. Mainly, carbon dioxide, ammonia, propane and
other natural refrigerants have drawn increased attention as refrigerants to protect the environment. The
cascade refrigeration systems including low and high temperature cycles are commonly applied to reach low
and very–low temperature levels. In design of such systems, the temperature levels in low and high
temperature cycles are important parameters determined from the ambient conditions and desired cooling
space temperatures. In order to decide the best refrigerant in the application, along with the design conditions
other important characteristics such as toxicity, flammability, ODP, GWP etc. should be also taken into
account.
There has been a significant interest in two-cycle cascade systems during the past decade, particularly with the
increasing the popularity of CO2 as a low temperature refrigerant. CO2 has several advantages compared to
other refrigerants because it is a non-toxic, non-explosive and environmental friendly. In addition, the size of
the units in the refrigeration system with CO2 is more compact due to its lower specific volume accompanied
with higher operating pressure values.
There are several studies in literature using CO2 and different synthetic refrigerants such as R22, R290,
R1270 and R404A in cascade refrigeration applications (Bansal and Jain 2007; Bansal 2012; Bhattacharyya et
al. 2005; Messineo 2012; Da Silva et al. 2012; Yilmaz et al. 2014).
Bansal and Jain (2007) evaluated the optimum cascade condensing temperatures of R744 of the low
temperature refrigerant for different refrigerants such as R717, R290, R1270 and, R404A, which are in the
high temperature cycles of a cascade system. They concluded that CO2 is a potential low temperature
refrigerant for temperatures less than -50°C due to its low cost and promising properties. Also, ammonia is
the best high temperature cycle refrigerant if it is located outside of the building. Bansal (2012) presented that
a comprehensive summary on the outgrowth of CO2 as the most promising refrigerant for low temperature
applications. Particularly, CO2 perform up to 60% better than the conventional single stage supermarket
refrigeration systems operating with R404A. Bhattacharyya et al. (2005) studied a carbon dioxide-propane
(R744–R290) cascade system in order to determine the optimum cascade evaporating temperature of R744 in
the high temperature cycle. Messineo (2012) has carried out the thermodynamic analysis of a R744/R717
cascade refrigeration system and of a R404A two-stage system at the same working conditions. He reported
that a R744/R717 cascade refrigeration system is a remarkable alternative to R404A two-stage refrigeration
system for low evaporating temperatures such as -30oC and -50oC. Da Silva et al. (2012) presented a
C

Engineering Approaches on Sustainability (Edited by: Dr. Zehra Semra Can, Dr. Barış Yılmaz, Dr. Seval Genç, Dr. Candeniz Seçkin )
91
comparison of R404A/CO2 cascade system with single-stage systems of R404A and R22 in a supermarket
application operated at the evaporation temperature of -30oC. They concluded that the cascade system can
reduce energy consumption and refrigerant charge compared to the single stage systems. Yilmaz et al. (2014)
examined influence of different operating conditions on a R404A/CO2 cascade system performance and
determined the optimum operating conditions to maximize the COP and thereby minimize the exergy
destruction of the system.
In the present study, the best refrigerant pair for a cascade refrigeration cycle has been investigated for three
different cases. CO2 is assumed to be the refrigerant of LTC while HTC refrigerant is varied from partially to
fully natural refrigerant options. In order to realize an energy efficient and environmentally friendly
refrigeration system, CO2/R404A, CO2/NH3 and CO2/R290 pairs of refrigerants are examined. Their
performances and mass flow requirements are analyzed and compared for different operating conditions.
Thermodynamic analysis of a cascade system
In a two-stage cascade system, two independent refrigeration cycles are paired through a heat exchanger
named a cascade condenser, where the heat transfer between two cycles occurs. Figure 1 shows schematic
diagram of the two-stage cascade refrigeration system. In a cascade condenser, the refrigerant vapors of the
low temperature cycle are condensed whereas the liquid phase refrigerant of the high temperature cycle are
evaporates. Therefore, it operates at intermediate pressure and temperature as evaporator for the high
temperature cycle and condenser for the low temperature cycle. In a single cycle refrigeration system there are
two temperature levels, the evaporating temperature and the condensing temperature which are represented
by TE and TC, respectively. As expected, these temperature levels depend on the temperatures of both the
conditioned space and the ambient conditions. On the other hand, in a cascade system there are four
temperature levels; the two additional temperatures being the condensing temperature of the low temperature
system, TCAS,C, and the evaporating temperature of the high temperature system, TCAS,E. These temperatures
between the high and low temperature cycles are a design parameter which plays an important role in
determining the coefficient of performance (COP) of the overall system.

B. Yılmaz, E. Mançuhan, N. Erdönmez, M. K. Sevindir, D. Yılmaz (Performance Analysis of a Cascade Refrigeration System with the Replacement of HFC Refrigerants With Natural Ones)
92
Figure 1. Schematic of a two-stage cascade refrigeration system
The thermodynamic model of the cascade system is developed using first law of thermodynamics. Mass,
energy equations are derived for both low and high temperature cycles. In this study, considering the
schematic and state points of Figure 1, the following equations are used for the analysis. The coefficient of
performance (COP) and the mass flow ratio of two cycles are computed for various operating conditions.
Following assumptions are taken into consideration in the analysis.
• isenthalpic expansion of refrigerants in expansion valves,
• isentropic compressor efficiencies of 0.80 both low and high temperatures cycles,
• potential and kinetic energy changes are neglected,
• heat and pressure losses in all components are neglected.
Numerical calculations are performed using well-known Engineering Equation Solver (EES) software. EES is
a general equation-solving program that can numerically solve coupled non-linear algebraic and differential
equations. The thermo-physical properties of the refrigerants (CO2, NH3, R290 and R404A) specified in this
study is obtained using EES which has property database of numerous refrigerants.
The mathematical model of the cascade system has been developed using first law of thermodynamics. The
derived equations are given below;
The capacity of the evaporator of LTC is defined as
Q ̇E= m ̇L(h1-h4) (1)

Engineering Approaches on Sustainability (Edited by: Dr. Zehra Semra Can, Dr. Barış Yılmaz, Dr. Seval Genç, Dr. Candeniz Seçkin )
93
Compressor power consumption for HTC is given a:
W ̇H=m ̇H(h6-h5) (2)
Similarly, compressor power consumption for LTC is
W ̇L=m ̇L(h2-h1) (3)
The rate of heat transfer in the cascade system is calculated as
Q ̇CAS=m ̇H(h5-h8) = m ̇L(h2-h3) (4)
The mass flow ratio is determined from
m ̇H/ m ̇L = (h2-h3)/ (h5-h8) (5)
The rate of heat rejection by the condenser of HTC:
Q ̇H= m ̇H(h6-h7) (6)
And finally, the overall COP of the cascade system is determined by:
COP=Q ̇E / (W ̇H + W ̇L) (7)
Environmental analysis
There are two major parameters measuring the trace of refrigerants on the environment which are Global
Warming Potential (GWP) and Ozone Depletion Potential (ODP). Carbon dioxide, has zero ODP and it is
used as the base refrigerant for measuring GWP which is equal to 1. One kg of R404A has a GWP of 3800
and one kg of R290 has a GWP of 3. In addition, ODP value is zero for NH3, R290 and R404A. These
values showed that true selection of environmentally friendly refrigerant is crucial to reduce the harmful
effects of them on the environment and to decrease contribution to the global warming. Due to the high
GWP of R404A it should be totally phased out by 2020 in developing countries (Montreal Protocol) and its
amendments from the United Nations Environment Program (UNEP, 1987).
In the present study, two fully and one partially natural refrigerant cases have been studied. In the first fully
natural refrigeration solution case, CO2 is utilized as the refrigerant of the low temperature cycle of a cascade
system and ammonia is the working fluid of the high temperature cycle. Using ammonia in low temperature
cycle is not proposed since below -35 ˚C, it has a vapor pressure lower than atmospheric pressure which may
cause air leakage into the system besides it is a toxic and flammable refrigerant.
Propane/CO2 pair is the second fully natural refrigeration solution. Propane has excellent thermodynamic
properties, similar to those of ammonia. It is cheap and universally available. The major advantage of selecting

B. Yılmaz, E. Mançuhan, N. Erdönmez, M. K. Sevindir, D. Yılmaz (Performance Analysis of a Cascade Refrigeration System with the Replacement of HFC Refrigerants With Natural Ones)
94
propane as the refrigerant over ammonia is that propane is non-toxic. However, its highly flammability
feature needs a serious concern and hence safe design and operating practice is of extreme importance.
The partially natural refrigerant cascade system uses the CO2 as the refrigerant of the low temperature cycle
and the synthetic R404A as refrigerant of the high temperature cycle. Currently, CO2/R404A pair is used
more commonly in commercial and industrial refrigeration applications.
Results and discussion
In order to realize an energy efficient and environmentally friendly refrigeration system, CO2/R404A,
CO2/NH3 and CO2/R290 pairs of refrigerants are examined. First two proposals represent fully natural
refrigerant solution however the last option corresponds to partial use of natural refrigerants.
The performance and mass flow ratio of the three different cascade systems (CO2/R404A, CO2/NH3 and
CO2/R290) are computed and results are plotted for different operating conditions. These conditions are
chosen to examine the effect of the evaporation temperature of cascade condenser (TCAS,E), the condensing
temperature of high temperature cycle (TC) and evaporating temperature of low temperature cycle (TE) on the
COP of the system and the mass flow ratio of two cycles.
- Effect of the evaporation temperature of cascade condenser
In this case study the evaporation temperature of cascade condenser (TCAS,E) was varied between -30oC and
5oC by keeping the other operating parameters constant such as condensing temperature of high temperature
cycle (TC =40oC), evaporating temperature of low temperature cycle (TE=-50oC), temperature difference in
cascade condenser (ΔTCAS=5oC). The degree of subcooling and superheat is assumed to be 0oC in the two
stage cascade system.
In Figures 2 and 3, the effect of TCAS,E on both the COP and the mass flow ratio are displayed for the cascade
system to select the right refrigerant pair. Figure 2 depicts variation of system COP for NH3, R290 and
R404A in the high temperature cycle with CO2 in the low temperature cycle. As can be seen from Figure 2,
the maximum COP of the system for the given conditions is highest for NH3 and lowest for R404A. The
ratio of mass flow of the refrigerants (NH3, R290) in the high temperature cycle to that of CO2 in the low
temperature cycle is also compared in Figure 3. The use of R404A in the high temperature cycle requires the
highest mass flow ratio ranging from 3.9 to 3.2, whereas using NH3 requires the lowest mass flow ratio (from
0.34 to 0.32) due to its high latent heat of vaporization. In addition, the mass flow ratio of R290 is calculated
between 1.5 and 1.3.

Engineering Approaches on Sustainability (Edited by: Dr. Zehra Semra Can, Dr. Barış Yılmaz, Dr. Seval Genç, Dr. Candeniz Seçkin )
95
Figure 2. Effect of cascade evaporating temperature (TCAS,E) on the performance of cascade systems
Figure 3. Effect of cascade evaporating temperature (TCAS,E) on the ratio of HT to LT mass flow rates
- Effect of condensing temperature of high temperature cycle
The condensation temperature (TC) of high temperature cycle is varied between 25oC to 45oC in this case.
The evaporation temperature, TE, for the low temperature cycles and the cascade evaporation temperatures,
TCAS,E , are chosen to be -50oC and -20oC, respectively. In all pairs of refrigerant cycles, the temperature
difference in cascade heat exchanger, ΔTCAS, is assumed to be constant of 5oC. Furthermore the degree of
subcooling and superheat are kept constant of 0oC.
Figure 4 and 5 depict the variation of COP and mass flow ratio for the change in condensation temperature,
TC, from 25oC to 45oC. Increasing the HTC condensing temperatures (TC), and keeping the TCAS,E and TE
constant affects the performance of the cascade system adversely, as shown in Figure 4. Increasing the
condensing temperature reduces to COPs for all pairs of refrigerant cycles. However, in Figure 5, it is

B. Yılmaz, E. Mançuhan, N. Erdönmez, M. K. Sevindir, D. Yılmaz (Performance Analysis of a Cascade Refrigeration System with the Replacement of HFC Refrigerants With Natural Ones)
96
observed that increasing of TC results in increase in mass flow ratio from 0.31 to 0.34 for NH3, from 1.2 to
1.5 for R290 and from 3.0 to 4.1 for R404A cases.
Figure 4. Effect of condensation temperature (TC) on the performance of different cascade systems
Figure .5 Effect of condensation temperature (TC) on the ratio of HTC to LTC mass flow rates
- Effect of evaporation temperature of low temperature cycle
The evaporation temperature of low temperature cycles (TE) has varied between -50oC to -25oC in this case
studies. The condensation temperature for the high temperature cycles, TC, and cascade evaporation
temperatures, TCAS,E , are chosen to be 40oC and -20oC, respectively. In all pairs of refrigerant cycles, the
temperature difference in cascade heat exchanger, ΔTCAS, is assumed to be constant of 5oC. In addition, the
degree of subcooling and superheat are kept constant to be 0oC.
Figure 6 and 7 illustrate the variation of COP and mass flow ratio for the change in evaporation temperature,
TE, from -50oC to -25oC. As shown in Figure 6, increasing the evaporating temperature rises to COPs for all

Engineering Approaches on Sustainability (Edited by: Dr. Zehra Semra Can, Dr. Barış Yılmaz, Dr. Seval Genç, Dr. Candeniz Seçkin )
97
pairs of refrigerant cycles. However, in Figure 7, it is observed that increasing of TE resulted in a decrease in
mass flow ratio of the CO2/R404A, CO2/NH3 and CO2/R290 systems.
Figure 6. Effect of evaporation temperature (TE) on the performance of different cascade systems
Figure 7. Effect of evaporation temperature (TE) on the ratio of HT to LT mass flow rates
- Effect of degree of superheat and subcooling in high temperature cycle
Superheating case study, the condensation temperature of the high temperature cycles, TC, the evaporation
temperature of the low temperature cycles, TE, and cascade evaporation temperatures, TCAS,E , are chosen to be
40oC, -50oC, and -20oC, respectively. The temperature difference in cascade heat exchanger, ΔTCAS, and the
subcooling degree, DTsub, are assumed to be constant at 5oC and 0oC, respectively.
In Figure 8, degree of superheat (DTsup) in HT cycles such as NH3, R290 and R404A cycles is varied from
0oC to 20oC. In addition, degree of superheat and subcooling in LT cycle (CO2 cycle) are held constant to be
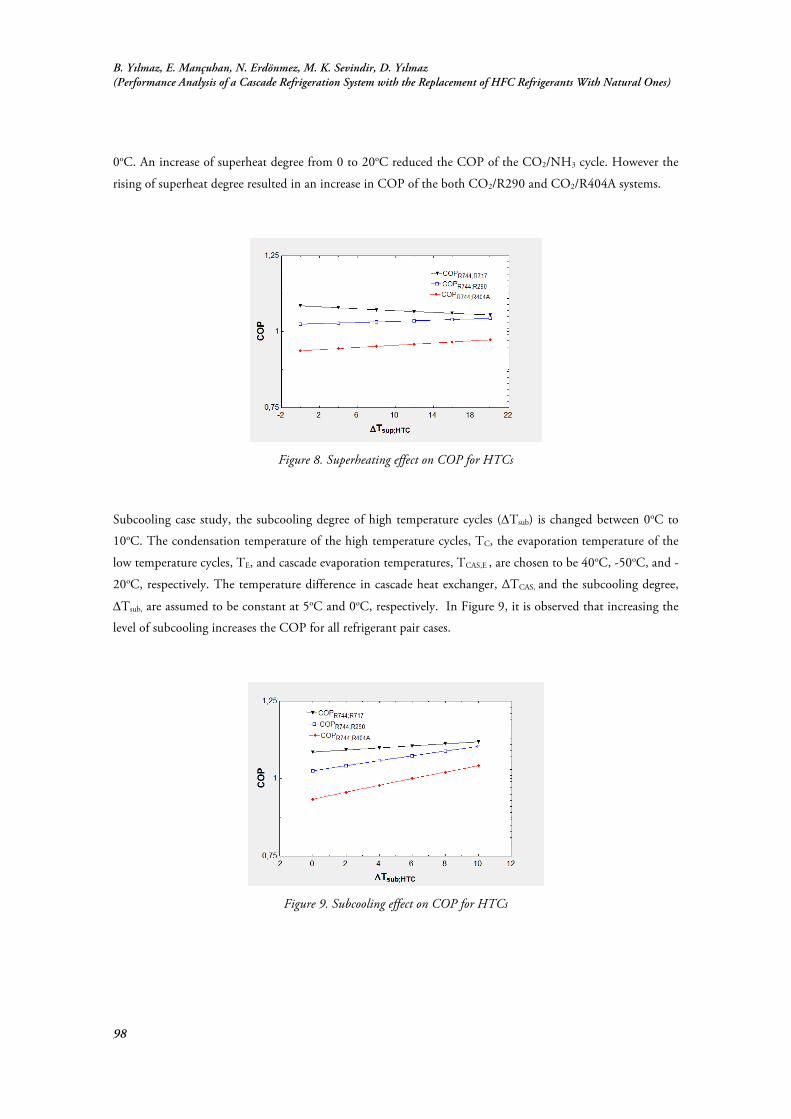
B. Yılmaz, E. Mançuhan, N. Erdönmez, M. K. Sevindir, D. Yılmaz (Performance Analysis of a Cascade Refrigeration System with the Replacement of HFC Refrigerants With Natural Ones)
98
0oC. An increase of superheat degree from 0 to 20oC reduced the COP of the CO2/NH3 cycle. However the
rising of superheat degree resulted in an increase in COP of the both CO2/R290 and CO2/R404A systems.
Figure 8. Superheating effect on COP for HTCs
Subcooling case study, the subcooling degree of high temperature cycles (DTsub) is changed between 0oC to
10oC. The condensation temperature of the high temperature cycles, TC, the evaporation temperature of the
low temperature cycles, TE, and cascade evaporation temperatures, TCAS,E , are chosen to be 40oC, -50oC, and -
20oC, respectively. The temperature difference in cascade heat exchanger, ΔTCAS, and the subcooling degree,
DTsub, are assumed to be constant at 5oC and 0oC, respectively. In Figure 9, it is observed that increasing the
level of subcooling increases the COP for all refrigerant pair cases.
Figure 9. Subcooling effect on COP for HTCs

Engineering Approaches on Sustainability (Edited by: Dr. Zehra Semra Can, Dr. Barış Yılmaz, Dr. Seval Genç, Dr. Candeniz Seçkin )
99
- The effect of the cascade refrigerant pairs to the environment
In this part of the study, the effect of using different the cascade refrigerant pairs on the system performance
and the environment has been investigated. The condensation temperature of the high temperature cycles,
TC, the evaporation temperature of the low temperature cycles, TE, and cascade evaporation temperatures,
TCAS,E , are chosen to be 40oC, -40oC, and -20oC, respectively. In all pairs of refrigerant cycles, the
temperature difference in cascade heat exchanger, ΔTCAS, is assumed to be constant of 5oC. The degree of
subcooling and superheat are kept constant to be 0oC. In addition, the evaporation capacity of the
evaporators, QEVAP, is chosen to be 6 kW.
The calculated performances and total refrigerant charge requirements of the different refrigerant pairs are
given in Table 1. In addition, GWPs of the three systems (CO2/NH3, CO2/290 and CO2/R404A), have been
examined for the leakage of the whole refrigerant in the cycle to the atmosphere. According to the Table 1
the CO2/R290 system has a total value of GWP of 15 and the CO2/R404A system has 45600 according to
each refrigerant charge pair. As can be noted, the difference between the CO2/R404A system and the
CO2/R290 system as calculated to be 45585.
It is found that the cascade refrigerant pair of CO2/NH3 results in the highest COP value and the best
environmental performance as compared to other refrigerant pairs. It is also observed that the COP of R404A
is lower compared to other refrigerants, while that of NH3 is better compared to R290.
Table 1. Mass flow rates of the refrigerants used and COPs in the pairs of cascade system
Refrigerant pair CO2/NH3 CO2/R290 CO2/R404A Total refrigerant charge (kg)
𝑚"#$ = 25 𝑚()* = 6.5
𝑚"#$ = 25 𝑚-$./ = 5
𝑚"#$ = 25 𝑚-0/01 = 12
GWP 𝐺𝑊𝑃"#$ = 1 𝐺𝑊𝑃()* = 0
𝐺𝑊𝑃"#$ = 1 𝐺𝑊𝑃-$./ = 15
𝐺𝑊𝑃"#$ = 1 𝐺𝑊𝑃-0/01= 45600
COP 1.3 1.2 1.1
Conclusion
In this study, CO2/NH3, CO2/290 and CO2/R404A pairs of refrigerants are compared in order to realize an
energy efficient and environmentally friendly refrigeration system. For the studied system, the cascade
refrigerant pair of CO2/NH3 results in the highest COP value and the best environmental performance as
compared to other refrigerant pairs. It is also found that the COP of R404A is lower compared to other
refrigerants, while that of NH3 is better compared to R290.
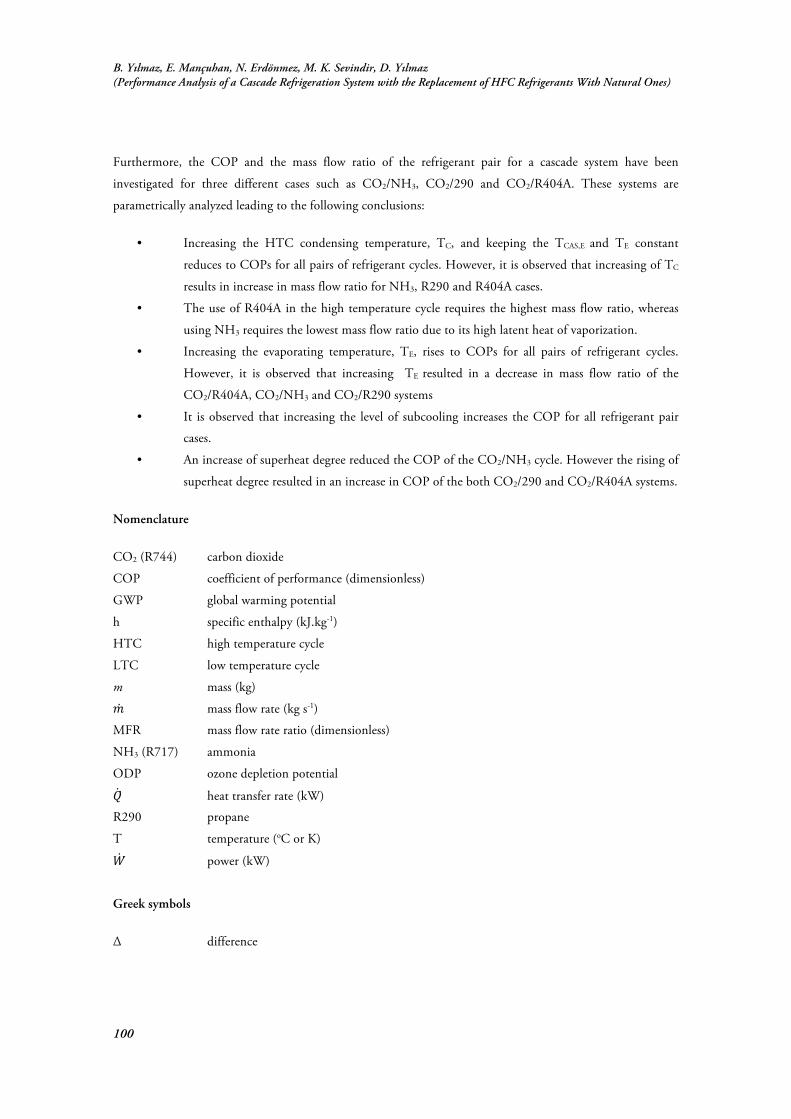
B. Yılmaz, E. Mançuhan, N. Erdönmez, M. K. Sevindir, D. Yılmaz (Performance Analysis of a Cascade Refrigeration System with the Replacement of HFC Refrigerants With Natural Ones)
100
Furthermore, the COP and the mass flow ratio of the refrigerant pair for a cascade system have been
investigated for three different cases such as CO2/NH3, CO2/290 and CO2/R404A. These systems are
parametrically analyzed leading to the following conclusions:
• Increasing the HTC condensing temperature, TC, and keeping the TCAS,E and TE constant
reduces to COPs for all pairs of refrigerant cycles. However, it is observed that increasing of TC
results in increase in mass flow ratio for NH3, R290 and R404A cases.
• The use of R404A in the high temperature cycle requires the highest mass flow ratio, whereas
using NH3 requires the lowest mass flow ratio due to its high latent heat of vaporization.
• Increasing the evaporating temperature, TE, rises to COPs for all pairs of refrigerant cycles.
However, it is observed that increasing TE resulted in a decrease in mass flow ratio of the
CO2/R404A, CO2/NH3 and CO2/R290 systems
• It is observed that increasing the level of subcooling increases the COP for all refrigerant pair
cases.
• An increase of superheat degree reduced the COP of the CO2/NH3 cycle. However the rising of
superheat degree resulted in an increase in COP of the both CO2/290 and CO2/R404A systems.
Nomenclature
CO2 (R744) carbon dioxide
COP coefficient of performance (dimensionless)
GWP global warming potential
h specific enthalpy (kJ.kg-1)
HTC high temperature cycle
LTC low temperature cycle
m mass (kg)
𝑚 mass flow rate (kg s-1)
MFR mass flow rate ratio (dimensionless)
NH3 (R717) ammonia
ODP ozone depletion potential
𝑄 ̇ heat transfer rate (kW)
R290 propane
T temperature (oC or K)
𝑊̇ power (kW)
Greek symbols
Δ difference
Engineering Approaches on Sustainability (Edited by: Dr. Zehra Semra Can, Dr. Barış Yılmaz, Dr. Seval Genç, Dr. Candeniz Seçkin )
101
Subscripts
C condenser
CAS cascade
E evaporator
H high temperature cycle
L low temperature cycle
sub subcooling
sup superheating
References
Bhattacharyya, S., Mukhopadhyay, S., Kumar, A., Khurana, R.K., & Sarkar, J. (2005). Optimization of a CO2–C3H8 cascade system for refrigeration and heating. International Journal of Refrigeration, 28, 1284–1292.
Bansal, P. (2012). A review-Status of CO2 as a low temperature refrigerant: Fundamentals and R&D opportunities. Applied Thermal Engineering, 41, 18-29.
Bansal, P.K. & Jain, S. (2007). Cascade systems: past, present, and future. ASHRAE Trans., 113 (1), 245–252. Da Silva, A., Filho, E. P. B., Antunes, & A. H. P. (2012). Comparison of a R744 cascade refrigeration system with
R404A and R22 conventional systems for supermarkets. Applied Thermal Engineering, 41, 30-35. Messineo, A. (2012). R744-R717 cascade refrigeration system: Performance evaluation compared with a HFC two-stage
system. Energy Procedia, 14, 56-65. UNEP. (1987). Montreal protocol on substances that deplete the ozone layer, Retrieved October 12, 2016, from
http://www.unep.org/ozone. Yilmaz, B., Erdönmez, N., Sevindir, M. K., & Mancuhan, E. (2014). Thermodynamic analysis and optimization of cascade
condensing temperature of a CO2 (R744)/404A cascade refrigeration system. Paper presented at the meeting of 15th International Refrigeration and Air Conditioning Conference, 14-17 July 2014, Purdue University, West Lafayette, Indiana, USA.


Engineering Approaches on Sustainability (Edited by: Dr. Zehra Semra Can, Dr. Barış Yılmaz, Dr. Seval Genç, Dr. Candeniz Seçkin )
103
7 Removal of Pb (II) Ion From Aqueous Solution by Adsorption Process onto Paper Mill Sludge: Isotherm and Kinetics
Ali Yaraş Hasan Arslanoğlu Abstract
The various experimental parameters such as initial pH of solution, adsorbent dosage, initial concentration of solution, temperature and contact time were investigated for adsorption process of Pb (II) ion onto paper mill sludge (PMS). Results showed that the adsorption capacity was decreased depending on increase in temperature. The pseudo-second order kinetic model was best described the kinetic data. When the experimental data were applied to Langmuir, Freundlich and Dubinin-Redushkevich (D-R) isotherm models, the Langmuir was determined as the most suitable isotherm from among these isotherm models. Furthermore, the mechanism of adsorption process has ion-exchange character since the values of sorption energy were calculated in the range of 14.43-10.78 kJ/mol for all temperatures. The calculated negative values of thermodynamic parameters such as enthalpy (ΔHo) and free energy (ΔGo) were revealed the process to be exothermic and spontaneous in nature. Keywords: Adsorption, Paper Mill Sludge, Pb (II) ion, Isotherm, Kinetic
Introduction
ead metal is one of the toxic heavy metals may cause the environmental pollution and adversely
affects the health of human and many biological species on environment even at low concentrations
(Ong, Toorisaka, Hirata, & Hano, 2013). Lead is discharged from different industries such as
metallurgical, battery, mining, paint and dyes at high concentrations (Soetaredjo, Kurniawan, Ki, & Ismadji,
L

Ali Yaraş, Hasan Arslanoğlu (Removal of Pb (II) ion From Aqueous Solution by Adsorption Process onto Paper Mill Sludge: Isotherm and Kinetics)
104
2013). It is essential to reduce the permissible concentration limit of wastewater containing Pb (II) ion by
using various methods, before Pb (II) ions are discharged (Rao, Khan, & Rehman, 2011). The processes such
as membrane filtration (Rivas & Palencia, 2011), adsorption (Yargıç, Şahin, Özbay, & Önal, 2015), ion
exchange (Abdel-Aziz, Nirdosh, & Sedahmed, 2013) and precipitation (Lovell, Nancy, ShaKayla, & Kayla,
2013) are commonly used for the removal of heavy metals from aqueous solution. Among the processes,
adsorption is the most preferred process because it is applicable and economical process (Singh & Kaushal,
2013). In recent years, agricultural and industrial waste materials such as peanut shell, tomato waste, coconut
shell and rice bran were used as low cost adsorbents (Singha & Das, 2013; Yargıç et al., 2015).
Paper mill sludge (PMS) produced by the paper industry was used as adsorbent in this study. The effect of
initial pH of solution, adsorbent dosage, initial concentration of solution, temperature and contact time on
adsorption of Pb (II) ion onto PMS from aqueous solution was investigated in the batch adsorption
experiments. The results obtained from adsorption experiments were applied to the pseudo-first order, the
pseudo-second order and intra-particle diffusion kinetic models. The adsorption data were analyzed using
Langmuir (Langmuir, 1918), Freundlich (Freundlich, 1906) and Dubinin-Radushkevich (D-R) (Dubinin &
Radushkevich, 1947) isotherm models. Thermodynamic parameters such as ΔHo, ΔGo and ΔSo calculated by
using the most suitable isotherm for adsorption process. The experiments were carried out in triplicate for
reliability, repeatability of results.
Materials and Method
PMS provided from OYKA paper industry in Zonguldak/Turkey was air-dried in the laboratory, crushed and
sieved to obtain desired sizes (<100 mesh). The stock solution of Pb (II) (0.25 M) was prepared in the
concentration of 0.25 M by dissolving amount of 95.25 g salt of Pb(CH3COOH)2.3H2O. All solutions in
various concentrations (5, 10, 15, 20, 25 mM) were prepared by diluting with deionized water of 0.25 M
stock solution.
The experiments were conducted in 300 mL erlenmayer in an orbital shaker with adjustable temperature and
agitation speed (Zhcheng ZHWY-200D). Initial pH values of Pb (II) solutions were measured. After PMS
was added to prepared solutions in erlenmayer flasks, the mixtures were agitated under prescribed temperature
and time at 200 rpm. The mixture was filtered through the filter paper (Double Rings-203) and pH
measurement (Metler Delta 350) was performed in the filtrate. The residual concentration of Pb (II) ion in
supernatant was analyzed by Atomic Absorption Spectrophotometer (Perkin Elmer AAnalyst-400).
Analytical Technique
The percentage of adsorbed Pb (II) ion was calculated from the expression;
Adsorption yield (%) ( )o
so C100CC ´-=
(1)

Engineering Approaches on Sustainability (Edited by: Dr. Zehra Semra Can, Dr. Barış Yılmaz, Dr. Seval Genç, Dr. Candeniz Seçkin )
105
The amount of retained Pb (II) ion in the adsorbent phase was expressed as;
mVCCq so ´-
=)(
(2)
Co and Cs (mM) are the initial and final concentration of Pb (II) solution, respectively. q (mg/g) is the amount
of adsorbed lead ion by the adsorbent mass per unit, V (L) is the volume of solution and m (g) is the mass of
adsorbent (Esmaeli et al., 2013).
Results and Discussion
To investigate the effect of adsorbent dosage, PMS was added to 200 mL of Pb (II) solution (5 mM) by
changing adsorbent dosages from 0.5 to 50 g/L and then agitated through 24 hours. As shown in Figure 1,
the adsorption dosage is increased by increasing the removal percentage of Pb (II) ion. For example, while the
adsorbent dosage was increased from 0.5 to 5 g/L by increasing removal percentage of Pb (II) ion
approximately from 18% to 83%, the removal percentage was reached to maximum value (98%) in 10 g/L
adsorbent dosage. After this value, there is no change in the adsorption efficiency. Therefore, the adsorbent
dosage was chosen as 10 g/L and the further adsorption experiments were performed in this value.
After determination adsorbent dosage as 10 g/L, further experiments were carried out at the initial pH values
of the metal solutions from 2 to 5 during 24 hours, while the other experimental conditions were kept
constant. The influence of initial and final pH values of solutions on removal of Pb (II) ion was shown in
Figure 2. As seen from Figure 2, the removal of Pb (II) ion was clearly increasing depending upon increasing
initial pH value of metal solution and also the highest percentage removal of Pb (II) ion was obtained as
97.6% at pH 5. On the other hand, it was observed that the final pH values of metal solution were higher
than initial pH values of solution. This situation may be attributed that the remained aqueous solution has
generally basic character because of the adsorbent is containing compounds of calcium and sodium.
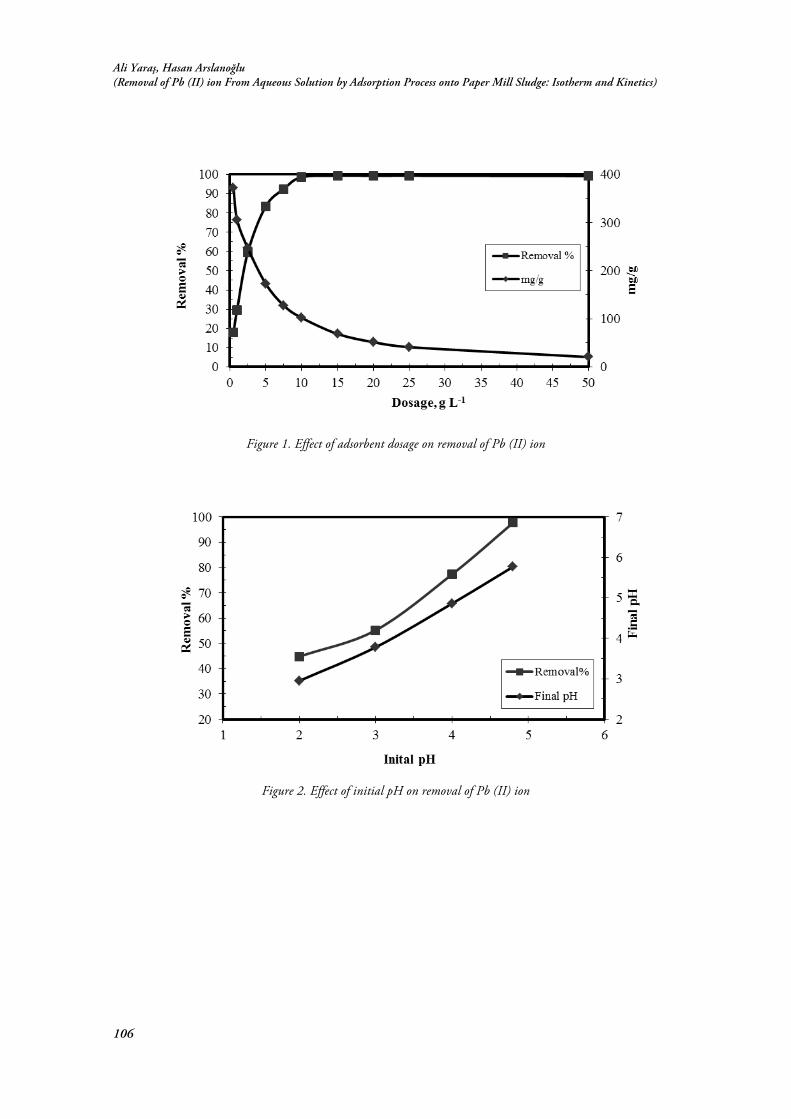
Ali Yaraş, Hasan Arslanoğlu (Removal of Pb (II) ion From Aqueous Solution by Adsorption Process onto Paper Mill Sludge: Isotherm and Kinetics)
106
Figure 1. Effect of adsorbent dosage on removal of Pb (II) ion
Figure 2. Effect of initial pH on removal of Pb (II) ion
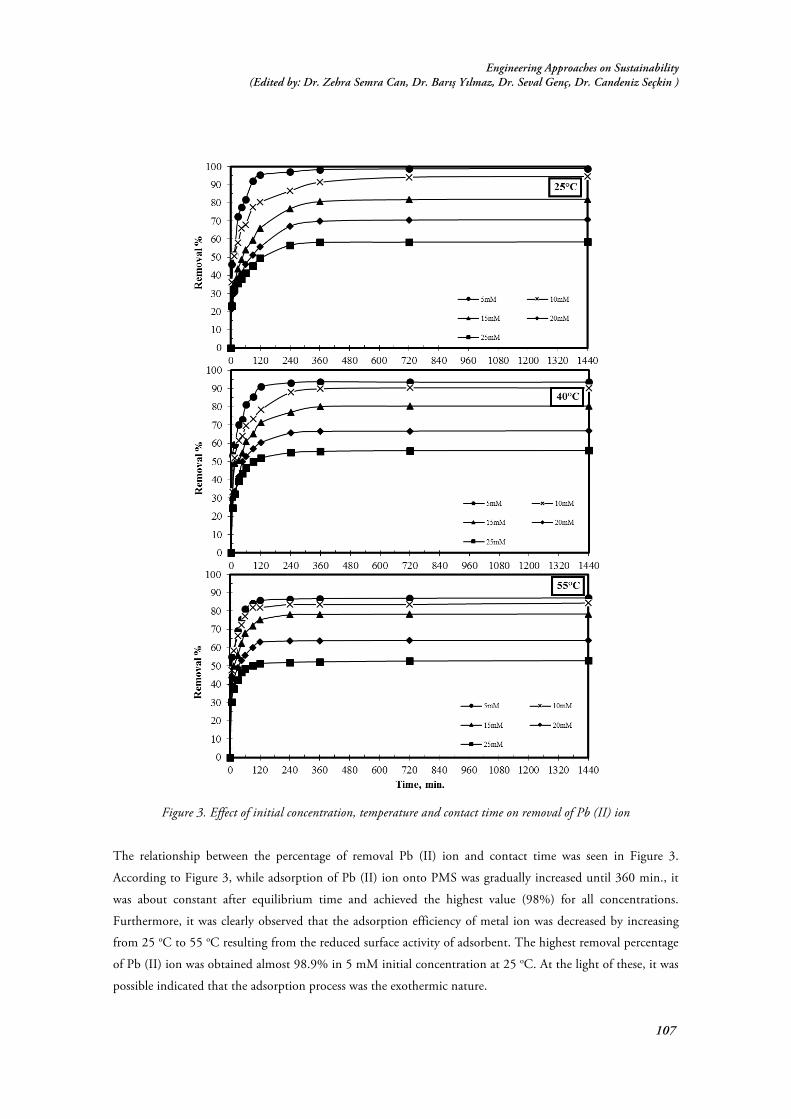
Engineering Approaches on Sustainability (Edited by: Dr. Zehra Semra Can, Dr. Barış Yılmaz, Dr. Seval Genç, Dr. Candeniz Seçkin )
107
Figure 3. Effect of initial concentration, temperature and contact time on removal of Pb (II) ion
The relationship between the percentage of removal Pb (II) ion and contact time was seen in Figure 3.
According to Figure 3, while adsorption of Pb (II) ion onto PMS was gradually increased until 360 min., it
was about constant after equilibrium time and achieved the highest value (98%) for all concentrations.
Furthermore, it was clearly observed that the adsorption efficiency of metal ion was decreased by increasing
from 25 oC to 55 oC resulting from the reduced surface activity of adsorbent. The highest removal percentage
of Pb (II) ion was obtained almost 98.9% in 5 mM initial concentration at 25 oC. At the light of these, it was
possible indicated that the adsorption process was the exothermic nature.

Ali Yaraş, Hasan Arslanoğlu (Removal of Pb (II) ion From Aqueous Solution by Adsorption Process onto Paper Mill Sludge: Isotherm and Kinetics)
108
To assess the kinetic of adsorption process, experimental data were applied to the equations belong to various
kinetic models such as the pseudo-first order (Largergren, 1898), the pseudo-second order (Ho, McKay,
Wase, & Forster, 2000) and intra-particle diffusion (Weber & Morris, 1963). According to results in Table 1,
it was determined that the best fit model is the pseudo-second order kinetic model due to the highest value of
R2 values for all temperatures and the quite closely values of qexp and qcal. . Similar results were obtained by
some researchers for adsorption process of Pb (II) ion onto different adsorbents (Gedam, Dongre, &
Bansiwal, 2015; Taşar, Kaya, & Özer, 2014).
Table 1. Calculated values of kinetic parameters for pseudo-second order kinetic model
The Langmuir isotherm is widely used kinetic model to explain the formation of monolayer on the surface of
the adsorbent and homogeneous surface of adsorbent in adsorption process. The linear form of Langmuir
equation can be written following as;
max
e
maxe
e 1qC
bqqC
+=
(3)
Here Ce, qe and qmax represent the Pb (II) ion concentration of solution at equilibrium time, the adsorption
capacity of the adsorbent and maximum adsorption capacity of adsorbent respectively. b is the a constant
linked to adsorption energy.
The equation of Freundlich isotherm describes the formation on heterogeneous surface of adsorbent and
given as following;
Temperature, oC
Co
(mM) qexp.
mg g-1
qcal.
mg g-1
k2 g mM-1 min.-1
R2
25
5 102.5 103.1 0.0011 0.9999 10 196.1 200.0 0.0003 0.9999 15 254.6 263.2 0.0001 0.9996 20 292.9 303.0 0.0001 0.9995 25 303.0 312.5 0.0002 0.9997
40
5 96.85 97.1 0.0015 0.9999 10 187.22 188.7 0.0004 0.9998 15 249.9 256.4 0.0003 0.9998 20 276.4 277.8 0.0003 0.9999 25 290.6 294.2 0.0003 1
55
5 90.4 91.0 0.0023 1 10 174.9 175.4 0.0010 1 15 243.8 243.9 0.0005 0.9999 20 265.3 270.3 0.0006 1 25 274.2 277.8 0.0006 1

Engineering Approaches on Sustainability (Edited by: Dr. Zehra Semra Can, Dr. Barış Yılmaz, Dr. Seval Genç, Dr. Candeniz Seçkin )
109
( ) efe Cn
Kq ln1lnln ÷øö
çèæ+=
(4)
where Kf is the Freundlich constant and 1/n is the adsorption capacity. The values of Kf and 1/n determined
from the intercept and slope from straight line of lnqe vs. lnCe.
(D-R) isotherm model based on Polany’s potential theory of adsorption mechanism is can be expressed as;
2lnln be-= mqq (5)
where β is a constant related to adsorption energy and ε is the Polanyi potential which is equal to
RTln(1+1/Ce), where R is the gas constant (kj.mol-1.K-1) and T is the absolute temperature (K). β constant
(mol2kj-2) and qm value were calculated from slope and intercept of the plot lnq vs. ε2. Accordingly, the
obtained isotherms by applying to Langmuir, Freundlich and D-R kinetic models and initial concentration of
Pb (II) ion solution in the range of 5-25 mM were showed in Figure 4.
Figure 4. Graphs of (a) Langmuir, (b) Freundlich and (c) D-R isotherms
(a)
(c)
(b)

Ali Yaraş, Hasan Arslanoğlu (Removal of Pb (II) ion From Aqueous Solution by Adsorption Process onto Paper Mill Sludge: Isotherm and Kinetics)
110
According to Langmuir isotherm, the state of adsorption process can be evaluate using dimensionless
separation factor (r) (Khezami & Capart, 2005).
011bC
r+
=
(6)
where r is the dimensionless separation constant, Co (mM.L-1) is the initial metal concentration, b is the
Langmuir constant (L.mM-1). The value of r is used to indicate the shape of the isotherm. r values indicate the
characteristic and feasibility of isotherm to be irreversible (r=0), favourable (0<r<1), linear (r=1) or
unfavorable (r>1) (Arslanoglu, Altundogan, & Tumen, 2009).
The calculated values belong to three kinetic models are given in Table 2. The results are showed that the
Langmuir isotherm is the most suitable for this process since it has the highest value of R2. Furthermore, the
calculated values of sorption energy from D-R isotherm model were in the range of 14.43-10.78 kJ/mol for
all temperatures. Therefore, it can be indicated that the ion-exchange mechanism is dominant for this process.
The adsorption capacity of Pb (II) ion was also determined as 310-305 mg/g. The adsorption process is
favorable due to the value of dimensionless constant (r) is in the range of 0.72-0.98 as shown in Table 3.
Table 2. Calculated parameters and regression coefficients from Langmuir, Freundlich and D-R isotherm models
Temperature, oC
Langmuir Freundlich D-R
b qmax R2 1/n Kf R2
qmax
E R2
25 0.0152 309.60 0.998 0.208 65.85 0.971 426.94 14.43 0.994 40 0.0071 307.69 0.999 0.299 32.16 0.895 527.48 11.78 0.937 55 0.0041 304.88 0.996 0.369 17.93 0.859 595.05 10.78 0.905
Tablo 3. Calculated r values for Pb (II) adsorption
Temperature oC r = 1/(1+bC0)
5 mM 10 mM 15 mM 20 mM 25 mM 25 0.93 0.87 0.81 0.77 0.72 40 0.97 0.93 0.90 0.88 0.85 55 0.98 0.96 0.94 0.92 0.91 The values of thermodynamic parameters such as entalphy (ΔHo), free energy (ΔGo) and entropy (ΔSo) were
calculated by using following equations;
RTG
b
oD=÷øö
çèæ 1ln
(7)

Engineering Approaches on Sustainability (Edited by: Dr. Zehra Semra Can, Dr. Barış Yılmaz, Dr. Seval Genç, Dr. Candeniz Seçkin )
111
RTHbbo
oD
-= lnln
(8)
ooo STHG D-D=D (9)
As seen from Table 4, the negative values of ΔGo and ΔHo are indicated that the adsorption process is
spontaneous nature and exothermic, respectively. The positive change of ΔSo can be result from increased
randomness in the solid/solution interface through adsorption process.
Table 4. Calculated values of thermodynamic parameters
Temperature, oC ΔHo (kj/mol) ΔGo (kj/mol) ΔSo (kj/mol) 25
-35.68 -6.74 0.142
40 -5.10 0.130 55 -3.84 0.121
Conclusion
The results of present study showed that the paper mill sludge (PMS) may be used as efficient and eco-
friendly adsorbent for adsorption of Pb (II) ion from wastewater containing Pb (II) ion at high concentration.
The highest removal percentage of Pb (II) ion for adsorption process was obtained at contact time (360 min.),
initial of pH=5, temperature (25 oC), adsorbent dosage (10 g/L) and initial concentration of solution (5 mM)
experimental conditions. As a result of different isotherm and kinetic models, the mechanism of adsorption
process has ion-exchange character. The adsorption process was spontaneous and exothermic in nature
according to the calculated thermodynamic parameters. For further studies, the utilization of PMS and
modified PMS as adsorbent can be investigated in adsorption processes of hazardous heavy metals and dyes.
References
Abdel-Aziz, M. H., Nirdosh, I., & Sedahmed, G. H. (2013). Ion-exchange-assisted electrochemical removal of heavy metals from dilute solutions in a stirred-tank electrochemical reactor: a mass-transfer study. Industrial & Engineering Chemistry Research, 52(33), 11655-11662.
Arslanoglu, H., Altundogan, H. S., & Tumen, F. (2009). Heavy metals binding properties of esterified lemon. Journal of Hazardous Materials, 164(2), 1406-1413.
Dubinin, M., & Radushkevich, L. (1947). Equation of the characteristic curve of activated charcoal. Chem. Zentr, 1(1), 875.
Esmaeli, A., Jokar, M., Kousha, M., Daneshvar, E., Zilouei, H., & Karimi, K. (2013). Acidic dye wastewater treatment onto a marine macroalga, Nizamuddina zanardini (Phylum: Ochrophyta). Chemical Engineering Journal, 217, 329-336.
Freundlich, H. (1906). Over the adsorption in solution. J. Phys. Chem, 57(385471), 1100-1107. Gedam, A. H., Dongre, R. S., & Bansiwal, A. K. (2015). Synthesis and characterization of graphite doped chitosan
composite for batch adsorption of lead (II) ions from aqueous solution. Advanced Materials Letters, 6(1), 59-67.

Ali Yaraş, Hasan Arslanoğlu (Removal of Pb (II) ion From Aqueous Solution by Adsorption Process onto Paper Mill Sludge: Isotherm and Kinetics)
112
Ho, Y., McKay, G., Wase, D., & Forster, C. (2000). Study of the sorption of divalent metal ions on to peat. Adsorption Science & Technology, 18(7), 639-650.
Khezami, L., & Capart, R. (2005). Removal of chromium (VI) from aqueous solution by activated carbons: kinetic and equilibrium studies. Journal of Hazardous Materials, 123(1), 223-231.
Langmuir, I. (1918). The adsorption of gases on plane surfaces of glass, mica and platinum. Journal of the American Chemical Society, 40(9), 1361-1403.
Largergren, S. (1898). Zur theorie der sogenannten adsorption geloster stoffe. Kungliga Svenska Vetenskapsakademiens. Handlingar, 24, 1-39.
Lovell, A., Nancy, M., ShaKayla, N., & Kayla, M. (2013). Biosorption and chemical precipitation of lead using biomaterials, molecular sieves, and chlorides, carbonates, and sulfates of Na & Ca. Journal of Environmental Protection, 2013.
Ong, S.-A., Toorisaka, E., Hirata, M., & Hano, T. (2013). Comparative study on kinetic adsorption of Cu (II), Cd (II) and Ni (II) ions from aqueous solutions using activated sludge and dried sludge. Applied Water Science, 3(1), 321-325.
Rao, R. A. K., Khan, M. A., & Rehman, F. (2011). Batch and column studies for the removal of lead (II) ions from aqueous solution onto lignite. Adsorption Science & Technology, 29(1), 83-98.
Rivas, B. L., & Palencia, M. (2011). Removal-concentration of pollutant metal-ions by water-soluble polymers in conjunction with double emulsion systems: A new hybrid method of membrane-based separation. Separation and Purification Technology, 81(3), 435-443.
Singh, U., & Kaushal, R. K. (2013). Treatment of waste water with low cost adsorbent: A review. VSRD International Journal of Technical & Non-Technical Research, 4(13), 33.
Singha, B., & Das, S. K. (2013). Adsorptive removal of Cu (II) from aqueous solution and industrial effluent using natural/agricultural wastes. Colloids and Surfaces B: Biointerfaces, 107, 97-106.
Soetaredjo, F. E., Kurniawan, A., Ki, O. L., & Ismadji, S. (2013). Incorporation of selectivity factor in modeling binary component adsorption isotherms for heavy metals-biomass system. Chemical Engineering Journal, 219, 137-148.
Taşar, Ş., Kaya, F., & Özer, A. (2014). Biosorption of lead (II) ions from aqueous solution by peanut shells: equilibrium, thermodynamic and kinetic studies. Journal of Environmental Chemical Engineering, 2(2), 1018-1026.
Weber, W. J., & Morris, J. C. (1963). Kinetics of adsorption on carbon from solution. Journal of the Sanitary Engineering Division, 89(2), 31-60.
Yargıç, A., Şahin, R. Y., Özbay, N., & Önal, E. (2015). Assessment of toxic copper (II) biosorption from aqueous solution by chemically-treated tomato waste. Journal of Cleaner Production, 88, 152-159.

Engineering Approaches on Sustainability (Edited by: Dr. Zehra Semra Can, Dr. Barış Yılmaz, Dr. Seval Genç, Dr. Candeniz Seçkin )
113
8 Application of Pervaporation in Environmental Engineering: VFA Separation via Commercial and Manufactured Membranes
Caglar Kullu Hatice Taner Hatice Yesil Adile Evren Tugtas Abstract
Volatile fatty acids (VFAs), which are currently synthesized from fossil fuels, are utilized in various industries. However, scarcity of fossil fuels has generated a new research interest to develop sustainable processes to produce commodity chemicals such as VFAs. Biological synthesis of VFAs through anaerobic fermentation is possible and would decrease the demand for natural resources; however produced VFAs should be separated from fermentation broths. In this study, separation of VFAs via pervaporation, a promising membrane-based technology, was investigated using porous and non-porous membranes and effects of flow rate, feed composition, and membrane type on the separation efficiency were assessed. Optimum flow rate for VFA separation was determined via polytetrafluoroethylene (PTFE) membrane at 55oC at flow rates ranging from 20.8 to 502.8 L/day. Effect of feed composition on separation efficiency was assessed at total VFA concentrations of 5000 mg/L, 10000 mg/L and 20000 mg/L at 35oC using a PTFE membrane. Porous PTFE and non-porous polydimethylsiloxane (PDMS) membranes (non-filled and 2.5% nano-silica filled vinyl terminated (PDMS-vinyl) and hydroxyl terminated (PDMS-OH/PTFE composite)) were used to determine the effect of membrane type on VFA separation. Increasing the feed concentration resulted in significantly increased acid flux and selectivity. Membrane type affected the flux and selectivity of VFAs and the flux of VFAs in different membranes were as follows in increasing order: PDMS-

Caglar Kullu, Hatice Taner Hatice Yesil, Adile Evren Tugtas (Application of Pervaporation in Environmental Engineering: VFA Separation via Commercial and Manufactured Membranes)
114
vinyl < silica-filled PDMS-vinyl < silica-filled PDMS-OH/PTFE composite < PDMS-OH/PTFE composite < PTFE. Whereas, selectivity of VFAs in membranes was as follows in increasing order: PDMS-vinyl < silica-filled PDMS-OH/PTFE composite < silica-filled PDMS-vinyl < PTFE < PDMS-OH/PTFE composite. Results of this study revealed that most efficient VFA separation was observed when PDMS-OH/PTFE composite membranes were used at 35oC with a flow rate of 300 L/d. This study will shed a light to integrated fermentation and membrane-based VFA separation applications, which will hopefully decrease the reliance on fossil-fuels for VFA production. Keywords: Membrane; pervaporation; recovery; volatile fatty acids
Introduction
ommodity chemicals such as volatile fatty acids (VFAs) are mostly synthesized through fossil fuel-
based processes (Eggeman and Verser 2005). However, scarcity of fossil fuel resources has generated
a new research interest to develop sustainable processes to produce commodity chemicals such as
VFAs (Elliott 2004). Biological synthesis of VFAs through anaerobic digestion of organic-rich wastes is a
promising and sustainable technology (Eggeman and Verser 2005). Every year approximately 1.3 billion tons
of food with high organic content is wasted globally (Gustavsson et al. 2011). However, organic-rich wastes
can be anaerobically fermented to produce commodity chemicals such as VFAs (Tugtas 2014). Anaerobic
digestion process is preferentially used to produce biogas and thus energy harvested in the form of methane
(Batstone et al. 2002). However, anaerobic digestion processes should not be only considered for biogas
production. In addition to biogas production, commodity chemicals such as organic acids (acetic, butyric,
lactic acid, etc.) or solvents (ethanol and buthanol etc.) can be produced via anaerobic digestion (Tugtas
2014). VFA production through anaerobic digestion/fermentation should be coupled with a VFA separation
technology as accumulated VFAs may inhibit the fermentation process (Arora et al. 2007, Cheng et al. 2010,
H.Yesil et al. 2014). VFA separation from various media has been achieved using technologies such as;
chemical precipitation (Dionysiou et al. 2000), solvent extraction (Alkaya et al. 2009), adsorption (Garcia
1991), electrodialysis (Wang et al. 2006), distillation (Araromi et al. 2014) and membrane separation (H.Yesil
et al. 2014, Qin et al. 2003, Thongsukmak and Sirkar 2007). Pervaporation, a membrane based technology,
is a potentially attractive process for the separation of VFAs (Alghezawi et al. 2005). In pervaporation, liquid
is in contact with one side of the membrane while vacuum or gas purge is applied on the other side of the
membrane facilitating the transfer of components through the membrane (Vane 2005). Operational
conditions such as feed concentration, temperature, pressure difference and feed recirculation flowrate may
affect the separation efficiency of pervaporation systems (Jiraratananon et al. 2002, Liang et al. 2004).
Pervaporative VFA separation have been investigated using various membranes, such as polyaniline (PANI)
(Huang et al. 1998), polyvinyl alcohol (PVA) (Isiklan and Sanli 2005), acrylonitrile (Alghezawi et al. 2005),
polytetrafluoroethylene (PTFE) (Qin et al. 2003) and polydimethylsiloxane (PDMS) (Bennett et al. 1997). In
addition, inorganic fillers such as nano-silica (Sun et al. 2013), zeolite (Zhan et al. 2009), TiO2 (Yang et al.
2009), and carbon black (Guo et al. 2007) have been integrated to membranes to increase the separation
efficiency.
C

Engineering Approaches on Sustainability (Edited by: Dr. Zehra Semra Can, Dr. Barış Yılmaz, Dr. Seval Genç, Dr. Candeniz Seçkin )
115
In this study, applicability of pervaporation to environmental engineering field was investigated. Effect of flow
rate, VFA concentration, and membrane type on pervaporative separation of VFAs were tested using PTFE,
non-filled and filled (hydrophilic nano-silica filled) hydroxyl terminated PDMS-OH/PTFE composite
membranes, and non-filled and filled (hydrophilic nano-silica filled) vinyl terminated PDMS membranes.
Materials and Methods
Chemicals
Acetic acid for analysis (No Merck 100063, Millipore Co., Germany); propionic acid for synthesis (No.
Merck 800605, Millipore Co., Germany); butyric acid for synthesis (No. Merck 800457, Millipore Co.,
Germany); valeric acid for analysis (No. Riedel de Haen 27818, Riedel de Haen AG, Germany); caproic acid
for analysis (No. Riedel de Haen 60088, Riedel de Haen AG, Germany), hydroxyl terminated PDMS (No.
Aldrich 481939, St. Louis, Missouri, USA), n-hexane (No. Acros 197360010, Thermo Fisher Scientific,
USA); dibutyltin dilaurate (No. Acros 382690050, Thermo Fisher Scientific, Belgium), tetraethyl
orthosilicate (No. Acros 157810010, Thermo Fisher Scientific, Belgium), dicumyl peroxide (No. Merck
8201630250, Merck Millipore Co., USA); hydrophilic silica (No. 1001129031, Sigma-Aldrich Co., USA),
Vinyl terminated PDMS (No. Xiameter RBB 2100-30, Dow Corning Co., Midland, Michigan, USA), and
concentrated phosphoric acid (H3PO4) (Cas No: 7664-38-2, Saf Kimya Co., Turkey).
Membranes
Separation efficiency of VFAs from synthetic VFA mixture was investigated via three different membranes;
commercial PTFE membrane (Emflon PTFE, 0.2 µm pore size, Pall Co., Port Washington, New York,
USA), vinyl-terminated PDMS membranes (PDMS-vinyl) with and without nano-silica filling, and PTFE
supported hydroxyl-terminated PDMS (PDMS-OH/PTFE composite) membranes with and without nano-
silica filling. PDMS-vinyl membranes were prepared without a support layer due to their high tensile
strength. Vinyl terminated PDMS membranes were fabricated through solvent casting method. PDMS-vinyl
polymer was dissolved in hexane of a PDMS/n-hexane ratio of 20% (by weight) using a magnetic stirrer
(Heidolph MR Hei-Mix L, Germany) for 12 hours. Hydrophilic nano-silica addition (2.5% by weight of
PDMS-vinyl) was carried out at this point for nano-silica filled membranes. The cross-linker dicumyl
peroxide was added to the homogenized polymer/hexane mixture with a PDMS/crosslinker ratio of 4%. The
polymeric membrane solution was stirred for polymerization reactions for 24 hours. The solution was placed
in an ultrasonic water bath (Bandelin, Sonorex DK 156 BP, Germany) at room temperature and 100% power
with HF-Frequency 35 kHz was applied to achieve a homogeneous mixture and to prevent possible hexane
fuming, which can cause the formation of heterogeneous pores in the membrane. The formed solution was
casted on a Teflon plate and the hexane was allowed to completely evaporate at ambient temperature for 24 h.
The crosslinking of the membrane was accomplished by gradual heating from ambient temperatures up to
200oC within 7 hours in an oven (Termal G11320SD, Termal Co, Turkey).
Caglar Kullu, Hatice Taner Hatice Yesil, Adile Evren Tugtas (Application of Pervaporation in Environmental Engineering: VFA Separation via Commercial and Manufactured Membranes)
116
Hydroxyl terminated PDMS (PDMS-OH/PTFE composite) membranes were prepared in accordance with
mixture casting method. The polymer solution was prepared by dissolving a hydroxyl terminated
polydimethylsiloxane (PDMS), cross-linker (tetraethylorthosilicate, TEOS) and catalyst (dibutyltin dilaurate)
in hexane. The polymer solution was prepared in constant PDMS/hexane, crosslinker and catalyst ratios of
30% (w/v), 20% (w/v) and 2% (w/w) respectively. Hydrophilic nano-silica addition (2.5% by weight of
PDMS-vinyl) was carried out at this point for nano-silica filled membranes. The polymer solution was mixed
for 24 hours using a magnetic stirrer (Heidolph MR Hei-Mix L, Germany) in order to homogenize the
solution and to initiate polymerization. The polymeric solution was casted on a PTFE membrane with a
stainless steel casting blade (Gardco Universal blade applicator, USA) at 254 µm thickness and dried at
ambient temperature for 24 hours allowing hexane to evaporate. Subsequently, crosslinking of the membranes
were carried out at 100oC for 24 hours in an oven (Termal G11320SD, Termal Co, Turkey).
Membrane Characterizations
Contact angle and tensile strength analysis were carried out to characterize the membranes. The contact angle
of water on membranes were measured through sessile drop method using a tensiometer at ambient
temperature (Model: Krüss FM41, A.Krüss Optronic GmbH, Hamburg, Germany). Physical endurance of
the manufactured PDMS-vinyl membranes was determined via tensile strength test (Model: Zwick GmBH &
Co., Ulm, Germany). Young's modulus of membranes was determined by applying 30 mm/min pulling
speed.
Pervaporation Studies
VFA separation assays were conducted with a pervaporation setup (Figure 1). A lab scale two-pieced stainless
steel membrane contactor was used. The feed and permeate compartments of the contactor were separated by
a membrane with an active surface area of 12.56 cm2. A 10-16 µm porous glass support was placed in the
permeate compartment (Borucam G4, İstanbul, Turkey) to protect the membranes from vacuum. VFA
transfer through the membranes were carried out via the use of a vacuum pump (Edward 1.5 Crawley,
England) and a vacuum regulator (J-KEM Sceintific-300, USA) creating a constant pressure of 3.0 torrs at
permeate side while the feed side was kept under atmospheric pressure (Figure 1). VFA permeated through
the membrane was condensed in liquid nitrogen immersed cold traps (KGW Isotherm 17202 KF 29-GL-Z,
Karlsruhe, Germany). Samples were taken from the feed and the permeate sides at intervals of two hours.
Each assay was conducted for 6 hours. Effect of feed recirculation flow rate on pervaporative VFA separation
was assessed using a PTFE membrane and the assays were conducted at 55oC. Recirculation flow rates at the
feed side of the membrane was ranged between 20.8 L/day to 502.8 L/day (20.8 L/d, 102.3 L/d, 212.6 L/d,
376.1 L/d and 502.8 L/d) via a peristaltic pump (Watson Marlow 323, Cornwall, UK).

Engineering Approaches on Sustainability (Edited by: Dr. Zehra Semra Can, Dr. Barış Yılmaz, Dr. Seval Genç, Dr. Candeniz Seçkin )
117
Figure 1. (1) Temperature-controlled cabinet, (2) Peristaltic pump, (3) Laboratory scale membrane contactor, (4)
Feed bottle (5) Magnetic stirrer, (6) Inline cold trap, (7) Protector cold trap, (8) Pervaporation table, (9) Vacuum
regulator and (10) Vacuum pump.
Feed concentration effect on pervaporative separation was investigated via PTFE membrane under 35oC, with
an optimum flow rate which was determined from flow rate assays. The assays were carried out at 5000 mg/L
(1000 mg/L of each acetic, propionic, butyric, valeric and caproic acids), 10000 mg/L (2000 mg/L of each
acetic, propionic, butyric, valeric and caproic acids) and 20000 mg/L (4000 mg/L of each acetic, propionic,
butyric, valeric and caproic acids) total VFA concentrations. The effect of membrane type on separation
efficiency was assessed via non filled PDMS-OH/PTFE composite and PDMS-vinyl polymeric membranes
and the effect of filling material on pervaporative separation was examined through including 2.5%
hydrophilic nano silica by weight of the polymer (PDMS-OH/PTFE composite or PDMS-vinyl). Both
studies were carried out at 35oC.
Analytical Methods
pH of the feed and permeate samples were measured using a pH meter (Inolab_IDS Multi 9310, WTW
GmbH, Germany). Samples were diluted and acidified with 1% phosphoric acid solution and were analysed
for their VFA content using a gas chromatography (Model: GC-2014ATF, Shimadzu, Kyoto, Japan)
equipped with a flame ionization detector and a capillary GC column (Model: TRB-FFAP 30m x 0.32 mm x
0.50 µm, Teknoroma, Sant Cugat del Velles, Spain). GC was operated under the following conditions: 80oC
column temperature, 260oC detector temperature, total flow of carrier gas 57.3 mL/min and purge flow 3
mL/min.

Caglar Kullu, Hatice Taner Hatice Yesil, Adile Evren Tugtas (Application of Pervaporation in Environmental Engineering: VFA Separation via Commercial and Manufactured Membranes)
118
Calculations
Membrane selectivity (α) of VFAs was defined by (Thongsukmak and Sirkar 2007);
α;<=/?@ABC=VFA weight fraction in the permeate VFA weight fraction in the feed
Water weight fraction in the permeate Water weight fraction in the feed (1)
VFA flux (JVFA) or permeation rate through the membrane under pseudo-stationary conditions was calculated
by;
J= mA.t
(2)
where m is the mass of VFA permeated through the membrane (g), A is the membrane surface area (m2), and
t is the time (h).
Reynolds number for various flow rates was calculated by;
𝑅𝑒 = FGH
(3)
Where Re is Reynolds number, u is feed velocity on the surface of membrane (m/s); h is the inlet height of
feed (m) and υ is the kinematic viscosity (m2/s) of feed solution (Liang et al. 2004).
Results and Discussion
Membrane Characterization
Contact angle of water on PTFE, filled and non-filled PDMS-vinyl, and filled and non-filled PDMS-
OH/PTFE composite membranes were assessed to determine hydrophilic and hydrophobic properties of
membranes (Table 1). Among all the membranes studied, PTFE membrane showed the highest
hydrophobicity with a contact angle of 143o significantly higher than 90o, demonstrating low water affinity
and high hydrophobicity at the surface of the membrane (Li et al. 2010) (Table 1). However, non-filled or
silica-filled composite PDMS-OH/PTFE composite membranes or PDMS-vinyl membranes showed
hydrophilic properties compared to that of PTFE membranes (Table 1).
Table 1. Contact angles of PTFE, PDMS-Vinyl and PDMS-OH membranes
Membrane Silica type
Contact Angle (avg±std error)
PTFE - 143±0.1 Non-filled PDMS-vinyl - 96.97±0.50 PDMS-vinyl 2.5% filling Hydrophilic 89.15±0.13 Non-filled PDMS-OH/PTFE composite 108 ± 5.8 PDMS-OH/PTFE composite 2.5% filling Hydrophilic 104 ± 8.0

Engineering Approaches on Sustainability (Edited by: Dr. Zehra Semra Can, Dr. Barış Yılmaz, Dr. Seval Genç, Dr. Candeniz Seçkin )
119
The variation in tensile strength of nano-silica filled and non-filled PDMS-vinyl membranes are shown in
Table 2. It can be clearly seen that PDMS-vinyl membrane’s mechanical strength was greatly enhanced (Table
2).
Table 2. Tensile strength results of vinyl terminated PDMS membranes
Membrane Silica type Tensile strength Elasticity
Coefficient (σ) kg/cm2 (E) N/mm2
Pure - 1.46±0.36 0.15±0.11 2.5% filling Hydrophilic 7.78±4.00 0.46±0.38
Effect of feed flow rate
The effect of feed recirculation rate on acid flux and selectivity of mixed VFAs was evaluated with five
different flow rates (20.8 L/d, 102.3 L/d, 212.6 L/d, 376.1 L/d and 502.8 L/d) using a PTFE membrane at
55oC. The experimental results obtained from the pervaporation assays depict that flux and selectivity of
VFAs were significantly affected by the flow rate of feed solution (Figure 2). Increasing the flow rate from
20.8 L/d to 502.8 L/d resulted in about two-fold increase in terms of acid flux for all VFAs (Figure 2).
Membrane selectivity of acetic, propionic, butyric, valeric and caproic acids, decreased about 24%, 18%,
13%, 9% and 7%, respectively, with the increase in flow rate from 20.8 L/d to 502.8 L/d. The improvement
of VFA transfer through the membrane as a result of increased flow rate was due to decrease in boundary layer
thickness as a result of increased Reynolds number (Figure 2). In pervaporation process, resistance of
boundary layer dominates the overall mass transfer rate of target compound to be separated under laminar
flow (Re<2300) conditions (Liang et al. 2004, Oliveira et al. 2001). Moreover, the thickness of boundary
layer decreases remarkably with the increase of Reynolds number (Liang et al. 2004). Correspondingly,
increase in flow rate improved mixture status of feed solution across the membrane surface, causing less
boundary layer resistance and higher acid flux under given hydrodynamic conditions. On the other hand,
increase of flow rate resulted in an increase of water flux through the membrane. Overall mass transfer
resistance for water molecules was probably less due to smaller molecular size of water compared to that of
VFAs (Jullok et al. 2015).

Caglar Kullu, Hatice Taner Hatice Yesil, Adile Evren Tugtas (Application of Pervaporation in Environmental Engineering: VFA Separation via Commercial and Manufactured Membranes)
120
Figure 2. Effect of flowrate on selectivity and acid flux for different acids with PTFE membranes: (A) acetic,
(B) propionic, (C) butyric, (D) valeric and (E) caproic acids.
As a consequence, higher water permeation through the membrane was observed with increase of flow rate,
which resulted in decrease of VFA selectivity (Figure 2). An optimum flow rate for an efficient pervaporation
process was determined considering membrane flux and selectivity together. For all individual VFAs,
optimum flux and membrane selectivity was observed at a flow rate of 300 L/d (Figure 2). As a result, other
separation assays within this study were conducted by recycling the feed solution with a flow rate of 300 L/d.
Effect of Feed Concentration on VFA Separation
Three synthetic VFA mixtures (Mixture A, B and C) were prepared at total concentrations of 5000 mg/L,
10000 mg/L and 20000 mg/L with 1000 mg/L, 2000 mg/L and 4000 mg/L each of acetic, propionic,
0 100 200 300 400 500
Sele
ctiv
ity (a
)
0,0
0,2
0,4
0,6
0,8
1,0
1,2
15
20
25
30
35
40
45
0 200 400 600 800 1000 1200
SelectivityAcid Flux
0 100 200 300 400 5000,0
0,2
0,4
0,6
0,8
1,0
1,2
Acid
Flu
x (g
/m2 .h
)
15
20
25
30
35
40
45
0 200 400 600 800 1000 1200
0 100 200 300 400 500
Sele
ctiv
ity (a
)
0,0
0,2
0,4
0,6
0,8
1,0
1,2
15
20
25
30
35
40
45
0 200 400 600 800 1000 1200
0 100 200 300 400 5000,0
0,2
0,4
0,6
0,8
1,0
1,2
Acid
Flu
x (g
/m2 .h
)
15
20
25
30
35
40
45
0 200 400 600 800 1000 1200
Flowrate (L/day)
0 100 200 300 400 500
Sele
ctiv
ity (a
)
0,0
0,2
0,4
0,6
0,8
1,0
1,2
15
20
25
30
35
40
45
Reynolds Number
0 200 400 600 800 1000 1200
Acid
Flu
x (g
/m2 .h
)
A B
C D
E

Engineering Approaches on Sustainability (Edited by: Dr. Zehra Semra Can, Dr. Barış Yılmaz, Dr. Seval Genç, Dr. Candeniz Seçkin )
121
butyric, valeric and caproic acids, respectively. Mixture A, B and C were used to investigate concentration
effect on separation efficiency of PTFE membranes at 35oC via pervaporation.
The results of the assay revealed that the flux and selectivity of each VFA increased with increasing feed
concentration (Figure 3).
Figure 3. The effect of concentration and feed composition on VFA selectivity and acid flux with PTFE membranes:
AA, PA, BA, VA and CA signs are indicating acetic, propionic, butyric, valeric and caproic acids respectively.
Mixture A, Mixture B and Mixture C contain 1000 mg/L, 2000 mg/L and 4000 mg/L each of AA, PA, BA, VA
and CA, respectively.
Increase of total feed concentration from 5000 mg/L to 10000 mg/L resulted in increase of acid flux for all
individual VFAs (Figure 3A). Increase of total feed concentration from 5000 mg/L to 20000 mg/L resulted in
seven-fold increase in acid flux and selectivity of VFAs reached above 1.0 (Figure 3). The results indicate that
increase in feed concentration results in increase of selectivity and acid flux. Considering the general leachate
composition and the results of the assays, feed total concentration was set at 10000 mg/L (2000 mg/L each of
acetic, propionic, butyric, valeric and caproic acids) in pervaporation assays using manufactured (PDMS-
OH/PTFE composite and PDMS-vinyl) membranes.
Manufactured membranes
Pervaporation of VFAs through non-filled and silica-filled PDMS-OH/PTFE composite and PDMS-vinyl
membranes were assessed at 35oC, 300 L/d feed recirculation flowrate, and 3 torr vacuum. Feed solution was
prepared with 2000 mg/L each of acetic, propionic, butyric, valeric and caproic acids. Acetic, propionic,
butyric, valeric, and caproic acid selectivities of 2.03, 2.32, 2.75, 3.57, and 4.54, respectively were observed
for PDMS-OH/PTFE membranes (Figure 4B). Hydrophilic nano-silica filled PDMS-OH/PTFE composite
membrane resulted in dramatic decrease of both selectivity and flux of VFAs compared to that of non-filled
PDMS-OH/PTFE membranes (Figure 4). Hong et al., 2011 investigated acetic acid/water separation by
pervaporation with silica filled PDMS-OH/PTFE composite membrane under the operational conditions of
AA PA BA VA CA
Acid
Flu
x (g
/m2 .h
)
0
10
20
30
40
50 Mixture A Mixture B Mixture C
AA PA BA VA CA
Sele
ctiv
ity
0,0
0,2
0,4
0,6
0,8
1,0
1,2
1,4A B

Caglar Kullu, Hatice Taner Hatice Yesil, Adile Evren Tugtas (Application of Pervaporation in Environmental Engineering: VFA Separation via Commercial and Manufactured Membranes)
122
30oC, 624 L/day feed recirculation and 10% acetic acid feed concentration and a decrease of both flux and
selectivity was observed upon addition of nano-silica to membrane (Hong et al. 2011). The phenomena was
explained as sacrifice of selectivity for increasing permeation flux where addition of nano-silica increased
amorphous regions in the membrane therefore more VFA and even more water molecules could go through
the membrane (Hong et al. 2011). Non-filled PDMS-vinyl membrane resulted in lower acid flux and
selectivitycompare to that of non-filled PDMS-OH/PTFE composite membrane perhaps due to its dense
polymeric structure. Addition of nano-silica to PDMS-vinyl membranes resulted in decreased total
permeation flux, however the selectivity was increased (Figure 4).
Figure 4. Acid flux (A) and Selectivity (B) for nano-silica filled and non-filled PDMS-vinyl and
PDMS-OH/PTFE composite membranes.
Conclusions
In this study, VFA pervaporation efficiencies of PTFE, PDMS-OH/PTFE composite, and PDMS-vinyl
membranes were assessed. The results of the study revealed that the recirculation flow rate of 300 L/day was
optimum for the separation of VFAs through pervaporation. Increasing the feed concentration resulted in
significantly increased acid flux and selectivity. PTFE membranes resulted in highest VFA flux among all the
tested membranes. Lowest flux was observed in PDMS-vinyl membranes and the addition of silica slightly
enhanced the flux of PDMS-vinyl membranes. Highest selectivity was observed in PDMS-OH/PTFE
composite membranes, whereas lowest selectivity was observed in PDMS-vinyl membranes. Addition of silica
filling to PDMS-OH/PTFE composite membranes resulted in decreased flux and selectivity. However,
addition of silica filling to PDMS-vinyl membranes resulted in increased flux and selectivity.
AA PA BA VA CA
Tota
l Flu
x
Acid
Flu
x g/
(m2 .h
)
0.0
0.2
0.4
0.6
0.8
1.0To
tal F
lux
g/(m
2 .h)
0
50
100
150
200PDMS-vinylPDMS-OH/PTFESilica Filled PDMS-vinyl Silica Filled PDMS-OH/PTFE
AA PA BA VA CA
Tota
l Sel
ectiv
ity
Sele
ctiv
ity (a
)
0
2
4
6
8

Engineering Approaches on Sustainability (Edited by: Dr. Zehra Semra Can, Dr. Barış Yılmaz, Dr. Seval Genç, Dr. Candeniz Seçkin )
123
Acknowledgements
This work was largely supported by The Scientific and Technological Research Council of Turkey
(TUBITAK) under Grant number 112Y218. And partially through Marmara University Scientific Research
Project Unit (FEN-C-YLP-110316-0102).
References
Alghezawi, N., Sanlı, O., Aras, L. and Asman, G. (2005) Separation of acetic acid–water mixtures through acrylonitrile grafted poly(vinyl alcohol) membranes by pervaporation. Chemical Engineering and Processing, 44, pp. 51–58.
Alkaya, E., Kaptan, S., Ozkan, L., Uludag-Demirer, S. and Demirer, G.N. (2009) Recovery of acids from anaerobic acidification broth by liquid-liquid extraction. Chemosphere, 77, pp. 1137-1142.
Araromi, D.O., Sonibare, J.A. and Emuoyibofarhe, J.O. (2014) Fuzzy identification of reactive distillation for acetic acid recovery from waste water. Journal of Environmental Chemical Engineering, 2, pp. 1394–1403.
Arora, M.B., Hestekin, J.A., Snyder, S.W., Martin, E.J.S., Lin, Y.J., Donnelly, M.I. and Millard, C.S. (2007) The separative bioreactor: A continuous separation process for the simultaneous production and direct capture of organic acids. Separation Science and Technology, 42, pp. 2519-2538.
Batstone, D.J., Keller, J., Angelidaki, I., Kalyuzhnyi, S.V., Pavlostathis, S.G., Rozzi, A., Sanders, W.T.M., Siegrist, H. and Vavilin, V.A. (2002) The IWA Anaerobic Digestion Model No 1 (ADM1). Water Science And Technology, 45, pp. 65–73.
Bennett, M., Brisdon, B.J., England, R. and Field, R.W. (1997) Performance of PDMS and organofunctionalised PDMS membranes for the pervaporative recovery of organics from aqueous streams. Journal of Membrane Science, 137, pp. 63-88.
Cheng, F., Li, M., Li, D., Chen, L., Jiang, W., Kitamura, Y. and Li, B. (2010) Volatile organic acid adsorption and cation dissociation by porphyritic andesite for enhancing hydrolysis and acidogenesis of solid food wastes. Bioresource Technology, 101, pp. 5076–5083.
Dionysiou, D.D., Tsianou, M. and Botsaris, G.D. (2000) Investigation of the conditions for the production of calcium magnesium acetate (CMA) road deicer in an extractive crystallization process. Crystal Research and Technology, 35, pp. 1035-1049.
Eggeman, T. and Verser, D. (2005) Recovery of Organic Acids from Fermentation Broths. Applied Biochemistry and Biotechnology, 121–124, pp. 605-618.
Elliott, D.C. (2004) Biomass, Chemicals from. Encylopedia of Energy, 1, pp. 163-174. Garcia, A.A. (1991) Strategies for the recovery of chemicals from fermentation – a review of the use of polymeric
adsorbents. Biotechnology Progress, 7, pp. 33-42. Guo, R.L., Ma, X.C., Hu, C.L. and Jiang, Z.Y. (2007) Novel PVA silica nanocomposite membrane for pervaporative
dehydration of ethylene glycol aqueous solution. Polymer, 48, pp. 2939–2945. Gustavsson, J., Cederberg, C., Sonesson, U., Otterdijk, R.v. and Meybeck, A. (2011) Global food losses and food waste –
Extent, causes and prevention, Food and Agriculture Organization of the United Nations, Rome, Italy. Yesil H., Tugtas, A.E., A.Bayrakdar and B.Calli. (2014) Anaerobic fermentation of organic solid wastes: volatile fatty acid
production and separation. Water Science And Technology, 69(10), pp. 2132-2138. Hong, H., Chen, L., Zhang, Q. and Zhang, Z. (2011) Acetic Acid/Water Separation by Pervaporation With Silica Filled
PDMS Membrane. Polymer Engineering And Science, 51(5), pp. 819-825. Huang, S.-C., Ball, I.J. and Kaner, R.B. (1998) Polyaniline membranes for pervaporation of carboxylic acids and water.
Macromolecules, 31, pp. 5456-5464. Isiklan, N. and Sanli, O. (2005) Separation characteristics of acetic acid-water mixtures by pervaporation using poly(vinyl
alcohol) membranes modified with malic acid. Chemical Engineering and Processing, 44, pp. 1019-1027. Jiraratananon, R., Chanachai, A., Huang, R.Y.M. and Uttapap, D. (2002) Pervaporation dehydration of ethanol-water
mixtures with chitosan/hydroxyethylcellulose (CS/HEC) composite membranes II. Analysis of mass transport. Journal of Membrane Science, 195(2), pp. 143-151.

Caglar Kullu, Hatice Taner Hatice Yesil, Adile Evren Tugtas (Application of Pervaporation in Environmental Engineering: VFA Separation via Commercial and Manufactured Membranes)
124
Jullok, N., Hooghten, R.V., Luis, P., Volodin, A., Haesendonck, C.V., Vermant, J. and Bruggen, B.V.d. (2015) Effect of silica nanoparticles in mixed matrix membranes for pervaporation dehydration of acetic acid aqueous solution: plant-inspired dewatering systems. Journal of Cleaner Production, pp. 1-11.
Li, S.-Y., Srivastava, R. and Parnas, R.S. (2010) Separation of 1-butanol by pervaporation using a novel tri-layer PDMS composite membrane. Journal of Membrane Science, 363, pp. 287–294.
Liang, L., Dickson, J.M., Jiang, J. and Brook, M.A. (2004) Mass Transfer of Dilute 1,2-Dimethoxyethane Aqueous Solutions During Pervaporation Process. Journal of Applied Polymer Science, 100, pp. 2075–2084.
Oliveira, T.A.C., Cocchini, U., Scarpello, J.T. and Livingston, A.G. (2001) Pervaporation mass transfer with liquid flow in the transition regime. Journal of Membrane Science, 183, pp. 119–133.
Qin, Y., Sheth, J.P. and Sirkar, K.K. (2003) Pervaporation Membranes That Are Highly Selective for Acetic Acid over Water. Industrial & Engineering Chemistry Research, 42, pp. 582-595.
Sun, D., Li, B.-B. and Xu, Z.-L. (2013) Pervaporation of ethanol/water mixture by organophilic nano-silica filled PDMS composite membranes. Desalination, 322 pp. 159–166.
Thongsukmak, A. and Sirkar, K.K. (2007) Pervaporation membranes highly selective for solvents present in fermentation broths. Journal of Membrane Science, 302(1–2), pp. 45-58.
Tugtas, A.E. (2014) Recovery of volatile fatty acids via membrane contactor using flat membranes: Experimental and theoretical analysis. Waste Management, 34, pp. 1171-1178.
Vane, L.M. (2005) A review of pervaporation for product recovery from biomass fermentation processes. Journal of Chemical Technology and Biotechnology, 80(6), pp. 603-629.
Wang, L., Han, X., Li, J., Zhan, X. and Chen, J. (2011) Hydrophobic nano-silica/polydimethylsiloxane membrane for dimethylcarbonate–methanol separation via pervaporation. Chemical Engineering Journal, 171, pp. 1035–1044.
Wang, Q.H., Cheng, G.S., Sun, X.H. and Jin, B. (2006) Recovery of lactic acid from kitchen garbage fermentation broth by fourcompartment configuration electrodialyzer. Process Biochemistry, 41, pp. 152–158.
Yang, D., Li, J., Jiang, Z.Y., Lu, L.Y. and Chen, X. (2009) Chitosan/TiO2 nanocomposite pervaporation membranes for ethanol dehydration. Chemical Engineering Science, 64, pp. 3130–3137.
Zhan, X., Li, J.-d., Chen, J. and Huang, J.-q. (2009) Pervaporation Of Ethanol/Water Mixtures With High Flux By Zeolite-Filled Pdms/Pvdf Composite Membranes. Chinese Journal of Polymer Science, 27(6), p. 771−780.
Engineering Approaches on Sustainability (Edited by: Dr. Zehra Semra Can, Dr. Barış Yılmaz, Dr. Seval Genç, Dr. Candeniz Seçkin )
125
9 Treatment of A Textile Dye in Aqueous Solution Using Fe0/GAC Micro-Electrolysis System
Belgin Karabacakoğlu Duygu Yamaç Abstract
In this work, the removal of Deep Red, which is a type of reactive azo dye, from solution was investigated by micro-electrolysis. Micro-electrolysis reactor was filled by iron chip-granular activated carbon (Fe0/GAC) mixture. In micro-electrolysis experiments the effects of operational parameters such as initial dye concentration (50-200 mg/L), the circulating rate of the solution (9.1-33.1 mL/s), initial pH value of the solution (1-6) and solution conductivity (3-11 mS/cm) were examined. The optimum values of parameters were determined as initial pH of 3, dye concentration of 100 mg/L, feed circulating rate of 9.1 mL/s, and conductivity of 3 mS/cm. Under these conditions 99.5 % Deep Red removal was achieved. Keywords: Micro-electrolysis, Deep Red, Iron, Granular Activated Carbon, Dye Removal
Introduction
ne of the most important pollutants of wastewater in textile industry is dyestuff. Many different
types of dyes such as acidic, basic and reactive are used in textile industry. The reactive dyes are
preferable for cotton fabrics due to good adhesion properties, and it is known that a significant
portion of dye passes through the wastewater due to the hydrolysis side reactions (Pazos et al., 2011).
Particularly azo reactive dyes create serious environmental problems. The electrochemical methods such as
O

Belgin Karabacakoğlu, Duygu Yamaç (Treatment of A Textile Dye in Aqueous Solution using Fe0/GAC Micro-Electrolysis System)
126
electrochemical oxidation, electrocoagulation and electro-Fenton have an important place for treatment of the
reactive dyes. However, electrical power needs restricts the implementation of these methods on large scale.
Micro-electrolysis (ME) is a low-cost electrochemical method which does not need an external power supply
(Zhang et al., 2015). Micro-electrolysis column consists of iron chip and granular activated carbon. When
iron (anode) and activated carbon (cathode) are mixed and the solution or wastewater is passed through the
column, numerous macroscopic galvanic cells are formed (Yanhe et al., 2016). Compared to electrolysis, rates
of electrochemical reactions in micro-electrolysis are very slow due to lack of external electrical supply (Cheng
et al., 2007). The half-cell reactions can be represented as follows (Fan et al., 2009):
Anode (oxidation): 2Fe → 2Fe2+ + 4e- (1)
Cathode (reduction): 4H+ + 4e−→ 4[H] → 2H2 (Acidic medium) (2)
O2 + 4H+ + 4e−→ 2H2O (Acidic medium with oxygen) (3)
O2 + 2H2O + 4e− → 4OH− (Neutral to alkaline) (4)
Products released from the galvanic cell reactions include hydroxyl, atomic hydrogen and Fe(II) which have
high activities to decompose contaminants (Guo et al., 2013). Also Fe2+, which is evaluated from anodic
corrosion, can be oxidized to Fe3+ according to following reaction:
4Fe2+ + O2 + 4H+ → 4Fe3+ + 2H2O (5)
Furthermore, organic contaminants can also be removed through coagulation and co-precipitation by the
ferrous and ferric hydroxides formed from Fe2+ and Fe3+ according to the following reactions (Fan et al.,
2009):
Fe2+ + 2OH- → Fe(OH)2↓ (6)
Fe3+ + 3H2O → Fe(OH)3↓ + 3H+ (7)
In addition, hydrogen peroxide can be generated in the presence of oxygen at acidic conditions (Ren et al.,
2011; Lan et al., 2012):
O2 (g) + 2H+ + 2e- → H2O2 (8)
Hydrogen peroxide evaluated according to Eq. 8 can be reacted with Fe2+ in solution to generate OH radical
known as Fenton’s reagent. These radicals are very effective for degrading of organic molecules in wastewater
via oxidation (Ying et al., 2012):
H2O2 + Fe2+ → Fe3++ .OH+ OH- (9)

Engineering Approaches on Sustainability (Edited by: Dr. Zehra Semra Can, Dr. Barış Yılmaz, Dr. Seval Genç, Dr. Candeniz Seçkin )
127
Micro-electrolysis is a low-cost and environmentally-friendly process for the disposal of organic pollutants
that cannot be treated with traditional methods due to high chemical stability and low biodegradability (Guo
et al., 2013). This method can be used for the different characteristic wastewater such as textile (Yang et al.,
2009), petrochemical (Qin ve Gong, 2014), coke (Wen-wu et al., 2012) and polyester (Yang, 2009)
industries. By means of micro-electrolysis, the removal of different dye types such as anthraquinone dyes (Qin
et al., 2012), acidic dyes (Chen et al, 2013) and azo/diazo reactive dyes (Guo et al., 2013; Yanhe et al., 2016;
Karabacakoğlu et al., 2015) from water and wastewater has been studied. In many micro-electrolysis studies,
conventional micro-electrolysis column reactors containing Fe and C filling were used (Cheng et al., 2010,
Lai et al., 2013), and but in some cases, ozone (Guo et al., 2013) or peroxide (Wang et al., 2016; Chen et al.,
2013) was added to wastewater before or after feeding to Fe/C packed reactor.
The aim of this study is the treatment of the Deep Red by micro-electrolysis method. In experiments, the
effects of operational parameters such as initial dye concentration, the circulating rate of the solution, initial
pH value and solution conductivity were investigated.
Material and method
Materials
Waste iron chips were supplied from a metal machining mill (Eskişehir, Turkey). Iron chips and GAC were
sieved. Iron chips (0.85 mm<Dp<1 mm) were first treated a 10% NaOH solution for remove the surface
grease, and then soaked in a diluted (5%) hydrochloride acid solution for remove oxide layer, and finally
cleaned by deionized water. A commercial granular activated carbon (GAC) (Picacarb 830, Pica) was used in
the experiments. Before filling the reactor, the GACs (1 mm<Dp<1.4 mm) were cleaned by distilled water,
and then soaked in the dye solution of 200 mg/L for 24 h to eliminate the adsorption influence.
Table 1. Some properties of Deep Red
Name 2-Naphthalenecarboxamide, 3-hydroxy-4-((4-methyl-2-nitrophenyl)azo)-N-(3-nitrophenyl)
Molecular Formula C24H17N5O6 Molecular Weight 471.429 g/mol
Structure
EINECS Number 222-643-8 Colour Index 12350
(http1://www.chemicalbook.com/ProductChemicalPropertiesCB8356989_EN.htm)

Belgin Karabacakoğlu, Duygu Yamaç (Treatment of A Textile Dye in Aqueous Solution using Fe0/GAC Micro-Electrolysis System)
128
The reactive azo dye, Deep Red, was provided from a textile factory in Eskişehir, Turkey. The structure and
characteristics of dye were illustrated in Table 1. The synthetic wastewater containing the dye was prepared
using distilled water. pH and conductivity were adjusted to desirable values using HCl and Na2SO4,
respectively.
Experimental procedure
The experimental setup consists of a reactor, a peristaltic pump and an air pump (Fig.1). The micro-
electrolysis reactor was made of glass. The diameter and length of the reactor were 2 cm and 19.5 cm,
respectively.
Figure 1. Experimental setup
Iron chips and GAC were mixed together with a volume ratio of 1:1 and then packed to the ME reactor. The
height of the packed was 8.5 cm. This ratio of iron to activated carbon is the optimum value determined in
many studies (Yanhe et al., 2016; Lai et al., 2012; Chen et al., 2013). The empty bed contact time was
around 6 minutes. The dye solution was circulated through the reactor by peristaltic pump, and air was fed
into the bottom of the column by air pump. Experiments were carried out in recirculated batch mode. All
experimental studies were made with a model solution volume of 200 mL. A sample of 4 mL from dye
solution was taken every 15 minutes. The concentration of Deep Red was determined by measuring the
absorbance at λmax=519.5 nm with UV spectrophotometer (Aquamate). Dye removal efficiency was calculated
according to Eq. (10):
𝐷𝑦𝑒𝑅𝑒𝑚𝑜𝑣𝑎𝑙𝐸𝑓𝑓𝑖𝑐𝑖𝑒𝑛𝑐𝑦 % = "UV""U
. 100 (10)

Engineering Approaches on Sustainability (Edited by: Dr. Zehra Semra Can, Dr. Barış Yılmaz, Dr. Seval Genç, Dr. Candeniz Seçkin )
129
where C0 is the initial concentration of dye (mg/L), C is the concentration of dye in time t (mg/L).
Results and discussion
The effects of initial dye concentration (50-200 mg/L), the feed rate (9.1-33.1 mL/s), initial pH value of the
solution (1-6) and solution conductivity (3-11 mS/cm) on the removal efficiency of dye were examined.
Effect of time
All the experiments, in which the parameters were examined, were carried out by measuring the change in
Deep Red concentration over a certain period of time. Therefore the effect of time on the percentage of dye
removal is clearly visible in all figures. There was a sharp increase in the first 15 minutes, and it is observed
that the dye removal has changed more slowly especially after 30 minutes in all experiments. The results
showed that with the reaction time increasing, the removal efficiency of Deep Red increases. This indicates
that the extension of reaction time can effectively improve the degradation efficiency of dye in the ME
reactor.
Effect of Deep Red concentration
Fig. 2 shows the variation of the removal efficiency with dye concentration. The removal of Deep Red can
reach 80% after 30 min for concentration of 200 mg/L, whereas it is above 90% for low concentrations.
Similar results were obtained by Ren et al. (2011). For this reason, it is necessary to increase the amount of
column filling for higher removal in a shorter time for higher concentrations. This is more important in
continuous micro-electrolysis studies.
Figure 2.Effect of dye concentration on the removal efficiency (Flow rate: 11.4 mL/s, pH:3 ).

Belgin Karabacakoğlu, Duygu Yamaç (Treatment of A Textile Dye in Aqueous Solution using Fe0/GAC Micro-Electrolysis System)
130
Effect of initial pH
The most important variable affecting the efficiency in ME studies is pH value of the solution. The pH value
of textile wastewaters varies from 4 to 11 depending on the type of dye used. However, microelectrolysis
reactions occur under acidic conditions. For this reason, the pH range of the experiments was determined as 1
and 6.35 (original pH of the solution). Fig. 3 shows the effect of pH on the removal efficiency. Removal
efficiencies improved with the pH declining from 5 to 3, but decreased slightly when pH changed from 3.0 to
1.0. Therefore, pH was controlled at about 3 in the other experiments. Similar results can be seen in some
studies in the literature (Cheng et al., 2010; Huang et al., 2014).
Figure 3. Effect of pH on the removal efficiency (Flow rate: 11.4 mL/s, pH:3, Co: 100 mg /L)
The pH of wastewater affects the chemical state of pollutants and the molar ratio of Fe(II)/Fe(III) (Wen-wu
et al., 2012) and the electrostatic interaction by modifying the surface charge of the GAC (Lai et al., 2013).
The electromotive force of the galvanic cell reactions given in Equations 1-4 is very high in the presence of
oxygen under acidic conditions. The hydroxyl radical has an extremely high redox potential (E0 = 2.8 V), and
therefore it can react with most pollutants in ambient temperature and pressure. Acidic conditions are also
required for the production of .OH radicals. In addition, the increase in H+ concentration accelerates the
corrosion of iron (Li et al., 2011; Chen et al., 2013; Xu et al., 2016). However, large amounts of hydrogen
generating under acidic condition inactivate the iron, which inhibits the microscopic galvanic cell reaction.
Especially in the case of pH of 2 and 1, the corrosion of the iron accelerated and excess iron hydroxide causes
the bed to be clogged. Excess iron hydroxide remaining in the treated solution is another problem. Also, large
amounts of Fe2+ generating with the stronger acid will disturb the detection of chroma due to color-rendering
property (Yanhe et al., 2016).
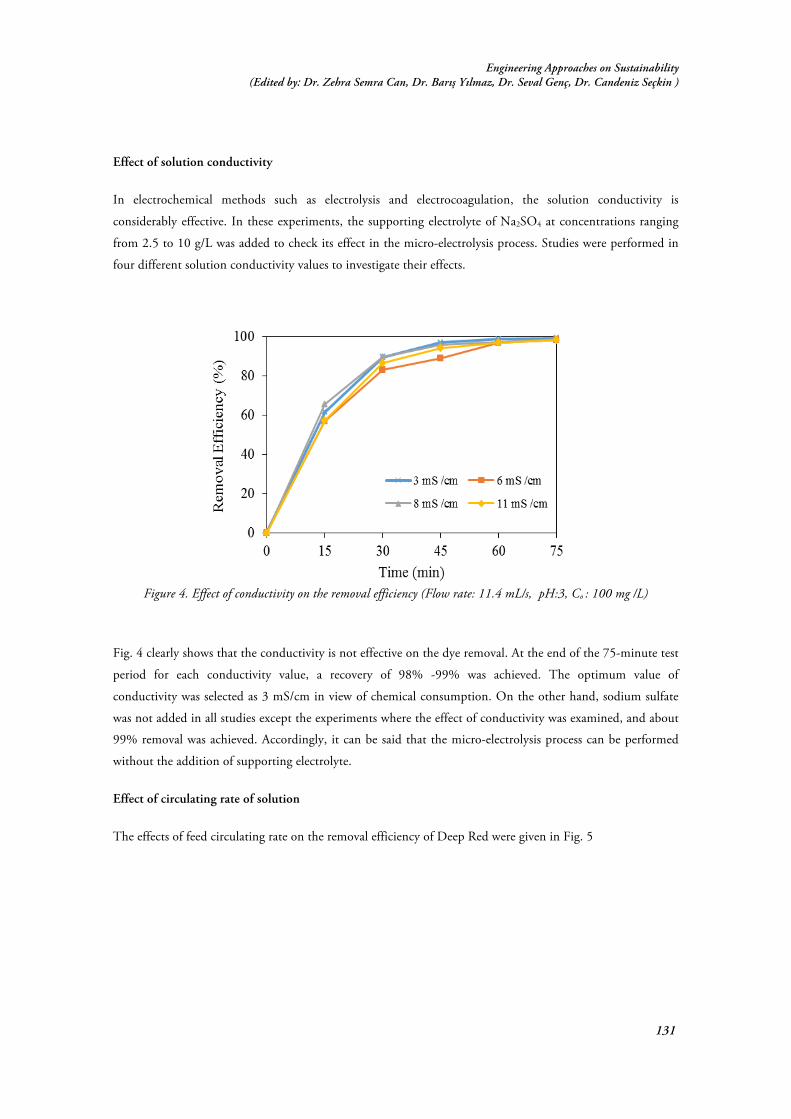
Engineering Approaches on Sustainability (Edited by: Dr. Zehra Semra Can, Dr. Barış Yılmaz, Dr. Seval Genç, Dr. Candeniz Seçkin )
131
Effect of solution conductivity
In electrochemical methods such as electrolysis and electrocoagulation, the solution conductivity is
considerably effective. In these experiments, the supporting electrolyte of Na2SO4 at concentrations ranging
from 2.5 to 10 g/L was added to check its effect in the micro-electrolysis process. Studies were performed in
four different solution conductivity values to investigate their effects.
Figure 4. Effect of conductivity on the removal efficiency (Flow rate: 11.4 mL/s, pH:3, Co : 100 mg /L)
Fig. 4 clearly shows that the conductivity is not effective on the dye removal. At the end of the 75-minute test
period for each conductivity value, a recovery of 98% -99% was achieved. The optimum value of
conductivity was selected as 3 mS/cm in view of chemical consumption. On the other hand, sodium sulfate
was not added in all studies except the experiments where the effect of conductivity was examined, and about
99% removal was achieved. Accordingly, it can be said that the micro-electrolysis process can be performed
without the addition of supporting electrolyte.
Effect of circulating rate of solution
The effects of feed circulating rate on the removal efficiency of Deep Red were given in Fig. 5

Belgin Karabacakoğlu, Duygu Yamaç (Treatment of A Textile Dye in Aqueous Solution using Fe0/GAC Micro-Electrolysis System)
132
Figure 5. Effect of feed flow rate on the removal efficiency (pH:3, Co: 100 mg /L)
As shown in Figure, the removal efficiency of dye rises with the decrease of feed flow rate, and the best
removal performance was observed at flow rate of 9.1 mL/s. The optimum values of parameters were
determined as initial pH of 3, dye concentration of 100 mg/L, feed circulating rate of 9.1 mL/s, and
conductivity of 3 mS/cm. Under these conditions 99.5 % Deep Red removal was achieved. The results
showed that the process of ME was an efficient and economical method to treat Deep Red solution.
Conclusion
In this study, Deep Red treatment was carried out by micro-electrolysis method using a mixture of iron
shavings and activated carbon. The cost of the ME process is determined primarily by the cost of the iron and
the active carbon used as the reactor filling. Iron shavings are very cheap because they are supplied from metal
processing residues. Activated carbon, the other filling material, can be used for a long time without being
regenerated. However, an iron oxide layer is formed on the Fe particles over a long period of use. This layer
reduces the catalytic activity and the number of galvanic cells, because it is electrically insulating. Therefore,
the bed can be occasionally washed with dilute acid solution to use the ME rector with long-term high yield.
In the process of ME electrical energy is consumed for pumping of solution and air. For this reason, it is more
economical than the electrochemical processes in which the electric current is directly used as the processing
means. As a result, micro-electrolysis method has shown that the reactive dyes can be removed with high
efficiency without applying electrical current. However, it is preferable to work with diluted wastewater so
that the ME method alone can be sufficient. The effect of the amount of filling can be examined to increase
efficiency. In large scale applications, it will be necessary to use the amount of filling material that can provide
adequate remediation in a single pass. Also suitable air distributors should be used for effective air flow.
Engineering Approaches on Sustainability (Edited by: Dr. Zehra Semra Can, Dr. Barış Yılmaz, Dr. Seval Genç, Dr. Candeniz Seçkin )
133
References
Chen Z., Sun X. , Liu Z., Huang X., Jia R. (2013). A Novel Application of Micro Electrolysis-Fenton Process on High-strength Acidic Dye Wastewater, Nature Environment and Pollution Technology, 12 ( 2) 255-260.
Cheng, H., Xu, W., Liu, J., Wang, H., He, Y., Chen, G. (2007). Pretreatment of wastewater from triazine manufacturing by coagulation, electrolysis, and internal microelectrolysis, Journal of Hazardous Materials, 146, 385–392.
Cheng, L., Bi X., Liu, C. (2010). Pretreatment of Straw Pulp and Papermaking Middle Stage Wastewater by Iron-carbon Microelectrolysis, IEEE.
Fan, L., Ni, J., Wu,Y. Zhang,Y. (2009). Treatment of bromoamine acid wastewater using combined process of micro-electrolysis and biological aerobic filter, Journal of Hazardous Materials, 162, 1204-1210.
Guo, X., Cai, Y. Wei, Z. H.,Hou Yang, X., Wang, Z. (2013). Treatment of di azo dye C.I. Reactive Black 5 in aqueous solution by combined process of interior micro electrolysis and ozonation, Water Sci.& Technol., 67 1880-1885.
http1://www.chemicalbook.com/ProductChemicalPropertiesCB8356989_EN.htm (date of access: 10.11.2016). Huang, D., Yue, Q., Fu, K., Zhang, B., Gao, B., Li, Q., Wang, Y. (2014). Application for acrylonitrile wastewater
treatment by new micro-electrolysis ceramic fillers, Desalination and Water Treatment, 1-9. Karabacakoğlu, B., Zurnacı, İ., Memiş, F., Kaya, K., Öztaylan, Y. (2015). Mikroelektroliz yöntemi ile model çözeltiden
reaktif black 5 giderimi, Anadolu University Journal of Science and Technology A- Applied Sciences and Engineering , 16 (2) 31 –326.
Lai, B., Zhou, Y., Yang, P., Yang, J., Wang, J. (2013). Degradation of 3,3-iminobis-propanenitrile in aqueous solution by Fe0 /GAC micro-electrolysis system, Chemosphere, 90 1470-1477.
Lan, S.,Ju, F., Wu, X. (2012). Treatment of wastewater containing EDTA-Cu(II) using the combined process of interior microelectrolysis and Fenton oxidation–coagulation, Separation and Purification Technology, 89, 117–124.
Li, M., Zou, D., Zou, H., Fan D. (2011) Degradation of nitrobenzene in simulated wastewater by iron-carbon micro-electrolysis packing, Environ Technol., 33 (15-16) 1761-6.
Pazos, M., Sanroman, A.M., Rivera M. (2011). Development of an electrochemical cell for the removal of Reactive Black 5, Desalination, 274, 39-43.
Qin, G.,Gong, D. (2014). Pretreatment of petroleum refinery wastewater by microwave-enhanced Fe0/GAC micro-electrolysis, Desalination and Water Treatment, 52, 2512–2518.
Qin, L., Zhang, G., Meng, Q., Xu, L., Lv, B. (2012). Enhanced MBR by internal micro-electrolysis for degradation of anthraquinone dye wastewater, Chemical Engineering Journal, 210, 575–584.
Ren, Y., Wu, Z., Ondruschka, B., Braeutigam, P., Franke, M., Nehring, H., Hampel, U. (2011) Oxidation of Phenol by Microbubble-Assisted Microelectrolysis, Chem. Eng. Technol., 34, 5, 699–706.
Wang, L., Yang, Q., Wang, D., Li, X., Zeng, G., Li, Z., Deng, Y., Liu, J., Yi, K. (2016). Advanced landfill leachate treatment using iron-carbon microelectrolysis- Fenton process: Process optimization and columnexperiments, Journal of Hazardous Materials, 318 460–467.
Wen-wu, L.,Xue-yan, T., Xiu-ping, W., Feng-qun, W., Wen, L. (2012), Pretreatment of coking wastewater by acid out, micro-electrolysis process with in situ electrochemical peroxidation reaction, Chemical Engineering Journal, 200, 720–728.
Xu X., Cheng Y., Zhang T., Ji F., Xu X. (2016). Treatment of pharmaceutical wastewater using interior microelectrolysis/Fenton oxidation-coagulation and biological degradation, Chemosphere, 152, 23-30.
Yang, X. (2009), Interior micro electrolysis oxidation of polyester wastewater and its treatment technology, Journal of Hazardous Materials, 169, 480–485.
Yang, X., Xue, Y., Wang, W. (2009). Mechanism, kinetics and application studies on enhanced activated sludge by interior microelectrolysis, Bioresource Technology, 100, 649–653.
Yanhe H., L. Han, L. Meili, S. Yimin, L. Cunzhen, C. Jiaqing, (2016). Purification treatment of dyes wastewater with a novel micro-electrolysis reactor, Separation and Purification Technology, 170, 241–247
Ying, D., Peng J., Xu X., Li K., Wang Y., Ji, J. (2012). Treatment of mature landfill leachate by internal micro-electrolysis integrated with coagulation: A comparative study on a novel sequencing batch reactor based on zero valent iron, Journal of Hazardous Materials, 229, 426-433.
Zhang L., L. Zhang, D. Li. (2015). Enhanced dark fermentative hydrogen production by zero-valent iron activated carbon microelectrolysis, Int. J. Hydrogen Energy, 40, 12201-12208.


Engineering Approaches on Sustainability (Edited by: Dr. Zehra Semra Can, Dr. Barış Yılmaz, Dr. Seval Genç, Dr. Candeniz Seçkin )
135
10 Production of Polyester Composite Material Using Pine Cone Powder as Reinforcement
Duygu Gökdai Alev Akpınar Borazan Abstract
Natural fiber reinforced polymer composites have much potential as a progressive material in many industrial applications. Although pine cones have fibril morphology and good mechanical properties they are rarely used as reinforcement in polymer composites. In this study, polymer matrix composites were produced using pine cone waste as reinforcement and polyester as polymer matrix with the casting method. Before mixing the polyester and filler the pine cones were chemically treated to avoid weak coherence between the natural fibers and polymer matrix and to clean their surface and corroborate binding with the polymer. Some mechanical and physical properties of composite materials were analyzed and the composites tested to determine their flexural strength, elastic modulus and hardness. Physical features such as density and water absorption were also investigated. Increasing the ratio of pine cone filler led to an increase in flexural strength values and a decrease of elastic modulus. Chemical treatment applied to pine cones reduced the increasing ratio of flexural strength and also the decreasing ratio of elastic modulus. Increasing the amount of cones reduced the impact strength and was supported by increasing the amount of open porosity. This was because the high amount of pine cone increased both the porosity of the composite and water absorption. Keywords: Polymer matrix composites, pine cone waste, polyester, mechanical properties

Duygu Gökdai, Alev Akpınar Borazan (Production of Polyester Composite Material Using Pine Cone Powder as Reinforcement)
136
Introduction
ecently; there has been wide interest in the production of natural fiber/particle reinforced polymer
composites that have great potential in many application areas like construction, packaging,
electronics and automotive industries (Baştürk et al., 2015; Prasad & Rao, 2011; Wei & Gu, 2009).
As a result of increasing environmental problems researchers have focused on new sustainable bio-composite
materials (Zhan et al., 2011). Polymer based composites have some significant features such as light weight
and good mechanical and tribological responses (Gopinath et al., 2014). Several recently conducted studies
on this subject are available. Arrakhiz et al. researched the mechanical and thermal properties of clay and pine
cone fiber reinforced polypropylene hybrid composite at a total weight percent of 30. The tensile property
results indicate that the Young’s modulus increased for whole systems reaching a gain of 80%, while tensile
strength remained stable with the use of both charges (Arrakhiz et al., 2013). In another study of Arrakhiz et
al. fiber–matrix adhesion was assured by both a styrene–(ethylene–butene)–styrene triblock copolymer grafted
with maleic anhydride (SEBS-g-MA) and a linear block copolymer based on styrene and butadiene
compatibilizer. Results show a clear improvement in mechanical properties from the use of both alkali treated
pine cone and pine cone compatibilized with maleic anhydride, with gains of 43% and 49%, respectively in
the Young’s modulus (Arrakhiz et al., 2012). In the study of Ramesh et al. sisal–jute–glass fiber reinforced
polyester composites were developed and their mechanical properties such as tensile strength, flexural strength
and impact strength were evaluated. The results indicated that the jute composite material shows maximum
tensile strength and can hold the strength up to 229.54 MPa. The maximum impact strength was obtained
for the sisal fiber composite and had the value of 18.67 joules (Ramesh et al., 2013). Zhang et al. investigated
the mechanical behaviors of unidirectional flax and glass fiber reinforced hybrid composites with the aim of
investigating the hybrid effects of the composites made with natural and synthetic fibers. The tensile
properties of the hybrid composites were improved with increase of the glass fiber content. They concluded
that the fracture toughness and interlaminar shear strength of the hybrid composites were even higher than
glass fiber reinforced composites because of the excellent hybrid performance of the hybrid interface (Zhang
et al., 2013). Another study of composites with fiber reinforcement was made by Sathishkumar et al. In this
study the tensile properties of snake grass fiber were studied and compared with other traditionally available
natural fibers. Isophthallic polyester resin was used to prepare the mixed chopped snake grass fiber reinforced
composite. The experimental results showed that the volume fraction increases the tensile, flexural strength
and modulus of the snake grass fiber reinforced composite (Sathishkumar et al. 2012). Rokbi et al. studied the
effect of chemical treatment on the flexure properties of natural fiber-reinforced polyester composite. They
used alfa fiber as a reinforcement extracted from the plant Stippa tenacissima from the Hodna Region
(Algeria). Alfa fibers were treated with NaOH at 1, 5 and 10% for a period of 0, 24, and 48 h at 28 °C. The
experimental results showed that the bending behaviors of composites made from alkali treated fibers were
better compared to the untreated fiber composite. For a fiber processing Alfa 10% NaOH for 24h, the
flexural strength and flexural modulus improved by 23 MPa to 57MPa and from 1.16 to 3.04 GPa. However,
the flexural properties of composites decreased after alkali treatment with 5% NaOH for 48 h (Rokbi et al.,
2011). Rout et al. also investigated the influence of fiber treatment on the performance of polyester
R

Engineering Approaches on Sustainability (Edited by: Dr. Zehra Semra Can, Dr. Barış Yılmaz, Dr. Seval Genç, Dr. Candeniz Seçkin )
137
composites. Hybrid composites containing glass fiber mat (7 wt.%), coir fiber mat (13 wt.%) and polyester
resin matrix were prepared. Hybrid composites containing surface modified coir fibers showed significant
improvement in flexural strength. Water absorption studies of coir/polyester and hybrid composites showed
significant reduction in water absorption because of the surface modifications of coir fibers (Rout et al.,
2001). Unlike the study of Rout et al., Gu had different results in a similar study. In the research of Gu
brown coir fibers were treated by NaOH solution with concentrations from 2% to 10% separately. Tensile
strength of the alkali-treated fibers was measured. A decreased trend of the fiber tensile strength was found
with increased NaOH density (Gu, 2009). In this study we aimed to produce polyester composite using pine
cone waste as filler. Pine cone is a renewable resource that has great potential for use in many areas. In winter
it is generally collected, dried to facilitate seed release, and burned in stoves. Cones are easily accessible
making them usable and preferable as reinforcement. Turkey has 54,000 ha of stone pine forests that produce
3,500 tons of pine cone annually (Ayrilmis et al., 2009). In terms of of sustainability, this value has significant
importance for evaluating pine cone waste in manufacturing composites that can be used in furniture and
some construction materials.
Material and Method
Materials
Polyester resin (Polipol 383-G, Poliya Composite Resins and Polymers Inc., density of 1.076±0.05 g/cm3)
was used as the polymer matrix in all experiments. While methyl ethyl ketone peroxide (MEKP,Butanox™ M-
60, AkzoNobel Products) was used as hardener for polyester resins Cobalt 2% solution was used as promoter.
Pine cone waste was used as reinforcement. The pine cones were dried in air conditions before mixing with
the polymer and they were also chemically treated to avoid weak coherence between the matrix and filler.
Composite Preparation
The polyester matrix was compounded with reinforcement fillings at different ratios by weight (Table 1). A
gas pycnometer Micromeritics the AccuPyc II 1340 model (respectively 4.1120±0.0029 g/cm3 -
1.4493±0.0010 g/cm3) was used to measure absolute volume and true density of pine cones. Both chemically
treated and untreated pine cones were first mixed with polyester resin in the indicated ratios. After
compounding was performed using speeds of 500, 1000 and 1500 rpm (Stuart scientific mechanical stirrer),
each for a cycle time of five minutes, the mixture was held under vacuum for 5 min. Then accelerator and
hardener were added and the final mixture was poured into a mold. Curing conditions for composites were
110 °C, for two hours in an oven (Binder,Germany) and for one day at ambient temperature. The mixture
preparation and casting processes are given in Figure 1.

Duygu Gökdai, Alev Akpınar Borazan (Production of Polyester Composite Material Using Pine Cone Powder as Reinforcement)
138
Table 1. Composition of polyester composites
Sample Code P*** [wt%] Polyester[wt%]** PC1 6 94 PC2 9 91 PC3 12 88 PC1ct* 6 94 PC2ct* 9 91 PC3ct* 12 88
* chemically treated composite samples
** [wt%]: Weight Percent
***P: pine cone powder
Figure 1. Composite production flowchart

Engineering Approaches on Sustainability (Edited by: Dr. Zehra Semra Can, Dr. Barış Yılmaz, Dr. Seval Genç, Dr. Candeniz Seçkin )
139
Characterizations
Mechanical Analysis
The mechanical properties of composites were investigated by three point bending tests that were applied at a
bending speed of 2 mm/min in a Shimadzu AG-IC Test Machine. The izod impact test was conducted with
the DVT CD device, Devotrans Quality Control Test Instruments Ltd., Turkey. Durometer Hardness was
used to determine the relative hardness of composite samples. The flexural moduli of the composites were
calculated. The cast sizes used in the experimental studies were 10mm x 4 mm x 100 mm. Mechanical
properties were calculated according to the following equations by calculating the mean of the three samples.
σ = (3LP)/(2bd²) (1)
Ef = (L3m)/ (4bd3) (2)
Physical Analysis
Each sample was divided into two pieces after the bending test. These separated samples were dried in an oven
at 110oC until they reached a constant weight. Their dry weights were measured at room temperature. They
were placed in boiling water to determine the water absorption of composite materials. After boiling for two
hours composites were held at room temperature for 24 hours. The suspended weights of the samples were
measured in water in a mechanism prepared using the Archimedes density determination kit (WA). The
samples were taken out of the water and measured by a balance. The weights of the water-absorbed samples
(WD) in the air were recorded. By using the following equations water absorption, bulk density and
percentage open porosity values were calculated.
A, % = [(WD -WK ) / WK] * 100 (3)
B = [WK /(WD -WA)]* ρwater (4)
P, % = [(WD-WK)/(WD-WA)]*100 (5)
A : Water Absorption,
B : Bulk Density,
P : Open Porosity
σ : Flexural strength (N/mm2), Ef : Flexural modulus (MPa), L : the support span (mm), P : the maximum load (N), b : the width of the composite sample (mm), d : the thickness of composite sample (mm), m : the slope of the initial straight line portion of the load displacement curve.

Duygu Gökdai, Alev Akpınar Borazan (Production of Polyester Composite Material Using Pine Cone Powder as Reinforcement)
140
Results and Discussion
The experimental results and tests showed that (Figure 2 and Figure 3) hardness value of composite materials
decreased for the untreated samples by increasing the pine cone ratio. For chemically treated samples hardness
increased with the filler ratio. Increasing the ratio of pine cone filler led to an increase in flexural strength
values and a decrease of the elastic modulus. Chemical treatment applied to pine cones reduced the increasing
ratio of flexural strength and also the decreasing ratio of elastic modulus. Increasing amounts of cones reduced
the impact strength as supported by an increase in the amount of open porosity. This could be due to the
fibrous structure of the pine cone, which is clearly visible in the SEM images. Fibrous structure of pine cone
led to the connection between the composite layers that were seen to have increased the composite’s strength
(Baştürk et al., 2015). High amounts of pine cone increased both the porosity of the composite and water
absorption (Table 2). This is because of the hydrophilic nature of pine cone in the composites. This can be
explained by the fact that pine cone consists of lignin and cellulose and the cellulose has a hydrophilic
structure that includes hydroxyl groups. This hydroxyl group easily reacts with the hydrogen bond of water
molecules leading to high moisture in the composite (Dan-mallam et al., 2015; Dhakal et al., 2007).
Table 2. Physical and mechanical properties of composite samples
Sample code
Bulk Density (g/cm3)
Open Porosity
(%)
Water Absorption
(%)
Izod Impact (J/mm2)
ShoreD Flexural Strength (N/mm2)
Elastic Modulus
(GPa) PC1 1.19 1.86 1.38 5.27 88.00 59.46 5.34 PC2 1.19 1.92 1.56 5.12 87.00 66.328 5.18 PC3 1.19 1.94 1.64 5.02 86.00 71.68 4.66 PC1ct 1.18 2.06 1.75 5.14 85.00 53.59 5.72 PC2 ct 1.17 2.25 1.90 4.96 85.67 56.48 5.62 PC3 ct 1.16 2.44 2.25 4.64 86.67 64.65 5.08
Figure 2. Izod impact and hardness results of the composite samples

Engineering Approaches on Sustainability (Edited by: Dr. Zehra Semra Can, Dr. Barış Yılmaz, Dr. Seval Genç, Dr. Candeniz Seçkin )
141
Figure 3. Bending properties of composite samples
In order to determine the properties of reinforcement-filling materials’ and the polyester matrix interface in
the manufactured composite samples a Scanning Electron Microscope (SEM., Zeiss Supra 40VP, Germany)
was used to view the images. SEM images of untreated pine cone and chemically treated pine cone reinforced
composites taken from a cracked surface are given in Figure 4.
Figure 4. SEM images of raw material and composites
In Figure 4 abbreviations represent respectively P: untreated pine cone, PCt: chemically treated pine cone,
PC3: untreated pine cone composite sample, PC3ct: chemically treated pine cone composite sample as
indicated in Table 1. According to SEM images of both the chemically treated composite and the raw
material it can clearly be said that treatment provided a good combination of matrix and fillers. This is
because in the PC3ct image the pore size increased and stratification is more than the PC3 composite. It can
also be seen that in PC3 the surface of the composite is covered with a layer of substances, which may contain
some pectin, lignin and other impurities. The surface is not smooth, but covered with nodes and irregular
stripes. After the chemical treatment of the PC3ct composite most of the lignin and pectin are removed
causing a rougher surface.

Duygu Gökdai, Alev Akpınar Borazan (Production of Polyester Composite Material Using Pine Cone Powder as Reinforcement)
142
Conclusion
Chemical treatment that was applied to increase the ratios of pine cones reduced the flexural strength but
increased the elastic modulus. Increasing amounts of cones reduced the impact strength as supported by an
increased amount of open porosity. It can be concluded that chemical treatment would increase the physical
properties of composites while decreasing the mechanical properties.
References
Arrakhiz, F.Z., Achaby, M. El., Benmoussa, K., Bouhfid, R., Essassi, E.M. & Qaiss, A. (2012). Evaluation of mechanical and thermal properties of Pine cone fibers reinforced compatibilized polypropylene, Materials and Design (40), 528-535.
Arrakhiz, F.Z., Benmoussa, K., Bouhfid, R. & Qaiss, A. (2013). Pine cone fiber/clay hybrid composite: Mechanical and thermal properties, Materials and Design (50), 376-381.
Ayrilmis, N., Buyuksari, U., Avci, E. & Koc, E.(2009) Utilization of pine (Pinus pinea L.) cone in manufacture of wood based composite. Forest Ecology Management, (1), 65-70.
Baştürk, S.B., Kanbur, K., Polatoğlu, İ. & Yürekli, Y. (2015). Mechanical Properties of Acorn and Pine Cone Filled Polymer Composites, American Scientific Research Journal for Engineering, Technology, and Sciences, 14 (2), 144-153.
Dan-mallam, Y., Hong, T.W. & Majid, M.S.A., (2015). Mechanical Characterization and Water Absorption Behaviour of Interwoven Kenaf/PET Fibre Reinforced Epoxy Hybrid Composite, International Journal of Polymer Science Vol. 2015, Article ID 371958, http://dx.doi.org/10.1155/2015/371958
Dhakal, H.N., Zhang, Z.Y. & Richardson, M.O.W. (2007). Effect of water absorption on the mechanical properties of hemp fibre reinforced unsaturated polyester composites, Composites Science and Technology 67(7-8), 1674–1683.
Gopinath, A., Kumar, S. & Elayaperumal, A. (2014). Experimental Investigations on Mechanical Properties of Jute Fiber Reinforced Composites with Polyester and Epoxy Resin Matrices, 12th Global Congress on Manufacturing and Management, Procedia Engineering (97), 2052-2063.
Gu, H. (2009). Tensile behaviours of the coir fibre and related composites after NaOH treatment, Materials and Design (30), 3931-3934.
Prasad, A.V. R. & Rao, M.K. (2011). Mechanical properties of natural fibre reinforced polyester composites: Jowar, sisal and bamboo, Materials and Design (32), 4658-4663.
Ramesh, M., Palanikumar, K. & Reddy, K.H. (2013). Mechanical property evaluation of sisal–jute–glass fiber reinforced polyester composites, Composites: Part B (48), 1-9.
Rokbi, M., Osmani, H., Imad, A. & Benseddiq, N. (2011). Effect of Chemical treatment on Flexure Properties of Natural Fiber-reinforced Polyester Composite, Procedia Engineering (10), 2092-2097.
Rout, J., Misra, M., Tripathy, S.S., Nayak, S.K. & Mohanty, A.K. (2001). The influence of fibre treatment on the performance of coir-polyester composites, Composites Science and Technology (61), 1303-1310.
Sathishkumar, T.P., Navaneethakrishnan, P. & Shankar, S. (2012). Tensile and flexural properties of snake grass natural fiber reinforced isophthallic polyester composites, Composites Science and Technology (72), 1183-1190.
Wei, W. & Gu, H. (2009). Characterisation and utilization of natural coconut fibres composites, Materials and Design (30), 2741-2744.
Zhan, M., Wool, R.P. & Xiao, J.Q. (2011). Electrical properties of chicken feather fiber reinforced epoxy composites, Composites: Part A 42 (3), 229-233.
Zhang, Y., Li, Y., Ma, H. & Yu, T. (2013). Tensile and interfacial properties of unidirectional flax/glass fiber reinforced hybrid composites, Composites Science and Technology (88), 9172-177.

Engineering Approaches on Sustainability (Edited by: Dr. Zehra Semra Can, Dr. Barış Yılmaz, Dr. Seval Genç, Dr. Candeniz Seçkin )
143
11 Management of Domestic Wastewater through Segregated Streams as an Aid towards Sustainability of Natural Resources and Sustainable Agriculture/Food Production
Bilsen Beler-Baykal Abstract
Conventional domestic wastewater management is a linear open cycle process, where domestic wastewater generated from different household functions is mixed and collected in one single pipe, treated to remove constituents regularly regarded as “waste”, and discharged into receiving media, “wasting” the valuable material and energy hidden in domestic wastewater. Segregation of domestic wastewater into various streams in the household lends a sustainable alternative for revaluating valuable components. Stream segregation starts with separate collection of streams which are different in terms of their character as well as their pollution potential at their point of generation, to be processed further for producing products to serve beneficial end-uses. Currently, segregation is practiced either as two-component separation as black (wastewater from toilet–bowls) and grey (all portions of domestic wastewater with the exclusion of toilet wastewater); or three-component/ECOSAN segregation as grey, yellow (separately collected urine) and brown (separately collected feces). Upon segregation and proper processing, nutrient-rich yellow water may be used as fertilizer, aiding sustainable agriculture, food production and landscape/green areas; brown/black water for energy and/or compost production; reclaimed grey water, corresponding to75% by volume, as an alternative source of water to be returned to almost any point in the water cycle, helping sustainability of natural resources. Stream segregation is an approach which promotes sustainability both through valorizing wastewater and through environmental protection.
Bilsen Beler-Baykal (Management of Domestic Wastewater through Segregated Streams as an Aid towards Sustainability of Natural Resources and Sustainable Agriculture/Food Production)
144
Keywords: Stream segregation, Domestic wastewater, Sustainability through revaluating wastes, Water
reclaimed from grey water, Fertilizers from human urine/yellow water
Introduction
omestic wastewater management, in the form it is practiced at this time, is a linear open cycle
process, where domestic wastewater generated as a result of different household functions is mixed
and collected in one single pipe. The main idea is to treat wastewater following single line
collection to free it from constituents which are regularly regarded as “waste”, turn them into gas, liquid and
solid end products, and discharge the treated effluent into a receiving medium. Under those circumstances,
organic carbon is converted mainly into carbon dioxide, nitrogen into nitrogen gas, as gaseous products and
released into the atmosphere, while the majority of phosphorus resides in the sludge which needs to be treated
further. Although this approach has been used for decades as the main option to abate water pollution and
safeguard the environment, it “wastes” the valuable material and energy hidden in domestic wastewater which
could otherwise be valorized to help maintain environmental sustainability and upraise human welfare.
Alternative ways of wastewater management have been introduced in the recent years which make use of the
conventionally “wasted” valuable components of domestic wastewater and use it as a source or a raw material
to produce new products to benefit from. One of those alternatives, namely, stream segregation / ECOSAN
(Ecological Sanitation), is based upon separation of domestic wastewater into various streams at their
locations of origin to be processed further for producing valuable material (Otterpohl et. al.,2003, Beler
Baykal, 2015), i.e. reclaimed water and fertilizers. Production of compost and energy are yet two other
options when this practice is adopted (de Graaff, et. al, 2011, Tervahauta et. al, 2014).
This paper aims to highlight stream segregation and ECOSAN as a recent approach to revaluate a waste,
namely, domestic wastewater, to create value out of it, while controlling water pollution at the same time,
specifically focusing upon producing reclaimed water which can be utilized almost at any point in the water
cycle and fertilizers which can serve various purposes like agriculture, landscape and urban greenery zones on
one hand, while taking care of water pollution on the other. Such an approach will not only benefit
sustainability of water resources but also will contribute to agricultural production, food security and
promotion of greenery and landscape areas. A further aim is to open this option to the discussion of the
multidisciplinary experts/community, to hear comments of experts representing interrelated disciplines upon
the subject matter, and to search for collaboration around this perspective from a wide spectrum and
diversified points of view.
D
Engineering Approaches on Sustainability (Edited by: Dr. Zehra Semra Can, Dr. Barış Yılmaz, Dr. Seval Genç, Dr. Candeniz Seçkin )
145
Segregated Streams of Domestic Wastewater
Stream segregation/ECOSAN claims that domestic wastewater is not a waste to be discarded but a source to
be revaluated, and is based upon separating various streams at their point of origin and avoiding mixing of
those segregated streams throughout each step including storage and processing. In the process of segregation,
streams which are different in terms of their character as well as their pollution potential are separated at the
first point they are generated, stored separately without mixing, and processed to produce products for
beneficial end-uses. As such, it is an option which starts the management process at the household level and is
closely related to control at the source. Furthermore, it enables revaluation of valuable components in
domestic wastewater, which is conventionally perceived as a waste.
Currently separation is practiced either as two component (black/grey) or three component/ECOSAN
(yellow/brown/grey) segregation. In case of two component segregation, domestic wastewater is separated as
black water and grey water, where grey water refers to all portions of domestic wastewater with the exclusion
of toilet wastewater and black water to that portion coming from the toilet-bowl. With three component
segregation, also and more commonly known as ECOSAN (ECOlogical SANitation) separation, the streams
are yellow water which is separately collected human urine and brown water which is separately collected
feces, in addition to grey water as described above.
Table 1 summarizes some characteristics and reuse of each stream. The greatest portion of domestic
wastewater appears as grey water with 75% which contains organic matter and pathogens as significant
pollutants. Yellow water is a nutrient rich stream containing majority of nitrogen (N), phosphorus (P) and
potassium (K) in conventional wastewater, however it constitutes only 1% of the domestic wastewater
volume. Brown water is just 0.1% by volume and is rich in organics and pathogens as well as containing
appreciable amounts of phosphorus. Black water is that fraction of domestic wastewater which contains the
entire toilet wastewater, that is urine, feces and flush water, making up 25% by volume, and is rich in organic
matter, nitrogen, phosphorus, potassium and pathogens.
One very important issue to note about segregated streams is that all streams are renewable, and even if their
quantities may change from one community to the other, they will be produced forever as long as mankind
survives. This makes each segregated stream a dependable and consistent source of raw materials for their
respective final products.
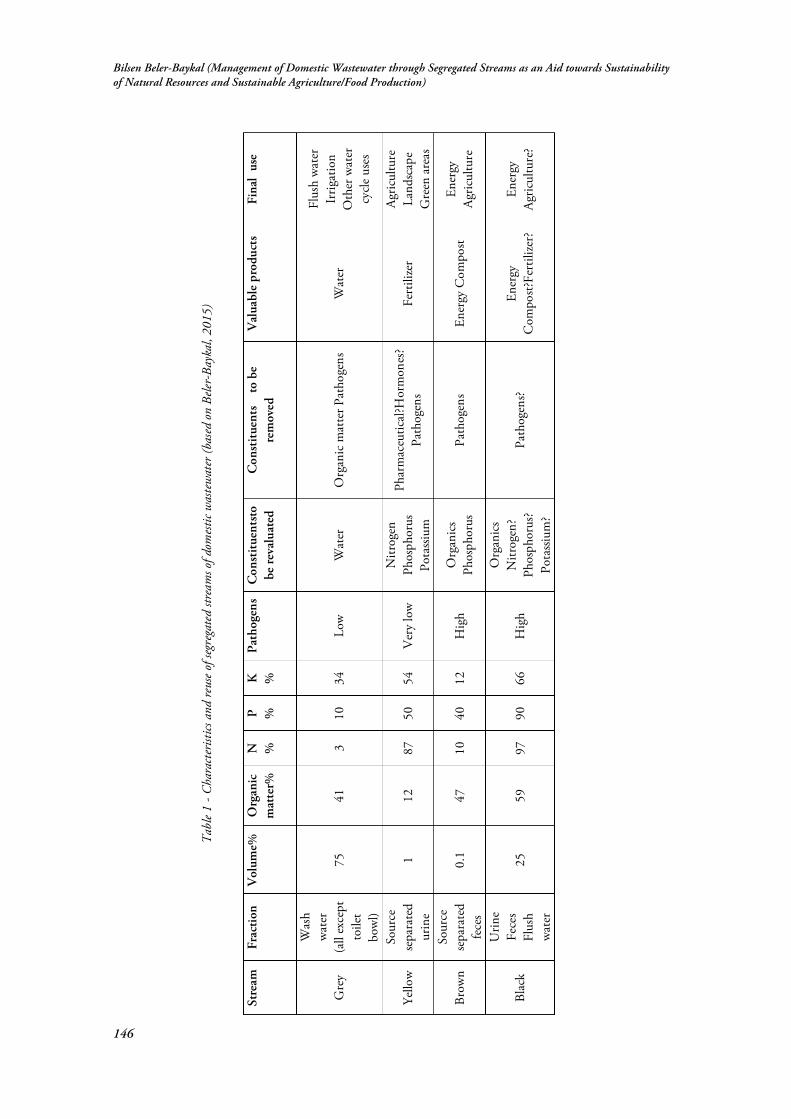
Bilsen Beler-Baykal (Management of Domestic Wastewater through Segregated Streams as an Aid towards Sustainability of Natural Resources and Sustainable Agriculture/Food Production)
146
Tab
le 1
- Cha
ract
erist
ics a
nd re
use o
f seg
rega
ted
strea
ms o
f dom
estic
was
tew
ater
(bas
ed o
n Be
ler-B
ayka
l, 20
15)
St
ream
Fr
acti
on
Vol
ume%
O
rgan
ic
mat
ter%
N
%
P %
K
%
Pa
thog
ens
Con
stit
uent
sto
be re
valu
ated
C
onst
itue
nts
to
be
rem
oved
V
alua
ble
prod
ucts
Fi
nal
use
Gre
y
Was
h w
ater
(all
exce
pt
toile
t bo
wl)
75
41
3 10
34
Lo
w
Wat
er
Org
anic
mat
ter P
atho
gens
W
ater
Flus
h w
ater
Ir
rigat
ion
O
ther
wat
er
cycle
use
s
Yello
w
Sour
ce
sepa
rate
d ur
ine
1 12
87
50
54
V
ery
low
N
itrog
en
Phos
phor
us
Pota
ssium
Phar
mac
eutic
al?H
orm
ones
? Pa
thog
ens
Fert
ilize
r Ag
ricul
ture
La
ndsc
ape
Gre
en a
reas
Brow
n So
urce
se
para
ted
fece
s 0.
1 47
10
40
12
H
igh
Org
anic
s Ph
osph
orus
Pa
thog
ens
Ener
gy C
ompo
st En
ergy
Ag
ricul
ture
Blac
k
Urin
e
Fece
s
Flus
h w
ater
25
59
97
90
66
Hig
h
Org
anic
s N
itrog
en?
Phos
phor
us?
Pota
ssium
?
Path
ogen
s?
Ener
gy
Com
post?
Fert
ilize
r?
Ener
gy
Agric
ultu
re?

Engineering Approaches on Sustainability (Edited by: Dr. Zehra Semra Can, Dr. Barış Yılmaz, Dr. Seval Genç, Dr. Candeniz Seçkin )
147
A Discussion of Stream Segregation in Households as a Sustainable Approach for Domestic Wastewater
Management
Stream segregation is a recent domestic wastewater management concept and as it takes care of water
pollution, it also enables the use of waste streams as raw material for useful products and aids sustainability of
water resources and food production/agriculture through revaluation of “waste” material. One very
important issue to realize is the fact that stream segregation is a concurrent route for valorizing wastewater and
for safeguarding the environment through controlling water pollution, which actually constitutes the essential
and ultimate aim of wastewater management. As such, stream segregation serves two main issues of
sustainability. That is, both environment and natural resources are protected, and wastes are handled in such a
way as to make them beneficial sources.
With stream segregation, the greatest portion of domestic wastewater ends up as grey water with 75%. Due to
its low pollution potential, with only organic matter and pathogens to take care of and very low nutrient
content, this is a much easier stream to reclaim as compared to conventional domestic wastewater which is
expected to have much higher levels of organics and pathogens in addition to problematic nutrients, i.e.
nitrogen and phosphorus. Reclaimed grey water may be returned to almost any part of the water cycle for
reuse after proper treatment including uses like flush water, irrigation, car washes, firefighting, etc. Treatment
options include extensive systems like constructed wetlands which may be preferred more in rural settings and
compact treatment schemes like membrane bioreactors and rotating biological contactors which suit urban
settings perfectly (Nolde, 1999 & 2005, Beler Baykal, 2015) One very useful practice is reuse of reclaimed
grey water as flush water. Constituting about one fourth of the daily domestic water use, flush water is used
for sweeping human excreta, a stream which carries the highly pathogenic agents, down the sewer systems,
using water of potable quality. Obviously, this is a “waste” of high quality water which acts against
sustainability of water resources, and replacement of potable water with reclaimed grey water for flushes will
enable the use of three days’ domestic water supply for four days. As an example, the quantity of water used
for toilet flushing in the Turkish megacity Istanbul is estimated to be more or less equivalent to the water
supply transferred from Buyuk Melen which is about 200 km away (Beler Baykal and Giresunlu, 2013).
There are appreciable examples of reclaimed grey water use for toilet flushing like those described by Nolde
(1999) and Giresunlu and Beler Baykal (2016). As exemplified here for flush water, the use of grey water as
an alternative source of water will clearly help the sustainability of water resources to a considerable extent.
Yellow water constitutes only1% of the domestic wastewater volume but contains up to 87% of nitrogen and
over 50% of phosphorus, which are two of the primary water pollutants which ironically make up two of the
three major constituents of fertilizers. The entire potential of nutrients (nitrogen, phosphorus and potassium)
in human excreta on a global scale is equivalent to 30-40% of the global fertilizer use. Moreover, nutrients
from the excreta of one person on an annual basis are enough to produce about 200 kg of cereals per year, or
roughly a large loaf of bread per day. The greatest portion of nutrients in domestic wastewater come from
urine which can be used both via direct and indirect routes. While urine may be applied directly upon plants
after storage for hygienic safety (Hoglund, 2001) and probably dilution, it has to be processed before

Bilsen Beler-Baykal (Management of Domestic Wastewater through Segregated Streams as an Aid towards Sustainability of Natural Resources and Sustainable Agriculture/Food Production)
148
application when indirect routes are selected. Ion exchange/adsorption, struvite precipitation and
stripping/absorption are the most common methods employed for processing of urine for production of
fertilizers. Different types of fertilizers may be produced through those indirect routes using source separated
human urine as raw material including phosphorus rich struvite, nitrogen rich ammonium sulfate and
nutrient enriched zeolites which is rich both in nitrogen and in phosphorus (Basakcilardan-Kabakci, et. al,
2007; Etter, et. al., 2011; Beler Baykal et. al., 2004, 2009, 2011; Beler-Baykal and Dogan, 2016, Kocaturk
and Beler Baykal, 2012). Revaluation of this stream is clearly a very significant potential to combat hunger,
and yellow water, only 1% of domestic wastewater, is a renewable source which will contribute to sustainable
agricultural products as well as promotion of green areas.
Grey water is a renewable source of water as although its quantity varies from community to community, its
production is inevitable as long as mankind survives on this globe. As a matter of fact, all other segregated
streams, i.e yellow water & urine, brown water & feces, or black water & both urine and feces, are also
renewable and will be generated obligately as a result of indispensible metabolic activities of mankind.
Stream segregation is actually a practice which demands a holistic approach and a thorough planning ahead of
time, and necessitates collaboration of different disciplines including various branches of engineering like
environmental, civil, mechanical, agricultural, chemical, in addition to planning, social sciences, management
and economics among others. The first tier of sustainability is environmental. From the technical stand point,
stream segregation necessitates a new type of infrastructure which should preferentially be planned a head of
time. Depending upon the type of segregation adopted, toilets, flushes, piping, storage tanks, pumping and
finally provisions for processing each stream for the production of the final end-product will have to be
provided. This short list of tasks is to be undertaken by the engineering group. Planning of the path way of
the “raw material”, i.e. the “waste”water, is significant, additionally, planning regarding the final destination
and final consumers of the end product ahead of time is also as crucial. Economic sustainability is the second
tier of sustainability and economists and management experts will be the major actors here, not only for funds
and marketing but also for financing the new approach through administrative incentives and economic
instruments. Last but not the least, new alternatives to be employed by mankind would necessitate the
acceptance by final consumers. Social sciences and education will play a major role within this context, taking
care of social sustainability.
Concluding Remarks
Stream segregation is a plausible option for domestic wastewater management which aids sustainability of the
world resources with additional benefits as compared to the conventional one. Upon segregation and proper
processing, nutrient-rich yellow water may be used as fertilizer, aiding sustainable agriculture/food
production; brown/black water for energy and/or compost production, constituting 75% by volume grey
water may be reclaimed as an alternative source of water which may be returned to almost any point in the
water cycle to help sustainability of natural resources. Stream segregation is an approach which promotes
sustainability both through valorizing wastewater for various end-uses and through environmental protection.

Engineering Approaches on Sustainability (Edited by: Dr. Zehra Semra Can, Dr. Barış Yılmaz, Dr. Seval Genç, Dr. Candeniz Seçkin )
149
Despite its value has been underestimated to date, the benefits it will provide in relation to environmental
sustainability and its support for sustainability of natural resources is envisaged to make segregated
streams/ECOSAN an acknowledged, and possibly a popular, route for domestic wastewater management in
the future.
References
Basakcilardan-Kabakci S., Ipekoglu N.A. & Talinli, I. (2007) . Recovery of Ammonia from Human Urine by Stripping and Absorption. Environmental Engineering Science 24(5), 615-624.
Beler-Baykal B. (2015). Stream Segregation in Household Use: A Review of Grey Water as an Alternative Source of Water and Yellow Water as an Alternative Source of Fertilizers. Water Quality, Exposure and Health 7(1), 27-37.
Beler Baykal, B., Allar, A.D. & Bayram, S.( 2011). Nitrogen recovery from source-separated human urine using clinoptilolite and preliminary results of its use as fertilizer. Water Sci. Technol. 63(4), 811-817.
Beler Baykal, B., Bayram, S., Akkaymak, E. & Cinar, S. (2004). Removal of ammonium from human urine through ion exchange with clinoptilolite and its recovery for further reuse. Water Sci. Technol. 50(6), 149-156.
Beler-Baykal B & Dogan G. (2016). Two Stage Processing Options for Enhancing Total Nutrient Recovery from Source Separated Human Urine to Be Used as Fertilizer. Water Science & Technology (under review)
Beler Baykal, B. & Giresunlu, E. (2013). Grey Water as an Alternative Source of (Flush) Water in a Mega City of a Water Stressed Country. IWA Conference on Alternative Water Resources Management and Integrated Technologies for Sustainable Urban Water System - Qingdao, China, June 25-28, 2013.
Beler Baykal, B., Kocaturk, N.P., Allar, A.D. & Sari, B. (2009). The effect of initial loading on the removal of ammonium and potassium from source-separated human urine via clinoptilolite. Water Sci. Technol. 60(10), 2515-2520.
de Graaff, MS, Temmink, H, Zeeman, G.& Buisman, CJN (2011). Energy and phosphorus recovery from black water. Water Science and Technology, 63 (11 ), 2759-2765.
Etter , B.., Tilley ,E., R. Rhadka, R., & Udert, K. M. (2011) Low-cost struvite production using source-separated urine in Nepal. Water Research 45(2), 852-862.
Giresunlu E., & Beler Baykal, B. (2016). A case study of the conversion of grey water to a flush water source in a Turkish student residence hall. Water Science and Technology Water Supply (in press).
Kocaturk, N.P. & Beler Baykal, B. (2012). Recovery of plant nutrients from dilute solutions of human urineand preliminary investigations of pot trials. Clean - Soil, Air, Water 40(5), 538-544.
Höglund C. ( 2001). Evaluation of microbial health risks associated with the reuse of source separated human urine. PhD thesis, Department of Biotechnology, Royal Institute of Technology, Stockholm, Sweden.
Nolde, E. (1999). Greywater reuse systems for toilet flushing in multi-storey buildings-over ten years experiences in Berlin. Urban Water, 1(4), 275-284.
Nolde, E.( 2005). Greywater recycling systems in Germany – results, experiences and guidelines. Water Science and Technology, 51(10), 203-210.
Otterpohl R., Braun U. & Oldenburg, M. (2003). Innovative Technologies for Decentralized Water Wastewater and Biowaste Management in Urban and Peri-urban Areas. Water Science & Technology 48(11), 23–31.
Tervahauta, T., Bryant, I. M., Hernández Leal , L., Buisman, C.J.N., Zeeman, G. (2014) Improved Energy Recovery by Anaerobic Grey Water Sludge Treatment with Black Water. Water 6(8), 2436-2448.


Engineering Approaches on Sustainability (Edited by: Dr. Zehra Semra Can, Dr. Barış Yılmaz, Dr. Seval Genç, Dr. Candeniz Seçkin )
151
12 Environmental and Economic Analysis of a Rainwater Harvesting System at Marmara University
Recep Önder Sürmeli Abstract
Marmara University is located in Istanbul/Turkey; being part of the most urbanized city makes water consumption and management an important issue in the campus areas. The main campus of the Marmara University, Göztepe Campus, has 38 buildings that equal 20% (~28000 m2) of the total university area (~140000 m2), which give a chance to use rainwater harvesting (RWH) as an efficient and sustainable pathway for water management. According to the average precipitation of Istanbul (~813 mm/year); 85% collection and 70% storage efficiency will provide ~0.484 m3/m2 potential amount of RW that will be collected by the roofs during a year, which equals to the ~60% of the precipitation. The potential amount of harvestable RW will be 13610 m3/year, which make RWH in the campus area an efficient and sustainable supplementary water source that give a chance for potable water saving and also economic and environmental benefits at the end. Keywords: Rainwater harvesting, Water scarcity, Water footprint, Renewable water resources, Sustainable city
Introduction
ater is a scarce and valuable resource for most of the natural systems and human life. Conservation of it becomes very important due to the increasing demand with the population explosion, changing life standards, industrial activities, continuous economic growth and mostly
because of the climate change (Rostad, Foti, & Montalto, 2016; Zhang et al., 2009). It directly affects the eligibility of life in many ways (Coombes et al., 2016). Therefore, protecting deficient and diminishing fresh water sources is significantly crucial under these stress-causing situations.
Rapid and unplanned urbanization causes problems due to high amount of water consumption; new treatment facilities and infrastructures have to be constructed for water supply, wastewater collection, stormwater drainage, and maintenance of them has to be done more than before because of overuse (Steffen et al., 2013). Consequently, in cities, as a natural resource water must be used rationally and reuse of it has to be mandatory now and for future generations. Rainwater harvesting (RWH) is a decentralized water
W

Recep Önder Sürmeli (Environmental and Economic Analysis of a Rainwater Harvesting System at Marmara University)
152
management process (Zhang et al., 2009) that gives opportunity to solve one part of this huge problem and offers many advantages than the municipal water distribution system (Pacheco et al., 2017).
RWH is a sustainable, effective, economic, secure and environmental friendly method, which becomes widespread in rural and mostly in urban areas. Harvested water can be used for toilet flushing, air conditioning, landscape and crop irrigation, cleaning purposes and can be used as a drinking water supply after acceptable treatment (Domènech & Saurí, 2011; Harb, 2015; Reckinger et al., 2015; Rostad, Foti, & Montalto, 2016 ; Zavala, Vega & Miranda, 2016). RW can be collected from roofs of all kind of structure, land surfaces directly and rock catchments, and stored with natural and/or artificial puddles, constructed reservoirs and commercial storage tanks (Fletcher et al., 2008; Helmreich & Horn, 2009). There are three models for RWH: in situ RWH, external RWH and domestic RWH (Helmreich & Horn, 2009).
The roofs of the buildings can be used like a drainage basin to collect rainwater (RW). This approach is an essential part of the domestic RWH model. The key point on that remedy is to store and conserve the precious and expensive fresh water in a sustainable way. RWH also gives a chance to decrease water and carbon footprint for the urbanized areas (Zuberi et al., 2013). In addition, every cubic meter of water gained by this method decreases the discharged water to the sewage system with eliminating the stormwater entrance and reduces the pumping expenses for the water supply.
For efficient RWH, annual rainfall is the most important figure; magnitude and intensity of the precipitation are also key points to set-up a convenient RWH system. Those systems need a suitable roof or roof clusters for catchment, tank systems for storage, an effective distribution structure, enough annual precipitation for economic compensations and may include a treatment unit for the purpose of usage (Özölçer, 2016; Vieira et al., 2013; Zavala et al., 2016). The treatment process changes due to the aim of the RW usage and may include sedimentation, filtration, membrane modules, biological processes, infiltration and disinfection units (Fletcher et al., 2008).
In addition, RWH systems have many advantages: controlling of urban flooding, erosion and pollution problems, create a better microclimate, decrease the load on the water collection and the distribution cycle, renewing the groundwater sources and reduce the cost of water treatment and pumping (Harb, 2015; Vialle et al., 2015; Zavala, Vega & Miranda, 2016; Zhang et al., 2009).
The primary objective of this study is to evaluate the potential of the RWH system at the Göztepe campus of the Marmara University. This is the preliminary step to investigate, essentially the environmental gains and probable future economical profits of the RWH system. Thus, RWH reduces the water consumption, decreases energy demand and reduces the wastewater production. Göztepe Campus was chosen for this study because of being in the middle of a densely populated area and the campus is consuming significant amount of water. The esults obtained will turn on a pathway for to make a decision on RWH in the campus area and it will open a window for the other campuses of the Marmara University.
Methodology
The world population has an increasing trend, and it already passed 7 billion habitants. In parallel with that, Turkey and its most crowded city, Istanbul, has a continuous growth rate on the population (Figure 1). From 2007 to 2015, percentage of the population growth was 16.57% and 11.55% for Istanbul and Turkey,

Engineering Approaches on Sustainability (Edited by: Dr. Zehra Semra Can, Dr. Barış Yılmaz, Dr. Seval Genç, Dr. Candeniz Seçkin )
153
respectively. Göztepe Campus area (40°59'16.0"N - 29°03'10.0"E) is located in Kadıköy (Figure 2), which is one of the highly populated district of Istanbul, and has a similar trend on increasing population rates.
Istanbul has many different raw water resources including lakes, dams, and rivers in its borders and from other cities to get enough water for the megapol. Nowadays, potable water supplied to the city is changing 2400000-3000000 m3/day. That huge amount of water is the main challenge of that fresh water problem. Collecting, storing, treating and distribution of the treated water to the city is a very costly, tough and long process to manage in a highly urbanized enormous territory.
In Istanbul, the potable water produced and distributed to the city by Istanbul Water and Sewage Administration (ISKI). ISKI has many different levels of water prices for a various kinds of consumers; for universities the price of one cubic meter potable water is 7.19 TL (2.23$ or 1.97€); that makes sense about the importance of RWH.
Figure 1. Population change of Turkey and Istanbul (2007-2015)
Total harvested RW was calculated according to the equation shown below.
V = P * A * C (1)
where V is the harvested volume of the RW from the roofs; P is the annual precipitation amount; A is the surface area of the roof; and C is the runoff coefficient. C is dependent on the collection and the storage efficiency of the RW, which were assumed as 0.85 and 0.70 (Thomas & Martinson, 2007), respectively.
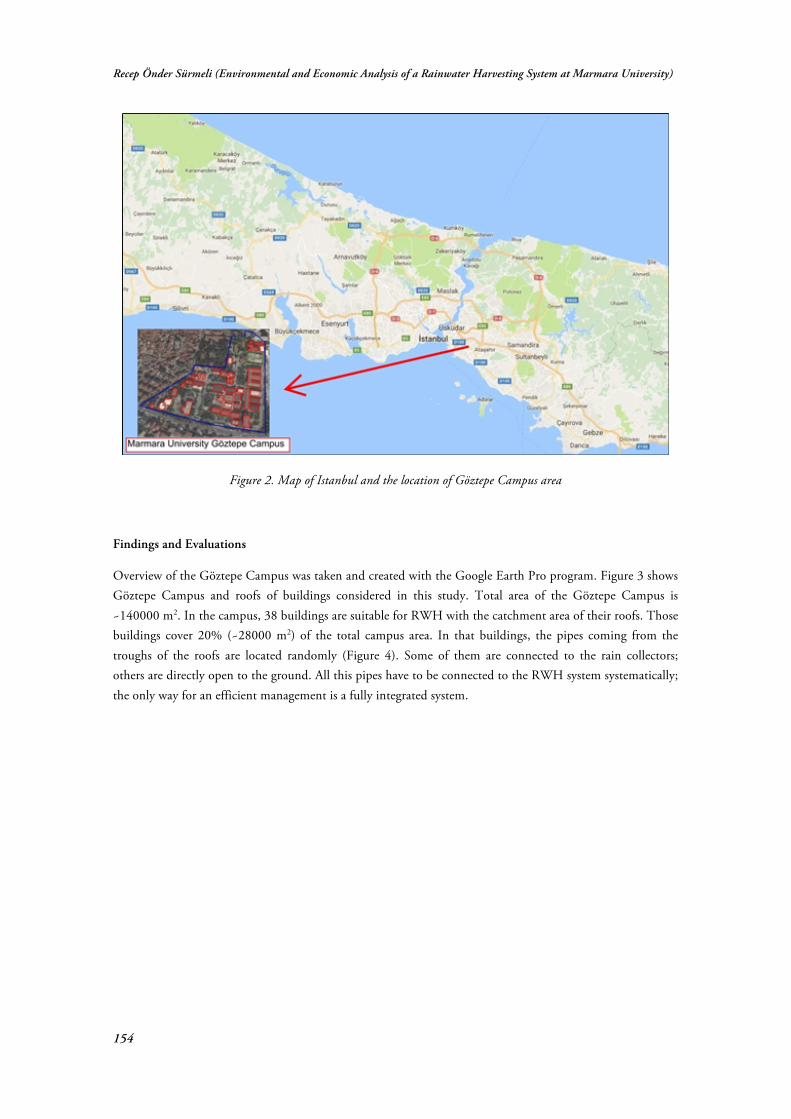
Recep Önder Sürmeli (Environmental and Economic Analysis of a Rainwater Harvesting System at Marmara University)
154
Figure 2. Map of Istanbul and the location of Göztepe Campus area
Findings and Evaluations
Overview of the Göztepe Campus was taken and created with the Google Earth Pro program. Figure 3 shows Göztepe Campus and roofs of buildings considered in this study. Total area of the Göztepe Campus is ~140000 m2. In the campus, 38 buildings are suitable for RWH with the catchment area of their roofs. Those buildings cover 20% (~28000 m2) of the total campus area. In that buildings, the pipes coming from the troughs of the roofs are located randomly (Figure 4). Some of them are connected to the rain collectors; others are directly open to the ground. All this pipes have to be connected to the RWH system systematically; the only way for an efficient management is a fully integrated system.

Engineering Approaches on Sustainability (Edited by: Dr. Zehra Semra Can, Dr. Barış Yılmaz, Dr. Seval Genç, Dr. Candeniz Seçkin )
155
Figure 3. Marmara University Göztepe Campus overview (blue line is the border of the campus, red lines are the border of the roofs and green ones are the new buildings areas)
According to annual precipitation data taken from Turkish State Meteorological Service, Istanbul has ~813 kg/m2/year precipitation (1950-2015) and Figure 5 presents monthly distribution of this amount. It is more than the Turkey’s average (574 kg/m2/year), which makes RWH more feasible for Istanbul than many other cities of Turkey. Besides that, Zavala et al (2016) studied RWH at a university campus in Mexico and found that, RWH is sustainable and efficient supplementary process for producing water. In that study, annual precipitation was 580 kg/m2/year; that is 28% lower than Istanbul, that makes Istanbul has a better potential. In addition, according to Zuberi et al. (2013) and Özölçer (2016), RWH in the university campuses is an effective method should be supported.

Recep Önder Sürmeli (Environmental and Economic Analysis of a Rainwater Harvesting System at Marmara University)
156
Figure 4. Pipes connected to the roofs catchments (on the left: connected to the discharge system and on the right: directly open to the ground)
In accordance with the assumptions and the Equation (1), the roofs will collect ~0.484 m3/m2 potential amount of RW during a year. That is ~60% of the precipitation, which is equal 13610 m3/year.
Figure 5. Monthly precipitation and number of rainy days of Istanbul

Engineering Approaches on Sustainability (Edited by: Dr. Zehra Semra Can, Dr. Barış Yılmaz, Dr. Seval Genç, Dr. Candeniz Seçkin )
157
Conclusion
The preliminary results show that rainwater harvesting is an effective and sustainable system to provide a supplementary water resource for the Göztepe Campus of Marmara University. There will be many environmental and economical gains. Possible harvestable rainwater will be ~0.484 m3/m2, which makes up totally 13610 m3/year, and this will decrease the water consumption cost of the university 97855 TL annually. This huge amount of water will be used after installing storage and distribution parts for irrigation and toilet flushing without any treatment. For other consumption options, a treatment module has to be applied to get an appropriate water quality. To establish how feasible is that system and to eliminate future bugs a pilot study should be started. A bunch of building will be chosen and a yearlong data collection period will give the best opinion for whole grid. Even if no action is taken after harvesting, all collected water from the roofs might be given to the soil for the aim of groundwater recharging.
References
Coombes, P.J., Smit, M., Byrne, J. & Walsh, C.J. (2016). Water resources, stormwater and waterway benefits of water conservation measures for Australian capital cities. In Proceedings of Conference: Stormwater2016, Stormwater Australia.
Domènech, L. & Saurí, D. (2011). A comparative appraisal of the use of rainwater harvesting in single and multi-family buildings of the Metropolitan Area of Barcelona (Spain): social experience, drinking water savings and economic costs. Journal of Cleaner Production, 19, 598–608.
Fletcher, T.D., Deletic, A., Mitchell, V.G. & Hatt, B.E. (2008). Reuse of Urban Runoff in Australia: A Review of Recent Advances and Remaining Challenges. Journal of Environmental Quality, 37(5), 116-127.
Harb, R. (2015). Assessing the Potential of Rainwater Harvesting System at the Middle East Technical University – Northern Cyprus Campus. (Published Master Thesis), METU-NCC.
Helmreich, B. & Horn, H. (2009). Opportunities in rainwater harvesting. Desalination, 248, 118–124. Özölçer, İ. H. (2016). Rainwater Harvesting Analysis for Bülent Ecevit University Central Campus. Karaelmas Fen ve Mühendislik Dergisi, 6(1),
22-34. Pacheco, P.R.C., Gómez, Y.D., Oliveira, I.Z. & Teixeira, L.C.G. (2017). A view of the legislative scenario for rainwater
harvesting in Brazil. Journal of Cleaner Production, 141, 290-294. Reckinger, S., Bocchino, J., Jackowitz, A. & Perry, J. (2014). Rainwater Harvesting for Campus Student Center: A
Sustainable, Community-Orientated Senior Design Project. International Journal for Service Learning in Engineering, 9(1), 117-137.
Rostad, N., Foti, R. & Montalto, F.A. (2016). Harvesting rooftop runoff to flush toilets: Drawing conclusions from four major U.S. cities. Resources, Conservation and Recycling, 108, 97–106.
Steffen, J., Jensen, M., Pomeroy, C.A. & Burian, S.J. (2013). Water Supply and Stormwater Management Benefits of Residential Rainwater Harvesting in U.S. Cities. Journal of The American Water Resources Association, 49(4), 810-824.
Thomas, T.H. & Martinson, D.B. (2007). Roofwater Harvesting a Handbook for Practitioners. Delft, the Netherlands: IRC International Water and Sanitation Centre.
Vialle, C., Busset, G., Tanfin, L., Montrejaud-Vignoles, M., Huau, M.-C. & Sablayrolles, C. (2015). Environmental analysis of a domestic rainwater harvesting system: A case study in France. Resources, Conservation and Recycling, 102, 178–184.
Vieira, A.S., Weeber, M. & Ghisi, E. (2013). Self-cleaning filtration: A novel concept for rainwater harvesting systems. Resources, Conservation and Recycling, 78, 67– 73.
Zavala, M.Á.L., Vega R.C. & Miranda, R.A.L. (2016). Potential of Rainwater Harvesting and Greywater Reuse for Water Consumption Reduction and Wastewater Minimization. Water, 8, 264.
Zhang, D., Gersberg, R.M., Wilhelm, C. & Voigt, M. (2009). Decentralized water management: rainwater harvesting and greywater reuse in an urban area of Beijing, China. Urban Water Journal, 6(5), 375-385.
Zuberi, M.J.S., Khan, M.A.A. & Akıntuğ, B. (2013). Rainwater Harvesting System for Dormitories of Metu-Northern Cyprus Campus, In Proceedings of Seventeenth International Water Technology Conference, IWTC17, Istanbul, TURKEY


Engineering Approaches on Sustainability (Edited by: Dr. Zehra Semra Can, Dr. Barış Yılmaz, Dr. Seval Genç, Dr. Candeniz Seçkin )
159
13 Environmentally Sustainable De-icer Management for an Airport
Sinem Aksit Sahinkaya Fatos Germirli Babuna Abstract
The objective of this study is to evaluate the environmentally sustainable aircraft de-icer management strategies in an airport to lower greenhouse gas emissions by adopting life cycle assessment methodology. Sabiha Gokcen International Airport where, a formulation containing mainly propylene glycol is used as aircraft de-icer, is investigated. The effect of on-site and off-site de-icer recycling, application of various recycling rates and types of glycol on emissions are presented via "cradle-to-grave" perspective. When propylene glycol is used, annually 35892ton CO2e is found to be generated. On the other hand, 60% on-site recycling of spent propylene glycol yields on average 17016ton CO2e/year. Off-site recycling with 60% recycling rate reduces the original amount to 20965 ton CO2e/year. The usage of bio-propylene glycol instead of conventional one is investigated generate 24776ton CO2e/year. Finally 30, 20 and 10% off-site recycling of spent conventional propylene glycol yield 28433, 30916 and 33408ton CO2e/year respectively. Keywords: Airport, Carbon Footprint, Sustainability, De-icer, Life Cycle Assessment
Introduction
eveloping strategies to achieve an environmentally sustainable aviation sector must cover not only the issues related to the flights, but also the management of airports and their supporting infrastructure must be considered. Only by doing so sound roadmaps towards environmental
sustainability can be obtained. Some chemicals used in airports can cause long term negative impacts on environment (Ahrens, Norstrom, Victor, Cousins & Josefsson, 2015; Filipovic, Woldegiorgis, Norstrom, Bibi, Lindberg & Osteras, 2015). Chemicals applied for the removal of existing ice and/or protection against ice formation are called de-icers. De-icers are used on both runways and aircrafts. Commercial de-icing formulations contain either propylene glycol or ethylene glycol. Similar to European countries and United States (Gray, 2013), propylene glycol formulations are used as de-icers in Turkish airports. The glycol content of de-icers varies between 50 to 88 % (Johnson, 2012). Glycols are not persistent or bio-accumulative (Murphy, Wallace, Knight, Cooper & Sellers, 2015). However, they are the major contributor to organic pollutant content of wastewaters generated from the airports (Freeman, Surridge, Matthews, Stewart &
D

Sinem Aksit Sahinkaya, Fatos Germirli Babuna (Environmentally Sustainable De-icer Management for an Airport)
160
Haygarth, 2015; Switzenbaum, Veltman, Mericas, Wagoner & Schoenberg, 2001). Due to this fact surface waters near airports are adversely affected from the usage of de-icers (Turnball & Bevan, 1995).
Apart from glycol, additives such as corrosion inhibitors, wetting agents, thickening agents, surfactants, anti-foaming agents are also used in de-icer formulations for various purposes i.e. keeping the de-icing solution on the aircraft, preventing corrosion etc (Mohiley, Franzaring, Calvo & Fangmeier, 2015; Johnson, 2012; Murphy, Wallace, Knight, Cooper & Sellers, 2015). Although these additives has a contribution less than 1 % by weight (Johnson, 2012), due to their existence glycol based de-icer formulations have higher toxicities than the toxicity of glycol solutions alone (Hartwell, Jordahl, Evans & May, 1995; Cancilla, Baird, Geis & Corsi, 2003; Mohiley, Franzaring, Calvo & Fangmeier, 2015; Murphy, Wallace, Knight, Cooper & Sellers, 2015).
Sustainable management of de-icers in airports is of importance as various alternatives can be considered when dealing with this issue. Some measures can be taken to lower the amount of de-icer applications on aircrafts such as mechanical de-icing (infra-red de-icing, hot air blast etc.) (US EPA, 2002; Gray, 2013). Besides the usage of computerized spraying systems is also stated to reduce the amount of de-icers (US EPA, 2002). Airport operators must choose not only the correct alternative among different chemicals used as de-icers, but also consider proper disposal or recycling methods. It is known that only de-icers applied on aircrafts can be recycled. The current technology is not allowing the recycling of de-icers used in runways. If recycling of used aircraft de-icers is preferred, the airport operators must decide on the type of recycling (on-site or off-site) and the percentage of recycling. Since many parameters are involved, a holistic approach is required while making a correct decision. On the other hand, environmental impacts of a service, an activity or a product can be evaluated on a holistic perspective with the aid of life cycle assessment (LCA). Such an approach eases decision making process for operators, manufacturers etc by presenting qualitative outcomes.
On a global basis the aviation industry is responsible for 2 % of all the anthropogenic carbon dioxide emissions (Monsalud, Ho & Rakas, 2014). Unless necessary measures are taken, an elevation of up to 15 % in this percentage is expected by the year 2050 (Baxter, Wild & Sabatini, 2014; Whitelegg & Cambridge, 2004).
In this context the objective of this study is to evaluate the environmentally sustainable aircraft de-icer management strategies to the reduce greenhouse gas emissions of an international airport by adopting life cycle assessment methodology. For this purpose Sabiha Gokcen International Airport where, a formulation containing mainly propylene glycol is used as aircraft de-icer, is investigated. The effect of on-site and off-site de-icer recycling together with the application of various recycling rates and various types of glycol are evaluated by using life cycle assessment in a "cradle-to-grave" perspective.
Materials and Methods
Sabiha Gokcen International Airport is located on the Asian side of Istanbul. The airport currently provides service to approximately 30 million passengers annually.
Data gathered from the airport are fed to Airport Carbon and Emissions Reporting Tool (ACERT v3.1 calculation tool) (ACERT, 2016) developed by Airports Council International (ACI) to get the current greenhouse gas emissions (ACI, 2009). The airport operator is responsible for the greenhouse gas emissions arising from the following activities: the fuel usage for air-side vehicles and employee shuttles, de-icer usage,

Engineering Approaches on Sustainability (Edited by: Dr. Zehra Semra Can, Dr. Barış Yılmaz, Dr. Seval Genç, Dr. Candeniz Seçkin )
161
waste/wastewater processing, electricity and natural gas inputs. The evaluation based on ACERT v3.1 calculation tool is used to find out the contribution of de-icer usage to whole greenhouse gas emissions generated by the activities of airport operator.
Similar to the other Turkish airports, a formulation containing mainly propylene glycol is used as aircraft de-icer in Sabiha Gokcen International Airport. Besides propylene glycol, the formulation contains water and other additives.
The effect of on-site and off-site de-icer recycling together with the application of various recycling rates and various types of glycol are evaluated by using life cycle assessment. The life cycle assessment analysis adopted in this study has a scope ranging from production of energy and raw materials to usage and final disposal of aircraft de-icer. Therefore the results of a "cradle-to-grave" analysis is used to find out the greenhouse gas emissions arising from the de-icer production, usage of it on aircrafts in the mentioned airport and final disposal.
The unit greenhouse emissions adopted in this study are obtained from a literature source performed on life cycle assessment of aircraft de-icers in Western Europe (Johnson, 2012). Due to differences in national electricity footprints it is expected to get slight variations in unit emissions for Turkey. However as Turkish power footprint is very close to that of Western Europe such an adoption will not cause significant discrepancies. Johnson, (2012) indicates a narrow gap between no recycling and recycling cases for countries with high power footprints and vice versa. Turkish electricity footprint is smaller (ACERT, 2016) than that of Western Europe, therefore the gap between no recycling and recycling alternatives is expected to widen. The mentioned literature considers 1 ton of de-icer with an average 65 % concentration of propylene glycol as functional unit. CO2 e emissions arising from propylene glycol application as de-icer is compared with 60 % on-site recycling of used de-icer and 60, 30, 20 and 10 % off-site recycling of spent de-icer. Variations in the recycling rates are expected to yield different levels of CO2 e emissions. The reasons lying behind such a variation can mainly be due to the following factors: i. Producing lower amounts of de-icers with increased recycling rates leading to generation of lower amounts of CO2 e emissions; ii) As recycling rates are increased less spent de-icer will be introduced to wastewaters causing lower CO2 e emissions. Besides transportation of de-icer or spent de-icer will affect the CO2 e emissions.
The following sequence is used for the production of propylene glycol: Natural gas and crude petroleum is processed to obtain naphtha. Naphtha is converted to propylene by steam cracking. Then propylene is passed through chlorohydrin processing to generate propylene oxide. Finally, propylene oxide is subjected to hydration to produce propylene glycol. Carbon footprint of the additives and water are obtained from ecoinvent (2010) in Johnson, 2012. For on-site recycling, spent de-icer is subjected to ultrafiltration, ion exchange, pH adjustment and distillation. For off-site recycling, spent de-icer is evaporated, thereafter steam distillation and thin film evaporation is applied. For further details of the life cycle assessment application one must refer to Johnson, 2012.
Results and Discussion
Among all the activities performed under the responsibility of airport operators electricity usage, fuel consumption of air-side vehicles and de-icer usage both for aircrafts and runways, have highest contributions of 42 %, 19 % and 18 % to the greenhouse gas emissions, respectively, as given in Figure 1. It must be noted

Sinem Aksit Sahinkaya, Fatos Germirli Babuna (Environmentally Sustainable De-icer Management for an Airport)
162
that these percentages are obtained on the basis of the operations take place in the airport under investigation without considering a life cycle assessment approach.
Figure 1. Percent distribution CO2 e emissions arising from activities performed by airport operators
All the greenhouse gas emission values presented in this study are based on carbon dioxide equivalent, in other words CO2 e. "Carbon dioxide equivalent" or "CO2e" is a term that describes various greenhouse gases, such as carbon dioxide itself, CO2; methane, CH4; nitrous oxide, N2O; hydrofluorocarbons, HFCs; perfluorocarbons, PFCs; sulfur hexafluoride, SF6; in a common unit.
The results obtained for greenhouse gas emissions by adopting the life cycle assessment to de-icer management is summarized in Table 1.
Table 1. Greenhouse gas emissions related to various de-icer management strategies via life cycle approach
Type of de-icer
Type of disposal
Recycling rate (%)
Unit greenhouse gas emissions (kg CO2 e/ton
de-icer)**
Minimum and Maximum greenhouse
gas emissions (ton CO2 e/year)
Reduction (%)**
propylene glycol no recycle - 3917 23930-47854 -
propylene glycol
on-site recycle 60 1857 11344-22687 53
propylene glycol
off-site recycle 60 2288 13976-27953 42
bio-propylene glycol* no recycle - 2704 16517-33035 31
propylene glycol
off-site recycle 30 3103 18955-37909 21
propylene glycol
off-site recycle 20 3374 20610-41220 14
propylene glycol
off-site recycle 10 3646 22272-44543 7
* propylene glycol made from plants **(Johnson, 2012)

Engineering Approaches on Sustainability (Edited by: Dr. Zehra Semra Can, Dr. Barış Yılmaz, Dr. Seval Genç, Dr. Candeniz Seçkin )
163
The usage of bio-propylene glycol (a type of glycol made from plant materials) instead of conventional propylene glycol (produced from petroleum) reduces greenhouse gas emissions by 31 %. Thus application of bio-propylene glycol results in average annual generation of 24776 ton CO2 e. 30, 20 and 10 % off-site recycling of conventional propylene glycol yield 28433, 30916 and 33408 ton CO2 e/year respectively.
Future Research Directions
As indicated earlier the unit greenhouse emissions adopted in this study are obtained from a literature source presenting the results of life cycle assessment of aircraft de-icers in Western Europe (Johnson, 2012). It is recommended to generate country specific data and perform a life cycle assessment by considering this data and local conditions (such as production flowchart of propylene glycol in Turkey, transportation issues etc.) to get more accurate outcomes.
Conclusion
The lowest carbon footprint is obtained when spent aircraft de-icer is recycled on-site by a rate of 60 %. This application lowers 35892 ton CO2 e/year emissions to 1857 ton CO2 e/year. After this comes 60 % off-site recycling that generates annually 2288 ton CO2 e.
References
ACERT (2016). Retrieved February 1, 2016, from http://www.aci.aero/About-ACI/Priorities/Environment/ACERT ACI (2009). Guidance Manual: Airport Greenhouse Gas Emissions Management, Airport Council International, 1st Edition,
November. Ahrens, L., Norstrom, K., Viktor, T., Cousins, A. P. and Josefsson, S. (2015). Stockholm Arlanda Airport as a source of
per- and polyfluoroalkyl substances to water, sediment and fish. Chemosphere, 129, 33-38. Baxter, G., Wild, G. and Sabatini, R. (2014). A sustainable approach to airport design and operations: Case Study of
Munich Airport. Practical Response to Climate Change, Engineers Australia, Convention 2014, 25-27 November, Melbourne.
Cancilla, D. A., Baird, J. C., Geis, S. W. and Corsi, S. R. (2003). Studies of the environmental fate and effect of aircraft de-icing fluids: detection of 5-methyl-1H-benzotriazole in the fathead minnow (Pimephales promelas). Environmental Toxicology and Chemistry, 22, 1, 134-140.
Ecoinvent, (2010). Life Cycle Assessment Database. Switzerland, St Gallen. Filipovic, M., Woldegiorgis, A., Norstrom, K., Bibi, M., Lindberg, M. and Osteras, A. H. (2015). Historical usage of
aqueous film forming foam: A casestudy of the widespread distribution of perfluoroalkyl acids from a military airport to groundwater, lakes, soils and fish. Chemosphere, 129, 39-45.
Freeman, A. I., Surridge, A. W. J., Matthews, M., Stewart, M. and Haygarth, P. M. (2015). Understanding and managing de-icer contamination of airport surface waters: A synthesis and future perspectives. Environmental Technology and Innovation, 3, 46-62.
Gray, L. (2013). Review of Aircraft Deicing and Anti-Icing Fluid Storm water Runoff Control Technologies-Including a Review of Preventive Measures. Water Pollution Prevention and Control Report, USA.
US EPA (2002). Managing Aircraft and Airfield Deicing Operations to Prevent Contamination of Drinking Water. Source Water Protection Practices Bulletin. EPA 816-F-02-018.
Hartwell, S. I., Jordahl, D. M., Evans, J. E. and May, E. B. (1995). Toxicity of aircraft de-icer and anti-icer solutions to aquatic organisms. Environmental Toxicology and Chemistry, 14, 8, 1375-1386.
Johnson, E. P. (2012). Aircraft de-icer: Recycling can cut carbon emissions in half. Environmental Impact Assessment Review, 32, 156-164.
Mohiley, A., Franzaring, J., Calvo, O. C. and Fangmeier, A. (2015). Potential toxic effects of aircraft de-icers and wastewater samples containing these compounds. Environmental Science and Pollution Research, 22, 13094-13101.
Monsalud, A., Ho, D. and Rakas, J. (2014). Greenhouse gas emissions mitigation strategies within the airport sustainability evaluation process. Sustainable Cities and Society, 14, 414-424.

Sinem Aksit Sahinkaya, Fatos Germirli Babuna (Environmentally Sustainable De-icer Management for an Airport)
164
Murphy, C., Wallace, S., Knight, R., Cooper, D. and Sellers, T. (2015). Treatment performance of an aerated constructed wetland treating glycol from de-icing operations at a UK airport. Ecological Engineering, 80, 117-124.
Switzenbaum, M. S., Veltman, S., Mericas, D., Wagoner, B. and Schoenberg, T. (2001). Best management practices for airport deicing stormwater. Chemosphere, 43, 1051-1062.
Turnball, D. A. and Bevan, J. R. (1995). The impact of airport de-icer on a river: The case of the Ouseburn, Newcastle Upon Tyne. Environmental Pollution, 88, 321-332.
Whitelegg, J. and Cambridge, J. (2004). Aviation and Sustainability- A Policy Paper, Stockholm Environment Institute, ISBN 91 88714 91 8.

Engineering Approaches on Sustainability (Edited by: Dr. Zehra Semra Can, Dr. Barış Yılmaz, Dr. Seval Genç, Dr. Candeniz Seçkin )
165
14 Some Remarks on Sustainable Fisheries Management in Turkey
Didem Göktürk Tomris Deniz Nurdan Cömert Abstract
Fisheries as an activity performed using natural resources are livelihood and strongly associated with the ecosystem. Hence it is a system which is characterized nesting complex relationship between society and the natural environment. Fisheries practices increased with the increase in the technological development and speed of globalization as well as environmental pollution. Therefore natural fish resources have been damaged for a long time. Most of fish stocks are fully fished and some are overfished. Focusing and monitoring on the sustainable use and conservation of renewable fish resources have a responsible manner for fisheries management. In simple terms, sustainable fisheries, known as harvested at a sustainable rate, means minimal ecosystem effects, healthy fish stocks and effective management. Turkey has an important spawning and fishing grounds for commercial fish species such as pelagic and demersal, so both large and small scale fishery are major economic activity. But yet it has been concerned that most of fish stocks are affected by overfishing and pollution in Turkey. For this purpose the aim of this study is to evaluate and improve the state of sustainable fisheries management in Turkey with the help of reported studies and official statistics regarding sustainable development for current and future practices.
Keywords: Turkey, fisheries management, sustainable fisheries.
Introduction
isheries, in simple terms, can be described as catching and evaluation of all kinds of living organisms by various methods in aquatic ecosystems. Since the Upper Palaeolithic (Childe, 1960), continued fishing activities with artisanal fisheries from that day to this, have reached the modern fishing
environment using electronic equipment, equipment and information technology. During this long period, fishery, which has gained considerable economic value, naturally has significant effects on ecosystems and people. The life of all living organisms depends on natural resources and one of these natural sources is fishing which is not endless even though it is a renewable resource. At the point of ensuring the continuity of natural resources, the concept of sustainability became a current issue. The concept of sustainability in the global
F

Didem Göktürk, Tomris Deniz, Nurdan Cömert (Some Remarks on Sustainable Fisheries Management in Turkey)
166
sense was first reported as "Our Common Future" by the World Commission on Environment and Development (WCED) in 1987. A general definition of sustainability is to supply daily needs by ensuring continuity of biological systems diversity and productivity without losing the ability of future generation’s necessities. In the field of fisheries, sustainability means that fisheries can be made economically without harming the diversity and stocks of fish species. What is important here is that fishery can contribute to the global employment and animal protein supply without harming the ecosystem so that it can be maintained in an environmentally friendly manner.
Sustainable fisheries and the ecosystems in which they function provide significant benefits. These might be categorised as economic output, livelihoods, food security and ecosystem services. A transition to the sustainable management of fish stocks will ensure that these benefits are available to future generations (ISU, 2016). The past fifty years has seen a massive expansion in fishing capacity that has over-exploited many fisheries (Grafton, Kompas & Hilborn, 2007). Fisheries are an underperforming global asset. A recent study by the World Bank and Food and Agriculture Organization of the United Nations (World Bank & FAO, 2009) indicates that the difference between the potential and actual net economic benefits from marine fisheries is on the order of $50 billion (109) per year (Willmann & Kelleher, 2010). Global fishery production in marine waters was 82.6 million tonnes in 2011 and 79.7 million tonnes in 2012 (74.3 and 75.0 million tonnes excluding anchoveta). In these two years, 18 countries caught more than an average of one million tonnes per year, accounting for more than 76 percent of global marine catches (FAO, 2014). Today's fishing industry has the capacity to catch more fish than the amount of fish ecosystems can produce (Aksoy & Koç, 2012; Seçer et al., 2010), and it was reported that 80% of them are collapsed, over-exploited, and are in the process of collapse as a result of work done by the Food and Agriculture Organization of the United Nations (FAO) today's fish stocks in 600 areas around the world (FAO, 2006).
Turkish coastline has four different characteristic seas with a rich marine biodiversity. From north to south: Black Sea, Sea of Marmara, Aegean Sea and Mediterranean Sea. In Turkish waters, the main fishery was targeted on small and medium pelagic fish for the Turkish coasts which are an important spawning ground for some migratory pelagic fish species such as Atlantic bonito, anchovy, bluefish and herring and also demersal fish (FAO, 2008; Gokturk, Deniz & Alıçlı, 2016). In marine capture fisheries the main stocks were anchovy, pilchard, horse mackerel, scad, whiting, grey mullet, blue fish, sprat, bogue, European hake, chup mackerel, red mullet, twaite shad, picarel, striped red, little tunny, frigate mackerel, striped bream, sand smelt, common sole, seabream, thornback ray, turbot, blue fin tuna, mackerel, tope shark, leer fish, saupe, red gurnard, annular bream, seabass, swordfish, white grouper, gar fish, saddled seabream, black scorpion fish, black seabream, saury, striped seabream, dentex, European barracuda, two banded bream, common seabream, gobies, dusky grouper, john dory, painted comber, blue spotted bream, albacore, brown meagre, greater amberjack, angel shark, corb, meagre, and shore rockling (FAO, 2008). However, the coastal and marine biodiversity also fish stocks of the Turkey was already under stress through a combination of heavy fishing, pollution, eutrophication, climatic fluctuations and the invasion of alien species due to the pressures exerted by mankind. Example of the Black Sea fish stock collapse is numerous and the unsustainable harvest of many fish species continuous today. Turkey is the most important country as to realize maximum fish production from the Black Sea. Pelagic fish species dominate marine landings in Turkey (Gokturk, Deniz & Oral, 2015).
Conservation and persistence of fish stocks are the basic principle of sustainable fisheries. However, many parameters are used in the calculation of sustainable fisheries. From this point of view, with using the data of marine fish landings, some remarks have been recommended to provide for sustainable fisheries in Turkey.

Engineering Approaches on Sustainability (Edited by: Dr. Zehra Semra Can, Dr. Barış Yılmaz, Dr. Seval Genç, Dr. Candeniz Seçkin )
167
Data Collection
The data reported and evaluated in this study, especially, demersal and pelagic fish species which are commercially fished was obtained from Republic of Turkey Ministry of Food, Agriculture and Livestock, Turkish Statistical Institute and FAO (Food and Agriculture Organization of the United Nations) statistics as well as some reported studies about fisheries of Turkey.
Findings
General view of marine landings in Turkey
Turkish waters are important fishing grounds for both small and large scale fisheries regarding to abundance of commercial as well as migratory species. Variation of fish, invertebrates and total marine capture between 2000 and 2015 were illustrated in Figure 1. Approximately 200 fish species in the Black Sea, 260 fish species in the Marmara Sea, 417 species in Aegean Sea and 750 species in the Mediterranean Sea were reported (Froese & Pauly, 2016). However, approximately 66 fish species are commercially caught in Turkish waters and recorded their catch amount by Turkish Statistical Institute.
Figure 1. Fisheries landings of Turkey, 2000-2015 for amount of fish, invertebrates and total.
Anchovy (Engraulis encrasicolus, Linnaeus, 1758), pilchard (Clupeidae), horse mackerel (Trachurus trachurus, Linnaeus, 1758/Trachurus mediterraneus, Steindachner, 1868), Atlantic bonito (Sarda sarda, Bloch, 1793), blue fish (Pomatomus saltatrix, Linnaeus, 1766), sprat (Sprattus sprattus, Linnaeus, 1758) are the main commercial pelagic fish species (Figure 2), which have mostly caught by purse seine in Turkey. Anchovy takes the first place for pelagic fishery in Turkey, where especially caught from Black Sea coast, with the average of 246812 tonnes between 2000 and 2015 (TSI, 2015). Whiting (Merlangius merlangus, Linnaeus, 1758), European hake (Merluccius merluccius, Linnaeus, 1758), surmullet (Mullus surmuletus, Linnaeus, 1758), red mullet/goldon banded (Mullus barbatus, Linnaeus, 1758/Upeneus sp.) and turbot (Scophthalmus maximus, Linnaeus, 1758) are the main commercially important fish species for demersal fisheries in Turkey as a target
0
100000
200000
300000
400000
500000
600000
700000
2000 2001 2002 2003 2004 2005 2006 2007 2008 2009 2010 2011 2012 2013 2014 2015Years
Tonnes
Fish Invertebrates Total

Didem Göktürk, Tomris Deniz, Nurdan Cömert (Some Remarks on Sustainable Fisheries Management in Turkey)
168
or by-catch (Figure 3). There are some fishing methods for landing the demersal fish resources in Turkish coastlines, such as trawl, beam trawl, beach seine, gillnets, trammel nets and lines. The catch profile with respect to fishing methods, regions and species are summarized in Table 1. Especially, European hake, Merluccius merluccius is one of the most economically important exploited demersal fish species in both Europe and Turkey. In recent years, according to official data, it was clearly seen that the total of European hake landing of Turkey dramatically decreased day by day (20810 tons in 2001 and 706 tons in 2015).
Figure 2. Main commercial pelagic fish species landings of Turkey between 2000 and 2015.
Figure 3. Main commercial demersal fish species landings of Turkey between 2000 and 2015.

Engineering Approaches on Sustainability (Edited by: Dr. Zehra Semra Can, Dr. Barış Yılmaz, Dr. Seval Genç, Dr. Candeniz Seçkin )
169
Table 1. Marine catch profile with respect to fishing methods, regions and species.
Fishing method Region Species
Purse seine
Black Sea Anchovy, horse mackerel, scad, Atlantic bonito, sprat, bluefish, chub mackerel, sardines.
Sea of Marmara Anchovy, Atlantic bonito, sprat, scad, bluefish, sardines
Aegean and Mediterranean Sea
Sardines, chub mackerel, albacore, Atlantic bluefin tuna, little tunny, bullet tuna
Midwater trawl Black Sea Anchovy, horse mackerel, bluefish, sardines
Bottom trawl
Black Sea Whiting, red mullet, turbot
Aegean Sea Mixed
Mediterranean Sea Mixed
Beam trawl Sea of Marmara European hake, whiting, red mullet (as a by-catch species)
Small-scale fisheries (gillnet, trammel net, longline, beach seine, traps)
Black Sea, Sea of Marmara, Aegean Sea and Mediterranean Sea
Mixed (i.e. Atlantic bonito, bluefish, whiting, turbot, red mullet, grey mullet, sparids, sole, swordfish and tuna-like)
There are 14340 fishing vessels licensed in Turkey according to statistics of the Turkish Statistical Institute such as trawler, purse seiner, carrier vessels, gillnetting, beam trawler, long liner and other vessels (TSI, 2015) (Figure 4).
Figure 4. Distribution of licenced fishing vessels according to operating type.
Significant fluctuations were observed from 2000 to 2015 in total marine capture fisheries in Turkey (Figure 5). Pelagic species such as anchovy, bonito, horse mackerel, sardines and bluefish are dominated marine landings. Taking into consideration of total marine landings in Turkey it is observed that the dominant
Beam trawler and dredge2.9%
Gillnetting51.4%
Long liner 29%
Carrier vessels0.6%
Others0.9%
Purse seiner2.9%
Beach seine0.1%
Trap0.1%
Trawler4.5%
Liftnetting0.1%
Surrounding nets 7.4%
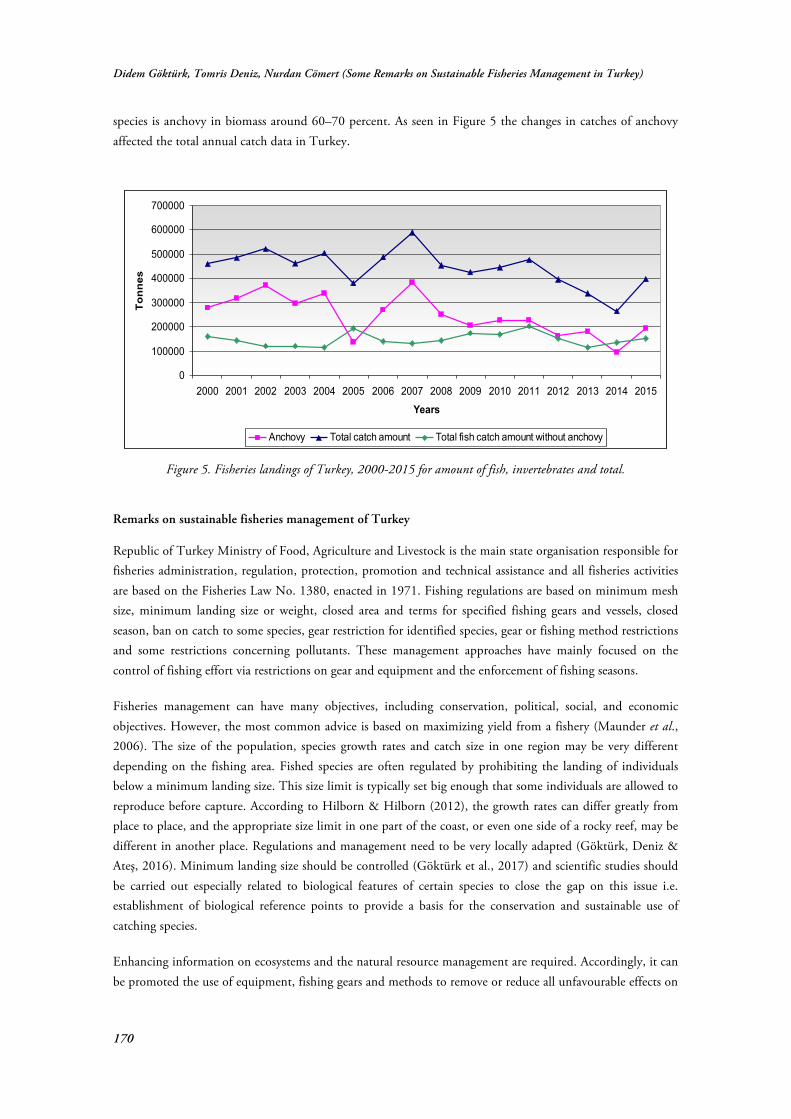
Didem Göktürk, Tomris Deniz, Nurdan Cömert (Some Remarks on Sustainable Fisheries Management in Turkey)
170
species is anchovy in biomass around 60–70 percent. As seen in Figure 5 the changes in catches of anchovy affected the total annual catch data in Turkey.
Figure 5. Fisheries landings of Turkey, 2000-2015 for amount of fish, invertebrates and total.
Remarks on sustainable fisheries management of Turkey
Republic of Turkey Ministry of Food, Agriculture and Livestock is the main state organisation responsible for fisheries administration, regulation, protection, promotion and technical assistance and all fisheries activities are based on the Fisheries Law No. 1380, enacted in 1971. Fishing regulations are based on minimum mesh size, minimum landing size or weight, closed area and terms for specified fishing gears and vessels, closed season, ban on catch to some species, gear restriction for identified species, gear or fishing method restrictions and some restrictions concerning pollutants. These management approaches have mainly focused on the control of fishing effort via restrictions on gear and equipment and the enforcement of fishing seasons.
Fisheries management can have many objectives, including conservation, political, social, and economic objectives. However, the most common advice is based on maximizing yield from a fishery (Maunder et al., 2006). The size of the population, species growth rates and catch size in one region may be very different depending on the fishing area. Fished species are often regulated by prohibiting the landing of individuals below a minimum landing size. This size limit is typically set big enough that some individuals are allowed to reproduce before capture. According to Hilborn & Hilborn (2012), the growth rates can differ greatly from place to place, and the appropriate size limit in one part of the coast, or even one side of a rocky reef, may be different in another place. Regulations and management need to be very locally adapted (Göktürk, Deniz & Ateş, 2016). Minimum landing size should be controlled (Göktürk et al., 2017) and scientific studies should be carried out especially related to biological features of certain species to close the gap on this issue i.e. establishment of biological reference points to provide a basis for the conservation and sustainable use of catching species.
Enhancing information on ecosystems and the natural resource management are required. Accordingly, it can be promoted the use of equipment, fishing gears and methods to remove or reduce all unfavourable effects on
0
100000
200000
300000
400000
500000
600000
700000
2000 2001 2002 2003 2004 2005 2006 2007 2008 2009 2010 2011 2012 2013 2014 2015Years
Tonnes
Anchovy Total catch amount Total fish catch amount without anchovy

Engineering Approaches on Sustainability (Edited by: Dr. Zehra Semra Can, Dr. Barış Yılmaz, Dr. Seval Genç, Dr. Candeniz Seçkin )
171
populations, species, habitats and ecosystems, including capture of unmatured fish, accidental catches (by-catch or discard) and habitat destruction. It should be provided that catching data is regularly and easily accessible. Furthermore, the data should be included such as fishing times in day, hour etc., and structure of fishing gear in order to calculate detailed fishing effort. Additionally persistence of fish stocks by-catch and discard ratio should be provided and also be recorded statistically. In this context, the sanction power of existing regulations should be increased and international cooperation for the development of conservation/sustainable use policies achieved. Another important issue is to take precautions related to uncertainty and variability in natural resource and ecosystem dynamics. For instance, pelagic fish stocks, especially anchovy decreased due to comb jelly (Mnemiopsis leidyi, A. Agassiz, 1865) known as invasive species in Black Sea.
As an economic point of view another important contribution is highly migratory species (called as HMS) -not as catch amount- for the fisheries of pelagic species in Turkey since they have high commercial value. Highly migratory species is a term which has its origins in Article 64 of the United Nations Convention on the Law of the Sea (UNCLOS). These species, according to the 1982 convention, listed under Annex I (UNCLOS, 1982). Highly migratory species which are commercially caught in Turkey are albacore (Thunnus alalunga, Bonnaterre, 1788), Atlantic bluefin tuna (Thunnus thynnus, Linnaeus, 1758), little tunny (Euthynnus alletteratus, Rafinesque, 1810), Bullet tuna / Frigate tuna (Auxis rochei, Risso, 1810 / Auxis thazard, Lacepède, 1800), Swordfish (Xiphias gladius, Linnaeus, 1758) and Atlantic saury (Scomberesox saurus, Walbaum, 1792). These species are commercially fished by longline, purse seine, trammel net in Turkey. However the total catch amount of these species is recorded approximately 1% in the total fish landing of Turkey. Among them T. thynnus and X. gladius that are exported as fishery products have an importance economic contribution approximately with 39102935 $ (TSI, 2013). T. alalunga, T. thynnus, E. alletteratus, and A. rochei/A. thazard are commercially taken by purse-seine and they are also caught by longlines which are used for swordfish and leerfish fisheries as by catch. The swordfish fisheries are especially made by longline but the harpoon is still used in catching. S. saurus which is caught mostly by-catch as well as recreational fishing. Besides all these, driftnets have been extensively using for the fisheries of X. gladius, T. alalunga and E. alletteratus for a long time until it was banned totally in 2011. In addition, HMS are generally caught by mutually as by-catch and evaluated economically i.e. Atlantic bluefin tuna caught in swordfish longline (Deniz, Göktürk & Ateş, 2016). ICCAT (International Commission for the Conservation of the Atlantic Tunas) determines the country quotas of the member countries for Atlantic bluefin tuna fishery. Thus prohibitions such as minimum landing size, time and catch amount related to fisheries for this species in the Mediterranean basin are determined and implemented by ICCAT. Since Turkey is also member of ICCAT Atlantic bluefin tuna fishery is performed in Turkey based on ICCAT implementations. Swordfish fishery is also performed according to ICCAT regulations. However other implementations and prohibitions for tuna and tuna-like species are self-regulated based on ICCAT's recommendation by the member countries.
Another convention in which Turkey has been party to international agreements since 1954 is The General Fisheries Commission for the Mediterranean (GFCM). According to GFCM, Mediterranean and Black Sea fisheries are currently facing serious challenges, with roughly 90 percent of the scientifically assessed stocks considered to be fished outside safe biological limits, decreasing catches and shrinking fleets at the regional scale. In this context “Resolution GFCM/40/2016/2 for a mid-term strategy (2017–2020) towards the sustainability of Mediterranean and Black Sea fisheries” was prepared by GFCM (2016). The implementation of the proposed GFCM mid-term strategy towards the sustainability of Mediterranean and Black Sea fisheries will be guided by the following select principles which are in place at the FAO level:

Didem Göktürk, Tomris Deniz, Nurdan Cömert (Some Remarks on Sustainable Fisheries Management in Turkey)
172
• Best available knowledge: The provision of advice, including on the status and trends of stocks and fisheries, should be based on the best available knowledge, including scientific advice and relevant information emanating from a variety of sources and stakeholders. Efforts to collect all information available shall be ensured, and standards for assuring the quality of information should be applied wherever and whenever practicable and appropriate within Scientific Advisory Committee on Fisheries (SAC) and Working Group on the Black Sea (WGBS);
• Objectivity and transparency: The collection, analysis and dissemination of information on the status and trends of fisheries, ecosystems and marine environment should contribute to the transparent provision of the best scientific evidence available, while respecting any confidentiality requirements. Uncertainty associated with information on status and trends should be expressed, without detracting from the application of the precautionary approach, when data and information are incomplete. Information on activities towards the fight against illegal unreported and unregulated (IUU) fishing should be made available, respecting confidentiality requirements;
• Timeliness: The collection, analysis and dissemination of information on the status and trends of fisheries, ecosystems and marine environment, as well as information on IUU fishing, should be provided in as timely manner as possible;
• Participation and cooperation: The collection, analysis and dissemination of information on the status and trends of fisheries, ecosystems and marine environment, as well as information on IUU fishing, should account for all relevant participants in the preparation, analysis and presentation of scientific advice and conclusions. Relevant participants may include, inter alia, representatives of GFCM Contracting Parties and Cooperating non-Contracting Parties (CPCs), relevant international, non-governmental and civil society organizations. The cooperative network established by the GFCM through the adoption of various MoU would be relied upon, having regard to the cross-sectoral nature of the strategy;
• Adaptability: The collection, analysis and dissemination of information on the status and trends of fisheries, ecosystems and marine environment, as well as information on IUU fishing, should be adaptive enough to permit adjustments, as necessary, to ensure their effective support of fisheries management based on the most recent scientific advice available.
Conclusions
Sustainability that involves the environmental, social and economic conservation issues of ecosystems and human activities, and fisheries management that focuses on harvested species, are at an admitted crossroad. Fishery products are one of the most-traded food resources worldwide. In order to protect the stocks of commercial importance species and to ensure their sustainability, it is necessary to obey the regulations because, effective control of these prohibitions have a great importance for conservation of stocks in terms of sustainable fisheries. For this reason, it is beneficial to carry out continuous monitoring studies within the fishing periods in order to protect the stocks by regulating the fisheries strategies of the species having commercial importance in the fisheries sector. Therefore, these monitoring activities will also play a positive role in maintaining and sustainability of the precise ecological balance, which is linked each other. In a social point of view, effective efforts should be made for conserving marine biodiversity and sustainable use of resources as well as preventing overfishing.

Engineering Approaches on Sustainability (Edited by: Dr. Zehra Semra Can, Dr. Barış Yılmaz, Dr. Seval Genç, Dr. Candeniz Seçkin )
173
References
Aksoy R. & Koç G. (2012). Small-scale fisheries and their sustainability: A field study in Zonguldak province. International Journal of Economic and Administrative Studies, 4(8), 87–103.
Childe V. G. (1960). What happened in history? London: M. Parrish. Deniz T., Göktürk D. & Ateş C. (2016). Status of highly migratory fisheries in The Mediterranean Sea, Turkey. In: C.
Turan, B. Salihoğlu, Ö. E. Özbek & B. Öztürk (Eds.), The Turkish Part of the Mediterranean Sea Marine Biodiversity, Fisheries, Conservation and Governance (pp. 333-352). Istanbul: Turkish Marine Research Foundation Publication No: 43.
FAO (Food and Agriculture Organization of the United Nations). (2014). The state of world fisheries and aquaculture opportunities and challenges. Rome: FAO publications.
FAO (Food and Agriculture Organization of the United Nations). (2006). The expert workshop on marine protected areas and fisheries management: Review of issues and considerations. Italy: FAO Fisheries Report No: 825.
FAO (Food and Agriculture Organization of the United Nations). (2008). Fishery country profile, The Republic of Turkey. Retrieved from FAO website: ftp://ftp.fao.org/FI/DOCUMENT/fcp/en/FI_CP_TR.pdf
Froese R. & Pauly D. (2016). FishBase: World wide web electronic publication. Retrieved from fishbase website: www.fishbase.org.
GFCM (The General Fisheries Commission for the Mediterranean). (2016). Resolution GFCM/40/2016/2 for a mid-term strategy (2017–2020) towards the sustainability of Mediterranean and Black Sea fisheries. Retrieved from GFCM website: https://www.cbd.int/doc/meetings/mar/soiom-2016-01/other/soiom-2016-01-gfcm-04-en.pdf
Göktürk D., Deniz T. & Ateş C. (2016). A case study on catch characteristics of European hake gillnet fıshery in the southern Sea of Marmara, Turkey. Cahiers de Biologie Marine, 57(4), 343–354.
Göktürk D., Deniz T. & Oral M. (2015). Has sustainability pelagic fisheries in the black sea Turkish coast ever been achieved? Paper presented at the 27th International Congress for Conservation Biology-4th European Congress for Conservation Biology (ICCB-ECCB 2015), pp. 3-4, Montpellier, France.
Göktürk D., Deniz T. Alıçlı T. Z. (2016). European Hake Fisheries in Turkish Waters: Practices and Suggestions. Paper presented at the 18th International Institute of Fisheries Economics and Trade Conference 2016 (IIFET 2016), pp. 280, Aberdeen, Scotland, UK.
Göktürk D., Deniz T., Yılmaz S., Sacıhan S. D., (2017). Illegal landing size problem in fisheries: Evaluation of marketed fish adequacy in Istanbul. NWSA Ecological Life Sciences, 12(1), (in press).
Grafton R. Q., Kompas T. & Hilborn R. (2007). The economics of overexploitation revisited. Science, 318(5856), 1601. Hilborn R. & Hilborn U. (2012). Overfishing: What everyone needs to know. New York, NY: Oxford University Press. ISU (International Sustainability Unit). (2012). Towards global sustainable fisheries: The opportunity for transition.
Retrieved from The Prince’s Charities’ International Sustainability Unit website: http://www.pcfisu.org/wp-content/uploads/2012/01/ISUMarineprogramme-towards-global-sustainable-fisheries.pdf
Maunder M. N., Sibert J. R., Fonteneau A., Hampton J., Kleiber P. & Harley S. J. (2006). Interpreting catch per unit effort data to assess the status of individual stocks and communities. ICES Journal of Marine Science, 63, 1373–1385.
Seçer S., Korkmaz A. Ş., Dinçer C., Atar H. H, Seçer F. S. & Keskin E. (2010). Türkiye’de Sürdürülebilir Su Ürünleri Avcılığı. Paper presenting at the TMMOB (the Union of the Chambers of Turkish Engineers and Architects) VII. Technical Congress of Agricultural Engineering, January 11-15, Ankara, Turkey. Retrieved from TMMOB-ZMO website http://www.zmo.org.tr/resimler/ekler/f452c63f81d0105_ek.pdf
TSI (Turkish Statistical Institute). (2013). Fisheries statistical database 2013. Retrieved from TSI website: http://www.turkstat.gov.tr.
TSI (Turkish Statistical Institute). (2015). Fisheries statistical database 2015. Retrieved from TSI website: http://www.turkstat.gov.tr.
UNCLOS. (1982). United Nations Convention on the law of the sea of 10 December 1982. Retrieved from: http://www.un.org/depts/los/convention_agreements/texts/unclos/UNCLOS-TOC.htm.
Willmann R. & Kelleher K. (2010). Economic Trends in Global Marine Fisheries. In: R. Q. Grafton, R. Hilborn, D. Squires, M. Tait & M. Williams (Eds.), Handbook of Marine Fisheries Conservation and Management (pp. 20-4), New York, NY: Oxford University Press.
World Bank & FAO (Food and Agriculture Organization of the United Nations). (2009). The Sunken Billions: The Economic Justification for Fisheries Reform. Washington, DC: World Bank.

Engineering Approacheson Sustainability
In general terms, sustainability is the act of meeting our own needs today without compromising the ability of future generations to meet their own needs (World Commission on Environment and Development, 1987). Obviously, the ability of natural resources and environmental systems to support our needs is limited. �erefore, the major challenge for engineers today is to design and/or operate systems that use energy and natural resources sustainably. Designing for the environment is crucial. �is book presents the recent engineering approaches to sustainability from research and practice.
�e chapters included in this volume are from the first International Sustainability Congress organized by International Center of Sustainability (ICS) between 1-3 December 2016 in Istanbul, Turkey. All chapters are peer-reviewed by both the editors and at least two independent scholars from fields relevant to the manuscript's subject area. ICS is a research and academic center for sustainability founded in 2015 and dedicated to build resilience of communities and ecosystems to environmental and socio-economic risks. ICS has an integrated approach and defines sustainability not only in terms of environment but also in terms of socio-economic process. Its mission is to produce information, to research and to practice at Micro and Macro levels in Sustainable Development with a holistic and cross-disciplinary approach.