
Apprenticeships evaluation 2015: employers - gov.uk · PDF fileApprenticeships Evaluation 2015...
108
Apprenticeships Evaluation 2015 - Employers A report by IFF Research, with the Institute for Employment Research at the University of Warwick October 2016
Transcript of Apprenticeships evaluation 2015: employers - gov.uk · PDF fileApprenticeships Evaluation 2015...

Apprenticeships Evaluation 2015 - Employers A report by IFF Research, with the Institute for Employment Research at the University of Warwick
October 2016
Contents Contents 2
Table of figures 5
1. Executive Summary 8
Who employs apprentices? 8
What types of apprenticeships are on offer? 9
How and why were apprentices recruited? 9
Keeping apprentices: retention and progression 10
New initiatives – Traineeships and Trailblazers 11
Delivery, assessment, cost and influence of apprenticeship training 12
Satisfaction, benefits and future plans 13
2. Introduction 14
Summary of policy context 14
Research aims 15
Summary of the methodology 15
Reporting conventions 17
3. Who employs apprentices? 18
Sector and size profile 19
Number of apprentices 20
Length of time offering apprenticeships 24
Growth outlook 25
Awareness of apprenticeships 26
4. What types of apprenticeships are on offer? 28
Broad frameworks 28
Specific frameworks 29
Broad frameworks – frameworks provided, and the main broad framework used 30
Level of apprenticeship 32
Age groups 34
5. Why and how were apprentices recruited? 38
Why offered apprenticeships rather than other forms of training 39
2

Reasons for having recently started to offer apprenticeships 41
Where the decision on the number of apprentices to take on is made 41
New recruits and existing employees 42
Apprenticeship vacancies 47
Support for applications 48
6. Keeping apprentices: retention and progression 50
Completion and non-completion 51
Retaining apprentices 51
Fixed term contracts 54
Offering progression 55
Why offer progression? 57
7. New initiatives – Traineeships and Trailblazers 59
Awareness and knowledge of traineeships 60
Participation in traineeships 62
Traineeships as a route into apprenticeships 62
Future traineeship offering 63
Awareness and knowledge of Trailblazers 64
Involvement with the new Trailblazer standards 66
Employers’ views on the new Trailblazer standards and assessments 66
Future Trailblazer offering 67
8. Delivery, assessment, cost and influence of apprenticeship training 69
Delivery of apprenticeship training 70
Assessment of apprenticeship training 71
Fees paid for apprenticeships 71
Employer influence on apprenticeship training 72
Employer desire for more influence 73
Maths and English GCSE 75
Whether apprentices started their apprenticeship with maths or English GCSE 75
The importance of maths and English GCSE to employers 76
9. Satisfaction, benefits and future plans 78
3

Overall satisfaction 79
Satisfaction with specific elements of apprenticeships 81
Advocacy 84
Benefits to the employer 85
Future provision of apprenticeships 90
Reducing or ending provision of apprenticeships 93
What employers would like to change 94
10. Conclusions 95
A. Technical Appendix 98
Introduction 98
Sampling 98
Fieldwork 99
Weighting 99
Differences from 2014 101
B. Regression analysis 102
4

Table of figures Table 2.1: Abbreviations of broad framework titles used in this report 16
Figure 3.1: Sector profile of employers with recent completers 19
Figure 3.2: Number of recent apprentice completers: by size of site 21
Table 3.1: Number of recent apprentices as a proportion of employees 22
Figure 3.3: Number recent apprentices, as a proportion of employees, by industrial sector (SIC2007) 23
Figure 3.4: Length of time offering apprenticeships, by all broad frameworks provided 25
Table 3.2: Growth expectations of businesses with recent apprentices, by size of organisation 26
Figure 3.5: Awareness that the framework is an apprenticeship, by all broad frameworks provided 27
Table 4.1: Employers with broad frameworks with recent apprentices 29
Figure 4.1: Specific frameworks within broad frameworks; all recent apprentices 30
Figure 4.2: Use of broad frameworks as the only, main or secondary broad framework31
Figure 4.3: Broad frameworks provided, and the ‘main’ broad framework 32
Figure 4.4: Levels provided to recent apprentices and at the time of the survey 33
Figure 4.5: Levels of apprenticeship studied, by main broad framework 34
Figure 4.6: Age groups apprenticeships offered to, by main broad framework 35
Figure 4.7: Age groups apprenticeships offered to, by sources of apprentice 36
Figure 4.8: What could persuade you to offer apprenticeships to under 19s 37
Figure 5.1: Single most important reason for offering apprenticeships over other forms of training, by main broad framework (prompted) 40
Figure 5.2: Single most important reason for offering apprenticeships over other forms of training, by size of site (prompted) 41
Figure 5.3 Where decisions on numbers of apprentices to take on made 42
Figure 5.4: Sources of recent apprentices: all employers 44
Figure 5.5: Sources of recruitment for recent apprentice completers, by number of recent apprentices 45
Figure 5.6: Sources of recruitment for recent apprentice completers, by broad framework 46
Figure 5.7: Usage of the Apprenticeship Vacancies website 47 5

Figure 5.8: Whether employers felt that there was sufficient information, support and guidance available, by industrial sector 49
Table 6.1: Whether recent apprentices were still working for the organisation at the time of the survey, by number of apprentices 52
Figure 6.1: Whether recent apprentices were still working for the organisation at the time of the survey, by main broad framework 53
Figure 6.2: Reasons why recent apprentices were no longer working for the organisation at the time of the survey, by main broad framework 54
Figure 6.3: Offering and carrying out higher level qualifications, overall and by main broad framework 55
Figure 6.4: Offering and carrying out higher level qualifications, by number of apprentices and size of site workforce 56
Figure 6.5: Reasons for offering higher level qualifications 57
Figure 6.6: Reasons for not offering higher level qualifications 58
Table 7.1 Knowledge of traineeships, by size of site and main broad framework 61
Figure 7.1 Future traineeship offering, by SIC 2007 sector 64
Table 7.2 Awareness / knowledge of Trailblazers, by employer size and framework 65
Figure 8.1 Whether apprentices received training from a training provider and from their employer, by main broad framework 70
Figure 8.2 Employer desire for more influence on apprenticeship training, by main broad framework 74
Figure 8.3 The importance of maths and English GCSE, by main broad framework 77
Table 9.1 Overall satisfaction amongst employers 79
Figure 9.1 Satisfaction with the overall apprenticeship programme by framework 80
Figure 9.2 Satisfaction with particular elements of the apprenticeship programme 82
Table 9.2 Satisfaction (six or more out of ten) with various elements of apprenticeships, by framework 83
Figure 9.3: Benefits experienced as a result of offering and training apprentices 86
Table 9.3 Benefits experienced as a result of offering and training apprentices – significant differences by main broad framework 87
Table 9.4 Benefits experienced as a result of offering and training apprentices – significant differences by sector 89
Figure 9.4 Future plans for the number of apprenticeship places offered over the next two to three years 92
6

Figure 9.5 Reasons for deciding to end apprenticeship offer in favour of another form of training 94
Table A.1 Sample profile, interviews achieved and weighted dataset profile 100
Table B.1 Ordered logistic regression results, model of employer reported change in future apprenticeship activity 103
Table B.2 Selected predicted probabilities for employers’ future apprenticeship activity107
7

1. Executive Summary
This report presents the findings of the Apprenticeships Evaluation Employer Survey 2015, and is the fourth in an annual series, the first of which was published in 2012. The evaluation, which sits alongside the Apprenticeships Evaluation Learner Survey, consisted of quantitative interviews with 4,000 employers that had had individuals complete an apprenticeship between March and October 2014. The research is intended to monitor key progress indicators and to develop understanding of the apprenticeship programme and the value it delivers. It provides insight into the impact of recent policy reforms and will help shape future development (and growth) of the programme. Specifically, the research covered employers’ experience of offering apprenticeships: who they took on and to what types of apprenticeship; their motivations for offering apprenticeships; the way the apprenticeships were delivered; the outcomes for their apprentices; and the satisfaction of employers and their future intentions. Who employs apprentices?
A quarter (24%) of employers with recent apprentices operated in the Health and Social Work sector, making this by far the largest sector. While there were few differences at a sector level since 2014, there were some changes by size of employer: over two-fifths (44%) of employers with apprenticeships had 25 or more employees at their site, compared with 34% in 2014.
The majority (67%) of employers offering apprenticeships had only one apprentice recently complete their training, reducing to 45% of employers with 100 or more staff. Around one in 11 (9%) had ten or more completers.
While larger employers tended to have more apprentices, mid-size sites (with 10 to 99 employees) actually had the highest ratio of apprentices to overall staff numbers (11 per 1,000 employees), around twice the level found among employers of other sizes. By sector, Other Services (which includes hairdressers and barbers) provided more apprentices per employee than any other sector, followed by Health and Social Work and Education.
Reflecting a recent plateauing of employer take-up of apprenticeships, a quarter (25%) had been offering apprenticeships for less than three years, a considerable reduction from the 42% in 2014.
8

Two-thirds (66%) of employers were aware that the training their staff had undertaken was an apprenticeship. However less than two-fifths (38%) of those that only provided apprenticeships to existing staff were aware. Awareness was higher for “traditional” frameworks (Construction and Engineering).
What types of apprenticeships are on offer?
As in 2014, there were three broad frameworks that accounted for the majority of the apprenticeships offered by employers. One in three (34%) provided Business frameworks to apprentices within the research window, while just under a quarter provided each of Health (23%) and Retail (22%).
Most employers (90%) provided only one broad framework. Two-thirds (65%) of employers provided apprenticeships at Level 2, and half (49%) at Level 3. Only one in seven (14%) provided both, although this rose to two-thirds (66%) among those with six or more apprentices. There was a wide variation by framework, with employers offering Construction frameworks much more likely to offer their apprenticeships at Level 2, while in Arts, Education and ICT most apprenticeships were at Level 3.
Most employers offered apprenticeships to those aged 19 to 24 (80%) or under 19 (74%). Only 16% exclusively offered apprenticeships to those aged under 19. Under half (46%) of employers offered apprenticeships to individuals aged 25 or over. For those who did not offer apprenticeships to individuals aged under 19, the most common reason was due to simply not being able to employ people of this age in the workplace (34%, rising to 46% among those offering a Health framework).
Employers targeting existing employees for apprenticeships were much more likely to provide them to people aged over 25 (70% compared to 34%), and much less likely to provide them to people aged under 19 (57% compared to 86%) than those recruiting from outside.
How and why were apprentices recruited?
A variety of reasons were given for choosing to offer apprenticeships to staff over other forms of training. When asked to choose a single reason which best described why they had made this choice, the most common related to apprenticeships being more relevant to the needs of the business (31%, an increase from 25% in 2014). Other frequently chosen reasons were the convenience of having the training provider handle recruitment (19%), that apprenticeships were the required form of training in the industry (18%) and their being the best way to aid recruitment (17%). Financial motivations were far less common (10%). There were no large differences between those offering apprenticeships to their existing staff and those recruiting new employees as apprentices, although those recruiting
9
new apprentices were more likely to say that it was because it was the required form of training for the industry (20% compared to 14%).
Employers that had been offering apprenticeships for a year or less (4% of all employers) were asked why they decided to start doing so. Commonly this was in order to acquire skilled staff (40%), while smaller proportions cited more reactive reasons such as being approached by a learning provider (19%) or existing staff (12%) to offer apprenticeships.
Most workplaces had control over the number of apprentices they took on, even if they belonged to a wider organisation. Approaching nine in ten (86%) of all workplaces decided for themselves the number of apprentices to train, and a further seven per cent suggested the number to take on that then required Head Office approval. Among branch sites, more than half (56%) made the decision on apprentice recruitment without any head office input, while for around one in six (17%) of branches the decision was made entirely off-site, at Head Office.
The majority of employers (64%) recruited externally at least some of the apprentices who completed their training in the research window. Two-fifths (38%) provided apprenticeships to existing staff. Just over half (56%) recruited at least one apprentice who started their apprenticeship immediately (compared with 50% in 2014, although due to changes in questionnaire design these differences are not strictly comparable).
The National Apprenticeship Service’s Apprenticeship Vacancies website, now called ‘Find an apprenticeship’, was used by around a fifth (21%). This rose to 25% among employers who had at least some recent completers that had been recruited specifically as apprentices.
Employers generally felt the information, support and guidance available when making decisions on offering apprenticeships was sufficient (71%), although this was a less commonly held view among small businesses (63% of those with fewer than ten employees).
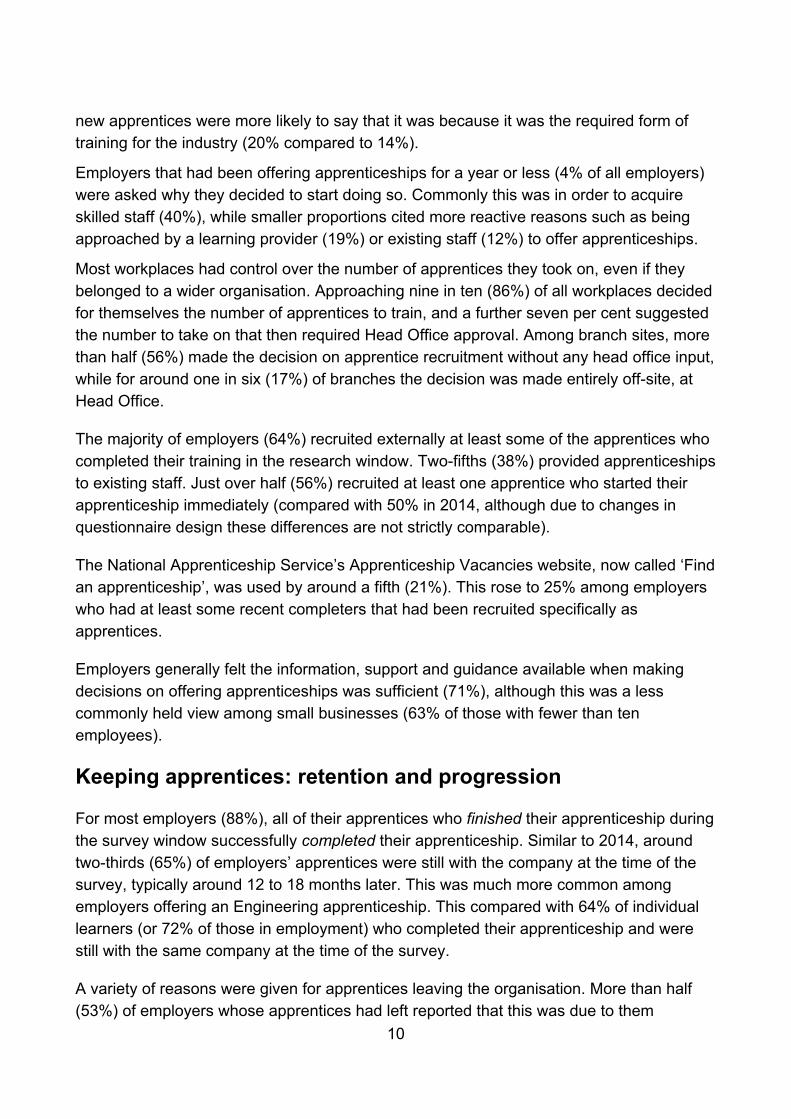
Keeping apprentices: retention and progression
For most employers (88%), all of their apprentices who finished their apprenticeship during the survey window successfully completed their apprenticeship. Similar to 2014, around two-thirds (65%) of employers’ apprentices were still with the company at the time of the survey, typically around 12 to 18 months later. This was much more common among employers offering an Engineering apprenticeship. This compared with 64% of individual learners (or 72% of those in employment) who completed their apprenticeship and were still with the same company at the time of the survey.
A variety of reasons were given for apprentices leaving the organisation. More than half (53%) of employers whose apprentices had left reported that this was due to them
10

receiving other or higher paid employment, in line with 2014. This was a more common outcome among individuals whose employers offered a Construction apprenticeship (66%). Just over seven in ten (71%) employers used fixed term contracts when recruiting a new apprentice, in line with 2014 (72%).
The availability of suitable progression routes beyond the apprenticeship are an important ingredient of the apprenticeship offer. Just over half (53%) of all employers offered any kind of qualification at Level 4 or above. A quarter (26%) offered Higher apprenticeships, while nearly one in seven (13%) offered Degree apprenticeships. However only 13% had actually had an apprentice proceed to a higher level apprenticeship. There was substantial variation in progression routes offered by framework, with those offering Health apprenticeships much more likely to offer and provide progression routes than others. Smaller businesses were also less likely to offer higher level qualifications.
A variety of reasons were given for not offering higher level qualifications, with the most common relating to a lack of demand from staff (24%), that is was not a requirement of the job (23%) or that there was a perceived lack of suitable qualifications available (23%).
New initiatives – Traineeships and Trailblazers
Traineeships were introduced in 2013 to provide work experience to young people not in work who need additional skills to get a job or an apprenticeship.
Approaching two-thirds (64%) of employers had heard of traineeships, while over two-fifths (43%) had at least some knowledge of what these entailed. Awareness and knowledge of traineeships was higher among larger employers, and those offering an Arts and Media, Health or Business framework.
The number of employers actively engaged in traineeships was much lower: only five per cent reported that the apprentices covered in the survey had undertaken a traineeship prior to their apprenticeship, although nearly one in five (19%) had participated in traineeships in some way. A further seven per cent of employers intend to offer traineeships in future.
The government also launched Trailblazer standards in 2013, with a view to these replacing the current apprenticeship frameworks over the next few years. These standards are being developed by employers, and thus enable them to influence the design of both training delivery and assessment, such that apprenticeships better meet the needs of industry.
A quarter (24%) of employers were aware of these standards, although only 12% had at least some knowledge of what they involved. Similar to traineeships, larger employers and those offering an Arts and Media or Business apprenticeship tended to have higher levels
11

of awareness and knowledge. A minority (6%) of employers had actually been involved in the Trailblazer standards in some way, rising to 19% of employers with 100 or more staff. While it is still quite early to determine the quality of these standards, over half (55%) of those involved considered Trailblazers to be an improvement on the current apprenticeship frameworks (25% felt it was too early to say).
Fewer than one in ten (8%) of all employers surveyed intended to offer Trailblazers within the next five years; however, this accounts for two-thirds (67%) of those employers aware of them.
Delivery, assessment, cost and influence of apprenticeship training
Most employers (94%) made use of an external training provider to deliver at least some of their apprenticeship training, consistent with 2014. There was little difference by framework.
Just under three-quarters (73%) of all employers provided formal training themselves, and here there was a greater variation by framework: nearly eight in ten (79%) employers with an Agriculture or Retail broad framework provided formal internal training sessions compared with just 59% of employers offering an Education framework.
Only one per cent of employers carried out the apprenticeship assessment themselves, rising to three per cent of sites with 100 or more employees.
Just over a quarter (27%) of employers who were employing apprentices at the time of the survey paid fees to a training provider, representing an increase of two percentage points from 2014 (25%). Employers offering apprenticeships in more “traditional frameworks” such as Construction and Engineering were much more likely to pay fees to a provider.
The majority (65%) of employers felt able to influence the content, delivery or duration of their apprenticeship training. Levels of influence before delivery of the apprenticeship were higher among those offering “newer” frameworks such as Arts and Media, as well as larger employers. Across all employers, 16% wanted more influence than they currently had over the content, delivery or duration of their training.
Recent apprenticeship policy in England has placed increased emphasis on developing maths and English skills. Such skills were deemed more important to employers offering “newer” frameworks such as Education (where 95% of employers regarded these skills as important) than more “traditional” frameworks like Construction (64%).
12

Satisfaction, benefits and future plans
Satisfaction levels with apprenticeships have increased since 2014, rising from 83% to 87%, although satisfaction varied widely by framework. Satisfaction was highest among those offering a Business apprenticeship, while the lowest levels of satisfaction occurred among employers offering Construction or Arts and Media frameworks.
Exploring specific aspects of the apprenticeship, employers were most satisfied with the quality of the assessment carried out by their provider (88%), how the provider offers training and / or assessment in a flexible way (86%), the quality of training (86%) and the support and communication from their provider (84%). There were lower levels of satisfaction regarding the quality of applicants (63%) and employers’ ability to influence structure, content, delivery and duration of the apprenticeship (65%).
High satisfaction levels were reflected in the proportion of employers who would recommend apprenticeships to others (83%). Just over a third (37%) would recommend apprenticeships to other employers without being asked.
Employers experienced a wide range of benefits as a result of training apprentices. Improved productivity, product or service quality, staff morale, staff retention and image in the sector, as well as generating new ideas, were all cited by at least two-thirds of employers, with improved productivity the most frequently cited benefit (76%).
The vast majority of employers remained committed to apprenticeships: 86% intended to continue offering apprenticeships in future, an increase from 79% in 2014. Some were also planning to expand their apprenticeship offer, with 25% of those intending to continue apprenticeships (or who were unsure) reporting that they would increase the number of apprenticeship places offered. A minority of employers intended to either decrease (4%) their apprenticeship numbers or stop altogether (6%). For these employers, nearly half (48%) attributed the change to needing to recruit or train fewer people, while 30% stated that they had decided to recruit or train in other ways. The regression analysis (shown in Appendix B) showed that the factor most closely associated with the decision to continue or expand apprenticeships was recent business growth.
13

2. Introduction
This report presents the findings from the 2015 Apprenticeships Evaluation Employer Survey, and sits alongside the accompanying Learner report. The research comprised 4,000 interviews with employers that had had individuals complete an apprenticeship between March and October 2014.
Summary of policy context
Apprenticeships are a flagship policy for Government. They both facilitate progression into employment for young people and provide relevant, work-related training that facilitates sustainable growth.
A wealth of policy developments and initiatives have been introduced recently to foster greater engagement with apprenticeships and to raise their quality. These include:
• The Specification of Apprenticeship Standards in England (SASE) in 2011. This set out minimum quality standards for all apprenticeships to adhere to.
• The launch of the Higher Apprenticeship Fund to accelerate the development of Higher apprenticeships.
• The Richard Review published in 2012. Core recommendations included giving employers greater control of apprenticeships, targeting apprenticeships at new recruits, refocusing apprenticeships on what individuals should know and be able to do at the end of their apprenticeship, and handing more purchasing power to employers.
• Rigour and Responsiveness in Skills (published in April 2013) identified a number of areas for change in the vocational skills system, and endorsed the Richard Review recommendation of putting employers at the heart of the system so that they set the standard for what completing an apprenticeship in that sector should entail, have much greater flexibility in deciding what training individuals need to get to that standard, and have real purchasing power so that they select the most appropriate provision.
• The Government’s Future of apprenticeships in England: Implementation Plan (October 2013) accepted the need to make apprenticeships employer-focused and employer-led, and set out how apprenticeships would be developed, undertaken and assessed in future.
• The current Government, in their Apprenticeships In England: Vision for 2020 (December 2015) has committed to supporting three million new apprenticeship starts by 2020. In order to fund this increase in the number and quality of
14

apprenticeships, the government announced in the Summer 2015 Budget the introduction of an apprenticeship levy, which will come into effect in April 2017.
Research aims
With annual public funding of £1.6bn in 2014/15 for the apprenticeship programme in England1, and the forthcoming apprenticeship levy aiming to raise £2.5bn to support apprenticeships in England by 2019-202, this research was commissioned to understand how the apprenticeship programme is working from employers’ point of view, and the extent to which it is delivering high quality training which meets the needs of employers and delivers the intended impacts.
The purpose of the Apprenticeship Evaluation Survey was therefore to monitor progress indicators and to develop understanding of the apprenticeship programme and the value it delivers to help understand the impact of recent policy reforms and to shape future development (and growth) of the programme.
This report explores employers’ experiences of offering apprenticeships: who they take on and to what types of apprenticeship; their motivations for offering apprenticeships; the way the apprenticeships are delivered; the outcomes for their apprentices; and the satisfaction of employers and their future intentions.
Summary of the methodology
The research comprised a telephone survey with 4,000 employers who had had individuals complete an apprenticeship between 1st March and 31st October 2014. Fieldwork took place between October 2015 and January 2016. To ensure comparability with previous studies, the research methodology closely followed that of the 2014 (and earlier) apprenticeship employer studies.
The Individualised Learner Record (ILR) was used to determine which employers were in scope for the survey. This also contained information on the number of apprentices who had completed an apprenticeship during the March to October 2014 period, as well as the framework and level of each individual’s apprenticeship. This information was used to stratify the sample. Results were weighted back to their representative employer profile for analysis purposes. More information on the fieldwork, sampling and weighting is available in Appendix A.
1 Skills Funding Agency (SFA), Annual Report and Accounts 2014/15, p65 (Jul 2015), BIS, Skills Funding Statement 2013-16, p26 (Feb 2014)
2 HM Government, Spending Review and Autumn Statement 2015, Section 1.33, p15 (2015)
15

Apprenticeship frameworks were grouped into the following classification groupings for sampling and reporting purposes. These are shown in the following table alongside the abbreviated description used for each throughout the report. A similar approach was taken in 2014, although for the current study Arts, Media & Publishing, and Education & Training have been separated out to reflect the growing number of apprentices undertaking these types of apprenticeships.
Table 2.1: Abbreviations of broad framework titles used in this report
The questionnaire was updated from 2014 to reflect recent policy changes, although the core measures that are used to track progress over time remained the same to provide comparability across years. New questions were added around employers’ use and views of the Apprenticeship Vacancies system (now called ‘Find an Apprenticeship’), and their attitudes towards academic qualifications such as maths and English GCSEs.
A number of recently developed initiatives were also covered, including Higher and Degree apprenticeships, traineeships and Trailblazers. There was also a revision to capture a more nuanced account of employers’ approach to recruiting apprentices. Apprentices who were recruited specifically to undertake an apprenticeship, but who may have undergone a trial period or other delay before actually starting their training were accounted for separately in the 2015 survey and data. In previous surveys it appears likely that this group were largely included by respondents among ‘existing employees’, or ‘internal recruits’.
Broad framework title Abbreviation
Agriculture, Horticulture & Animal Care Agriculture
Arts, Media & Publishing Arts and Media
Business, Administration & Law Business
Construction, Planning & the Built Environment Construction
Education & Training Education
Engineering & Manufacturing Technologies Engineering
Health, Public Services & Care Health
Information & Communication Technology ICT
Leisure, Travel & Tourism Leisure
Retail and Commercial Enterprise Retail
16

Reporting conventions
The survey upon which this report is based was carried out at site level; that is, both branch sites and head offices were interviewed. Where we refer to “employers” we are referring to a number of workplaces rather than a number of organisations, unless otherwise specified.
Throughout the report, unless otherwise specified, “recent apprentices” refers to apprentices who ended their training within the survey window for the evaluation, which covered eight months, from March to October 2014.
We also make reference to ‘traditional’ and ‘newer’ frameworks. Traditional frameworks, which for the purposes of this report (and in line with the previous 2014 Apprenticeship Evaluation) are taken to comprise the broad frameworks of Construction and Engineering, have had a long history of engagement with apprenticeships. All other frameworks are classified as ‘newer’.
17
3. Who employs apprentices?
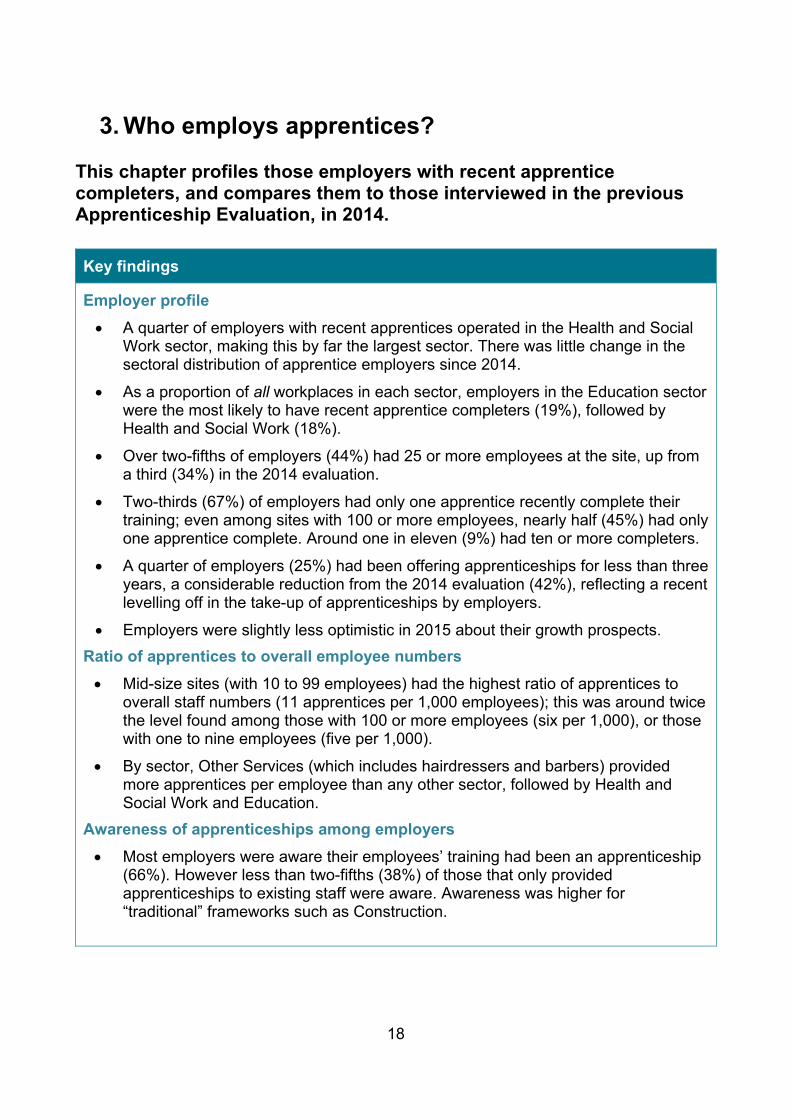
This chapter profiles those employers with recent apprentice completers, and compares them to those interviewed in the previous Apprenticeship Evaluation, in 2014.
Key findings
Employer profile • A quarter of employers with recent apprentices operated in the Health and Social
Work sector, making this by far the largest sector. There was little change in the sectoral distribution of apprentice employers since 2014.
• As a proportion of all workplaces in each sector, employers in the Education sector were the most likely to have recent apprentice completers (19%), followed by Health and Social Work (18%).
• Over two-fifths of employers (44%) had 25 or more employees at the site, up from a third (34%) in the 2014 evaluation.
• Two-thirds (67%) of employers had only one apprentice recently complete their training; even among sites with 100 or more employees, nearly half (45%) had only one apprentice complete. Around one in eleven (9%) had ten or more completers.
• A quarter of employers (25%) had been offering apprenticeships for less than three years, a considerable reduction from the 2014 evaluation (42%), reflecting a recent levelling off in the take-up of apprenticeships by employers.
• Employers were slightly less optimistic in 2015 about their growth prospects. Ratio of apprentices to overall employee numbers • Mid-size sites (with 10 to 99 employees) had the highest ratio of apprentices to
overall staff numbers (11 apprentices per 1,000 employees); this was around twice the level found among those with 100 or more employees (six per 1,000), or those with one to nine employees (five per 1,000).
• By sector, Other Services (which includes hairdressers and barbers) provided more apprentices per employee than any other sector, followed by Health and Social Work and Education.
Awareness of apprenticeships among employers • Most employers were aware their employees’ training had been an apprenticeship
(66%). However less than two-fifths (38%) of those that only provided apprenticeships to existing staff were aware. Awareness was higher for “traditional” frameworks such as Construction.
18

Sector and size profile
The sector profile of employers with recent apprentices remained broadly unchanged from 2014. As in 2014 Health & Social Work was the single largest sector, covering a quarter (24%) of apprentice employers. Other prominent sectors included the Wholesale and Retail sector (12%), Education (11%), Other Services (10%, of which a large component is hairdressing and barbering), Manufacturing (9%), and Accommodation / Food Service (9%).
The chart below shows employers of apprentices broken down by sector and also provides a breakdown within those sectors into commercial, public sector and third sector employers. As can also be seen in the chart, employers providing apprenticeships tended to be mostly in the commercial sector (79%, as in 2014). Employers of apprentices in the public sector (11% of apprentice employers) tended to be in specific sectors – Education, Health & Social Work and Public Administration & Defence. Those in the third sector (8% of apprentice employers) were found mostly in Health & Social Work, Education, and Arts & Entertainment.
Figure 3.1: Sector profile of employers with recent completers
19

The grey italics on the chart above show the percentage of all workplaces in each sector that had recent Level 2 or 3 apprentices 3. The sectors where apprenticeships were provided by a particularly large proportion of employers were Education (19%), Health & Social Work (18%), and Other Services (12%). Meanwhile the Wholesale & Retail sector (despite making up 12% of employers with apprentices) was heavily under-represented, with only an estimated three per cent of all employers in the sector with recent apprentice completers.
Over two-fifths of employers with recent apprentices (44%) were found to have 25 or more employees at the site interviewed, up from a third (34%) in the 2014 evaluation.
Number of apprentices
Most employers (67%) had only one apprentice recently complete their training. Although this is partly because the population of employers offering apprenticeships is dominated by small companies, it is clear that even on large sites with 100 or more employees, a substantial proportion (45%) had only one recent apprentice completer, and less than a tenth (9%) had ten or more.
3 ONS IDBR (Inter-Departmental Business Register), March 2014, combined with survey data to produce a figure for the proportion of employers (at a workplace level) which had apprentices complete their training in the survey window (March - October 2014). For example, weighted survey results (which used the ILR as the basis for the weighting) show that there were 9,070 sites in the education sector with apprentices completing their training at Level 2 or 3 in the survey window. ONS IDBR data shows that this represented 19% of the 47,477 sites in this sector in March 2014.
20

Figure 3.2: Number of recent apprentice completers: by size of site
It is also useful to consider the number of apprentices that employers have compared to the number of employees. Comparing the number of recent apprentices with the number of employees at the time of the survey, the number of apprentices per 1,000 employees varied from 263 at sites with two to nine employees to just 17 at sites with 100 or more employees.
However, this does not provide a full picture of the relative participation in apprenticeships of different sizes of employer, because it excludes those sites with no recent apprentices at all. To take these employers into account, IDBR data can be used alongside survey data to show the proportion of all sites of each size that had recent apprentices, shown in the third column of table 3.1 overleaf. A much larger proportion of sites with 100 or more employees (32%) had apprentices than sites with two to nine employees (2%). In other words, although small employers who did recruit apprentices recruited a much larger number in comparison to their size, they were far less likely to recruit in the first place.
21

The final column brings this information together to show the number of apprentices per 1,000 current employees at the average workplace of this size across England, taking into account those without any recent apprentice completers4. This shows that it was the mid-size sites (10 to 99 employees) which tended to have the largest proportion of apprentices; around twice that found among large sites with 100 or more employees.
Table 3.1: Number of recent apprentices as a proportion of employees
Employers with recent apprentices (survey results)
All employers (sites with and without apprentices)
Employees at site 2015 survey profile
Apprentices* per 1,000
employees
% of all workplaces of this size with
apprentices*
Apprentices* per 1,000
employees
Base: site size known (3,916) (3,916) (3,916) (3,916)
2 to 9 24% 263 2% 5
10 to 24 30% 105 11% 12
25 to 99 31% 51 21% 11
100+ 13% 17 32% 6
TOTAL 100% 116 6% 6 * Apprentices completing framework in survey window (March to October 2014) vs current employees
This clearly has potential policy implications, showing that the burden of funding and training apprentices currently falls particularly upon those mid-sized businesses with 10 to 99 employees; if the intensity of apprenticeship usage among these mid-sized organisations could be equalled among large businesses with 100 or more employees, this could yield large increases in the number of apprentices nationally.
A similar analysis by sector is shown in the following chart. The hollow bars show the number of recent apprentices per 1,000 current employees in each SIC2007 sector amongst those employers with recent apprentices. The solid bars take into account the estimated proportion of employers with no recent apprentices (again using IDBR data) to
4 For example, weighted survey results (which used the ILR as the basis for the weighting), showed 20,600 sites with 2 to 9 employees with apprentices completing within the survey window. ONS IDBR data shows that this represented only 2% of the 1,097,000 sites of this size in England. The sites surveyed had 263 apprentices per 1,000 employees; multiplied by the proportion of sites with apprentices at all (2%) this suggests that, overall, sites of this size in England employed five apprentices (263 × 2% = 5) per 1,000 employees.
22
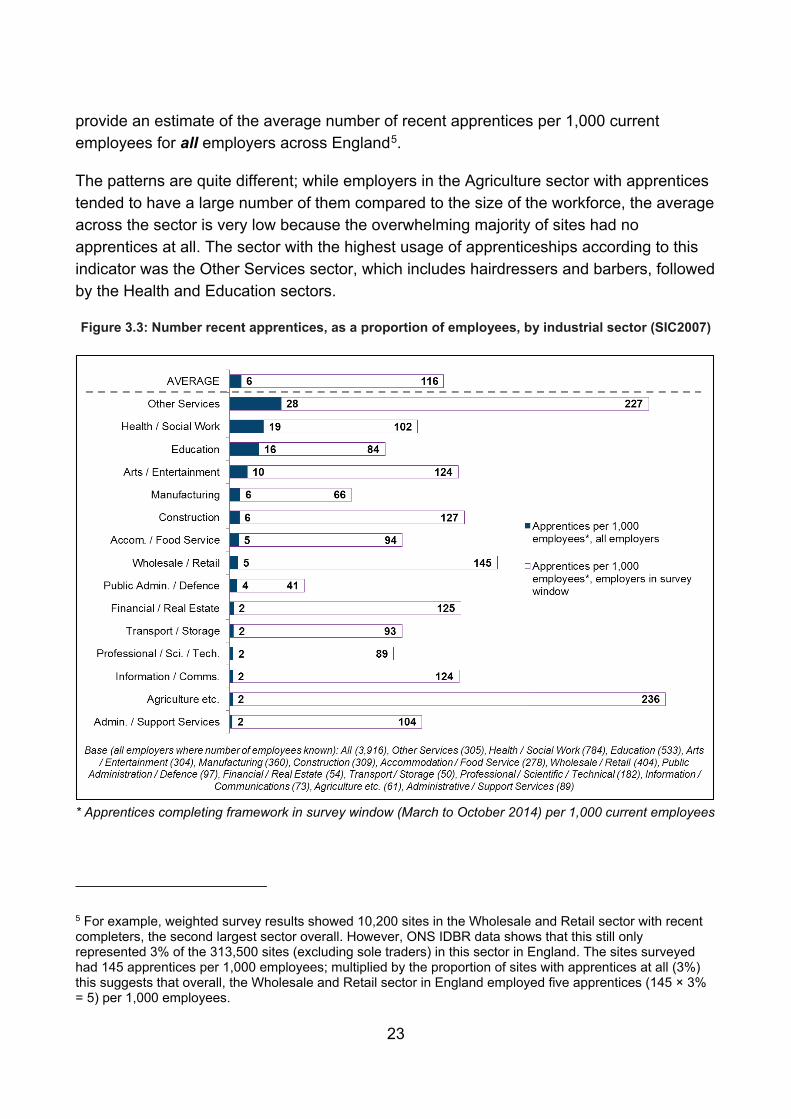
provide an estimate of the average number of recent apprentices per 1,000 current employees for all employers across England5.
The patterns are quite different; while employers in the Agriculture sector with apprentices tended to have a large number of them compared to the size of the workforce, the average across the sector is very low because the overwhelming majority of sites had no apprentices at all. The sector with the highest usage of apprenticeships according to this indicator was the Other Services sector, which includes hairdressers and barbers, followed by the Health and Education sectors.
Figure 3.3: Number recent apprentices, as a proportion of employees, by industrial sector (SIC2007)
* Apprentices completing framework in survey window (March to October 2014) per 1,000 current employees
5 For example, weighted survey results showed 10,200 sites in the Wholesale and Retail sector with recent completers, the second largest sector overall. However, ONS IDBR data shows that this still only represented 3% of the 313,500 sites (excluding sole traders) in this sector in England. The sites surveyed had 145 apprentices per 1,000 employees; multiplied by the proportion of sites with apprentices at all (3%) this suggests that overall, the Wholesale and Retail sector in England employed five apprentices (145 × 3% = 5) per 1,000 employees.
23

Clearly this too has policy implications, potentially enabling the targeting of sectors where there is greatest growth potential, both in terms of the volume of apprentices recruited by an employer once engaged with the apprenticeship programme, as well as the proportion of employers using the programme at all.
Length of time offering apprenticeships
A quarter of employers with recent apprentices (25%) had been offering apprenticeships for less than three years, a considerable reduction on the figure from the 2014 evaluation (42%), reflecting a recent levelling off in take-up of apprenticeships among businesses not previously participating in the scheme6.
Just over half of employers surveyed had been offering apprenticeships for more than five years (53%). There was considerable variation by broad frameworks provided, as shown in the chart below. The “traditional” broad frameworks (Construction and Engineering) show the highest proportion of sites offering apprenticeships for more than ten years, at about half (48% and 50% respectively). Meanwhile, in some other broad frameworks (Arts and Media, ICT, Education and Business) a third or more of the employers with recent apprentices have become involved only in the last three years or so.
6 The most recent Statistical First Release: Education and Skills (based on ILR data) shows a steady increase in the number of workplaces with apprenticeships, but at a slowing rate of increase (2010/11: 173,600; 2011/12: 204,800; 2012/13: 228,700; 2013/14: 240,900; 2014/15: 252,300).
24

Figure 3.4: Length of time offering apprenticeships, by all broad frameworks provided
Growth outlook
Private sector employers employing apprentices were asked about the general outlook for their business in growth terms. They were slightly less optimistic in the 2015 evaluation than in 2014; three-fifths (59%) of employers expected growth compared to two-thirds (66%) in 2014. Only a very small proportion (3%) expected the business to contract, and most of those (2%) felt it would contract only slightly; only one per cent believed their company would contract significantly.
Table 3.2 below shows employers’ growth expectations by the number of employees at the organisation; larger companies were much more optimistic about growth than smaller organisations. There was also substantial variation by sector; for example businesses in Information & Communications (81%) or Financial & Real Estate (81%) were more than twice as likely to expect growth as businesses in Agriculture (35%), with all other sectors within a few percent of the England average.
25
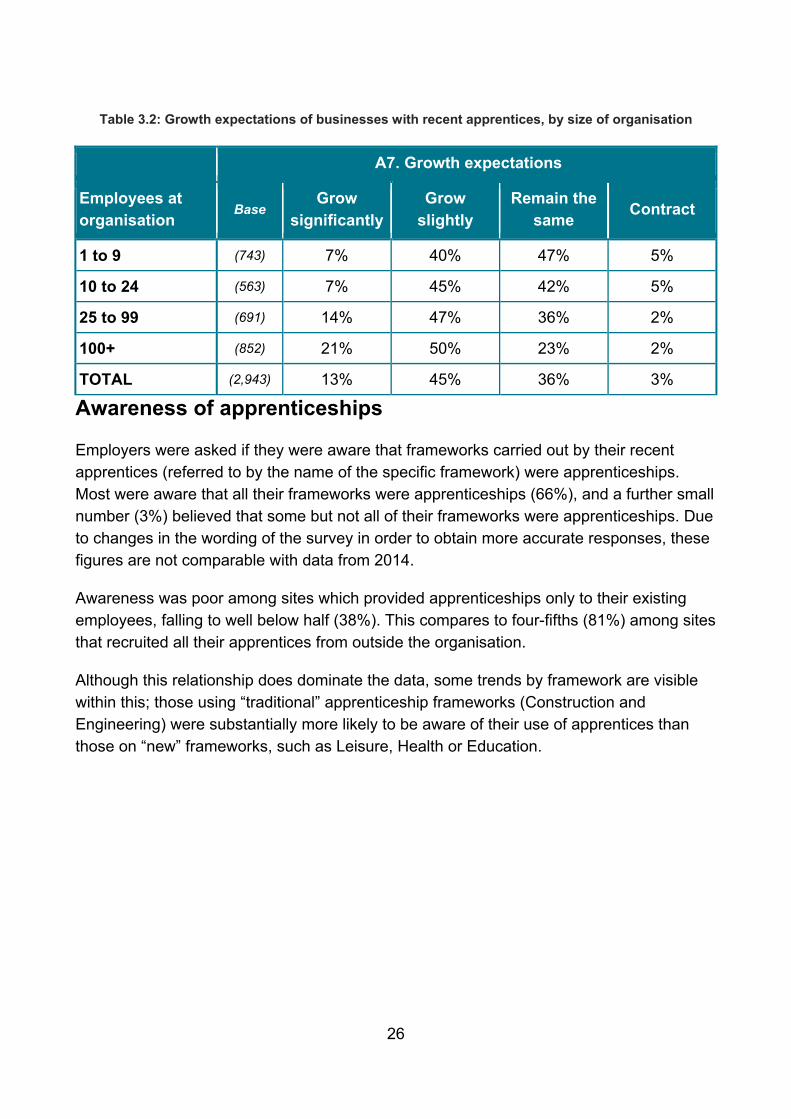
Table 3.2: Growth expectations of businesses with recent apprentices, by size of organisation
A7. Growth expectations
Employees at organisation
Base Grow
significantly Grow
slightly Remain the
same Contract
1 to 9 (743) 7% 40% 47% 5%
10 to 24 (563) 7% 45% 42% 5%
25 to 99 (691) 14% 47% 36% 2%
100+ (852) 21% 50% 23% 2%
TOTAL (2,943) 13% 45% 36% 3%
Awareness of apprenticeships
Employers were asked if they were aware that frameworks carried out by their recent apprentices (referred to by the name of the specific framework) were apprenticeships. Most were aware that all their frameworks were apprenticeships (66%), and a further small number (3%) believed that some but not all of their frameworks were apprenticeships. Due to changes in the wording of the survey in order to obtain more accurate responses, these figures are not comparable with data from 2014.
Awareness was poor among sites which provided apprenticeships only to their existing employees, falling to well below half (38%). This compares to four-fifths (81%) among sites that recruited all their apprentices from outside the organisation.
Although this relationship does dominate the data, some trends by framework are visible within this; those using “traditional” apprenticeship frameworks (Construction and Engineering) were substantially more likely to be aware of their use of apprentices than those on “new” frameworks, such as Leisure, Health or Education.
26

Figure 3.5: Awareness that the framework is an apprenticeship, by all broad frameworks provided
81%
88%
88%
87%
87%
82%
81%
75%
74%
71%
67%
40%
64%
61%
69%
53%
40%
41%
Insufficient Sample (4)
31%
40%
37%
AVERAGE
Construction
Engineering
Agriculture
ICT
Business
Retail
Arts and Media
Education
Health
Leisure
Any new recruits
Any existing employees
Base (all employers): Construction, new recruits (315); Construction, existing (63); Engineering, new recruits (429); Engineering, existing (136); Agriculture, new recruits (205), Agriculture, existing (84); ICT, new recruits (199); ICT, existing (84); Business, new recruits (711);
Business, existing (572); Retail, new recruits (423); Retail, existing (355); Arts and Media, new recruits (55), Education, new recruits (151), Education, existing (76), Health, new recruits (478), Health, existing (375), Leisure, new recruits (162), Leisure, existing (142)
27
4. What types of apprenticeships are on offer?
Apprenticeships were offered in a wide variety of subjects and at a range of levels; this chapter explores the variety of training provided.
Key findings
Broad Frameworks provided • There was little change in the broad frameworks provided from the 2014
evaluation, with a third (34%) providing Business frameworks, and just under a quarter providing Health (23%) and Retail (22%).
• Most employers (90%) provided only one broad framework.
• Two-thirds (65%) of employers provided apprenticeships at Level 2, and half (49%) some at Level 3. Only one in seven (14%) provided both, although this rose to two-thirds (66%) among those with six or more apprentices.
• The Construction broad framework mostly involves Level 2 apprenticeships, while in Arts and Media, Education and ICT most apprenticeships are at Level 3.
Types of apprentice • Most employers offer apprenticeships to those aged 19 to 24 (80%) or under 19
(74%). In “traditional” apprenticeship subjects (Construction and Engineering) there was more focus on apprentices aged under 19.
• Apprentices at organisations providing apprenticeships to existing employees rather had a very different age profile of apprentices to those providing them to new recruits. Those targeting existing employees were much more likely to provide them to people aged over 25 (70% compared to 34%), and much less likely to provide them to people aged under 19 (57% compared to 86%) than those recruiting from outside.
• A third of employers who do not offer apprenticeships to people aged under 19 feel they could not employ people of this age in their workplace (34%, rising to almost half (46%) amongst those providing Health frameworks.
Broad frameworks
The hundreds of frameworks of apprenticeship available are classed into ten ‘broad frameworks’ by the National Apprenticeship Service, reflecting the broad subject area of the training. Data on which frameworks employers had provided was taken from the ILR, which records all apprenticeships carried out in England. As in 2014, three broad frameworks stood out as being particularly widespread.
A third of employers (34%) provided Business frameworks to recent completers, while just under a quarter provided each of Health (23%) and Retail (22%). Two other broad
28

framework groups were also fairly common – Engineering (13%) and Construction (7%). As shown in the table below, the changes from 2014 were minimal.
Table 4.1: Employers with broad frameworks with recent apprentices
Broad frameworks with recent apprentices
Broad framework % of employers Number of employers 2014 % of employers
Agriculture 3% 2,400 3%
Arts and Media 0% 300 n/a
Business 34% 29,200 34%
Construction 7% 6,100 9%
Education 2% 2,000 n/a
Engineering 13% 11,300 10%
Health 23% 19,200 22%
ICT 3% 2,500 3%
Leisure 3% 2,700 3%
Retail 22% 18,800 23%
TOTAL 100% 84,800 100% Source: Individualised Learner Record (2014/15)
Specific frameworks
The framework groupings shown in the previous table are, by their nature, quite broad, and often contain a wide range of specific frameworks. For context, the chart below shows the largest individual frameworks within each broad framework grouping, again based on the ILR extract used to weight the survey data.
The largest single specific framework is Business and Administration, involving 13,000 employers (15% of employers with apprentices), followed by Health and Social Care (10,100 or 12%). Four other frameworks involve more than 5,000 employers: Management (8,900 or 10%), Customer Services (7,700 or 9%), Children & Young People’s Workforce (6,400 or 8%), and Hairdressing (5,200 or 6%). There are also hundreds of smaller frameworks, some involving just a handful of employers.
29

Figure 4.1: Specific frameworks within broad frameworks; all recent apprentices
Source: Individualised Learner Record (2014/15)
Broad frameworks – frameworks provided, and the main broad framework used
Most employers (90%) provided frameworks in only one broad framework group, exactly in line with 2014. The remaining ten per cent of employers were asked which framework they considered to be most important to their business, which we refer to in this report as the “main” framework. The chart below shows that some broad framework types were much more likely to be used as secondary frameworks than others, in line with the 2014 evaluation.
In particular, Arts and Media (25%), ICT (19%) and Business frameworks (17%) were more likely than average to be used as secondary frameworks, where the employer also provided another framework which they considered more important. This reflects, in part, their applicability to a wide range of businesses in a supporting role. Meanwhile, few employers which provided “traditional” broad frameworks offered any other broad frameworks, especially in Construction (6%) and to a lesser extent in Engineering (11%).
30

Figure 4.2: Use of broad frameworks as the only, main or secondary broad framework
For the remainder of this report, and in line with reports from previous years, we report on the basis of main broad framework, rather than including secondary frameworks.
The chart below compares the proportion of employers providing each broad framework at all with the proportion identifying each as their main broad framework. Although other frameworks are also frequently used as a secondary broad framework (as shown above, Arts and Media and ICT) the main difference in the overall distribution is in the Business, Administration & Law framework, mainly due to its large size.
31

Figure 4.3: Broad frameworks provided, and the ‘main’ broad framework
Level of apprenticeship
For around two-thirds (65%) of employers, at least one of their recent completers was at Level 2, slightly down on the figure for 2014 (68%). Around half (49%), had an apprentice completer at Level 3, broadly in line with 2014 (51%).
There was an overlap between these groups, with about one in seven (14%) having apprentice completers at both levels, a slight reduction on 2014 (18%). This leaves about half of employers (51%) who only had completers at Level 2, and a third (35%) who only had completers at Level 3. As might be expected, the proportion of employers that offered each level increased with the number of apprentices employed; of those with six or more apprentices, two-thirds (66%) had apprentices complete training at both levels.
Not having a recent completer at a particular level does not mean the employer did not offer that level of apprenticeship at all. Given the length of apprenticeships, a minority of apprentices at a company would be expected to complete their training within the eight month survey window which was the basis for the fieldwork.
As shown below, about a third (34%) of those employers surveyed had apprentices at both Level 2 and Level 3 at the time of the survey, between October and December 2015; only
32

two-fifths (38%) had apprentices only at Level 2 and fewer (28%) had apprentices only at Level 3.
Figure 4.4: Levels provided to recent apprentices and at the time of the survey
There was considerable variation in levels of apprenticeships provided by main broad framework, as shown in the chart below. The Construction broad framework was particularly dominated by Level 2 apprenticeships, as were, to a lesser extent, Agriculture and Retail. Meanwhile, the Arts and Media, Education and ICT broad frameworks were dominated by Level 3 apprenticeships.
33

Figure 4.5: Levels of apprenticeship studied, by main broad framework
Age groups
Most employers offer apprenticeships to those aged 19 to 24 (80%, an increase compared with the 75% in 2014) or under 19 (74%). This represents a substantial increase on the 2014 findings (65%), and a small but significant increase on the 2013 findings (71%). The proportion of employers offering apprenticeships to those aged over 25 remained steady, at about half (46%), not significantly changed from 2014 (47%). One in six employers (16%) offered apprenticeships only to those aged under 19; but it was comparatively rare to offer them exclusively to older age groups.
The chart below shows the age groups apprenticeships were offered to by main broad framework. As can be seen there was a greater focus on offering apprenticeships to under 19 year olds in Construction (90%, and 28% offer them just to this age group), Engineering (89% offer, 29% exclusively), and Agriculture (86% offer, 26% exclusively).
Although the Retail broad framework also shows a focus on under 19s, this is almost exclusively due to the Hairdressing and Barbering specific frameworks (97% offer to under 19s, 36% exclusively), rather than the remainder of the frameworks in that group (64% offer to under 19s, 10% exclusively). The Education broad framework shows the opposite trend to those mentioned above; only half (54%) offer apprenticeships to under 19s at all,
51%
71%
65%
65%
56%
50%
41%
30%
27%
25%
23%
35%
24%
25%
29%
32%
42%
37%
44%
64%
73%
62%
14%
5%
10%
6%
13%
8%
22%
26%
9%
1%
15%
AVERAGE
Construction
Retail
Agriculture
Business
Engineering
Leisure
Health
ICT
Arts and Media
Education
Level 2 only Level 3 only Level 2 and Level 3
Base (all employers): All (4,000), Construction (345), Retail (645), Agriculture (270), Business (854), Engineering (495), Leisure (240), Health (720), ICT (179), Arts and Media (51), Education (201)
34

and a high proportion relative to other frameworks offer them exclusively to over 25s (11%).
Figure 4.6: Age groups apprenticeships offered to, by main broad framework
Those employers who recruited apprentices as new employees from outside the organisation tended to have younger apprentices; nearly all (86%) had at least some apprentices aged under 19, compared to just over half (57%) of those who provided apprenticeships to existing employees. Employers who provided apprenticeships to existing employees were much more likely to have older apprentices – nearly three-quarters (70%) provided them to people aged 25 or over when the apprenticeship started, compared to just a third (34%) among those who provided apprentices to new recruits.
35

Figure 4.7: Age groups apprenticeships offered to, by sources of apprentice
About a quarter of employers who do not offer apprenticeships to under 19s (28%) said they would be open to offering an apprenticeship to someone of this age if a suitable applicant applied.
The dominant obstacle to offering apprenticeships to under 19 year olds was that they could not employ people of this age in the workplace (34%, similar to the 36% in 2014). This response was particularly prevalent among those using the Health main broad framework (46%).
A smaller proportion (8%) mentioned they would offer apprenticeships to 16-18 year olds if there was financial assistance to pay their wages – a viewpoint which was particularly prevalent (20%) among companies which were static or shrinking in size, as well as in the Education main broad framework (21%).
36

Figure 4.8: What could persuade you to offer apprenticeships to under 19s
37

5. Why and how were apprentices recruited?
This chapter explores why employers offered apprenticeships, the means used to find/recruit apprentices, and why they had recruited apprentices in this way.
Key findings
The decision to offer apprenticeships • When asked to pick a single reason from a list as to why they recruit apprentices,
the most frequently chosen was that apprenticeships were the most relevant form of training to the needs of the business (31%). Other frequently chosen reasons were the convenience of having the training provider handle recruitment (19%), that apprenticeships were the required form of training in the industry (18%) and their being the best way to aid recruitment (17%).
• In nearly all cases (93%), when deciding the number of apprenticeships to provide, the initiative is taken by the site where the apprenticeship takes place.
Who to recruit and how • Two-thirds of employers (64%) had recruited externally for at least some of their
recent apprentices, while relatively few (38%) had provided apprenticeships to existing staff. A small minority (5%) had provided training to both groups, rising to 31% among those with 10 or more apprentices.
• Just over half (56%) recruited at least one apprentice who started their training straight away, suggesting a modest increase on the 2014 evaluation (50%), while ten per cent recruited someone specifically for an apprenticeship, but whose training did not start immediately.
• A fifth (21%) used the Apprenticeship Vacancies website. Most users (60%) rated the website more than six out of ten, while just over a third (37%) rated it eight out of ten or better.
• Most employers felt that there was sufficient information, support and guidance available to employers interested in offering apprenticeships (71%, down slightly from 73% in 2014); however, smaller organisations are more likely to experience a lack of information, support or guidance.
• The two most commonly mentioned issues were a lack of information on how to recruit apprentices (20%) and how to find funding (19%).
38

Why offered apprenticeships rather than other forms of training
Employers who were aware that the training recently completed by their staff was an apprenticeship were presented with a list of common reasons for offering apprenticeships, and asked which one best described why they had offered these staff apprenticeships rather than some other form of training.
The most frequently chosen reason was that apprenticeships were the most relevant form of training to the needs of the business (31%, an increase on 25% in the 2014 evaluation). Other frequently chosen reasons were the convenience of having the training provider handle recruitment (19%), that apprenticeships were the required form of training in the industry (18%) and their being the best way to aid recruitment and retention (17%). Fewer chose to use apprenticeships rather than some other form of training for these staff because of cost (10%). A small number rejected all these possibilities, and said instead (unprompted) that they offered apprenticeships for altruistic reasons of helping the community or young people (2%).
As shown in Figure 5.1, there was substantial variation by main broad framework. For the Construction, Engineering and Retail broad frameworks, apprenticeships were often chosen over other forms of training because they were seen as a required form of training in the industry (35%, 30% and 26% respectively). In these sectors, cost and convenience were relatively rarely the key reasons for offering apprenticeships.
Cost was a particularly important factor for Education (21%) and ICT (21%) broad frameworks, and also in the public sector (13%) and third sector (17%) more than the commercial sector (9%). Convenience, in terms of the training provider handling recruitment of the apprentices, was seen of particular importance in Education (25%), ICT (25%) and Business (24%). Apprenticeships aiding recruitment and retention was most often the reason for having offered apprenticeship training to staff ahead of other forms of training in Business (20%) broad frameworks, but was rarely the key factor in Education (6%).
39

Figure 5.1: Single most important reason for offering apprenticeships over other forms of training, by main broad framework (prompted)
It might be expected that those employers who provided apprenticeships to existing employees would have a different set of reasons to those who recruited new employees as apprentices. However, the differences were relatively small, although still significant. Generally, those who recruited new employees as apprentices were more likely to say that they were motivated to provide apprenticeships by their being the required type of training in their industry (20%) than to those providing apprenticeships to existing employees (14%). Conversely, those who recruited existing employees were slightly more likely to mention relevance to the needs of the business (35% compared to 31%) and convenience (22% compared to 18%).
There was also substantial variation by workplace size. In relative terms, large employers with 100 plus staff at the site placed particular emphasis on the needs of the business (38%) and on it aiding recruitment and retention (23%), while small workplaces with fewer than ten employees were more influenced by convenience (23%, twice the proportion of large employers mentioning this factor) and it being the norm in their sector (23%).
18%
35%
30%
26%
17%
14%
7%
6%
6%
6%
5%
10%
4%
3%
8%
9%
14%
18%
19%
16%
21%
21%
31%
27%
31%
34%
33%
30%
35%
33%
30%
29%
25%
17%
15%
15%
15%
18%
12%
15%
14%
20%
6%
18%
19%
15%
17%
15%
18%
23%
20%
20%
24%
25%
25%
2%
1%
1%
2%
3%
1%
3%
3%
9%
4%
AVERAGE
Construction
Engineering
Retail
Health
Agriculture
Leisure
Arts and Media
Business
Education
ICT
Apprenticeships are the required form of training for our industryThey cost us less than the alternativesThey are most relevant to the needs of our businessThey are the best way to aid recruitment and retentionThey are the most convenient because training provider handles most of the recruitmentWant to help the local community / young people (unprompted)
Base (employers aware that the training is an Apprenticeship): All (2,874), Construction (306), Engineering (426), Retail (432), Health (438), Agriculture (211), Leisure (141), Arts and Media (47), Business (595), Education (126), ICT (152)
40

Figure 5.2: Single most important reason for offering apprenticeships over other forms of training, by size of site (prompted)
Reasons for having recently started to offer apprenticeships
Workplaces that had been offering apprenticeships for a year or less (4% of all employers) were asked why they decided to start doing so. The most common reason was they believed it a good way to get skilled staff (40%). Smaller proportions gave their reason as having been approached by a learning provider (19%), by existing staff (12%), or being motivated by wanting to help young people (9%), or hearing about a grant (9%).
Where the decision on the number of apprentices to take on is made
At most workplaces the decision on the number of apprentices to train was made exclusively by those working at the site itself (86%), and at nearly all (93%) the number was at least suggested by the site, even if Head Office approval was also needed.
Looking only at branch sites (i.e. branches of multi-site organisations that were not head offices), more than half made the decision on apprenticeship recruitment without any head office input (56%), while at around one in six (17%) of branches was the decision made
18%
23%
19%
16%
13%
10%
10%
11%
10%
10%
31%
27%
32%
30%
38%
17%
12%
17%
18%
23%
19%
23%
17%
22%
11%
2%
1%
2%
1%
4%
AVERAGE
1 to 9 employees
10 to 24 employees
25 to 99 employees
100+ employees
Apprenticeships are the required form of training for our industryThey cost us less than the alternativesThey are most relevant to the needs of our businessThey are the best way to aid recruitment and retentionThey are the most convenient because training provider handles most of the recruitmentWant to help the local community / young people
Base (employers aware that the training is an Apprenticeship): All (2,874), 1 to 9 employees at site (787), 10 to 24 employees at site (747), 25 to 99 employees at site (785), 100+ employees at site (526)
41

entirely off-site at Head Office. At the remainder (24% of branches) the decision was made locally but approved elsewhere.
In total, just an eighth of all employers (12%) relied to some extent on decisions from head office (5% said head office set the number and 7% said head office approval of their suggestions were needed), down slightly from 15% in the 2014 evaluation. These results suggest the importance of marketing and providing support both at the site and the head office level within large multi-site organisations.
Figure 5.3 Where decisions on numbers of apprentices to take on made
New recruits and existing employees
There has been much debate around the impact and value of apprenticeships offered to existing employees of an organisation, and concern that they only or mainly serve to accredit existing skills. The Future of Apprenticeships in England: Implementation Plan, published in October 2013, for example made clear that:
“Apprenticeships will remain an all-age programme, with each apprentice undertaking a stretching programme which will lead to genuine skills gain, not to the accreditation of existing skills. Apprenticeships will be available to new and existing employees, but should only be
42

offered to the latter where substantial training is required to achieve competency in their occupation.”
For this reason, whether apprentices are mostly new recruits or existing employees is an area of particular interest for policy-makers. In the 2014 evaluation, apprentices were broken down into those who were already working for the employer when the apprenticeship started (53%), and those who were recruited directly onto the apprenticeship (50%), with a small overlap (4%) where an employer had both types.
However, a drawback of this approach was that the ‘existing employees’ group potentially included a large minority who had been recruited specifically to carry out an apprenticeship, but for whom the start of training had been delayed. Others may have been new recruits who were deliberately recruited on a trial basis, pending entry to an apprenticeship, thus by the time they started their apprenticeships were considered to be an existing employee. The 2015 employer survey therefore sought to provide a more nuanced understanding of the new recruit vs. existing employee dichotomy and to differentiate between these groups by adding a third category, of those who were recruited with the intention that they would start an apprenticeship, but the training didn’t start immediately.
The 2015 evaluation found that just over half (56%) of those employers who recently provided apprenticeships provided them to people who were recruited specifically to start an apprenticeship, with the training starting straight away. A smaller group of employers (9%) had provided apprenticeships to people who were recruited with the intention that they would start an apprenticeship, but the training didn’t start immediately. Around two-fifths (38%) provided apprenticeships to existing employees that were already working for them, excluding any recruited with the intention of starting an apprenticeship.
These three groups do overlap significantly; as shown in Figure 5.4 below, nearly two-thirds of employers (64%) had recruited some apprentices specifically for their apprenticeship, whether it started straight away or not, and around three-fifths (58%) exclusively recruited apprentices from outside the organisation. While as previously discussed two-fifths (38%) provided apprenticeships to existing employees not recruited with an apprenticeship in mind (38%), only a third (33%) sourced apprentices only in this way. This breakdown, between those sourcing apprentices internally, externally or both, is used for the sub-group analysis shown in subsequent charts.
43

Figure 5.4: Sources of recent apprentices: all employers
Among the nine per cent of employers where training of someone recruited as an apprentice did not start straight away, the main reason for this was the need for a probation period (40%, rising to 51% in the public sector), followed by delays on the part of the training provider (26%, rising to 48% in the “traditional” broad frameworks of Construction and Engineering), giving the employee time to settle in (16%), and to ensure the employee is suitable before committing (14%).
Of those who provided apprenticeships to existing employees, about two-fifths (42%) were doing this to prepare the employee for a new job; just over half (57%) were doing this only to improve skills in an existing job. This latter approach was taken by two-thirds of those with less than ten employees (64%) who provided an apprenticeship to an existing employee, and was also more likely than average among those offering apprenticeships only to the over 19s (67%) or over 25s (81%).
As shown in the chart below, the source of apprentices varied significantly the number of recent apprentices the employer had. Those with more apprentices were of course more likely to recruit both externally and internally.
44

Figure 5.5: Sources of recruitment for recent apprentice completers, by number of recent apprentices
33%
32%
30%
30%
33%
5%
8%
21%
31%
64%
62%
55%
46%
34%
AVERAGE
One apprentice
Two apprentices
3 to 9 apprentices
10 or moreapprentices
Existing employees only Both Recruited specifically only
Base (all employers): All (4,000), 1 apprentice (2,382), 2 apprentices (701), 3 to 5 apprentices (495), 6 to 9 apprentices (126), 10 or more apprentices (296)
45

As shown in the Figure 5.6 below, the source of apprentices varied significantly by broad framework; those in Arts and Media (95%) and the “traditional” broad frameworks of Construction (82%) and Engineering (78%) were much more likely than average to recruit new employees for apprenticeships. Meanwhile, in “new” frameworks the proportion fell to around half or less in some cases, most noticeably in Leisure (44%), hence here there is relatively greater emphasis on training existing employees through apprenticeships.
Figure 5.6: Sources of recruitment for recent apprentice completers, by broad framework
Results varied quite dramatically within these broad groupings by specific framework. For example, nearly four-fifths (77%) of employers who used mainly Hairdressing or Barbering frameworks only provided them to new recruits.
33%
43%
42%
40%
33%
32%
23%
15%
13%
12%
3%
5%
8%
4%
4%
11%
5%
2%
3%
3%
3%
2%
58%
44%
52%
52%
51%
57%
70%
78%
82%
82%
95%
AVERAGE
Leisure
Retail
Business
Health
Education
Agriculture
Engineering
ICT
Construction
Arts and Media
Existing employees only Both Recruited specifically only
Base (all employers): All (4,000), Leisure (240), Retail (645), Business (854), Health (720), Education (201), Agriculture (270), Engineering (495), ICT (179), Construction (345), Arts and Media (51)
46

Apprenticeship vacancies
A fifth (21%) of all employers have used the Apprenticeship Vacancies website, rising to a quarter (25%) of those employers who had at least some recent completers that had been recruited specifically as apprentices.
The site tended to be used more among those with large numbers of apprentices (36% among those with 10 or more apprentices, compared to 19% among those with just one recent apprentice). Similarly, large sites with 100-249 (31%) or 250+ employees (47%) were more likely to use the website. The link to the size of the site was much stronger than that with overall company size, as shown in the chart below.
Figure 5.7: Usage of the Apprenticeship Vacancies website
There was no link found between apprenticeship level and use of Apprenticeship Vacancies, although the website was more popular for recruiting certain main broad frameworks than others – in particular Arts and Media (48%), Business and Administration (27%) and ICT (26%). It was least used among those mainly recruiting Agriculture (15%) and Construction (16%) apprentices.
Those employers who used the Apprenticeship Vacancies website were asked to rate it on a scale of zero to ten, where ten was the most positive and zero the most negative. Most
47

users (60%) rated Apprenticeship Vacancies positively (six or more out of ten), although only just over a third of users (37%) rated it eight out of ten or better. Overall four per cent rated it poor (a score of four or less out of ten).
There was little variation in this across different types of apprenticeships or employers, although those whose main motivation for providing apprenticeships was to aid recruitment and retention were particularly satisfied (45% rating it eight or more out of ten).
Support for applications
Most employers felt that there was sufficient information, support and guidance available to employers interested in offering apprenticeships (71%, down slightly but significantly from 73% in 2014). Employers with more than 25 employees have a more favourable impression of the information, support and guidance available, with three-quarters (75%) finding the information and support available sufficient compared to around two-thirds of those with 10 to 24 employees (68%) or with fewer than ten employees (63%).
Views on the sufficiency of information, guidance and support varied by sector (more than by framework): those in the Information & Communications sector were most positive (91%), those in Construction (65%), Arts & Entertainment (63%) and Other Services, which includes hairdressing and barbering (61%) were the least satisfied.
48

Figure 5.8: Whether employers felt that there was sufficient information, support and guidance available, by industrial sector
Those employers who felt the information, support or guidance available to be insufficient experienced a range of issues. Around a third of these employers (31%) didn’t know who to approach or how to get information in the first place. It was also quite common for these employers to report a lack of information on how to recruit apprentices (20%) and how to find funding (19%). Others reported difficulty getting sufficient information on the requirements and benefits of apprenticeships (16%), how to find suitable training providers (14%), how to set up training for apprentices (12%), or information about the level of fees (10%). Around one in eight of these employers (13%) wanted more personal support or advice.
71%
91%
82%
76%
76%
75%
73%
72%
71%
71%
70%
68%
68%
65%
63%
61%
23%
9%
13%
19%
20%
19%
13%
21%
25%
22%
25%
24%
30%
29%
25%
31%
6%
5%
5%
4%
6%
14%
8%
4%
7%
6%
7%
2%
7%
12%
8%
AVERAGE
Information & Comms.
Professional, Sci. & Tech.
Public Admin. & Defence
Health & Social Work
Transport & Storage
Agriculture
Manufacturing
Accom. & Food Service
Admin. & Support Services
Education
Wholesale & Retail
Financial & Real Estate
Construction
Arts & Entertainment
Other Services
Yes No Don't know
Base (all employers): All (4,000), Information and Communications (74), Professional, Scientific and Technical (185), Public Administration and Defence (103), Health and Social Work (793), Transport and Storage (50), Agriculture (64), Manufacturing (361), Accommodation and
Food Service (279), Administrative and Support Services (92), Education (540), Wholesale and Retail (409), Financial and Real Estate (74), Construction (325), Arts and Entertainment (315), Other Services (321)
49

6. Keeping apprentices: retention and progression
This chapter explores issues of completion and retention, and employer attitudes toward offering progression from Intermediate and Advanced apprenticeships toward higher level qualifications.
Key findings
Completion and Retention • Most employers (88%) reported that all of their recent apprentices had successfully
completed their apprenticeship.
• Around two-thirds (65%) reported that all their recent apprentices were still with the company at the time of the survey, unchanged from 2015. This rose to four-fifths (79%) at employers where all apprentices successfully completed their apprenticeship. Retention was highest in Engineering and lowest in Agriculture and Arts and Media.
• Apprentices most often left for another job (53%); however, those studying education frameworks were quite often required to leave due to a lack of work (32%) or coming to the end of their contract (13%).
• Over seven in ten employers (71%) used fixed term contracts when recruiting a new apprentice, in line with 2014 (72%).
Offering progression • Just over half (53%) of apprentice employers offered any kind of qualification at
Level 4 or above, with about half of that group specifically offering Higher (26%) or Degree (13%) apprenticeships. However, less than half (13% of all employers) had ever actually had an apprentice proceed to these levels.
• There was considerable variation by sector, with a majority of employers where Health was the main framework offering higher level qualifications (69%).
• Smaller businesses and those with smaller apprenticeship schemes were much less likely to offer higher level qualifications.
• Employers that didn’t offer higher level qualifications most often said there was a lack of demand from employees (24%), that they weren’t required to do the job (23%), or that availability of higher level qualifications was an obstacle (23%), either that they knew there were none (8%) or weren’t aware of any (16%).
50

Completion and non-completion
The vast majority of employers (88%) reported that all of their recent apprentices had successfully completed their apprenticeship, up from 78% in the 2014 evaluation. Nearly all (91%) said that at least some apprentices had successfully completed their training, again an increase on the previous 2014 evaluation (87%). In part this reflects an increase in the proportion of successful completions7, but a change in the question wording is also likely to have played a role8.
The rate of successful completion did not vary greatly between types of employer or apprentice; however, those who only provided apprenticeships to existing employees reported a slightly higher success rate (95% with any successful completers). The proportion of employers experiencing any non-completers was slightly higher among those providing Engineering frameworks (11% compared to an average of 9% among all employers), and in Arts and Media (16%) although the sample size here was small (51).
Retaining apprentices
Around two-thirds (65%) reported that all their recent apprentices were still with the company, unchanged from last year, while three quarters (75%) have kept at least some of the apprentices. This compared with 64% of individual learners (or 72% of those in employment) who completed their apprenticeship and were still with the same company at the time of the survey.
The percentage of employers retaining at least some apprentices was higher (83%) among those who only provided apprenticeships to existing members of staff, and lower (67%) among those whose main motivation for offering apprenticeships was to reduce costs. The minority of employers which only offered apprenticeships to those aged over 25 had a much higher rate of retention, with four-fifths (81%) keeping all apprentices.
7 Data are not available for the exact survey windows used in the 2014 and 2015 Apprenticeship evaluations. However, in the 2012/13 FE year (August 2012 – July 2013) the number of achieved apprenticeships ran at 50% of the number of starts in the same time period. This rose to 58% in the 2013/14 FE year (August 2013 – July 2014), which covered the majority of the survey window for the 2015 Apprenticeship evaluation.
8 The 2015 evaluation survey wording explicitly specified in the question wording that the answer given should relate to the apprentices completing their training in the survey window, not to any other apprentices the employer might have. Although the question in 2014 was also intended to refer only to apprentices in the survey window only, it seems likely it might have been misinterpreted, and employers might therefore have thought of apprentices who failed to complete their training outside the survey window.
51

As shown in Table 6.1, there is of course considerable variation in retention according to the number of apprentices trained; as the number of apprentices increases, so does the chance of retaining at least one of them. Of those with just one apprentice finishing training, two-thirds (69%) were still employing that person, while a quarter (26%) were not, with the remainder unsure, while among employers with ten or more recent apprentices only a small minority (4%) were no longer employing any of them.
Table 6.1: Whether recent apprentices were still working for the organisation at the time of the survey, by number of apprentices
Apprentices Base All Some or all None
1 2,382 69% 69% 26%
2 701 61% 84% 11%
3 to 5 495 57% 85% 8%
6 to 9 126 40% 87% 9%
10+ 296 33% 88% 4%
TOTAL 4,000 65% 75% 21% “Don’t know” and “Other” responses (4% together) not shown
52
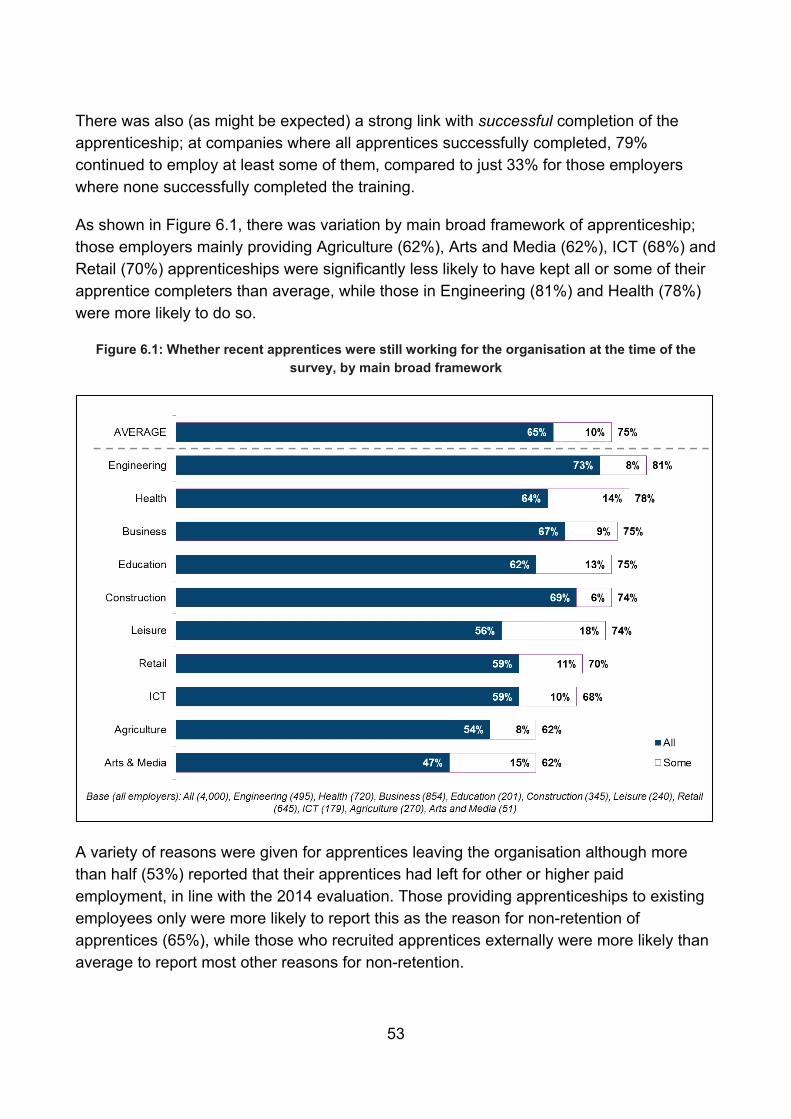
There was also (as might be expected) a strong link with successful completion of the apprenticeship; at companies where all apprentices successfully completed, 79% continued to employ at least some of them, compared to just 33% for those employers where none successfully completed the training.
As shown in Figure 6.1, there was variation by main broad framework of apprenticeship; those employers mainly providing Agriculture (62%), Arts and Media (62%), ICT (68%) and Retail (70%) apprenticeships were significantly less likely to have kept all or some of their apprentice completers than average, while those in Engineering (81%) and Health (78%) were more likely to do so.
Figure 6.1: Whether recent apprentices were still working for the organisation at the time of the survey, by main broad framework
A variety of reasons were given for apprentices leaving the organisation although more than half (53%) reported that their apprentices had left for other or higher paid employment, in line with the 2014 evaluation. Those providing apprenticeships to existing employees only were more likely to report this as the reason for non-retention of apprentices (65%), while those who recruited apprentices externally were more likely than average to report most other reasons for non-retention.
53

There was significant variation by main broad framework, as shown in the chart below. In particular, those organisations providing Education frameworks were much more likely to ask apprentices to leave due to no longer requiring their position (32%) or the contract ending (13%). These reasons were also more likely than average to be mentioned at large sites in all sectors – but not at large employers, where no such difference was found.
Employers providing the Hairdressing or Barbering frameworks were far more likely than other employers offering Retail frameworks to report that apprentices left because they did not like the job (18% to 6%) or for personal reasons (15% to 9%).
Figure 6.2: Reasons why recent apprentices were no longer working for the organisation at the time of the survey, by main broad framework
Fixed term contracts
Over seven in ten (71%) employers who recruited apprentices specifically for the role used fixed term contracts for the duration of the apprenticeship for at least some of their apprentices, in line with 2014 (72%). Two-thirds of employers (65%) only used this type of contract, and 69% used it in a majority of cases.
Use of these contracts was much more widespread among employers providing some frameworks than others; in particular they were the only form of contract used at nearly all employers where Education was the main broad framework (87%), as well as in Arts and Media (86%), and to a lesser extent in Retail (75%). Although organisations with larger
54

numbers of apprentices were more likely to offer non-fixed term contracts to at least some apprentices, partly because they were likely to offer some apprenticeships to existing employees, fixed term contracts were still generally used for the majority.
Offering progression
Just over half (53%) of apprentice employers offered any kind of qualification at Level 4 or above. A variety of types of Higher qualifications were offered by employers in 2015 with a quarter (29%) specifically offering Higher (26%) or Degree (13%) apprenticeships. However, less than half of that group (13% of all employers) had ever actually had an apprentice proceed to a Higher (Level 4) or Degree (Level 5+) level apprenticeship.
As shown in the chart below, there was substantial variation by main broad framework. Employers whose main framework was in Health were much more likely to offer and provide progression than others. The same applies to a lesser extent to employers where Business and Engineering were their main broad frameworks.
Figure 6.3: Offering and carrying out higher level qualifications, overall and by main broad framework
As expected, there is a clear link between providing apprenticeships at Level 3 and offering them at Level 4 or higher; those that had recent completers at Level 3 were more likely (34%) to offer progression than those with completers at only Level 2 (27%).
55

The provision of higher level qualifications was also associated with the number of apprentices and the size of the organisation. As shown in the chart below, larger organisations and those with more apprentices tended to be more likely to both offer and carry out higher level qualifications, including Higher or Degree apprenticeships at Level 4 and above.
Figure 6.4: Offering and carrying out higher level qualifications, by number of apprentices and size of site workforce
56

Why offer progression?
Most employers who offer higher or degree level qualifications do so as part of a workforce development strategy (64%). Around a fifth (18%) mentioned the need for higher qualifications for promotion or for management roles: this reason was more common among those with larger apprenticeship programmes (28%), in the third sector (29%), among employers where Health is the main broad framework (23%), and where increases in the numbers of apprentices were planned (23%).
Figure 6.5: Reasons for offering higher level qualifications
The three main reasons for not offering higher level qualifications, each cited by just under a quarter, were a lack of demand from employees, higher level qualifications not being needed to do the job, or were unaware or felt there were no suitable qualifications available (24%, 23% and 23% respectively).
57

Figure 6.6: Reasons for not offering higher level qualifications
Employers with larger programmes, with ten or more recent apprentices, were much more concerned about cost / a perceived lack of funding (21%) than those with a single apprentice completer (8%). The reverse trend applied to perceived lack of demand and availability of higher level qualifications; these particularly affected those with small numbers of apprentices.
As might be expected, there was some variation in the perception of availability of higher level qualifications by subject area. Of those whose current main broad framework was in Engineering or Manufacturing, nearly a third (31%) didn’t know of any higher level qualifications suitable for their business, or believed there definitely weren’t any available, while the same was true of only 12% of those whose current main broad framework was in Education.
58

7. New initiatives – Traineeships and Trailblazers
This section explores the awareness, participation and future offering of the Government Traineeship Programme and of the new Trailblazer standards and assessments.
Key findings
Traineeships • The majority (64%) of employers had heard of traineeships, while over two-
fifths (43%) had at least some knowledge of what these entailed. • Nevertheless this did not translate into involvement: one in five (19%) of all
employers had participated in traineeships in some way, while only five per cent of employers reported that the apprentices covered in the survey had undertaken a traineeship prior to their apprenticeship.
• Awareness and knowledge of traineeships was higher among those employers offering an Arts and Media, Health or Business framework, and it was among the two former groups where involvement levels were highest too.
• Large sites had higher levels of awareness and knowledge of traineeships, they were no more likely to participate in traineeships.
• While approaching one in five participated in traineeships, a further seven per cent intended to do so in future.
Trailblazers
• A quarter (24%) of employers were aware of the recently introduced Trailblazer standards and assessments; only half of these (12% of all) had at least some knowledge of what they involve.
• Larger employers, and those offering an Arts and Media or Business apprenticeship tended to have higher levels of awareness and knowledge.
• A small proportion (6%) of employers had been involved in the Trailblazer standards, rising to 19% of employers at sites with 100 or more staff.
• Over half (55%) of those involved considered Trailblazers to be an improvement on the previous framework approach, with a quarter (25%) feeling it was too early to say, leaving a fifth (21%) who considered them not to be an improvement.
• Two-thirds (67%) of those employers aware of them intended to offer Trailblazers within the next five years. Nevertheless, taking into account the relatively low level of awareness mentioned above, this group accounted for fewer than one in ten (8%) of all employers surveyed.
59

Awareness and knowledge of traineeships
Traineeships were introduced in 2013 to provide work experience to people not in work who need additional skills to get a job or an apprenticeship. The programme specifically targets 16 to 24 year olds and the work experience sits alongside support with basic skills such as maths and English to improve their suitability for the workplace.
Two years after their introduction, two-thirds (64%) had heard of traineeships and just over two-fifths (43%) of employers had some knowledge (29%) or a good knowledge (14%) of what traineeships involve. Table 7.1 illustrates awareness and knowledge by the number of employees at the site and framework.
60

Table 7.1 Knowledge of traineeships, by size of site and main broad framework
Row percentages B
ase
Not
hea
rd o
f
Aw
are
but n
o kn
owle
dge
Som
e kn
owle
dge
Goo
d kn
owle
dge
AT
LEA
ST S
OM
E K
NO
WLE
DG
E
AW
AR
E
Average 4,000 % 36 21 29 14 43 64
1-9 staff at site 991 % 41 23 26 9 36 59
10-24 staff at site 1,056 % 38 19 30 14 43 62
25-99 staff at site 1,256 % 35 20 31 13 44 65
100+ staff at site 655 % 25 19 30 26 56 75
Agriculture 270 % 43 21 26 10 36 57
Arts and Media 51 % 30 18 29 22 51 69
Business 854 % 32 22 29 17 46 68
Construction 345 % 42 23 22 12 34 58
Education 201 % 39 20 25 16 41 60
Engineering 495 % 39 21 29 11 40 61
Health 720 % 32 18 35 14 49 68
ICT 179 % 51 13 21 15 36 49
Leisure 240 % 34 25 28 12 40 66
Retail 645 % 40 20 27 13 39 60
61

Awareness and knowledge of traineeships was highest among:
• Larger employers: 75% of employers with 100 or more staff were aware of traineeships.
• Employers offering an Arts and Media (69%), Health (68%) or Business (68%) apprenticeship framework. Awareness was particularly low among employers offering an ICT framework (49%).
• Employers operating in the public sector (73% aware compared with 62% in the commercial and 65% in the third sector).
• Those with higher volumes of apprentices: 79% of employers with ten or more apprentices were aware of traineeships.
Participation in traineeships
A fifth (19%) of all employers participated in traineeships at the time of the survey, either as a provider or by offering work experience placements as part of the programme. Participation was most common among employers offering an Arts and Media (30%) or Health (28%) apprenticeship. It was less common in more ‘traditional’ frameworks such as Construction (13%) and Engineering (11%), while only one in ten (10%) employers offering ICT frameworks participated in traineeships.
Although large employers with 100 or more staff were more likely to be aware and knowledgeable of traineeships, this did not translate into higher rates of participation with traineeships (18% of employers at sites with 100 or more staff compared with 19% of employers with 1 to 99 staff).
Traineeship participation was especially high among employers who already had a diverse apprenticeship offering; over a quarter (28%) of those who offered both Level 2 and Level 3 apprenticeships participated in traineeships, as did over a fifth (22%) of those who offered apprenticeships to multiple age groups. Participation was also high among employers who had offered apprenticeships for five or more years (22%).
Traineeships as a route into apprenticeships
Traineeships are intended to provide a platform for individuals to learn the basic skills they need to start an apprenticeship. In this context, a small portion (5%) of employers had recent apprentice completers who had undertaken a traineeship with them before starting the apprenticeship. This rose to seven per cent among employers offering a Health apprenticeship as their main broad framework.
62

Future traineeship offering
While a fifth of employers participated in traineeships, a further seven per cent intended to do so in future, rising to ten per cent of employers at sites with 100 or more staff.
When combining those who offered traineeships with those who intended to do so in future, the greatest appetite for traineeships was seen among employers in the Education sector (37%), followed by Health and Social Work (34%) and Public Admin and Defence (34%), all sectors dominated by the public sector. By contrast there was little interest in traineeships in the Information and Communications sector (13%), in the Professional, Scientific and Technology sector (13%), and in Manufacturing (14%).
Overall, the public sector was much more positive about traineeships; a third (32%) either already offered or planned to offer them, compared to a quarter (25%) in the commercial sector. One in nine (11%) of all employers have at least some knowledge of traineeships, but did not intend to offer traineeships in the future; this was most widespread in the Professional, Scientific and Technology sector (22%), indicating that the low level of interest in this sector is not caused by a low level of awareness.
63

Figure 7.1 Future traineeship offering, by SIC 2007 sector
The drive to offer traineeships in future was linked with intentions to increase the overall apprenticeship offer. Over a third (36%) of those who expected the number of apprentices at their site to increase in the next two to three years either offered traineeships or intended to do so in future, compared to a quarter (26%) overall.
Awareness and knowledge of Trailblazers
In October 2013, government launched the first eight “Trailblazers”. These were established to create a new set of apprenticeship standards intended to replace the existing apprenticeship frameworks and also to create apprenticeships in new occupations at all levels. These standards are being developed by employers, to enable them to influence the design of both training delivery and assessment, with the intention that these lead to apprenticeships that are high in quality and more relevant to the needs of industry.9
9 https://www.gov.uk/government/uploads/system/uploads/attachment_data/file/487350/BIS-15-632-apprenticeships-guidance-for-trailblazers-december-2015.pdf
6%
5%
8%
12%
6%
6%
7%
3%
9%
4%
5%
3%
7%
8%
12%
57%
47%
50%
36%
57%
60%
66%
60%
63%
65%
65%
71%
69%
58%
61%
70%
11%
11%
8%
19%
10%
6%
5%
17%
9%
12%
10%
8%
13%
22%
17%
5%
7%
9%
7%
10%
6%
11%
4%
10%
5%
6%
7%
8%
6%
4%
6%
7%
19%
28%
27%
23%
22%
17%
18%
10%
14%
13%
12%
10%
11%
10%
8%
6%
AVERAGE
Education
Health & Social Work
Public Admin. & Defence
Other Services
Accom. & Food Service
Arts & Entertainment
Admin. & Support Services
Financial & Real Estate
Wholesale & Retail
Construction
Agriculture
Transport & Storage
Professional, Sci. & Tech.
Manufacturing
Information & Comms.
Don't know No knowledge Has knowledge, but does not intend to offer Intend to offer Currently offer
Base (all employers): All (4,000), Education (540), Health and Social Work (793), Public Administration and Defence (103), Other Services (321), Accommodation and Food Service (279), Arts and Entertainment (315), Administrative and Support Services (92), Financial and Real
Estate (74), Wholesale and Retail (409), Construction (325), Agriculture (64), Transport and Storage (50), Professional, Scientific and Technical (185), Manufacturing (361), Information and Communications (74)
64

A quarter of employers (24%) were aware of Trailblazers, and half of these felt they had some knowledge (7%) or a good knowledge (5%) of what Trailblazers involve. Table 7.2 illustrates awareness and knowledge by site size and framework.
Table 7.2 Awareness / knowledge of Trailblazers, by employer size and framework
Row percentages
Bas
e
Not
hea
rd o
f
Aw
are
but n
o kn
owle
dge
Som
e kn
owle
dge
Goo
d kn
owle
dge
AT
LEA
ST S
OM
E K
NO
WLE
DG
E
AW
AR
E
Average 4,000 % 76 12 7 5 12 24
1-9 staff at site 991 % 84 8 5 2 7 16
10-24 staff at site 1,056 % 80 11 6 2 9 20
25-99 staff at site 1,256 % 75 12 7 5 12 25
100+ staff at site 655 % 52 18 14 16 30 48
Agriculture 270 % 78 7 7 7 14 22
Arts and Media 51 % 66 15 3 15 19 34
Business 854 % 72 12 8 8 16 28
Construction 345 % 78 11 6 5 11 22
Education 201 % 86 9 4 1 5 14
Engineering 495 % 76 11 8 5 13 24
Health 720 % 80 11 7 2 9 20
ICT 179 % 77 13 5 4 10 23
Leisure 240 % 79 10 6 4 11 21
Retail 645 % 76 13 7 4 11 24
65

Patterns by subgroup of knowledge and awareness of Trailblazers mirrored those seen across traineeships for the most part. Awareness and knowledge was in particular higher among:
• Larger employers: 48% of employers with 100 or more staff were aware of Trailblazers, rising to 60% of employers with 250+ staff.
• Employers offering an Arts and Media (34%) or Business (28%) apprenticeship framework. Awareness was particularly low among employers offering an Education framework (14%).
• Employers operating in the public sector (36% aware compared with 22% in the commercial and 24% in the third sector).
• Those with higher volumes of apprentices: 49% of employers with ten or more apprentices were aware of Trailblazers.
Involvement with the new Trailblazer standards
A small proportion (6%) of all employers were involved in the new Trailblazer standards, rising to 19% of employers at sites with 100 or more staff.
The most common forms of involvement included being consulted about a Trailblazer standard (4% of all employers), or developing the standard themselves (3%). Only a tiny minority (1%) had actually had apprentices undertake a Trailblazer standard, while the same proportion (1%) had contributed to assessment design.
By framework, employers offering an Agriculture (10%), Engineering (9%) or Business (8%) apprenticeship were all more likely than average to have got involved in some way with the new Trailblazer standards. Nevertheless, these employers were no more likely than any other to have actually had apprentices undertake a Trailblazer standard. Similarly, while larger employers had higher levels of involvement with Trailblazers, this generally related to design and development work: still only one per cent of employers with 100+ staff had had apprentices undertake a Trailblazer standard.
Employers’ views on the new Trailblazer standards and assessments
Those employers involved with Trailblazers were asked whether they considered these new Trailblazer standards and assessments to be an improvement over the previous frameworks. Over half (55%) considered them to be an improvement, with a quarter (25%) feeling it was too early to say, leaving a fifth (21%) who considered them not to be an improvement.
66

Employers in the commercial sector were more likely than those in the non-profit sector to consider the new standards and assessments to be improvements over the previous frameworks (60% and 43% respectively).
The Trailblazer standards gained less traction among employers whose apprenticeships represented a relatively deep-rooted approach to training and recruitment. Less than half (48%) of employers who had offered apprenticeships for at least 10 years considered the new Trailblazer standards and assessments an improvement, compared with 26% who thought they were not an improvement. In contrast, two-thirds (66%) of employers who had offered apprenticeships for less than five years considered the standards an improvement, compared with 11% who thought they were not an improvement.
Future Trailblazer offering
Trailblazer standards are intended to account for an increasing proportion of apprenticeships over the next few years10.
Two thirds (67%) of employers with at least some knowledge of Trailblazers intended to offer them within the next five years. However, taking into account the low level of awareness mentioned above, fewer than one in ten (8%) of all employers surveyed planned to offer Trailblazers within the next five years, rising to 21% of employers with 100 or more staff.
Public sector employers were more likely than commercial or third sector employers to expect to move to Trailblazers in the next five years (15%, 7% and 8% of all employers surveyed respectively), while by framework, those offering a Business apprenticeship were most commonly planning to offer Trailblazer standards in future (12%).
There were notable differences in planned future Trailblazer offering by apprenticeship history, recruitment, and offering:
• Although employers who had offered apprenticeships for a longer time were less likely to consider the new Trailblazer standards an improvement over the existing frameworks, they were more likely to think that they would move to these new standards in the next five years – one in ten (10%) of those who have offered apprenticeships for 10 or more years plan this, compared to five per cent of those who have offered apprenticeships for three years or less.
10 https://www.gov.uk/government/uploads/system/uploads/attachment_data/file/487350/BIS-15-632-apprenticeships-guidance-for-trailblazers-december-2015.pdf.
67

• Employers who had six or more recent apprentices were more likely than those with fewer completers to think that they would move to the new standards in the next five years (19% and 8% respectively).
• Employers recruiting apprentices from existing employees only were less likely than average to think that they would move to the new Trailblazer standards in the next five years –five per cent.
• Those offering both Level 2 and Level 3 apprenticeships were more likely to think they will move to the new standards than those offering Level 2 or Level 3 only (15%, 6% and 8% respectively).
68

8. Delivery, assessment, cost and influence of apprenticeship training
In this section we examine the delivery, assessment and cost of the apprenticeship training as well as employers’ level of influence on that training. This section also assesses the prevalence of Maths and English GCSE among apprentices, and the importance of this to employers.
Key findings
Delivery and Assessment • Nearly all employers (94%) used an external training provider to deliver at
least some of their apprenticeship training, consistent with 2014, while 73% provided formal training themselves.
• While there was little variation by framework in terms of those using an external training provider, the profile of those providing formal training internally varied considerably: nearly eight in ten (79%) employers with an Agriculture or Retail broad framework provided formal internal training sessions compared with just 59% of employers offering an Education framework.
• Very few (1%) employers carried out the apprenticeship assessment themselves, rising to three per cent of sites with 100 or more employees.
Fees • Just over a quarter (27%) of employers who were employing apprentices at the
time of the survey paid fees to a training provider. This represented a slight increase from 2014 (25%).
• Employers offering apprenticeships in more “traditional” Construction and Engineering frameworks” were more likely to pay fees to a provider.
Influence • Nearly two-thirds (65%) of employers felt able to influence the content,
delivery or duration of their apprenticeship training.
• Levels of influence before delivery of the apprenticeship were higher among those offering “newer” frameworks such as Arts and Media, as well as larger employers.
• Across all employers, 16% wanted more influence than they currently had over the content, delivery or duration of their apprenticeship training.
Previous qualifications • There has been an increased emphasis in recent years on the importance of
developing maths and English skills through an apprenticeship.
• Around a third (34%) of employers reported that all of their apprentices had both a maths and English GCSE at A*-C, but the majority (70%) considered it
69

Key findings
important for their apprentices to have or to achieve A*-C grades in maths and English
• Such skills were deemed more important to employers offering “newer” frameworks such as Education (where 95% of employers regarded these skills as important) than more “traditional” frameworks like Construction (64%).
Delivery of apprenticeship training
Nearly all employers used an external provider to deliver at least some of the apprenticeship training (94%, consistent with 2014). Again, in line with 2014, three-quarters (73%) of all employers provided formal training sessions as part of the apprenticeship.
Figure 8.1 Whether apprentices received training from a training provider and from their employer, by main broad framework
There was relatively little variation in the use of external providers by framework with at nine in ten employers across all broad frameworks using an external provider. A slightly higher proportion of employers who had a Level 3 apprenticeship as their main level used
94% 97% 96% 95% 95% 93% 92% 91% 91% 91% 90%
73% 70%76%
67%75% 79% 79%
61%69% 71%
59%
AVE
RA
GE
Leis
ure
Hea
lth
Bus
ines
s
Eng
inee
ring
Ret
ail
Agr
icul
ture
Arts
and
Med
ia
ICT
Con
stru
ctio
n
Edu
catio
n
Received training by a training providerReceived formal training sessions from employer
4,000 720 645240 854 495 270 51 179 345 201Base:
70
an external provider to deliver training (96%, compared with 94% of employers with a Level 2 main level and 91% of employers with a Level 4+ main level).
There was more variation in the provision of formal internal training sessions as part of the apprenticeship by broad framework. Nearly eight in ten (79%) employers with an Agriculture or Retail broad framework provided formal training sessions, while only six in ten (59%) employers with an Education main broad framework did so.
Employers who offered apprenticeships to existing employees were less likely to provide formal internal training sessions (66%; 64% among those who recruited existing employees only, compared with 78% of those who only recruited external applicants). The longer an employer had offered apprenticeships, the more likely they were to provide formal internal training. Such differences did not exist with regards employers’ use of external training providers.
Seven out of ten (70%) employers offered their apprentices training at both an external training provider and at their own organisation. Whilst a quarter (25%) of employers only used an external provider for training, only a minority (3%) offered solely internal training (with this varying little between apprenticeship framework).
Assessment of apprenticeship training
While the delivery of apprenticeship training tended to be conducted by both an external training provider and the employer themselves, the assessment of apprentices was generally left to the external training provider: consistent with 2014, 97% of employers used an external training provider to assess their apprentices and only one per cent carried out the assessment themselves. Larger sites were more likely to have carried out the assessment by themselves; among sites with 100 or more employees, three per cent had done so, with this figure rising to six per cent among sites with 250 or more employees.
Fees paid for apprenticeships
Of those employers currently employing apprentices, only around a quarter (27%) had paid fees to a training provider. This represents a slight increase on the proportion of employers paying fees recorded in the 2014 evaluation (25%).
Employers were most likely to pay fees for apprentices who were aged 19 to 24 when they started their course (16%), and least likely for those aged 25 and over (6%). Just over a tenth (11%) of those with apprentices aged 16 to 18 paid fees.
There was some variation by sector, in particular nearly half of employers providing apprenticeships in the “traditional” frameworks of Construction (39%) and Engineering
71

(53%) paid fees to a training provider. Those providing apprenticeships in Retail (17%), Health (13%) or Leisure (12%) were typically less likely to have paid fees to a provider. This represents a similar pattern to 2014.
Employers with larger numbers of employees were also more likely to pay fees, rising to over half (54%) among those with 250 or more employees on site. About a third of public sector employers had paid fees (33%), compared to just over a quarter of commercial sector employers (27%) and a fifth of third sector employers (21%).
Of those paying fees, the data indicates an average fee of £1,600 to £2,000 per apprentice per annum, with a wide range from only a few pounds to over £10,000. It should be borne in mind that some courses will be paid for by a combination of subsidy and fees; in most cases fees are fully subsidised for those aged 16 to 18, 50% subsidised for those aged 19 to 24, and unsubsidised for those aged 25 or over at the start of the course. In some cases the course may be mostly subsidised but the employer may make a small payment, for example for certificates or course materials. However, arrangements vary by sector, and there may be other sources of subsidy, including from the learner or grants they may be entitled to as an individual. Due to this high level of variation, and the small proportion of employers paying fees at all, the fee levels cannot be meaningfully broken down by level, sector, broad framework or age group.
Employer influence on apprenticeship training
Recent Government policy on employers’ engagement towards apprenticeships (and people development more broadly) has emphasised the importance of employers’ choice over what training their apprentices receive and their level of influence on the design and delivery of the apprenticeship11.
Two-thirds (65%) of all employers were able to influence the content, delivery or duration of the apprenticeship training, with half (49%) being able to influence the training before it started, and three-fifths (57%) being able to influence the training after it had started.
Mirroring findings from 2014, the proportion of employers who were able to influence training before the start of the apprenticeship was particularly high amongst those offering apprenticeships on “newer” frameworks, such as Arts and Media (74%), ICT (53%) and Retail (53%). Employers who offered apprenticeships on more “traditional” frameworks were able to influence training to a lesser extent. Indeed, amongst employers whose main broad framework was Construction, only a quarter (27%) were able to influence the
11 Department for Education and Department for Business, Innovation & Skills, Rigour and Responsiveness in Skills, (2013).
72

apprenticeship training before it had started, and just two-fifths (38%) were able to influence the training after it had started.
The ability to influence the content, delivery or duration of the apprenticeship training before or after the training started was more common among the very largest sites; two-thirds of sites with 100 or more staff had been able to influence the training before (63%) or after (66%) the training started, with this rising to seven in ten sites with 250 or more staff (69% and 70% respectively).
Employers who had a diverse apprenticeship offering were more likely to have influenced the apprenticeship training before or after it had started. This is unsurprising, given the link between employer size and a diverse apprenticeship offering. Indeed, employers offering multiple broad frameworks were more likely to have influenced the training before (57%) or after (62%) it had started compared to those employers only offering apprenticeships within one broad framework (48% and 56% respectively). Similarly, employers who offered both Level 2 and Level 3 apprenticeships were more likely to have influenced the training before (56%) or after (63%) than those who only offered Level 2 or Level 3.
Employer desire for more influence
As with last year, employers who had limited influence (those who said they had not been able to influence apprenticeship training either before or after it started) were asked whether they had wanted any influence over training.
Amongst these employers, three in ten (30%) wanted influence over training. The appetite for influence diminished slightly from 2014, where 35% of those with limited influence wanted to have more, and falls back in line with levels seen in 2013 (29%).
Drawing together findings of all employers’ ability and desire to influence apprenticeship training, results show that, amongst all employers:
• 16% wanted more influence (employers who were not able to influence the apprenticeship either before or after its start, and who wanted to).
• 54% felt that they had sufficient influence (those who were able to influence apprenticeship training both before and after the start of the apprenticeship, and those employers who were not able to influence the apprenticeship either before or after its start but who did not want to).
• 24% had no influence over apprenticeships, but did not want to have influence anyway (with 6% giving a ‘don’t know’ response).
73

Figure 8.2 below breaks this down by broad framework.
Figure 8.2 Employer desire for more influence on apprenticeship training, by main broad framework
Whilst a sixth (16%) of all employers wanted more influence over apprenticeship training, this varied considerably by framework with a quarter of employers with an Arts and Media (26%) or Construction (25%) main broad framework wanting more influence over the apprenticeship training, compared to just an eighth (13%) of those with a Leisure main broad framework.
The desire to have more influence over apprenticeship training was also more common among smaller sites; 21% among those with one to nine staff and 18% among those with 10 to 24 staff wanted more influence, compared with just 12% among those with 100 or more staff, and just 8% among those employers with 250+ staff.
Employers who recruited external candidates specifically for an apprenticeship were more likely than those who only recruited existing employees to have wanted more influence over training (18% compared to 14%). Likewise, those who expected their growth to contract were more likely to want more influence over training (25%, compared to those who expected significant, slight or static growth – 16% across all).
6%
4%
7%
7%
5%
5%
5%
13%
6%
7%
5%
24%
6%
36%
20%
21%
26%
23%
28%
20%
24%
31%
54%
64%
32%
51%
53%
52%
56%
44%
60%
55%
51%
16%
26%
25%
21%
21%
17%
16%
15%
15%
14%
13%
AVERAGE
Arts andMedia
Construction
Agriculture
ICT
Engineering
Health
Education
Retail
Business
Leisure
Don’t know Had no influence, but did not want anyHad sufficient influence over training Wanted more influence over training
Base (all employers): All (4,000), Arts and Media (51), Construction (345), Agriculture (270), ICT (179), Engineering (405), Health (720), Education (201), Retail (645), Business (854), Leisure (240)
74

Employers with a ‘newer’ main broad framework were more likely to feel that they had sufficient influence over apprenticeship training compared to those with a ‘traditional’ main broad framework. For example, three-fifths (60%) of employers with a Retail main broad framework felt they had sufficient influence over the apprenticeship training, compared to just a third (32%) of those with a Construction main broad framework.
Those employers who offered both Level 2 and Level 3 apprenticeships (61%) or had six or more apprentices complete during the March-October 2014 window (72%) were more likely to have felt they had sufficient influence over the apprenticeship training. Again, this is likely to be related to employer size; namely that larger employers were more likely to feel that they had had sufficient influence over apprenticeship training.
A quarter (24%) of all employers did not want any influence. This group is of particular interest given the continuing move towards more employer-led apprenticeships. The proportion of employers who did not want any influence over apprenticeship training was highest amongst employers offering apprenticeships on the Construction (36%), Leisure (31%) and Education (28%) frameworks. Those who only trained apprentices aged 25 and over were also particularly likely not to want any influence (34%).
Maths and English GCSE
Whether apprentices started their apprenticeship with maths or English GCSE
Recent apprenticeship policy in England has placed increased emphasis on developing maths and English skills: the Richard Review recommended requiring all apprentices to have reached Level 2 in English and maths before they can complete their apprenticeship, and in the subsequent ‘The Future of Apprenticeships in England: Implementation Plan’ (October 2013) one of the four underpinning principles of future apprenticeships was that apprenticeships should develops transferable skills, including English and maths:
“All apprentices will be required to achieve a certain standard of English and maths in order to complete their apprenticeship. The English and maths requirements will be stronger in future apprenticeships. This reflects the importance of these skills to an apprentice’s employability and to their career progression within a sector or across sectors. We are not setting any minimum entry requirements relating to an apprentice’s English and maths skills, and expect employers to be flexible in recruiting apprentices with lower initial English and maths skills.”
In this context, employers were asked about whether their apprentices already had maths or English GCSE at grade A*-C. Around a third (34%) reported that all of their apprentices
75

had both a maths and English GCSE at A*-C. Just over half (52%) however said that they had a least one apprentice who did not have such grades when they started.
Employers offering a Health and Care services apprenticeship as their main broad framework were most likely to take on apprentices without a maths or English GCSE grade A*-C (72%). This was also common in the Retail and Arts main broad framework (59% and 57% respectively). By contrast, employers with an ICT (58%), Engineering (47%), Education (45%) or a Business (44%) main broad framework were more likely to have had all their apprentices start their apprenticeships with these grades.
Employers who only offered apprenticeships to existing employees were more likely to have had at least one apprentice start without maths or English at GCSE grade A*-C than employees who specifically recruited all their apprentices (57% and 49% respectively).
The importance of maths and English GCSE to employers
The majority of employers (70%) considered it important for their apprentices to have or to achieve A*-C grades in maths and English, with a third (36%) considering it to be very important. In comparison just under a fifth (18%) did not think it was important.
Prior academic qualifications tended to be more important to those employers offering ‘newer’ frameworks: nearly all (95%) with an Education main broad framework considered maths and English GCSE important with over four-fifths (82%) considering it to be very important, while 84% of employers with an ICT main broad framework also considered these GCSE grades important. By contrast, less than two-thirds (64%) of employers with a Construction main broad framework considered maths and English GCSE important, as did those with an Agriculture main broad framework (64%).
76

Figure 8.3 The importance of maths and English GCSE, by main broad framework
Just under four-fifths (78%) of employers with 100 or more staff at their site considered maths and English GCSE important, rising to over four-fifths (83%) among employers with 250 or more staff at their site. This trend was not seen at the organisation level, however.
Employers who specifically recruited for apprentices only were more likely to consider maths and English at GCSE important than employees who recruited existing employees only (73% and 66% respectively).
Three-quarters (74%) of employers who had been offering apprenticeships for less than three years considered maths and English GCSE important.
70%
95%
84%79%
76% 75%
67% 65% 64% 64% 62%
AVE
RA
GE
Edu
catio
n
ICT
Arts
and
Med
ia
Eng
inee
ring
Bus
ines
s
Hea
lth
Leis
ure
Agr
icul
ture
Con
stru
ctio
n
Ret
ail
4,000 51201 270854 345495 720179 240Base: 645
Percentages are a summary of ‘Very important’ and ‘Quite important’ responses
77

9. Satisfaction, benefits and future plans
In this section we examine employers’ satisfaction with the apprenticeship programme overall, as well as levels of satisfaction with particular elements of apprenticeships. This section also discusses the extent to which employers would recommend apprenticeships to others, the benefits of participation, employer plans for the provision of apprenticeships in future and any aspects of the programme that they would like to change.
Key findings
• Levels of overall satisfaction with the apprenticeship programme have increased from 2014, rising from 83% to 87%. Levels of satisfaction varied by framework.
• Employers were most satisfied with the quality of the assessment carried out by their provider (88%), how the provider offers training and / or assessment in a flexible way (86%), the quality of training (86%) and the support and communication from their provider (84%). Levels of satisfaction with these individual elements of apprenticeships rose slightly when compared to 2014.
• Eight out of ten (83%) employers would recommend apprenticeships to others. Just over a third (37%) of employers would recommend apprenticeships to other employers without being asked (35% in 2014), and a further 46% said they would recommend them if asked.
• Employers experienced a wide range of benefits as a result of offering and training apprentices. Productivity, product or service quality, staff morale, staff retention, image in the sector and generating new ideas were all cited by at least two thirds of employers.
• The majority of employees remain committed to apprenticeships. Over eight out of ten (86%) employers said they planned to continue to offer apprenticeships, a significant increase from 79% in 2014. Of those employers who did plan to continue offering apprenticeships (or who were unsure), a quarter (25%) intended to increase the number of apprenticeship places that they offered at their specific site, whilst 69% expected the number of places to stay at about the same level.
• Four per cent of all employers intended to decrease the number of apprenticeships that they offer, and a further six per cent intended to stop offering apprenticeships entirely. Half (48%) of these employers attributed this to needing to recruit or train fewer people, and 30% stated that the reduction in their apprenticeship offer was due to a decision to recruit or train in other ways.
78

Overall satisfaction
Employers were asked to provide an overall satisfaction rating for their main level and framework of the apprenticeship programme, giving scores between zero and ten (with zero being the most dissatisfied, five being ‘neither satisfied nor dissatisfied, and ten being the most satisfied). Overall levels of satisfaction have increased from 2014, with the vast majority (87%) of employers ‘satisfied’ with their main level and framework of the apprenticeship programme (giving a score between six and ten); significantly higher compared with the 83% satisfaction recorded in 2014. The proportion ‘very satisfied’ (giving a score of eight or more) also increased significantly while the proportion dissatisfied fell from nine per cent to four per cent.
Table 9.1 Overall satisfaction amongst employers
2013 2014 2015
Base 4,009 4,030 4,000
All satisfied (6-10) 84% 83% 87%
Very satisfied (8-10) 60% 62% 66%
Satisfied (6-7) 24% 20% 20%
Dissatisfied (0-4) 7% 9% 4%
Mean 7.6 7.5 7.8
79
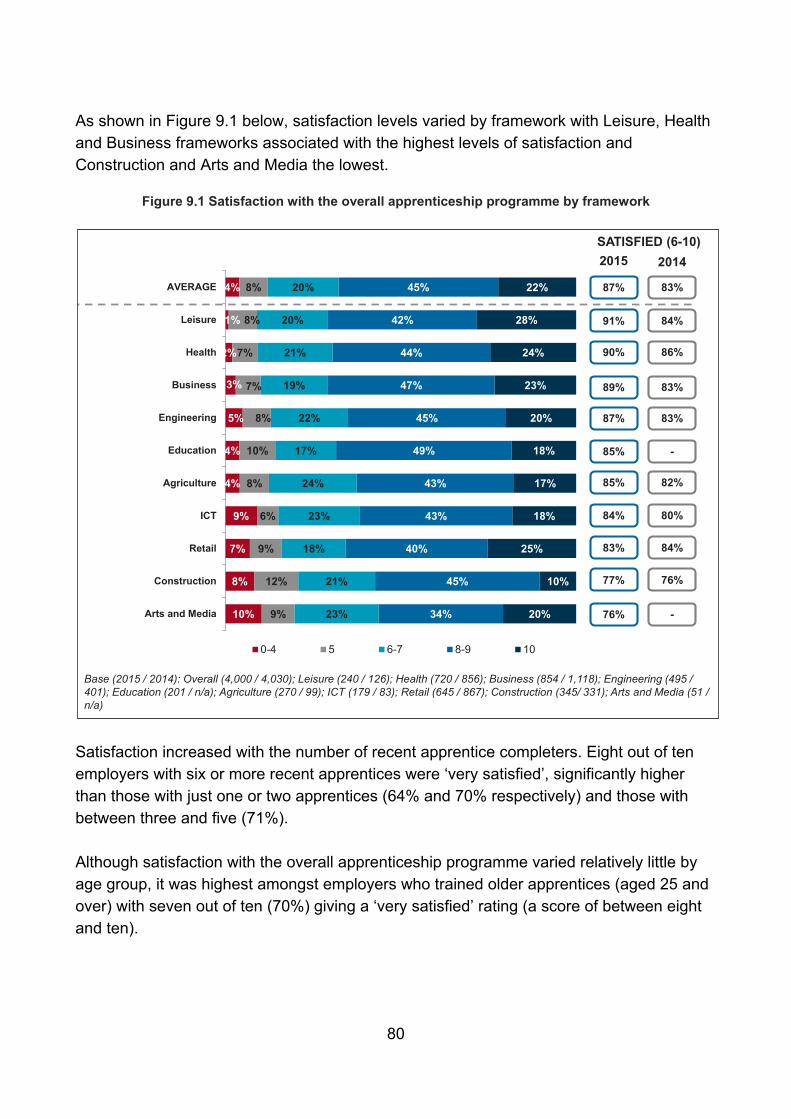
As shown in Figure 9.1 below, satisfaction levels varied by framework with Leisure, Health and Business frameworks associated with the highest levels of satisfaction and Construction and Arts and Media the lowest.
Figure 9.1 Satisfaction with the overall apprenticeship programme by framework
Satisfaction increased with the number of recent apprentice completers. Eight out of ten employers with six or more recent apprentices were ‘very satisfied’, significantly higher than those with just one or two apprentices (64% and 70% respectively) and those with between three and five (71%). Although satisfaction with the overall apprenticeship programme varied relatively little by age group, it was highest amongst employers who trained older apprentices (aged 25 and over) with seven out of ten (70%) giving a ‘very satisfied’ rating (a score of between eight and ten).
10%
8%
7%
9%
4%
4%
5%
3%
2%
1%
4%
9%
12%
9%
6%
8%
10%
8%
7%
7%
8%
8%
23%
21%
18%
23%
24%
17%
22%
19%
21%
20%
20%
34%
45%
40%
43%
43%
49%
45%
47%
44%
42%
45%
20%
10%
25%
18%
17%
18%
20%
23%
24%
28%
22%
Arts and Media
Construction
Retail
ICT
Agriculture
Education
Engineering
Business
Health
Leisure
AVERAGE
0-4 5 6-7 8-9 10
21
SATISFIED (6-10)2015 2014
Base (2015 / 2014): Overall (4,000 / 4,030); Leisure (240 / 126); Health (720 / 856); Business (854 / 1,118); Engineering (495 / 401); Education (201 / n/a); Agriculture (270 / 99); ICT (179 / 83); Retail (645 / 867); Construction (345/ 331); Arts and Media (51 / n/a)
87%
87%
89%
77%
91%
90%
85%
84%
76%
83%
85%
83%
83%
83%
76%
84%
86%
-
80%
-
84%
82%
80

Whilst only a small proportion (4%, in line with 2014) of employers were dissatisfied with the apprenticeship programme overall (giving a score of between zero and four), levels of dissatisfaction varied across frameworks. The highest levels of dissatisfaction were seen amongst employers with apprenticeships on the Arts and Media and Construction frameworks (10% and 8% respectively). In line with previous years, smaller employers were also more likely to be dissatisfied with the apprenticeship programme, with seven per cent of employers with one to nine employees on site giving a score of between zero and four. This is likely to be reflective of the challenges of tailoring apprenticeships to meet the needs of particularly small organisations.
Satisfaction with specific elements of apprenticeships
In terms of a number of specific elements of apprenticeships, employers were most satisfied with the quality of the assessment carried out by their provider (88% giving a score between six and ten), how the provider offered training and / or assessment in a flexible way to meet their needs (86%), the quality of training (86%) and the support and communication from their provider (84%). Satisfaction with each of these elements has increased significantly from 2014 while it has remained broadly consistent across the remaining elements as shown in Figure 9.2 below.
81

Figure 9.2 Satisfaction with particular elements of the apprenticeship programme
Table 9.2 below shows how this varied by framework.
16%
14%
7%
7%
8%
5%
4%
5%
4%
17%
17%
15%
12%
7%
6%
7%
5%
8%
29%
22%
24%
23%
20%
20%
20%
19%
20%
25%
30%
37%
37%
41%
45%
42%
44%
45%
10%
13%
14%
17%
23%
22%
25%
25%
22%
Quality of applicants
Ability to influencestructure, content, delivery
and duration
Amount and complexity ofpaperwork
Ability to select relevantframework
Support andcommunication from
provider
Quality of training
Flexibility of training andassessment
Quality of assessment
AVERAGE
0-4 5 6-7 8-9 10
23
(Base A)
SATISFIED (6-10)2015 2014
87% 83%
77% 76%
74% 74%
84% 79%
88% 83%
86% 83%
86% 82%
65% 64%
63% 64%(Base D)
(Base A)
(Base A)
(Base A)
(Base C)
(Base C)
(Base C)
(Base B)
Base A (all employers): 4,000Base B (all where provider carries out assessments): 3,777
Base C (all where provider carries out training): 3,777Base D (all who recruit outside of organisation): 2,636
82

Table 9.2 Satisfaction (six or more out of ten) with various elements of apprenticeships, by framework
All
Agr
icul
ture
Art
s an
d M
edia
Bus
ines
s
Con
stru
ctio
n
Educ
atio
n
Engi
neer
ing
Hea
lth
ICT
Leis
ure
Ret
ail
% % % % % % % % % % %
Base: All who recruit apprentices from outside the organisation
2,636 190 49 495 296 134 392 445 148 128 359
Quality of applicants 63 57 71 66 62 77 65 65 64 69 54
Base: All 4,000 270 51 854 345 201 495 720 179 240 645
Ability to select framework relevant to needs
77 76 75 79 67 77 75 79 79 78 74
Amount and complexity of paperwork and bureaucracy required
74 73 74 74 67 75 74 75 71 76 76
Ability to influence structure, content, delivery and duration of training
65 67 61 68 44 59 63 64 66 60 68
Base: Employers where the apprenticeship provider carries out training / assessments
3,777 249 47 815 311 182 474 697 166 232 604
Quality of assessment 88 87 72 89 80 82 87 89 85 90 87
Flexibility of training / assessment
86 88 76 88 72 81 84 89 83 91 88
Quality of training delivered by provider
86 83 70 89 76 81 86 89 81 90 85
Support and communication from provider
84 83 67 86 78 78 84 84 77 86 85
83

Over three quarters of employers (77%) were satisfied that they were able to select a framework relevant to their needs, whilst half (54%) were very satisfied. High proportions of ‘very satisfied’ employers were evident amongst those offering apprenticeships on the Leisure (58%) and Health and Care frameworks (57%). Whilst only 7% of all employers were dissatisfied with their ability to select a relevant framework, levels of dissatisfaction were particularly high amongst employers offering apprenticeships on the Arts and Media (14%), Agriculture (10%), and Construction frameworks (10%).
The extent to which employers felt they could influence the structure, content, delivery and duration of their apprenticeship training was particularly variable. Two-thirds (65%) of employers were satisfied with their ability to influence training, with 43% ‘very satisfied’. Nearly half (48%) of employers on the Retail framework were ‘very satisfied’, as well as 46% of those offering apprenticeships on the Business and Administration framework.
Predictably, employers who felt they were able to influence the structure, content, delivery, or duration of apprenticeships before training started (86% compared to 43% of those not able to influence), and during it (84% compared to 38%) were much more likely to be satisfied. However, 13% of employers were dissatisfied, making influence over the training one of the specific areas of apprenticeships in which employers were most dissatisfied. Dissatisfaction was particularly high amongst employers offering apprenticeships on the Construction framework. Almost three out of ten (27%) were dissatisfied. This is in particularly stark contrast when compared to the proportion of employers who were ‘very satisfied’ (43% overall).
Compared to other specific elements, employers were also more dissatisfied with the quality of applicants for apprenticeship positions (16%). Dissatisfaction with the quality of applicants was particularly high amongst employers who offered apprenticeships on the Retail framework (23%).
Likewise, one in five (20%) of employers whose apprentices did not have either GCSE English or Maths (or both) at A*-C grade were also dissatisfied with the quality of applicants (compared to 11% whose apprentices did have these qualifications).
Advocacy
Just over a third (37%) of employers said they would recommend apprenticeships to other employers without being asked (in line with the 35% in 2014), and a further 46% said they would recommend them if asked. Together therefore, over fourfifths (83%) would recommend apprenticeships to others while only an extremely small proportion (one per cent) of employers would recommend against apprenticeships if asked.
The proportion of employers who would recommend apprenticeships varied little by framework, with the highest proportion of employers who would recommend
84

apprenticeships seen amongst those who offered apprenticeships on the Arts and Media framework (90%).
Employers who offered apprenticeships at a higher level (Level 3) were more likely to recommend apprenticeships than those offering Level 2 (86% compared to 83%). Likewise, nine out of ten (90%) employers who offered both Level 2 and 3 apprenticeships said they would recommend them, compared to eight out of ten employers who only offered one of these levels (81% of those offering just Level 2, and 84% of those offering just Level 3).
Larger employers were more likely to speak positively about apprenticeships. Whilst only eight out of ten (79%) of employers with one to nine employees on site said they would recommend apprenticeships (alongside 83% of with 10 to 24 employees, and 84% of those with 25 to 99), 91% of employers with 100 or more employees said they would recommend them.
Employers who expected their business to contract were most likely to recommend against offering apprenticeships (9%, compared to 2% amongst those who expected significant growth, 1% who expected slight growth, and 2% who expected growth to remain static).
Benefits to the employer
Employers experienced a wide range of benefits as a result of offering apprenticeships and training apprentices: improved productivity, product or service quality, staff morale, staff retention, image in the sector and generating new ideas were all cited as benefits by at least two thirds of employers. Only a small minority (4%) were unsure of the benefits of apprenticeships, answering that they did not know of any benefits to their organisation, or that there were none.
85

Figure 9.3: Benefits experienced as a result of offering and training apprentices
The benefits experienced by employers varied by main broad framework and are summarised in the table overleaf. This variation is partly due to the nature of the frameworks and partly due to the nature of the sectors those frameworks are typically offered to. For example, employers using the Education main broad framework, being mainly schools, were rarely interested in winning new business.
In Leisure and Health, Care & Public Services, there were more benefits seen by employers almost across the board, while Construction and Education employers experienced fewer benefits.
86

Table 9.3 Benefits experienced as a result of offering and training apprentices – significant differences by main broad framework
Benefits experienced as a result of offering and training apprentices – significant differences to
the all broad framework average
Main Broad Framework Base Significant differences above ▲ / below ▼average
Agriculture 270 Lower overall wage bill (45%) ▲ Improved staff retention (61%) ▼
Brought new ideas (57%) ▼
Arts & Media 51 Improved staff retention (51%) ▼ Win new business (21%) ▼
Business & Admin. 854 Brought new ideas (72%) ▲
Improved our image (64%) ▼ Help win new business (34%) ▼
Construction 345
Helped win new business (45%) ▲ Improved productivity (66%) ▼
Improved staff retention (65%) ▼ Improved staff morale (62%) ▼
Improved product / service quality (62%) ▼ Brought new ideas (51%) ▼
Education 201
Improved staff morale (64%) ▼ Helped improve staff retention (55%) ▼
Improved ability to attract good staff (53%) ▼ Improved image (51%) ▼
Helped win new business (1%) ▼
Engineering & Manufacturing 495
Help us win business (44%) ▲ Improved staff morale (70%) ▼
Brought new ideas (60%) ▼ Lower overall wage bill (30%) ▼
Health, Care & Public Services 720
Improved product or service quality (82%) ▲ Improved staff morale (77%) ▲
Improved image in sector (74%) ▲ Helped improve staff retention (73%) ▲
Brought new ideas (71%) ▲ Improved ability to attract good staff (69%) ▲
ICT 179
Improved our image (55%) ▼ Helped improve staff retention (54%) ▼
Improved ability to attract good staff (48%) ▼ Helped us win business (30%) ▼
87

Leisure 240
Improved product / service quality (88%) ▲ Improved productivity (87%) ▲
Improved image in sector (81%) ▲ Improved staff morale (80%) ▲
Improved staff retention (78%) ▲ Bought new ideas (77%) ▲
Improved ability to attract good staff (73%) ▲ Helped us win business (32%) ▼
Retail & Commercial 645 Helped us win business (47%) ▲ Improved ability to attract good staff (59%) ▼
Breaking this down by sector reveals further patterns; although overall most sectors agreed on the key advantages of apprenticeships, there are still significant variations.
For example, in the Financial and real estate sector, apprenticeships were far more likely to be seen as useful in lowering the overall wage bill than in Manufacturing or Accommodation and food service, while the ability to attract good staff was key in Other services (which included hairdressers and barbers) and Education.
88

Table 9.4 Benefits experienced as a result of offering and training apprentices – significant differences by sector
Benefits experienced as a result of offering and training apprentices – significant differences to
the all sector average
SIC 2007 sector Base Significant differences above ▲ / below ▼average
Agriculture 64 Improved product or service quality (63%) ▼
Improved staff retention (56%) ▼ Improved ability to attract good staff (48%) ▼
Manufacturing 361 Improved product or service quality (68%) ▼ Improved our image in the sector (61%) ▼
Lower overall wage bill (28%) ▼
Construction 325
Improved our image in the sector (73%) ▲ Helped us win business (49%) ▲ Improved productivity (67%) ▼ Improved staff morale (63%) ▼
Brought new ideas to the organisation (51%) ▼
Wholesale / Retail 409
Helped us win business (47%) ▲ Improved product or service quality (71%) ▼
Brought new ideas to the organisation (62%) ▼ Improved our image in the sector (62%) ▼
Transport / Storage 50 Improved staff morale (59%) ▼
Accommodation / Food Service 279 Improved ability to attract good staff (50%) ▼
Lower overall wage bill (31%) ▼
Information / Communication 74 Helped us win business (50%) ▲
Financial / Real Estate 74 Lower overall wage bill (55%) ▲ Helped us win business (26%) ▼
Professional / Scientific / Technical 185
Lower overall wage bill (43%) ▲ Improved product or service quality (68%) ▼
Improved staff morale (65%) ▼
Administrative / Support Services 92 No significant differences
Public Administration / Defence 103
Brought new ideas to the organisation (84%) ▲ Improved our image in the sector (77%) ▲
Improved staff retention (60%) ▼ Helped us win business (11%) ▼
89

Education 540
Improved productivity (81%) ▲ Improved product or service quality (80%) ▲
Brought new ideas to the organisation (75%) ▲ Improved ability to attract good staff (68%) ▲
Lower overall wage bill (42%) ▲ Helped us win business (20%) ▼
Health / Social Work 793
Improved product or service quality (80%) ▲ Brought new ideas to the organisation (72%) ▲
Improved our image in the sector (71%) ▲ Improved ability to attract good staff (65%) ▲
Arts / Entertainment 315
Improved product or service quality (84%) ▲ Improved productivity (82%) ▲ Improved staff morale (81%) ▲
Brought new ideas to the organisation (75%) ▲ Helped us win business (28%) ▼
Other Services (including hairdressing and barbering)
321
Improved productivity (81%) ▲ Improved staff retention (76%) ▲
Improved ability to attract good staff (70%) ▲ Helped us win business (58%) ▲ Lower overall wage bill (43%) ▲
Future provision of apprenticeships
The vast majority of employers remained committed to offering apprenticeships in future; 86% planned to continue to offer apprenticeships, representing a significant increase from 79% in 2014.
The likelihood of continuing apprenticeships in future was most common among those offering ‘newer’ frameworks, especially among those who offered Health apprenticeships (93%). In contrast, however, much smaller proportions of employers who planned to continue offering apprenticeships were seen amongst those on the ICT, Arts and Media and Agriculture frameworks (75%, 79% and 80% respectively). This closely mirrors the low levels of satisfaction with apprenticeships overall, and implies that satisfaction and plans to continue offering apprenticeships are closely linked. Indeed, 94% of those who would recommend apprenticeships without being asked planned on continuing to offer apprenticeships in future.
In contrast, seven per cent of employers were undecided about whether they would offer apprenticeships in future, whilst only six per cent did not plan on continuing to offer them. Smaller employers (those with one to nine employees on site) were more negative, with larger proportions answering that they will not continue to offer apprenticeships (12%) or that they were undecided (11%).
90

Amongst the majority of employers who did plan to continue offering apprenticeships (or who were unsure), a quarter (25%, or 23% of all employers) intended to increase the number of apprenticeship places that they offer at their specific site, whilst 69% expected the number of places to stay at about the same level.
As shown by Figure 9.4 below, this varied considerably by broad framework, with those offering ‘new’ frameworks being particularly likely to plan on increasing the number of apprenticeship places that they offer. Indeed, the largest proportion of employers planning on increasing the number of apprenticeship places that they offer was amongst those on the Arts and Media framework (33%), followed by the Retail framework (31%) and the ICT framework (27%). This contrasts the low proportion of employers on the Arts and Media and ICT frameworks who planned on continuing to offer apprenticeships in the future, and implies that those employers who do plan on remaining with the apprenticeship programme are particularly engaged, and are committed to offering a greater number of apprenticeships.
91

Figure 9.4 Future plans for the number of apprenticeship places offered over the next two to three years
There were no particularly strong trends shown by the sector of the employer; however, the regression analysis shown in Appendix B, which adjusts for other factors which might influence taking on apprenticeships, allows some detail to be drawn out. This found that employers in the Agriculture, Manufacturing, Construction, Retail and Professional, scientific and technical SIC sectors had lower probabilities of continuing to offer apprenticeships, all else being equal.
Larger employers with 100 or more employees (38%), and those who offered apprenticeships exclusively to existing employees (28%) were also more likely to be planning to increase their number of apprentices.
As is to be expected, plans to increase apprenticeship provision were strongly linked to an expectation of overall company growth. Employers who predicted significant growth were more likely to increase their apprenticeship offering in the future (41%). This compares to 26% of those who predict slight growth, 15% of those who expect company growth to remain static and 17% of those who expect their organisation to contract.
3%
4%
3%
5%
5%
6%
4%
2%
6%
8%
4%
78%
77%
77%
75%
69%
68%
67%
69%
68%
51%
69%
16%
17%
19%
20%
24%
25%
26%
27%
31%
33%
25%
Education
Agriculture
Construction
Engineering
Health
Leisure
Business
ICT
Retail
Arts and Media
AVERAGE
Decrease Stay about the same Increase
32Base (all employers who plan to continue offering Apprenticeships): Overall (3, 739), Arts and Media
(46 – caution low base size), Retail (614), ICT (162), Business (800), Leisure (222), Health (701), Engineering (460), Construction (308), Agriculture (246), Education (180)
92

This was confirmed as the key factor affecting intention to recruit apprenticeships, even after adjusting for other factors, by the regression analysis shown in Appendix B. Even those companies reporting slight growth show a significantly greater likelihood of intending to continue with apprenticeships than those expecting company growth to remain static.
Reducing or ending provision of apprenticeships
In total, four per cent of all employers intended to decrease the number of apprenticeships that they offer, and a further six per cent intended to stop offering apprenticeships entirely. Again, this varied substantially, particularly by framework and growth prospects. Again, the proportion of employers planning to stop offering apprenticeships was higher amongst those on the Construction (12%), Agriculture (10%), Arts and Media (9%), and ICT (9%) frameworks, mirroring the low levels of overall satisfaction within these frameworks.
Those who expected their business to contract in future were more likely to plan to end their involvement with apprenticeships (18%, compared to nine per cent of those who predict static growth, four per cent of those who predict growth).
Tied in with this, it was more common for employers to decrease or end their apprenticeship due to the need to recruit or train fewer staff (48%) as opposed to wanting to recruit or train staff in some other way (30%).
Among those employers who planned on decreasing or ending their apprenticeship offer in favour of another type of training, a quarter (25%) stated that this was due to poor quality apprentices (see Figure 9.5). Nearly one in five (19%) of employers answered that this is due to financial reasons (including cost, issues with cash flow, affordability and value for money), whilst 19% felt that alternative training methods had better results.
93

Figure 9.5 Reasons for deciding to end apprenticeship offer in favour of another form of training
What employers would like to change
A quarter (26%) of employers would have liked to have changed the content, structure, delivery or duration of their apprenticeship training. Most commonly, employers wanted the training to be better tailored to their organisation (8% of all employers). This was particularly evident amongst those who offered apprenticeships on the Arts and Media framework (25%). A further five per cent of employers would have liked to have seen improved communications with their training provider, and three per cent would have liked the apprenticeship programme to have greater flexibility.
Two-fifths (40%) of employers would have liked to have seen more flexible scheduling, so that, for example, training could be scheduled to avoid specific times of year which were busier for the employer. This was especially true for employers who offered apprenticeships on the Retail framework (46%), and those who only took existing employees on to an apprenticeship (45%).
12Base (all employers planning to decrease of end their Apprenticeship offer in favour of another type of training): 131
6%
6%
7%
9%
15%
19%
19%
25%
Excessive paperwork, bureaucracy or red tape
Staff are fully qualified
Apprenticeships didn't meet needs of thebusiness
Poor quality of training
No current need for new staff / no vacancies
Cost / cashflow / affordability / value for money
Alternative training method has better results
Poor quality of Apprenticeships
94

10. Conclusions In 2015 the Government committed to creating 3 million apprenticeships by 202012. With the success of the apprenticeship model reliant on employer engagement, this drive to increase the quantity of apprenticeships in England draws even greater attention to employers’ attitudes towards apprenticeships and their capacity to deliver high quality training to staff.
Recent Statistical First Release data illustrates a plateauing of apprenticeship starts following large increases between 2010/11 and 2012/13. This survey’s data however reveals the potential for growth over the next few years, through increased employer take-up. The vast majority intend to continue offering apprenticeships in future, with higher proportions citing this in 2015 than 2014, while nearly a quarter of all employers with current apprentices intend to increase the number of apprenticeship places that they offer. This provides some indication that apprenticeships are gradually becoming more integral to longer-term planning, with their benefits more widely valued. The regression analysis also revealed that likelihood to grow is strongly linked to business growth, highlighting that apprenticeship growth targets are particularly reliant on general business conditions and the wider economy.
A clear target for boosting apprenticeship numbers are larger businesses, typically with 100 or more staff. These types of businesses are more likely to take on any apprentices, but the survey found those that did tended to have a lower ratio of apprentices to overall staff numbers compared with mid-size businesses, suggesting strong potential for growth among these employers. The Government has already taken steps to address such shortfalls. The Apprenticeship Levy, set to be introduced in 2017, affects large employers with a pay bill over £3 million and is intended to provide a financial incentive that encourages large employers to take on a greater number of apprentices13. The 2015 Enterprise Bill meanwhile allowed the Government to set annual apprenticeships targets for public sector employers14. It will be important to measure the impact of these interventions on employer uptake of apprenticeships over the next few years, not only for those directly affected but to assess any ‘trickle-down’ effect on the wider employer population.
12 https://www.gov.uk/government/news/government-kick-starts-plans-to-reach-3-million-apprenticeships
13 https://www.gov.uk/government/consultations/apprenticeships-levy-employer-owned-apprenticeships-training
14 https://www.gov.uk/government/consultations/public-sector-apprenticeship-targets
95

The survey found a range of business benefits employers typically derive from providing apprenticeships. Nearly all cited benefits, such as improved productivity, an increase in product or service quality and improved staff retention; tangible business benefits that can be harnessed as marketing messages to engage employers new to the apprenticeship landscape, or to encourage greater levels of uptake.
On top of the variety of benefits employers reported, satisfaction with apprenticeships was very high, and, importantly, had increased since 2014. In particular, satisfaction had increased with regards to employers’ perception of the quality and flexibility of the training apprentices received and the assessments conducted, while satisfaction had also increased regarding the support and communication received from the training provider.
However, there are key barriers preventing greater uptake of apprenticeships, illustrated by the sizeable minority of employers who were unaware that the training being delivered was an apprenticeship. Additionally, small businesses in particular felt that the information, support and guidance available to them when making decisions about apprenticeships should be better.
A common concern among employers was the work readiness of applicants for an apprenticeship. Two recent policy initiatives have sought to ensure that those that are taken on to an apprenticeship do quickly gain the basic skills required in most workplaces. The first stipulates that employers should incorporate maths and English Level 2 within training courses for apprentices lacking these qualifications. The importance of raising such standards is reinforced by survey findings showing that half of employers offering apprenticeships had at least one apprentice without basic Maths or English qualifications. Meanwhile, the introduction of Traineeships in 2013 was intended to provide work experience to young people prior to starting their apprenticeship, to ensure they were better prepared for the workplace. Only a small minority of employers have had apprentices undertake a Traineeship or been involved in some other way. It may take some time before these reforms affect the quality of applicants: as in 2014, there remains a significant minority of employers dissatisfied with the quality of the applicant, an issue that was particularly common for employers offering apprenticeships in Retail.
Pointing to the quality of the apprenticeship provided, most employers made use of an external training provider to deliver at least some of their apprenticeship training. However, a smaller proportion (two-thirds of all employers) were involved in the design and development of training courses, raising concerns that for some employers the training does not best suit their needs. Indeed, one in eight wanted more influence over the training provided. Involvement in the design and development of training courses was likely to lead to better outcomes, with the use of external training providers and influence over the design of courses correlating positively with higher satisfaction levels.
96
To better meet the needs of industry, the government introduced Trailblazer standards in 2013, conferring the responsibility for designing and developing apprenticeship training courses to the employer. Awareness of these standards is still relatively low, though the majority of those aware reported they intended to move across to these standards in the next five years.
The findings showed considerable diversity by framework, highlighting the importance of accounting for these differences within the apprenticeships landscape during any future marketing or reforms. Three-quarters of employers offering Construction and Arts and Media frameworks were satisfied with their apprenticeship offer, compared with nine in ten offering Leisure, Health and Business frameworks. Satisfaction levels for Construction and Arts and Media frameworks were low across a variety of measures, including quality and relevance of training, and support from the provider. In contrast, the Learner survey found that Construction apprentices were among the most satisfied with their apprenticeship. More research might be required to unpick the underlying issues causing this disconnect between the employer and apprentice experience.
Apprenticeships can also offer individuals progression to higher levels of qualifications, and three in ten employers provide individuals a route on to a Higher or Degree Apprenticeship. Once again, there was some variability by framework, with the greatest opportunities for progression occurring among those employers offering a Health apprenticeship; for the majority of other frameworks however, opportunities for progression were relatively limited.
The 2015 survey presents a positive picture of employers’ attitudes towards apprenticeships. Satisfaction has increased, higher proportions than in previous years are intending to continue offering apprenticeships, while the business benefits continue to be wide-ranging, and experienced by most employers. The challenge over the next few years is to maintain this quality and relevance of training as the apprenticeship offer expands to incorporate a wider range of employers and individuals, and moves across to the new Trailblazer standards.
97

A.Technical Appendix
This appendix details how the survey was sampled, carried out, weighted and analysed, and how this compares to the previous survey carried out in 2014.
Introduction
The data in this report comes primarily from a 20 minute telephone survey of 4,000 employers identified as having had an apprentice complete their training in the survey window15, carried out specifically for the research. The telephone survey was piloted on 7th and 8th October 2015, with the main fieldwork taking place between 22nd October 2015 and 7th January 2016.
The survey targeted people in charge of training and development, and was carried out at an establishment (i.e. workplace) level. For larger organisations with multiple sites, it therefore represents the viewpoints of both Head Offices and branch sites.
Sampling
Employers with apprentices completing their training in the survey window were identified using the ILR (Individualised Learner Record), which records all apprenticeships which take place in England. Their contact details were provided by BlueSheep, which sources information from the documentation the employer submitted to set up the apprenticeship and return details of its completion. A sample of 24,000 employers was drawn from this for the fieldwork (a ratio of 6:1 to the target of 4,000 completes).
In order to ensure statistically robust results could be returned for each broad framework of apprenticeship, significant oversampling of employers offering smaller, less widely used frameworks was needed. The sample was therefore stratified to ensure a sufficient sample for analysis within each broad framework of apprenticeship available.
It was also stratified to obtain sufficient response for separate analysis from employers with ten or more apprentices, who represent a small minority of employers. In this latter case a census approach was taken, contacting all employers where contact details were available. In addition, the sampling approach took into account Level, splitting up those offering apprenticeships only at level 2, only at level 3, or both. Employers offering apprenticeships only at level 4 and higher (e.g. Higher or Degree apprenticeships) were not sampled. The left hand column of Table A.1 shows the distribution of the sample.
15 March to October 2014, inclusive
98

Fieldwork
In total, 11,582 employers were spoken to by telephone16; 4,000 interviews were achieved from this, a 35% response rate. Interviews lasted close to 20 minutes on average.
Interlocking quotas were used to align the response to the intended profile, and fieldwork was actively managed to ensure these were met as closely as possible. The resulting distribution of interviews is shown in the middle column of Table A.1. Interviews achieved were regularly monitored for quality by a team of field supervisors.
Weighting
Because the fieldwork oversampled specific groups of employers, as outlined above, weighting was required to ensure the results produced did not over-represent these groups.
The dataset produced from fieldwork was therefore weighted to the profile of employers shown on the ILR. As in 2014, this was done using an interlocking weight by broad framework and levels provided and then with a rim weight based on the number of apprentices, to ensure an even representation of all employers with apprentices in the survey window.
The data was also grossed up to allow the production of figures reflecting the total number of employers with apprentices in the survey window in England (84,794, determined from the ILR).
This resulted in the final weighted profile shown in the right hand column of table A.1.
16 Excluding any sample where the phone number was incorrect, the company had closed or the respondent did not answer the phone.
99
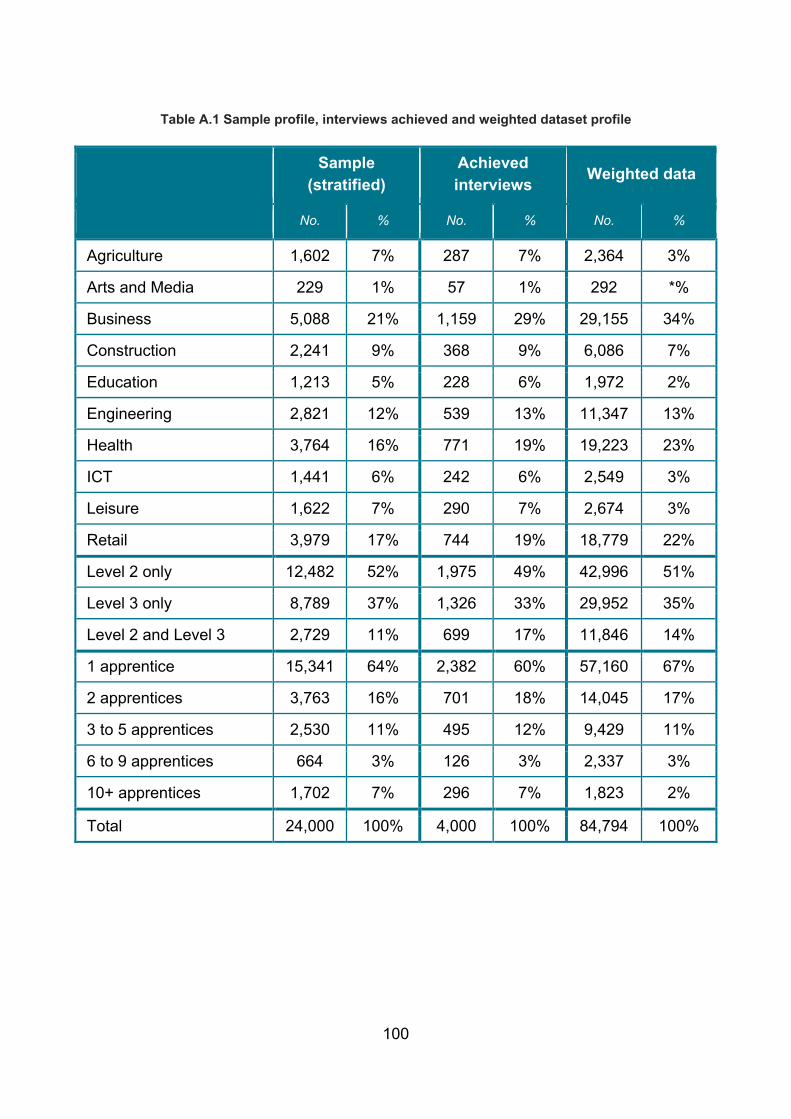
Table A.1 Sample profile, interviews achieved and weighted dataset profile
Sample (stratified)
Achieved interviews Weighted data
No. % No. % No. %
Agriculture 1,602 7% 287 7% 2,364 3%
Arts and Media 229 1% 57 1% 292 *%
Business 5,088 21% 1,159 29% 29,155 34%
Construction 2,241 9% 368 9% 6,086 7%
Education 1,213 5% 228 6% 1,972 2%
Engineering 2,821 12% 539 13% 11,347 13%
Health 3,764 16% 771 19% 19,223 23%
ICT 1,441 6% 242 6% 2,549 3%
Leisure 1,622 7% 290 7% 2,674 3%
Retail 3,979 17% 744 19% 18,779 22%
Level 2 only 12,482 52% 1,975 49% 42,996 51%
Level 3 only 8,789 37% 1,326 33% 29,952 35%
Level 2 and Level 3 2,729 11% 699 17% 11,846 14%
1 apprentice 15,341 64% 2,382 60% 57,160 67%
2 apprentices 3,763 16% 701 18% 14,045 17%
3 to 5 apprentices 2,530 11% 495 12% 9,429 11%
6 to 9 apprentices 664 3% 126 3% 2,337 3%
10+ apprentices 1,702 7% 296 7% 1,823 2%
Total 24,000 100% 4,000 100% 84,794 100%
100

Differences from 2014
The sampling process differed from the 2014 evaluation in a number of ways, none of which should affect the overall comparability of the data:
• Due to the changes in the broad frameworks on offer over time (in particular the increasing popularity of some new frameworks such as Arts and Media) in 2015 these were sampled and weighted separately.
• The sampling and weighting was based on all broad frameworks offered, rather than (as in 2014) weighting those with a single broad framework separately, and then splitting the reminder into groups using common combinations of broad frameworks. This should improve the accuracy of results among larger employers.
• The final data was grossed up to population of employers from the ILR.
• To improve the accuracy of the awareness data, mentioning apprenticeships was avoided where possible in the screening stage of the survey. This may have slightly changed the profile of employers choosing to take part.
101

B.Regression analysis
This appendix details logistic regression analysis carried out on the dataset in order to identify the employer characteristics most closely associated with future plans for use of apprenticeships.
A variable indicating the employer’s future plans regarding participation in apprenticeships was used as the dependent variable to examine what factors and characteristics of a business (and its apprenticeship) might help predict their probability of continuing to train (or not) through this programme.
The dependent variable, change_apps, is an ordered categorical variable taking on the values:
1. where the employer reports that they plan to stop training apprentices altogether;
2. where they will continue with apprenticeships but decrease their volume;
3. where the employer plans to continue with apprenticeships as is; and
4. where the employer plans to continue to train apprentices and to increase their number.
An ordered logistic model was estimated in order to obtain the probability of an employer exhibiting any of these four possible changes to their apprenticeship involvement depending on various characteristics of their business and the apprenticeships they provide at present. Table B.1 below presents the estimation results.
102

Table B.1 Ordered logistic regression results, model of employer reported change in future apprenticeship activity
Dependent variable: change in future apprenticeship engagement Coefficient Z
Expected business growth: Reference: Remain about the same
Grow significantly 1.2336*** 9.26
Grow slightly 0.7332*** 7.60
Contract slightly -0.3067 -1.07
Contract significantly -0.9634** -2.23
Don’t know 0.3003 0.96
Refused 0.7085 1.06
Sector: Reference: Q Human Health and Social Work Activities
A: Agriculture, forestry & fishing -1.2175*** -2.70
B: Mining & quarrying -1.0065 -1.02
C: Manufacturing -0.3518** -2.28
D: Electricity, gas, steam & air conditioning supply -0.7622 -0.43
E: Water supply; sewerage, waste management & remediation activities -2.6878** -2.30
F: Construction -0.7049*** -4.09
G: Wholesale & retail trade; repair of motor vehicles & motorcycles -0.6825*** -4.61
H: Transportation & storage -0.4148 -1.19
I: Accommodation & food service activities 0.2098 1.34
J: Information & communication -0.1742 -0.52
K: Financial & insurance activities -0.0697 -0.14
L: Real estate activities -0.6189 -1.66
M: Professional, scientific & technical activities -0.6370*** -3.16
N: Administrative & support service activities 0.0581 0.19
O: Public administration & defence; 0.3707 0.54
103

compulsory social security
P: Education -0.2624 -1.32
R: Arts, entertainment & recreation 0.0500 0.19
S: Other service activities -0.0590 -0.37
T: Activities of households as employers; undifferentiated goods and services produced by households
-0.4575 -0.21
Currently has apprentice(s) 0.4242*** 4.46
Recruits: Reference: New recruits only
Existing employees only 0.1828* 1.83
Both existing and new employees 0.0846 0.46
Involved in apprenticeship: Reference: New recruits only
For more than a year, up to 3 years 0.7098*** 2.89
More than 3 years, up to 5 years 0.6679*** 2.67
More than 5 years up to 10 years 0.7319*** 2.95
More than 10 years 0.6662*** 2.72
Don't know 0.4317 1.41
Offers apprenticeships to 16-18 year olds 0.1628 1.49
Offers apprenticeships to 19-24 year olds 0.1833* 1.72
Overall satisfaction 0.0724*** 3.27
/cut1 -0.8210
/cut2 -0.3406
/cut3 3.4453 Note: Statistical significance is denoted as: *** at 1% level; ** at 5% level; * at 10% level
The ordered logistic regression model used for the outcome variable, change_apps. In this model, a positive coefficient estimate indicates that the particular dependent variable increases the probability that the employer falls into a higher group of the outcome variable (i.e. that they are more likely to continue with apprenticeships in some way). The model includes an indicator of expected business growth as one explanatory variable. The reference category for this variable is that the employer expects that their business will remain about the same rather than grow or contract.
104

Compared to this reference category, those employers that reported expected growth (slight or significant) are more likely to report that they are intend to continue to engage with apprenticeships; the coefficients for these two responses are positive and statistically significant at the one per cent level. Those employers expecting the business to contract significantly are found to have lower chances of continuing with apprenticeships, all else equal.
A variable indicating the sector in which the employer’s business operates was also included in the model. Compared to the reference sector (human health and social work activities), employers in agriculture, forestry and fishing, manufacturing, construction, wholesale and retail trade, and, professional, scientific and technical activities are found to have lower probabilities of continuing with apprenticeship training, all else held constant. The coefficient estimates for these sectors are negative and statistically significant at the five per cent level or better.
The length of time over which the employer has been involved in this form of training is, as expected, found to have a positive effect on the likelihood that they will continue to train apprentices. The employer’s overall level of satisfaction with the apprenticeship programme is also found to have a positive association with the probability of an employer planning to continue with their involvement.
Two further variables were entered into the model (and retained) but were not found to be statistically significant. These included the age groups to which apprenticeships were offered by the employer and whether the employer took on new recruits or existing employees (or both) as apprentices.
Whilst the coefficient estimates and their statistical significance, as shown in Table B.1, can help in looking at the association between certain variables and the probability of employers being involved in apprenticeship training in future, it is perhaps more intuitive to consider some predicted probabilities arising from the model.
Table B.2 shows the ‘baseline’ probabilities of an employer stopping or continuing their apprenticeship activity. The ‘baseline’ employer is one with all characteristics being the reference categories for the variables shown in Table B.1. (i.e. the employer expects the business to remain about the same (no growth/contraction); business is in human health and social work activities; does not currently have apprentices; only new recruits as apprentices; involved in apprenticeships for one year or less; does not offer apprenticeships to 16 to 18 year olds; does not offer to 19 to 24 year olds); dissatisfied with apprenticeship overall).
There is a 31% probability that the baseline employer would indicated that they are going to stop participating in apprenticeships altogether and a 55% probability that they will continue as they are at present. If all else remains equal, but the employer expects the
105

business to grow significantly rather than remain as it is, the probability of discontinuing apprenticeship participation is reduced to 11% and the probability of continuing as they are currently increase to 73%. For a company that expects to contract significantly, the probability of discontinuing rises to 54%. An employer that has apprentices currently (all else as in the baseline) has a 64% probability of continuing apprenticeship involvement as it is presently and a five per cent probability of increasing their apprenticeship numbers.
As these results show, one of the most important predictors of employers’ intentions regarding future apprenticeship involvement is their overall business prospects. This finding is in agreement with findings from other surveys and studies of employer engagement in apprenticeships (e.g. Net Costs studies).
106

Table B.2 Selected predicted probabilities for employers’ future apprenticeship activity
Characteristic of employer Employer’s expected future involvement in apprenticeships
Discontinue Decrease
number, but continue
Continue as currently
Continue and
increase numbers
Baseline (does not have apprentices currently, company expected to remain as is)
31% 11% 55% 3%
Expects company to grow significantly 11% 6% 73% 10%
Expects company to contract significantly 54% 12% 34% 1%
Employer currently has apprentice(s) 22% 9% 64% 5%
Currently has apprentice(s) and expects company to grow significantly
8% 4% 74% 14%
Currently has apprentice(s) and expects company to contract significantly
43% 12% 43% 2%
107

© Crown copyright 2016
This publication (not including logos) is licensed under the terms of the Open Government Licence v3.0 except where otherwise stated. Where we have identified any third party copyright information you will need to obtain permission from the copyright holders concerned.
To view this licence: visit www.nationalarchives.gov.uk/doc/open-government-licence/version/3 email [email protected] write to Information Policy Team, The National Archives, Kew, London, TW9 4DU
About this publication: enquiries www.education.gov.uk/contactus download www.gov.uk/government/publications