Applying TVET Solution to Address Performance Limitations in the Jamaican Economy Presenter:...
25
Applying TVET Solution to Address Performance Limitations in the Jamaican Economy Presenter: Christopher Bryan Masters Student School of Education, UWI, Mona May 13-15, 2015 Second International Conference on TVET in the Caribbean
-
Upload
duane-harris -
Category
Documents
-
view
215 -
download
0
Transcript of Applying TVET Solution to Address Performance Limitations in the Jamaican Economy Presenter:...

Applying TVET Solution to Address Performance Limitations in the
Jamaican Economy
Presenter: Christopher BryanMasters Student
School of Education, UWI, MonaMay 13-15, 2015
Second International Conference on TVET in the Caribbean

Structure of Presentation• TVET UNESCO Definition
• Background and Methodology• Jamaica’s National Productivity
• Labour Force Information• Training received by Labour Force • Labour Productivity
• Competitiveness• Global Risks • Global Competitiveness• Jamaica’s Economic Condition 2013
Global Risk Water CrisesNon Revenue Water
• Water Crises in Singapore- TVET Solutions Applied• Conclusion• Recommendations
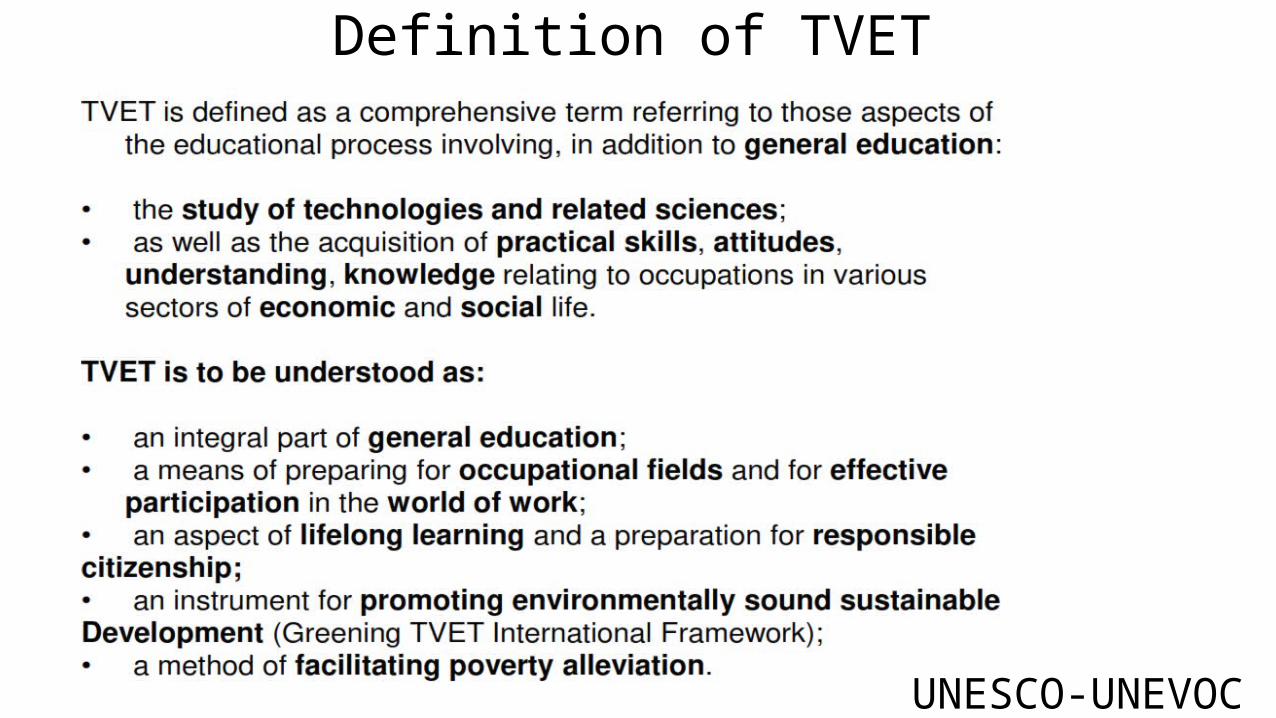
Definition of TVET
UNESCO-UNEVOC

TVET is the Paradigm, the difference between the Developing and the Developed Economies.TVET answers the powerful question.
How it can be done?
Through a T.I.P- Technological Innovation by People

Definition of TVET
UNESCO-UNEVOC

Background and Methodology
2014 Jamaica –ve 0.04 %
2014 USA +ve 2.4 %2002 Jamaica +ve 3.9 %2002 USA +ve 1.6 %
http://ieconomics.com/gdp-annual-growth-rate-jamaica-us
Average Annual Growth Rate USA +ve 2.2 %
Average Annual Growth Rate Jam -ve .04 %
Jamaica vs. USA Average Annual Growth Rate 1996-2014
NATIONAL PRODUCTION- GDP

Background and MethodologyComparison of Countries with High Debt-to GDP Ratio during the Decade of the 1970’s
Source: WDI
GDP/Capita in US$ GDP/Capita in $US
1970 2008 2012
Rank CountryGDP/Capita 1970
Ratio to Jamaica Rank Country
GDP/Capita 2008
Ratio to Jamaica Rank Country
GDP/Capita 2012
Ratio to Jamaica
1Trinidad & Tobago 4,615 1.4 1Singapore 27,991 7.4 1Singapore 51,162 9.2
2Singapore 4,531 1.4 2Portugal 11,413 3 2Portugal 20,179 3.6
3Uruguay 4,496 1.3 3Trinidad & Tobago 10,981 2.9 3
Trinidad & Tobago 19,018 3.4
4Portugal 4,282 1.3 4Uruguay 8,788 2.3 4Chile 15,776 2.8
5Mexico 3,576 1.1 5Mexico 6,592 1.7 5Uruguay 14,614 2.6
6Jamaica 3,355 1 6Chile 6,592 1.6 6Mexico 10,247 1.8
7Panama 2,741 0.8 7Panama 5,587 1.5 7Panama 9,919 1.8
8Costa Rica 2,371 0.7 8Costa Rica 5,196 1.4 8Costa Rica 9,673 1.7
9Chile 2,203 0.7 9 Jamaica 3,792 1 9Jamaica 5,541 1.0

National Productivity- GDP & Labour Productivity• GDP declined in 2013 by 3.1% over 2012 to US$5289.97 (ESSJ 2013)
• Between 1972 to 2007 real GDP grew 0.5% per annum
• While labour productivity or output per worker declined by 1.3 % per annum
(Productivity Summary Report 1972 to 2007, 2009)• Jamaica’s TFP per worker also lags significantly behind most other countries in
the LAC region

Training Received By Labour Force 2008-2013
Source: STATIN http://statinja.gov.jm/LabourForce/labourforceTrainingReceived.aspx
2008 totalled 25%
Between 2011 & 2013 totalled 31%
Improving percentage of worker’s skill level by 1 percent can increase productivity growth by 0.03% (Bryson, 2011,Firm Productivity in Jamaica, )
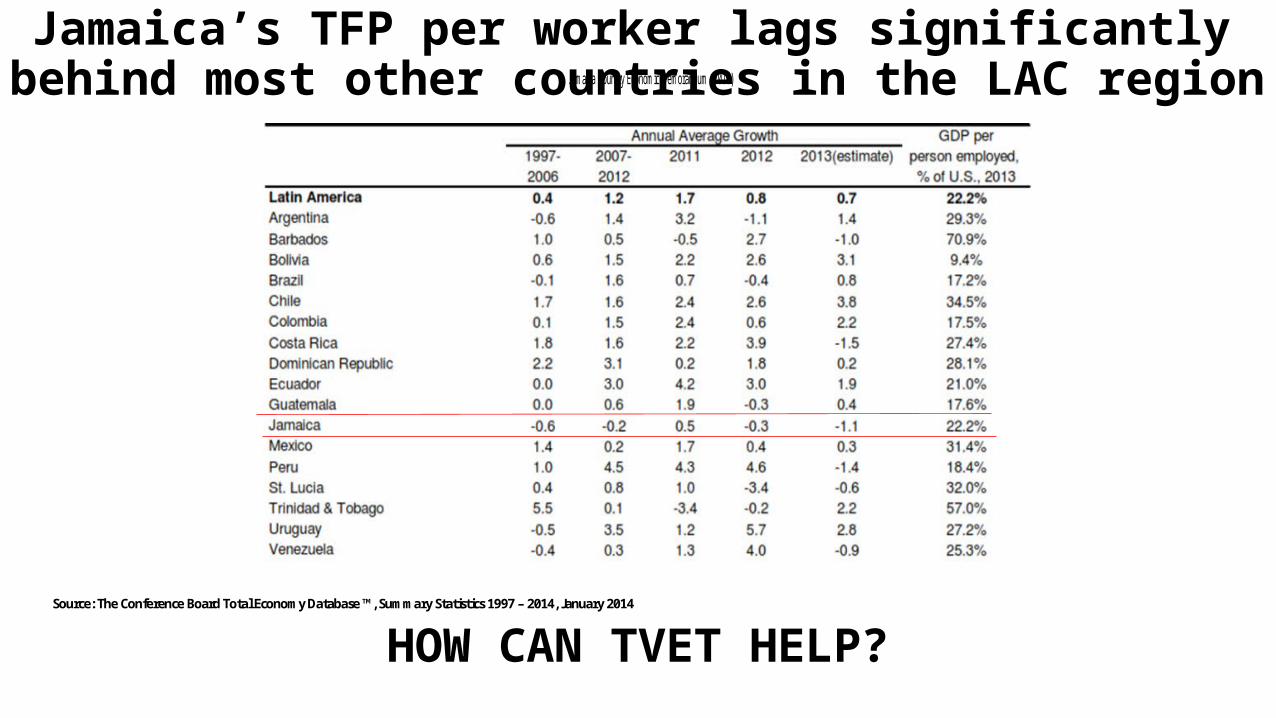
Jamaica’s TFP per worker lags significantly behind most other countries in the LAC region
HOW CAN TVET HELP?
Jamaica Country Economic Memorandum (2011)
Source: The Conference Board Total Economy Database ™, Summary Statistics 1997 – 2014, January 2014
TVET Providing Opportunity out of a Crises
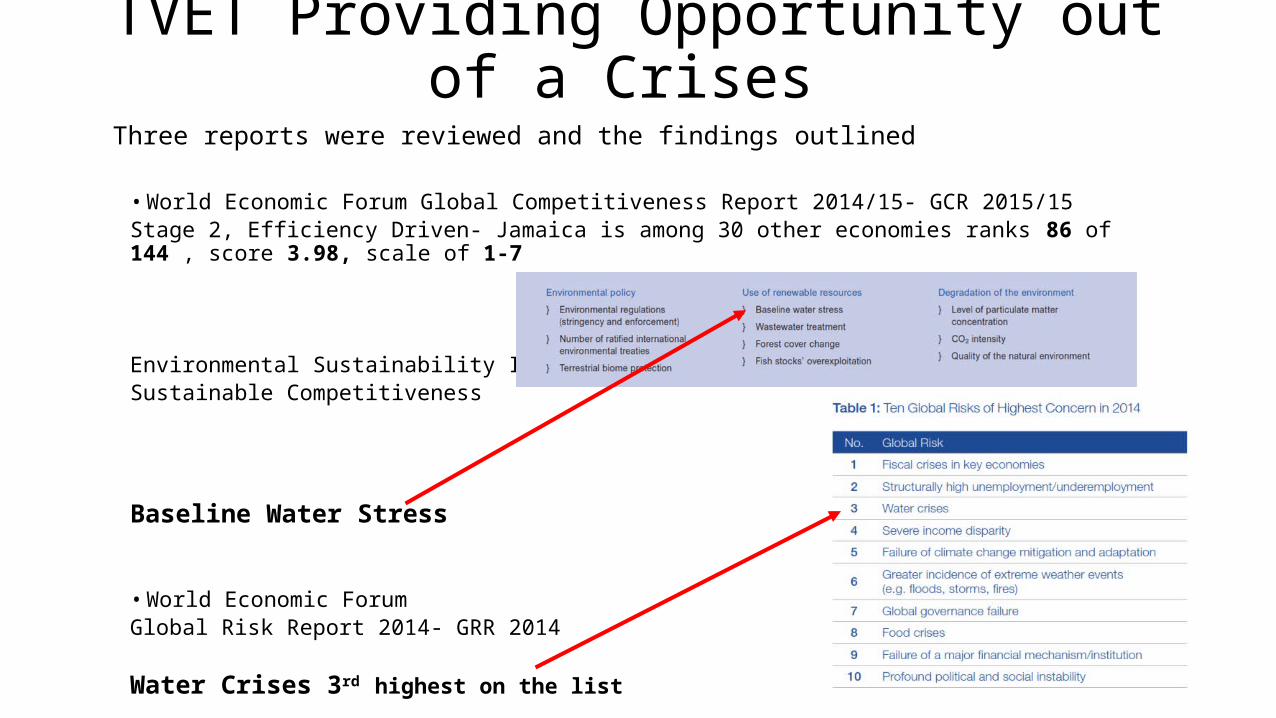
Three reports were reviewed and the findings outlined
• World Economic Forum Global Competitiveness Report 2014/15- GCR 2015/15Stage 2, Efficiency Driven- Jamaica is among 30 other economies ranks 86 of 144 , score 3.98, scale of 1-7
Environmental Sustainability Index Sustainable Competitiveness
Baseline Water Stress
• World Economic Forum Global Risk Report 2014- GRR 2014
Water Crises 3rd highest on the list
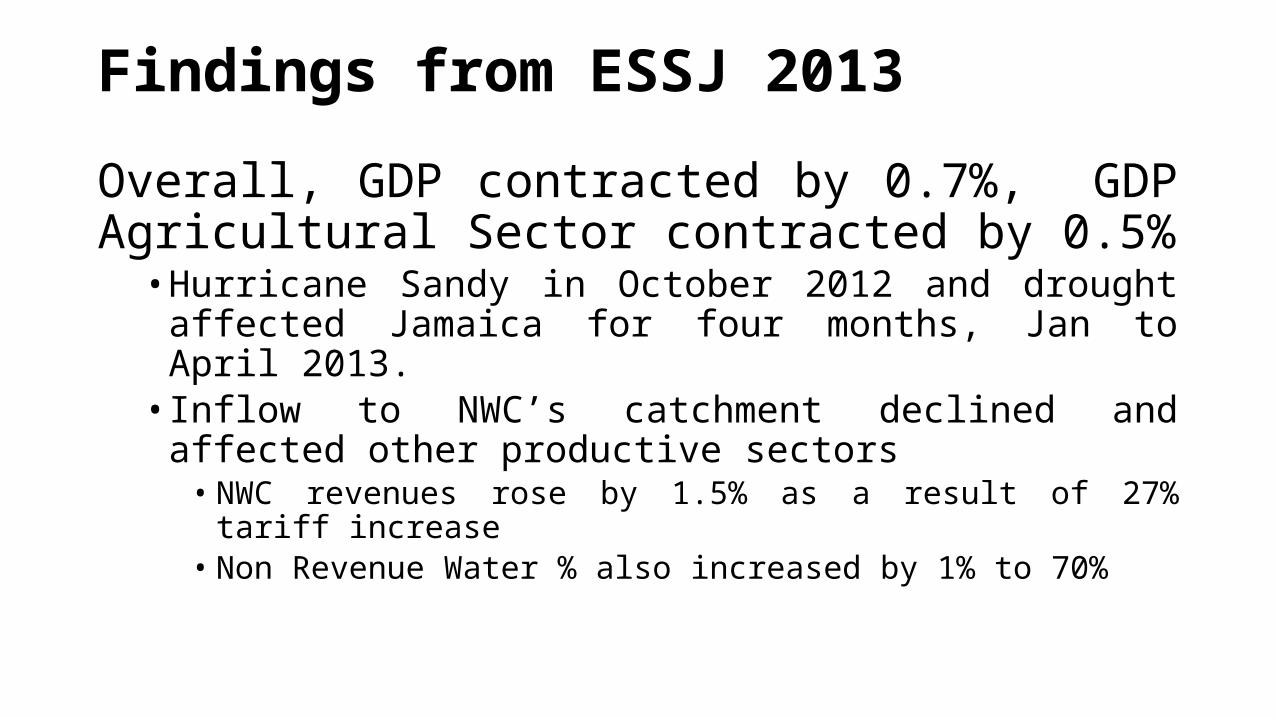
Findings from ESSJ 2013
Overall, GDP contracted by 0.7%, GDP Agricultural Sector contracted by 0.5%• Hurricane Sandy in October 2012 and drought affected Jamaica for
four months, Jan to April 2013.• Inflow to NWC’s catchment declined and affected other productive
sectors• NWC revenues rose by 1.5% as a result of 27% tariff increase• Non Revenue Water % also increased by 1% to 70%

OUR NWC’s Rate Determination Notice for Tariff Increase• 23% granted in 2008 • 27% was granted for four years 2013 to 2018. Impact higher inflation• Non Revenue Water( NRW) losses up from 69% in 2012 to 70% 2013• $36b Operations Budget(2013)
Is this tariff policy approach to reducing and managing NRW the only way?Is this sustainable?
Turn to TVET Solutions like Singapore
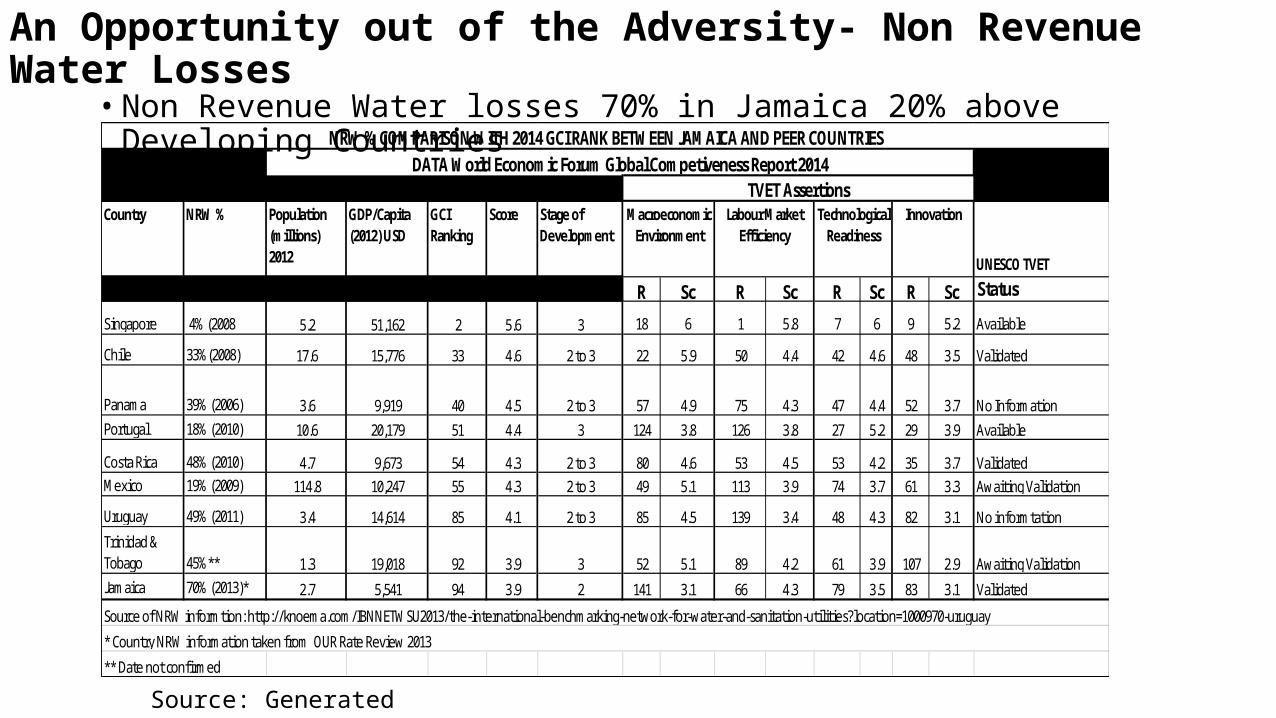
An Opportunity out of the Adversity- Non Revenue Water Losses
• Non Revenue Water losses 70% in Jamaica 20% above Developing Countries
Country NRW % Population (millions)2012
GDP/Capita (2012) USD
GCI Ranking
Score Stage of Development
UNESCO TVET
R Sc R Sc R Sc R Sc Status
Singapore 4% (2008 5.2 51,162 2 5.6 3 18 6 1 5.8 7 6 9 5.2 Available
Chile 33%(2008) 17.6 15,776 33 4.6 2 to 3 22 5.9 50 4.4 42 4.6 48 3.5 Validated
Panama 39% (2006) 3.6 9,919 40 4.5 2 to 3 57 4.9 75 4.3 47 4.4 52 3.7 No InformationPortugal 18% (2010) 10.6 20,179 51 4.4 3 124 3.8 126 3.8 27 5.2 29 3.9 Available
Costa Rica 48% (2010) 4.7 9,673 54 4.3 2 to 3 80 4.6 53 4.5 53 4.2 35 3.7 ValidatedMexico 19% (2009) 114.8 10,247 55 4.3 2 to 3 49 5.1 113 3.9 74 3.7 61 3.3 Awaiting Validation
Uruguay 49% (2011) 3.4 14,614 85 4.1 2 to 3 85 4.5 139 3.4 48 4.3 82 3.1 No informtation
Trinidad & Tobago 45%** 1.3 19,018 92 3.9 3 52 5.1 89 4.2 61 3.9 107 2.9 Awaiting ValidationJamaica 70% (2013)* 2.7 5,541 94 3.9 2 141 3.1 66 4.3 79 3.5 83 3.1 Validated
Source of NRW informtion: http://knoema.com/IBNNETWSU2013/the-international-benchmarking-network-for-water-and-sanitation-utilities?location=1000970-uruguay
** Date not confirmed
* Country NRW information taken from OUR Rate Review 2013
NRW % COMPARISON WITH 2014 GCI RANK BETWEEN JAMAICA AND PEER COUNTRIESDATA World Economic Forum Global Competiveness Report 2014
TVET AssertionsMacroeconomic
EnvironmentLabour Market
EfficiencyTechnological
ReadinessInnovation
Source: Generated
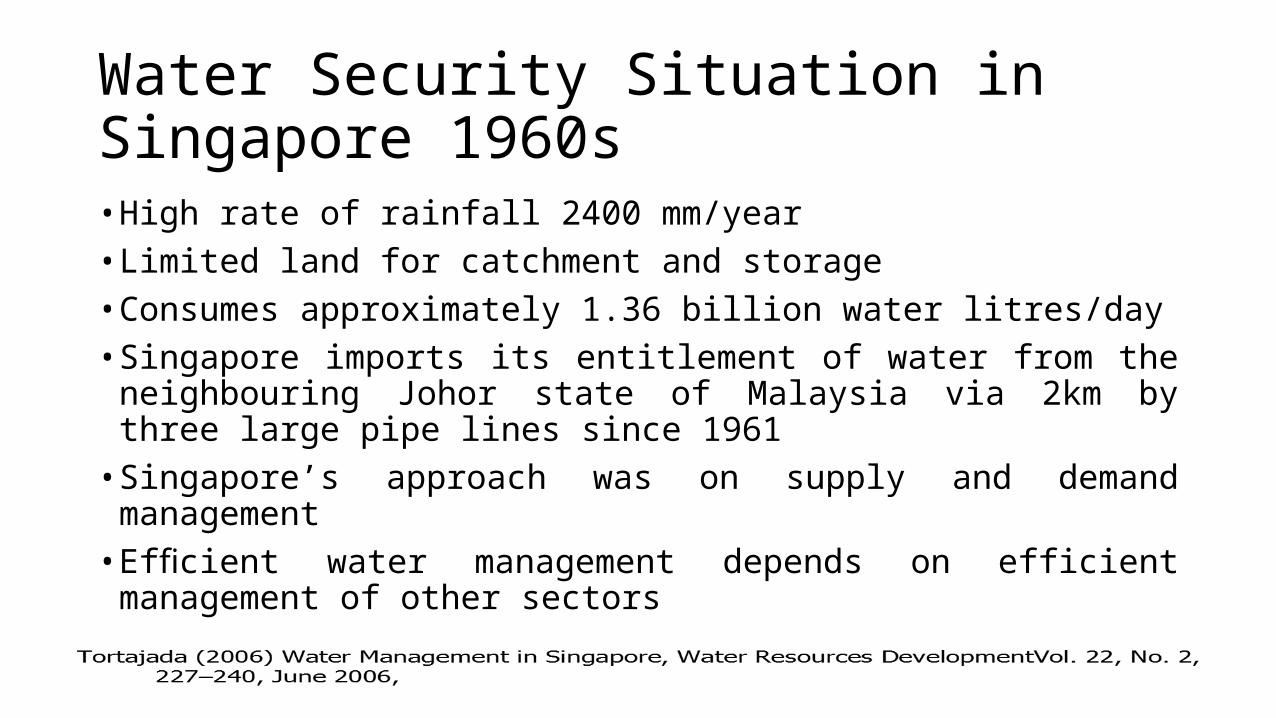
Water Security Situation in Singapore 1960s• High rate of rainfall 2400 mm/year• Limited land for catchment and storage• Consumes approximately 1.36 billion water litres/day• Singapore imports its entitlement of water from the neighbouring
Johor state of Malaysia via 2km by three large pipe lines since 1961• Singapore’s approach was on supply and demand management• Efficient water management depends on efficient management of
other sectors
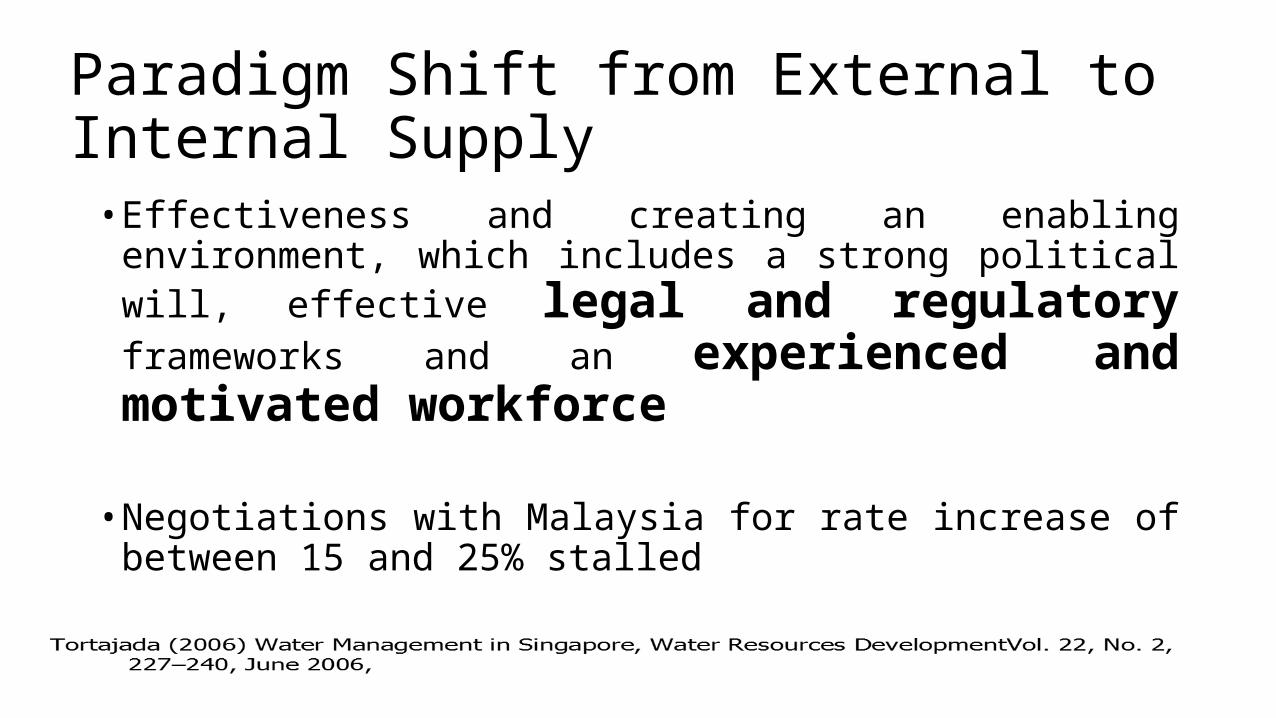
Paradigm Shift from External to Internal Supply• Effectiveness and creating an enabling environment, which includes a
strong political will, effective legal and regulatory frameworks and an experienced and motivated workforce
• Negotiations with Malaysia for rate increase of between 15 and 25% stalled
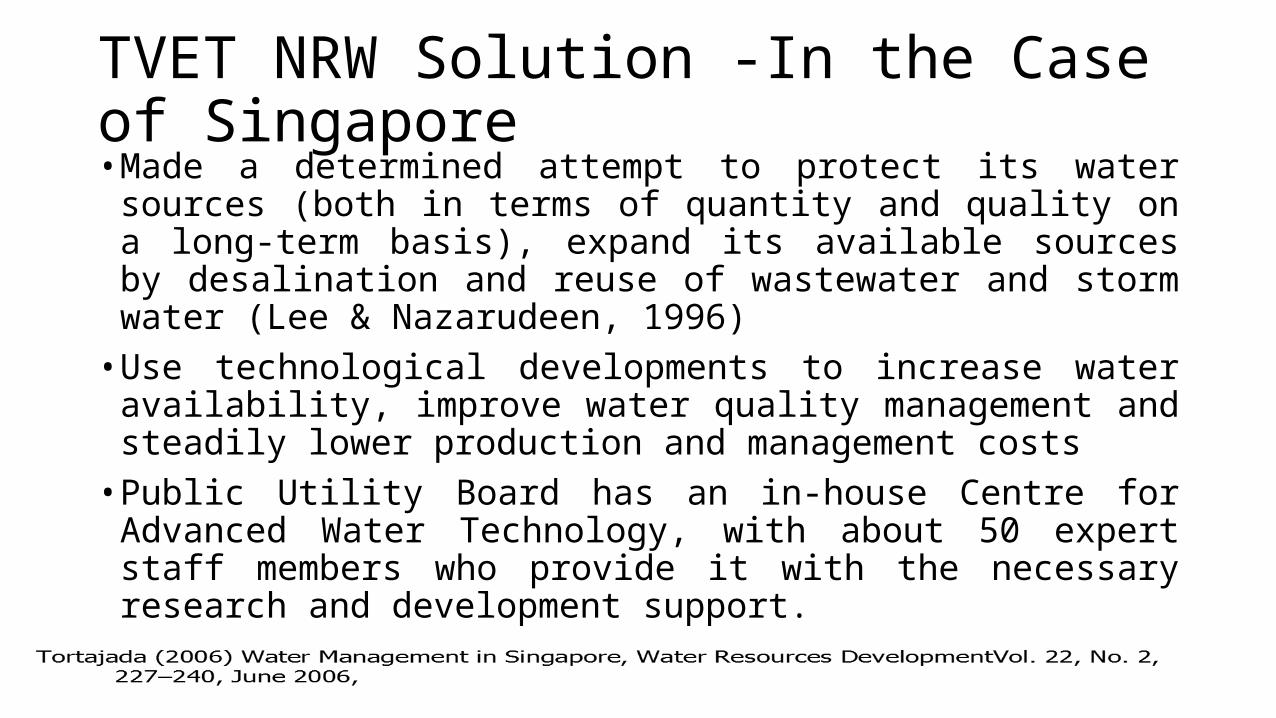
TVET NRW Solution -In the Case of Singapore• Made a determined attempt to protect its water sources (both in
terms of quantity and quality on a long-term basis), expand its available sources by desalination and reuse of wastewater and storm water (Lee & Nazarudeen, 1996)• Use technological developments to increase water availability,
improve water quality management and steadily lower production and management costs• Public Utility Board has an in-house Centre for Advanced Water
Technology, with about 50 expert staff members who provide it with the necessary research and development support.

TVET Solution -In the Case of Singapore• In late 2005, Tuas Desalination Plant, the first municipal-scale
seawater desalination plant, was opened at a cost of $200 million. Designed and constructed by a local water company.• Also, In 1998, PUB and the Ministry of the Environment formulated a
reclamation study. The prototype plant, located on a site downstream of the Bedok Water Reclamation Plant, started functioning in May 2000, and produced 10 000 m3 of water per day.• Wastewater is reclaimed after secondary treatment by means of
advanced dual-membrane and ultraviolet technologies, NEWater and use for industrial processes.
Tortajada (2006) Water Management in Singapore, Water Resources DevelopmentVol. 22, No. 2, 227–240, June 2006,

Reduction of NRW or Unaccounted for Water (UFW)
• The supply of water is further expanded by reducing unaccounted for water (UFW), which is defined as actual water loss due to leaks, and apparent water loss arising from meter inaccuracies.• Illegal connection is not an issue in Singapore

Results in Singapore based on TVET solutions
9% in 1990 4-5% in 2004

Conclusion on Non Revenue Water Example• In the Nine Peer Countries NRW is less than 50% • NRW losses can be effectively and sustainably reduced • Tariff Revenue system encourages inefficiency• TVET can be a strategic solution to improve the
environmental sustainability efficiency index for Jamaica.

100% Non Revenue Water Losses
0% Non Revenue Water Losses
Comparison of Non Revenue Water (NRW) Management in both Countries
4-5%
70%
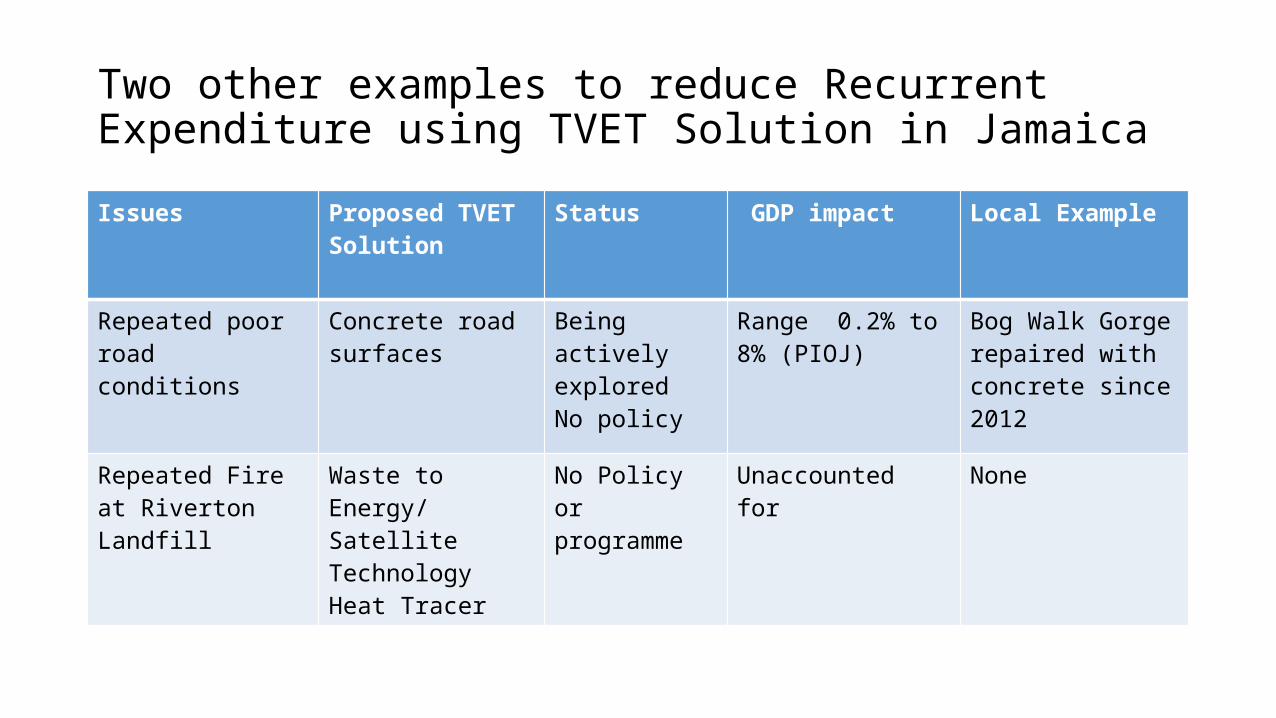
Two other examples to reduce Recurrent Expenditure using TVET Solution in JamaicaIssues Proposed TVET
Solution Status GDP impact Local Example
Repeated poor road conditions
Concrete road surfaces
Being actively exploredNo policy
Range 0.2% to 8% (PIOJ)
Bog Walk Gorge repaired with concrete since 2012
Repeated Fire at Riverton Landfill
Waste to Energy/ Satellite Technology Heat Tracer
No Policy or programme
Unaccounted for None

Recommendations for Jamaica
• TVET solutions is recommended to be employed to build a resilient and environmentally sustainable economy through analysis and emphasis on mitigating against the Global Risks by a time and cost to be specified using TVET intervention to reduce recurrent expenditure; thereby improving the environmental sustainability efficiency index• GLOBAL COMPETIVENESS INDEX will automatically improve on that basis
while Jamaica’s National Production, GDP, grows
Apply TVET solutions to solve Jamaica’s Economic Problems
now.

TVET WILL DO IT!