Applying Six Sigma Methodology to the Admissions Process ...
14
Old Dominion University ODU Digital Commons Engineering Technology Faculty Publications Engineering Technology 2008 Applying Six Sigma Methodology to the Admissions Process in Higher Education Alok Verma Old Dominion University, [email protected] Follow this and additional works at: hps://digitalcommons.odu.edu/engtech_fac_pubs Part of the Engineering Education Commons , and the Operational Research Commons is Conference Paper is brought to you for free and open access by the Engineering Technology at ODU Digital Commons. It has been accepted for inclusion in Engineering Technology Faculty Publications by an authorized administrator of ODU Digital Commons. For more information, please contact [email protected]. Repository Citation Verma, Alok, "Applying Six Sigma Methodology to the Admissions Process in Higher Education" (2008). Engineering Technology Faculty Publications. 34. hps://digitalcommons.odu.edu/engtech_fac_pubs/34 Original Publication Citation Verma, A. (2008). Applying Six Sigma methodology to the admissions process in higher education. Paper presented at the 2008 ASEE Annual Conference and Exposition, Pisburgh, Pennsylvania.
Transcript of Applying Six Sigma Methodology to the Admissions Process ...

Old Dominion UniversityODU Digital Commons
Engineering Technology Faculty Publications Engineering Technology
2008
Applying Six Sigma Methodology to theAdmissions Process in Higher EducationAlok VermaOld Dominion University, [email protected]
Follow this and additional works at: https://digitalcommons.odu.edu/engtech_fac_pubs
Part of the Engineering Education Commons, and the Operational Research Commons
This Conference Paper is brought to you for free and open access by the Engineering Technology at ODU Digital Commons. It has been accepted forinclusion in Engineering Technology Faculty Publications by an authorized administrator of ODU Digital Commons. For more information, pleasecontact [email protected].
Repository CitationVerma, Alok, "Applying Six Sigma Methodology to the Admissions Process in Higher Education" (2008). Engineering TechnologyFaculty Publications. 34.https://digitalcommons.odu.edu/engtech_fac_pubs/34
Original Publication CitationVerma, A. (2008). Applying Six Sigma methodology to the admissions process in higher education. Paper presented at the 2008 ASEEAnnual Conference and Exposition, Pittsburgh, Pennsylvania.

AC 2008-147: APPLYING SIX SIGMA METHODOLOGY TO THE ADMISSIONSPROCESS IN HIGHER EDUCATION
Alok Verma, Old Dominion UniversityDr. Alok K. Verma is Ray Ferrari Professor and, Director of the Lean Institute at Old DominionUniversity. He also serves as the Director of the Automated Manufacturing Laboratory and METProgram Director. Alok received his B.S. in Aeronautical Engineering from IIT Kanpur, MS inEngineering Mechanics and PhD in Mechanical Engineering from ODU. Prof. Verma is alicensed professional engineer in the state of Virginia, a certified manufacturing engineer and hascertifications in Lean Manufacturing and Six Sigma. He has organized several internationalconferences as General Chair, including ICAM-2006 and ICAM-1999 and also serves asassociate editor for three International Journals. His scholarly publications include 26 journalpapers and 46 papers in conference proceedings. Dr. Verma has developed and delivered trainingprogram in Lean Enterprise & Design for Manufacturing for Northrop Grumman Newport News,STIHL and several other companies in U.S. He has developed simulation based training programsfor shipbuilding and repair industry under a grant from the National Shipbuilding ResearchProgram (NSRP). He is well known internationally and has been invited to deliver keynoteaddresses at several national and international conferences on Lean/Agile manufacturing. Dr.Verma has received the Regional Alumni Award for Excellence for contribution to LeanManufacturing research, the International Education Award at ODU and Ben Sparks Medal byASME. He is active in ASME, ASEE, SME and SNAME. Dr. Verma continues to serve theHampton Roads community in various leadership positions.
© American Society for Engineering Education, 2008
Page 13.215.1
Applying Six Sigma Methodology to the Admissions Process in
Higher Education
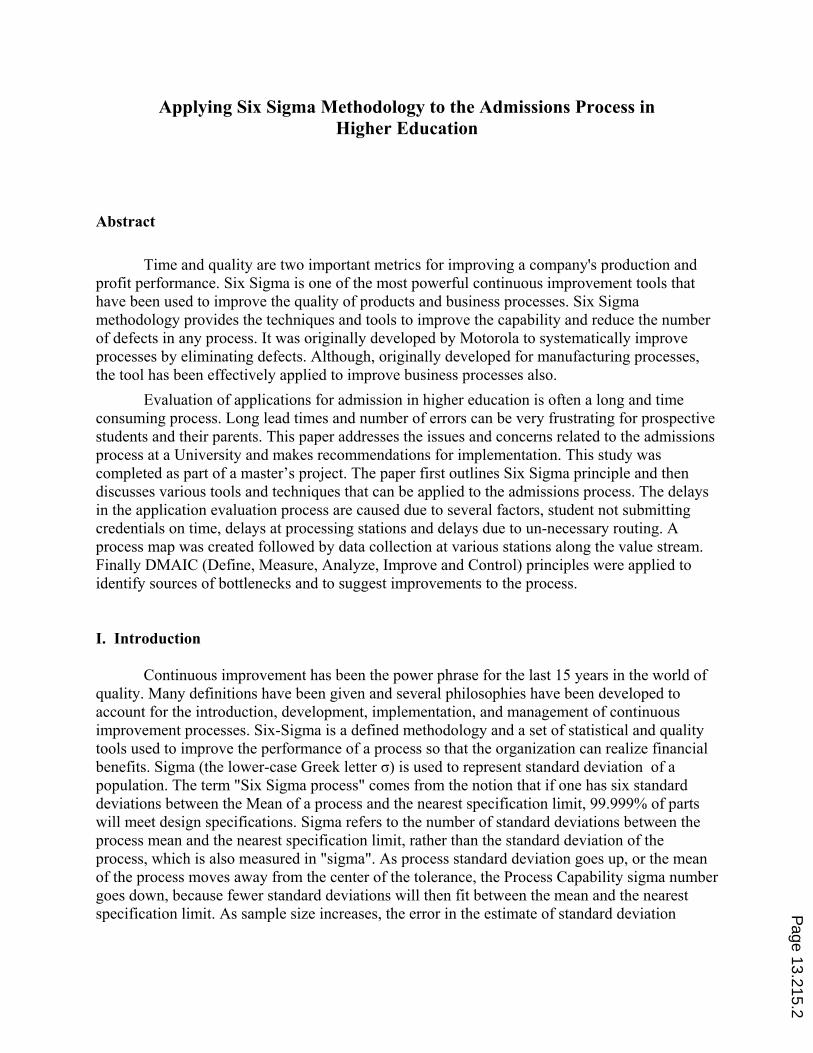
Abstract
Time and quality are two important metrics for improving a company's production and
profit performance. Six Sigma is one of the most powerful continuous improvement tools that
have been used to improve the quality of products and business processes. Six Sigma
methodology provides the techniques and tools to improve the capability and reduce the number
of defects in any process. It was originally developed by Motorola to systematically improve
processes by eliminating defects. Although, originally developed for manufacturing processes,
the tool has been effectively applied to improve business processes also.
Evaluation of applications for admission in higher education is often a long and time
consuming process. Long lead times and number of errors can be very frustrating for prospective
students and their parents. This paper addresses the issues and concerns related to the admissions
process at a University and makes recommendations for implementation. This study was
completed as part of a master’s project. The paper first outlines Six Sigma principle and then
discusses various tools and techniques that can be applied to the admissions process. The delays
in the application evaluation process are caused due to several factors, student not submitting
credentials on time, delays at processing stations and delays due to un-necessary routing. A
process map was created followed by data collection at various stations along the value stream.
Finally DMAIC (Define, Measure, Analyze, Improve and Control) principles were applied to
identify sources of bottlenecks and to suggest improvements to the process.
I. Introduction
Continuous improvement has been the power phrase for the last 15 years in the world of
quality. Many definitions have been given and several philosophies have been developed to
account for the introduction, development, implementation, and management of continuous
improvement processes. Six-Sigma is a defined methodology and a set of statistical and quality
tools used to improve the performance of a process so that the organization can realize financial
benefits. Sigma (the lower-case Greek letter j) is used to represent standard deviation of a
population. The term "Six Sigma process" comes from the notion that if one has six standard
deviations between the Mean of a process and the nearest specification limit, 99.999% of parts
will meet design specifications. Sigma refers to the number of standard deviations between the
process mean and the nearest specification limit, rather than the standard deviation of the
process, which is also measured in "sigma". As process standard deviation goes up, or the mean
of the process moves away from the center of the tolerance, the Process Capability sigma number
goes down, because fewer standard deviations will then fit between the mean and the nearest
specification limit. As sample size increases, the error in the estimate of standard deviation Page 13.215.2
converges much more slowly than the estimate of the mean. It follows that estimates of defect
rates can be very greatly influenced by uncertainty in the estimate of standard deviation.
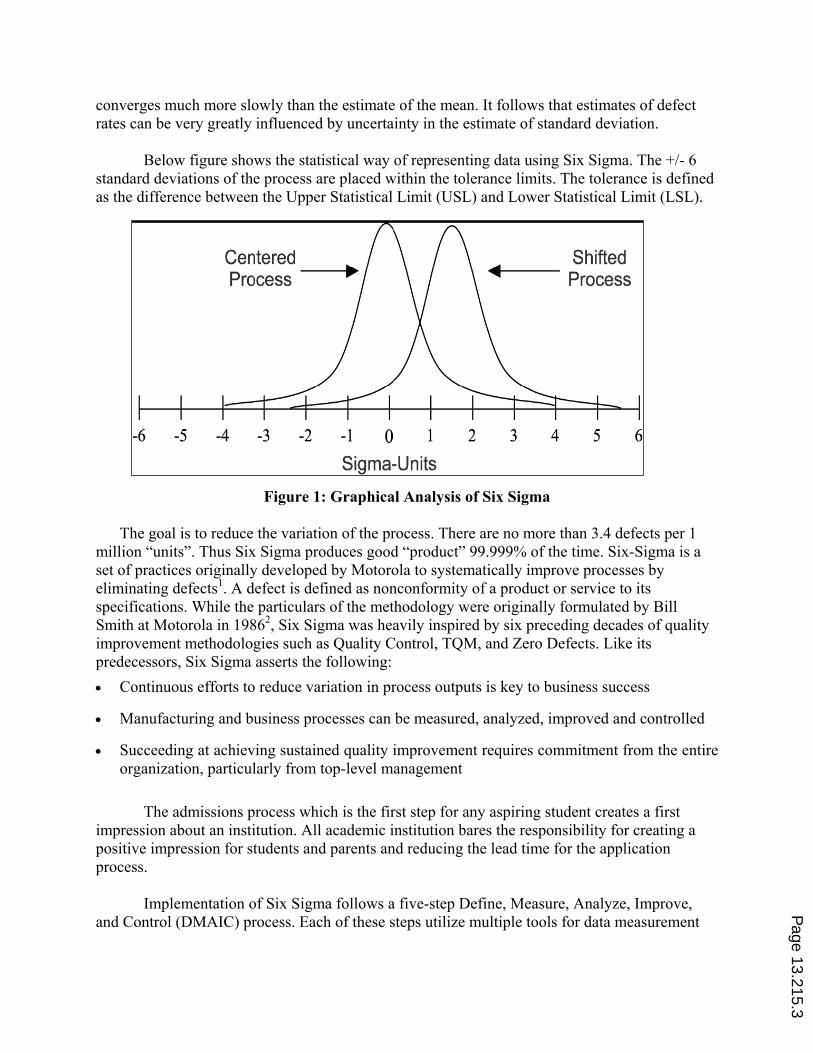
Below figure shows the statistical way of representing data using Six Sigma. The +/- 6
standard deviations of the process are placed within the tolerance limits. The tolerance is defined
as the difference between the Upper Statistical Limit (USL) and Lower Statistical Limit (LSL).
Figure 1: Graphical Analysis of Six Sigma
The goal is to reduce the variation of the process. There are no more than 3.4 defects per 1
million “units”. Thus Six Sigma produces good “product” 99.999% of the time. Six-Sigma is a
set of practices originally developed by Motorola to systematically improve processes by
eliminating defects1. A defect is defined as nonconformity of a product or service to its
specifications. While the particulars of the methodology were originally formulated by Bill
Smith at Motorola in 19862, Six Sigma was heavily inspired by six preceding decades of quality
improvement methodologies such as Quality Control, TQM, and Zero Defects. Like its
predecessors, Six Sigma asserts the following:
‚ Continuous efforts to reduce variation in process outputs is key to business success
‚ Manufacturing and business processes can be measured, analyzed, improved and controlled
‚ Succeeding at achieving sustained quality improvement requires commitment from the entire
organization, particularly from top-level management
The admissions process which is the first step for any aspiring student creates a first
impression about an institution. All academic institution bares the responsibility for creating a
positive impression for students and parents and reducing the lead time for the application
process.
Implementation of Six Sigma follows a five-step Define, Measure, Analyze, Improve,
and Control (DMAIC) process. Each of these steps utilize multiple tools for data measurement
Page 13.215.3
Centered Process ----
Shifted Process
-6 -5 -4 -3 -2 -1 0 1 2 3 4 5 6
Sigma-Units
analysis and control. In the following sections, we apply each of these steps to the admissions
process.
II. Define Phase
The admissions process for undergraduate students at ______ has been characterized by
long lead times for application processing. This in turn has resulted in decrease in acceptance
rate and selection of qualified applicants. The above is a result of a number of factors like –
tracking, communication, technology, staff, training, etc. Sometimes the delays are due to
students not submitting the required transcripts on time, but most of the times other technical
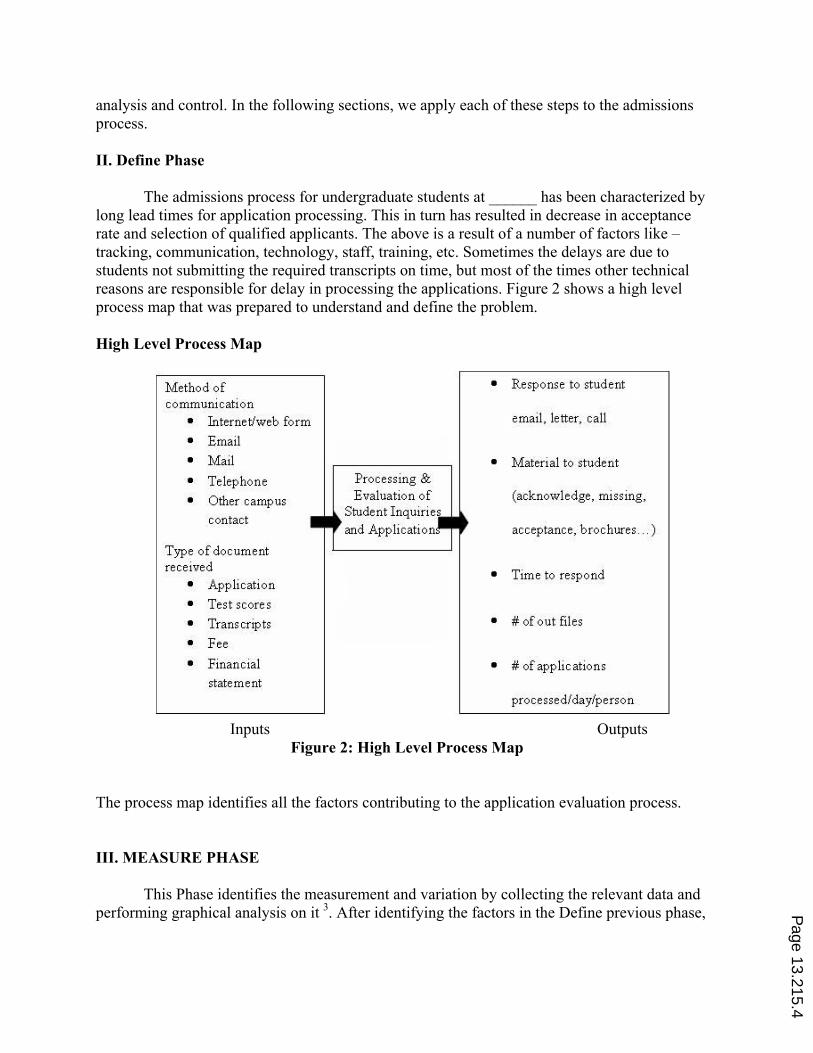
reasons are responsible for delay in processing the applications. Figure 2 shows a high level
process map that was prepared to understand and define the problem.
High Level Process Map
Inputs Outputs
Figure 2: High Level Process Map
The process map identifies all the factors contributing to the application evaluation process.
III. MEASURE PHASE
This Phase identifies the measurement and variation by collecting the relevant data and
performing graphical analysis on it 3. After identifying the factors in the Define previous phase, P
age 13.215.4
Method of communication
• Internet/web form
• Telephone
• Other campus contact
Type of document received
• Application
• Test scores
• Transcripts
• Fee
• Financial statement
Processing & Evaluation of
Student Inquiries and Application
• Response to student
email, letter, call
• Material to student
(acknowledge, missing,
acceptance, brochures . .)
• Time to respond
• # of out files
• # of applications
processed/day/person
the admissions office was contacted for application processing data. Undergraduate applications
were classified into three categories: Second Degree, Transfer and Freshman.
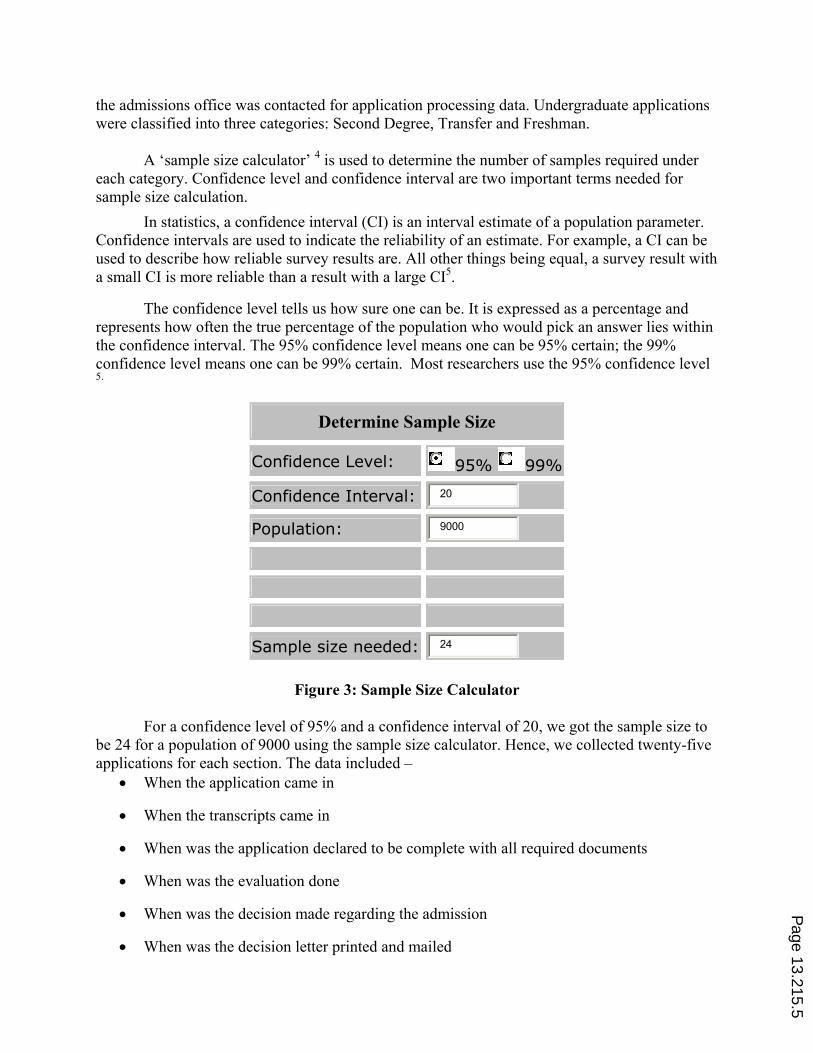
A ‘sample size calculator’ 4 is used to determine the number of samples required under
each category. Confidence level and confidence interval are two important terms needed for
sample size calculation.
In statistics, a confidence interval (CI) is an interval estimate of a population parameter.
Confidence intervals are used to indicate the reliability of an estimate. For example, a CI can be
used to describe how reliable survey results are. All other things being equal, a survey result with
a small CI is more reliable than a result with a large CI5.
The confidence level tells us how sure one can be. It is expressed as a percentage and
represents how often the true percentage of the population who would pick an answer lies within
the confidence interval. The 95% confidence level means one can be 95% certain; the 99%
confidence level means one can be 99% certain. Most researchers use the 95% confidence level 5.
Determine Sample Size
Confidence Level: 95% 99%
Confidence Interval: 20
Population: 9000
Sample size needed: 24
Figure 3: Sample Size Calculator
For a confidence level of 95% and a confidence interval of 20, we got the sample size to
be 24 for a population of 9000 using the sample size calculator. Hence, we collected twenty-five
applications for each section. The data included –
‚ When the application came in
‚ When the transcripts came in
‚ When was the application declared to be complete with all required documents
‚ When was the evaluation done
‚ When was the decision made regarding the admission
‚ When was the decision letter printed and mailed
Page 13.215.5

The data was tabulated in Microsoft Excel to calculate the mean, standard deviation and
to perform graphical analysis. For each of the three categories of applications, processing steps
were identified along with the time required for processing in number of days.
Second Degree Applications:
Step 1: Application received – Transcripts received
Step 2: Transcripts received – Application complete
Step 3: Application complete – Sent for departmental review
Step 4: Sent for departmental review – Departmental chair approval
Step 5: Departmental Chair approval - College Dean approval
Step 6: College Dean approval – Sent back to Admissions office
Step 7: Admissions office – Admission granted
Step 8: Admission granted – Admission letter printed
The mean and standard deviation for the data collected is calculated to understand which
steps are causing delays in the process.
Table 1: Data for Second Degree Applications
Second Degree Application Processing Times
0
5
10
15
20
25
Step
1
Step
2
Step
3
Step
4
Step
5
Step
6
Step
7
Step
8
Steps Involved in the Application Process
Nu
mb
er o
f A
pp
lica
tio
ns
Mean
Standard Deviation
Figure 4: Graphical Representation of Mean and Standard Deviation for Second Degree
Applications
Page 13.215.6
Second Degree Applications 1 2 3 4 5 6 7 8 9 10 11 12 13 14 15 16 17 18 19 20 21 22 23 24 25 IMean Std. Deriation
Step 1 2 I 27 57 5 27 9 75 8 3 0 16 5 2 I 7 7 13 12 0 7 0 28 0 2 12.56 18.00684314 Step2 I 0 0 I 27 0 I 8 2 4 8 0 17 0 I 14 2 6 0 4 4 21 0 0 0 4.84 7.192662928 Step3 0 0 6 0 I 2 113 1 7 4 2 1 I 0 0 20 4 3 0 3 5 14 1 0 10 7.92 21.97256471 Step4 3 5 27 37 4 27 26 9 8 4 3 12 12 12 4 7 25 29 9 13 8 61 6 29 21 16.04 13.57491805 Step5 2 3 7 0 5 119 0 4 1 7 3 0 1 0 2 2 9 0 3 7 I 4 2 2 3 748 22.89649755 Step6 I 3 3 4 6 6 2 6 4 0 12 3 12 2 I 4 2 0 2 I 4 4 2 I 3 3.52 3.008255308 Step 7 I I 7 I I 8 I 2 I I 94 3 6 0 I 0 5 0 0 3 I 2 56 I I 7.88 20.62099901 Steps 4 2 I 3 6 6 11 9 2 4 0 4 4 2 34 2 3 I 2 4 2 4 0 9 3 .88 6 .. 525 64323

Transfer Application Processing Times
0
5
10
15
20
25
Step 1 Step 2 Step 3 Step 4 Step 5
Steps Involved in the Application Process
Nu
mb
er
of
Ap
pli
cati
on
s
Mean
Standard Deviation
Steps with longer processing time certainly need attention however, processes with
higher standard deviation may also warrant attention since the larger variation in processing
times may be result of an unstable process. From the graph above and the data collected, steps1,
2, 3, 5, 7 and 8 have longer processing times. Thus, we need to focus on these steps.
Transfer Applications:
The following steps are involved in the processing of transfer applications.
Step 1: Application received – Transcripts received
Step 2: Transcripts received – Application complete
Step 3: Application complete – Evaluation done
Step 4: Evaluation done – Admission granted
Step 5: Admission granted – Admission letter printed
Bringing together these steps and the relevant data for interpretation in Microsoft excel
sheet gives the following result.
Table 2: Data for Transfer Applications
Figure 5: Graphical Representation of Mean and Standard Deviation for Transfer
Applications
Page 13.215.7
Transfer Applications 1 2 3 4 5 6 7 8 9 10 11 12 13 14 15 16 17 18 19 20 21 22 23 24 25 Mean Std. Deriation
Step 1 29 II 1 4 9 5 36 36 35 83 1 45 8 83 27 15 1 16 17 8 24 54 2 j I 2214 21229774 Step2 5 70 18 4 39 II 4 3 3 3 14 5 5 1 1 4 3 3 92 6 2 10 0 5 9 12.8 21.76786623 Step3 11 5 0 21 0 2 9 4 4 19 12 12 16 66 0 14 19 5 10 0 7 21 34 6 11 1232 13.64615697 Step4 0 1 1 0 2 3 0 1 0 30 14 0 0 0 1 0 0 7 II 9 7 1 8 14 0 4.4 6.899275324 Step5 7 8 0 3 11 9 2 17 3 1 2 8 9 0 9 2 0 3 2 11 3 14 2 6 3 5.4 4.5607017

From the above graph, looking at the mean and standard deviation, we need to focus on
steps 1, 2, 3 and 4.
Freshman Applications:
Step 1: Application received – Transcripts received
Step 2: Transcripts received – Recommendations received
Step 3: Recommendations received – Application complete
Step 4: Application complete – Evaluation done
Step 5: Evaluation done – Admission granted
Step 6: Admission granted – Admission letter printed
Table 3: Data for Freshman Applications
Freshman Application Processing Times
0
5
10
15
20
25
Step 1 Step 2 Step 3 Step 4 Step 5 Step 6
Steps Involved in the Application Process
Nu
mb
er
of
Ap
pli
cati
on
s
Mean
Standard Deviation
Figure 6: Graphical Representation of Mean and Standard Deviation for Freshman
Applications
For the freshman applications, steps 1, 2, 3 and 4 have the largest mean and standard
deviation and are the main reasons for delay in the freshman applications.
Office Layout:
The office layout for all the three categories (second degree, transfer, freshman
applications) were drawn to evaluate the travel time and distance for documents from one step to
Page 13.215.8
Freshman Applic.atioos 1 2- 3 4 5 6 7 8 9 10 11 12 13 14 15 16 17 18 19 20 21 22 23 24 25 Mean Std, De1iation
Stepl 3 9 14 4 2 9 64 88 2 8 1 16 2 j 0 3 22 23 22 21 6 33 21 4 2 15.36 20.21460858 Step2 0 0 0 5 5 I 0 0 3 0 0 0 4 39 3 0 7 0 I I 0 0 0 0 0 2.76 7.659138333 Step3 6 10 34 2 2 I 4 7 72 29 12 6 3 I 5 II 10 0 12 4 35 4 2 7 3 1128 15.63206% Step4 0 2 4 0 0 0 2 9 34 0 0 2 3 2 I 55 3 8 8 2 1 14 I 30 I 7.28 12.99082753 Step5 0 0 0 0 0 0 0 I 2 I 0 I I 0 0 9 0 0 0 0 0 0 0 0 0 0.6 1.788854382 Step6 3 2 4 1 2 I 8 I I I 3 I 7 I 3 8 4 0 0 2 2 0 1 I 3 2.4 2.244994432

other. Complicated room layout can make the application staff tired, frustrated, confused leading
to delays.
Figure 7: Office Layout for Freshman/Transfer Applications Before
Figure 7 shows the room layout for freshman/transfer applications. The applications are
initially loaded into the computer by the coordinators, and then the applications are transferred to
another station for completion check. At step 3, the transfer evaluators make the decision for
admission. The front desk prepares the Admission letters. These letters are placed in the folders
for future reference and a copy of this letter is mailed to the student.
A similar procedure is followed for the second-degree applications. The only difference
is that these are sent to the respective departments to make decision on admission. Below is the
room layout for second-degree application process.
IV. Analyze Phase
At this stage of Six Sigma implementation, we have narrowed our focus on a distinct
group of processes that may be responsible for delays. During the analyze phase, we try to
identify the reasons for delay in these processes. Fish Bone Diagram also known as Cause and
Effect Diagram or Ishikawa diagram is used to analyze reasons behind the problem causing
areas.
Page 13.215.9
STEPS
STEP6
By Post
STEP _,
Front Desk Prep.es ADL
DCJCJCJ
STEP -
F1hng
D
Application D
Loaded D D STEPl
D D D
11
STEP3
Transfer Evaluator and Dec1S1on

Figure 8: Office Layout for Second Degree Applications Before
Cause and Effect Diagram / Fish Bone Diagram
The cause and effect diagram is used to explore all the potential or real causes (or inputs)
that result in a single effect (or output) 7. Causes are arranged to their level of importance or
detail, resulting in a depiction of relationships and hierarchy of events. Thus helps in the search
for root causes, identify areas where there may be problems, and compare the relative importance
of different causes 8. The cause and effect diagram is also known as fish bone diagram because it
was drawn to resemble the skeleton of a fish, with the main causal categories drawn as ‘bones’
attached to the spine of the fish. The fishbone diagram is also helpful in displaying the many
potential causes for a specific problem leading to a more robust solution.
V. Recommendations
After performing the analysis using fishbone diagram and looking at the above mentioned
causes for the delay in the admissions process we came up with the following recommendations.
‚ Triage process 11
–The staff should be aware of notifying the appropriate parties when a
situation arises, making sure the situation is handled properly, fixed and documented for
future purposes.
‚ Communication –The students should be sent reminders periodically every week
regarding their status of their application to their emails along with placing it online.
Page 13.215.10
lnEPio l Coll
-By Post
STEP9 Front Desk · Prepans ADLlelten
Application loaded by Application D Coordinators
s approval fonn from 6 Lfrom 9
STEP 12
Filing
Loads the
ications sealed in envelopes and thus application is complete
STEP 3 - DeJ>artment ,--S-T-EP-4--,1---- ,-I -S-TE_P_5--,
Chair Dean
D STEP I
D STEP6
D D STEP 7 D
y pre-requisites suggested, the application moves directly from 6 to 8-Evaluators load th,em
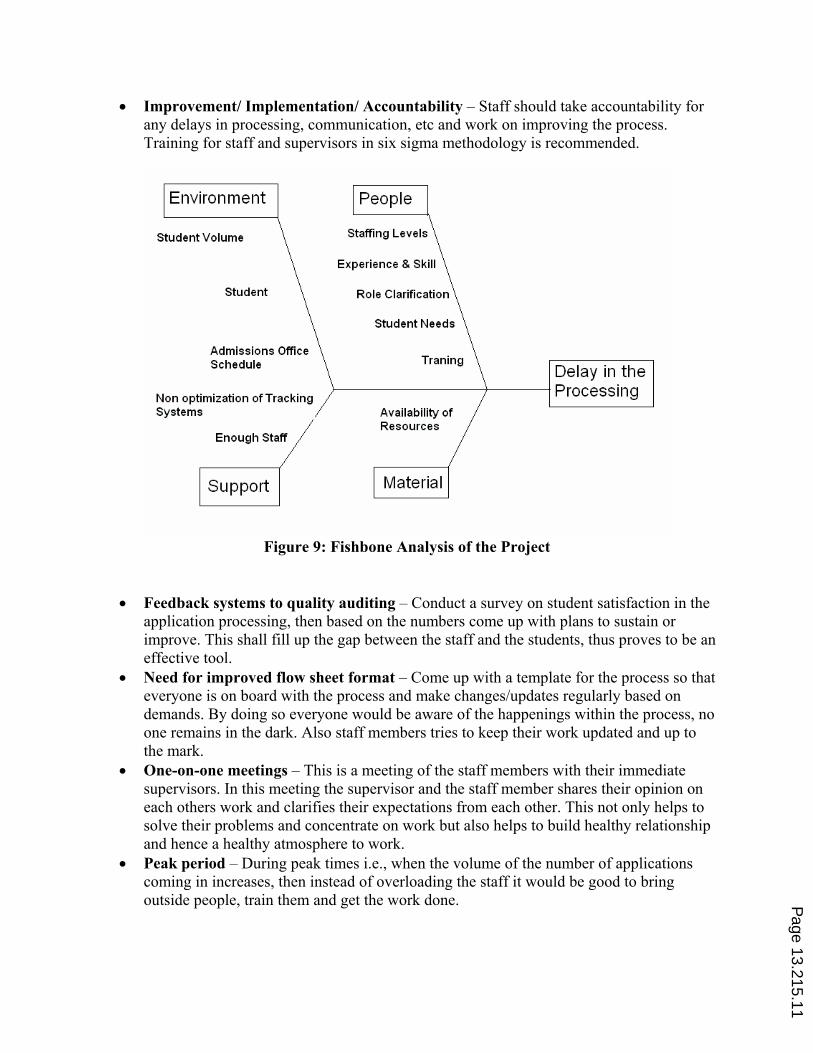
‚ Improvement/ Implementation/ Accountability – Staff should take accountability for
any delays in processing, communication, etc and work on improving the process.
Training for staff and supervisors in six sigma methodology is recommended.
Figure 9: Fishbone Analysis of the Project
‚ Feedback systems to quality auditing – Conduct a survey on student satisfaction in the
application processing, then based on the numbers come up with plans to sustain or
improve. This shall fill up the gap between the staff and the students, thus proves to be an
effective tool.
‚ Need for improved flow sheet format – Come up with a template for the process so that
everyone is on board with the process and make changes/updates regularly based on
demands. By doing so everyone would be aware of the happenings within the process, no
one remains in the dark. Also staff members tries to keep their work updated and up to
the mark.
‚ One-on-one meetings – This is a meeting of the staff members with their immediate
supervisors. In this meeting the supervisor and the staff member shares their opinion on
each others work and clarifies their expectations from each other. This not only helps to
solve their problems and concentrate on work but also helps to build healthy relationship
and hence a healthy atmosphere to work.
‚ Peak period – During peak times i.e., when the volume of the number of applications
coming in increases, then instead of overloading the staff it would be good to bring
outside people, train them and get the work done. Page 13.215.11
Environment
Student Volume
Student
Admissions Office Schedule
Non optimization of Tracking Systems
Enough Staff
Support
People
Staffing Levels
Experience & Skill
Student Needs
Delay in the )----------+-----! Processing
Availability of Resources
Material
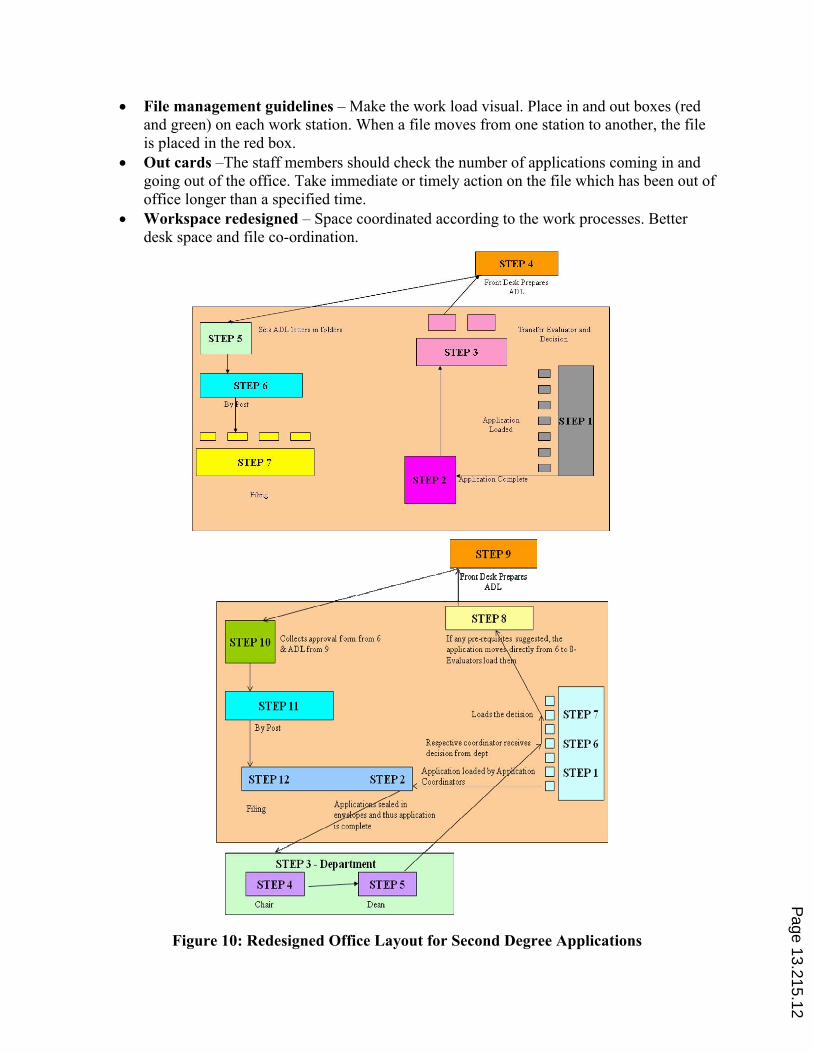
‚ File management guidelines – Make the work load visual. Place in and out boxes (red
and green) on each work station. When a file moves from one station to another, the file
is placed in the red box.
‚ Out cards –The staff members should check the number of applications coming in and
going out of the office. Take immediate or timely action on the file which has been out of
office longer than a specified time.
‚ Workspace redesigned – Space coordinated according to the work processes. Better
desk space and file co-ordination.
Figure 10: Redesigned Office Layout for Second Degree Applications
Page 13.215.12
STEP5
STEP6
D
STEP 7
Filing
STEP4
Front D esk Prepare s ADL
Transfer Evaluator and Dec1S1on
D D D
Apphcat1on D STEPI Loaded
D D D
STEP9
------ ront Desk Prepares ADL
STEP IO Collects approval fonn from 6 &ADLfrom9
STEPll
By Post
STEP 12 STEP2
Filing
~--ST_ EP~ 3 - Departm~e_n_t -~~
STEP4 I 1 STEP5 Chair Dean
STEP S
If any pre-requ, 'tes suggested, the application move directly from 6 to 8-Evalualors load lhe
0 Loads the decision 0 STEP 7
0 Respective coordinator receives 0 STEP6 decision from dept 0
Application loaded by Ap cation 0 STEP! Coordinators 0

VI. Conclusions
Six-Sigma methodology has been applied to the admissions process at a higher education
institution. The methodology offers a detailed step by step implementation process for improving
a process. Data collected on processing times were used to identify key steps resulting in delay.
During the analysis phase, key reasons behind the delay were identified. The recommendation
made as a result of this study can lead to the following benefits:
‚ Increased satisfaction with inquiries and applicants.
‚ Increased enrollment yield of students that apply.
‚ Improved perception, integrity, and accountability of office.
‚ Simpler and better defined process for university employees and students.
‚ More student-friendly customer service.
‚ Improved employee satisfaction resulting in fewer turnovers.
‚ Quicker and more accurate view of status of applications.
References
1. “Six Sigma: What It Is and How to Use It.” Harvard Management Update June 1999, pp. 6- 7.
2. Breyfogle W.F., M.J. Cupello, and B. Meadows. Managing Six Sigma: A Practical Guide to
Understanding, Assessing and Implementing the Strategy that Yields Bottom Line Success. Hoboken, NJ:
John Wiley & Sons, 2001. ISBN 0-471-39673-7.
3. Hahn J.G., N. Doganaksoy, and R. Hoerl. “The Evolution of Six Sigma.” Quality Engineering Journal, vol.
12, no. 3, 2000, pp. 317- 326.
4. http://www.surveysystem.com/sscalc.htm
5. Fisher, R.A. (1956), Statistical Methods and Scientific Inference, Oliver and Boyd, Edinburgh, pp. 32.
6. Freund, J.E. (1962), Mathematical Statistics Prentice Hall, Englewood Cliffs, NJ, pp. 227-228.
7. Sanders D., and C. Hild, “A Discussion of Strategies for Six Sigma Implementation.” Quality Engineering
Journal. Vol. 12, no. 3, pp. 311- 315.
8. Scherkenbach, William W. (1998), The Deming Route to Quality and Productivity: Road Maps and
Roadblocks, ASQC Quality Press, Milwaukee, WI.
9. Harry, Mikel J. (January 2000b), A New Definition Aims to Connect Quality Performance with Financial
Performance, Quality Progress 33(1): 64- 66.
10. Snee, Ronald D. (September 1999a), Why Should Statisticians Pay Attention to Six Sigma? An
Examination for Their Role in the Six Sigma Methodology, Quality Progress 32(9): 100- 103.
11. Kaplan, Robert S., and David P. Norton. The Balanced Scorecard. Boston: Harvard Business School Press,
1996.
12. Blakeslee, J.A. “Implementing the Six Sigma Solution.” Quality Progress, vol. 32, no. 7, July 1999, pp. 77-
85.
Page 13.215.13