
APPLYING SINGLE MINUTE EXCHANGE OF DIES (SMED) AND 5S …
106
APPLYING SINGLE MINUTE EXCHANGE OF DIES (SMED) AND 5S TO REDUCE SETUP TIME OF FILLING MACHINE AT PT. MNO By Nathania Sembiring 004201300037 A Thesis presented to the Faculty of Engineering President University in partial fulfillment of the requirements of Bachelor Degree in Engineering Major in Industrial Engineering 2017
Transcript of APPLYING SINGLE MINUTE EXCHANGE OF DIES (SMED) AND 5S …
i
APPLYING SINGLE MINUTE EXCHANGE OF DIES
(SMED) AND 5S TO REDUCE SETUP TIME OF
FILLING MACHINE AT PT. MNO
By
Nathania Sembiring
004201300037
A Thesis presented to the
Faculty of Engineering President University in partial
fulfillment of the requirements of Bachelor Degree in
Engineering Major in Industrial Engineering
2017
i
THESIS ADVISOR
RECOMMENDATION LETTER
This thesis entitled “Applying Single Minute Exchange of Dies (SMED) and 5S
to Reduce Setup Time of Filling Machine AT PT. MNO” prepared and
submitted by Nathania Sembiring in partial fulfillment of the requirements for the
degree of Bachelor Degree in the Faculty of Engineering for a thesis fit to be
examined. I therefore recommend this thesis for Oral Defense.
Cikarang, Indonesia, February 6th
2017
Johan Runtuk, S.T., M.T

ii
DECLARATION OF ORIGINALITY
I declare that this thesis, entitled “Applying Single Minute Exchange of Dies
(SMED) and 5S to Reduce Setup Time of Filling Machine AT PT. MNO” is,
to the best of my knowledge and belief, an original piece of work that has not
been submitted, either in whole or in part, to another university to obtain a degree.
Cikarang, Indonesia, February 6th
2017
Nathania Sembiring
iii
APPLYING SINGLE MINUTE EXCHANGE OF DIES
(SMED) AND 5S TO REDUCE SETUP TIME OF
FILLING MACHINE AT PT. MNO
By
Nathania Sembiring
ID No: 004201300037
Approved by,
Johan Runtuk S.T., M.T
Ir. AndiraTaslim, M.T
Thesis Advisor 1 Thesis Advisor 2
Ir. AndiraTaslim, M.T
Head of Study Program Industrial Engineering
iv
ABSTRACT
Manufacturing excellence represent as the goal for every manufacturing industry
all around the world. Reducing waste could help to achieve the goal of
manufacturing excellence since waste could happen in every manufacturing
industry. PT. MNO as one of food and beverages industry also focusing on
reducing waste in the production process, especially in filling department. Similar
with other department, filling department also has planned and unplanned
stoppages. As one of planned stoppages, the set-up activities represent as one of
the highest contribution of waste in filling department. Therefore, PT. MNO can
reduce the set-up time by using Single Minute Exchange of Dies (SMED) and 5S
method. Then, overall equipment effectiveness (OEE) calculation can shows the
differences between the productivity of filling machine before and after Single
Minute Exchange of Dies (SMED) and 5S method. As the result, the set-up time
is reduced from 34 minutes to 13 minutes by using Single Minutes Exchange of
Dies (SMED) method implementation, while after 5S method implementation, the
set-up time become ten minutes. The overall equipment effectiveness (OEE)
calculation result shows better productivity after SMED and 5S method
implementation in filling department by the increasing OEE rate from 76% to
78% in the end.
Keywords: Set-up, waste, planned stoppages, Single Minute Exchange of Dies
(SMED), 5S, Overall Equipment Effectiveness (OEE).

v
ACKNOWLEDGEMENT
Firstly of all, I want to express my gratitude for God who always help me and
support me to complete this internship report. Hereby are my expressions of
gratitude to:
1. My beloved family, especially my mom and daddy, Mrs. Rosni Masran
and Mr. Benny Sembiring, my sisters, Meilina Sembiring and Yuliana
Lestari Sembiring, who always support me, love me, bless me, and pray
for my success.
2. Thank you for Mr. Johan Runtuk S.T., M.T as my thesis advisor, which
guide me to finish this thesis and thank you for all advices that you have
gave to me.
3. Thank you for Mrs. Ir. Andira MT., as my second thesis advisor and also
as the Head of study program for Industrial Engineering, which always
support and encourage me.
4. Thank you for all my workmates, Kak Tere, Elly, Mbak Ajeng, Mbak
Yanti, Ganjar, Virgi, Dwi, Aseng, and other who I’m not mention that
gives support and advice to me when conduct this research.
5. My roommate, Nabila Aulia Asdin, who knows me better than anyone
else, who support me and always being cheerful and fun around me, who
always makes me laugh.
6. My thesis partner, Lestari My Oktaviani Ginting, who always encourage
me to finish this thesis and become my thesis partner every weekend.
7. My best friend, Marsha, Putri, Nadila, Hartono, Je, Sang, Ipan, Dino, Anta
and my classmates in Industrial Engineering batch 2013. Thank you for
giving me a support and bring a happiness every day.
8. My high school friend, Jessica, Sally, Cindy, Andre, Andreas, Alfredo,
and etc. Thank you for giving me a good day every time we met.
9. All engineering family of President University of Industrial Engineering,
batch 2012, 2013, 2014, and so on. Thank you for giving me many
unforgettable moment since I entered President University.

vi
TABLE OF CONTENTS
THESIS ADVISOR RECOMMENDATION LETTER .......................................... i
DECLARATION OF ORIGINALITY ................................................................... ii
APPROVAL PAGE ............................................................................................... iii
ABSTRACT ........................................................................................................... iv
ACKNOWLEDGEMENT ...................................................................................... v
TABLE OF CONTENTS ....................................................................................... vi
LIST OF TABLES .................................................................................................. x
LIST OF FIGURES ............................................................................................... xi
LIST OF TERMINOLOGIES ............................................................................... xii
CHAPTER I INTRODUCTION ............................................................................. 1
1.1. Problem Background ................................................................................ 1
1.2. Problem Statement .................................................................................... 3
1.3. Research Objectives .................................................................................. 3
1.4. Scope and Limitation ................................................................................ 3
1.5. Assumption ............................................................................................... 4
1.6. Research Outline ....................................................................................... 4
CHAPTER II LITERATURE STUDY ................................................................... 5
2.1 Lean Manufacturing .................................................................................. 5
2.1.1 Waste ................................................................................................. 7
2.1.2 Set-up Time ....................................................................................... 9
2.2 Single Minute Exchange of Die (SMED) ............................................... 10
2.2.1 Internal and external setup activities not differentiated ................... 11
2.2.2 Separate internal and external activities .......................................... 12
2.2.3 Convert internal activities to external activities .............................. 12
2.2.4 Streamline the Remaining Internal Activities .................................. 13
2.3 5S 13
2.3.1 SEIRI ............................................................................................... 14
2.3.2 SEITON ........................................................................................... 15
2.3.3 SEISO .............................................................................................. 15
2.3.4 SEIKETSU ...................................................................................... 15
vii
2.3.5 SHITSUKE ...................................................................................... 16
2.4 Data Collection Tools ............................................................................. 16
2.4.1 Pareto Chart ..................................................................................... 16
2.4.2 Spaghetti Diagram ........................................................................... 17
2.4.3 Gantt Chart ....................................................................................... 18
2.4.4 Flow Process Chart .......................................................................... 19
2.4.5 Overall Equipment Effectiveness (OEE) ......................................... 21
2.5 Previous Research ................................................................................... 26
CHAPTER III RESEARCH METHODOLOGY ................................................. 27
3.1 Research Framework .............................................................................. 28
3.1.1 Initial Observation ........................................................................... 28
3.1.2 Problem Identification ..................................................................... 29
3.1.3 Literature Study ............................................................................... 29
3.1.4 Data Collection ................................................................................ 29
3.1.5 Data Analysis ................................................................................... 30
3.1.6 Conclusion and Recommendation ................................................... 30
3.2 Detail Framework ................................................................................... 30
3.2.1 Define Problem ................................................................................ 33
3.2.2 Data Collection ................................................................................ 33
3.2.3 Data Analysis ................................................................................... 34
3.2.4 Execute the Action ........................................................................... 35
CHAPTER IV DATA COLLECTION AND ANALYSIS .................................. 36
4.1 Data Collection ....................................................................................... 38
4.1.1 Flow Process Chart .......................................................................... 39
4.1.2 Gantt Chart ....................................................................................... 41
4.1.3 Initial Layout Design ....................................................................... 43
4.1.4 Spaghetti Diagram ........................................................................... 44
4.2 Data Analysis .......................................................................................... 45
4.2.1 Overall Equipment Effectiveness (OEE) Before Implementation ... 46
4.2.2 Single Minutes Exchange of Dies (SMED) Implementation .......... 48
4.2.3 5S Implementation for Set-up Activities in Filling Machine .......... 57

viii
4.3 Single Minute Exchange of Dies (SMED) and 5S Method
Implementation ....................................................................................... 61
4.3.1 New Improvement Result of Set-up Activities ................................ 61
4.3.2 Before Single Minute Exchange of Dies (SMED) Method
Implementation ................................................................................ 63
4.3.3 After Single Minute Exchange of Dies (SMED) Method
Implementation ................................................................................ 65
4.3.4 After Single Minute Exchange of Dies (SMED) and 5S Method
Implementation ................................................................................ 66
4.3.5 Set-up time April until June 2016 .................................................... 67
4.4 Summary of the Implementation Overall Equipment Effectiveness (OEE)
after Single Minute Exchange of Dies (SMED) and 5S Implementation 69
4.4.1 Overall Equipment Effectiveness (OEE) after Single Minutes
Exchange of Dies (SMED) and 5S implementation ........................ 69
4.4.2 Overall Equipment Effectiveness (OEE) from April until June
2016 ................................................................................................. 72
4.5 SEIKETSU (Standardizing) .................................................................... 73
4.6 SHITSUKE (Sustaining)......................................................................... 75
4.7 Summary of the Result ........................................................................... 75
CHAPTER V CONCLUSION AND RECOMMENDATION ............................. 79
5.1 Conclusion .............................................................................................. 79
5.2 Recommendation .................................................................................... 79
REFERENCES ..................................................................................................... 80
APPENDICES ...................................................................................................... 82
Appendices 1 - Changeover Product April 2016 .................................................. 82
Appendices 2 - Process Failure April 2016 .......................................................... 82
Appendices 3 - Minor Stoppages April 2016 ....................................................... 83
Appendices 4 - Changeover Product June 2016 ................................................... 85
Appendices 5 - Process Failure June 2016 ........................................................... 85
Appendices 6 - Minor Stoppages June 2016 ......................................................... 86
Appendices 7 – Downtime Loss Calculation April and June 2016 ...................... 88
Appendices 8 – Performance Loss Calculation April and June 2016 ................... 89
Appendices 9 – Loading Time Calculation April and June 2016 ......................... 89
Appendices 10 – Operating Time Calculation April and June 2016 .................... 90

ix
Appendices 11 – Operating Time Calculation April and June 2016 .................... 90
Appendices 12 – Availability Rate Calculation April and June 2016 .................. 91
Appendices 13 – Performance Rate Calculation April and June 2016 ................. 91
Appendices 14 – Quality Rate Calculation April and June 2016 ......................... 92
Appendices 15 – Overall Equipment Effectiveness (OEE) Rate Calculation April
and June 2016 ......................................................................................... 93

x
LIST OF TABLES
Table 2.1 Five Primary Elements ............................................................................ 6
Table 2.2 Definition of TIMWOOD ...................................................................... 8
Table 2.3 5S Explanation ...................................................................................... 13
Table 2.4 5S Explanation (Continued) .................................................................. 14
Table 2.5 Example of Flow Process Chart ............................................................ 19
Table 2.6 Type of Operation ................................................................................. 21
Table 2.7 Characteristics of Overall Equipment Effectiveness (OEE) ................. 22
Table 2.8 Characteristics of Overall Equipment Effectiveness (OEE) (Continued)
............................................................................................................................... 22
Table 4.1 Flow Process Chart ............................................................................... 39
Table 4.2 Flow Process Chart (Continued) ........................................................... 40
Table 4.3 Gantt Chart ............................................................................................ 42
Table 4.4 Setup Activity of Filling Machine Area................................................ 48
Table 4.5 Setup Activity of Filling Machine Area (Continued) ........................... 49
Table 4.6 Internal and External Activities of Set-up Activities in Filling Machine
Area ....................................................................................................................... 50
Table 4.7 Internal and External Activities of Set-up Activities in Filling Machine
Area (Continued) .................................................................................................. 51
Table 4.8 Converting Internal Activities into External Activities ........................ 52
Table 4.9 Current Internal Activities for Set-up Activities in Filling Machine Area
............................................................................................................................... 54
Table 4.10 Current External Activities for Set-up Activities in Filling Machine
Area ....................................................................................................................... 56
Table 4.11 New Improvement Result of Set-up Activities ................................... 61
Table 4.12 New Improvement Result of Set-up Activities (Continued) .............. 62
Table 4.13 Set-up time before Single Minute Exchange of Dies (SMED) .......... 63
Table 4.14 Set-up time before Single Minute Exchange of Dies (SMED)
Implementation (Continued) ................................................................................. 64
Table 4.15 Set-up time after Single Minute Exchange of Dies (SMED)
Implementation ..................................................................................................... 65
Table 4.16 Set-up time after Single Minute Exchange of Dies (SMED) and 5S
Implementation ..................................................................................................... 66
Table 4.17 Set-up time after Single Minute Exchange of Dies (SMED) and 5S
Implementation (Continued) ................................................................................. 67
Table 4.18 New Working Instruction (WI) ........................................................... 73
Table 4.19 New Working Instruction (WI) (Continued) ...................................... 74
Table 4.20 Summary of the Result ....................................................................... 76
Table 4.21 Summary of the Result (continued) .................................................... 77
xi
LIST OF FIGURES
Figure 2.1 SMED Step .......................................................................................... 11
Figure 2.2 Example of Pareto Chart...................................................................... 17
Figure 2.3 Example of Spaghetti Diagram............................................................ 18
Figure 2.4 Example of Gantt Chart ....................................................................... 19
Figure 3.1 Research Methodology ........................................................................ 28
Figure 3.2 Detail Framework ................................................................................ 31
Figure 3.3 Detail Framework (continued) ............................................................ 32
Figure 4.1 Stoppages in Filling Machine (February – March 2016) .................... 37
Figure 4.2 Planned Stoppages in Filling Machine (February – March 2016)....... 37
Figure 4.3 Initial Layout Design of Filling Machine ............................................ 43
Figure 4.4 Spaghetti Diagram ............................................................................... 44
Figure 4.5 Overall Equipment Effectiveness Calculation (April 2016)................ 46
Figure 4.6 Overall Equipment Effectiveness (April 2016) ................................... 47
Figure 4 7 Removing Unnecessary Item ............................................................... 59
Figure 4.8 New Design Layout ............................................................................. 60
Figure 4 9 Set-up time April – June 2016 ............................................................. 68
Figure 4.10 Overall Equipment Effectiveness (June 2016) .................................. 70
Figure 4.11 Overall Equipment Effectiveness (June 2016) .................................. 71
Figure 4.12 Overall Equipment Effectiveness (April and June 2016) .................. 72
Figure 4.13 Summary of Overall Equipment Effectiveness (OEE) ...................... 78

xii
LIST OF TERMINOLOGIES
Unplanned Stoppages : a process of machine stops because of an activity
that already planned before
Planned Stoppages : a process of machine stops because of an
unexpected activity that are not planned before
Set-up : an activity of machine preparation before the
machine starts to operate
SMED : Single Minute Exchange of Dies, which is a
method to reduce changeover or set-up time
5S : a method to reduce waster by implementing 5 cycle
of SEIRI, SEITON, SEISO, SEIKETSU, and
SHITSUKE
OEE : a method used to calculate the effectiveness of the
machine
Internal Activities : activities done when the machine stops
External Activities : activities done when the machine runs
SAP : System Application Products which used to input
the data
Shift Hand-Over : a process of changing shift by delivering the
information from previous shift to the next shift
Working Instruction
(WI)
: an instruction for the operator to conduct an
activity
CIL : Cleaning Inspection Lubrication, an activity that
include the inspection and lubrication to the
cleaning
1
CHAPTER I
INTRODUCTION
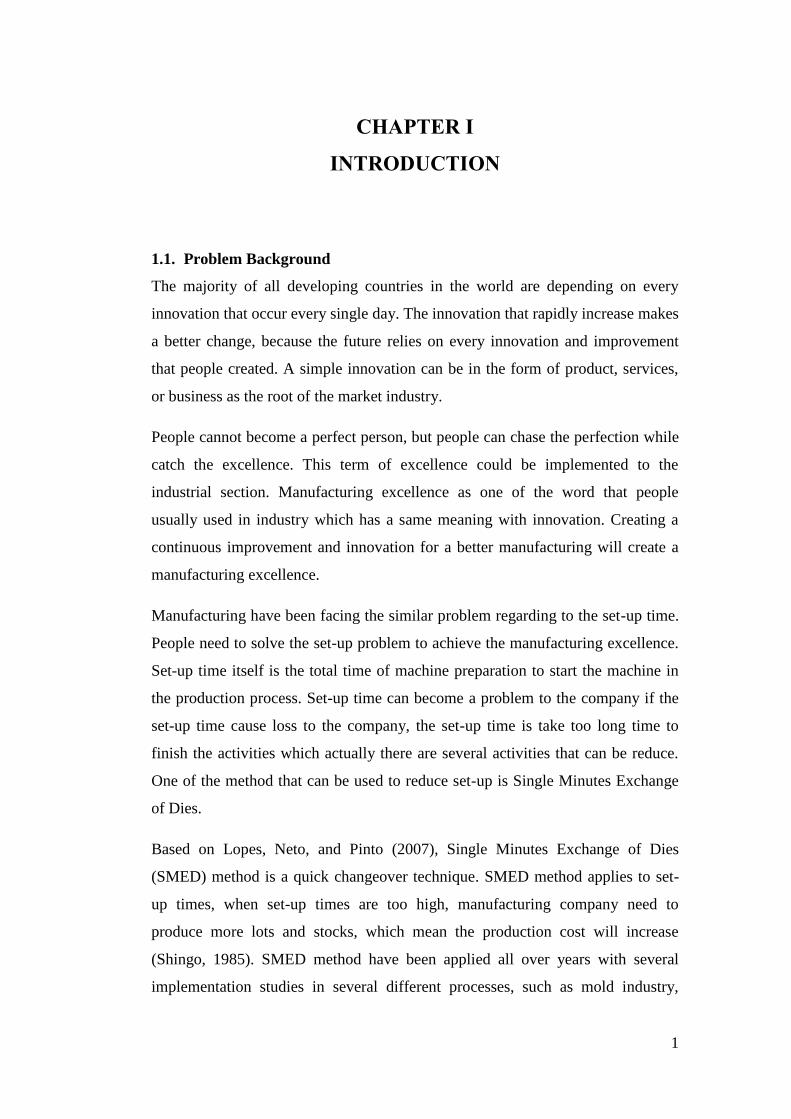
1.1. Problem Background
The majority of all developing countries in the world are depending on every
innovation that occur every single day. The innovation that rapidly increase makes
a better change, because the future relies on every innovation and improvement
that people created. A simple innovation can be in the form of product, services,
or business as the root of the market industry.
People cannot become a perfect person, but people can chase the perfection while
catch the excellence. This term of excellence could be implemented to the
industrial section. Manufacturing excellence as one of the word that people
usually used in industry which has a same meaning with innovation. Creating a
continuous improvement and innovation for a better manufacturing will create a
manufacturing excellence.
Manufacturing have been facing the similar problem regarding to the set-up time.
People need to solve the set-up problem to achieve the manufacturing excellence.
Set-up time itself is the total time of machine preparation to start the machine in
the production process. Set-up time can become a problem to the company if the
set-up time cause loss to the company, the set-up time is take too long time to
finish the activities which actually there are several activities that can be reduce.
One of the method that can be used to reduce set-up is Single Minutes Exchange
of Dies.
Based on Lopes, Neto, and Pinto (2007), Single Minutes Exchange of Dies
(SMED) method is a quick changeover technique. SMED method applies to set-
up times, when set-up times are too high, manufacturing company need to
produce more lots and stocks, which mean the production cost will increase
(Shingo, 1985). SMED method have been applied all over years with several
implementation studies in several different processes, such as mold industry,
2
pharmaceutical industry, and several more manufacturing industry (Simoes &
Tenera, 2010).
5S is one lean manufacturing method in reducing waste (Agrahari, Dangle, &
Chandratre, 2015). 5S will organize the workplace to create a better flow of the
production activities in the workplace. When the condition of workplace already
cleans, and organized in the right place, it helps the worker to conduct the
activities more effective.
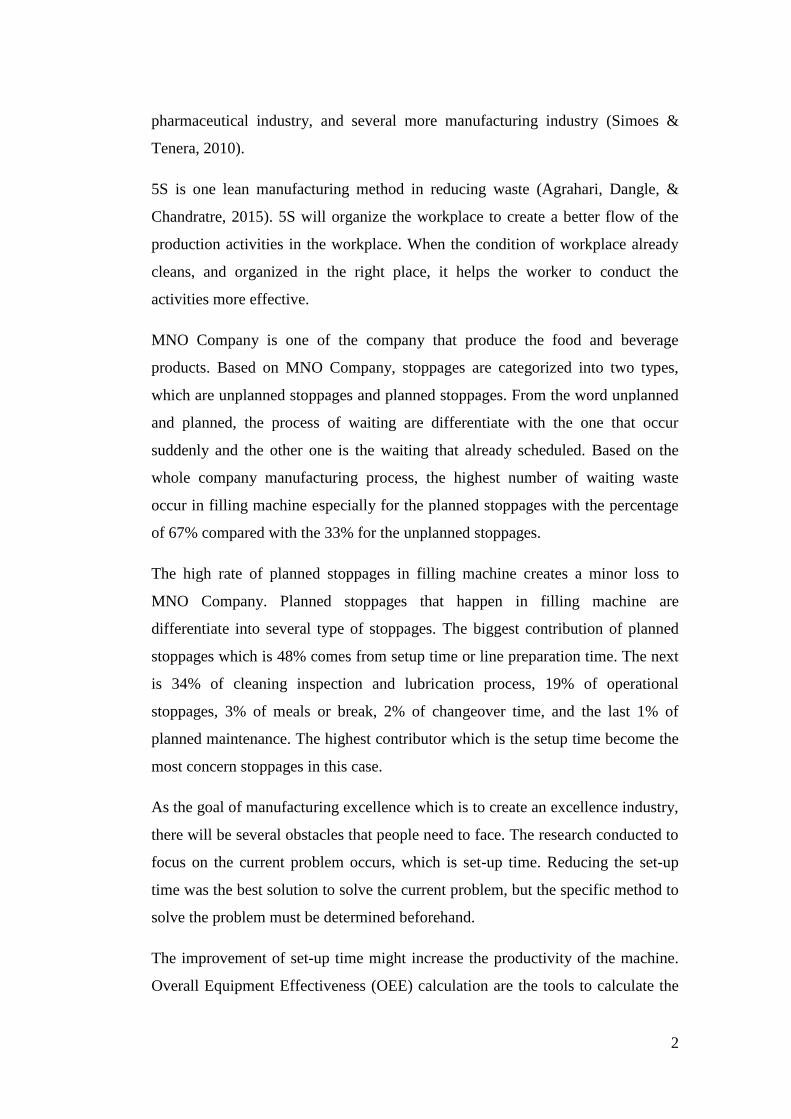
MNO Company is one of the company that produce the food and beverage
products. Based on MNO Company, stoppages are categorized into two types,
which are unplanned stoppages and planned stoppages. From the word unplanned
and planned, the process of waiting are differentiate with the one that occur
suddenly and the other one is the waiting that already scheduled. Based on the
whole company manufacturing process, the highest number of waiting waste
occur in filling machine especially for the planned stoppages with the percentage
of 67% compared with the 33% for the unplanned stoppages.
The high rate of planned stoppages in filling machine creates a minor loss to
MNO Company. Planned stoppages that happen in filling machine are
differentiate into several type of stoppages. The biggest contribution of planned
stoppages which is 48% comes from setup time or line preparation time. The next
is 34% of cleaning inspection and lubrication process, 19% of operational
stoppages, 3% of meals or break, 2% of changeover time, and the last 1% of
planned maintenance. The highest contributor which is the setup time become the
most concern stoppages in this case.
As the goal of manufacturing excellence which is to create an excellence industry,
there will be several obstacles that people need to face. The research conducted to
focus on the current problem occurs, which is set-up time. Reducing the set-up
time was the best solution to solve the current problem, but the specific method to
solve the problem must be determined beforehand.
The improvement of set-up time might increase the productivity of the machine.
Overall Equipment Effectiveness (OEE) calculation are the tools to calculate the
3
productivity of the machine. There are three main rate in OEE which are
availability, performance, and quality. The calculation of availability are related to
set-up time, changeover time, unplanned maintenance, process failure, and etc.
The calculation of performance are related with the minor stoppages, while the
quality rate are related with the defect. The difference of set-up time will give
impact to the productivity of the machine which shown in the calculation of the
availability rate. Then, the calculation of OEE will shows the productivity
difference before and after SMED and 5S method.
1.2. Problem Statement
Based on the problem happen in MNO Company, this research is conduct to
answer these following questions:
How does company reduce set-up time in filling machine by using the
Single Minutes Exchange of Dies (SMED) and 5S method in PT. MNO?
What is the difference between Overall Equipment Effectiveness (OEE)
before and after Single Minutes Exchange of Dies (SMED) and 5S
implementation?
1.3. Research Objectives
The main objectives of this research are as follows:
To reduce the set-up time in filling machine by using Single Minutes
Exchange of Dies (SMED) and 5S method in PT. MNO.
To determine the difference between Overall Equipment Effectiveness
(OEE) before and after Single Minutes Exchange of Dies (SMED) and 5S
implementation?
1.4. Scope and Limitation
There are several scope and limitation that will give a clear boundary and the limit
of this research:
The data were taken from April until June 2016
The data of line preparation time in filling area
The main focus is planned stoppages of line preparation in filling area

4
The defect product of filling machine only caused by sealing defect
1.5. Assumption
There are several assumption in order to support this research:
The data of the research is accurate
The machine is function normally
The material handling flow is ignored
1.6. Research Outline
Chapter I Introduction
This chapter discuss about problem background, problem statement, research
objectives, scope and limitation, and assumption.
Chapter II Literature Study
This chapter discuss about the theory of every method that are existed in this
research. The method that is used in this research is Single Minutes Exchange of
Dies (SMED) Method integrated with 5S method including several data collection
and analysis tools that used in this research.
Chapter III Research Methodology
This chapter consists of the flow of this research including the explanation of each
step from the beginning to the end of the research.
Chapter IV Data Collection and Analysis
This chapter discuss about the way to collect the data including the output of the
data. Then, the data that has be collected will be further analyze to achieve the
result regarding to problem in the research.
Chapter V Conclusion and Recommendation
This chapter consists of the conclusion and result from the research. It also
contain the recommendation regarding to this research
5
CHAPTER II
LITERATURE STUDY
2.1 Lean Manufacturing
Lean manufacturing can describe a production method from Toyota Production
System (TPS). Lean manufacturing is popularized by Womack, Jones, and Toos,
in 1990. Lean manufacturing also can be defined as a process performance that
happen in manufacturing company to increase competitive advantage. This system
already implemented in several auto industries successfully and slowly spread to
other industry sectors.
The challenge that lean manufacturing faced is to create and maintain long term
commitment from top management by using the entire workforce. The main focus
of lean manufacturing is to eliminate any waste in manufacturing process, which
means lean manufacturing is manufacturing that run without any waste. Besides
that, lean manufacturing also focus on reaching the market on time and managing
manufacturing stocks that are nearly reach the customer demand while still
producing products with a good quality efficiently. Lean manufacturing also
aiming on produce product and service at the lowest cost in short time.
Lean manufacturing must be support by several primary element which shown in
table 2.1. Lean manufacturing are divided into five primary element, which are
manufacturing flow, organization, process control, metrics, and logistic. Each
primary element have their own objective when dealing with the lean
manufacturing implementation in the production process. (Feld, 2000)
Manufacturing flow means that the process of making a physical change and
design standards that are the part of the cell, while organization the process of
focusing the roles or function of people, which also include training the new
working process, and communication to others. Process control is monitoring,

6
controlling, stabilizing, and pursuing to improve the process. Metrics is the
process to create a visible address, result-based performance measure, target
improvement, and recognition or reward for the team. Logistic is the process to
control the flow of material and create an operating rules and planning
mechanism. (Feld, 2000)
Table 2.1 Five Primary Elements
No Manufacturing Flow No Process Control
1 Product / quantity assessment
1
Total productive
maintenance
2 Process mapping
2 Poka-yoke
3 Routing analysis
3 SMED
4 Takt calculations
4 Graphical work instructions
5 Workload balancing
5 Visual control
6 Kanban sizing
6 Continuous improvement
7 Cell layout
7 Line stop
8 Standard work
8 SPC
9 One-piece flow
9 5S housekeeping
No Metrics
No Logistics
1 On-time delivery
1 Forward plan
2 Process lead-time
2 Mix-model manufacturing
3 Total cost
3 Level loading
4 Quality yield
4 Workable work
5 Inventory (turns)
5 Kanban pull signal
6 Space utilization
6 A,B,C parts handling
7 Travel distance
7 Service cell agreements
8 Productivity
8 Customer/supplier alignment
9 Operational rules
No Organization
1 Product-focused, multi-
discipline team
2 Lean manager development
3 Touch labor cross-taking
skill matrix
4 Training
5 Communication plan
6 Roles and responsibility
Source: (Feld, 2000)
7
Lean manufacturing is not a short term system, but it is a long term system. Lean
manufacturing system will evaluates the whole manufacturing process step by
step from beginning until the end to identify waste and inefficiency. Then, it will
help people to create the new solutions to improve the manufacturing process by
reduce waste, increasing the efficiency, and reduce expenses. Lean activities are
assessment, improvement and performance monitoring. Lean will assess or
evaluates the problem first, then improve the manufacturing system, in the end it
will monitor the manufacturing performance.
2.1.1 Waste
Waste is the thing that are unnecessary or not needed to exist. Waste can in the
form of object, energy, material, and many other form. Since waste is unwanted
things, people will disposed the waste, people do not want the waste is exist
anymore and also prevent the waste occur.
Toyota Production system (TPS) are divided into three M, which are “Muri”,
“Muda”, and “Mura”. “Muri” means forcing the human or machine to the
maximal limit, which can cause producing the output exceed the target. Besides
that, “Muri” may cause machine breakdown and even defect products. “Muda”
has the meaning of all kind of waste including non-value added activities. Based
on “Muda”, the non-value added activities are include unnecessary movement of
operator, high rate of inventory, and also any kind of waiting condition. “Mura” is
happen because the two M, which are “Muri” and “Muda” and cause an
unevenness. Breakdown and defects may cause the unstable of production
schedule since the production volume is fluctuating. The unevenness also happen
because of the unnecessary movement, high inventory and waiting condition that
happen in “Muda”. (Liker, 2004)
As has been mention before, “Muda” is the waste that happen in lean
manufacturing. Based on table 2.2, there are several types of “Muda” waste that
are usually happen in production system of manufacturing company, it is called as
TIMWOOD, which stands for seven waste which are Transportation, Inventory,
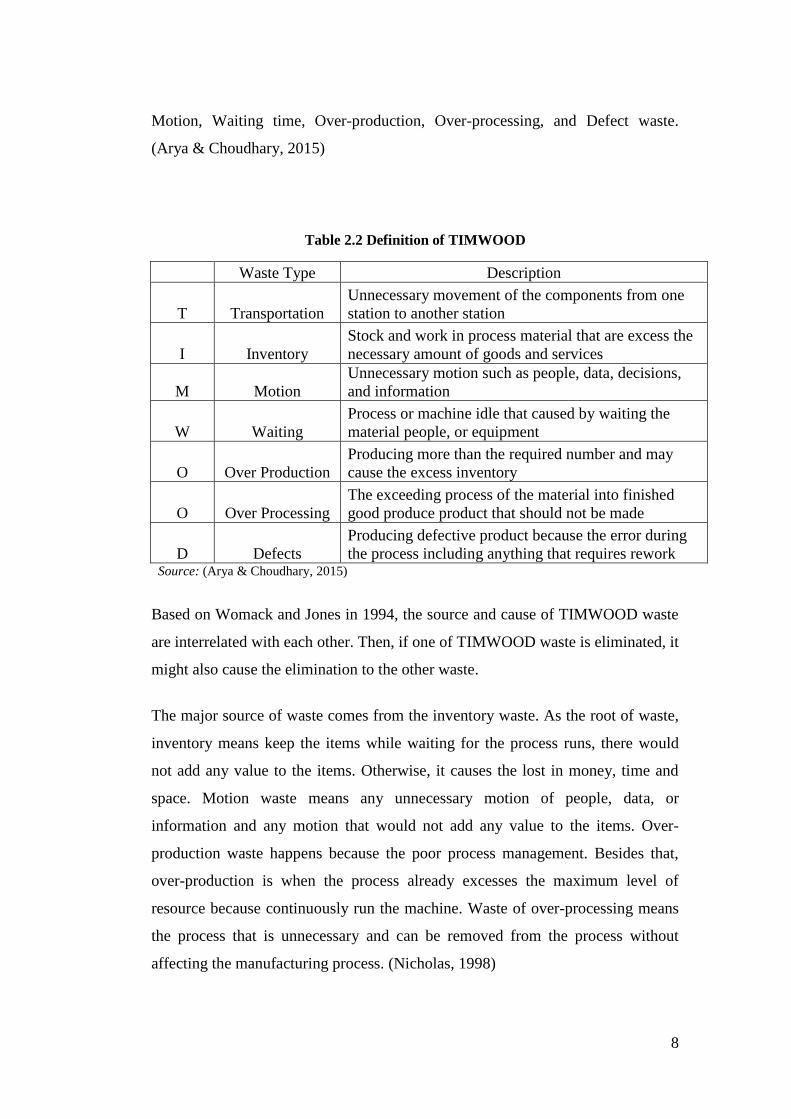
8
Motion, Waiting time, Over-production, Over-processing, and Defect waste.
(Arya & Choudhary, 2015)
Table 2.2 Definition of TIMWOOD
Waste Type Description
T Transportation
Unnecessary movement of the components from one
station to another station
I Inventory
Stock and work in process material that are excess the
necessary amount of goods and services
M Motion
Unnecessary motion such as people, data, decisions,
and information
W Waiting
Process or machine idle that caused by waiting the
material people, or equipment
O Over Production
Producing more than the required number and may
cause the excess inventory
O Over Processing
The exceeding process of the material into finished
good produce product that should not be made
D Defects
Producing defective product because the error during
the process including anything that requires rework Source: (Arya & Choudhary, 2015)
Based on Womack and Jones in 1994, the source and cause of TIMWOOD waste
are interrelated with each other. Then, if one of TIMWOOD waste is eliminated, it
might also cause the elimination to the other waste.
The major source of waste comes from the inventory waste. As the root of waste,
inventory means keep the items while waiting for the process runs, there would
not add any value to the items. Otherwise, it causes the lost in money, time and
space. Motion waste means any unnecessary motion of people, data, or
information and any motion that would not add any value to the items. Over-
production waste happens because the poor process management. Besides that,
over-production is when the process already excesses the maximum level of
resource because continuously run the machine. Waste of over-processing means
the process that is unnecessary and can be removed from the process without
affecting the manufacturing process. (Nicholas, 1998)

9
Defect is the waste of producing products that different from the real product; or
producing products differently from that have been planned before. Waste of
waiting is the simplest identified waste because it is too obvious when the
machine stop, there are no process happen. But, it’s not the true that increase the
working hours of machine and worker may the best solution for waiting waste.
Otherwise, it may cause another problem which is waste of over-production. One
of the simple example of waste of waiting are material waiting, machine
breakdowns, overlong changeover, overlong set-up time, and etc. The overlong of
set-up time can be happen when the set-up activities time is take too long and
make the machine stop for a long time. (Nicholas, 1998)
2.1.2 Set-up Time
Set-up time is the time spent in preparation to do a job. Besides that, set-up time
also has a definition of the time between the last good products with the first good
product. Set-up time includes the preparation times, which are replacements,
adjustments and attachment on the machine. The count of set-up time start before
the machine run until the first finish good produced. When it comes to the
ineffective time, the output are the scraps or rework. (Nicholas, 1998)
When the set-up time is decrease, quality become well since there will be less
mistakes done by the worker. Besides that, it also reduces cost because it will use
smaller batch size and reduce work-in-process (WIP) and finished good inventory,
more flexible since smaller lot size, set-up become more easy and no need to have
a specialized worker for the specific set-up, capacity optimization, and process
variability because the time spent for each process and step of each setup is
reduce. (Nicholas, 1998)
Nicholas (1998) stated that set-up steps that conducted by all manufacturing
industry have four steps, those are:
Preparing, checking material and tools before the set-up start. Checking the
condition of workplace area and machine also included
After the process ends, changing the old tools into the new tools

10
Measuring, setting , and calibrating the machine in the right place that stated
in the standard
Test the machine until the machine runs properly and product the good
finished products.
2.2 Single Minute Exchange of Die (SMED)
Single Minute Exchange of Die (SMED) method was developed in 1950 by Ohno
at Toyota. Toyota have a problem of the high inventory cost for the vehicle,
because the way to reduce production loss was to reduce setup time. Then, Ohno
want to develop a system that can exchange dies in simple way. The phrase
"single minutes" does not mean all the time must become one minute, but it
means that the time must become a single digit minutes or less than ten minutes.
(Benjamin, Murugaiah, & Marathamuthu, 2012)
The main purpose of SMED is to reduce setup time on a machine. SMED also
called as quick change over of tools. SMED can reduce or remove any non-value
activities in set-up activities or changeover activities. Before the development of
SMED, the best way to minimize the idle machines during the setup activities was
to produce more lots, it is done to obtain the lowest percentage of idle time per
unit produced. According to Min and Pheng (2007), the inventory cost must equal
with the cost of idle equipment during the change over and it can become the ideal
amount of production lot. Several manufacturing company already implemented
SMED method to create an improvement in reducing setup time. SMED also one
of lean tool that help to reduce the setup time while also eliminate waste that are
identify in the changeover activities. But, SMED technique is an element of Total
Productivity Maintenance (TPM) and continuous improvement process. Shingo
(1985) states that, “SMED can be applied in any factory to any machine”.
Figure 2.1 shows several step of Single Minute Exchange of Die (SMED)
implementation, those are internal and external setup activities are not
differentiated, separate internal and external activities, convert internal to external
activities, and improve all element operations. (Moxham & Greatbanks, 2000)

11
Source: (Moxham & Greatbanks, 2000)
Figure 2.1 SMED Step
Shingo (1985) states that there are two kinds of setup, those are internal and
external setup.
Internal setup is the activities that can be done when the machine is in idle
condition or stop
External setup is the activities that can be done when the machine is running
which can be before or after the machine running
The purposes to change the internal to external setup are already applicable
universally. The greatest benefit of reducing setup time is the flexibility to
produce parts in smaller batches. Based on figure 2.1, SMED have four steps,
every step will be further explain.
2.2.1 Internal and external setup activities not differentiated
This phase is done by gathering all the data. The data about all activities that have
been classified from the beginning until the end that are related with the setup
problem. Besides that, the duration of each activities from the beginning until the

12
end also must be collected. There will be other particular factors that affect the
activities that must be concerned. By observing, it can shows the critical part that
reduce the efficiency of setup time. (Benjamin, Murugaiah, & Marathamuthu,
2012)
In this phase, there are several ways to collect the data, which are observe the
current activities, interview with the operator of the machine, and documentation
that can in the form of picture, videos, and etc.
2.2.2 Separate internal and external activities
In order to help people to separate the internal and external activities, people can
try to think "Do this activities must be done when the machine is stop, can this
activity done when the machine is running?" It helps to differentiate whether the
activity is internal or external activity.
There are three techniques that usually used by SMED for this step, those are
checklist, function checks, and improved transport dies and other parts. Checklist
all the internal and external activities, explain the function for all the operator, and
the improvement of the transportation tools.
2.2.3 Convert internal activities to external activities
After internal and external already divided, convert or shift internal activities to
external activities must be done to achieve the goal of single minute setup time.
The aim of this step in SMED is to identify whether the activities can be done
during the machine running, this may lead to reduction several amount of set-up
time (Benjamin, Murugaiah, & Marathamuthu, 2012). Converting internal to
external activities can reduce the setup time a lot since when the several activities
that all done when the machine run is convert into activities done when the
machine is running. The total time of machine stop or idle is reduced. Within this
step, the automation of operations is happen, and also the utilization of different
tools.
13
2.2.4 Streamline the Remaining Internal Activities
After converting internal into external activities, this steps help to reduce more the
remaining time of the internal activities which need to be done to achieve the goal
of SMED which is under 10 minutes (Benjamin, Murugaiah, & Marathamuthu,
2012). The simple example to eliminate more of set-up time is relocating parts
and material to reduce the distance. When the activities need to take a long walk,
the position can be adjust by changing the layout of the production floor.
Relocating the parts and material also means that the layout of production floor
needs to be improved.
2.3 5S
5S originated from Japanese manufacturing industry from 1950. In 1980, 5S
method become more famous since many manufacturing industry start to apply 5S
methodology. 5S stands for SEIRI, SEITON, SEISO, SEIKETSU, and
SHITSUKE (Arai & Sekine, 1998). The 5S use “Can see, Can take out, Can
return” philosophy to create an improvement in the workplace (Ishijima,
Eliakimu, & Mahana, 2015). 5S also becomes a simple strategy that can be done
by company to clean the shop floor, but it can develop into a better standard of
workplace practices.
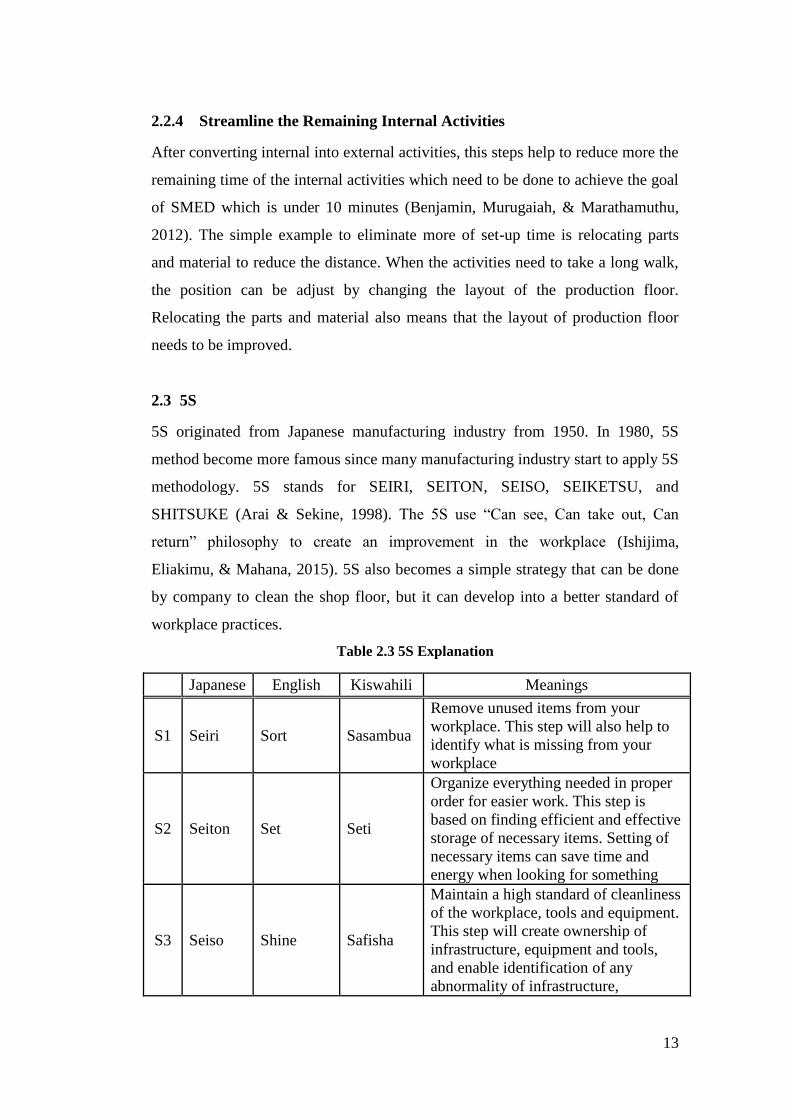
Table 2.3 5S Explanation
Japanese English Kiswahili Meanings
S1 Seiri Sort Sasambua
Remove unused items from your
workplace. This step will also help to
identify what is missing from your
workplace
S2 Seiton Set Seti
Organize everything needed in proper
order for easier work. This step is
based on finding efficient and effective
storage of necessary items. Setting of
necessary items can save time and
energy when looking for something
S3 Seiso Shine Safisha
Maintain a high standard of cleanliness
of the workplace, tools and equipment.
This step will create ownership of
infrastructure, equipment and tools,
and enable identification of any
abnormality of infrastructure,
14
equipment or tools
Source: (Gupta & Jain, 2014)
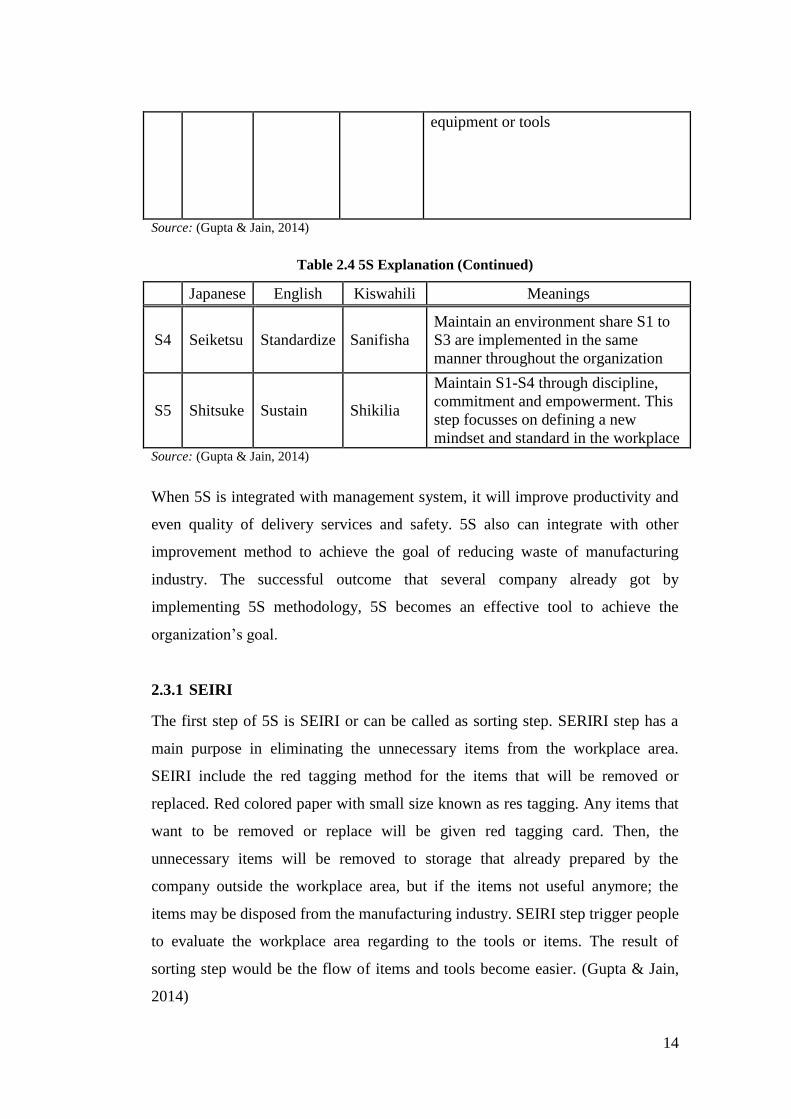
Table 2.4 5S Explanation (Continued)
Japanese English Kiswahili Meanings
S4 Seiketsu Standardize Sanifisha
Maintain an environment share S1 to
S3 are implemented in the same
manner throughout the organization
S5 Shitsuke Sustain Shikilia
Maintain S1-S4 through discipline,
commitment and empowerment. This
step focusses on defining a new
mindset and standard in the workplace Source: (Gupta & Jain, 2014)
When 5S is integrated with management system, it will improve productivity and
even quality of delivery services and safety. 5S also can integrate with other
improvement method to achieve the goal of reducing waste of manufacturing
industry. The successful outcome that several company already got by
implementing 5S methodology, 5S becomes an effective tool to achieve the
organization’s goal.
2.3.1 SEIRI
The first step of 5S is SEIRI or can be called as sorting step. SERIRI step has a
main purpose in eliminating the unnecessary items from the workplace area.
SEIRI include the red tagging method for the items that will be removed or
replaced. Red colored paper with small size known as res tagging. Any items that
want to be removed or replace will be given red tagging card. Then, the
unnecessary items will be removed to storage that already prepared by the
company outside the workplace area, but if the items not useful anymore; the
items may be disposed from the manufacturing industry. SEIRI step trigger people
to evaluate the workplace area regarding to the tools or items. The result of
sorting step would be the flow of items and tools become easier. (Gupta & Jain,
2014)

15
2.3.2 SEITON
The next process is SEITON or also can be called as set in order. SEITON will
stored the items to the best place to support the production process, placed every
items in the right position and right place. It is necessary to include the worker in
placing the items in the workplace area, because workers play the important role
in performing the activities around the workplace area. SEITON have several
activities that useful for setting items in order, those are labeling each item, giving
color for better identification for each item, storing the same type of item together
in one place, painting floor to keep the items above stay at the right place. People
become easier to find items because the items are noticeable (Gupta & Jain,
2014). SEITON creating better arrangement for the work activities, then if there is
a mis-step, people can easily identify and corrected.
2.3.3 SEISO
SEISO or also can be called as shine is the next step after SEITON. SEISO will
perform the cleaning and inspection through everything that exist in the
workplace area (Arai & Sekine, 1998). SEISO will help to clean or sanitize
everything that already stored by the previous process. Similar with SEITON step,
all worker need to takes part in cleaning the workplace area. The worker needs to
evaluate and know how often they must clean the workplace to create a better
motivation in cleaning the workplace without feeling burden in it. A better work
activities is better be done in clean workplace area, the term that worker need to
believe (Gupta & Jain, 2014). All the workers also need to understand that the
unclean workplace area may cause the potential hazards to human. Then, the
worker must remember to keep the workplace clean as the responsibilities of their
duties.
2.3.4 SEIKETSU
The next process is SEIKETSU or usually called as standardize. After organize
thing in the right place, cleaning it, people need to maintain the condition of
workplace area. Each worker has different daily routine that must be done every
16
day in the workplace area, standard making people realize about the duties and
responsibilities (Gupta & Jain, 2014). It is become the main reason for the
company to create standardize for every workplace area. Based on Ishikawa
(1986), the standard can be made by using the help of 5M to fulfill the
requirement, which stands for Manpower, Methods, Materials, Machines, and
Measurements representing the 5 components of making a standard.
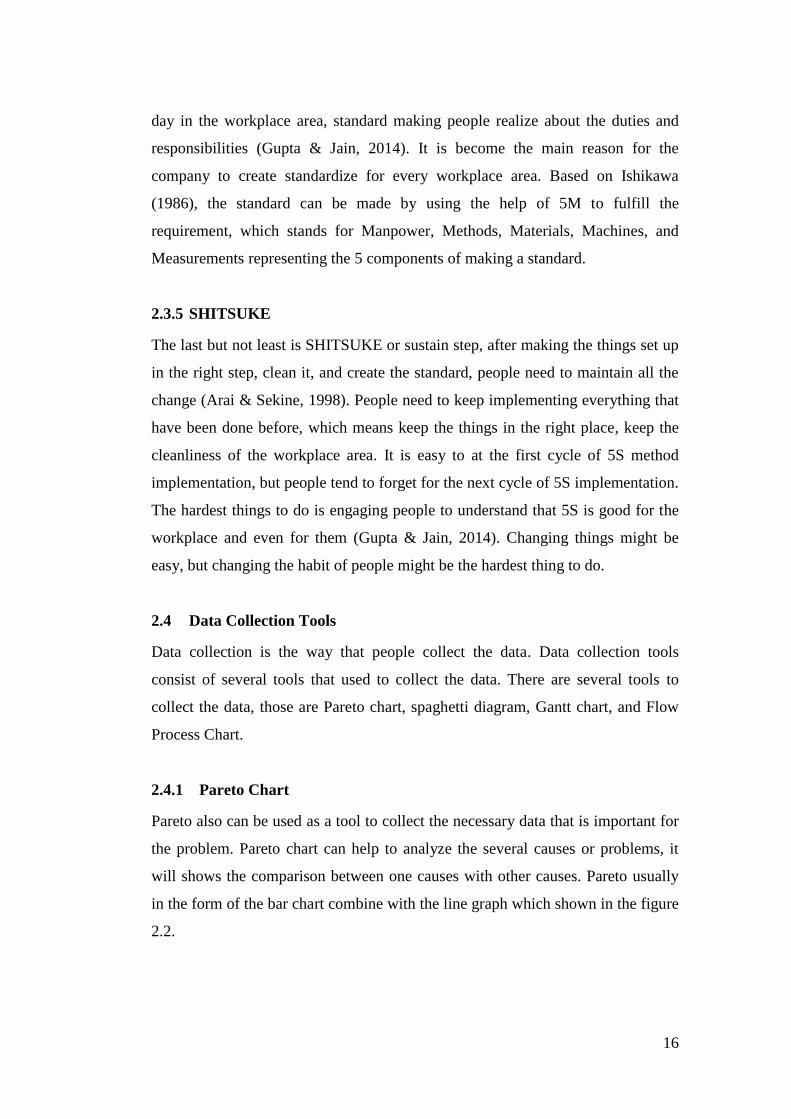
2.3.5 SHITSUKE
The last but not least is SHITSUKE or sustain step, after making the things set up
in the right step, clean it, and create the standard, people need to maintain all the
change (Arai & Sekine, 1998). People need to keep implementing everything that
have been done before, which means keep the things in the right place, keep the
cleanliness of the workplace area. It is easy to at the first cycle of 5S method
implementation, but people tend to forget for the next cycle of 5S implementation.
The hardest things to do is engaging people to understand that 5S is good for the
workplace and even for them (Gupta & Jain, 2014). Changing things might be
easy, but changing the habit of people might be the hardest thing to do.
2.4 Data Collection Tools
Data collection is the way that people collect the data. Data collection tools
consist of several tools that used to collect the data. There are several tools to
collect the data, those are Pareto chart, spaghetti diagram, Gantt chart, and Flow
Process Chart.
2.4.1 Pareto Chart
Pareto also can be used as a tool to collect the necessary data that is important for
the problem. Pareto chart can help to analyze the several causes or problems, it
will shows the comparison between one causes with other causes. Pareto usually
in the form of the bar chart combine with the line graph which shown in the figure
2.2.
17
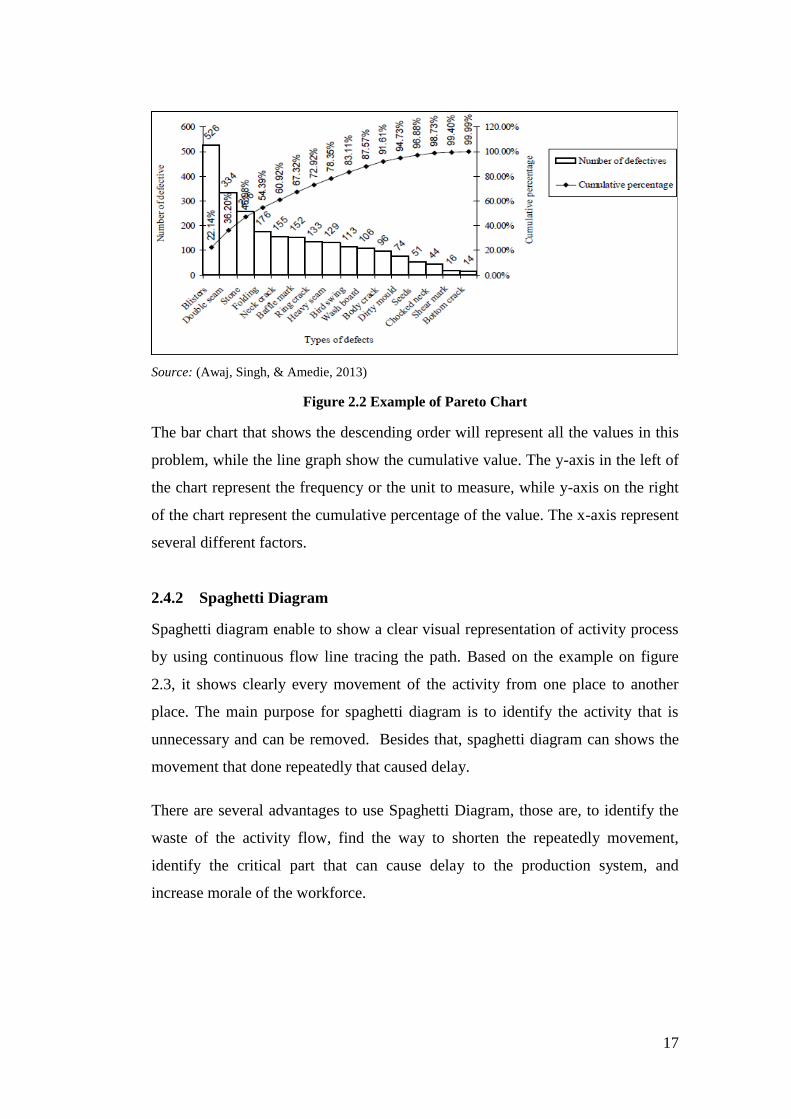
Source: (Awaj, Singh, & Amedie, 2013)
Figure 2.2 Example of Pareto Chart
The bar chart that shows the descending order will represent all the values in this
problem, while the line graph show the cumulative value. The y-axis in the left of
the chart represent the frequency or the unit to measure, while y-axis on the right
of the chart represent the cumulative percentage of the value. The x-axis represent
several different factors.
2.4.2 Spaghetti Diagram
Spaghetti diagram enable to show a clear visual representation of activity process
by using continuous flow line tracing the path. Based on the example on figure
2.3, it shows clearly every movement of the activity from one place to another
place. The main purpose for spaghetti diagram is to identify the activity that is
unnecessary and can be removed. Besides that, spaghetti diagram can shows the
movement that done repeatedly that caused delay.
There are several advantages to use Spaghetti Diagram, those are, to identify the
waste of the activity flow, find the way to shorten the repeatedly movement,
identify the critical part that can cause delay to the production system, and
increase morale of the workforce.

18
Source: (Kamne, 2016)
Figure 2.3 Example of Spaghetti Diagram
The spaghetti diagram will show the layout of the place. The place of the
activities that people want to observe. For the biggest scope, it only show the
name of the place, it looks like a sketch of map. For the more specific scope, it
shows more detail information in it. For example, the layout of a room that consist
of bathroom, closet, desk chair, bed, and etc. Then, when people want to observe
the activities, it will become more detail.
2.4.3 Gantt Chart
Gantt chart is a production planning tool to manage batch production. In other
words, Gantt chart also a project planning tool to represent timing task, because
Gantt chart is more simple to be understand by all people and also easy to
construct. Based on the example on figure 2.4, it's already used by several
complex projects.
19
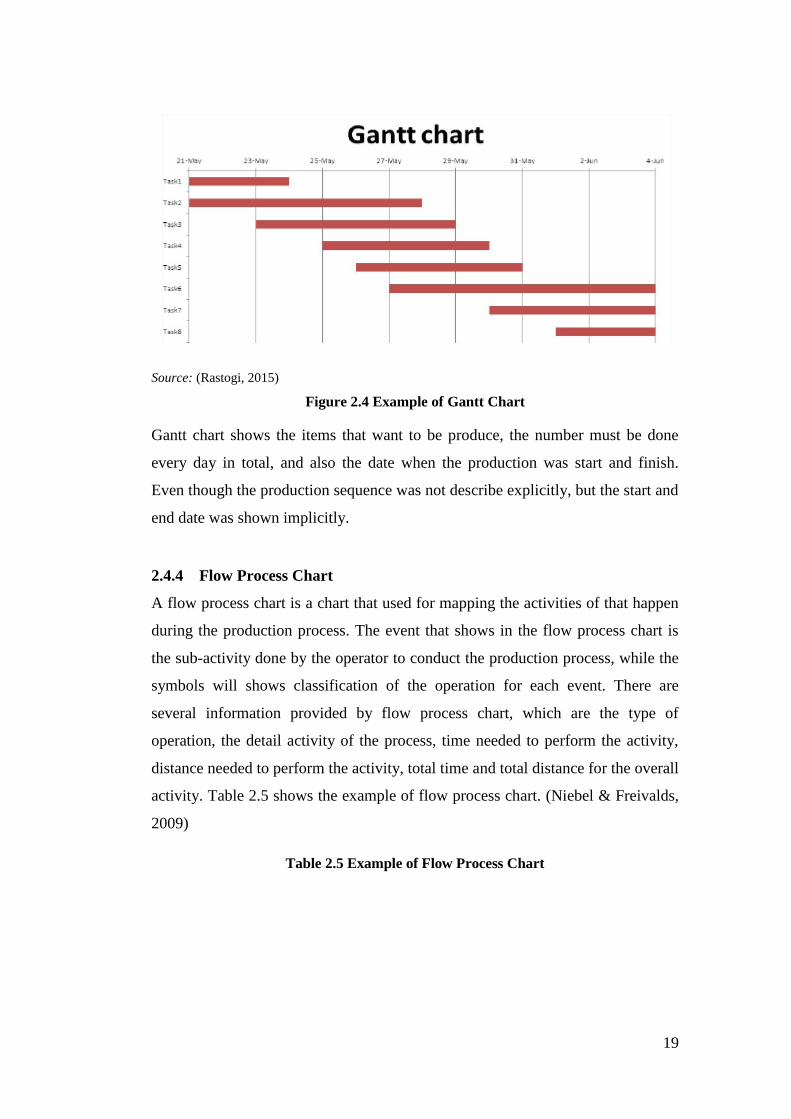
Source: (Rastogi, 2015)
Figure 2.4 Example of Gantt Chart
Gantt chart shows the items that want to be produce, the number must be done
every day in total, and also the date when the production was start and finish.
Even though the production sequence was not describe explicitly, but the start and
end date was shown implicitly.
2.4.4 Flow Process Chart
A flow process chart is a chart that used for mapping the activities of that happen
during the production process. The event that shows in the flow process chart is
the sub-activity done by the operator to conduct the production process, while the
symbols will shows classification of the operation for each event. There are
several information provided by flow process chart, which are the type of
operation, the detail activity of the process, time needed to perform the activity,
distance needed to perform the activity, total time and total distance for the overall
activity. Table 2.5 shows the example of flow process chart. (Niebel & Freivalds,
2009)
Table 2.5 Example of Flow Process Chart

20
Source: (Niebel & Freivalds, 2009)
Flow process chart will shows every that happen in the activity. For example, the
flow process chart of the milling process, event is the sub activity that done by the
operator to complete the milling process from the beginning until the end. Then,
every event or sub-activity will be differentiate based on the type of operation
which shows in table 2.6. The link arrows shows the direction of flow process
chart. Inside the table of flow process chart, the analyst that fill the flow process
chart must fill the time needed to complete every event, and also the distance
needed by the operator to conduct the event. The total time total distance also
21
input inside the flow process chart. Flow process chart will show the information
and short overview about the whole process. (Niebel & Freivalds, 2009)
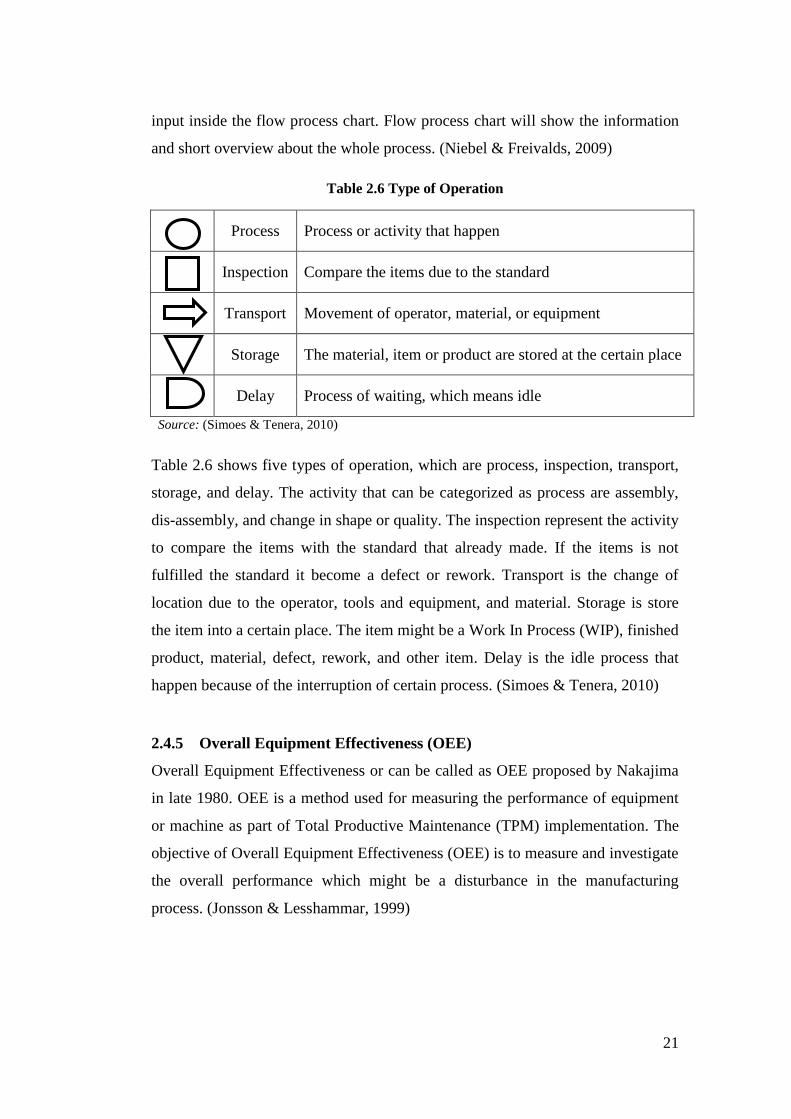
Table 2.6 Type of Operation
Process Process or activity that happen
Inspection Compare the items due to the standard
Transport Movement of operator, material, or equipment
Storage The material, item or product are stored at the certain place
Delay Process of waiting, which means idle
Source: (Simoes & Tenera, 2010)
Table 2.6 shows five types of operation, which are process, inspection, transport,
storage, and delay. The activity that can be categorized as process are assembly,
dis-assembly, and change in shape or quality. The inspection represent the activity
to compare the items with the standard that already made. If the items is not
fulfilled the standard it become a defect or rework. Transport is the change of
location due to the operator, tools and equipment, and material. Storage is store
the item into a certain place. The item might be a Work In Process (WIP), finished
product, material, defect, rework, and other item. Delay is the idle process that
happen because of the interruption of certain process. (Simoes & Tenera, 2010)
2.4.5 Overall Equipment Effectiveness (OEE)
Overall Equipment Effectiveness or can be called as OEE proposed by Nakajima
in late 1980. OEE is a method used for measuring the performance of equipment
or machine as part of Total Productive Maintenance (TPM) implementation. The
objective of Overall Equipment Effectiveness (OEE) is to measure and investigate
the overall performance which might be a disturbance in the manufacturing
process. (Jonsson & Lesshammar, 1999)
22
OEE have three factors of performance measurement which are availability,
performance, and quality which will be used for OEE calculation in rating the
effectiveness of the machine or equipment. (Jonsson & Lesshammar, 1999)
Availability rate shows the availability of the machine during the production
process. Loss in availability means the downtime loss of a machine which
inlude breakdowns, and set-up time and adjustment.
Performance rate shows the performance of the machine in performing the
production process. Speed loss is the OEE loss category in the performance
rate and include small stops and speed reduce.
Quality rate shows the quality related due to the result of production process.
Quality loss includes the start-up rejects and production rejects.
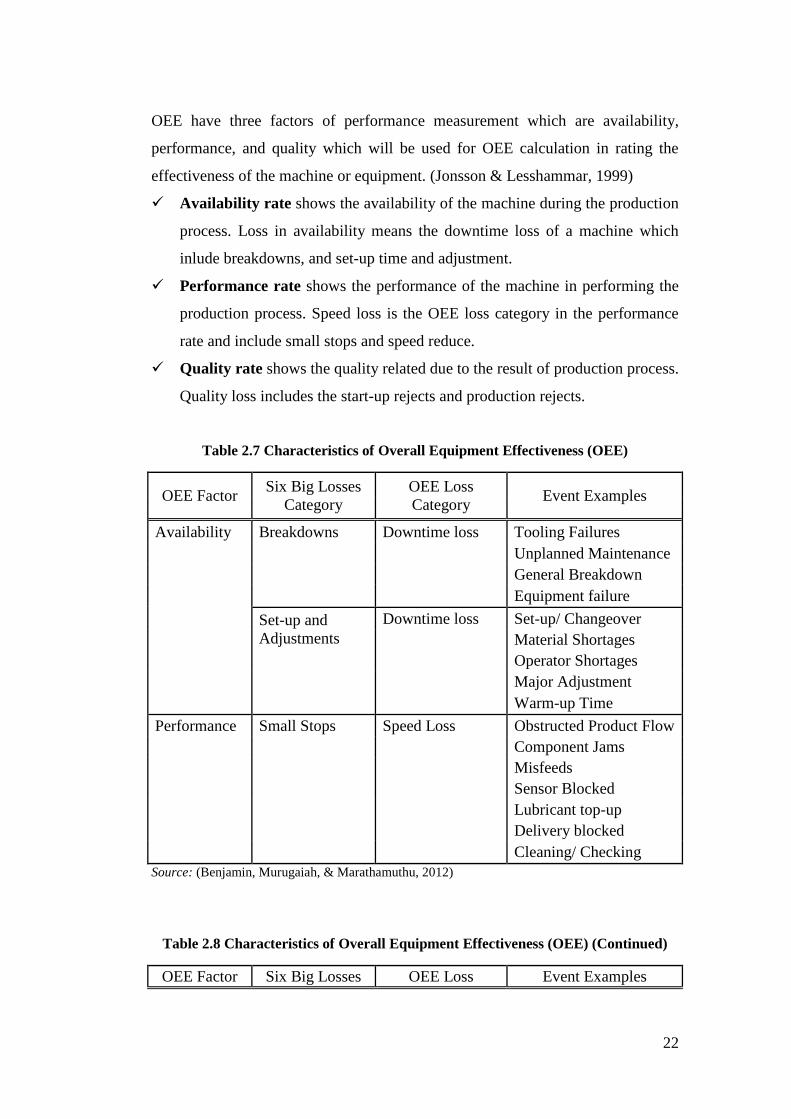
Table 2.7 Characteristics of Overall Equipment Effectiveness (OEE)
OEE Factor Six Big Losses
Category
OEE Loss
Category Event Examples
Availability Breakdowns Downtime loss Tooling Failures
Unplanned Maintenance
General Breakdown
Equipment failure
Set-up and
Adjustments
Downtime loss Set-up/ Changeover
Material Shortages
Operator Shortages
Major Adjustment
Warm-up Time
Performance Small Stops Speed Loss Obstructed Product Flow
Component Jams
Misfeeds
Sensor Blocked
Lubricant top-up
Delivery blocked
Cleaning/ Checking
Source: (Benjamin, Murugaiah, & Marathamuthu, 2012)
Table 2.8 Characteristics of Overall Equipment Effectiveness (OEE) (Continued)
OEE Factor Six Big Losses OEE Loss Event Examples
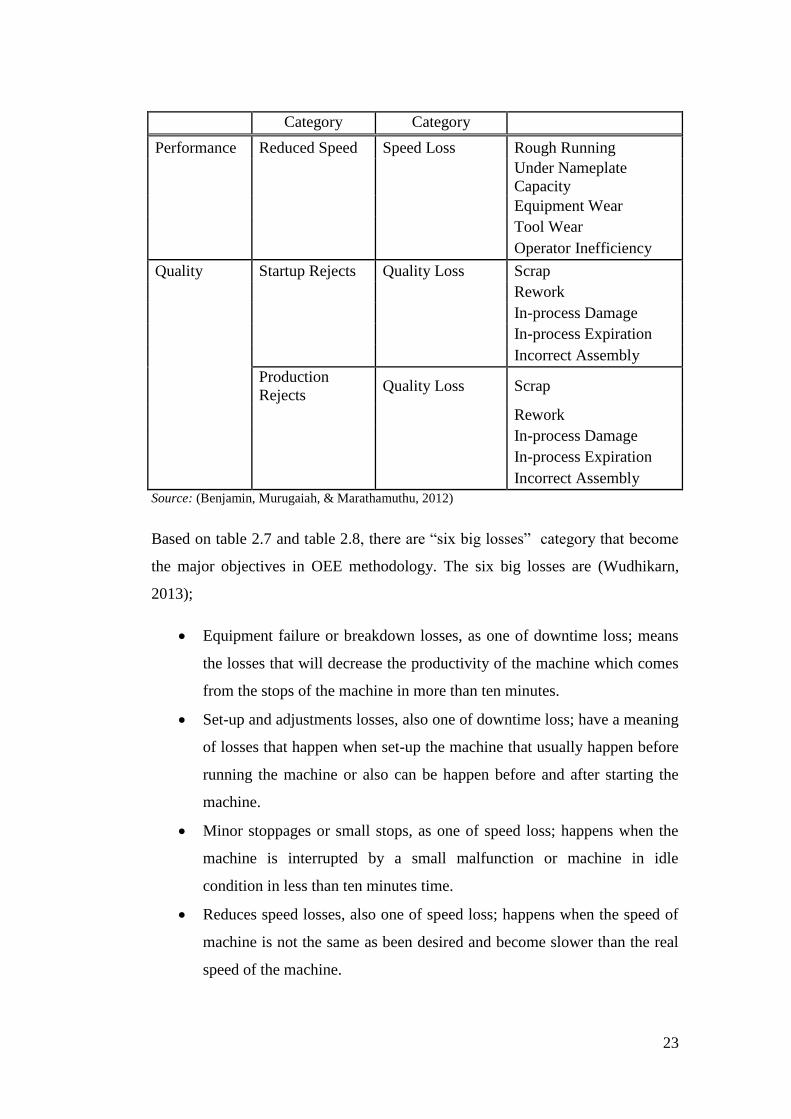
23
Category Category
Performance Reduced Speed Speed Loss Rough Running
Under Nameplate
Capacity
Equipment Wear
Tool Wear
Operator Inefficiency
Quality Startup Rejects Quality Loss Scrap
Rework
In-process Damage
In-process Expiration
Incorrect Assembly
Production
Rejects Quality Loss Scrap
Rework
In-process Damage
In-process Expiration
Incorrect Assembly
Source: (Benjamin, Murugaiah, & Marathamuthu, 2012)
Based on table 2.7 and table 2.8, there are “six big losses” category that become
the major objectives in OEE methodology. The six big losses are (Wudhikarn,
2013);
Equipment failure or breakdown losses, as one of downtime loss; means
the losses that will decrease the productivity of the machine which comes
from the stops of the machine in more than ten minutes.
Set-up and adjustments losses, also one of downtime loss; have a meaning
of losses that happen when set-up the machine that usually happen before
running the machine or also can be happen before and after starting the
machine.
Minor stoppages or small stops, as one of speed loss; happens when the
machine is interrupted by a small malfunction or machine in idle
condition in less than ten minutes time.
Reduces speed losses, also one of speed loss; happens when the speed of
machine is not the same as been desired and become slower than the real
speed of the machine.
24
Defect and rework loss, as one of quality loss; happens when the losses
that caused by repairing the rework or defect product into a good
products, which include the time and financial losses.
Startup loss, also one of quality loss; the losses that happen when start-up
the machine or production process, which also include time and volume
lsses.
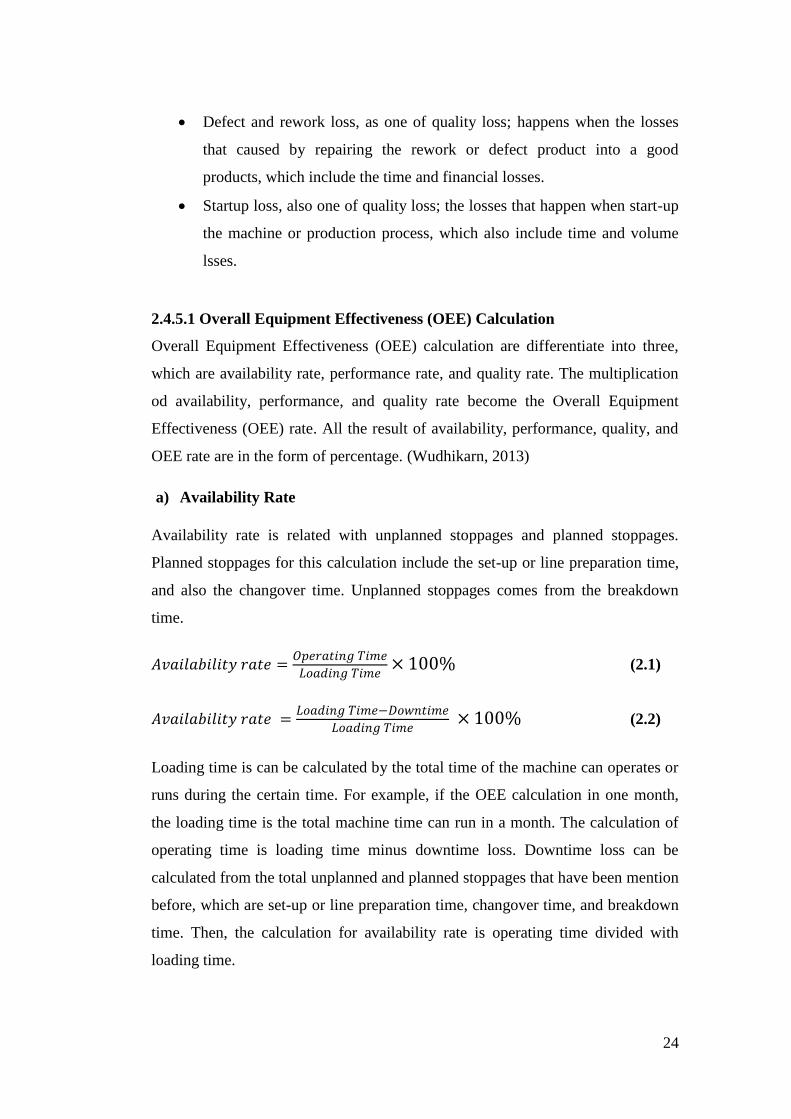
2.4.5.1 Overall Equipment Effectiveness (OEE) Calculation
Overall Equipment Effectiveness (OEE) calculation are differentiate into three,
which are availability rate, performance rate, and quality rate. The multiplication
od availability, performance, and quality rate become the Overall Equipment
Effectiveness (OEE) rate. All the result of availability, performance, quality, and
OEE rate are in the form of percentage. (Wudhikarn, 2013)
a) Availability Rate
Availability rate is related with unplanned stoppages and planned stoppages.
Planned stoppages for this calculation include the set-up or line preparation time,
and also the changover time. Unplanned stoppages comes from the breakdown
time.
(2.1)
(2.2)
Loading time is can be calculated by the total time of the machine can operates or
runs during the certain time. For example, if the OEE calculation in one month,
the loading time is the total machine time can run in a month. The calculation of
operating time is loading time minus downtime loss. Downtime loss can be
calculated from the total unplanned and planned stoppages that have been mention
before, which are set-up or line preparation time, changover time, and breakdown
time. Then, the calculation for availability rate is operating time divided with
loading time.
25
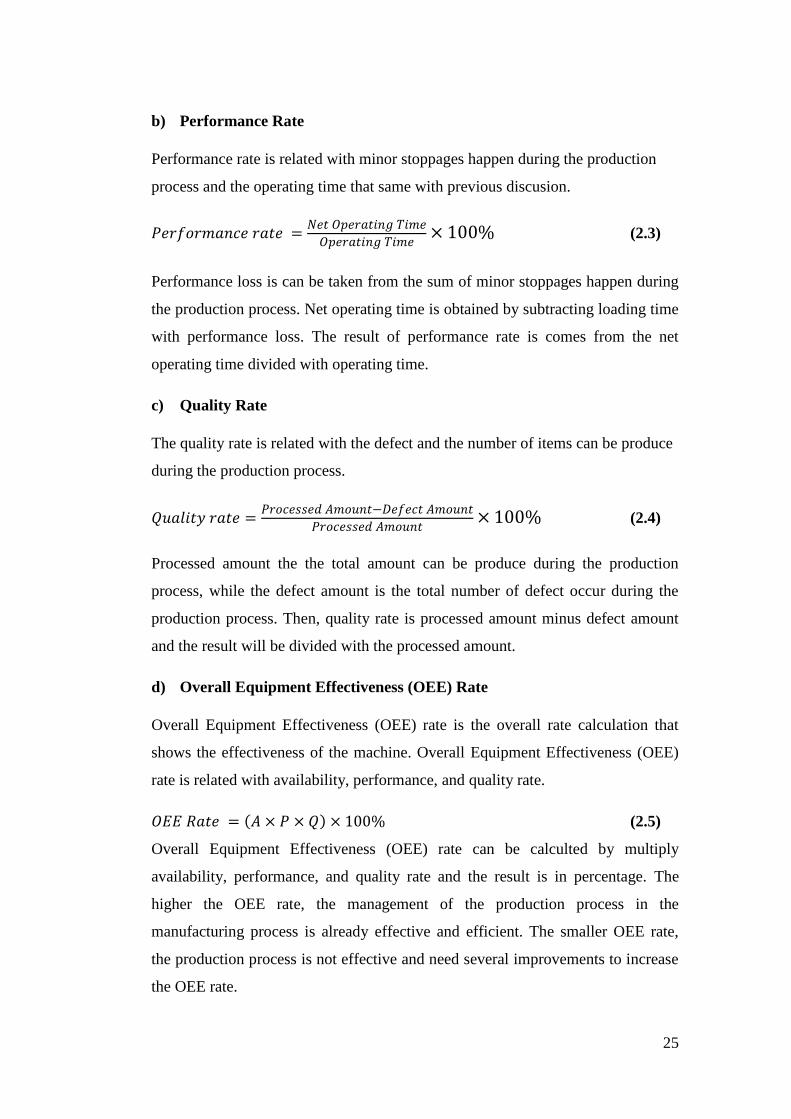
b) Performance Rate
Performance rate is related with minor stoppages happen during the production
process and the operating time that same with previous discusion.
(2.3)
Performance loss is can be taken from the sum of minor stoppages happen during
the production process. Net operating time is obtained by subtracting loading time
with performance loss. The result of performance rate is comes from the net
operating time divided with operating time.
c) Quality Rate
The quality rate is related with the defect and the number of items can be produce
during the production process.
(2.4)
Processed amount the the total amount can be produce during the production
process, while the defect amount is the total number of defect occur during the
production process. Then, quality rate is processed amount minus defect amount
and the result will be divided with the processed amount.
d) Overall Equipment Effectiveness (OEE) Rate
Overall Equipment Effectiveness (OEE) rate is the overall rate calculation that
shows the effectiveness of the machine. Overall Equipment Effectiveness (OEE)
rate is related with availability, performance, and quality rate.
( ) (2.5)
Overall Equipment Effectiveness (OEE) rate can be calculted by multiply
availability, performance, and quality rate and the result is in percentage. The
higher the OEE rate, the management of the production process in the
manufacturing process is already effective and efficient. The smaller OEE rate,
the production process is not effective and need several improvements to increase
the OEE rate.
26
2.5 Previous Research
SMED approach applied to a press line in automotive industry. SMED method
proposes waste elimination by reducing non-production time in each machine,
especially the time needed for set-up machine time. Gantt chart and time study
will be used to support the SMED implementation in this research. In the end, the
set-up time of press line in automotive industry has been reduce from 6 minutes
and 47 seconds become 5 minutes and 23 seconds, with one minute and 24
seconds reduction in total. SMED implementation is successful in reducing set-up
time of press line in automotive industry with 47.5% reduction of set-up time.
This research is done by Andreia Simoes and Alexandra Tenera in 2010 with the
title “Improving Set-up Time in a Press Line – Application of the SMED
Methodology”, from IFAC, from page 297 until page 302.
Another SMED implementation happens in punch press operation in the
fabrication department at Krueger International’s (KI) Manitowoc manufacturing
facility. Reduction of set-up time might be helpful to support KI’s marketing
strategy in fulfill customer’s needs. After conducting all the step of SMED, the
set-up time is reduced by the overall set-up time reduction rate at 68%. The
SMED implementation is successful in reducing set-up time in punch press
operation at Krueger International’s (KI) Manitowoc manufacturing. This
research is done by Brian T. Michels in 2007 with title of “Application of
Shingo’s Single Minute Exchange of Dies (SMED) Methodology to Punch Press
Changeover Times at Krueger International, 5th
ed, American Psychological
Association in Washington DC.
A study case held in a small scale industry of one of automotive manufacturing
industry to reduce set-up time by using SMED implementation. In order to
achieve the excellence, manufacturing industry need to reduce production time
and cost to improve production performance and product quality. After
implementation of SMED, the set-up time is reduce from 480 second become 385
seconds with a total 85 seconds. Another achievement by using SMED

27
implementation is 30% cost reduction while the productivity and product output is
increased. This research is held by Mr. Rahul R Joshi and Prof G R Naik in 2012
with title of “Application of SMED Methodology – A Case Study in Small Scale
Industry”, International Journal of Scientific and Research Publications in
Kolhapur, India.
A study case happens in Tanzania hospital that has the main purpose in reducing
waiting time of patient of hospital. The method used for reducing waiting time is
5S methodology by the help of Design of Experiment method of Randomized
Block Design. After implementation 5S (SEIRI-SEITON-SEISO-SEIKETSU-
SHITSUKE) and randomized block design, the outcome shows a good result
which means a successful research. This research held by Hisahiro Ishijima,
Eliudi Eliakimu, and Jonathan Mcharo Mshana, with ttile of “The 5S Approach to
Improve a Working Environment can Reduce Waiting Time”, The TQM Journal
from page 664 until page 680.
CHAPTER III
RESEARCH METHODOLOGY

28
3.1 Research Framework
Research framework shows the step or guideline to conduct the research. Based
on figure 3.1, steps of this research are initial observation, problem identification,
literature study, data collection and analysis, and conclusion and recommendation.
Figure 3.1 Research Methodology
3.1.1 Initial Observation
The initial observation is analyzing the line preparation process from the
beginning until the end in filling machine area in PT. MNO. It observes the detail
activities of line preparation or set-up time in filling area. Besides that, it observe
the filling production layout that include the surrounding environment of filling
• Observation on the manufacturing process or production
flow in PT. MNO
• Observation on the production layout
Initial
Observation
• Identify problem background
• Determine research’s objective
• Determine research’s scope and assumptions
Problem
Identification
• Theoretical knowledge about Lean Manufacturing, waste
• Theoretical knowledge about SMED and 5S
• Theoretical knowledge about data collection tools
Literature
Study
• Create Flow Process Chart of setup activities
• Create Spaghetti diagram of setup activities of filling area
• Create Gantt Chart based of setup activities of filling area
• Initial Layout Design
Data
Collection
• Single Minutes Exchange of Die (SMED) implementation
• 5S implementation
• Overall Equipment Effectiveness (OEE)
Data
Analysis
• Conclusion and calculation analysis
• Recommendation for the further research Conclusion and
Recommendation
29
machine. From the observation the research can gather some important data that
can be used for this research.
3.1.2 Problem Identification
After observing the line preparation of filling area, there is a problem regarding to
the line preparation or set-up time. There will be problem background that
explains about the problem of planned stoppages of line preparation in filling
machine area. Problem statement also can be determined by focusing to the main
problem about reducing planned stoppages in line preparation of filling area. The
research objective is the answer of the problem statement that already stated
which are reducing the planned stoppages in line preparation of filling area by
using Single Minute Exchange of Dies (SMED) and 5S method implementation.
3.1.3 Literature Study
The literature study will clearly explain about every method that will be used in
this research based on several journals and books. There will be theoretical
knowledge regarding to SMED and 5S method. Besides that, there are theoretical
knowledge about the lean manufacturing, waste, and set-up time that related with
the problem in this research. There will be several data collection and analysis
tools which are, Flow Process Chart, Gantt Chart, Spaghetti Diagram, Pareto
Chart, and Overall Equipment Effectiveness (OEE).
3.1.4 Data Collection
All the data is originally taken from PT. MNO by individual observation and also
the data that already record by the company. There will be four data that will be
collected which are Flow Process Chart that explain the activities, time and
distance of set-up activities, Spaghetti Diagram that shows the movement of
operator during the set-up activities, Gantt Chart that explain the time lap of set-
up activities, layout design that shows the overall layout of filling machine area.
30
3.1.5 Data Analysis
After the data is gathered, the data will be further analyze in this section. First of
all, there will be OEE calculation that will be used at the end of this research to
compare the effectiveness of the machine before and after SMED and 5S
implementation. OEE calculation will help this research to know the difference
from the effectiveness of production process before and after SMED and 5S
method implementation. The data that will be used in this calculation are based on
the monthly data regarding to unplanned and planned stoppages that taken from
the PT.MNO
Then, the analysis is done by using the Single Minutes Exchange of Dies (SMED)
method at first. Then, it is continued by 5S method after SMED method, Single
Minutes Exchange of Dies (SMED) method consist of four steps which are
internal and external activities are not differentiated, separate internal and external
activities, convert internal and external activities, and streamline internal
activities. 5S method help to streamline the remaining internal activities to make
the internal activities more effective than before. The data of conduct the analysis
is taken from the data collection in this research.
3.1.6 Conclusion and Recommendation
This section contains the summary of all the feedback that already done including
the main result. The result will be answering the problem of reducing the planned
stoppages of filling area in PT. MNO which comes from set-up activities. There
are also the differences of OEE rate before and after SMED and 5S method
implementation. In this section also include the advice to the further research.
3.2 Detail Framework
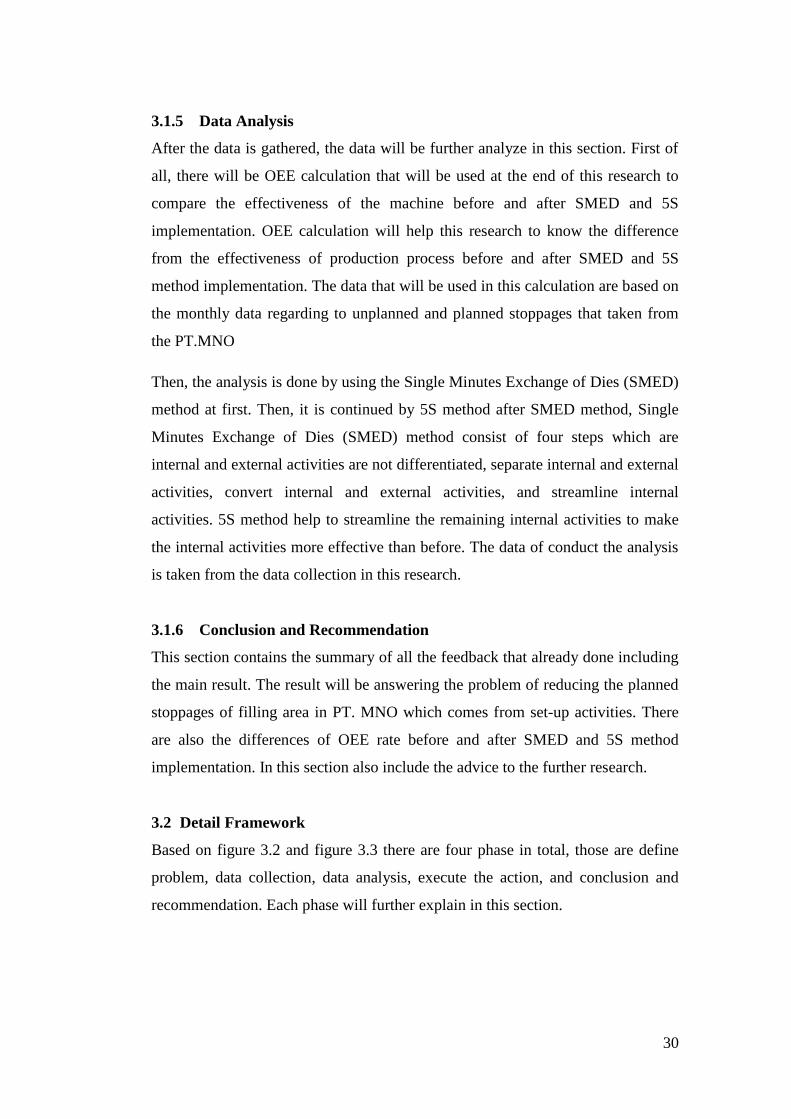
Based on figure 3.2 and figure 3.3 there are four phase in total, those are define
problem, data collection, data analysis, execute the action, and conclusion and
recommendation. Each phase will further explain in this section.

31
Figure 3.2 Detail Framework
Problem
Identification
Determine Flow
Process Chart
Determine Gantt
Chart
Initial Layout
Design
START
Define
theoretical
knowledge
Initial
Observation
Determine
Spaghetti Diagram
A
Define objective
of research
Define
Problem
Data
Collection
32
Figure 3.3 Detail Framework (continued)
Setup time
≤ 10 ?
Conclusion and
Recommendation
FINISH
Yes
No
Overall Equipment
Effectiveness
(Before)
Internal and external
activities are not
differentiated
Overall Equipment
Effectiveness (After)
Separate internal and
external activities
Convert internal to
external activities
Streamline
internal activities
5S implementation
A
Execute the
Action
Data Analysis
Result of SMED and
5S implementation

33
3.2.1 Define Problem
Based on figure 3.2, define problem is differentiated into four steps, which are
initial observation, problem identification, define objective of research, define
theoretical knowledge regarding to the problem. Initial observation can be done
by observing the production process in filling machine area and find is there any
problem happen. Problem identification means identified the problem and also the
causes of the problem which comes from set-up activities. Define the objective of
research means identify the objective to held the research and the way to solve the
problem. In this research, set-up time can be reduce by using Single Minutes
Exchange of Dies (SMED) integrated with 5S method. The last steps is defining
theoretical knowledge regarding to the SMED, 5S, set-up and other data
collection and analysis tools based on several journals and books.
3.2.2 Data Collection
All the data that have been collected from PT. MNO will support the analysis in
this research. The data that are needed for this research are all activities regarding
to the problem in line preparation or set-up time of filling area. The activities
including the duration, movement, distance, steps of activities, etc.
Flow Process Chart will shows the main activities including the sub-
activities, including the time and distance. The data for Flow Process Chart is
obtain from individual observation during the set-up activities.
Gantt chart will show the clear step of activity and the time lap for each
activity. Similar with Flow Process Chart and Spaghetti Diagram, data of
Gantt Chart is obtain by observation and data from PT. MNO.
Observation also held to gather the data of layout design. The layout design
will shows the specific location of the machine and surrounding environment
of the filling machine area.
The observation of the operator movement to conduct the set-up activities
will become the data of spaghetti diagram. Spaghetti diagram shows the detail
movement of the operator during the line preparation from the beginning until
the end with the movement from one place to another place.

34
3.2.3 Data Analysis
After the data is gathered, the data will be further analyze in this section which
shown in figure 3.3. Overall Equipment Effectiveness is used to analyze the
effectiveness of the machine before SMED and 5S implementation. The data that
will be used for OEE calculation are obtained from the PT. MNO in filling
machine. The data might be the planned maintenance time, breakdown time, line
preparation time, changeover time, and other production time from the month of
April until June 2016.
The first step of Single Minutes Exchange of Dies (SMED) method is stated
internal and external activities that are not differentiated which contain the entire
activities of set-up. Then, separate the internal and external activities from the
result of previous step. The internal and external activities must be separate
according to the activities that the operator done in real life. If there any internal
activities that can be done during the machine run, the internal activities can be
convert to external activities to reduce internal activities. Next, streamline the
remaining internal activities by using 5S implementation.
SEIRI (Sorting) will be the first step, observing the surrounding area and
determine unnecessary item in the filling machine area and removed, re-place, or
re-stored unnecessary item. Then, SEITON (Set) will set the all the remaining
item in the right place to reduce the repetition and far movement of the operator.
The implementation of SEISO (Shining) step is done by creating a schedule to
clean the filling machine area environment together with the operator and achieve
the standard condition. The cleaning time can be done during the planned
maintenance time in the beginning of June 2016. SEIKETSU (Standardizing) step
will help to create the standard of new set-up activities in filling machine area,
while SHITSUKE (Sustaining) keeping the implementation stay running as it is
can be done by train the operator the new set-up activities and keep monitoring
them when performing the new standard of set-up activities.
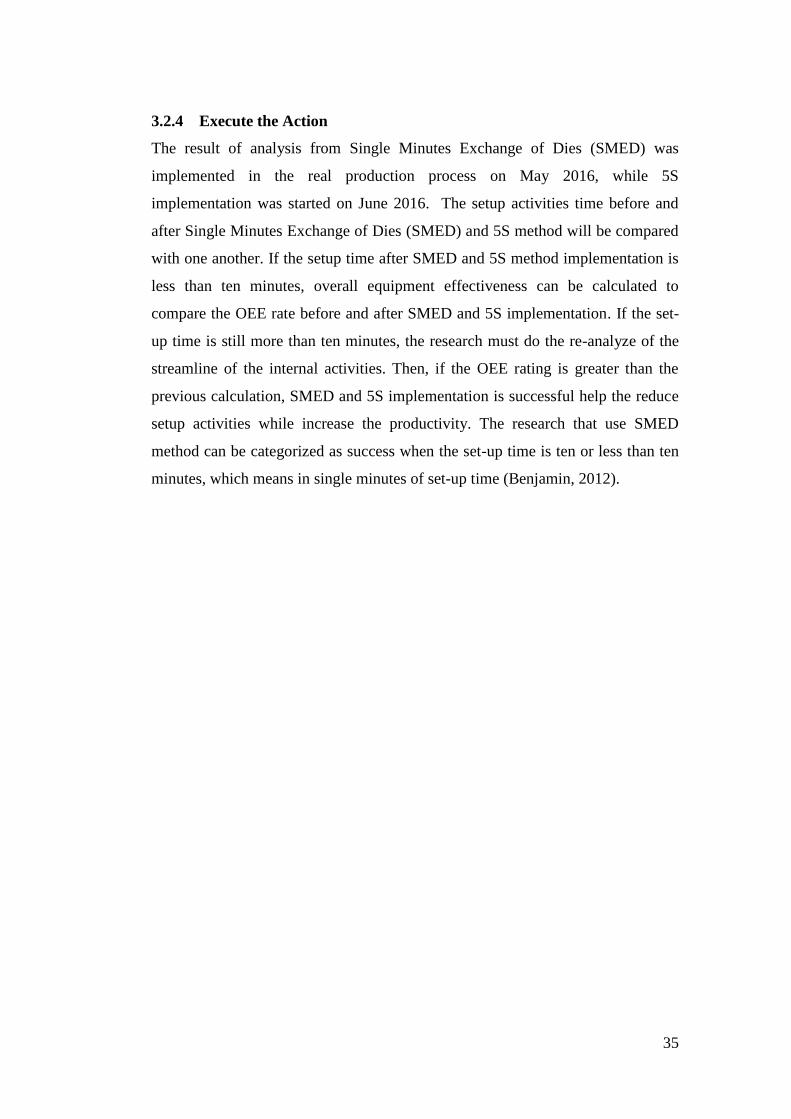
35
3.2.4 Execute the Action
The result of analysis from Single Minutes Exchange of Dies (SMED) was
implemented in the real production process on May 2016, while 5S
implementation was started on June 2016. The setup activities time before and
after Single Minutes Exchange of Dies (SMED) and 5S method will be compared
with one another. If the setup time after SMED and 5S method implementation is
less than ten minutes, overall equipment effectiveness can be calculated to
compare the OEE rate before and after SMED and 5S implementation. If the set-
up time is still more than ten minutes, the research must do the re-analyze of the
streamline of the internal activities. Then, if the OEE rating is greater than the
previous calculation, SMED and 5S implementation is successful help the reduce
setup activities while increase the productivity. The research that use SMED
method can be categorized as success when the set-up time is ten or less than ten
minutes, which means in single minutes of set-up time (Benjamin, 2012).
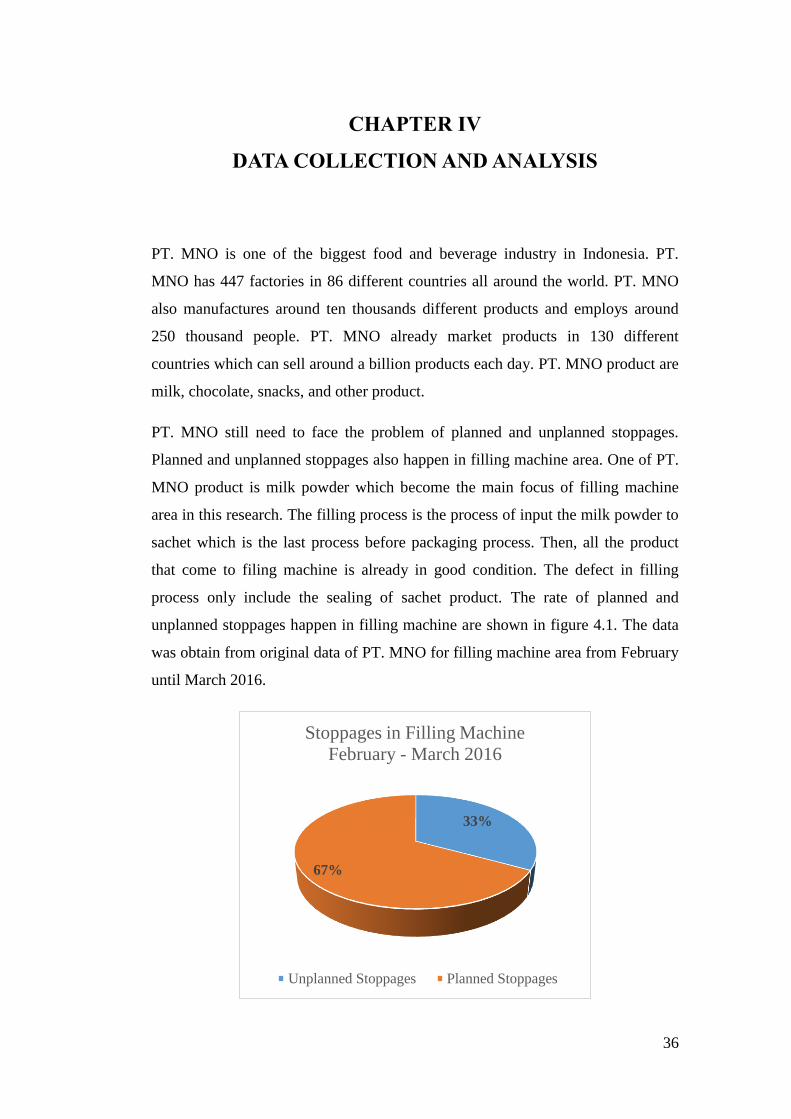
36
CHAPTER IV
DATA COLLECTION AND ANALYSIS
PT. MNO is one of the biggest food and beverage industry in Indonesia. PT.
MNO has 447 factories in 86 different countries all around the world. PT. MNO
also manufactures around ten thousands different products and employs around
250 thousand people. PT. MNO already market products in 130 different
countries which can sell around a billion products each day. PT. MNO product are
milk, chocolate, snacks, and other product.
PT. MNO still need to face the problem of planned and unplanned stoppages.
Planned and unplanned stoppages also happen in filling machine area. One of PT.
MNO product is milk powder which become the main focus of filling machine
area in this research. The filling process is the process of input the milk powder to
sachet which is the last process before packaging process. Then, all the product
that come to filing machine is already in good condition. The defect in filling
process only include the sealing of sachet product. The rate of planned and
unplanned stoppages happen in filling machine are shown in figure 4.1. The data
was obtain from original data of PT. MNO for filling machine area from February
until March 2016.
33%
67%
Stoppages in Filling Machine
February - March 2016
Unplanned Stoppages Planned Stoppages

37
Figure 4.1 Stoppages in Filling Machine (February – March 2016)
Planned stoppages and unplanned stoppages become the problem that must be
face by PT. MNO. Based on figure 4.1, filling machine shows the appearance of
both stoppages. But, the highest contribution goes to planned stoppages with 67%,
while the unplanned stoppages only contributes 33%. Then, the company focus on
the planned stoppages happen in filling machine. The planned stoppages itself can
be divided into four major stoppages happen in filling machine, which are set-up
activities, cleaning inspection lubrication (CIL), operation stoppages, and planned
maintenance. The data of planned stoppages are shown in figure 4.2 that are
obtain from the data of PT. MNO from February until March 2016 in filling
machine.
Figure 4.2 Planned Stoppages in Filling Machine (February – March 2016)
Based on figure 4.2, the highest contribution goes to set-up activities with 48%
from February until March 2016. Cleaning Inspection Lubrication (CIL) shows
34%, while operation stoppages 19%, meals and break 3%, changeover time 2%,
and planned maintenance only 1%. Then, the main focus in this research goes to
set-up activities of filling machine area.
PT. MNO still has to face a problem in manufacturing industry regarding to
planned stoppages especially in set-up activities. The time needed to conduct set-
up activities is taking too long which actually the set-up time still can be reduce
48%
34%
19%
3% 2% 1% 0%
10%
20%
30%
40%
50%
60%
Set-up CIL Operationg
Stoppages
Meals and
Break
Changeover
Time
Planned
Maintenance
Planned Stoppages in Filling Machine
February - March 2016

38
by using Single Minutes Exchange of Dies (SMED) method. 5S method will be
used to streamline the remaining internal activities to reduce more set-up time.
Then, PT. MNO can reduce the impact of losses to the company.
The productivity of machine can be calculated by using Overall Equipment
Effectiveness (OEE). There are three different rate, which are availability,
performance, and quality. In this research, the availability calculation will use the
set-up time, changeover time, and process failure, while performance rate will use
the minor stoppages, and quality will use the defect of the filling machine product.
The defect happen in filling machine product only caused by the sealing of
product sachet, since the output of filling machine is milk powder in sachet
product. The milk powder that come to filling machine are already in the good
condition since filling machine is the last production process before the packaging
process.
4.1 Data Collection
Data collection can be obtained by initial observation to the condition of filling
machine area. The data are original from PT.MNO particularly in filling machine
area. The data that need to be collected are flow process chart, Gantt chart, initial
layout design, and spaghetti diagram. All the data will be collected and used for
data analysis in the next discussion.
There are also several data that can be obtain originally from the company. The
data of several planned and unplanned stoppages that will be used for Overall
Equipment Effectiveness (OEE) calculation in the next chapter which is data
analysis. The data of changeover time, set-up time and process failure will be used
for calculating availability. Minor stoppages data will be used for performance
calculation, and the data of defect will be used for calculating the quality. All the
data are from the filling machine are from April to June 2016 which shown in the
appendices.

39
4.1.1 Flow Process Chart
The whole activities of line preparation in filling machine area are shown in flow
process chart in table 4.1 and table 4.2. The data for flow of set-up process are
obtain from the observation to the area of filling machine when set-up activities
are take place. The flow process chart also shows the symbols of activity that
clearly identified what type of activity that happen, it can be operation, transport,
delay, inspection, or storage. Besides that, the time of each activities are stated
including the distance that the operator take, in order to perform the activity in the
filling machine area. Based on table 4.1, there are eight main activities in total
which are checking metal detector, cleaning environment, cleaning machine, input
data SAM/ SAP, take sample bubble test, take sample of carbon test, cut open
rework, and Shift Hand-Over (SHO) update. There are 25 activities happen during
the setup or line preparation in filling machine.
Table 4.1 Flow Process Chart
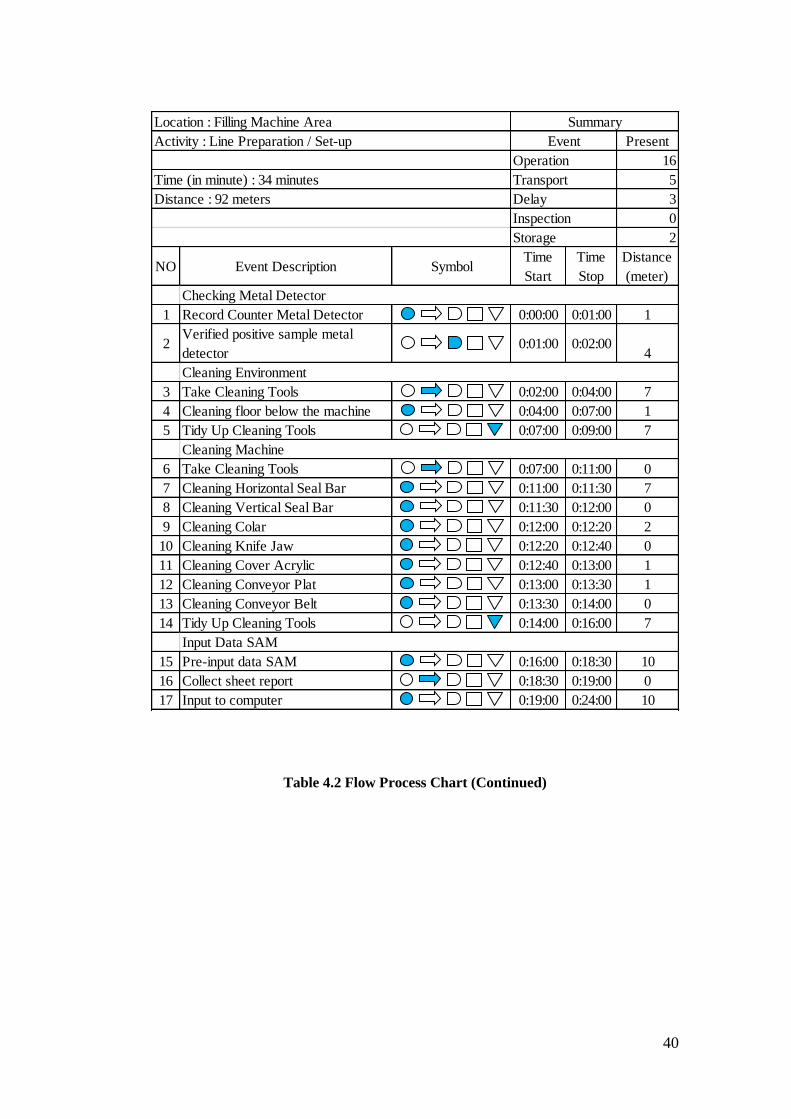
40
Table 4.2 Flow Process Chart (Continued)
Present
16
5
3
0
2
NO Event Description SymbolTime
Start
Time
Stop
Distance
(meter)
1 Record Counter Metal Detector 0:00:00 0:01:00 1
2Verified positive sample metal
detector0:01:00 0:02:00
4
3 Take Cleaning Tools 0:02:00 0:04:00 7
4 Cleaning floor below the machine 0:04:00 0:07:00 1
5 Tidy Up Cleaning Tools 0:07:00 0:09:00 7
6 Take Cleaning Tools 0:07:00 0:11:00 0
7 Cleaning Horizontal Seal Bar 0:11:00 0:11:30 7
8 Cleaning Vertical Seal Bar 0:11:30 0:12:00 0
9 Cleaning Colar 0:12:00 0:12:20 2
10 Cleaning Knife Jaw 0:12:20 0:12:40 0
11 Cleaning Cover Acrylic 0:12:40 0:13:00 1
12 Cleaning Conveyor Plat 0:13:00 0:13:30 1
13 Cleaning Conveyor Belt 0:13:30 0:14:00 0
14 Tidy Up Cleaning Tools 0:14:00 0:16:00 7
15 Pre-input data SAM 0:16:00 0:18:30 10
16 Collect sheet report 0:18:30 0:19:00 0
17 Input to computer 0:19:00 0:24:00 10
Location : Filling Machine Area Summary
Activity : Line Preparation / Set-up
Time (in minute) : 34 minutes
Event
Operation
Transport
Distance : 92 meters Delay
Inspection
Cleaning Machine
Input Data SAM
Checking Metal Detector
Cleaning Environment
Storage

41
The whole activity shows 16 operation event, five transport events, three delay
events, no inspection event, and two storage events. There are several activities
that have a zero distance, this means that the operator does not require any
movement for the current activities, which means the operator is not moving to
any other place. Based on the flow process chart in table 4.1 and table 4.2, time
required to complete setup activity is 34 minutes in total, while the movement
done by the operator is 92 meter of distance in total.
4.1.2 Gantt Chart
Gantt Chart displays the set-up activities against the time taken for the activities.
Based on table 4.3, the number stated in horizontal area means the time of
activities in minutes from one until 34 minutes, while the vertical area shows the
all activities.
NO Event Description SymbolTime
Start
Time
Stop
Distance
(meter)
18 Take Sample for Bubble Test 0:00:00 0:25:00 4
19 Waiting sampling result 0:25:00 0:25:40 0
20 Report sampling 0:25:40 0:26:00 4
21 Take Sample for Carbon Test 0:25:40 0:27:00 4
22 Waiting sampling result 0:27:00 0:27:40 0
23 Report sampling 0:27:40 0:28:00 4
24 Cut Open Rework 0:27:00 0:31:00 10
25 SHO Update 0:27:40 0:34:00 8
Take Sample for Carbon Test
Take Sample for Bubble Test

42
Table 4.3 Gantt Chart
The activities are stated same with flow process chart but the difference only comes from the table shows the time lap from current
activities the next activities until the set-up activities are finished. Gantt chart shows the activities start in minute one until minutes 34.
No Activities 1 2 3 4 5 6 7 8 9 10 11 12 13 14 15 16 17 18 19 20 21 22 23 24 25 26 27 28 29 30 31 32 33 34
1 Checking Metal Detector
Record Counter Metal Detector
Verified positive sample metal detector
2 Cleaning Environment
Take Cleaning Tools
Cleaning floor below the machine
Tidy Up Cleaning Tools
3 Cleaning Machine
Take Cleaning Tools
Cleaning Horizontal Seal Bar
Cleaning Vertical Seal Bar
Cleaning Colar
Cleaning Knife Jaw
Cleaning Cover Acrylic
Cleaning Conveyor Plat
Cleaning Conveyor Belt
Tidy Up Cleaning Tools
4 Input Data SAM
Pre-input data SAM
Collect sheet report
Input to computer
5 Take Sample for Bubble Test
Take Sample for Bubble Test
Waiting sampling result
Report sampling
6 Take Sample for Carbon Test
Take Sample for Carbon Test
Waiting sampling result
Report sampling
7 Cut Open Rework
8 SHO Update
40

43
4.1.3 Initial Layout Design
Layout design can be created by observing the real layout design of filling
machine area. Based on figure 4.3 there are seven items in filling machine area
that used for set-up activities and one filling machine. The seven items are SAM/
SAP table, cleaning tools for (red) for cleaning environment, cleaning tools (blue)
for cleaning machine, Shift Hand-Over board, metal detector, sampling test table,
tip table, and cut open rework table. The distance shown in figure 4.3 are drawn
by scale of 1:100.
Figure 4.3 Initial Layout Design of Filling Machine
The length of machine is 5.6 meters in total. SAM/ SAP table is ten meters away
from the machine. There are two types of cleaning tools, cleaning tools with red
mark and blue mark which are 7 meters away from the machine. Shift Hand-Over
(SHO) board is located 4 meters from the machine. The metal detector and
sampling test are located 4 meters from left of the machine. Cut open rework
places and tip table are located 5.6 meter from the machine which means in front
section of the machine. The longest items that placed in filling machine area is

44
SAM / SAP table with ten meters distance, while the shortest items places in
filling machine area are Shift hand-Over board, metal detector, and sampling test
table with four meters in distance.
4.1.4 Spaghetti Diagram
Spaghetti diagram shows the movement of the operator during the set up activities
in filling machine area. Figure 4.4 shows the spaghetti diagram that has been used
during the observation of the operator’s movement during set-up activities. The
total number of 25 means the total activities conduct by the operator which same
with that have been stated in table 4.1 Flow Process Chart beforehand.
Figure 4.4 Spaghetti Diagram
Figure 4.4 shows the movement of the operator step by step from the beginning
until the end of set-up activities. The flow of set-up activities process based on the
spaghetti diagram are explained more below.
a. The operator starts the operation from the middle of filling machine area that
mark with purple color.
45
b. Then, the operator will go to the center point of machine to check the metal
and go to metal detector equipment to check the condition of metal detector
c. The operator needs to take the cleaning tools with the red mark and move to
the machine to clean the floor and surrounding environment of the machine
that are dirty and need to be cleaned.
d. Next, the operator needs to clean several internal part of filling machine. The
operator needs to take cleaning tools with blue mark to clean several internal
parts of the machine.
e. The operator is going back and forth to the machine and SAM/SAP table to
finished inputting SAM/ SAP data to the computer.
f. Next activities are sampling test for bubble and carbon. The operator needs to
take the filling machine output or product to be test in the bubble test and
carbon test. After the operator take the output or product, the operator will go
to sample test table that already provide the equipment for bubble and carbon
sample test.
g. The operator needs to do the cut open rework in order to help the rework
department in making the rework of the defect product from filling machine.
h. The last activity is the operator need to fill up the shift hand-over board. The
chart in shift hand-over board will summarize all situation that happen during
the current shift and the information will be delivered to the next shift.
Based on the analysis of spaghetti diagram that already shown in figure 4.4, there
are several repetition movement that done by the operator. In order to reduce the
time of set-up activities, the research may consider reducing distance of the items
also may help to decrease the set-up time.
4.2 Data Analysis
The data that were collected in previous section, will be further analyzed by using
Overall Equipment Effectiveness (OEE), Single Minute Exchange of Dies
(SMED), and 5S method. The analysis are related with the problem in this
research which is set-up time. Then, the analysis will help to reduce the number of
set-up time in filling machine area.

46
4.2.1 Overall Equipment Effectiveness (OEE) Before Implementation
Single Minutes Exchange of Dies (SMED) implementation is done in the
beginning of May 2016, April 2016 will become the data for OEE calculation
before SMED implementation. All the data is originally obtained from PT. MNO
which include planned and unplanned stoppages. Planned stoppages data are
changeover product and line preparation or set-up time, and etc. Unplanned
stoppages data are minor stoppages, breakdown, and etc.
Based on figure 4.5 that visualized by Pareto chart, there are several calculation
that will be used to calculate the availability, performance, and quality. The
calculation includes down time loss, performance loss, loading time, operating
time and net operating time. Besides that, figure 4.6 shows the Pareto Chart of the
availability, performance, quality rate and the Overall Equipment Effectiveness
(OEE) rating in April 2016. The result shown in figure 4.5 and 4.6 are shown in
minute.
Figure 4.5 Overall Equipment Effectiveness Calculation (April 2016)
Downtime loss can be calculated from the changeover, line preparation or set-up
time, and also breakdown time happen in filling machine during April 2016 which
results 4692 minutes in total, the data are shown in the appendices. On the other
hand, performance loss can be calculated from the minor stoppages happen in
filling machine and the total performance loss is 8100 minutes in total. Loading
time calculated based on the total time when machine can run. There are seven
4692 8100
33120
28428 25020
0
5000
10000
15000
20000
25000
30000
35000
Down Time Loss Performance Loss Loading Time Operating TimeNet Operating Time

47
days for planned maintenance, which means seven days of idle production process
and 33120 minutes is total time of machine can run in April 2016. Operating time
can be calculated by the subtracting loading time with down time loss that result
28428 minutes. Net operating time also got from the calculation of the difference
between loading time and performance loss which result 25020 minutes in total.
All the data and the OEE calculation are shown more clearly in the last chapter of
appendices.
Figure 4.6 Overall Equipment Effectiveness (April 2016)
There are four data shown in figure 4.6 which are availability, performance,
quality and OEE rate in April 2016. The calculation of availability rate use the
equation 2.1, and the calculation are shown as follows:
Availability rate can be calculated by dividing operating time by loading time
which result 86%. The calculation of performance rate is based on dividing the net
operating time with the operating time which shown in the equation 2.2 and the
result for performance calculation is 88%. The detail calculation are stated in the
appendices
86% 88% 100%
76%
0%
20%
40%
60%
80%
100%
120%
Availability Performance Quality OEE

48
Quality rate can be calculated by the total product amount that produce in April
2016 except the defect product and divided by the total product amount should be
produce in April 2016, the calculation are based on equation 2.3. There are 130
defect product occur in April 2016 caused by the sealing while the demand is
39000, and the result of quality rate is 100% which calculated by subtracting
processed amount with defect amount, and the result will be divided with
processed amount. OEE rating can be calculated by multiply availability,
performance, and quality rate which result 76%. For the further calculation are
shown more clearly in the last chapter of appendices.
4.2.2 Single Minutes Exchange of Dies (SMED) Implementation
Single Minutes Exchange of Dies (SMED) implementation differentiates into four
steps, those are internal and external setup activities are not differentiated,
separate internal and external activities, convert internal into external activities,
and streamline the remaining internal activities. Streamlining the remaining
internal activities will be done using 5S implementation to reduce the movement
of the operator.
4.2.2.1 Internal and External Setup Activities are not differentiated
The set-up activity in filling machine area based on individual observation are
shown in table 4.4 and table 4.5. Setup activities has already stated more detail
before in flow process chart in table 4.1. Similar with the flow process chart, there
are eight main activities which represent by alphabet of A until H, while the sub-
activities are represent with number one until 25. Table 4.4 and table 4.5 also
shows the time to start each activities with the time when each activity stops, the
total time represent the time needed to conduct each activities.
Table 4.4 Setup Activity of Filling Machine Area
NO Activity
Time
Start
Time
Stop
Total
Time
A Checking Metal Detector
1 Record Counter Metal Detector 0:00:00 0:01:00 0:01:00
2
Verified positive sample metal
detector 0:01:00 0:02:00 0:01:00
2 minutes
B Cleaning Environment

49
3 Take Cleaning Tools 0:02:00 0:04:00 0:02:00
4 Cleaning floor below the machine 0:04:00 0:07:00 0:03:00
5 Tidy Up Cleaning Tools 0:07:00 0:09:00 0:02:00
7 minutes
C Cleaning Machine
6 Take Cleaning Tools 0:09:00 0:11:00 0:02:00
7 Cleaning Horizontal Seal Bar 0:11:00 0:11:30 0:00:30
Table 4.5 Setup Activity of Filling Machine Area (Continued)
NO Activity
Time
Start
Time
Stop
Total
Time
C Cleaning Machine
8 Cleaning Vertical Seal Bar 0:00:00 0:12:00 0:00:30
9 Cleaning Colar 0:12:00 0:12:20 0:00:20
10 Cleaning Knife Jaw 0:12:20 0:12:40 0:00:20
11 Cleaning Cover Acrylic 0:12:40 0:13:00 0:00:20
12 Cleaning Conveyor Plat 0:13:00 0:13:30 0:00:30
13 Cleaning Conveyor Belt 0:13:30 0:14:00 0:00:30
14 Tidy Up Cleaning Tools 0:14:00 0:16:00 0:02:00
7 minutes
D Input Data SAM
15 Pre-input data SAM 0:16:00 0:18:30 0:02:30
16 Collect sheet report 0:18:30 0:19:00 0:00:30
17 Input to computer 0:19:00 0:24:00 0:05:00
8 minutes
E Take Sample for Bubble Test
18 Take Sample for Bubble Test 0:24:00 0:25:00 0:01:00
19 Waiting sampling result 0:25:00 0:25:40 0:00:40
20 Report sampling 0:25:40 0:26:00 0:00:20
2 minutes
F Take Sample for Carbon Test
21 Take Sample for Carbon Test 0:26:00 0:27:00 0:01:00
22 Waiting sampling result 0:27:00 0:27:40 0:00:40
23 Report sampling 0:27:40 0:28:00 0:00:20
2 minutes
G Cut Open Rework
24 Cut Open Rework 0:28:00 0:31:00 0:03:00
3 minutes
H SHO Update
25 SHO Update 0:31:00 0:34:00 0:03:00
3 minutes
TOTAL
34
minutes

50
Total time for setup activity for filling machine area is 34 minutes. Table 4.4 and
table 4.5 shows the whole activity which include and internal activities in the
correct order. Checking metal detector activities require two minutes in total.
Cleaning environment also needs seven minutes to finish the activities, while the
cleaning machine also needs seven minutes to finish the entire cleaning machine.
The activities of input data SAM/ SAP take eight minutes in total. There are two
sample test in set-up activities, which are bubble test and carbon test. Each test
needs two minutes to complete the sample test. Cut open rework can be done in
three minutes, while fill the Shift Hand-Over (SHO) board requires three minutes
to finish the activities.
4.2.2.2 Separated Internal and External Activities
Setup activity that already stated in table 4.4 and table 4.5 only shows the whole
activities in detail and correct order. Then, those activities need to separate into
two activities category, which are internal and external activities. The internal
activities that need to be done when the machine stops and cannot be convert into
external activities will be mark with red color, while the rest can be convert into
external activities. Table 4.6 and 4.7 shows the set-up activities that already
separated.
Table 4.6 Internal and External Activities of Set-up Activities in Filling Machine
Area
NO Activity Time (minute)
Explanation Internal External
A Checking Metal Detector
1 Record Counter Metal Detector 1
metal detector test in metal
detector equipment
2
Verified positive sample metal
detector 1
verified the result of metal
detector
B Cleaning Environment
3
Take Cleaning Tools 2
take red cleaning tools to
clean the environment of
machine
4
Cleaning floor below the
machine 3
cleaning the machine
environment
5 Tidy Up Cleaning Tools 2
re-store red cleaning tools to
the previous place
C Cleaning Machine
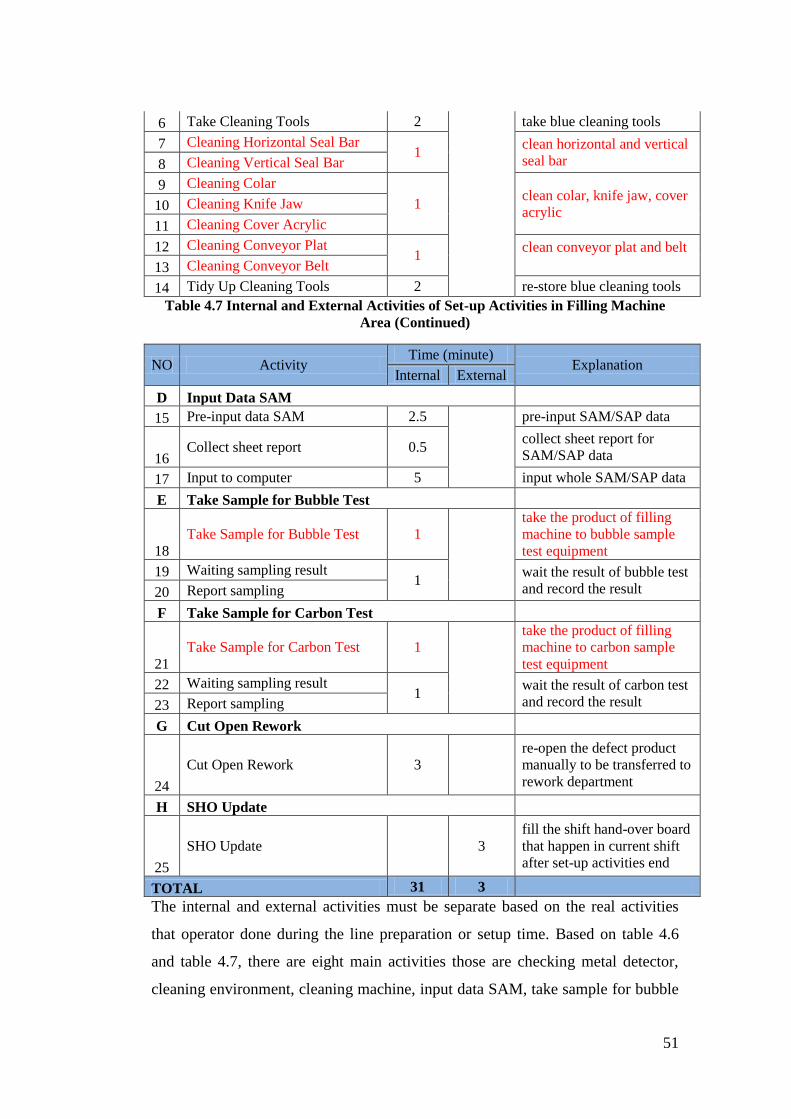
51
6 Take Cleaning Tools 2
take blue cleaning tools
7 Cleaning Horizontal Seal Bar 1
clean horizontal and vertical
seal bar 8 Cleaning Vertical Seal Bar
9 Cleaning Colar
1 clean colar, knife jaw, cover
acrylic 10 Cleaning Knife Jaw
11 Cleaning Cover Acrylic
12 Cleaning Conveyor Plat 1
clean conveyor plat and belt
13 Cleaning Conveyor Belt
14 Tidy Up Cleaning Tools 2 re-store blue cleaning tools
Table 4.7 Internal and External Activities of Set-up Activities in Filling Machine
Area (Continued)
NO Activity Time (minute)
Explanation Internal External
D Input Data SAM
15 Pre-input data SAM 2.5
pre-input SAM/SAP data
16 Collect sheet report 0.5
collect sheet report for
SAM/SAP data
17 Input to computer 5 input whole SAM/SAP data
E Take Sample for Bubble Test
18
Take Sample for Bubble Test 1
take the product of filling
machine to bubble sample
test equipment
19 Waiting sampling result 1
wait the result of bubble test
and record the result 20 Report sampling
F Take Sample for Carbon Test
21
Take Sample for Carbon Test 1
take the product of filling
machine to carbon sample
test equipment
22 Waiting sampling result 1
wait the result of carbon test
and record the result 23 Report sampling
G Cut Open Rework
24
Cut Open Rework 3
re-open the defect product
manually to be transferred to
rework department
H SHO Update
25
SHO Update 3
fill the shift hand-over board
that happen in current shift
after set-up activities end
TOTAL 31 3
The internal and external activities must be separate based on the real activities
that operator done during the line preparation or setup time. Based on table 4.6
and table 4.7, there are eight main activities those are checking metal detector,
cleaning environment, cleaning machine, input data SAM, take sample for bubble
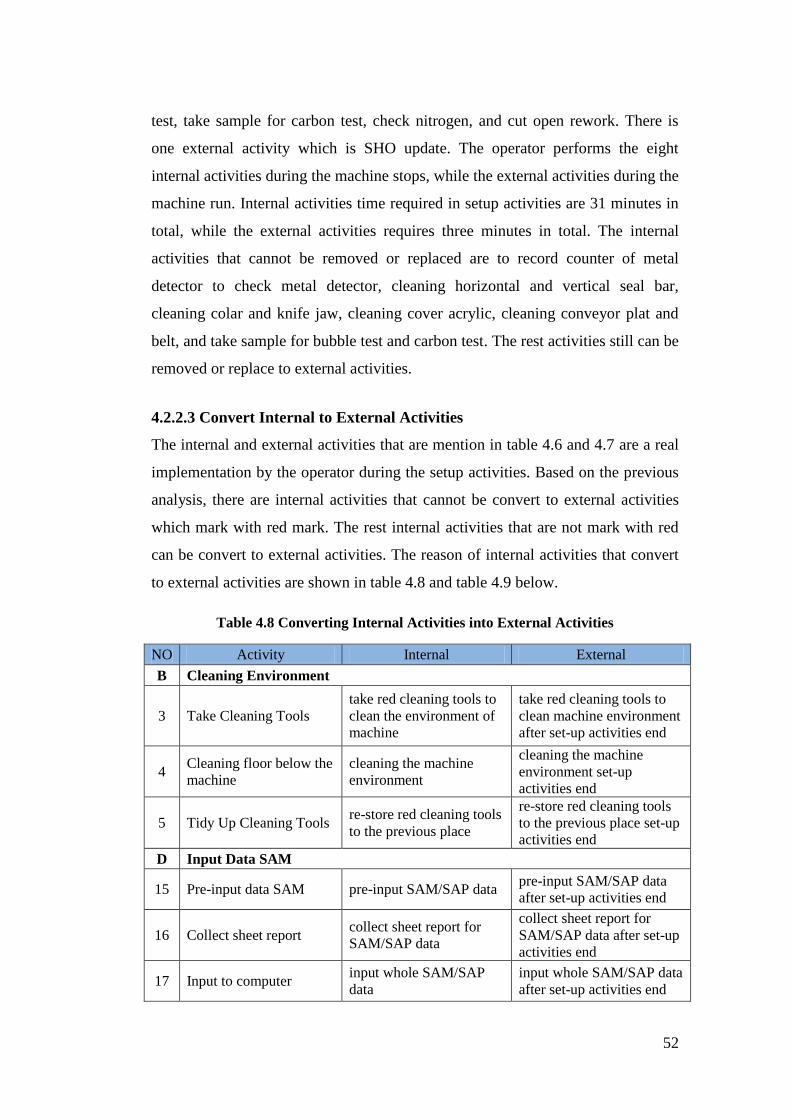
52
test, take sample for carbon test, check nitrogen, and cut open rework. There is
one external activity which is SHO update. The operator performs the eight
internal activities during the machine stops, while the external activities during the
machine run. Internal activities time required in setup activities are 31 minutes in
total, while the external activities requires three minutes in total. The internal
activities that cannot be removed or replaced are to record counter of metal
detector to check metal detector, cleaning horizontal and vertical seal bar,
cleaning colar and knife jaw, cleaning cover acrylic, cleaning conveyor plat and
belt, and take sample for bubble test and carbon test. The rest activities still can be
removed or replace to external activities.
4.2.2.3 Convert Internal to External Activities
The internal and external activities that are mention in table 4.6 and 4.7 are a real
implementation by the operator during the setup activities. Based on the previous
analysis, there are internal activities that cannot be convert to external activities
which mark with red mark. The rest internal activities that are not mark with red
can be convert to external activities. The reason of internal activities that convert
to external activities are shown in table 4.8 and table 4.9 below.
Table 4.8 Converting Internal Activities into External Activities
NO Activity Internal External
B Cleaning Environment
3 Take Cleaning Tools
take red cleaning tools to
clean the environment of
machine
take red cleaning tools to
clean machine environment
after set-up activities end
4 Cleaning floor below the
machine
cleaning the machine
environment
cleaning the machine
environment set-up
activities end
5 Tidy Up Cleaning Tools re-store red cleaning tools
to the previous place
re-store red cleaning tools
to the previous place set-up
activities end
D Input Data SAM
15 Pre-input data SAM pre-input SAM/SAP data pre-input SAM/SAP data
after set-up activities end
16 Collect sheet report collect sheet report for
SAM/SAP data
collect sheet report for
SAM/SAP data after set-up
activities end
17 Input to computer input whole SAM/SAP
data
input whole SAM/SAP data
after set-up activities end
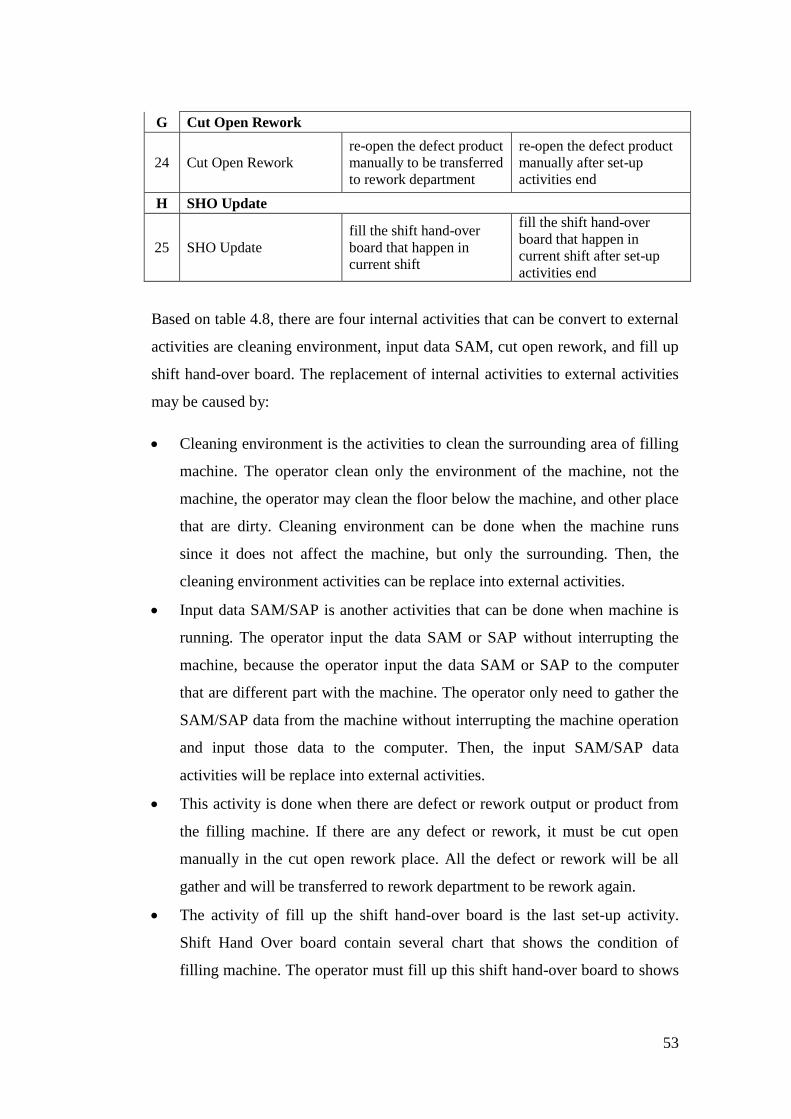
53
G Cut Open Rework
24 Cut Open Rework
re-open the defect product
manually to be transferred
to rework department
re-open the defect product
manually after set-up
activities end
H SHO Update
25 SHO Update
fill the shift hand-over
board that happen in
current shift
fill the shift hand-over
board that happen in
current shift after set-up
activities end
Based on table 4.8, there are four internal activities that can be convert to external
activities are cleaning environment, input data SAM, cut open rework, and fill up
shift hand-over board. The replacement of internal activities to external activities
may be caused by:
Cleaning environment is the activities to clean the surrounding area of filling
machine. The operator clean only the environment of the machine, not the
machine, the operator may clean the floor below the machine, and other place
that are dirty. Cleaning environment can be done when the machine runs
since it does not affect the machine, but only the surrounding. Then, the
cleaning environment activities can be replace into external activities.
Input data SAM/SAP is another activities that can be done when machine is
running. The operator input the data SAM or SAP without interrupting the
machine, because the operator input the data SAM or SAP to the computer
that are different part with the machine. The operator only need to gather the
SAM/SAP data from the machine without interrupting the machine operation
and input those data to the computer. Then, the input SAM/SAP data
activities will be replace into external activities.
This activity is done when there are defect or rework output or product from
the filling machine. If there are any defect or rework, it must be cut open
manually in the cut open rework place. All the defect or rework will be all
gather and will be transferred to rework department to be rework again.
The activity of fill up the shift hand-over board is the last set-up activity.
Shift Hand Over board contain several chart that shows the condition of
filling machine. The operator must fill up this shift hand-over board to shows
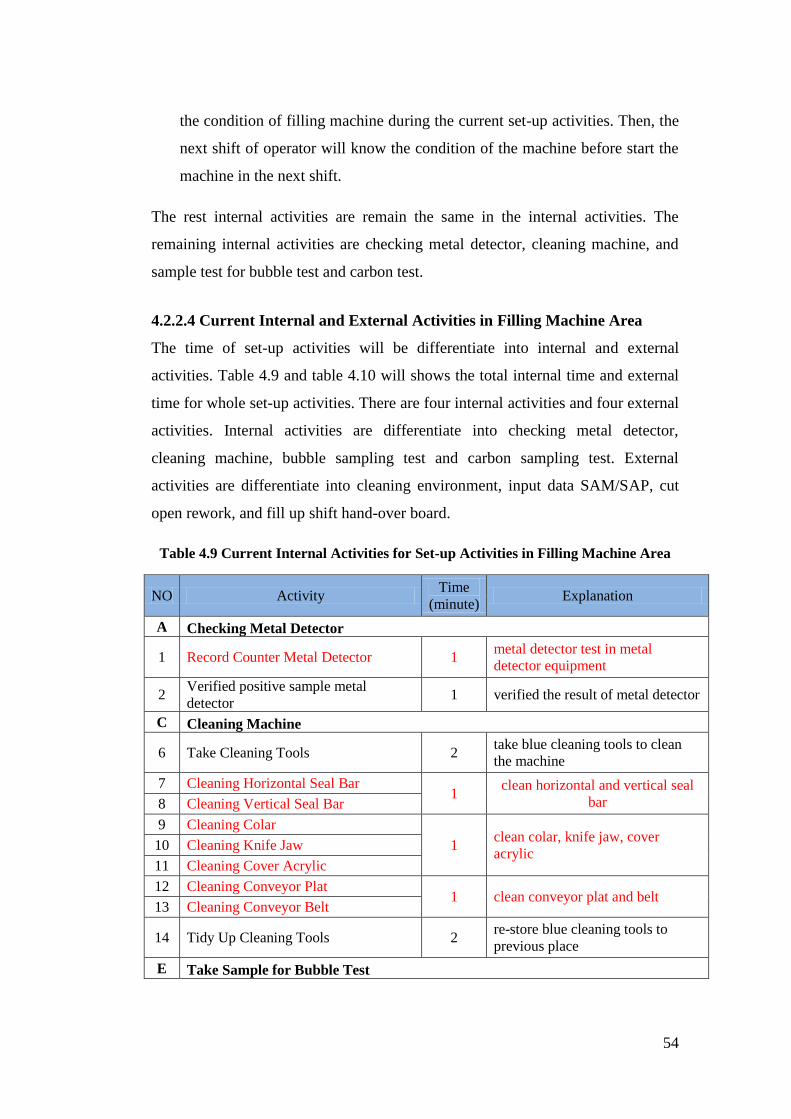
54
the condition of filling machine during the current set-up activities. Then, the
next shift of operator will know the condition of the machine before start the
machine in the next shift.
The rest internal activities are remain the same in the internal activities. The
remaining internal activities are checking metal detector, cleaning machine, and
sample test for bubble test and carbon test.
4.2.2.4 Current Internal and External Activities in Filling Machine Area
The time of set-up activities will be differentiate into internal and external
activities. Table 4.9 and table 4.10 will shows the total internal time and external
time for whole set-up activities. There are four internal activities and four external
activities. Internal activities are differentiate into checking metal detector,
cleaning machine, bubble sampling test and carbon sampling test. External
activities are differentiate into cleaning environment, input data SAM/SAP, cut
open rework, and fill up shift hand-over board.
Table 4.9 Current Internal Activities for Set-up Activities in Filling Machine Area
NO Activity Time
(minute) Explanation
A Checking Metal Detector
1 Record Counter Metal Detector 1 metal detector test in metal
detector equipment
2 Verified positive sample metal
detector 1 verified the result of metal detector
C Cleaning Machine
6 Take Cleaning Tools 2 take blue cleaning tools to clean
the machine
7 Cleaning Horizontal Seal Bar 1
clean horizontal and vertical seal
bar 8 Cleaning Vertical Seal Bar
9 Cleaning Colar
1 clean colar, knife jaw, cover
acrylic 10 Cleaning Knife Jaw
11 Cleaning Cover Acrylic
12 Cleaning Conveyor Plat 1 clean conveyor plat and belt
13 Cleaning Conveyor Belt
14 Tidy Up Cleaning Tools 2 re-store blue cleaning tools to
previous place
E Take Sample for Bubble Test

55
18 Take Sample for Bubble Test 1 take the product of filling machine
to bubble sample test equipment
19 Waiting sampling result 1
wait the result of bubble test and
record the result 20 Report sampling
F Take Sample for Carbon Test
21 Take Sample for Carbon Test 1 take the product of filling machine
to carbon sample test equipment
22 Waiting sampling result 1
wait the result of carbon test and
record the result 23 Report sampling
TOTAL 13
Based on table 4.9, the total internal time in set-up activities are 13 minutes.
Checking metal detector require two minutes to complete the activities, while
cleaning machine require seven minutes, bubble and carbon sampling test require
two minutes for each sampling test to complete the action. Based on table 4.9,
there are several internal activities that are not mark with red color which means
actually it can be convert to external activities, but it’s not convert to external
activities. Those activities are not convert to external activities because it is
related to the internal activities.
Verified positive sample metal detector in checking metal detector activities
are not convert to external activities because the machine must be verified
first to know whether the metal detector function normally in the filling
machine. If the verification activities are happen in external activities when
the machine runs, the operator already start the machine without knowing the
result of metal detector condition.
Take cleaning tools for cleaning the machine also not convert to external
activities, but it cannot be convert to external activities. The reason is because
the operator cannot conduct the cleaning machine activities if the operator do
not take the cleaning tools beforehand. Imagine that the activities of take the
cleaning tools for cleaning machine are happen in external activities. Then,
the cleaning machine are happen in external activities when the machine
stops. It is also happen to tidy up the cleaning tools for cleaning machine.
Tidy up the cleaning tools are related with cleaning machine, which means

56
every activities that related to cleaning machine cannot be separated to the
external activities.
Waiting sample test for bubble and carbon test are the same activities but
only different in the type of sample test. As has been mention before, bubble
test are used to test the condition of filling output or product. The output or
product must not leaking. If the output or product is leaking, the set-up
activities cannot be started. The waiting activities cannot be done in external
activities when the machine runs because the result of sample test are needed
to be verified first before the machine runs.
Similar with bubble test, carbon test is done to test the condition of filling
output or product sealing. Then, if the sealing is not proper the operator
cannot start the machine. The result of bubble and carbon sample test are used
to know the condition of the filling output or product. All the activities are
done to reduce the number of defects or rework for the filling output or
product.
Previous table are explaining the internal activities, while table 4.10 will explain
the external activities. Based on previous discussion already stated the reason of
converting internal activities to external activities. Table 4.10 will shows the time
needed to conduct each external activities.
Table 4.10 Current External Activities for Set-up Activities in Filling Machine Area
NO Activity Time
(minute) Explanation
B Cleaning Environment
3 Take Cleaning Tools 2 take red cleaning tools to clean the
environment of machine
4 Cleaning floor below the machine 3 cleaning the machine environment
5 Tidy Up Cleaning Tools 2 re-store red cleaning tools to the
previous place
D Input Data SAM
15 Pre-input data SAM 2.5 pre-input SAM/SAP data
16 Collect sheet report 0.5 collect sheet report for SAM/SAP
data
17 Input to computer 5 input whole SAM/SAP data
G Cut Open Rework

57
24 Cut Open Rework 3
re-open the defect product
manually to be transferred to
rework department
H SHO Update
25 SHO Update 3
fill the shift hand-over board that
happen in current shift after set-up
activities end
TOTAL 21
Based on table 4.10 cleaning environment require seven minutes, input data
SAM/SAP require eight minutes, cut open rework and SHO update require three
minutes for each to complete each activities. Then, the total time needed to
conduct the external activities in set-up activities of filling machine are 21
minutes.
4.2.2.5 Streamline the Remaining Internal Activities
After the previous step of SMED method, the result of analysis is the internal
activities time become 14 minutes. The internal activities need to be streamline
again to achieve the goal of single minutes which means ten minutes or less than
ten minutes. The streamline method for the rest of internal activities is by using
5S method.
4.2.3 5S Implementation for Set-up Activities in Filling Machine
After conducting the analysis using Single Minute Exchange of Dies (SMED)
method, 5S method will be implemented to reduce more the internal activities
time. Then, the set-up time also will be reduce when the internal activities time is
reduced. There are five steps of 5S that will be done in this chapter, which are
SEIRI (Sorting), SEITON (Setting), SEISO (Shining), SEIKETSU
(Standardizing), and SHITSUKE (Sustaining).
4.2.3.1 SEIRI (Sorting)
Based on the layout stated in previous discussion, the filling machine area consist
of several items, those are SAM/ SAP table, red and blue cleaning tools, Shift
Hand-Over Board, Metal Detector, Sampling test, Tip Table, and Cut Open
Rework. SAM/ SAP table is used to input the data into SAM/SAP. On the
SAM/SAP table, there are a computer that will be used to input the SAM/SAP

58
data. Blue and red cleaning tools are two different cleaning tools with two
different uses. The blue cleaning tools will be used for cleaning the internal parts
of the machine, while red cleaning tools will be used for cleaning the environment
of the machine. The blue cleaning tools consist of small size of brush with
different shape to cleaning the internal parts. The red cleaning tools consist of the
bigger size of brush or also can be called as a broom. The cleaning tools are hang
on the iron stools.
Shift Hand-Over (SHO) board are contain several chart that must be filled by the
operator. The chart will represent everything that happen during the current shift.
Then, the operator on the next shift will know the situation that have been happen
before. Metal detector is the tools to use to check the metal in the machine.
Sampling test is located on the table, which contain a sampling device for testing
the sample of bubble and nitrogen. Tip table contains the telephone, several paper
and stationary, and etc. Cut open rework is the place to open the rework product
that produce on the previous shift. The product are already inside the sachet, the
operator need to open the rework product manually and stored to rework
department. Then, sorting the item in filling machine layout can be shown in
figure 4.7.
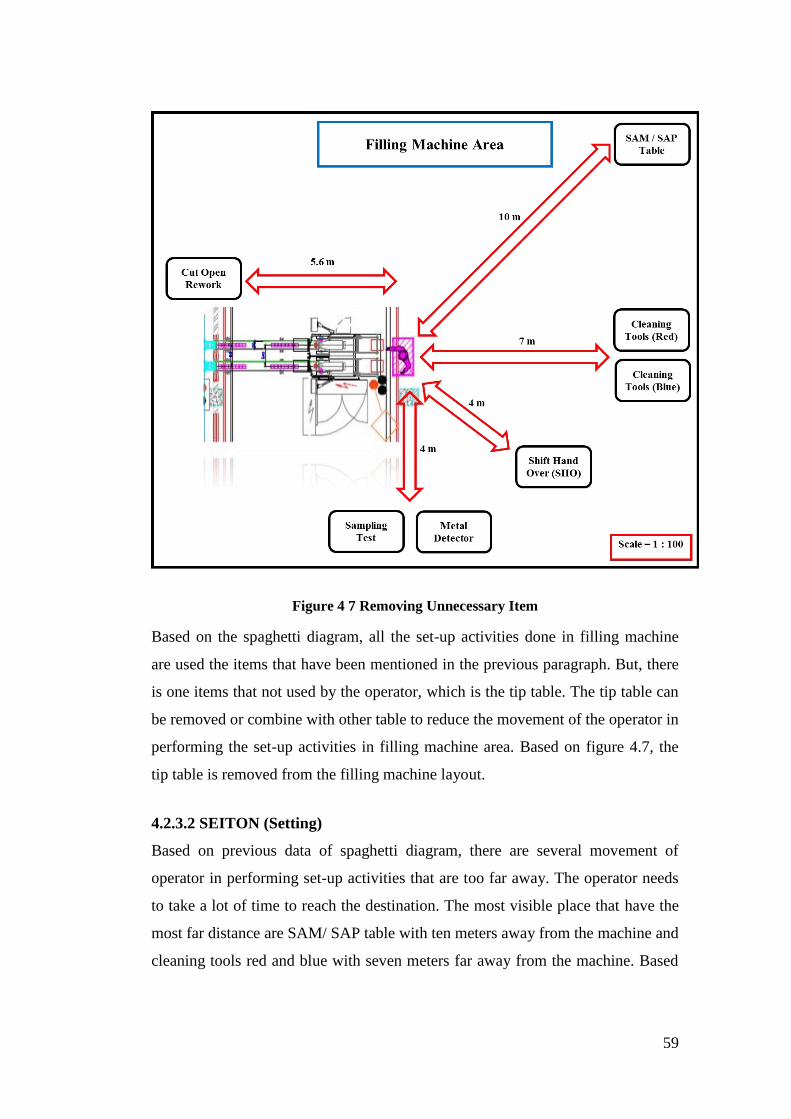
59
Figure 4 7 Removing Unnecessary Item
Based on the spaghetti diagram, all the set-up activities done in filling machine
are used the items that have been mentioned in the previous paragraph. But, there
is one items that not used by the operator, which is the tip table. The tip table can
be removed or combine with other table to reduce the movement of the operator in
performing the set-up activities in filling machine area. Based on figure 4.7, the
tip table is removed from the filling machine layout.
4.2.3.2 SEITON (Setting)
Based on previous data of spaghetti diagram, there are several movement of
operator in performing set-up activities that are too far away. The operator needs
to take a lot of time to reach the destination. The most visible place that have the
most far distance are SAM/ SAP table with ten meters away from the machine and
cleaning tools red and blue with seven meters far away from the machine. Based

60
on figure 4.8, two items have been replaced to another place that are close by the
machine.
Figure 4.8 New Design Layout
Figure 4.8 shown that SAM/ SAP table replaced or combined with the tip table
that located 5.6 meters from the machine and on the left side of the filling
machine. The computer for input the data SAM/SAP will be replace into tip table.
The red and blue cleaning tools also replace to near cut open rework place which
located also 5.6 meters from the machine, but on the right side of the machine.
The rest items are not replaced and stay in the original place.
4.2.3.3 SEISO (Shining)
The layout of filling machine area has been improved with several change. Then,
the filling machine are need to be clean, which means the items that are located in
filling machine must be clean. The items including the SAM/SAP table, red and
cleaning tolls, Shift Hand-Over (SHO) board, metal detector, sampling test, tip
table, and cut open rework. The cleaning is done during the planned maintenance

61
time when the machine is not run. All of the operator will help the cleaning
activities in filling machine area. The cleaning time is done in beginning of May
2016.
4.3 Single Minute Exchange of Dies (SMED) and 5S Method
Implementation
The method that used in this research are Single Minutes Exchange of Dies
(SMED) and 5S method. The time for set-up activities are different before and
after SMED and 5S method implementation. Before SMED method
implementation is the data from April 2016, while result of SMED analysis are
implemented on May 2016, the result of 5S analysis are implemented on June
2016. The data of set-up time are from April until June 2016.
4.3.1 New Improvement Result of Set-up Activities
After Single Minute Exchange of Dies (SMED) and 5S implementation, the
internal and external time are decreased. Table 4.11 and 4.12 shows the
differences before and after SMED and 5S implementation for whole set-up
activities. The table will differentiate between before and after for internal
activities, and before and after for external activities. The method stated in table
4.11 and table 4.12 are method that make the change between set-up activities
before and after.
Table 4.11 New Improvement Result of Set-up Activities
NO Activity
Time (minute) Tools /
Method Internal External
Before After Before After
A Checking Metal Detector
1 Record Counter Metal Detector 1 1
SMED
2
Verified positive sample metal
detector 1 1
B Cleaning Environment
3 Take Cleaning Tools
2 0.5 SMED
& 5S 4 Cleaning floor below the machine 3 3
5 Tidy Up Cleaning Tools 2 0.5

62
Table 4.12 New Improvement Result of Set-up Activities (Continued)
NO Activity
Time (minute) Tools /
Method Internal External
Before After Before After
C Cleaning Machine
6 Take Cleaning Tools 2 0.5
SMED
& 5S
7 Cleaning Horizontal Seal Bar 1 1
8 Cleaning Vertical Seal Bar
9 Cleaning Colar
1 1 10 Cleaning Knife Jaw
11 Cleaning Cover Acrylic
12 Cleaning Conveyor Plat 1 1
13 Cleaning Conveyor Belt
14 Tidy Up Cleaning Tools 2 0.5
D Input Data SAM
15 Pre-input data SAM
2.5 1.5 SMED
& 5S 16 Collect sheet report 0.5 0.5
17 Input to computer 5 5
E Take Sample for Bubble Test
18 Take Sample for Bubble Test 1 1
SMED 19 Waiting sampling result 1 1
20 Report sampling
F Take Sample for Carbon Test
21 Take Sample for Carbon Test 1 1
SMED 22 Waiting sampling result 1 1
23 Report sampling
G Cut Open Rework
7 Cut Open Rework 3 3 SMED
H SHO Update
8 SHO Update 3 3 SMED
TOTAL 13 10 21 17
Based on table 4.11 and table 4.12 there are several time of activities that reduced.
The reduction happen because of the 5S method implementation that discussed
before. The 5S implementation change the layout of filling machine area. The
replacement of SAM/SAP table to the tip table which is from ten meters to only
5.6 meters away from the machine. The red and blue cleaning tools are also
replace from seven meter away to 5.6 meter away which located near the cut open
rework places. Then, the result of several replacement cause the reduction time for

63
the related activities. The activity of taking and tidy up the cleaning tools are
reduce from 2 minutes into 0.5 minutes, while the activity of pre-input data
SAM/SAP are reduce from 2.5 into 1.5 because the distance for input the
SAM/SAP data are reduce from ten meters into 5.6 meters. The computer to input
SAM/SAP data are replace to the tip table location.
The time for internal activities before and after SMED and 5S method
implementation are reduced three minutes from 13 minutes into 10 minutes. The
time for external activities are reduced five minutes, from 21 minutes into 17
minutes. Based on table 4.14 and table 4.15, current internal and external time for
set-up activities are ten minutes and 17 minutes. But, the total set-up time can be
taken from internal activities, which means the total set-up time for current set-up
activities is only ten minutes.
4.3.2 Before Single Minute Exchange of Dies (SMED) Method
Implementation
Single Minute Exchange of Dies (SMED) result has been implemented start in
May 2016. Before May 2016, the set-up time is still the same with the original
set-up activities. As has been mention before, the total time needed for set-up
activities is 40 minutes. The data set-up time in filling machine during April 2016
are shown in table 4.13 and 4.14. The data is originally taken from PT. MNO and
also individual observation to set-up activities in filling machine are started in 1
April 2016 until 31 April 2016 There are seven days of maintenance that has been
planned by the company for one month in April 2016.
Table 4.13 Set-up time before Single Minute Exchange of Dies (SMED)
Implementation
April Time
(minute)
Friday 1-Apr-16 35
Saturday 2-Apr-16 -
Sunday 3-Apr-16 -
Monday 4-Apr-16 30
Tuesday 5-Apr-16 25
Wednesday 6-Apr-16 40

64
Thursday 7-Apr-16 34
Friday 8-Apr-16 39
Saturday 9-Apr-16 -
Table 4.14 Set-up time before Single Minute Exchange of Dies (SMED)
Implementation (Continued)
April Time
(minute)
Sunday 10-Apr-16 -
Monday 11-Apr-16 40
Tuesday 12-Apr-16 34
Wednesday 13-Apr-16 27
Thursday 14-Apr-16 32
Friday 15-Apr-16 35
Saturday 16-Apr-16 34
Sunday 17-Apr-16 -
Monday 18-Apr-16 38
Tuesday 19-Apr-16 38
Wednesday 20-Apr-16 30
Thursday 21-Apr-16 40
Friday 22-Apr-16 30
Saturday 23-Apr-16 -
Sunday 24-Apr-16 -
Monday 25-Apr-16 37
Tuesday 26-Apr-16 30
Wednesday 27-Apr-16 33
Thursday 28-Apr-16 36
Friday 29-Apr-16 40
Saturday 30-Apr-16 35
TOTAL 792
Average 34
Based on table 4.13 and table 4.14, there are seven days that shows the set-up time
is equal to zero, which means that the machine is not running on entire day in
seven days for planned maintenance. The planned maintenance happen in 2 - 3
April 2016, 9 - 10 April 2016, 17 April 2016, and 23 - 24 April 2016. The total
time needed for set-up time in filling machine is 792 minutes, while the average
set-up time for the entire month of April 2016 is 34 minutes.

65
4.3.3 After Single Minute Exchange of Dies (SMED) Method
Implementation
Single Minute Exchange of Dies (SMED) result has been implemented in May
2016 after the analysis that has been done in this research. The data of set-up time
after SMED implementation is shown in table 4.15 below. The data is original and
taken from PT. MNO and individual observation to set-up activities in filling
machine area. Planned maintenance that scheduled by the company is 11 days in
total of May 2016. Then, there are 20 days for calculate the average set-up time in
May 2016 from filling machine.
Table 4.15 Set-up time after Single Minute Exchange of Dies (SMED)
Implementation
May Time
(minute)
Sunday 1-May-16 -
Monday 2-May-16 -
Tuesday 3-May-16 -
Wednesday 4-May-16 -
Thursday 5-May-16 -
Friday 6-May-16 -
Saturday 7-May-16 -
Sunday 8-May-16 -
Monday 9-May-16 15
Tuesday 10-May-16 12
Wednesday 11-May-16 13
Thursday 12-May-16 15
Friday 13-May-16 13
Saturday 14-May-16 15
Sunday 15-May-16 -
Monday 16-May-16 13
Tuesday 17-May-16 15
Wednesday 18-May-16 16
Thursday 19-May-16 10
Friday 20-May-16 10
Saturday 21-May-16 15
Sunday 22-May-16 -
Monday 23-May-16 10
Tuesday 24-May-16 10
Wednesday 25-May-16 15
Thursday 26-May-16 8
Friday 27-May-16 15
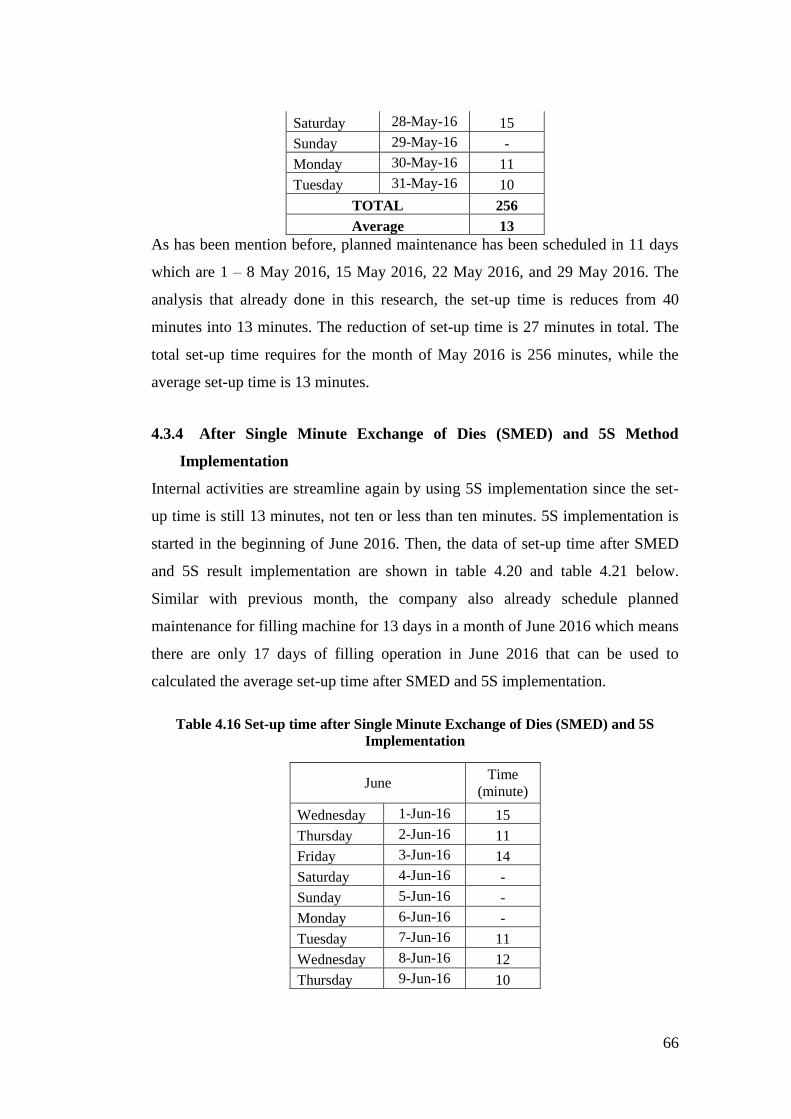
66
Saturday 28-May-16 15
Sunday 29-May-16 -
Monday 30-May-16 11
Tuesday 31-May-16 10
TOTAL 256
Average 13
As has been mention before, planned maintenance has been scheduled in 11 days
which are 1 – 8 May 2016, 15 May 2016, 22 May 2016, and 29 May 2016. The
analysis that already done in this research, the set-up time is reduces from 40
minutes into 13 minutes. The reduction of set-up time is 27 minutes in total. The
total set-up time requires for the month of May 2016 is 256 minutes, while the
average set-up time is 13 minutes.
4.3.4 After Single Minute Exchange of Dies (SMED) and 5S Method
Implementation
Internal activities are streamline again by using 5S implementation since the set-
up time is still 13 minutes, not ten or less than ten minutes. 5S implementation is
started in the beginning of June 2016. Then, the data of set-up time after SMED
and 5S result implementation are shown in table 4.20 and table 4.21 below.
Similar with previous month, the company also already schedule planned
maintenance for filling machine for 13 days in a month of June 2016 which means
there are only 17 days of filling operation in June 2016 that can be used to
calculated the average set-up time after SMED and 5S implementation.
Table 4.16 Set-up time after Single Minute Exchange of Dies (SMED) and 5S
Implementation
June Time
(minute)
Wednesday 1-Jun-16 15
Thursday 2-Jun-16 11
Friday 3-Jun-16 14
Saturday 4-Jun-16 -
Sunday 5-Jun-16 -
Monday 6-Jun-16 -
Tuesday 7-Jun-16 11
Wednesday 8-Jun-16 12
Thursday 9-Jun-16 10
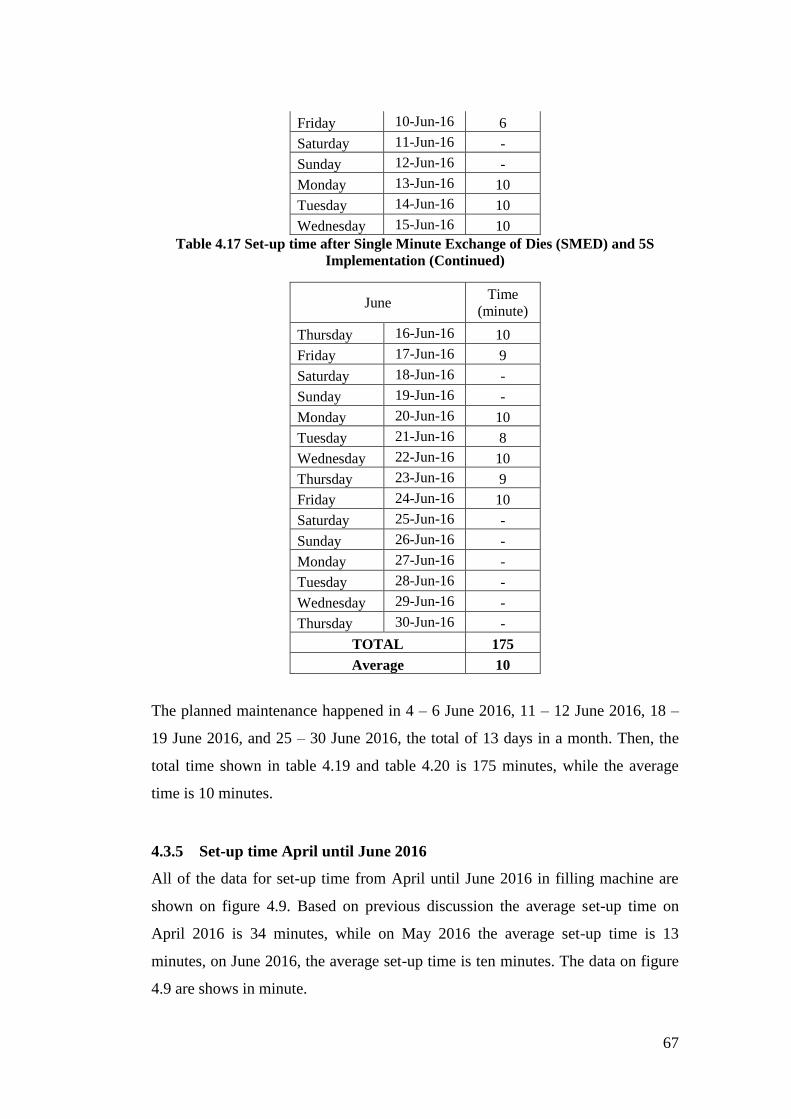
67
Friday 10-Jun-16 6
Saturday 11-Jun-16 -
Sunday 12-Jun-16 -
Monday 13-Jun-16 10
Tuesday 14-Jun-16 10
Wednesday 15-Jun-16 10
Table 4.17 Set-up time after Single Minute Exchange of Dies (SMED) and 5S
Implementation (Continued)
June Time
(minute)
Thursday 16-Jun-16 10
Friday 17-Jun-16 9
Saturday 18-Jun-16 -
Sunday 19-Jun-16 -
Monday 20-Jun-16 10
Tuesday 21-Jun-16 8
Wednesday 22-Jun-16 10
Thursday 23-Jun-16 9
Friday 24-Jun-16 10
Saturday 25-Jun-16 -
Sunday 26-Jun-16 -
Monday 27-Jun-16 -
Tuesday 28-Jun-16 -
Wednesday 29-Jun-16 -
Thursday 30-Jun-16 -
TOTAL 175
Average 10
The planned maintenance happened in 4 – 6 June 2016, 11 – 12 June 2016, 18 –
19 June 2016, and 25 – 30 June 2016, the total of 13 days in a month. Then, the
total time shown in table 4.19 and table 4.20 is 175 minutes, while the average
time is 10 minutes.
4.3.5 Set-up time April until June 2016
All of the data for set-up time from April until June 2016 in filling machine are
shown on figure 4.9. Based on previous discussion the average set-up time on
April 2016 is 34 minutes, while on May 2016 the average set-up time is 13
minutes, on June 2016, the average set-up time is ten minutes. The data on figure
4.9 are shows in minute.

68
Figure 4 9 Set-up time April – June 2016
There are three different part that seen in figure 4.9. The first part is before SMED method implementation. The time of set-up activities are
quite high which all above 35 minutes and below 45 minutes. But, the average of the set-up time on April 2016 is 34 minutes. Then, after
SMED implementation, the set-up time shown in figure 4.8 are decreasing drastically into below 16 minutes and higher than eight minutes.
The average time on May 2016 in filling machine is 13 minutes. Last part is on June 2016 where 5S result analysis are implemented, the
set-up time decreasing a little bit with the range of set-up time from six minutes until 15 minutes, and the average of set-up time in June
2016 is ten minutes. 65

69
4.4 Summary of the Implementation Overall Equipment Effectiveness
(OEE) after Single Minute Exchange of Dies (SMED) and 5S
Implementation
Overall Equipment Effectiveness (OEE) used to shows the difference of the
effectiveness of machine before and after new improvement by using SMED and
5S implementation. OEE rate include the line preparation or set-up time into the
calculation. This means that, the effectiveness of the machine are related with set-
up time. In this research, the beginning set-up time is 34 minutes. But, after
SMED implementation, the set-up time decrease to 13 minutes. Then, 5S method
also implemented in this research. The set-up is decrease more become only ten
minutes in total. The decreasing of set-up time will create a difference between
OEE before and after SMED and 5S implementation.
4.4.1 Overall Equipment Effectiveness (OEE) after Single Minutes
Exchange of Dies (SMED) and 5S implementation
5S method implementation is done after SMED method implementation in May
2016. Then, 5S method starts to be implemented in June 2016. The data are taken
originally from PT. MNO in June 2016, which include the same unplanned and
planned stoppages happen in filling machine in previous month.
Figure 4.10 shows the result of calculation for down time loss, performance loss,
loading time, operating time and net operating time, while figure 4.11 shows the
calculation for Overall Equipment Effectiveness (OEE) rate which include
availability, performance, quality, and also OEE rate. All the result shown in
figure 4.10 and 4.11 are calculated in minute.
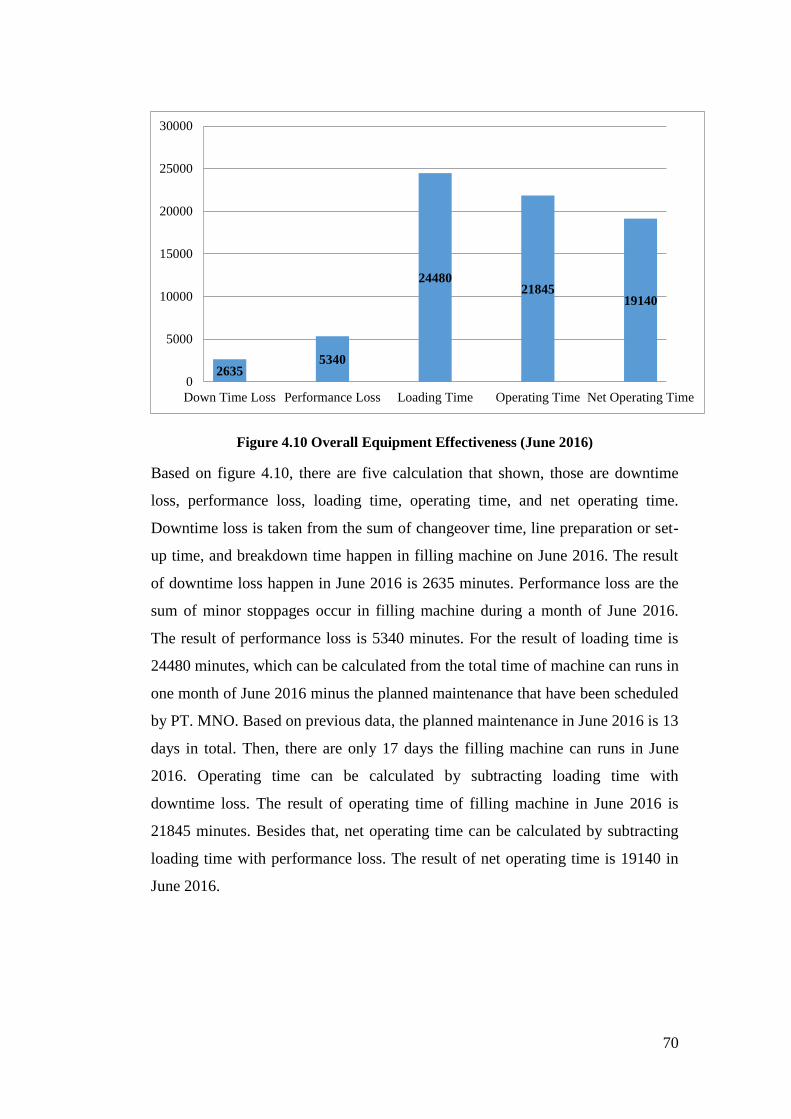
70
Figure 4.10 Overall Equipment Effectiveness (June 2016)
Based on figure 4.10, there are five calculation that shown, those are downtime
loss, performance loss, loading time, operating time, and net operating time.
Downtime loss is taken from the sum of changeover time, line preparation or set-
up time, and breakdown time happen in filling machine on June 2016. The result
of downtime loss happen in June 2016 is 2635 minutes. Performance loss are the
sum of minor stoppages occur in filling machine during a month of June 2016.
The result of performance loss is 5340 minutes. For the result of loading time is
24480 minutes, which can be calculated from the total time of machine can runs in
one month of June 2016 minus the planned maintenance that have been scheduled
by PT. MNO. Based on previous data, the planned maintenance in June 2016 is 13
days in total. Then, there are only 17 days the filling machine can runs in June
2016. Operating time can be calculated by subtracting loading time with
downtime loss. The result of operating time of filling machine in June 2016 is
21845 minutes. Besides that, net operating time can be calculated by subtracting
loading time with performance loss. The result of net operating time is 19140 in
June 2016.
2635 5340
24480 21845
19140
0
5000
10000
15000
20000
25000
30000
Down Time Loss Performance Loss Loading Time Operating Time Net Operating Time

71
Figure 4.11 Overall Equipment Effectiveness (June 2016)
There are four result of calculation that shown in figure 4.11, those are
availability, performance, quality and OEE rate. The calculation is the same with
previous discussion of OEE calculation shown in equation 2.1, but the difference
is in the result.
The result of availability rate is 89% in June 2016. The calculation can be done by
dividing operating time with loading time. The calculation for performance rate
also shown in equation 2.2, which is done by dividing net operating time with
operating time and the result of performance rate is 88%. Then, there are 100
defect products occur in June 2016 while the demand still the same which is
39000 products, and the result of quality rate of filling machine in June 2016 is
100% which calculated by subtracting processed amount with defect amount, and
the result will be divided with processed amount and shown clearly in equation
2.3. The last calculation is OEE rate which done by multiply availability,
performance, and quality, and the result is 78%. All the calculation are stated
clearly in the last chapter of appendices.
89% 88% 100%
78%
0%
20%
40%
60%
80%
100%
120%
Availability Performance Quality OEE

72
4.4.2 Overall Equipment Effectiveness (OEE) from April until June 2016
As we all know, every month since April 2016 until June 2016, the number of
unplanned stoppages and the planned stoppages are different. Then, the result for
OEE rate for each month also must be different. All the result of Overall
Equipment Effectiveness (OEE) from April until June 2016 are summarized into
one Pareto Chart that shown in figure 4.12. The data is taken from the manual
calculation about Overall Equipment Effectiveness (OEE) before and after SMED
and 5S implementation.
Figure 4.12 Overall Equipment Effectiveness (April and June 2016)
The first rate is availability rate which calculate the operating time divided with
loading time. The calculation of availability rate is include the line preparation or
set-up time. The set-up time before SMED method implementation is 34 minutes,
while after SMED implementation the set-up time becomes 13 minutes. Then,
after 5S implementation, the set-up time is decrease more become 10 minutes.
The availability rate is calculated based on the operating time divided with
loading time. The operating time is decreasing every month since April and June
2016, because the set-up time is also decreasing. The availability rates from April
and June 2016 are 86% and 89%. The performance rate shows different result in
filling machine. The performance rate calculations are using the minor stoppages
data from in April and June 2016. The minor stoppages happen in filling machine
are caused by the machine itself. When the minor stoppages are high, the
0%
20%
40%
60%
80%
100%
Availability Performance Quality OEE
86% 88%
100%
76% 89% 88%
100%
78%
Overall Equipment Effectiveness
(April and June 2016)
Apr-16
Jun-16

73
performance rate will be small, because the calculation of performance rate is
based on the performance loss. The performance rate from May and June 2016 are
88% and 88%. The quality rate for the entire month from May and June 2016 is
100%. Then, the OEE rate are 76% and 78% from May until June 2016.
4.5 SEIKETSU (Standardizing)
After all the set-up activities already improve by SMED and 5S implementation.
The company need to create new standards or update the old standard of set-up
activities in filling machine. All the operator need to follow the standard to
perform the set-up activities in filling machine. The new working instruction (WI)
are shown on table 4.18 and table 4.19 below.
Table 4.18 New Working Instruction (WI)
NO Activity Time (minute)
Activities done when the machine stops
1 Checking Metal Detector
Record Counter Metal Detector 1
Verified positive sample metal
detector 1
2
2 Cleaning Machine
Take Cleaning Tools 0.5
Cleaning Horizontal Seal Bar 1
Cleaning Vertical Seal Bar
Cleaning Colar
1
Cleaning Knife Jaw
Cleaning Cover Acrylic
Cleaning Conveyor Plat 1
Cleaning Conveyor Belt
Tidy Up Cleaning Tools 0.5
4
3 Take Sample for Bubble Test
Take Sample for Bubble Test 1
Waiting sampling result 1
Report sampling
2
4 Take Sample for Carbon Test
Take Sample for Carbon Test 1
Waiting sampling result 1
Report sampling
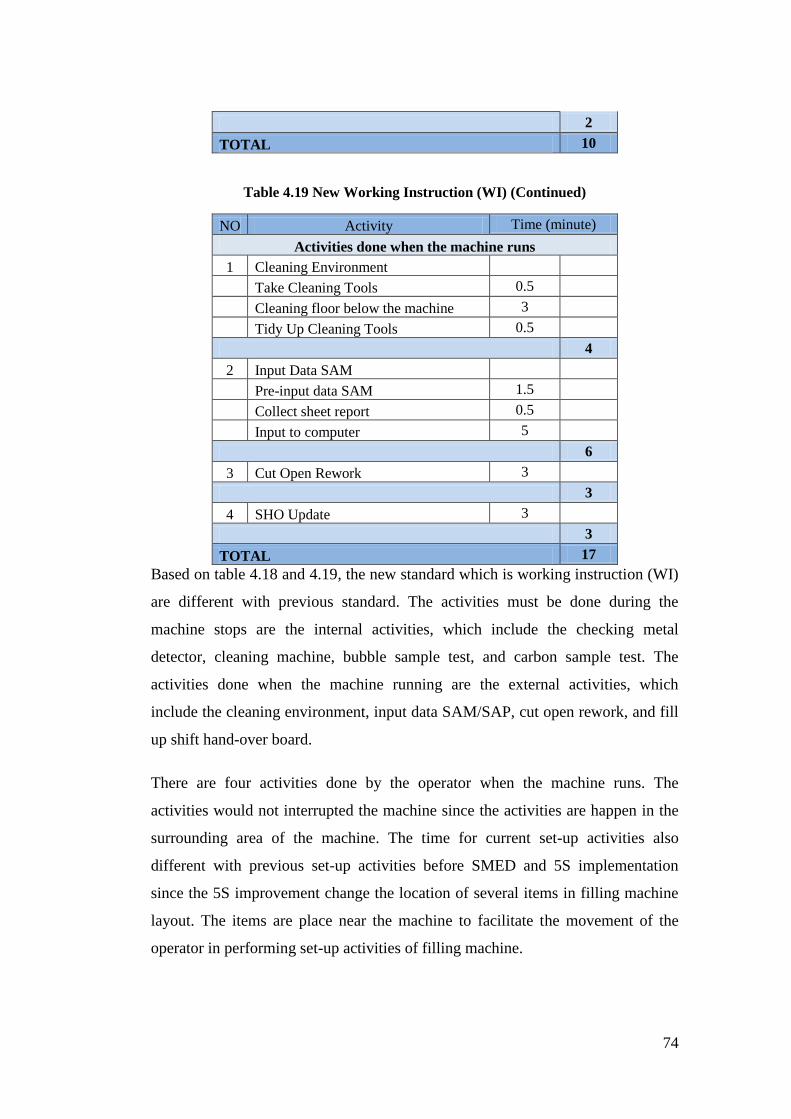
74
2
TOTAL 10
Table 4.19 New Working Instruction (WI) (Continued)
NO Activity Time (minute)
Activities done when the machine runs
1 Cleaning Environment
Take Cleaning Tools 0.5
Cleaning floor below the machine 3
Tidy Up Cleaning Tools 0.5
4
2 Input Data SAM
Pre-input data SAM 1.5
Collect sheet report 0.5
Input to computer 5
6
3 Cut Open Rework 3
3
4 SHO Update 3
3
TOTAL 17
Based on table 4.18 and 4.19, the new standard which is working instruction (WI)
are different with previous standard. The activities must be done during the
machine stops are the internal activities, which include the checking metal
detector, cleaning machine, bubble sample test, and carbon sample test. The
activities done when the machine running are the external activities, which
include the cleaning environment, input data SAM/SAP, cut open rework, and fill
up shift hand-over board.
There are four activities done by the operator when the machine runs. The
activities would not interrupted the machine since the activities are happen in the
surrounding area of the machine. The time for current set-up activities also
different with previous set-up activities before SMED and 5S implementation
since the 5S improvement change the location of several items in filling machine
layout. The items are place near the machine to facilitate the movement of the
operator in performing set-up activities of filling machine.

75
4.6 SHITSUKE (Sustaining)
After making the standard, the company need to make sure that all the operator
still following the standard. The operator might be used to the old standard and
does not used to the new standard of set-up activities. The company need to make
a training of new set-up activities for the operator. Then, the operator need to try
to implement the new standard during the real set-up activities. The trainer must
guide the operator when performing the new set-up activities at the first time.
4.7 Summary of the Result
In this research, there are several improvement happen which are the reduction of
setup activities. The actual set-up activities before the improvement of Single
Minute Exchange of Dies (SMED) are eight activities in total with 34 minutes to
finish the set-up activities. After Single Minute Exchange of Dies (SMED)
improvement, four internal activities are converted to external activities and the
rest remaining activities become the internal activities. Then, the total time needed
to perform the remaining internal activities are 13 minutes.
5S implementation will help to improve the filling machine area, which means
removing or replacing the unneeded items. The other improvement might be
replace the location of the needed items to the appropriate location to help the
operator in performing more effective movement in set-up activities. The
unneeded items that are not useful for set-up activities are tip table.
The next improvement is to replace the location of SAM/SAP table to nearest
place to the filling machine, and also replacing the location of cleaning tools (red
and blue). The SAM/SAP table are replace from 10 meters away from the
machine to only 5.6 meters, while the red and blue cleaning tools are reduce from
7 meters to 5.6 meters away from the filling machine.
The table 4.20 and 4.21 shows the result of Single Minute Exchange of Dies
(SMED) and 5S implementation and will be compare with the actual set-up
activities before new implementation. The table include the time for each set-up

76
activities, and also the distance taken by the operator in performing the set-up
activities. Table 4.20 shows the result for internal activities or the activities done
when the machine stops.
Table 4.20 Summary of the Result
NO Activity Time (minute) Distance (meter)
Before After Before After
Activities done when the machine stops
1 Checking Metal Detector
Record Counter Metal Detector 1 1 1 1
Verified positive sample metal
detector 1 1 4 4
2 2 5 5
2 Cleaning Machine
Take Cleaning Tools 2 0.5 0 5
Cleaning Horizontal Seal Bar 1 1
7 2
Cleaning Vertical Seal Bar 0 0
Cleaning Colar
1 1
2 1
Cleaning Knife Jaw 0 0
Cleaning Cover Acrylic 1 2
Cleaning Conveyor Plat 1 1
1 2
Cleaning Conveyor Belt 0 0
Tidy Up Cleaning Tools 2 0.5 7 3
7 4 18 15
3 Take Sample for Bubble Test
Take Sample for Bubble Test 1 1 4 4
Waiting sampling result 1 1
0 0
Report sampling 4 4
2 2 8 8
4 Take Sample for Carbon Test
Take Sample for Carbon Test 1 1 4 4
Waiting sampling result 1 1
0 0
Report sampling 4 4
2 2 8 8
TOTAL 13 10 39 36
Based on table 4.20, it shows that the set-up activities which means the activities
done when the machine stops are reduce from 13 minutes to 10 minutes. There are
only four internal activities in total which is the current internal activities. The
distance taken by the operator in performing the actual set-up activities is 39
meters, after the Single Minute Exchange of Dies (SMED) and 5S
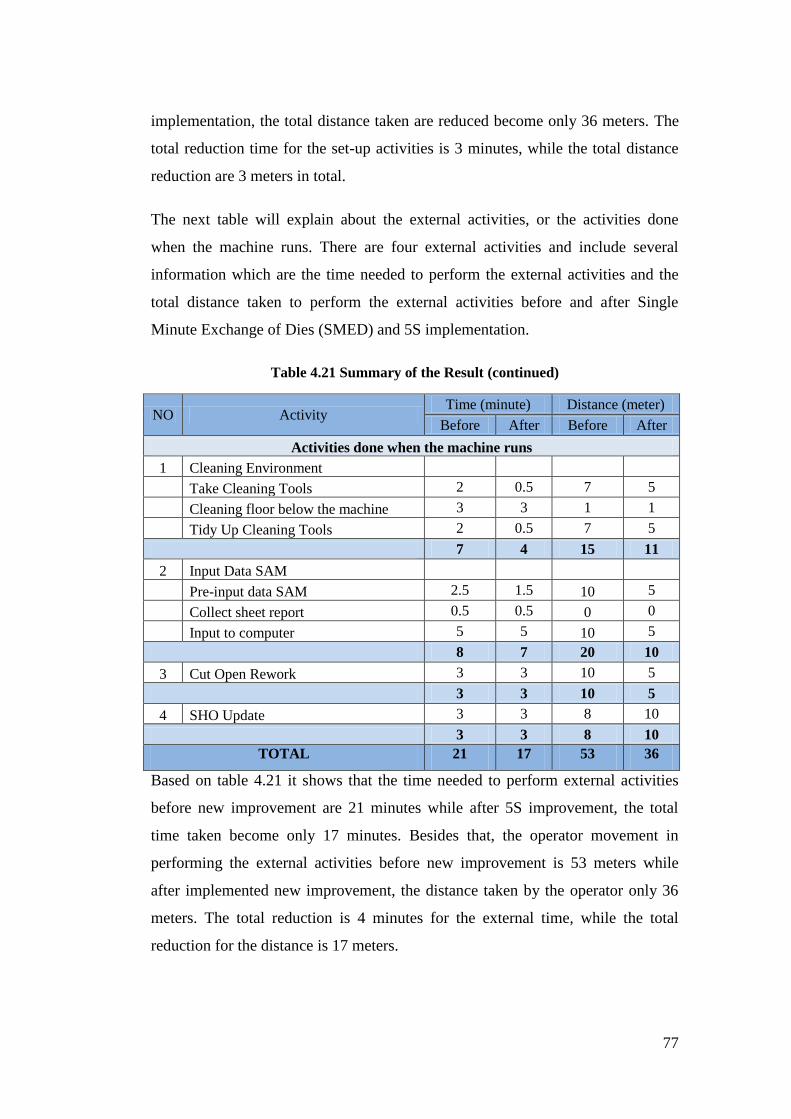
77
implementation, the total distance taken are reduced become only 36 meters. The
total reduction time for the set-up activities is 3 minutes, while the total distance
reduction are 3 meters in total.
The next table will explain about the external activities, or the activities done
when the machine runs. There are four external activities and include several
information which are the time needed to perform the external activities and the
total distance taken to perform the external activities before and after Single
Minute Exchange of Dies (SMED) and 5S implementation.
Table 4.21 Summary of the Result (continued)
NO Activity Time (minute) Distance (meter)
Before After Before After
Activities done when the machine runs
1 Cleaning Environment
Take Cleaning Tools 2 0.5 7 5
Cleaning floor below the machine 3 3 1 1
Tidy Up Cleaning Tools 2 0.5 7 5
7 4 15 11
2 Input Data SAM
Pre-input data SAM 2.5 1.5 10 5
Collect sheet report 0.5 0.5 0 0
Input to computer 5 5 10 5
8 7 20 10
3 Cut Open Rework 3 3 10 5
3 3 10 5
4 SHO Update 3 3 8 10
3 3 8 10
TOTAL 21 17 53 36
Based on table 4.21 it shows that the time needed to perform external activities
before new improvement are 21 minutes while after 5S improvement, the total
time taken become only 17 minutes. Besides that, the operator movement in
performing the external activities before new improvement is 53 meters while
after implemented new improvement, the distance taken by the operator only 36
meters. The total reduction is 4 minutes for the external time, while the total
reduction for the distance is 17 meters.

78
Figure 4.13 shows the difference between Overall Equipment Effectiveness
(OEE) before and after new improvement. The calculation are shown more detail
in the appendices. Based on previous discussion, the calculation of OEE rate are
include the set-up time which comes from the availability rate. When the set-up
time is reduce the availability rate will be increase since the time needed for the
filling machine stops are reduce. Then, the reduction of set-up time will influence
the OEE rate.
Figure 4.13 Summary of Overall Equipment Effectiveness (OEE)
Based on previous discussion and the calculation that shown in the appendices,
the Overall Equipment Effectiveness (OEE) rate are increasing from 76% to 78%.
The OEE rate before Single Minute Exchange of Dies (SMED) and 5S
implementation are conducted in April 2016 since the SMED implementation are
happen in May 2016 which result 76%. The OEE rate after SMED and 5S
implementation are happen in June 2016 which result 78%. Then, the difference
between the OEE before and after Single Minute Exchange of Dies (SME) and 5S
implementation are 2%.
74%
75%
76%
77%
78%
79%
80%
April June
76%
78%
Overall Equipment Effectiveness (OEE)

79
CHAPTER V
CONCLUSION AND RECOMMENDATION
5.1 Conclusion
Based on the result of analysis in this research, there are two conclusions that can
answer the objective of this research:
Based on Single Minute Exchange of Dies (SMED) implementation, the set-
up time is reduced from 34 minutes into 13 minutes. Then, by using 5S
method, the set-up time is reduced from 13 minutes into 10 minutes after
implementing 5S method. The total reduction time before implementing
Single Minute Exchange of Dies (SMED) and 5S implementation are 24
minutes which the reduction from 34 minutes into 10 minutes of the time of
set-up activities.
Based on the Overall Equipment Effectiveness (OEE) calculation, the
difference of OEE rate is increasing from April to June 2016 76% to 78%.
Since the calculation of OEE include the line preparation or set-up time, the
reduction of set-up time influence the increasing of OEE rate. The OEE rate
is increasing in PT. MNO, which means PT. MNO has a good productivity
than before.
5.2 Recommendation
The recommendation from future research are as shown follow:
Another recommendation might be further Single Minute Exchange of Dies
(SMED) method implementation in other department such as packing,
milling, and other department to reduce the set-up time.

80
REFERENCES
Agrahari, R. S., Dangle, P. A., & Chandratre, K. v. Implementation of 5S
Methodology in The Small Scale Infustry: A Case Study. International
Journal of Scientific & Technology Research , 2015 180-187.
Arai, K., & Sekine, K. TPM for the Lean Factory: Innovative Methods and
Worksheets for the Equipment Management. Portland: Productivity Press,
1998.
Arya, A. K., & Choudhary, S. Assessing the application of Kaizen principles in
Indian small-scale industry. International Journal of Lean Six Sigma,
2015, 369-396.
Awaj, Y. M., Singh, A. P., & Amedie, W. Y. Quality Improvement using
Statistical Proces Control Tools in Glass Bottles Manufacturing Company.
International Journal for Quality Research, 2013, 107-126.
Benjamin, S. J., Murugaiah, U., & Marathamuthu, M. S. The use of SMED to
eliminate small stops in a manufacturing firm. Journal Manufacturing
Technology Management, 2012, 792-807.
Boztinaztepe, B., & Canan, F. Lean Tools for Reducting Production Time and
Satisfying Employees. Sweden, 2008.
Feld, W. M. Lean Manufacturing: tools, technique, and how to use them. Florida:
St. Lucie Press, 2000.
Gupta, S., & Jain, S. K. An application of 5S concept to organize the workplace at
a scientific instruments manufacturing company. International Journal of
Lean Siz Sigma, Vol 6, 2014, 73-88.
Ishijima, H., Eliakimu, E., & Mahana, J. M. The "5S" approach to improve a
working environment can reduce waiting time. TQM Journal, Vol. 28,
2015, 664-680.
Jonsson, P., & Lesshammar, M. Evaluation anf improvement of manufacturing
performance measurement systems - the role of OEE. International
Journal of Operations and Production Management, Vol 19, 1999, 55-78.
Kamne, A. Improving a plant's operations by applying lean manufacturing on the
material flow and layout design. Chicago: Alfa Laval, 2016.
Liker, J. K. The Toyota Way: 14 Management Principles from the World's
Greatest Manufacturer. New York: McGraw-Hill, 2004.
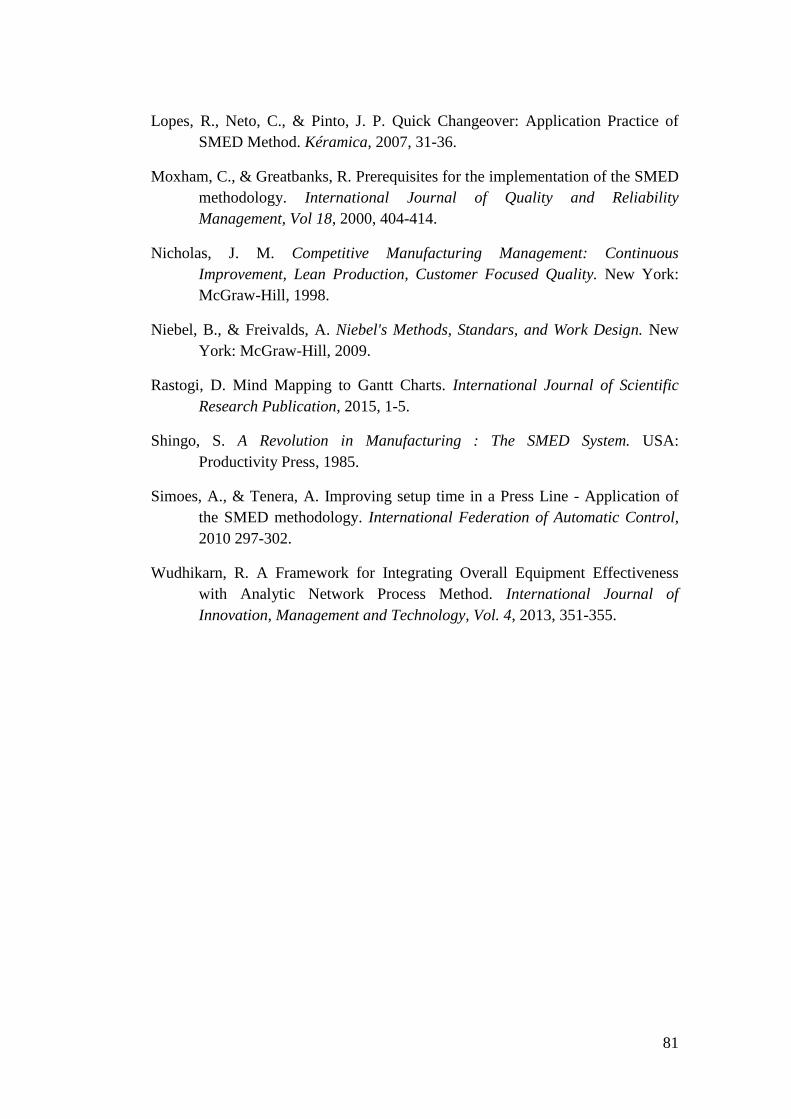
81
Lopes, R., Neto, C., & Pinto, J. P. Quick Changeover: Application Practice of
SMED Method. Kéramica, 2007, 31-36.
Moxham, C., & Greatbanks, R. Prerequisites for the implementation of the SMED
methodology. International Journal of Quality and Reliability
Management, Vol 18, 2000, 404-414.
Nicholas, J. M. Competitive Manufacturing Management: Continuous
Improvement, Lean Production, Customer Focused Quality. New York:
McGraw-Hill, 1998.
Niebel, B., & Freivalds, A. Niebel's Methods, Standars, and Work Design. New
York: McGraw-Hill, 2009.
Rastogi, D. Mind Mapping to Gantt Charts. International Journal of Scientific
Research Publication, 2015, 1-5.
Shingo, S. A Revolution in Manufacturing : The SMED System. USA:
Productivity Press, 1985.
Simoes, A., & Tenera, A. Improving setup time in a Press Line - Application of
the SMED methodology. International Federation of Automatic Control,
2010 297-302.
Wudhikarn, R. A Framework for Integrating Overall Equipment Effectiveness
with Analytic Network Process Method. International Journal of
Innovation, Management and Technology, Vol. 4, 2013, 351-355.

82
APPENDICES
Appendices 1 - Changeover Product April 2016
PS - Changeover Product (COP) 12 12
05. Seal Bar (H&V), T Belt & Knife Head1 3
4/1/2016 3
06. Seal Bar (H&V), T Belt & Knife Head2 3
4/1/2016 3
05. Seal Bar (H&V), T Belt & Knife Head3 3
4/1/2016 3
06. Seal Bar (H&V), T Belt & Knife Head4 3
4/1/2016 3
Appendices 2 - Process Failure April 2016
UPS - Process Failure (PF) 53 53
05. Seal Bar (H&V), T Belt & Knife Head1 3
4/1/2016 1
4/14/2016 2
06. Seal Bar (H&V), T Belt & Knife Head2 4
4/14/2016 3
4/29/2016 1
07. Laminate Transport (dancing roll) H1 3
4/28/2016 3
08. Laminate Transport (dancing roll) H2 2
4/28/2016 2
05. Seal Bar (H&V), T Belt & Knife Head3 5
4/14/2016 2
4/25/2016 1
4/28/2016 2
06. Seal Bar (H&V), T Belt & Knife Head4 6
4/14/2016 3
4/29/2016 3
07. Laminate Transport (dancing roll) H3 6
4/16/2016 1
4/20/2016 3
4/28/2016 2
08. Laminate Transport (dancing roll) H4 3
4/28/2016 3
01. Folding Unit 1 Head 1 2
4/29/2016 2
03. Folding Unit 2 Head 3 5
4/1/2016 2
4/20/2016 3
07. Robot Fanuc SIC 1 8
4/1/2016 2
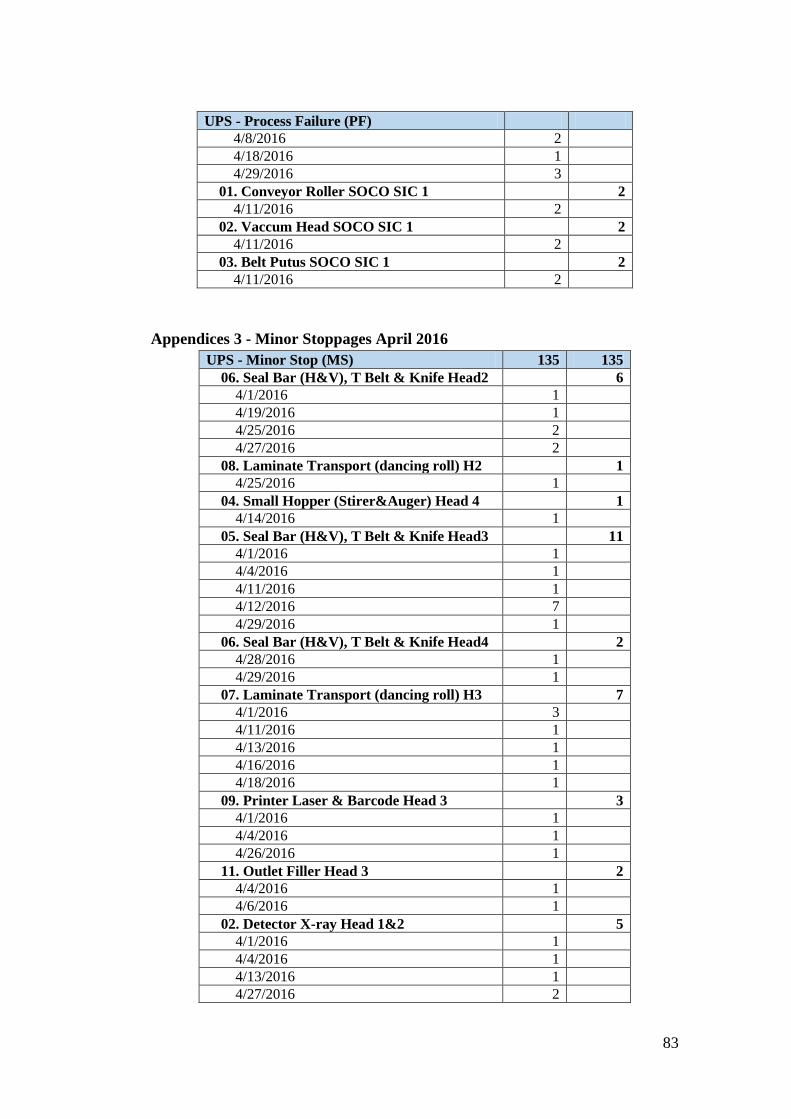
83
UPS - Process Failure (PF)
4/8/2016 2
4/18/2016 1
4/29/2016 3
01. Conveyor Roller SOCO SIC 1 2
4/11/2016 2
02. Vaccum Head SOCO SIC 1 2
4/11/2016 2
03. Belt Putus SOCO SIC 1 2
4/11/2016 2
Appendices 3 - Minor Stoppages April 2016
UPS - Minor Stop (MS) 135 135
06. Seal Bar (H&V), T Belt & Knife Head2 6
4/1/2016 1
4/19/2016 1
4/25/2016 2
4/27/2016 2
08. Laminate Transport (dancing roll) H2 1
4/25/2016 1
04. Small Hopper (Stirer&Auger) Head 4 1
4/14/2016 1
05. Seal Bar (H&V), T Belt & Knife Head3 11
4/1/2016 1
4/4/2016 1
4/11/2016 1
4/12/2016 7
4/29/2016 1
06. Seal Bar (H&V), T Belt & Knife Head4 2
4/28/2016 1
4/29/2016 1
07. Laminate Transport (dancing roll) H3 7
4/1/2016 3
4/11/2016 1
4/13/2016 1
4/16/2016 1
4/18/2016 1
09. Printer Laser & Barcode Head 3 3
4/1/2016 1
4/4/2016 1
4/26/2016 1
11. Outlet Filler Head 3 2
4/4/2016 1
4/6/2016 1
02. Detector X-ray Head 1&2 5
4/1/2016 1
4/4/2016 1
4/13/2016 1
4/27/2016 2
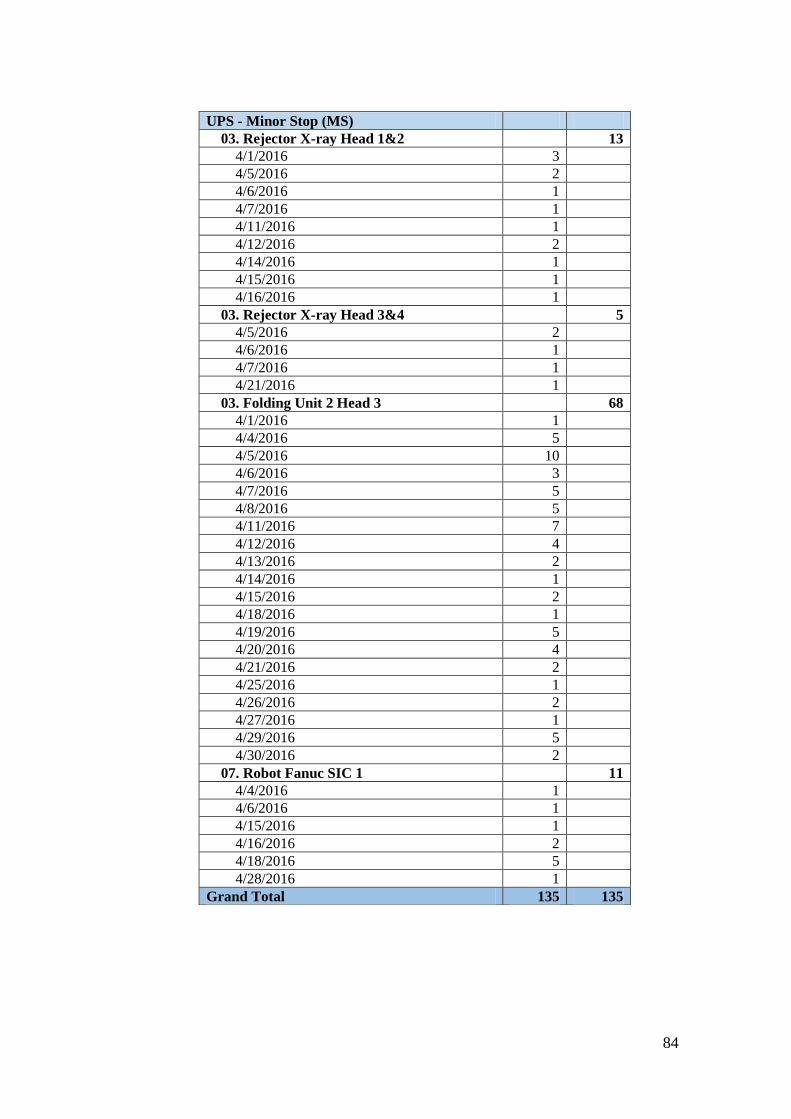
84
UPS - Minor Stop (MS)
03. Rejector X-ray Head 1&2 13
4/1/2016 3
4/5/2016 2
4/6/2016 1
4/7/2016 1
4/11/2016 1
4/12/2016 2
4/14/2016 1
4/15/2016 1
4/16/2016 1
03. Rejector X-ray Head 3&4 5
4/5/2016 2
4/6/2016 1
4/7/2016 1
4/21/2016 1
03. Folding Unit 2 Head 3 68
4/1/2016 1
4/4/2016 5
4/5/2016 10
4/6/2016 3
4/7/2016 5
4/8/2016 5
4/11/2016 7
4/12/2016 4
4/13/2016 2
4/14/2016 1
4/15/2016 2
4/18/2016 1
4/19/2016 5
4/20/2016 4
4/21/2016 2
4/25/2016 1
4/26/2016 2
4/27/2016 1
4/29/2016 5
4/30/2016 2
07. Robot Fanuc SIC 1 11
4/4/2016 1
4/6/2016 1
4/15/2016 1
4/16/2016 2
4/18/2016 5
4/28/2016 1
Grand Total 135 135
85
Appendices 4 - Changeover Product June 2016
PS - Changeover Product (COP) 8 8
05. Seal Bar (H&V), T Belt & Knife Head1 2
6/9/2016 1
6/22/2016 1
06. Seal Bar (H&V), T Belt & Knife Head2 2
6/9/2016 1
6/22/2016 1
05. Seal Bar (H&V), T Belt & Knife Head3 2
6/9/2016 1
6/22/2016 1
06. Seal Bar (H&V), T Belt & Knife Head4 2
6/9/2016 1
6/22/2016 1
Appendices 5 - Process Failure June 2016
UPS - Process Failure (PF) 33 33
05. Seal Bar (H&V), T Belt & Knife Head1 1
6/7/2016 1
06. Seal Bar (H&V), T Belt & Knife Head2 4
6/13/2016 2
6/15/2016 1
6/20/2016 1
07. Laminate Transport (dancing roll) H1 4
6/1/2016 1
6/10/2016 2
6/13/2016 1
08. Laminate Transport (dancing roll) H2 5
6/7/2016 1
6/16/2016 2
6/17/2016 1
6/22/2016 1
11. Outlet Filler Head 1 1
6/16/2016 1
03. Small Hopper (Stirer&Auger) Head 3 2
6/22/2016 2
05. Seal Bar (H&V), T Belt & Knife Head3 3
6/15/2016 2
6/20/2016 1
06. Seal Bar (H&V), T Belt & Knife Head4 2
6/3/2016 1
6/15/2016 1
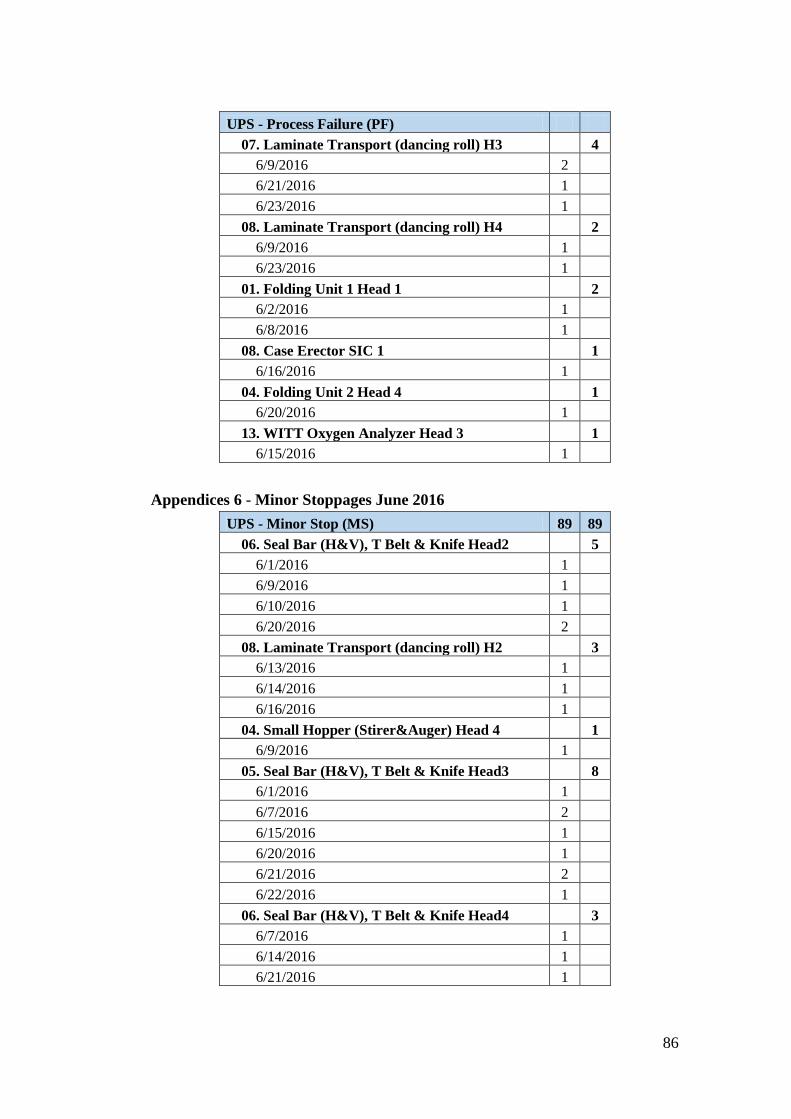
86
UPS - Process Failure (PF)
07. Laminate Transport (dancing roll) H3 4
6/9/2016 2
6/21/2016 1
6/23/2016 1
08. Laminate Transport (dancing roll) H4 2
6/9/2016 1
6/23/2016 1
01. Folding Unit 1 Head 1 2
6/2/2016 1
6/8/2016 1
08. Case Erector SIC 1 1
6/16/2016 1
04. Folding Unit 2 Head 4 1
6/20/2016 1
13. WITT Oxygen Analyzer Head 3 1
6/15/2016 1
Appendices 6 - Minor Stoppages June 2016
UPS - Minor Stop (MS) 89 89
06. Seal Bar (H&V), T Belt & Knife Head2 5
6/1/2016 1
6/9/2016 1
6/10/2016 1
6/20/2016 2
08. Laminate Transport (dancing roll) H2 3
6/13/2016 1
6/14/2016 1
6/16/2016 1
04. Small Hopper (Stirer&Auger) Head 4 1
6/9/2016 1
05. Seal Bar (H&V), T Belt & Knife Head3 8
6/1/2016 1
6/7/2016 2
6/15/2016 1
6/20/2016 1
6/21/2016 2
6/22/2016 1
06. Seal Bar (H&V), T Belt & Knife Head4 3
6/7/2016 1
6/14/2016 1
6/21/2016 1
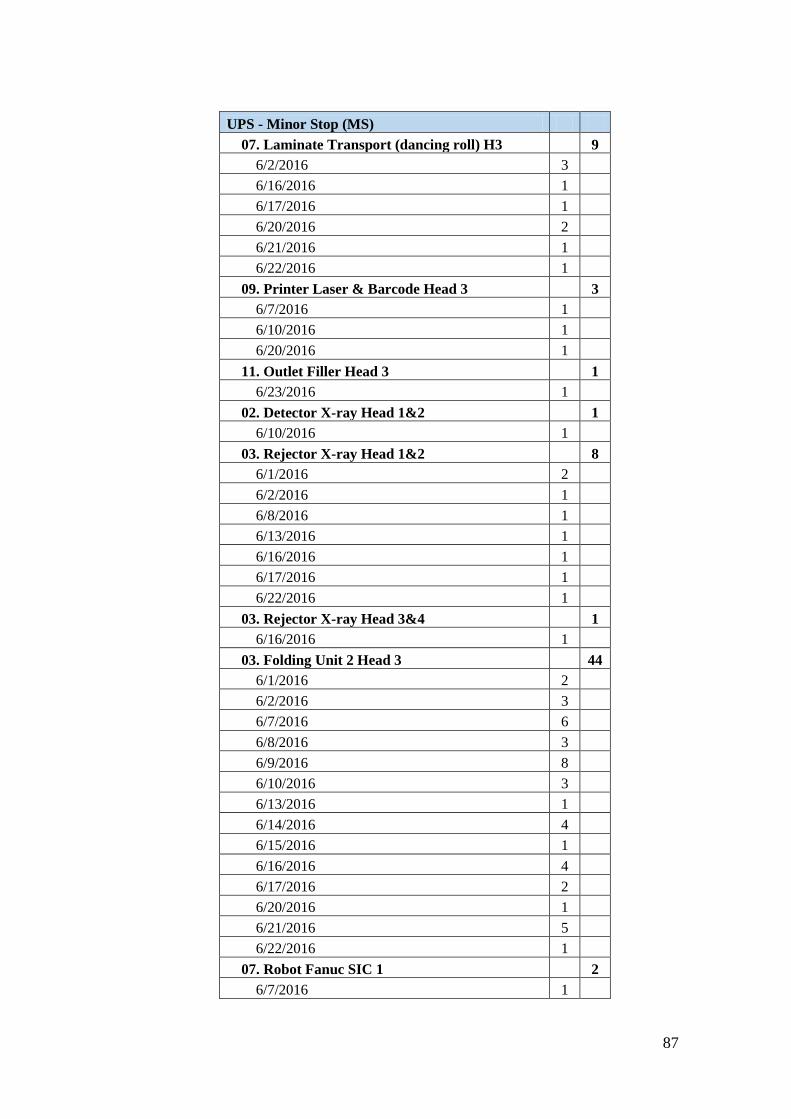
87
UPS - Minor Stop (MS)
07. Laminate Transport (dancing roll) H3 9
6/2/2016 3
6/16/2016 1
6/17/2016 1
6/20/2016 2
6/21/2016 1
6/22/2016 1
09. Printer Laser & Barcode Head 3 3
6/7/2016 1
6/10/2016 1
6/20/2016 1
11. Outlet Filler Head 3 1
6/23/2016 1
02. Detector X-ray Head 1&2 1
6/10/2016 1
03. Rejector X-ray Head 1&2 8
6/1/2016 2
6/2/2016 1
6/8/2016 1
6/13/2016 1
6/16/2016 1
6/17/2016 1
6/22/2016 1
03. Rejector X-ray Head 3&4 1
6/16/2016 1
03. Folding Unit 2 Head 3 44
6/1/2016 2
6/2/2016 3
6/7/2016 6
6/8/2016 3
6/9/2016 8
6/10/2016 3
6/13/2016 1
6/14/2016 4
6/15/2016 1
6/16/2016 4
6/17/2016 2
6/20/2016 1
6/21/2016 5
6/22/2016 1
07. Robot Fanuc SIC 1 2
6/7/2016 1

88
UPS - Minor Stop (MS)
6/22/2016 1
Grand Total 89 89
Appendices 7 – Downtime Loss Calculation April and June 2016
April 2016
Changeover Product
= 12 x 60 minutes
= 720 minutes
Process Failure
= 53 x 60 minutes
= 3180 minutes
Line Preparation or Setup time
= 792 minutes
Downtime Loss
= 720 minutes + 3180 minutes + 792 minutes
= 4692 minutes
June 2016
Changeover Product
= 8 x 60 minutes
= 480 minutes
Process Failure
= 33 x 60 minutes
= 1980 minutes

89
Line Preparation or Setup time
= 175 minutes
Downtime Loss
= 480 minutes + 1980 minutes + 175 minutes
= 2635 minutes
Appendices 8 – Performance Loss Calculation April and June 2016
April 2016
Minor Stoppages
= 135 x 60 minutes
= 8100 minutes
Performance Loss
= 8100 minutes
June 2016
Minor Stoppages
= 89 x 60 minutes
= 5340 minutes
Performance Loss
= 5340 minutes
Appendices 9 – Loading Time Calculation April and June 2016
April 2016
Planned Maintenance = 7 days

90
Loading Time
= (30 days – 7 days) x 24 hours x 60 minutes
= 552 x 60 minutes
= 33120 minutes
June 2016
Planned Maintenance = 13 days
Loading Time
= (30 days – 13 days) x 24 hours x 60 minutes
= 480 x 60 minutes
= 24480 minutes
Appendices 10 – Operating Time Calculation April and June 2016
April 2016
Operating Time = Loading Time – Downtime Loss
= 33120 minutes – 4692 minutes
= 28428 minutes
June 2016
Operating Time = Loading Time – Downtime Loss
= 24480 minutes – 2635 minutes
= 21845 minutes
Appendices 11 – Operating Time Calculation April and June 2016
April 2016
Net Operating Time = Loading Time – Performance Loss
= 33120 minutes – 8100 minutes
= 25020 minutes
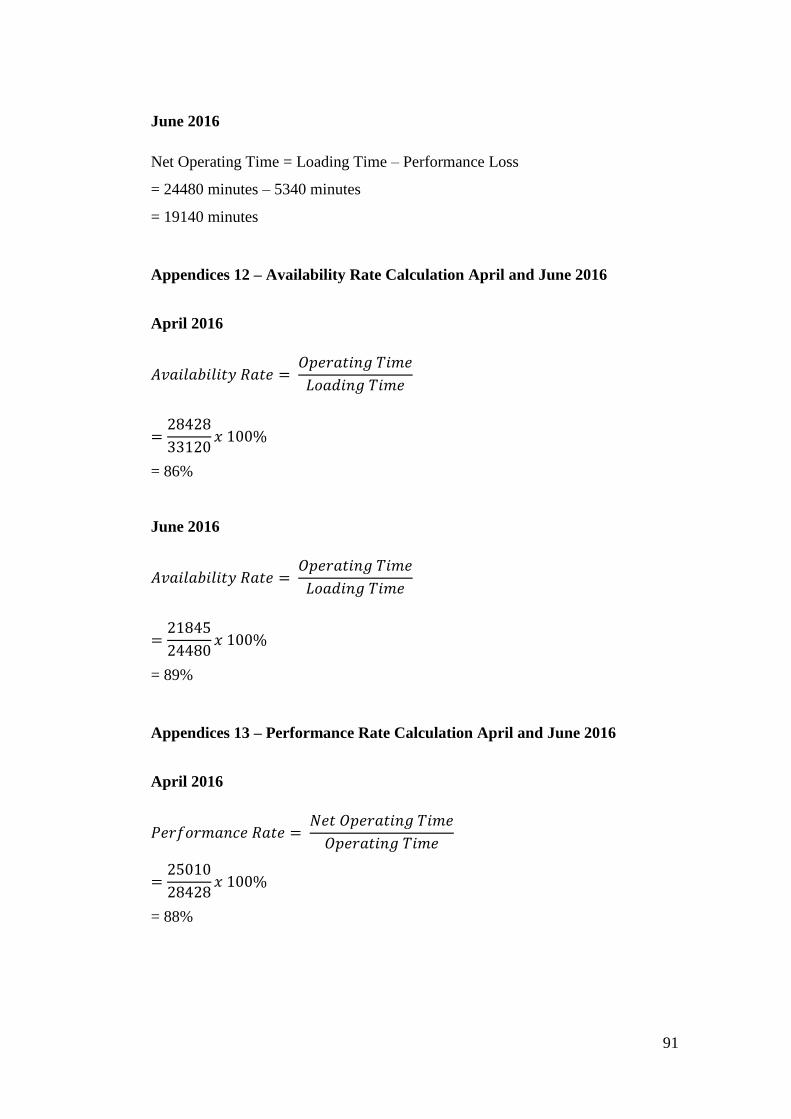
91
June 2016
Net Operating Time = Loading Time – Performance Loss
= 24480 minutes – 5340 minutes
= 19140 minutes
Appendices 12 – Availability Rate Calculation April and June 2016
April 2016
= 86%
June 2016
= 89%
Appendices 13 – Performance Rate Calculation April and June 2016
April 2016
= 88%

92
June 2016
= 88%
Appendices 14 – Quality Rate Calculation April and June 2016
April 2016
Processed Amount = 39000
Defect Amount = 130
( )
( )
= 99.66% = 100%
June 2016
Processed Amount = 39000
Defect Amount = 100
( )
( )
= 99.74% = 100%
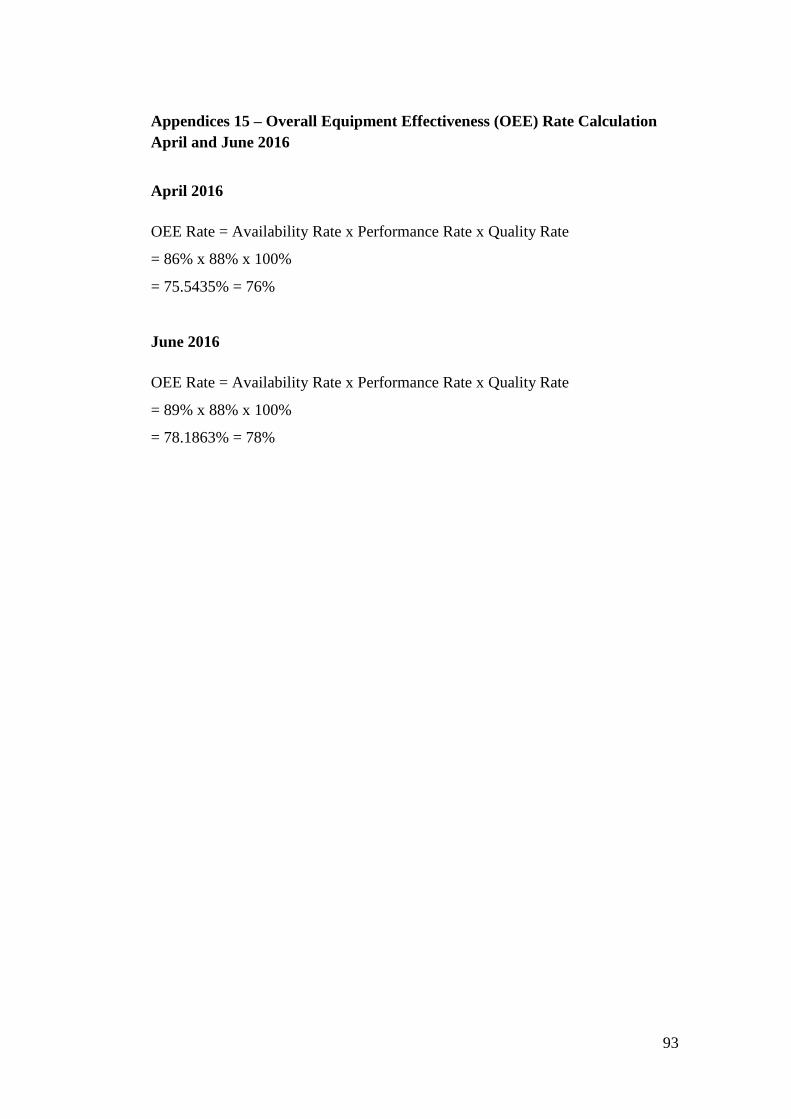
93
Appendices 15 – Overall Equipment Effectiveness (OEE) Rate Calculation
April and June 2016
April 2016
OEE Rate = Availability Rate x Performance Rate x Quality Rate
= 86% x 88% x 100%
= 75.5435% = 76%
June 2016
OEE Rate = Availability Rate x Performance Rate x Quality Rate
= 89% x 88% x 100%
= 78.1863% = 78%