Applying Importance Measures to Risk Analysis in ...
12
HAL Id: hal-01412632 https://hal.archives-ouvertes.fr/hal-01412632 Submitted on 8 Dec 2016 HAL is a multi-disciplinary open access archive for the deposit and dissemination of sci- entific research documents, whether they are pub- lished or not. The documents may come from teaching and research institutions in France or abroad, or from public or private research centers. L’archive ouverte pluridisciplinaire HAL, est destinée au dépôt et à la diffusion de documents scientifiques de niveau recherche, publiés ou non, émanant des établissements d’enseignement et de recherche français ou étrangers, des laboratoires publics ou privés. Applying Importance Measures to Risk Analysis in Engineering Project Using a Risk Network Model Chao Fang, Franck Marle, Min Xie To cite this version: Chao Fang, Franck Marle, Min Xie. Applying Importance Measures to Risk Analysis in Engineering Project Using a Risk Network Model. IEEE Systems Journal, IEEE, 2016, 11 (3), pp.1548-1556. 10.1109/jsyst.2016.2536701. hal-01412632
Transcript of Applying Importance Measures to Risk Analysis in ...

HAL Id: hal-01412632https://hal.archives-ouvertes.fr/hal-01412632
Submitted on 8 Dec 2016
HAL is a multi-disciplinary open accessarchive for the deposit and dissemination of sci-entific research documents, whether they are pub-lished or not. The documents may come fromteaching and research institutions in France orabroad, or from public or private research centers.
L’archive ouverte pluridisciplinaire HAL, estdestinée au dépôt et à la diffusion de documentsscientifiques de niveau recherche, publiés ou non,émanant des établissements d’enseignement et derecherche français ou étrangers, des laboratoirespublics ou privés.
Applying Importance Measures to Risk Analysis inEngineering Project Using a Risk Network Model
Chao Fang, Franck Marle, Min Xie
To cite this version:Chao Fang, Franck Marle, Min Xie. Applying Importance Measures to Risk Analysis in EngineeringProject Using a Risk Network Model. IEEE Systems Journal, IEEE, 2016, 11 (3), pp.1548-1556.�10.1109/jsyst.2016.2536701�. �hal-01412632�

1
Abstract—Risk analysis and prioritization is a key process in
project risk management. Its outcomes serve as input of the risk
response planning process where decisions are made. Complexity
of projects is characterized by the emergence of phenomena that
are difficult to detect and to manage using classical methods. It
may disturb risk assessment, on which priorities are further
established. This paper aims at using importance measure
techniques in the complex project risk management field. This
involves modeling the complex project risk network and
providing complementary analysis results based on risk
importance measures accounting for risk interactions. These new
project risk indicators allowthe managerfora morecomprehensive
understanding ofthe risks. An application to a complex
engineering project is provided to illustrate this approach to
assess both risks and risk interactions, in order to establish
priorities for further decision-making.
Index Terms—Complexity, risk interaction, risk analysis,
importance measures, project management
I. INTRODUCTION
Risk management is indispensable for the successful realization
of projects. The Project Management Institute defines a project
risk as ―an uncertain event or condition whose occurrence
affects at least one of the project objectives, e.g., scope,
schedule, cost and quality‖[1]. The classical steps of Project
Risk Management (PRM) involve: risk identification, risk
analysis, risk response planning, risk monitoring & control and
lessons learned. A common and critical issue in the PRM
process is to assess and determine the relative priority of
various risks. As projects are subject to more uncertainties and
tight budget constraints, it is necessary for the manager to
identify the most important risks to take care of, because no
project can afford to manage and control all the potential risks.
In this regard, risk analysis is required to prioritize risks and
then the manager can allocate resources to mitigate the most
This work was supported in part by the NSFC Grant No. 71301123,
71231007, by SRF for ROCS, SEM and ―the Fundamental Research Funds for
the Central Universities‖.
*C.Fang is with the School of Economics andManagement,WuhanUniversity,Wuhan 430072, China (e-mail:
F. Marle is with the Laboratoire Genie Industriel, Ecole Centrale Paris, 92290Chatenay-Malabry, France (e-mail: [email protected]).
M. Xie is with the Department of Systems Engineering and
EngineeringManagement, City University of Hong Kong, Hong Kong, China (e-mail:[email protected]).
critical ones.
Risks are generally assessed with respect to their probability
(of occurrence) and impact (of their materialization). Risk
rating or criticality is used as an aggregate measure of risk
importance, and it is often defined as the product of risk
probability and impact scores [1-3]. A widely praised and
adopted as simple, effective tool for risk prioritization in PRM
practice and other contexts is the ‗risk matrix‘ or
‗probability-impact grid‘ (PIG) [4,5].However, some
researchers highlight the weakness related to the fact that
interdependencies among risks are not properly considered in
PRM just using the risk matrix or the PIG approach [6-8]. For
example, Salado and Nilchiani have discussed the importance
of modeling risk dependencies and hence the uncertainty
propagation [9, 10].
Indeed, projects are facing a growing complexity due to the
involvement of numerous, diverse and strongly interrelated
elements [11-14]. This leads to an increasing number of
interdependent risks, which must be taken into account in order
to be able to put properly priorities to these risks. Some
research have discussed how to model and understand the
complexity in network structures, e.g., in [15-19]. A modeling
and analysis process of the risk network will be used in this
paper based on previous works[20].
Complexity appears to be one of the main reasons of the
unpredictability of projects, particularly in terms of problems
and failures. There is a high number and great diversity of
interdependent elements to manage, with also a lot of and
diverse parameters that characterize them. The amount and
diversity of these interactions are huge that projects rapidly
become unmanageable due to the sole use of classical project
management tools and methods like the mentioned risk matrix
or the PIG approach. Both the complexity of the evolving
environment and the internal complexity of the project justify
the need for a new approach. For instance, some events may
occur and eventually propagate throughout the project, which is
likely to reduce the project performance if this emergent
behavior is not properly anticipated and controlled[21, 22].
The approach using importance measures (IMs) was first
introduced by Birnhaum [23], and a series of IMs have been
proposed afterwards [24-27]. They all aim at quantifying the
contribution of individual components to the system
performance and have been developed in different fields, like
reliability, risk, availability, throughout [28-32]. Besides, some
Applying Importance Measures to Risk Analysis
in Engineering Project Using a Risk Network
Model
Chao Fang, Franck Marle, and Min Xie, Fellow, IEEE

2
other risk measures like mean-riskmeasure have been widely
applied in systems engineering. For example, Choi and
co-authors conductedmean variance analysis on inventory
management and supply chain management[33-35].In this
research, we propose to measure the importance of risk with
regard to its contribution to the global project risk exposure.The
originality of this paper is tailoring and application of some
importance measures to refined project risk assessments, taking
into account risk interactions. Namely, the measure and ranking
of risks in terms of their importance in the risk network may
differ from the classical project risk analysis results. The
importance of risk interactions can also be measured and
prioritized with respect to their role in the risk network. The
approach can thus provide more comprehensive understanding
of project risks and perhaps novel insights for decision-making.
This work proposes a refined priority of risks and a
complementary priority analysis of risk interactions. It is
regarded as an initial step to develop dependency-driven risk
assessment methods.
Risk assessment or estimation involves using qualitative or
quantitative approaches. In the context of projects, no previous
experience can be reused as is, and the number of similar
projects is not high enough to get significant statistics based on
the past. The aim of this work is to give rankings, order of
magnitudes where gaps between different risks are significant
compared to the error made in estimates. The important thing is
how data are transformed in order to analyze relatively risk
importance, independently of the reliability of initial risk
estimate.
The remainder of the paper is organized as follows. Section 2
introduces a project risk network to model the complexity of
risk interdependencies. Section 3 proposes some importance
measures to project risks considering their interactions with
respect to their contribution to the overall project risk exposure.
Section 4 illustrates how the proposed approach is tested on a
real large engineering project in the construction industry.
Finally, some conclusions are drawn and perspectives are
discussed in Section 5.
II. A RISK NETWORK-BASED MODEL
The aim of this work is to combine importance measures
applied on refined risk assessments, considering risk
interactions. Based on classical project risk analysis methods, a
risk network model is built to capture the project risks and the
propagation behavior through their interactions.
A. Classical Project Risk Assessment Techniques
Risk criticality is used as an aggregate measure of risk
importance, and is often defined as the product of risk
probability and impact, or severity [1-3].
Qualitative scales are often used to express project risk
probability with 5 to 10 levels (e.g., very rare, rare, unlikely,
likely, etc.), which typically correspond to non-linear
probability measures (e.g., 10-4
, 10-3
, 10-2
, 10-1
, etc.) [6, 36]. To
avoid some fundamental flaws in calculation according to [37],
the qualitative scales need to be converted to quantitative
measures of risk probability[20]. Logarithmic scales have been
used by statisticians for many decades [38]. They allow us
todistribute probabilities unevenly. In practice, they devote
more space to small values, imposing a compressed,
logarithmic mapping. For our calculations, based on this
principle, we use the following mappingEquation:
𝑃 = α ∗ 10−𝛽/𝑠 (1)
where Pis the quantitative probability measure, s indicates the
qualitative scale value, with parameters α > 0 , β > 0 .Risk
impact is assessed by classical PRM methods, based upon a mix
of previous experience and expert judgment [1, 39].
In practice, if risks are analyzed individually (i.e., without
considering the interrelationship among risks), the classical risk
criticality indicator can be used to measure the importance of a
risk:
𝐶𝑟𝑖𝑡𝑖𝑐𝑎𝑙𝑖𝑡𝑦𝑖 = 𝑃𝑖 ∗ 𝐼𝑖 (1)
where Piand Ii indicate the estimated probability and impact of
Risk i.
When considering a project with N risks, a potential
objective function O of risk management, i.e., the project risk
exposure, can be defined as [40, 41]:
𝑂 = 𝐶𝑟𝑖𝑡𝑖𝑐𝑎𝑙𝑖𝑡𝑦𝑖𝑛𝑖=1 = 𝑃𝑖 ∗ 𝐼𝑖
𝑛𝑖=1 (3)
The next section shows how the consideration of risk
interactions in our approach may change values of parameters
in Eq. (3).
B. Modeling and Analyzing the Project Risk Network
A risk network model is used to capture the project risks and
their interactions, and to reassess their values in terms of
refined probability and refined criticality. This work is an initial
attempt to incorporate risk dependency in risk analysis for
non-probabilistic risk assessment methods since only
materialization dependency has been incorporated. Such
network representation models the individual risks and their
interactions which convey the risk propagation behavior, i.e.,
the occurrence of one risk triggering another risk in the
network. Simulation technique is used to run the model and
observe the occurrence of risks. In what follows, the risk
network model is briefly described. Readers may refer to[20]
for more details.
First, the network is built. Risk interaction is considered as
the existence of a possible precedence relationship between two
risks [42]. Multiple experts are engaged for this modeling task,
after being made aware of the possible confusion between
direct and indirect interactions among risks, and being asked to
concentrate on direct dependencies. In the context of project
risk management, there is generally not enough experience on
identification and assessment of risk interactions. This is why
expertise is the chosen way in this study to model them.The
interrelations between project objects, such as tasks, actors and
product components, can facilitate the identification of
interrelations between the risks related to these objects.

3
Generally, an indirect cause-effect dependency involves
modeling at least one additional intermediary node and
additional edges between the cause and the effect. This means
that the initial risk list may be enriched thanks to risk
interaction identification.
We define the Risk-Risk Matrix (RR), which is a square
matrix called MDM (Multi-Domain Matrix) in the Dependency
and Structure Modeling (DSM) approach [43, 44] as follows:
𝑅𝑅𝑖𝑗 = 𝑇𝑃𝑖𝑗 if there is a cause − effect
relationship from risk 𝑗 to 𝑖 𝑅𝑅𝑖𝑗 = 0 otherwise
(4)
where the transition probability TPij is defined as the
probability that the occurrence of the cause riskj triggers the
occurrence of the effect risk i.
There is then an important distinction between the
spontaneous probability (that a risk is caused by external events
or risks which are outside the scope of the model) and the
transition probability (that a risk is triggered by another risk
within the model). For the example in Fig. 1, Risk 1 occurs only
in accordance with its spontaneous probability; and Risk 3 may
arise from both its spontaneous probability and the transition
probabilities from Risk 5 and Risk 7.
Finally, the weighted network is analyzed through
simulation. A large number of iterations are conducted for each
scenario of simulation, where the occurrence of every risk
during the run is recorded. The observed probability or
frequency of each risk in the simulation may change or not.
This new value due to the risk propagation behavior is called
𝑃′ . Hence, the output of global risk exposure becomes:
𝑂′ = 𝑃𝑖′𝑛
𝑖=1 ∗ 𝐼𝑖 (5)
III. TAILORING IMPORTANCE MEASURES TO THE PROJECT RISK
NETWORK
This section introduces an approach to combining the refined
risk assessment (considering risk network instead of individual
risks) and the importance measure techniques. We tailor several
risk importance measures to the context of project
management. The value of the proposed risk IMs can be
obtained by the introduced risk network model using
simulation techniques. Various IMs can provide project
manager with diverse insights on risks and risk interactions
with respect to risk management.
A. Risk Importance Measures
Several risk importance measures are proposed based on the
refined risk values using the risk network model:
Risk Achievement Value:
𝑅𝐴𝑉𝑖 = 𝑂′ 𝑅𝑖 = 1 − 𝑂 𝑏𝑎𝑠𝑒 (6)
Risk Reduction Value:
𝑅𝑅𝑉𝑖 = 𝑂 𝑏𝑎𝑠𝑒 − 𝑂′ 𝑅𝑖 = 0 (7)
Marginal Risk Value:
𝑀𝑅𝑉𝑖 = 𝑂′ 𝑅𝑖 = 1 − 𝑂′ 𝑅𝑖 = 0 (8)
Here O is the defined objective function for PRM, namely
the overall risk exposure; O(base) is the estimated value
without carrying out any risk management activities; 𝑂′ 𝑅𝑖 =
1 indicates the achieved risk exposure under the condition that
the spontaneous probability of Risk i is set to 1 while the other
risks remain the original status (i.e., with the estimated
spontaneous probability to occur); 𝑂′ 𝑅𝑖 = 0 indicates the
value of O given that the spontaneous probability of Risk i is set
to 0 (others remain).
The RAVispecifies the maximum potential increase from the
estimated global risk exposure if Risk i is out of control and
determined to occur with 100% probability. The RRVi
represents the maximum potential decrease of the global risk
exposure by investing to directly mitigate Risk i. The MRVi is
irrelevant to the estimated value of the spontaneousprobability
of Ri. It thus reflects the importance of Ri with respect to its
structural position in the risk network. In other words, it
denotes the range of influence of Ri on the overall objective
function and follows:
𝑀𝑅𝑉𝑖 = 𝑅𝐴𝑉𝑖 + 𝑅𝑅𝑉𝑖 (9)
We divide these measures by O (base) to express their
fractional contribution to the overall risk exposure. The ratios
are also easier to use as IMs for risk ranking. The formulas are
as follows:
Risk Achievement Importance:
𝑅𝐴𝐼𝑖 =𝑂′ 𝑅𝑖=1 −𝑂 𝑏𝑎𝑠𝑒
𝑂 𝑏𝑎𝑠𝑒 (10)
Risk Reduction Importance:
𝑅𝑅𝐼𝑖 =𝑂 𝑏𝑎𝑠𝑒 −𝑂′ 𝑅𝑖=0
𝑂 𝑏𝑎𝑠𝑒 (11)
Marginal Risk Importance:
𝑀𝑅𝐼𝑖 =𝑂′ 𝑅𝑖=1 −𝑂′ 𝑅𝑖=0
𝑂 𝑏𝑎𝑠𝑒 (12)
B. Risk Interactions Importance Measures
Besides individual risks, the importance of risk interactions
can also be measured in terms of its influence on the global risk
Fig. 1. Matrix-based representation of project risk network (adapted from [20]).
4
exposure:
Risk Interaction Achievement Importance:
𝑅𝐴𝐼𝑖→𝑗𝐼 =
𝑂′ 𝑒𝑖→𝑗=1 −𝑂 𝑏𝑎𝑠𝑒
𝑂 𝑏𝑎𝑠𝑒 (13)
Risk Interaction Reduction Importance :
𝑅𝑅𝐼𝑖→𝑗𝐼 =
𝑂 𝑏𝑎𝑠𝑒 −𝑂′ 𝑒𝑖→𝑗=0
𝑂 𝑏𝑎𝑠𝑒 (14)
Marginal Risk Interaction Importance:
𝑀𝑅𝐼𝑖→𝑗𝐼 =
𝑂′ 𝑒𝑖→𝑗=1 −𝑂′ 𝑒𝑖→𝑗=0
𝑂 𝑏𝑎𝑠𝑒 (15)
In a similar sense, 𝑒𝑖→𝑗 = 1 and 𝑒𝑖→𝑗 = 0 translate into
respectively enhancing the corresponding edge of risk
interaction from Ri to Rj in the network (set its transition
probability TPji to 1) or blocking it (set the transition
probability TPji to 0). The RAII, RRI
I, and MRI
I for risk
interaction edges have similar implications to the counterpart
measures for risk nodes in the network.
IV. APPLICATION TO A REAL ENGINEERING PROJECT
In this Section, we illustrate the application of the proposed
approach to a real large engineering project, aimed at building
the infrastructure and associated systems of the future tramway
in a medium-sized city in Europe. The project includes the
construction and implementation of tramway, equipment, and
civil work, with 10 years duration and hundreds of millions €
budget. The leading company is a designer and manufacturer of
trains, which recently extended its scope by proposing
―turnkey‖ projects, including not only the trains, but also the
complete infrastructure around the trains.
A. Identifying Risks and Building the Risk Network
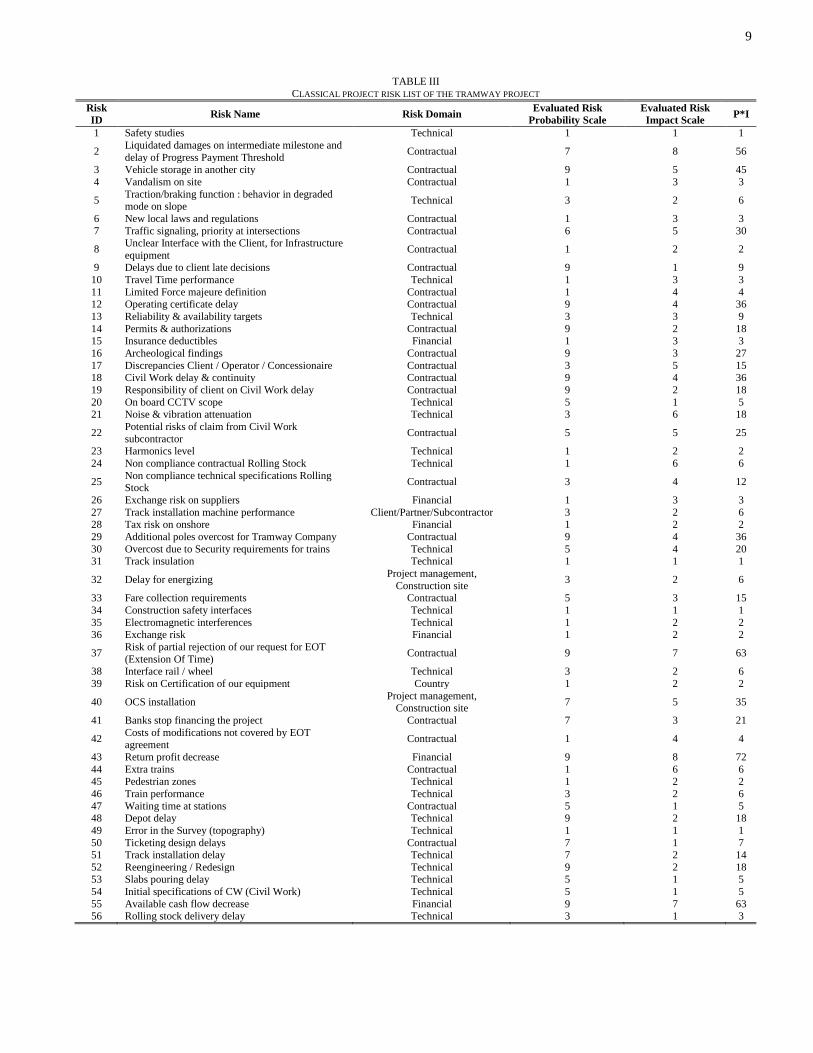
A project risk list is provided by the project manager and the
expert team, containing 56 identified risks at the main level,
with their name, domain information, as shown in Table III in
the Appendix. Basic characteristics of risks have been assessed
by the project manager and associated experts, including
qualitative probability and impact scales, as well as criticality
measure (product of probability and impact).
Qualitative scales of probability are then converted into
quantitative metrics through Eq. (1), setting parameters α = 5,
β = 8by experience. We adoptimpact scales that existed in the
organization to estimate the impact gravity of project risks.
Becauserisk impacts are in essence multi-dimensional (namely
in terms of schedule, cost, quality, etc.), hence hard to create
comparable quantitative scales, in this case study we only
multiply the qualitative scales by a constant for quantification.
Besides, the importance measures in terms of ratio are not
sensitive to the value scales of impact.
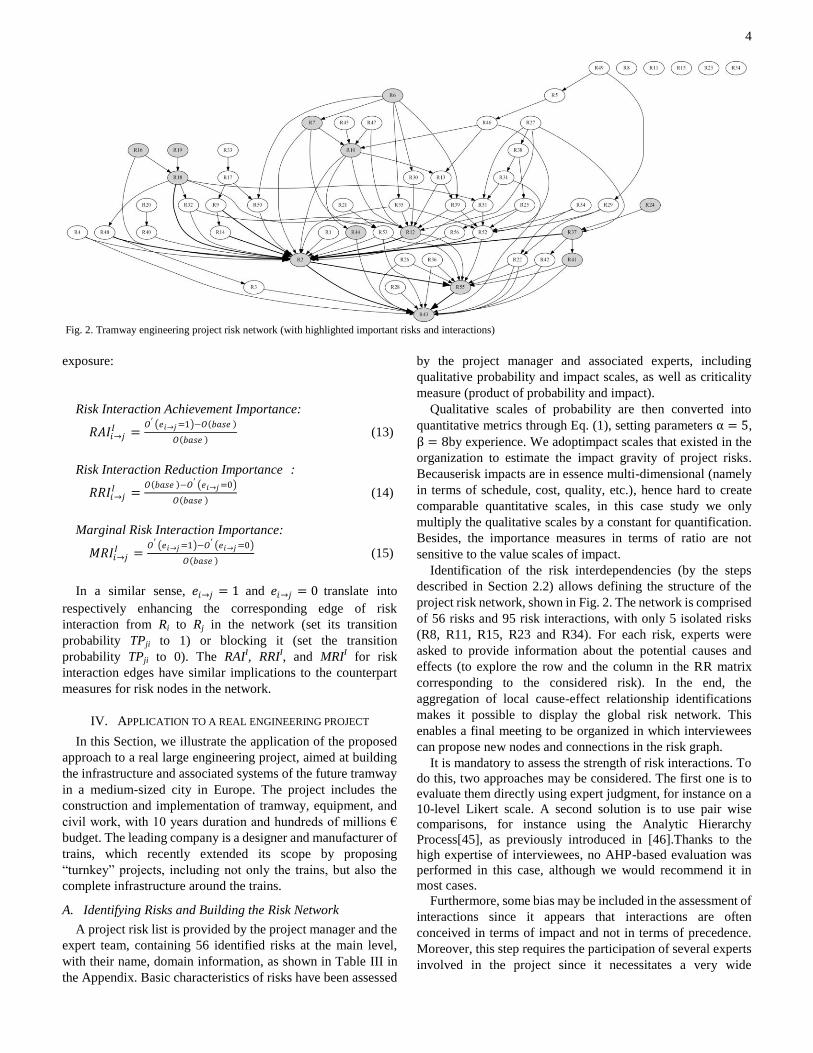
Identification of the risk interdependencies (by the steps
described in Section 2.2) allows defining the structure of the
project risk network, shown in Fig. 2. The network is comprised
of 56 risks and 95 risk interactions, with only 5 isolated risks
(R8, R11, R15, R23 and R34). For each risk, experts were
asked to provide information about the potential causes and
effects (to explore the row and the column in the RR matrix
corresponding to the considered risk). In the end, the
aggregation of local cause-effect relationship identifications
makes it possible to display the global risk network. This
enables a final meeting to be organized in which interviewees
can propose new nodes and connections in the risk graph.
It is mandatory to assess the strength of risk interactions. To
do this, two approaches may be considered. The first one is to
evaluate them directly using expert judgment, for instance on a
10-level Likert scale. A second solution is to use pair wise
comparisons, for instance using the Analytic Hierarchy
Process[45], as previously introduced in [46].Thanks to the
high expertise of interviewees, no AHP-based evaluation was
performed in this case, although we would recommend it in
most cases.
Furthermore, some bias may be included in the assessment of
interactions since it appears that interactions are often
conceived in terms of impact and not in terms of precedence.
Moreover, this step requires the participation of several experts
involved in the project since it necessitates a very wide
Fig. 2. Tramway engineering project risk network (with highlighted important risks and interactions)

5
overview of the project elements and stakes. Great attention
should thus be paid to that point when analyzing the results.
One may wonder when is the most appropriate moment to
perform this risk network modelling process and the related
analysis. Early modelling enables discussions between people
who would not have necessarily been in relation due to the
project organization to be facilitated. However, information
may be neither available nor reliable at the very beginning of
the project. The decision about the analysis schedule is thus a
balance between doing it early enough and having reliable
enough information. In this case, the project had already been
launched with eight risk review meetings before the beginning
of the study.
B. Results and Analysis
The relevant values of O 𝑏𝑎𝑠𝑒 , 𝑂′ 𝑅𝑖 = 1 and 𝑂′ 𝑅𝑖 =0 for each risk Ri are calculated by simulating the risk network
model. In this work, we use the software ARENA®
for
simulation. The number of simulation iterations are increased
gradually from 1000, 2000, …, to 20 000, and the occurrence of
each risk during the run is recorded. The results are then found
stable after 14 000 iterations. We adopted 20 000 iterations in
this case study forcomputational convenience. The simulation
cost is not a limiting factor as the total running time using
ARENA on a normal PC is less than 10 minutes. The results
shown in Fig. 3 visually illustrate the contribution, namely the
varying range of influence, of each risk to the output of global
risk exposure.
The values of the proposed risk IMs are then consolidated
and compared with the classical risk criticality analysis. We
Fig. 3. Illustrating the contribution of each risk on the global risk exposure
TABLE I
TOP-TEN RISKS ACCORDING TO VARIOUS IMS
Ranking Classical risk criticality measure
Importance Measures of Risks
RAI RRI MRI
Risk ID Value Risk ID Value Risk ID Value Risk ID Value
1 R43 3.048 R10 0.238 R37 0.079 R7 0.258
2 R37 2.667 R7 0.190 R16 0.071 R10 0.238
3 R55 2.667 R6 0.164 R7 0.068 R2 0.213
4 R2 2.465 R2 0.147 R2 0.066 R37 0.207
5 R3 1.905 R44 0.147 R18 0.063 R16 0.186
6 R40 1.541 R37 0.128 R12 0.056 R18 0.164
7 R12 1.524 R4 0.118 R43 0.048 R6 0.164
8 R18 1.524 R16 0.115 R55 0.046 R12 0.148
9 R29 1.524 R27 0.113 R41 0.044 R44 0.147
10 R7 1.314 R24 0.113 R19 0.038 R41 0.142
6
highlight the prioritized top-ten risks according to different
indicators in Table I. It is found that the rankings using the
proposed risk IMs are quite different from the classical risk
analysis results. For example, the most critical risk identified by
classical analysis was R43 (Return profit decrease), which is
closely related to the financial performance of the project.
However, after taking into account the risk propagation
behavior, some other risks occupy the pole or premier critical
position according to different IMs. Another example is R3
(Vehicle storage in another city), which was regarded
important, but has fallen out of the top-ten list according to the
proposed IMs. Overall, several of the critical risks identified by
classical risk criticality analysis have been confirmed by the
proposed IMs, e.g., R37 (Risk of partial rejection of our request
for extension of time), R2 (Liquidated damages on intermediate
milestone and delay of Progress Payment Threshold), R12
(Operating certificate delay) and R18 (Civil Work delay &
continuity). But in addition, some new risks have been
highlighted as key factors by the proposed approach, which are
supplementary results and provide the manager with new
insights on the risk network.
Specifically, R7 (Traffic signaling, priority at intersections),
R10 (Travel Time performance) and R2 (Liquidated damages
on intermediate milestone and delay of Progress Payment
Threshold) are ranked as the top-three risks with marginal
influence on the global risk exposure. R10 has a very high RAI
but not identified as important risk in terms of its RRI value. It
means that although the decrease of risk exposureis relatively
low by carrying out mitigation actions on R10, the potential
damage/loss could be significant if R10 happens. Thus, the
project manager should not propose preventive actions on R10,
but keep on monitoring it during the project progress. On the
other hand, R7 and R2 also have high RRI values. Hence, it
would be worthy to plan risk mitigation actions on them,
although the feasibility of actions should be considered.
Because the edges of risk interactions and the nodes of risks
in the network are basically different in nature and may be
suitable to adopt different kinds of mitigation actions, from the
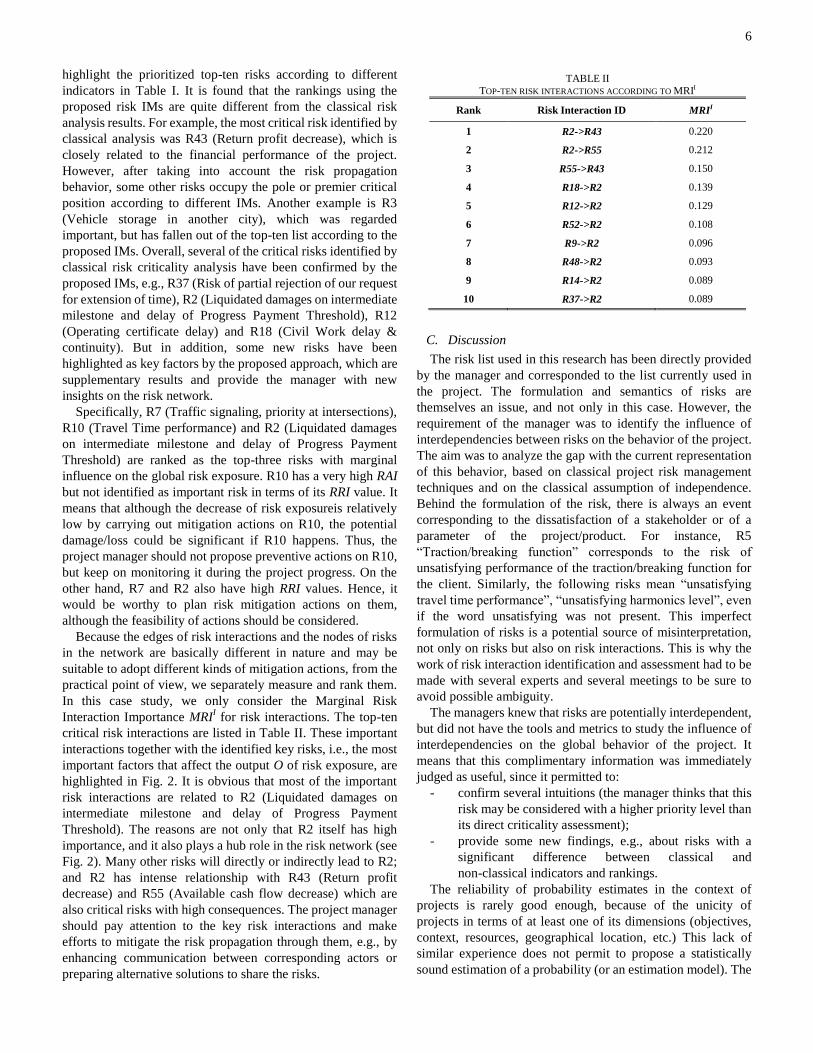
practical point of view, we separately measure and rank them.
In this case study, we only consider the Marginal Risk
Interaction Importance MRII for risk interactions. The top-ten
critical risk interactions are listed in Table II. These important
interactions together with the identified key risks, i.e., the most
important factors that affect the output O of risk exposure, are
highlighted in Fig. 2. It is obvious that most of the important
risk interactions are related to R2 (Liquidated damages on
intermediate milestone and delay of Progress Payment
Threshold). The reasons are not only that R2 itself has high
importance, and it also plays a hub role in the risk network (see
Fig. 2). Many other risks will directly or indirectly lead to R2;
and R2 has intense relationship with R43 (Return profit
decrease) and R55 (Available cash flow decrease) which are
also critical risks with high consequences. The project manager
should pay attention to the key risk interactions and make
efforts to mitigate the risk propagation through them, e.g., by
enhancing communication between corresponding actors or
preparing alternative solutions to share the risks.
C. Discussion
The risk list used in this research has been directly provided
by the manager and corresponded to the list currently used in
the project. The formulation and semantics of risks are
themselves an issue, and not only in this case. However, the
requirement of the manager was to identify the influence of
interdependencies between risks on the behavior of the project.
The aim was to analyze the gap with the current representation
of this behavior, based on classical project risk management
techniques and on the classical assumption of independence.
Behind the formulation of the risk, there is always an event
corresponding to the dissatisfaction of a stakeholder or of a
parameter of the project/product. For instance, R5
―Traction/breaking function‖ corresponds to the risk of
unsatisfying performance of the traction/breaking function for
the client. Similarly, the following risks mean ―unsatisfying
travel time performance‖, ―unsatisfying harmonics level‖, even
if the word unsatisfying was not present. This imperfect
formulation of risks is a potential source of misinterpretation,
not only on risks but also on risk interactions. This is why the
work of risk interaction identification and assessment had to be
made with several experts and several meetings to be sure to
avoid possible ambiguity.
The managers knew that risks are potentially interdependent,
but did not have the tools and metrics to study the influence of
interdependencies on the global behavior of the project. It
means that this complimentary information was immediately
judged as useful, since it permitted to:
- confirm several intuitions (the manager thinks that this
risk may be considered with a higher priority level than
its direct criticality assessment);
- provide some new findings, e.g., about risks with a
significant difference between classical and
non-classical indicators and rankings.
The reliability of probability estimates in the context of
projects is rarely good enough, because of the unicity of
projects in terms of at least one of its dimensions (objectives,
context, resources, geographical location, etc.) This lack of
similar experience does not permit to propose a statistically
sound estimation of a probability (or an estimation model). The
TABLE II
TOP-TEN RISK INTERACTIONS ACCORDING TO MRII
Rank Risk Interaction ID MRII
1 R2->R43 0.220
2 R2->R55 0.212
3 R55->R43 0.150
4 R18->R2 0.139
5 R12->R2 0.129
6 R52->R2 0.108
7 R9->R2 0.096
8 R48->R2 0.093
9 R14->R2 0.089
10 R37->R2 0.089

7
principle is then to transform these numerical inputs into
numerical outputs, where gaps and orders of magnitude are
analyzed, not precise values. Knowing that we have this lack of
reliability in estimates, or error margin, we suppose that gaps
between outputs should be high enough to be significant. The
ranking swaps for instance are interesting to analyze,
particularly if they involve putting a low-level risk at a high
position in importance measure-based rankings, like R10 for
instance. On the opposite, R2 and R37 are always very close to
each other, and the fact that in one ranking R2 is behind R37 (or
not) may not mean that one should be prioritized. It is only
when differences are significant, like R43 which was initially
the most critical risk, and which appears only one time in the
new rankings of RAI, RRI and MRI respectively.
The existence of differing rankings according to various
indices is not a conflict, since it gives different information and
different reasons for proposing a tailored response action for
each risk. For instance, a critical risk with less influence on the
network can be treated with classical mitigation or avoidance of
its direct consequences. A risk with a low criticality but a high
importance on the network may be treated with a preventive
action to cut propagation chain at the source. This means that
the budget invested to prevent this source risk may be cancelled
for other risks which are downstream in the reaction chain and
initially considered as more critical. We argue that it is usually
preferable to act on upstream events of a chain rather than on
downstream events, since the latter generally have higher
amounts at stake and more expensive treatment actions.
V. CONCLUSIONSAND PERSPECTIVE
This paper presents an original method for project risk
analysis and prioritization using importance measures. Risk
interactions are accounted for with the purpose of modeling the
complexity of interdependent project risks. It is an initial step to
develop dependency-driven risk assessment methods.We have
showed how the proposed approach can be applied to a real
case study of a large engineering project and illustrated that it
serves as a powerful complement to the classical project risk
analysis.
Various importance measures have been proposed with
different purposes for risk analysis and prioritization. For
example, the Marginal Risk Importance (MRI) indicates the
potential influence range of a risk on the global risk exposure;
the Risk Achievement Importance (RAI) provides information
to identify the risks which may be dangerous if occurs, even if
they are estimated at a low level of exposure; Risk Reduction
Importance (RRI) helps to identify the risks which are the most
effective targets for planning mitigation actions. The classical
criticality analysis of risks can only evaluate the risks that affect
the global project performance in a local point of view without
taking into account risk interactions. Using the importance
measures permits to identify the key factors (i.e., either
spontaneous reasons or particular risk interactions) in the risk
network that most affect the global performance in terms of risk
exposure. For supporting subsequent decisions with respect to
risk response planning, this approach enables manager to
combine classical risk mitigation strategies (avoidance,
mitigation, transfer and acceptance) with new ones which help
facing the complexity of risk network: protecting risks due to
their position in the network, changing the actors who own risks
and/or the organization to adapt it to the current complexity,
and reducing the complexity by acting for instance on
important risk interactions instead of risks only.
The current study still has a number of limitations. For
example, it only considers impact of dependencies on risk
materialization; however, the related changes in probability of
occurrence and severity of consequenceswill be included.
Besides, the risk impacts/consequences are in essence
multi-dimensional, namely in terms of schedule, cost, quality,
etc., and thus with difficulties to create comparable scales. This
approach employs a DSM-based method with pair-wise
comparisons to model risk interactions. However, it may fail in
accounting for some types of dependencies, for example, a risk
may materialize (or change its properties) only as a function of
two other risks occurring[47].This kind of scenarios should be
noticed and future work will be proposed to model them.
Moreover, risk clustering and importance measures of the
risk groups will be studied, in order totake into account the
synergy or co-effects of risks with respect to mitigation actions
planning.Some probabilistic-based risk methods like Monte
Carlo analysis will also be considered and compared. Finally, in
current study, we assume that the risk network structure do not
change during the project development. As perspective, the
dynamic situations would be involved in the model.
APPENDIX
Nomenclature
Ri risk i
RRij (i, j)-th element in the risk interaction matrix
Pi probability measure of risk i
Ii impact measure of risk i
TPij transition probability between risk j and risk i
Criticalityi criticality measure of risk i
O global risk exposure
𝑃′ simulated risk probability
𝑂′ simulated output of global risk exposure
𝑂 𝑏𝑎𝑠𝑒 estimated value of O without carrying out risk
management activities
𝑂′ 𝑅𝑖 = 1 the value of O given that the spontaneousprobability
of Risk i is set to 1 while the other risks remain the
original status
𝑂′ 𝑅𝑖 = 0 the value of O given that the spontaneous
probabilityof Risk i is set to 0 while the other risks
remain the original status
𝑂′ 𝑒𝑖→𝑗 = 1 the value of O given that the transition probability of
risk interaction from Ri to Rj is set to 1 (the others
remain)
𝑂′ 𝑒𝑖→𝑗 = 0 the value of O given that the transition probability of
risk interaction from Ri to Rj is set to 0 (the others
remain)
RAV risk achievement value
RRV risk reduction value
MRV marginal risk value
RAI risk achievement importance
RRI risk reduction importance
MRI marginal risk importance

8
RAII risk interaction achievement importance
RRII risk interaction reduction importance
MRII marginal risk interaction importance
9
TABLE III
CLASSICAL PROJECT RISK LIST OF THE TRAMWAY PROJECT
Risk
ID Risk Name Risk Domain
Evaluated Risk
Probability Scale
Evaluated Risk
Impact Scale P*I
1 Safety studies Technical 1 1 1
2 Liquidated damages on intermediate milestone and
delay of Progress Payment Threshold Contractual 7 8 56
3 Vehicle storage in another city Contractual 9 5 45
4 Vandalism on site Contractual 1 3 3
5 Traction/braking function : behavior in degraded mode on slope
Technical 3 2 6
6 New local laws and regulations Contractual 1 3 3
7 Traffic signaling, priority at intersections Contractual 6 5 30
8 Unclear Interface with the Client, for Infrastructure
equipment Contractual 1 2 2
9 Delays due to client late decisions Contractual 9 1 9
10 Travel Time performance Technical 1 3 3
11 Limited Force majeure definition Contractual 1 4 4 12 Operating certificate delay Contractual 9 4 36
13 Reliability & availability targets Technical 3 3 9
14 Permits & authorizations Contractual 9 2 18
15 Insurance deductibles Financial 1 3 3
16 Archeological findings Contractual 9 3 27
17 Discrepancies Client / Operator / Concessionaire Contractual 3 5 15 18 Civil Work delay & continuity Contractual 9 4 36
19 Responsibility of client on Civil Work delay Contractual 9 2 18
20 On board CCTV scope Technical 5 1 5 21 Noise & vibration attenuation Technical 3 6 18
22 Potential risks of claim from Civil Work
subcontractor Contractual 5 5 25
23 Harmonics level Technical 1 2 2
24 Non compliance contractual Rolling Stock Technical 1 6 6
25 Non compliance technical specifications Rolling Stock
Contractual 3 4 12
26 Exchange risk on suppliers Financial 1 3 3
27 Track installation machine performance Client/Partner/Subcontractor 3 2 6 28 Tax risk on onshore Financial 1 2 2
29 Additional poles overcost for Tramway Company Contractual 9 4 36
30 Overcost due to Security requirements for trains Technical 5 4 20
31 Track insulation Technical 1 1 1
32 Delay for energizing Project management,
Construction site 3 2 6
33 Fare collection requirements Contractual 5 3 15
34 Construction safety interfaces Technical 1 1 1
35 Electromagnetic interferences Technical 1 2 2 36 Exchange risk Financial 1 2 2
37 Risk of partial rejection of our request for EOT
(Extension Of Time) Contractual 9 7 63
38 Interface rail / wheel Technical 3 2 6
39 Risk on Certification of our equipment Country 1 2 2
40 OCS installation Project management,
Construction site 7 5 35
41 Banks stop financing the project Contractual 7 3 21
42 Costs of modifications not covered by EOT agreement
Contractual 1 4 4
43 Return profit decrease Financial 9 8 72
44 Extra trains Contractual 1 6 6
45 Pedestrian zones Technical 1 2 2
46 Train performance Technical 3 2 6
47 Waiting time at stations Contractual 5 1 5 48 Depot delay Technical 9 2 18
49 Error in the Survey (topography) Technical 1 1 1
50 Ticketing design delays Contractual 7 1 7 51 Track installation delay Technical 7 2 14
52 Reengineering / Redesign Technical 9 2 18 53 Slabs pouring delay Technical 5 1 5
54 Initial specifications of CW (Civil Work) Technical 5 1 5
55 Available cash flow decrease Financial 9 7 63 56 Rolling stock delivery delay Technical 3 1 3

10
REFERENCES
[1] PMI, "A Guide to the Project Management Body of Knowledge
(PMBOK) (2008 ed.)," ed. Newton Square, PA, USA: Project
Management Institute, 2008.
[2] T. Raz and E. Michael, "Use and benefits of tools for project risk management," International Journal of Project Management, vol. 19, pp.
9-17, 2001.
[3] T. Williams, "A classified bibliography of recent research relating to project risk management," European Journal of Operational Research,
vol. 85, pp. 18-38, 1995.
[4] D. Baccarini and R. Archer, "The risk ranking of projects: a methodology," International Journal of Project Management, vol. 19, pp.
139–145, 2001.
[5] A. Ahmed, et al., "A review of techniques for risk management in projects," Benchmarking: An International Journal, vol. 14, pp. 22-36,
2007.
[6] A. T. Cox Jr, "What's wrong with risk matrices?," Risk Analysis, vol. 28, pp. 497-512, 2008.
[7] D. W. Hubbard, The failure of risk management: why it's broken and how
to fix it. New jersey: John Wiley & Sons Inc, 2009.
[8] C. Chapman and S. Ward, "How to manage project opportunity and risk:
why uncertainty management can be a much better approach than risk
management," ed. Chichester, Sussex: John Wiley & Sons Ltd., 2011. [9] A. Salado, et al., "Taxonomy and Categorization of Uncertainties in
Space Systems with an Application to the Measurement of the Value of
Adaptability," in AIAA Space Conference 2012, Pasadena, USA, 2012. [10] A. Salado and R. Nilchiani, "Assessing the Impacts of Uncertainty
Propagation to System Requirements by Evaluating Requirement
Connectivity," in INCOSE International Symposium, Philadelphia, USA, 2013, pp. 647-661.
[11] D. Baccarini, "The concept of project complexity – a review,"
International Journal of Project Management, vol. 14, pp. 201–204, 1996.
[12] D. Chu, et al., "Theories of complexity – Common denominators of
complex systems," Complexity, vol. 8, pp. 19–30, 2003. [13] B. Lazzerini and L. Mkrtchyan, "Analyzing risk impact factors using
extended fuzzy cognitive maps," IEEE Systems Journal, vol. 5, pp.
288-297, 2011.
[14] D. D. Wu, et al., "A risk analysis model in concurrent engineering product
development," Risk Analysis, vol. 30, pp. 1440-1453, 2010.
[15] S. V. Buldyrev, et al., "Catastrophic cascade of failures in interdependent networks," Nature, vol. 464, pp. 1025-1028, 2010.
[16] J. Sanz, et al., "Dynamics of interacting diseases," Physical Review X,
vol. 4, p. 041005, 2014. [17] C.-Y. Xia, et al., "Effects of delayed recovery and nonuniform
transmission on the spreading of diseases in complex networks," Physica
A: Statistical Mechanics and its Applications, vol. 392, pp. 1577-1585, 2013.
[18] Y.-Y. Liu, et al., "Controllability of complex networks," Nature, vol. 473,
pp. 167-173, 2011. [19] S. Boccaletti, et al., "Complex networks: Structure and dynamics,"
Physics reports, vol. 424, pp. 175-308, 2006. [20] C. Fang and F. Marle, "A simulation-based risk network model for
decision support in project risk management," Decision Support Systems,
vol. 52, pp. 635-644, 2012. [21] C. Eckert, et al., "Change and customisation in complex engineering
domains," Research in Engineering Design, vol. 15, pp. 1-21, 2004.
[22] B. Kloss-Grote and M. A. Moss, "How to measure the effectiveness of risk management in engineering design projects? Presentation of
RMPASS: a new method for assessing risk management performance and
the impact of knowledge management—including a few results," Research in Engineering Design, vol. 19, pp. 71-100, 2008.
[23] L. W. Birnbaum, "On the importance of different elements in a
multi-element system. ," Multivariate analysis, vol. 2. Academic Press, New York, 1969.
[24] W. Kuo and X. Zhu, Importance Measures in Reliability, Risk, and
Optimization: Principles and Applications: Wiley, 2012. [25] X. Zhu and W. Kuo, "Importance measures in reliability and
mathematical programming," Annals of Operations Research, pp. DOI:
10.1007/s10479-012-1127-0, 2012. [26] M. Xie, "On some importance measures of system components,"
Stochastic processes and their applications, vol. 25, pp. 273-280, 1987.
[27] M. Xie and B. Bergman, "On a general measure of component
importance," Journal of statistical planning and inference, vol. 29, pp. 211-220, 1992.
[28] M. C. Cheok, et al., "Use of importance measures in risk-informed
regulatory applications," Reliability Engineering & System Safety, vol. 60, pp. 213-226, 1998.
[29] M. Van der Borst and H. Schoonakker, "An overview of PSA importance
measures," Reliability Engineering & System Safety, vol. 72, pp. 241-245, 2001.
[30] J. K. Vaurio, "Importance measures in risk-informed decision making:
Ranking, optimisation and configuration control," Reliability Engineering & System Safety, vol. 96, pp. 1426-1436, 2011.
[31] E. Borgonovo, "Differential importance and comparative statics: An
application to inventory management," International Journal of Production Economics, vol. 111, pp. 170-179, 2008.
[32] E. Zio, et al., "Importance measures-based prioritization for improving
the performance of multi-state systems: application to the railway industry," Reliability Engineering & System Safety, vol. 92, pp.
1303-1314, 2007.
[33] T.-M. Choi, et al., "Mean–variance analysis for the newsvendor problem," Systems, Man and Cybernetics, Part A: Systems and Humans,
IEEE Transactions on, vol. 38, pp. 1169-1180, 2008.
[34] J. Li, et al., "Mean variance analysis of fast fashion supply chains with returns policy," Systems, Man, and Cybernetics: Systems, IEEE
Transactions on, vol. 44, pp. 422-434, 2014.
[35] Y. Zhao, et al., "Mean-risk analysis of wholesale price contracts with stochastic price-dependent demand," Annals of Operations Research, pp.
1-28, 2014. [36] D. Vose, Risk Analysis: a Quantitative Guide: John Wiley & Sons Inc,
2008.
[37] E. Kujawski, "Analysis and critique of the system readiness level," Systems, Man, and Cybernetics: Systems, IEEE Transactions on, vol. 43,
pp. 979-987, 2013.
[38] J. L. Fleiss, Statistical methods for rates and proportions. New York: John Wiley&Sons, 1981.
[39] C. Chapman and S. Ward, Project Risk Management – Processes,
Techniques and Insights. Chichester: John Wiley & Sons, 2003. [40] D. Hillson, et al., "Managing project risks using a cross risk breakdown
matrix," Risk Management, pp. 61-76, 2006.
[41] C. Rafele, et al., "Understanding project risk exposure using the
two-dimensional risk breakdown matrix," in Proceeding of 2005 Project
Management Institution Global Congress, Edinburgh, Scotland, 2005.
[42] F. Marle and L. Vidal, "Potential Applications of DSM Principles in Project Risk Management," in 10th International Design Structure
Matrix Conference, DSM’08, Stockholm, Sweden, 2008, pp. 157–168.
[43] D. Steward, "The Design Structure Matrix: a method for managing the design of complex systems," IEEE Transactions on Engineering
Management, vol. 28, pp. 71–74, 1981.
[44] T. Browning, "Applying the design structure matrix to system decomposition and integration problems: a review and new directions,"
IEEE Transactions on Engineering Management, vol. 48, pp. 292–306,
2001. [45] T. Saaty, The Analytic Hierarchy Process: Planning, Priority Setting,
Resource Allocation: McGraw-Hill, 1980
[46] L. Vidal, et al., "Developing an original framework to assess project complexity thanks to the use of the AHP," in International Conference on
Engineering Design ICED'09, Stanford, USA, 2009.
[47] A. Salado and R. Nilchiani, "The concept of order of conflict in
requirements engineering," IEEE Systems Journal, In Press, 2014.
Chao FANG received the B.S. and M.S. degrees
from Xi‘an Jiaotong University, P.R. China, and the Ph.D. in Industrial Engineering from Ecole
Centrale Paris, France in 2011. He is currently
associate professor at Economics and Management School, Wuhan University, P.R.
China. His research interests include project
management, risk management, complex system modeling and simulation.

11
Franck MARLE received his MSc degree at
Ecole Centrale Lyon (1997) and the Ph.D. at Ecole Centrale Paris in 2002. He is professor in project
management at Ecole Centrale Paris. He is also
Director of the TOTAL Chair "Managing Procurement Risks in Complex Projects" since
April 2013. He is now conducting research works
about risk modeling in projects, interactions modeling and assessment, and decision-making in
project and multi-projects context.
Min Xie (F‘06)received the Ph.D. degree in
Quality Technology from Linkoping University, Sweden, in 1987. He is currently Chair Professor
at Department of Systems Engineering and
Engineering Management, City University of Hong Kong. His research focuses on statistical
quality and reliability engineering, and has
published more than 200 journal articles and eight books.