Adapting complex and clumsy CFD code to rapidly changing ...
This article was downloaded by:[Turku University Library]On: 20 September 2007Access Details: [subscription number 781060020]Publisher: Taylor & FrancisInforma Ltd Registered in England and Wales Registered Number: 1072954Registered office: Mortimer House, 37-41 Mortimer Street, London W1T 3JH, UK
Applied Spectroscopy ReviewsPublication details, including instructions for authors and subscription information:http://www.informaworld.com/smpp/title~content=t713597229
Photoacoustic Gas Analysis Using InterferometricCantilever MicrophoneTom Kuusela a; Jyrki Kauppinen aa Department of Physics, University of Turku, Turku, Finland
Online Publication Date: 01 September 2007To cite this Article: Kuusela, Tom and Kauppinen, Jyrki (2007) 'Photoacoustic GasAnalysis Using Interferometric Cantilever Microphone', Applied SpectroscopyReviews, 42:5, 443 - 474To link to this article: DOI: 10.1080/00102200701421755URL: http://dx.doi.org/10.1080/00102200701421755
PLEASE SCROLL DOWN FOR ARTICLE
Full terms and conditions of use: http://www.informaworld.com/terms-and-conditions-of-access.pdf
This article maybe used for research, teaching and private study purposes. Any substantial or systematic reproduction,re-distribution, re-selling, loan or sub-licensing, systematic supply or distribution in any form to anyone is expresslyforbidden.
The publisher does not give any warranty express or implied or make any representation that the contents will becomplete or accurate or up to date. The accuracy of any instructions, formulae and drug doses should beindependently verified with primary sources. The publisher shall not be liable for any loss, actions, claims, proceedings,demand or costs or damages whatsoever or howsoever caused arising directly or indirectly in connection with orarising out of the use of this material.
Dow
nloa
ded
By:
[Tur
ku U
nive
rsity
Lib
rary
] At:
08:1
3 20
Sep
tem
ber 2
007
Photoacoustic Gas Analysis UsingInterferometric Cantilever Microphone
Tom Kuusela and Jyrki Kauppinen
Department of Physics, University of Turku, Turku, Finland
Abstract: Theoretical considerations and a simple but realistic model of the function of
the cantilever-based photoacoustic trace gas system are presented. The essential
features of the cantilever dynamics, thermal characteristics, and noise models are
derived. Some other related constructions are shown with the practical implemen-
tations of the real system.
Keywords: Gas analysis, trace gas, photoacoustic, cantilever, interferometer, FTIR
INTRODUCTION
The photoacoustic effect is the process of acoustic wave generation in the
sample resulting from the absorption of photons. This process was invented
already at the end of the 1800s (1, 2) but first real applications were not intro-
duced until the 1960s (3, 4). The photoacoustic method has since been used to
study various chemical and physical phenomena in number of fields. Some of
the applications are trace gas analysis, spectroscopy of weak optical
transitions, and probing of an optically thick sample. To date, photoacoustic
spectroscopy is widely used in many areas of research and applications.
The basic theory behind photoacoustic detection is rather simple (5).
Light absorbed in a sample will excite a small fraction of the ground state
molecular population to higher energy levels. These excited states will sub-
sequently relax through a combination of radiative and nonradiative
pathways. The nonradiative part of the excitations will finally generate heat
in the localized region of the light beam and produce a pressure wave,
Received 20 April 2007, Accepted 24 April 2007
Address correspondence to Tom Kuusela, Department of Physics, University of
Turku, Vesilinnantie 5, 20014 Turku, Finland. E-mail: [email protected]
Applied Spectroscopy Reviews, 42: 443–474, 2007
Copyright # Taylor & Francis Group, LLC
ISSN 0570-4928 print/1520-569X online
DOI: 10.1080/00102200701421755
443
Dow
nloa
ded
By:
[Tur
ku U
nive
rsity
Lib
rary
] At:
08:1
3 20
Sep
tem
ber 2
007
which propagates away from the source. This pressure wave can be then
detected with a suitable sensor such as a microphone. Photoacoustic
detection is a unique method since it is a direct monitor of the nonradiative
relaxation channel and thus it complements spectroscopic techniques based
on absorption and fluorescence. The photoacoustic method is also an
extremely sensitive technique, with the ability to detect highly forbidden
optical transitions and trace components in a mixture of gases.
In this study we describe the key features and the theoretical backgrounds
of the photoacoustic trace gas system when using the cantilever microphone as
a pressure sensor.
PHOTOACOUSTIC DETECTION SYSTEM
The essential components of the apparatus used for photoacoustic gas analysis
or spectroscopy are a source of modulated light, a sample cell, a sensor for
detecting the acoustic signals, and the signal processing system.
Radiation Sources
The light source of the photoacoustic detection system is either a broadband
IR source, a continuous wave, or a pulsed laser. When using an IR source,
the radiation must be fed to the sample cell through a narrow band-pass
filter or monochromator. With a conventional lamp it is very simple to
generate lot of infrared power, but the modulation of the infrared source is
clumsy; in practice, the only method is to use a mechanical chopper,
although low-power semiconductor infrared emitters, which can be
modulated by current, are already available. With lasers, the amplitude and
frequency modulation is easily performed. However, the suitable wavelengths
needed for molecular excitations can be difficult to realize when using laser
sources.
Sample Cell Structures
The sample cell design depends on the type of the light source but the main
target is always to generate acoustic waves and couple the sensor to
acoustic excitations as efficiently as possible. All sample cells can be used
either in the nonresonant or resonant mode of operation. If the modulation
frequency is much lower than the lowest acoustical resonance frequency,
the cell is operated in a nonresonant mode. In this case, the sound wavelength
is much larger than the cell dimensions; thus, sound cannot propagate and
standing waves cannot form, and the average pressure in the cavity will
oscillate with the modulation frequency.
T. Kuusela and J. Kauppinen444
Dow
nloa
ded
By:
[Tur
ku U
nive
rsity
Lib
rary
] At:
08:1
3 20
Sep
tem
ber 2
007
For resonant operation, the modulation frequency is tuned to one of the
eigenresonances of the photoacoustic cell. If the eigenresonances are well
separated and the Q factor of the particular resonance to be used is large
enough, the selected resonance can be excited much more effectively than
the others. The set of resonance modes depends on the basic structure of the
cell. Three types of acoustic resonators have found widespread use in photo-
acoustic detection: Helmholz resonators, one-dimensional cylindrical resona-
tors, and cavity resonators (6).
The simplest Helmholz resonator consists of a cavity and an adjoining
neck, which opens to open air. When an air plug in the neck moves
outward, the pressure inside the cavity decreases, resulting in an inward-
directed force, which tries to restore the original state. An oscillation will
develop with the resonance frequency depending on the cross-sectional area
and the length of the neck and volume of the cavity. The amplification at
the resonance frequency depends on the viscous and thermal losses at the
wall of the neck and the radiation losses through the opening; in practice, it
does not exceed a value of 10. Since a Helmholz resonator cell has to be
isolated against outside noise, a simple cavity with a neck is not useful.
Therefore, the simplest practical applicable cell consists of two cavities
connected by a tube.
If the cross-sectional dimensions of a resonator are much smaller than the
acoustic wavelength, the excited sound filed develops a spatial variation only
along the length of the resonator. A narrow pipe or tube can be regarded as a
one-dimensional acoustic resonator. A pressure wave propagating in the pipe
will be reflected by open or closed end with opposite or same phase, and
through multiple reflections a standing wave will be formed corresponding
to the resonance situation. Pipe resonators are widely used in gas-phase
photoacoustics.
If the dimensions of a cavity are comparable with the acoustic wave-
length, then several distinct resonances can be generated. The standing
wave patterns and resonance frequencies depend strongly on the shape and
size of the cavity. Typical resonator constructions are cylinders and spheres
where various radial or spherical resonances are possible. Cylindrical
cavities are used with laser light sources.
Acoustic Sensors
The device coupling to the acoustic field and converting pressure changes to
voltage signal is the most critical part of the apparatus when looking for the
best sensitivity in trace gas analysis. Microphones normally used in photo-
acoustic applications can be divided into two main categories: capacitive
and optical. Capacitive microphones are either condenser or electret micro-
phones. Optical sensors are based on measuring the movements of either
elastic membrane or silicon cantilever using optical beam deflection method
Photoacoustic Gas Analysis 445
Dow
nloa
ded
By:
[Tur
ku U
nive
rsity
Lib
rary
] At:
08:1
3 20
Sep
tem
ber 2
007
or an interferometer. Besides these methods it is possible to accumulate the
absorbed energy not in the gas but in piezoelectric quartz crystals.
A condenser microphone produces an electrical signal when a pressure
wave impinging on the diaphragm pushes the diaphragm closer to the fixed
metal plate, thereby increasing the capacitance between the surfaces. The
capacitance change leads to a voltage signal, which increases with the bias
voltage and diaphragm area. Condenser microphones generally have very
flat frequency response and low distortion and respond well to pressure
impulses. The dielectric material between the condenser plates in this type
of microphone is air. The electret microphone works on the same principle
except that the bias voltage for the capacitor is provided by an electret, a
thin sheet of material with a permanent electric polarization; thus, no
external bias voltage is needed. Due to large capacitance per unit area
possible from electret materials, these microphones can be very small.
Both condenser and electret microphones have some fundamental limit-
ations that cannot be overcome (7–9). First, to increase the sensitivity of
the microphone, the gap between the elastic membrane and the backplate
cannot be decreased below certain limit. If the gap is very narrow, the gas
between the membrane and plate cannot flow freely because of viscous
effects; therefore, membrane movements are restricted. Secondly, the
tension of the membrane cannot decrease too much: if the membrane is
very flexible, the dynamic range of the sensor is extremely small. Increasing
of the membrane area also cannot improve the function of these microphones
since the larger area corresponds to larger movements of the membrane and
thus also larger volume changes in the closed sample cell where the micro-
phone is attached. This volume change decreases the magnitude of the
pressure pulses and no net increase in the sensitivity can be achieved. The
response of the membrane on the external pressure is also nonlinear due to
the fact that the material has to stretch out radially under pressure variations.
Finally, the output impedance of condenser and electret microphones is very
high, especially at low frequencies, necessitating the use of a very high input
impedance amplifier for further signal processing. In practice, the noise of the
best available amplifiers usually exceeds the noise generated from the transdu-
cer itself. Noise features can be improved by using higher modulation frequen-
cies since the noise sources, both intrinsic of the microphone and external
acoustic noise, show a characteristic 1/f frequency dependence. Unfortu-
nately, the photoacoustic signal is also inversely proportional to the modu-
lation frequency, and thus the signal-to-noise ratio of the gas microphone
cell is usually quite low. With resonator cell designs, like the Helmholz
resonator, signal-to-noise ratio can be significantly enhanced but then the
cell structure is more complicated.
The movement of the elastic membrane can be also measured optically
using either an optical beam deflection method (10) or an interferometric
technique (11). These methods eliminate the need for electronic detection
of the small capacitance changes in the condenser or electret microphone.
T. Kuusela and J. Kauppinen446
Dow
nloa
ded
By:
[Tur
ku U
nive
rsity
Lib
rary
] At:
08:1
3 20
Sep
tem
ber 2
007
In the optical beam approach, the beam of the He-Ne laser is focused either on
the reflecting diaphragm or pellicle mounted on the photoacoustic cell. The
pressure waves distort the surface of the diaphragm so that the intensity of
the reflected beam varies with the modulation frequency of the excitation
radiation. This variation is measured with an iris-photodiode or split-
photodiode assembly or position-sensing detector. In the interferometric
method, the reflecting diaphragm serves as one element of the Michelson or
Fabry-Perot type of interferometer. Pressure changes in the interferometer
cavity alter the spacing between mirrors, causing a shift in interference
fringe patterns, which are then detected with a photodiode. Although the
optical detection methods are totally different than condenser microphone
solutions, they have shown a sensitivity close to that of conventional micro-
phones. The noise in these optical microphones arises from several sources.
The most obvious sources are dark current in the photodiode and shot noise
from the laser. Also, fluctuations in the laser frequency, mode hoppings,
and variations in the interferometer spacing can have their own contribution
in the total noise, although they obviously are not major sources. The
diaphragm itself has its own mechanical limitations regardless of the
diaphragm movement detection method as described previously.
A cantilever does not have the same mechanical restrictions as a
membrane when using it for pressure wave detection in photoacoustic appli-
cations (7, 8). A cantilever has two main benefits. First, the string constant
of the vibrating cantilever can be quite easily 2 or 3 decades smaller than
one of the membrane, and it can be very easily adjusted by changing the
dimensions of the cantilever. Secondly, the dynamical range of the cantilever
is very large compared to the one of the membrane; i.e., the cantilever can
bend even tens of micrometers without any nonlinear or restricting effects.
The bending can be measured either using an optical beam or interferometer.
If a large dynamical range is needed, the optical beam method is not applicable
but the interferometer should be used. The interferometric measuring has an
inherently infinite range of dynamics since the bending can be determined
over as many wavelengths of the laser as needed. This large dynamic range
is directly related to the concentration range of the trace gas that can be
measured, an important feature of any gas detection and measure system.
When using a resonator cell, the absorbed energy is accumulated in the
acoustic mode of the resonator; i.e., in the gas. The absorbed power and the
measured signal are directly proportional to the quality factor of the
resonator. Because of intrinsic losses related to gas viscosity and other relax-
ation processes, the quality factor is clearly less than 100. Another option is to
absorb the energy in the sensitive element or sensor itself. Much higher quality
factor can be achieved if the absorbing element is piezoelectric quartz crystal
(12, 13). The inexpensive quartz tuning fork found on every digital watch
(resonance frequency 32,768 Hz) has a quality factor of 20,000 in a vacuum
and 8,000 in atmospheric pressure, much higher than in any resonator gas
cell. The most important feature of the quartz resonator is its immunity to
Photoacoustic Gas Analysis 447
Dow
nloa
ded
By:
[Tur
ku U
nive
rsity
Lib
rary
] At:
08:1
3 20
Sep
tem
ber 2
007
background acoustic noise. In general, the ambient acoustic noise is low above
10 kHz since the noise density follows a 1/f frequency dependence. At these
frequencies, the acoustic wavelength in air is about 1 cm or longer at lower fre-
quencies. Since the distance of the two prongs of the quartz tuning fork is less
than 1 mm, the sound waves from a distant source tend to apply a force in the
same direction upon the prongs, and no piezoelectrically active mode is excited.
Photoacoustic systems based on quartz resonators have a few drawbacks.
Since the resonance frequencies of the quartz resonators are moderately high,
only lasers can be used as a photoacoustic excitation source; infrared sources
based on conventional lamp or other blackbody radiator cannot be modulated
with such a high frequency. The modulation frequency has to be controlled
very accurately since the width of the resonance is very narrow. Even slight
drift in the frequency can erroneously decrease the signal significantly.
THEORY OF THE CANTILEVER OPERATION
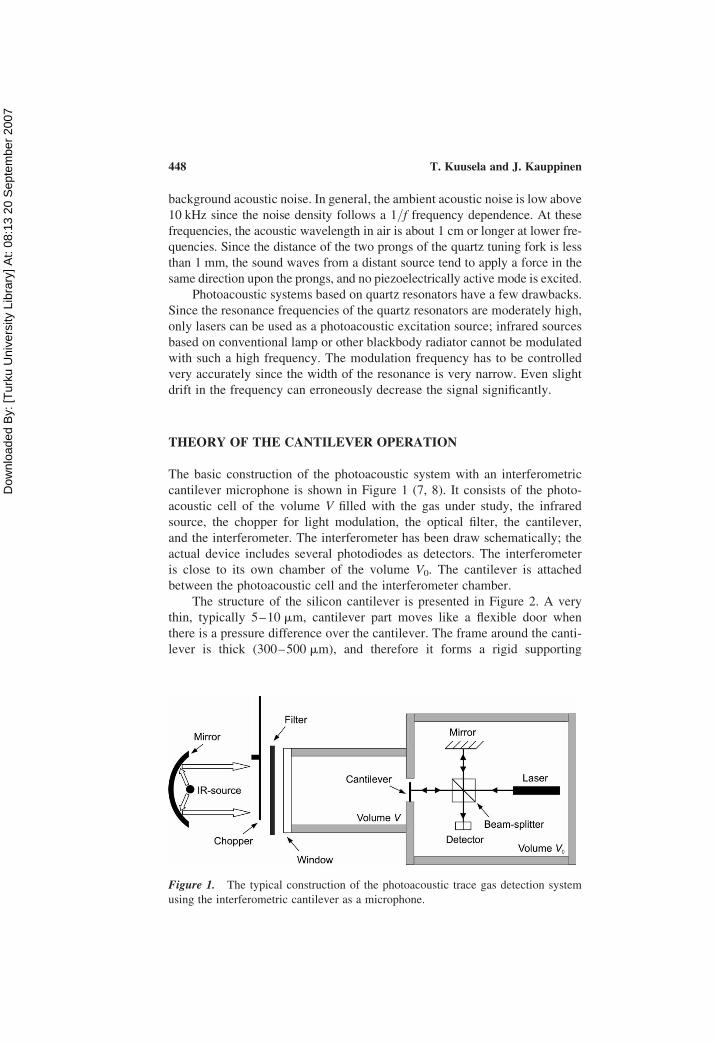
The basic construction of the photoacoustic system with an interferometric
cantilever microphone is shown in Figure 1 (7, 8). It consists of the photo-
acoustic cell of the volume V filled with the gas under study, the infrared
source, the chopper for light modulation, the optical filter, the cantilever,
and the interferometer. The interferometer has been draw schematically; the
actual device includes several photodiodes as detectors. The interferometer
is close to its own chamber of the volume V0. The cantilever is attached
between the photoacoustic cell and the interferometer chamber.
The structure of the silicon cantilever is presented in Figure 2. A very
thin, typically 5–10 mm, cantilever part moves like a flexible door when
there is a pressure difference over the cantilever. The frame around the canti-
lever is thick (300–500 mm), and therefore it forms a rigid supporting
Figure 1. The typical construction of the photoacoustic trace gas detection system
using the interferometric cantilever as a microphone.
T. Kuusela and J. Kauppinen448

Dow
nloa
ded
By:
[Tur
ku U
nive
rsity
Lib
rary
] At:
08:1
3 20
Sep
tem
ber 2
007
structure. There is a narrow gap (5–30 mm) between the frame and the canti-
lever on three sides. The length and width of the cantilever are a few milli-
meters. When the pressure in the surrounding gas varies, the cantilever
bends but it does not stretch. Therefore, it is very sensitive to pressure vari-
ations compared to the stretching of the elastic membrane.
Cantilever Dynamics
The cantilever can vibrate in several different modes. However, if we are only
interested in the frequency region below the first resonance frequency, the full
three-dimensional structure model can be replaced with a simple one-
dimensional point of mass model in the form of a harmonic oscillator.
Therefore, the equation of motion is
m€xþ D_xþ kx ¼ FextðtÞ ð1Þ
where m is the effective mass, D is the damping factor, and k is the effective
spring constant of the cantilever. Fext(t) is an external force acting on the can-
tilever. The displacement x from the equilibrium is defined at the free end of
the cantilever. As will be shown later, both the mass and the spring constant
are not solely determined by the structure of the cantilever in this model but
they also depend on the environment; i.e., the features of the photoacoustic
cell. The spring constant of the cantilever alone is
k0 ¼2
3hE
d
L
� �3
ð2Þ
Figure 2. Structure of the silicon cantilever and its frame.
Photoacoustic Gas Analysis 449
Dow
nloa
ded
By:
[Tur
ku U
nive
rsity
Lib
rary
] At:
08:1
3 20
Sep
tem
ber 2
007
where h is the width, L the length, and d the thickness of the cantilever, and E
is the Young’s modulus of the material (14).
If the external force in Eq. (1) is a simple sinusoid as Fext (t) ¼ F0 cos
(vtþ f), the displacement x(t) can be easily solved. The amplitude of the
sinusoidal oscillation of x(t) or frequency response is then
AðvÞ ¼F0
m
ffiffiffiffiffiffiffiffiffiffiffiffiffiffiffiffiffiffiffiffiffiffiffiffiffiffiffiffiffiffiffiffiffiffiffiffiffiffiffiffiffiffiffiffiffiðv2
0 � v2Þ2þ ðvD=mÞ2
q ð3Þ
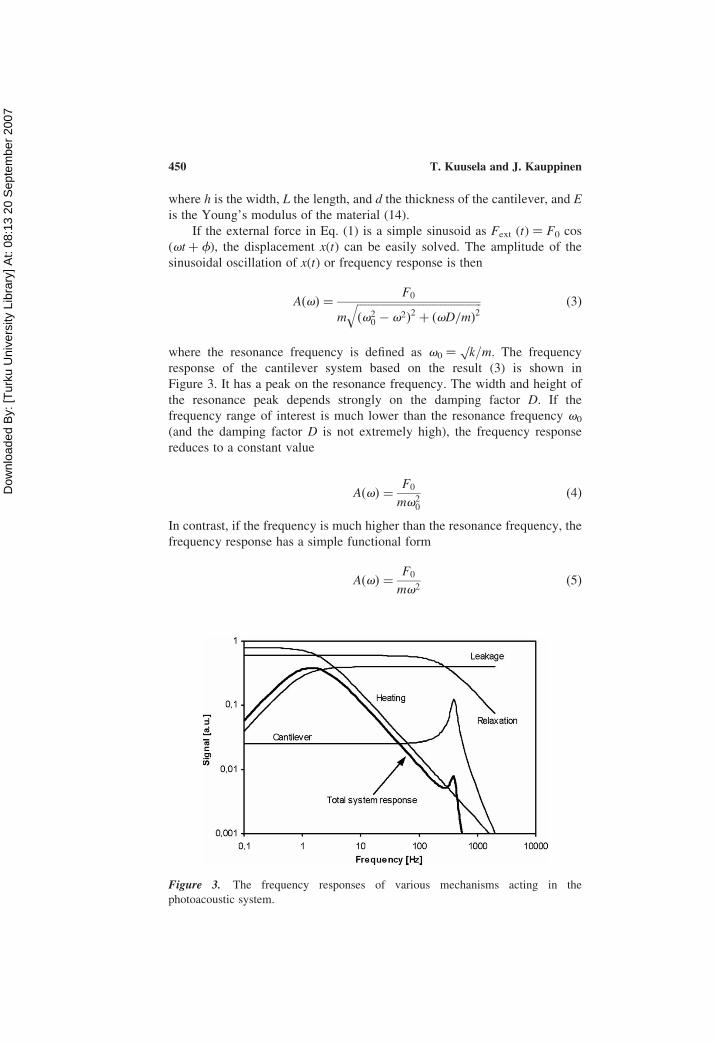
where the resonance frequency is defined as v0 ¼pk/m. The frequency
response of the cantilever system based on the result (3) is shown in
Figure 3. It has a peak on the resonance frequency. The width and height of
the resonance peak depends strongly on the damping factor D. If the
frequency range of interest is much lower than the resonance frequency v0
(and the damping factor D is not extremely high), the frequency response
reduces to a constant value
AðvÞ ¼F0
mv20
ð4Þ
In contrast, if the frequency is much higher than the resonance frequency, the
frequency response has a simple functional form
AðvÞ ¼F0
mv2ð5Þ
Figure 3. The frequency responses of various mechanisms acting in the
photoacoustic system.
T. Kuusela and J. Kauppinen450
Dow
nloa
ded
By:
[Tur
ku U
nive
rsity
Lib
rary
] At:
08:1
3 20
Sep
tem
ber 2
007
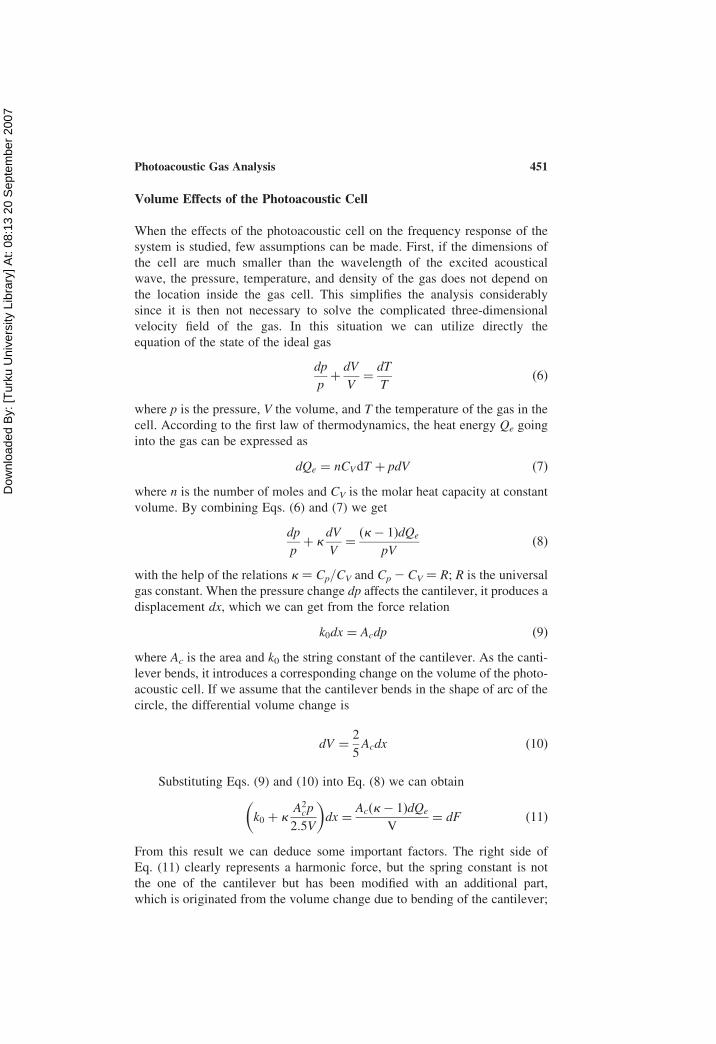
Volume Effects of the Photoacoustic Cell
When the effects of the photoacoustic cell on the frequency response of the
system is studied, few assumptions can be made. First, if the dimensions of
the cell are much smaller than the wavelength of the excited acoustical
wave, the pressure, temperature, and density of the gas does not depend on
the location inside the gas cell. This simplifies the analysis considerably
since it is then not necessary to solve the complicated three-dimensional
velocity field of the gas. In this situation we can utilize directly the
equation of the state of the ideal gas
dp
pþdV
V¼
dT
Tð6Þ
where p is the pressure, V the volume, and T the temperature of the gas in the
cell. According to the first law of thermodynamics, the heat energy Qe going
into the gas can be expressed as
dQe ¼ nCVdT þ pdV ð7Þ
where n is the number of moles and CV is the molar heat capacity at constant
volume. By combining Eqs. (6) and (7) we get
dp
pþ k
dV
V¼
ðk� 1ÞdQe
pVð8Þ
with the help of the relations k ¼ Cp/CV and Cp2 CV ¼ R; R is the universal
gas constant. When the pressure change dp affects the cantilever, it produces a
displacement dx, which we can get from the force relation
k0dx ¼ Acdp ð9Þ
where Ac is the area and k0 the string constant of the cantilever. As the canti-
lever bends, it introduces a corresponding change on the volume of the photo-
acoustic cell. If we assume that the cantilever bends in the shape of arc of the
circle, the differential volume change is
dV ¼2
5Acdx ð10Þ
Substituting Eqs. (9) and (10) into Eq. (8) we can obtain
k0 þ kA2cp
2:5V
� �dx ¼
Acðk� 1ÞdQe
V¼ dF ð11Þ
From this result we can deduce some important factors. The right side of
Eq. (11) clearly represents a harmonic force, but the spring constant is not
the one of the cantilever but has been modified with an additional part,
which is originated from the volume change due to bending of the cantilever;
Photoacoustic Gas Analysis 451
Dow
nloa
ded
By:
[Tur
ku U
nive
rsity
Lib
rary
] At:
08:1
3 20
Sep
tem
ber 2
007
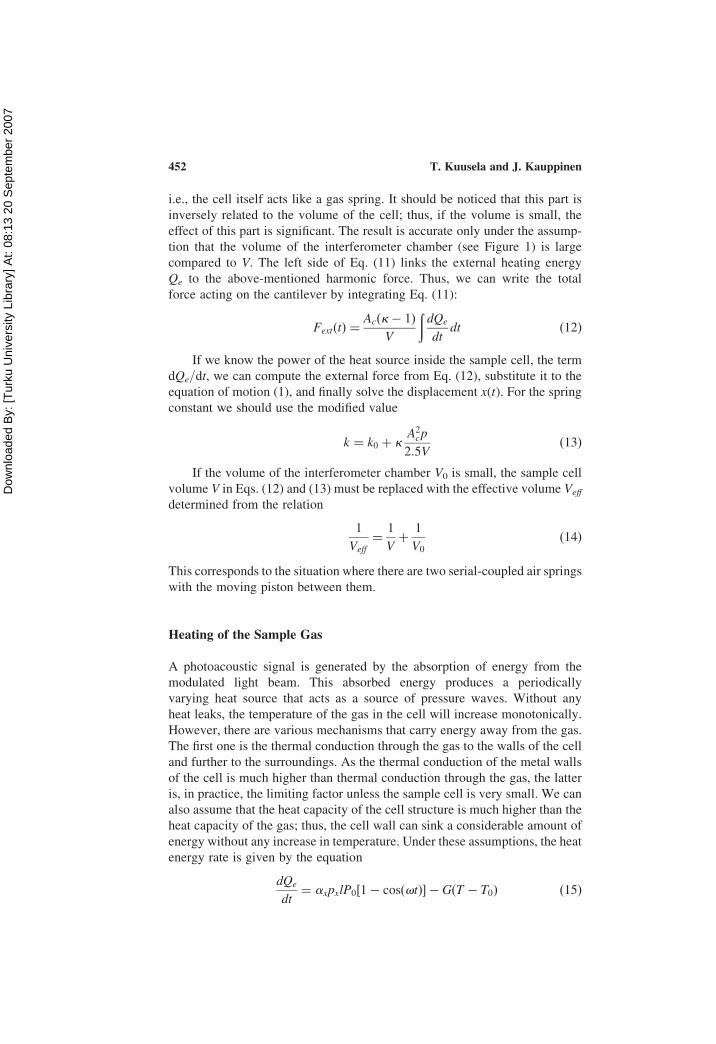
i.e., the cell itself acts like a gas spring. It should be noticed that this part is
inversely related to the volume of the cell; thus, if the volume is small, the
effect of this part is significant. The result is accurate only under the assump-
tion that the volume of the interferometer chamber (see Figure 1) is large
compared to V. The left side of Eq. (11) links the external heating energy
Qe to the above-mentioned harmonic force. Thus, we can write the total
force acting on the cantilever by integrating Eq. (11):
FextðtÞ ¼Acðk� 1Þ
V
ðdQe
dtdt ð12Þ
If we know the power of the heat source inside the sample cell, the term
dQe/dt, we can compute the external force from Eq. (12), substitute it to the
equation of motion (1), and finally solve the displacement x(t). For the spring
constant we should use the modified value
k ¼ k0 þ kA2cp
2:5Vð13Þ
If the volume of the interferometer chamber V0 is small, the sample cell
volume V in Eqs. (12) and (13) must be replaced with the effective volume Veff
determined from the relation
1
Veff
¼1
Vþ
1
V0
ð14Þ
This corresponds to the situation where there are two serial-coupled air springs
with the moving piston between them.
Heating of the Sample Gas
A photoacoustic signal is generated by the absorption of energy from the
modulated light beam. This absorbed energy produces a periodically
varying heat source that acts as a source of pressure waves. Without any
heat leaks, the temperature of the gas in the cell will increase monotonically.
However, there are various mechanisms that carry energy away from the gas.
The first one is the thermal conduction through the gas to the walls of the cell
and further to the surroundings. As the thermal conduction of the metal walls
of the cell is much higher than thermal conduction through the gas, the latter
is, in practice, the limiting factor unless the sample cell is very small. We can
also assume that the heat capacity of the cell structure is much higher than the
heat capacity of the gas; thus, the cell wall can sink a considerable amount of
energy without any increase in temperature. Under these assumptions, the heat
energy rate is given by the equation
dQe
dt¼ axpxlP0½1� cosðvtÞ� � GðT � T0Þ ð15Þ
T. Kuusela and J. Kauppinen452
Dow
nloa
ded
By:
[Tur
ku U
nive
rsity
Lib
rary
] At:
08:1
3 20
Sep
tem
ber 2
007
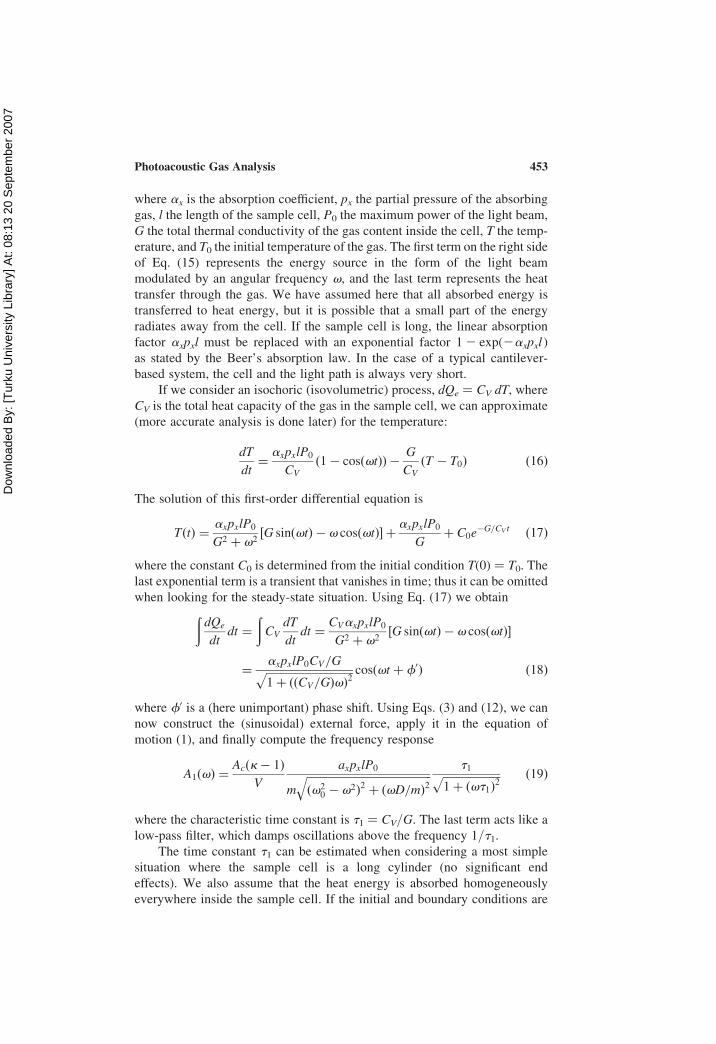
where ax is the absorption coefficient, px the partial pressure of the absorbing
gas, l the length of the sample cell, P0 the maximum power of the light beam,
G the total thermal conductivity of the gas content inside the cell, T the temp-
erature, and T0 the initial temperature of the gas. The first term on the right side
of Eq. (15) represents the energy source in the form of the light beam
modulated by an angular frequency v, and the last term represents the heat
transfer through the gas. We have assumed here that all absorbed energy is
transferred to heat energy, but it is possible that a small part of the energy
radiates away from the cell. If the sample cell is long, the linear absorption
factor axpxl must be replaced with an exponential factor 12 exp(2axpxl )
as stated by the Beer’s absorption law. In the case of a typical cantilever-
based system, the cell and the light path is always very short.
If we consider an isochoric (isovolumetric) process, dQe ¼ CV dT, where
CV is the total heat capacity of the gas in the sample cell, we can approximate
(more accurate analysis is done later) for the temperature:
dT
dt¼
axpxlP0
CV
ð1� cosðvtÞÞ �G
CV
ðT � T0Þ ð16Þ
The solution of this first-order differential equation is
TðtÞ ¼axpxlP0
G2 þ v2½G sinðvtÞ � v cosðvtÞ� þ
axpxlP0
Gþ C0e
�G=CV t ð17Þ
where the constant C0 is determined from the initial condition T(0) ¼ T0. The
last exponential term is a transient that vanishes in time; thus it can be omitted
when looking for the steady-state situation. Using Eq. (17) we obtainðdQe
dtdt ¼
ðCV
dT
dtdt ¼
CVaxpxlP0
G2 þ v2½G sinðvtÞ � v cosðvtÞ�
¼axpxlP0CV=Gffiffiffiffiffiffiffiffiffiffiffiffiffiffiffiffiffiffiffiffiffiffiffiffiffiffiffiffiffiffiffiffi1þ ððCV=GÞvÞ
2p cosðvt þ f0Þ ð18Þ
where f0 is a (here unimportant) phase shift. Using Eqs. (3) and (12), we can
now construct the (sinusoidal) external force, apply it in the equation of
motion (1), and finally compute the frequency response
A1ðvÞ ¼Acðk� 1Þ
V
axpxlP0
m
ffiffiffiffiffiffiffiffiffiffiffiffiffiffiffiffiffiffiffiffiffiffiffiffiffiffiffiffiffiffiffiffiffiffiffiffiffiffiffiffiffiffiffiffiffiðv2
0 � v2Þ2þ ðvD=mÞ2
q t1ffiffiffiffiffiffiffiffiffiffiffiffiffiffiffiffiffiffiffiffiffi1þ ðvt1Þ
2p ð19Þ
where the characteristic time constant is t1 ¼ CV/G. The last term acts like a
low-pass filter, which damps oscillations above the frequency 1/t1.The time constant t1 can be estimated when considering a most simple
situation where the sample cell is a long cylinder (no significant end
effects). We also assume that the heat energy is absorbed homogeneously
everywhere inside the sample cell. If the initial and boundary conditions are
Photoacoustic Gas Analysis 453
Dow
nloa
ded
By:
[Tur
ku U
nive
rsity
Lib
rary
] At:
08:1
3 20
Sep
tem
ber 2
007
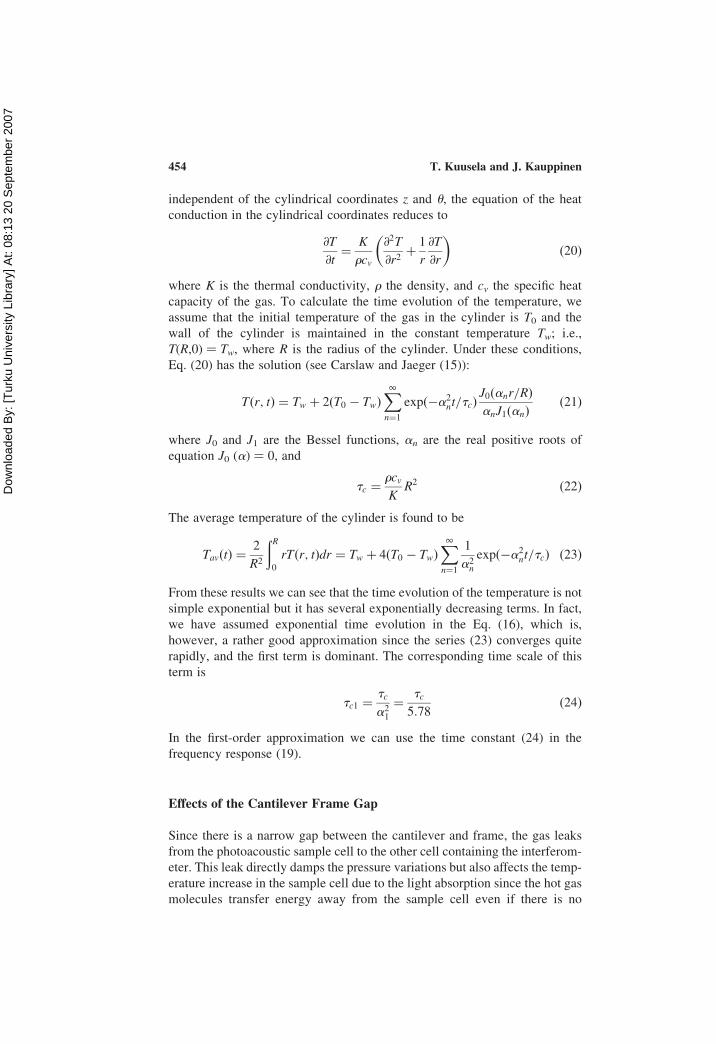
independent of the cylindrical coordinates z and u, the equation of the heat
conduction in the cylindrical coordinates reduces to
@T
@t¼
K
rcv
@2T
@r2þ1
r
@T
@r
� �ð20Þ
where K is the thermal conductivity, r the density, and cv the specific heat
capacity of the gas. To calculate the time evolution of the temperature, we
assume that the initial temperature of the gas in the cylinder is T0 and the
wall of the cylinder is maintained in the constant temperature Tw; i.e.,
T(R,0) ¼ Tw, where R is the radius of the cylinder. Under these conditions,
Eq. (20) has the solution (see Carslaw and Jaeger (15)):
Tðr; tÞ ¼ Tw þ 2ðT0 � TwÞX1n¼1
expð�a2nt=tcÞ
J0ðanr=RÞ
anJ1ðanÞð21Þ
where J0 and J1 are the Bessel functions, an are the real positive roots of
equation J0 (a) ¼ 0, and
tc ¼rcv
KR2 ð22Þ
The average temperature of the cylinder is found to be
TavðtÞ ¼2
R2
ðR0
rTðr; tÞdr ¼ Tw þ 4ðT0 � TwÞX1n¼1
1
a2n
expð�a2nt=tcÞ ð23Þ
From these results we can see that the time evolution of the temperature is not
simple exponential but it has several exponentially decreasing terms. In fact,
we have assumed exponential time evolution in the Eq. (16), which is,
however, a rather good approximation since the series (23) converges quite
rapidly, and the first term is dominant. The corresponding time scale of this
term is
tc1 ¼tc
a21
¼tc
5:78ð24Þ
In the first-order approximation we can use the time constant (24) in the
frequency response (19).
Effects of the Cantilever Frame Gap
Since there is a narrow gap between the cantilever and frame, the gas leaks
from the photoacoustic sample cell to the other cell containing the interferom-
eter. This leak directly damps the pressure variations but also affects the temp-
erature increase in the sample cell due to the light absorption since the hot gas
molecules transfer energy away from the sample cell even if there is no
T. Kuusela and J. Kauppinen454
Dow
nloa
ded
By:
[Tur
ku U
nive
rsity
Lib
rary
] At:
08:1
3 20
Sep
tem
ber 2
007
pressure difference between the cells. Both mechanisms have their own
contribution to the frequency response of the system. In the next we
sections, we study these mechanisms separately.
Gas Flow Due to Pressure Difference
The gas leak between the cells can be solved using the simple kinetic-
molecular model of an ideal gas. Let us assume that the volume of the
sample cell is V, pressure p, temperature T0, and the number of gas
molecules N, and in the interferometer chamber V0, p0, T0, and N0, respect-
ively. Thus we have assumed the temperature is equal in both cells. The
total area of the gap between the cantilever and the frame is Ag.
The next step is to compute the number of molecules colliding or passing
the area Ag. To begin, we assume that all molecules in the gas have the same
magnitude of velocity jvxj in the direction of the normal to the area Ag. Then
the number of molecules that collide with Ag during the small time interval dt
is equal to the number of molecules within a cylinder with base area Ag and
length jvxj dt. The volume of such a cylinder is Agjvxj dt. If the number of
molecules per unit volume (N/V ) is uniform, the number of molecules in
this cylinder is (N/V ) Agjvxj dt. On average, half of these molecules are
moving toward Ag and half are moving away, so the final number of
molecules going through the area Ag is (1/2) (N/V ) Agjvxj dt.
The net decrease of the number of molecules in the sample cell is now
�dN ¼1
2
N
V
� �Agjvxjdt �
1
2
N0
V0
� �Agjvxjdt ð25Þ
where the last term represents the molecules coming from the interferometer
chamber. Since the total number of molecules cannot change, dN0 ¼ 2dN.
For the system of all molecules in the gas, the total momentum change dPx
during dt is the number of passing molecules multiplied by 2mjvxj. The rate
of change of momentum is then
dPx
dt¼
NAgmv2x
Vð26Þ
But the rate of change of momentum equals the force exerted on the area Ag by
the gas molecules; thus, the force per unit area is the pressure
p ¼Nmv2xV
and p0 ¼N0mv
2x
V0
ð27Þ
By solving N and N0 from Eqs. (27) and substituting them into Eq. (25) we
obtain
�dp ¼1
2Agjvxj
p
V�
p0
V
� �dt þ dpext ð28Þ
Photoacoustic Gas Analysis 455
Dow
nloa
ded
By:
[Tur
ku U
nive
rsity
Lib
rary
] At:
08:1
3 20
Sep
tem
ber 2
007
where we have added the external (time-dependent) pressure term sourced by
the light absorption in the sample cell. The corresponding equation for p0 is
(without any external pressure source)
dp0 ¼1
2Agjvxj
p
V0
�p0
V0
� �dt ð29Þ
In practice, only the pressure difference between the sample cell and the
interferometer chamber is important. If we define pd ¼ p2 p0 we finally get
dpd
dtþ1
2Agjvxj
1
Veff
pd ¼dpext
dtð30Þ
where the effective volume is determined previously in Eq. (14). This first-
order differential equation can be easily solved. If we omit the exponential
transient solution of the homogenous equation and assume that the external
pressure is sinusoidal, i.e., pext (t) ¼ G0 sin(vt), the solution of Eq. (30) is
pdðtÞ ¼G0vt2ffiffiffiffiffiffiffiffiffiffiffiffiffiffiffiffiffiffiffiffiffi1þ ðvt2Þ
2p cosðvt þ f00Þ ð31Þ
where the characteristic time constant is
1
t2¼
1
2Agjvxj
1
Veff
ð32Þ
In reality jvxj or vx2 is not the same for all molecules. However, we can
replace vx2 with average value (vx
2)av. Since there is no real difference
between x-, y-, and z-directions in the ideal gas model, we can write
(vx2)av ¼ 1/3(v2)av. Now Eq. (27) becomes pV ¼ 2/3 N[1/2m(v2)av]. Using
the ideal gas equation pV ¼ nRT0, we can first obtain the average translational
kinetic energy of a gas molecule 1/2m(v2)av ¼ 3/2kBT0, where kB is the
Boltzmann constant and T is the temperature, and finally the root mean
square speed of a gas molecule of a mass m
vrms0 ¼ffiffiffiffiffiffiffiffiffiffiffiðv2Þav
p¼
ffiffiffiffiffiffiffiffiffiffiffiffi3kBT0
m
rð33Þ
which can be used in Eq. (32) to replace jvxj. Now we can write the frequency
response of the leakage of the gap:
A2ðvÞ ¼G0vt2ffiffiffiffiffiffiffiffiffiffiffiffiffiffiffiffiffiffiffiffiffi1þ ðvt2Þ
2p ð34Þ
This corresponds to a high-pass filter since A2(v) � 0 when v � 0, and A2-
(v) ! constant G0 when v � t2. Frequencies below 1/t2 are strongly
damped.
T. Kuusela and J. Kauppinen456
Dow
nloa
ded
By:
[Tur
ku U
nive
rsity
Lib
rary
] At:
08:1
3 20
Sep
tem
ber 2
007
Energy Transfer Due to Temperature Difference
Also in this case we can use a simple kinetic model of an ideal gas. We assume
now that the volume of the sample cell is V, pressure p, temperature T, and the
number of gas molecules N, and in the interferometer chamber V0, p, T0, and
N0, respectively. Thus, we have assumed that the pressure is equal in both
cells. Since the temperature inside the cells is not equal, the mean velocities
of the molecules are different, here vx and vx0. This velocity difference
produces net gas flow through the gap between the cantilever and the frame.
The internal energy of the gas in the cell is the number of molecules
passing through the area Ag multiplied by the kinetic energy of one
molecule 1/2mvx2. The net change of the internal energy U of the sample
cell is
�dU ¼1
2
N
V
� �Agvxdt
1
2mv2x
� ��1
2
N0
V0
� �Agvx0dt
1
2mv2x0
� �ð35Þ
The last term is the contribution of the molecules coming from the interferom-
eter chamber. As shown in the previous case, the average kinetic energy of a
gas molecule is equal to 3/2kBT, so for N molecules we can write the internal
energy
dU ¼3
2kBNdT ð36Þ
Since the pressure is equal in both cells, N0/V0 � N/V. By combining Eqs.
(35) and (36), replacing vx and vx0 with the root mean square speeds vrmsand vrms0 ((vx
2)av ¼ 1/3(v2)av ¼ 1/3vrms2 ), and adding the external time-
dependent temperature source Text, we obtain
dT ¼ �mAg
6kBV
1
3
� �3=2
ðv3rms � v3rms0Þ dt þ dText ð37Þ
Further, we can use the Eq. (33) to convert root mean square speeds to temp-
eratures in order to get the differential equation for temperature:
dT
dt¼ �
Ag
6V
ffiffiffiffiffikB
m
rT3=2 � T
3=20
h iþdText
dtð38Þ
Since this equation is nonlinear, its solution cannot be found analytically.
However, since we are only interested in the temperature difference
between the cells, we can write T ¼ T0þ Td, where Td is very small, and
approximate
T3=2 ¼ T0 1þTd
T0
� �� �3=2� T
3=20 1þ
3
2
Td
T0
� �ð39Þ
Photoacoustic Gas Analysis 457
Dow
nloa
ded
By:
[Tur
ku U
nive
rsity
Lib
rary
] At:
08:1
3 20
Sep
tem
ber 2
007
Now the equation for Td is
dTd
dt¼ �
Ag
4V
ffiffiffiffiffiffiffiffiffiffikBT0
m
rTd þ
dText
dtð40Þ
If we omit the exponential transient solution of the homogenous equation,
as we did in the previous case, and assume that the external temperature source
is sinusoidal, i.e., Text (t) ¼ H0 sin(vt), the solution of Eq. (40) is
TdðtÞ ¼H0vt3ffiffiffiffiffiffiffiffiffiffiffiffiffiffiffiffiffiffiffiffiffi1þ ðvt3Þ
2p cosðvt þ f000Þ ð41Þ
where the characteristic time constant is
1
t3¼
Ag
4ffiffiffi3
pV
ffiffiffiffiffiffiffiffiffiffiffiffi3kBT0
m
r¼
Ag
4ffiffiffi3
pVvrms0 ð42Þ
and the corresponding frequency response
A3ðvÞ ¼H0vt3ffiffiffiffiffiffiffiffiffiffiffiffiffiffiffiffiffiffiffiffiffi1þ ðvt3Þ
2p ð43Þ
It should be noted that the functional form of the frequency response (43)
is equal to the one of Eq. (34). In Eqs. (35) and (36) we have assumed that the
internal energy of the interferometer chamber is constant. If more precise
analysis is done (not shown here), the only modification in our first-order
approximation is that the sample cell volume V in Eq. (42) should be
replaced with the effective volume Veff.
If we compare the characteristic time scales (32) and (42), we find that
they are very similar; the only difference is the factor of 2. Although the
two processes, gas flow due to pressure difference and temperature difference,
have been treated separately, the total mechanism can be regarded as a serial
mechanism of these two processes. Then the effective time constant is
1
t23¼
1
t2þ
1
t3¼
3
2
Ag
4ffiffiffi3
pVeff
vrms0 ¼3Ag
4ffiffiffik
pVeff
vsound ð44Þ
where we have replace the root mean square molecular velocity with the sound
velocity in the gas (vrms0 ¼p3/kvsound). As long as the gas flow through the
gap between the cantilever and the frame is low enough, the above-described
analysis is valid. If the flow increases, there is a limit for gas flow; namely, the
sound velocity. After that limit, the flow does not depend on the pressure (or
temperature) difference.
T. Kuusela and J. Kauppinen458
Dow
nloa
ded
By:
[Tur
ku U
nive
rsity
Lib
rary
] At:
08:1
3 20
Sep
tem
ber 2
007
Relaxation Mechanism from Light Absorption to Heat
When light enters to the sample cell, it will excite a small fraction of the
molecules in the ground state to higher energy levels. These excited states
will relax through both radiative and nonradiative pathways, but only the non-
radiative part of the excitations will generate heat. The pathways can be very
complex and the contribution of each path could be very difficult to estimate.
The relaxation time from the absorption to heat generation depends on the
complexity of the pathway and the energy levels of the excited states.
However, the total relaxation process can be modeled using one effective
relaxation time constant. The process acts like a low-pass filter whose
frequency response is
A4ðvÞ ¼J0ffiffiffiffiffiffiffiffiffiffiffiffiffiffiffiffiffiffiffiffiffi
1þ ðvt4Þ2
p ð45Þ
where t4 is the effective relaxation time constant. Typically the relaxation
time is less than 1 ms and therefore it is not important if the operation
frequency is well below the characteristic frequency 1/t4, as it is in cantile-
ver-based systems. However, in the cell configurations utilizing resonances
on the frequency range of kilohertz and especially in quartz-enhanced photo-
acoustic devices, where the modulation frequency is typically tens of
kilohertz, relaxation processes significantly reduces the sensitivity, and the
responsitivity depends strongly on the gas mixture.
The frequency response of the complete system is the product of the
responses of each separate mechanism and process described in Eqs. (19),
(34), (43), and (45). The two responses can be combined with the help of
Eq. (44). Thus, we obtain the total frequency response (the frequency
responses (34), (43), and (45) must be divided by G0, H0, and J0 in order to
obtain transfer functions):
AtotðvÞ ¼Acðk� 1Þ
V
axpxlP0
m
ffiffiffiffiffiffiffiffiffiffiffiffiffiffiffiffiffiffiffiffiffiffiffiffiffiffiffiffiffiffiffiffiffiffiffiffiffiffiffiffiffiffiffiffiffiðv2
0 � v2Þ2þ ðvD=mÞ2
q t1ffiffiffiffiffiffiffiffiffiffiffiffiffiffiffiffiffiffiffiffiffi1þ ðvt1Þ
2p
vt23ffiffiffiffiffiffiffiffiffiffiffiffiffiffiffiffiffiffiffiffiffiffiffi1þ ðvt23Þ
2p 1ffiffiffiffiffiffiffiffiffiffiffiffiffiffiffiffiffiffiffiffiffi
1þ ðvt4Þ2
pð46Þ
The contribution of each response is shown in Figure 3. The cantilever
itself has flat frequency response until the resonance frequency, where it has
a sharp peak. On lower frequencies, the gas leakage through the gap
between the cantilever and the frame strongly decreases the sensitivity of
the system. The heating mechanism of the sample gas drops the sensitivity
at the higher frequencies. As a combination of all mechanisms, the total
system typically has a wide maximum in the frequency range of 1–10 Hz.
Experiments with various sample cells have demonstrated that observed
frequency responses can be well fitted to Eq. (46).
Photoacoustic Gas Analysis 459
Dow
nloa
ded
By:
[Tur
ku U
nive
rsity
Lib
rary
] At:
08:1
3 20
Sep
tem
ber 2
007
NOISE CHARACTERISTICS
The sensitivity of the trace gas detection system is a most important
parameter, but high responsivity itself does not guarantee that the system is
really useful for measuring small gas concentrations. As important factor is
the noise level or signal-to-noise ratio (SNR). There are four noise sources
of the cantilever-based photoacoustic systems: acceleration noise, acoustical
noise, Brownian noise, and electrical noise.
Acceleration Noise
The acceleration noise is generated from the movements of the cantilever
because of the external disturbances acting on the system. Typically these dis-
turbances are low-frequency vibrations of the environment that couple directly
to the support structure of the device and thereby to the cantilever. Only such
acceleration components that are perpendicular to the surface of the cantilever
can make the cantilever bend and produce noise. The signal-to-noise ratio can
be determined as
SNRðvÞ ¼AtotðvÞ
Noise amplitude: ð47Þ
In the case of external vibration affecting the cantilever we can write
DF ¼ mDa ¼ rcAcdDa ¼ kDx; ð48Þ
where the mcant is the mass of the cantilever, Da is the amplitude of the accel-
eration noise, Dx the corresponding movement, and rc the material density of
the cantilever. If vt1 � 1, vt23 � 1, and vt4 � 1, the frequency response
(46) can be simplified. By solving Dx from Eq. (48) and using it as noise
amplitude in Eq. (47) we obtain
SNRaccelðvÞ ¼Acðk� 1ÞaxpxlP0
V
1
vm
ffiffiffiffiffiffiffiffiffiffiffiffiffiffiffiffiffiffiffiffiffiffiffiffiffiffiffiffiffiffiffiffiffiffiffiffiffiffiffiffiffiffiffiffiffiðv2
0 � v2Þ2þ ðvD=mÞ2
q 1
rcAcdDa=k
¼ðk� 1ÞaxpxlP0
vðm=kÞffiffiffiffiffiffiffiffiffiffiffiffiffiffiffiffiffiffiffiffiffiffiffiffiffiffiffiffiffiffiffiffiffiffiffiffiffiffiffiffiffiffiffiffiffiðv2
0 � v2Þ2þ ðvD=mÞ2
qVrcdDa
: ð49Þ
In the limit v � v0, i.e., when we are looking for the frequencies below the
resonance of the cantilever, SNR is further reduced to (v02 ¼ k/m)
SNRaccelðvÞ �ðk� 1ÞaxpxlP0
vVrcdDað50Þ
It should be noted that the result (50) does not depend on the area or spring
constant of the cantilever. The easiest way to increase SNR is to decrease
T. Kuusela and J. Kauppinen460
Dow
nloa
ded
By:
[Tur
ku U
nive
rsity
Lib
rary
] At:
08:1
3 20
Sep
tem
ber 2
007
the cell volume V, but a very small cell can produce other problems, like fast
cooling of the sample gas lowering the sensitivity.
Acoustical Noise
Acoustical noise can be generated from external acoustical waves, which leak
to the sample cell through holes in the construction, but in normal sample cell
design this is rather rare situation. In practice, high-frequency mechanical
vibrations often produce acoustical noise if the structure of the sample cell
or other parts, like tubes and valves connected to it, act like a microphone;
i.e., their walls or sealings are so flexible that they can vibrate under sound
pressure. As in the previous case, we can write for the noise amplitude
DF ¼ AcDp ¼ kDx ð51Þ
where Dp is the amplitude of the acoustical pressure noise, and the
corresponding SNR is
SNRacoustðvÞ ¼ðk� 1ÞaxpxlP0
vðm=kÞffiffiffiffiffiffiffiffiffiffiffiffiffiffiffiffiffiffiffiffiffiffiffiffiffiffiffiffiffiffiffiffiffiffiffiffiffiffiffiffiffiffiffiffiffiðv2
0 � v2Þ2þ ðvD=mÞ2
qVDp
�ðk� 1ÞaxpxlP0
vVDpð52Þ
where the last version is the low-frequency limit. This is very similar to the
acceleration SNR in Eq. (49) or Eq. (50).
Brownian Noise
The cantilever can be regarded as a one-dimensional harmonic oscillator
immersed in a viscous medium when the equation of motion can be written as
m€xþ D_xþ kx ¼ FextðtÞ þ FthðtÞ ð53Þ
where Fth(t) is the random force due to thermal fluctuations (16–18). Since
the thermal fluctuations are mediated by collisions between the molecules
in the medium and the cantilever, the random forces are completely uncorre-
lated for a time scale much longer than the mean collisions time. The fluctu-
ating force Fth(t) comes about because of the randomness of the individual
impacts from the molecules that make up the medium responsible for the
deterministic friction force 2Dx, as proven by the fluctuation-dissipation
theorem (19).
In thermodynamic equilibrium, if we assume that force on the cantilever
is solely thermal in origin, the expectation value of the potential energy of the
cantilever k1/2kx2 (t)l is equal to 1/2kBT as long as �v � kBT. As previously
Photoacoustic Gas Analysis 461
Dow
nloa
ded
By:
[Tur
ku U
nive
rsity
Lib
rary
] At:
08:1
3 20
Sep
tem
ber 2
007
shown, x(t) in Eq. (53) can be considered to be the output of a linear
time-invariant system H(v) for an input Fth(t) and transfer function
HðvÞ ¼1
�mv2 þ iDvþ kð54Þ
The power spectral density of x(t) is given by
SðvÞ ¼ jHðvÞj2SthðvÞ ¼1
ðk � mv2Þ2þ D2v2
SthðvÞ ð55Þ
where Sth(v) is the power spectral density of Fth(t). Using Eq. (55) we can
derive the expectation value of the potential energy in the frequency domain:
1
2kBT ¼
1
2kkx2ðtÞl ¼
1
2k1
2p
ð1�1
SðvÞdv
¼1
4pk
ð1�1
SthðvÞdv
ðk � mv2Þ2þ D2v2
ð56Þ
Assuming that Fth(t) is white noise with a spectral density given by a
constant s2, we obtain, after computing the integral in Eq. (56),
1
2kBT ¼
ks2
4p
p
mDv2ð57Þ
and therefore we have the relation s2 ¼ 2kBTD. Thus, we have the power
spectral density
SðvÞ ¼2kBTD
ðk � mv2Þ2þ D2v2
ð58Þ
For signal-to-noise ratio we need the root mean square amplitude of the
cantilever movement, which is the square root of the power spectral density
(whose unit is m2/Hz) either multiplied with the measurement bandwidth B
or divided with the measurement time tm. In the low-frequency and small
damping limit we obtain
Dxrms ¼
ffiffiffiffiffiffiffiffiffiffiffiffiffiffikðDxÞ2l
q¼
ffiffiffiffiffiffiffiffiffiffiffiffiffiffiffiffiSðvÞ=tm
p¼
ffiffiffiffiffiffiffiffiffiffiffiffiffi2kBTD
k2tm
r¼
ffiffiffiffiffiffiffiffiffiffiffiffiffiffiffiffiffi2kBT
mv30Qtm
sð59Þ
where the quality Q factor is given by Q ¼ v0/Dv ¼ v0m/D, where Dv is the
half-width of the resonance peak. The SNR with Brownian noise, according to
Eq. (47), is
SNRBðvÞ ¼Acðk� 1ÞaxpxlP0
vVkffiffiffiffiffiffiffiffiffiffiffiffiffiffiffiffiffiffiffiffiffiffiffiffiffiffiffiffiffi2kBT=mv
30Qtm
p ¼Acðk� 1ÞaxpxlP0
vVffiffiffiffiffiffiffiffiffiffiffiffiffiffiffiffiffiffiffiffiffiffiffiffiffiffiffiffi2kBTk=v0Qtm
p ð60Þ
From the result (60), we can see that the SNRB can be significantly
increased either by decreasing the volume V of the sample cell or increasing
theQ factor (in practice, decreasing the damping factorD). TheQ factor of the
T. Kuusela and J. Kauppinen462
Dow
nloa
ded
By:
[Tur
ku U
nive
rsity
Lib
rary
] At:
08:1
3 20
Sep
tem
ber 2
007
cantilever itself, measured in vacuum conditions, is high, typically several
hundreds. When the cantilever is in the gas-filled chamber, the effective Q
factor is only 5–10 since the gas flow around the cantilever damps the
movements of the cantilever rather efficiently. The Q factor can be artificially
increased by introducing external force in Eq. (53), which is directly related to
the velocity of the cantilever (20–23). Normally this method has been used to
sharpen the resonance peak of the AFM cantilever when the signal amplitude
is increased but also the Brownian noise; thus, there is no net effect on the
signal-to-noise ratio. In this case, where the operation frequency is well
below the resonance, the desired effect is to decrease Brownian noise.
Higher Q factor accumulates noise to the resonance peak when the noise on
other frequencies decreases since the total Brownian noise integrated over
all frequencies is constant.
The signal-to-noise ratio can also be written in the form
SNRBðvÞ ¼Acðk� 1ÞaxpxlP0
vVffiffiffiffiffiffiffiffiffiffiffiffiffiffiffiffiffiffiffiffiffi2 kBTD=tm
p ð61Þ
From this form we can realize that actually SNR does not depend on the spring
constant k; the only parameter directly related to the features of the cantilever
is the area Ac. In fact, the damping factor D is the most important parameter
when considering SNR for Brownian noise. In a free air condition, the
damping factor D is directly related to the cantilever area Ac but when the can-
tilever is operating inside the closed cell the dependence is different. In all
cases, however, the damping factor increases when increasing the cantilever
area.
We can thus conclude that the spring constant can be easily increased in
such a manner that the acceleration, acoustical and especially Brownian noise,
if the first ones can be efficiently eliminated, dominates over the electrical
noise. For traditional membrane-based microphones, the electrical noise
always sets the limits for smallest detectable signal.
Electrical Noise
The electrical noise is originated from various sources on the sensor system.
The photodiodes used in the interferometer have their own noise contribution
because of the dark current, and the photodiode amplifier some input noise,
which can be minimized by using a low-noise version of operational ampli-
fiers. The interferometer laser has mainly shot noise. All these noise sources
have different frequency characteristics. In practical implementations of the
cantilever-based photoacoustic detection systems, the level of electrical
noise is clearly lower than all other noise types. If the external vibrations
and acoustical disturbances can be eliminated, Brownian noise is the main
noise source.
Photoacoustic Gas Analysis 463
Dow
nloa
ded
By:
[Tur
ku U
nive
rsity
Lib
rary
] At:
08:1
3 20
Sep
tem
ber 2
007
EXPERIMENTS
The cantilever microphone has been used in various photoacoustic configur-
ations. In most cases, there is no need to optimize the cantilever itself, but
the structure and dimensions of the sample cell must be selected to fulfill
the special demands of the different applications.
Experiments with Infrared Source
The first experiments using a cantilever microphone were performed with an
infrared light source (8). The length of the sample cell was 100 mm and the
diameter 10 mm. The IR radiation was fed to the sample cell through band-
pass filter with cut-on and cut-off wavelengths of 2.94 and 3.85 mm;
methane has a strong absorption band in this range. The resonance
frequency of the cantilever inside the sample cell was 470 Hz and the modu-
lation frequency of the infrared source was 118 Hz, accomplished by using a
mechanical chopper. The sample cell was filled with a mixture of nitrogen and
methane, where concentration of methane was 10+ 2 ppm, and the total
pressure was 0.6 atm. The observed SNR was about 1000 with a measurement
time of 0.74 s and about 12,000 with a measurement time of 100 s. In the last
case, the detection limit was 0.8 ppb. Further, 10 ppm concentration of
methane corresponds to 25 nm amplitude of the cantilever, pressure change
of 2 � 1027 Pa, or temperature increase of 2 � 1029 K. The design of the
system was not optimal since, for example, the gap between the frame and
the cantilever was rather large, 30 mm, and therefore the cut-off frequency
due to gas leakage was approximately 50 Hz. By decreasing the gap, it is
possible to decrease the detection limit significantly. These first results
already show that cantilever-based photoacoustic method is most promising
for trace gas measurements.
Experiments Using Tunable Diode Laser Sources
Tunable DFB (distributed feedback) laser diodes as a light source are potential
when constructing compact, selective, highly sensitive, and relatively low-
cost trace gas analysis devices. The system configuration with laser sources
is quite different when comparing with the photoacoustic detection with
traditional IR sources.
First, the laser modulation is accomplished in a different manner. It
would be possible to modulate electrically the light intensity by adjusting
the laser current but the better method is to modulate the output wavelength
of the laser light. In practice, the mean wavelength of the laser source is
positioned on the center of the absorption line of the analyzed gas by
adjusting the laser DC current and the temperature of the laser chip.
T. Kuusela and J. Kauppinen464
Dow
nloa
ded
By:
[Tur
ku U
nive
rsity
Lib
rary
] At:
08:1
3 20
Sep
tem
ber 2
007
Typically, the temperature adjustment slope is 0.1–0.2 nm/K. The fast
wavelength modulation is accomplished by adding a sinusoidal small-
amplitude current at the frequency f to the DC driving current of the
laser. The current tuning factor is 0.01–0.02 nm/mA. The modulation
current is adjusted to make the laser output line sweep back and forth
across the absorption line of the gas. The photoacoustic signal is
generated by the line absorption at the frequency 2f but the photoacoustic
background signal from windows, walls of the sample cell, and the
cantilever itself appears at the frequency f; thus, it is possible to
eliminate background effects by picking only the signal at 2f.
Secondly, the sample cell should be designed for the laser source; i.e., the
diameter should be so small that the laser beam fills it as well as possible. This
maximizes the response in the gas and guarantees the best performance of the
system.
The first study with a cantilever microphone and tunable laser source
was realized using non-optimal sample cell structure (24, 25) for CO2 gas
concentration measurements. The diameter of the cells was 10 mm and
the volume 8 cm3. The laser beam was collimated with a fiber collimator
and fed to the cell through a calcium window. The laser beam reflected
from the silver-coated cantilever and thus travelled twice the sample cell.
The wavelength of the telecommunication laser was 1572 nm and the
output power about 50 mW. Around this wavelength there are three
rotational absorption lines of CO2. None of these lines is very strong, but
they were selected because a suitable telecommunication laser is
available. When using the strongest line at the total pressure of 250
mbar, the minimum detectable CO2 mole fraction was 7.2 ppm with the
measurements time of 110 s. The detection limit was estimated from the
noise level of the system (SNR ¼ 1).
Slightly better results were observed with another sample cell structure
(26, 27). The cell diameter was 3 mm and the length 40 mm; the total
volume including the small buffer was 1.7 cm3. The laser source was the
same as in a previous study (24, 25). With the output power of 34 mW, the
detection limit for CO2 was 4.0 ppm. The output power of the diode laser
can be increased by amplifying the laser light with an ytterbium-erbium
co-doped fiber amplifier. The nominal maximal output power was 1 W, but
in practice the maximal power transmitted through the cell was
650–700 mW. At the power of 600 mW, the detection limit for CO2 was
0.23 ppm. These figures can be used to estimate the detection limit of other
gases by utilizing the data of their line strengths. At the power of 30 mW,
the corresponding limits are 69 ppb for CH4, 33 ppb for NH3, and 3.6 ppm
for CO. In this study it was also observed that the photoacoustic response
depends on the solvent gas: when using similar CO2 concentrations, the photo-
acoustic signal was 60% lower in nitrogen than in argon.
The similar cell structure (length 61 mm, diameter 3 mm) has been used
for sensitive oxygen detection (28). As a light source, a tunable DFB diode
Photoacoustic Gas Analysis 465
Dow
nloa
ded
By:
[Tur
ku U
nive
rsity
Lib
rary
] At:
08:1
3 20
Sep
tem
ber 2
007
laser (output power 30 mW) and a VCSEL (vertical-cavity surface-emitting;
output power 0.5 mW) laser were used, both operating near 760 nm. Unfortu-
nately, the only absorption band of oxygen within the spectral range covered
by diode lasers is a weak magnetic dipole transition at this wavelength, and
therefore low detection limits are difficult to achieve. However, the high sen-
sitivity of photoacoustic method with a cantilever-enhanced technique can
provide a potential alternative over traditional absorption methods. The
noise-equivalent detection limits for oxygen were 20 ppm with the DFB
laser and 500 ppm with the VCSEL when the measurement time was 68 s,
corresponding to average of 100 individual FFT spectra. These figures point
out that for practical demands in oxygen sensors, for example, in biomedicine,
the demonstrated sensitivity is sufficient. Some VCSEL lasers can also operate
at significantly longer wavelengths where stronger absorption lines of many
interesting gases exist, and thus much higher sensitivities can be expected.
However, currently, such VCSELs have very low output power or they
must be operated at cryogenic temperatures, and they are also very
expensive. In the future we can assume that the manufacturing technology
of VCSELs will further develop when they are very promising components
for photoacoustic applications.
Currently, the best result when using cantilever-enhanced photoacoustic
method with laser source is the detection limit of 0.33 ppm for CO2 (29).
The output power of the DFB laser was 30 mW and the measurement time
100 s. The achieved normalized noise equivalent sensitivity of
1.7 � 10210cm21 W/pHz is the best ever reported with laser-based photoa-
coustic trace gas detectors. The improvement of the detection limit was
achieved by optimizing the cell size and structure, cantilever dimensions,
and the interferometer measurement system. However, there are still possibi-
lities to further improve the performance by optimizing the total pressure in
the photoacoustic cell together with the depth and the symmetry of the laser
wavelength modulation.
Lindley et al. (30) made comparisons between different photoacoustic cell
structures and microphones. In the first setup they used a hollow 80-mm
stainless steel tube, which acted as an acoustic resonator; the resonance
frequency was 2 kHz. The microphone was a conventional electret capacitor
microphone. The light source was a diode laser operating at a wavelength
of 1530 nm and output power of 30 mW. The wavelength was selected to
match the combined rotational-vibrational line of acetylene. The second cell
configuration consisted of two cylindrical acoustic resonator flow tubes that
were 5.5 mm in diameter. Both tubes housed a microphone but the laser
radiation was directed through only one to generate the photoacoustic
signal. The resonance frequency of the tubes was 4 kHz. By subtracting the
signal of the reference cell from the one of the photoacoustic cells would
remove any noise components that are coherent in both resonators. The
third cell design contained a cantilever pressure sensor attached to the 115-
mm cylindrical copper tube with a diameter of 3 mm. This configuration
T. Kuusela and J. Kauppinen466
Dow
nloa
ded
By:
[Tur
ku U
nive
rsity
Lib
rary
] At:
08:1
3 20
Sep
tem
ber 2
007
was used well below the acoustic resonance frequency of the cell and the
mechanical resonance of the cantilever. The same laser source was used in
all three cell designs but the modulation scheme was different: for the first
and second systems, the amplitude of the laser output was modulated at the
resonance frequency of the acoustical resonator, but in the case of the cantile-
ver microphone, the wavelength of the light was modulated. The results from
these three different setups clearly demonstrated that the cantilever-based
microphone in the non-resonator cell was the most sensitive for trace gas
measurements. In fact, the cantilever microphone was 100 times better than
either the differential or single-microphone cells. Superior performance of
the cantilever cell demonstrates that it is less vulnerable to residual ambient
noise under conditions where traditional microphone cell performances are
compromised.
Cantilever Microphone in FTIR Applications
Low-resolution Fourier-transform infrared (FTIR) spectrometers are the best
instruments for trace gas analysis when a broadband black-body radiation
source and a normal absorption technique is used. Currently, modern FTIR
gas analyzers are already working very close to their theoretical limits and
thus the only possibility to improve their performance is to use new technol-
ogy. Photoacoustic sensors are seldom used in gas-phase FTIR, but their
benefits have been demonstrated in solid-phase FTIR spectroscopy. Photo-
acoustic detectors based on conventional condenser microphones normally
do not have such a high sensitivity as needed for FTIR applications. It is
possible to enhance the sensitivity using acoustical resonances of the
sample cell, but such devices are not useful for FTIR purposes because
FTIR systems require a wide frequency band. However, the cantilever
pressure sensor has a sensitivity even several orders higher than the conven-
tional microphones, and the frequency band is wide.
Typical conventional gas-phase FTIR spectrometers consist of a large
White multipass cell of few liters in volume and very expensive mirrors.
They also severely suffer nonlinearities due to Beer’s law because the absorp-
tion path length can be several meters. This can be a very serious limitation
when analyzing wet gases due to strong water absorption over a wide wave-
length range. With cantilever-based microphones, the cell can be very small
in volume and the absorption path length only few millimeters, which practi-
cally cancels all nonlinearities and water problems.
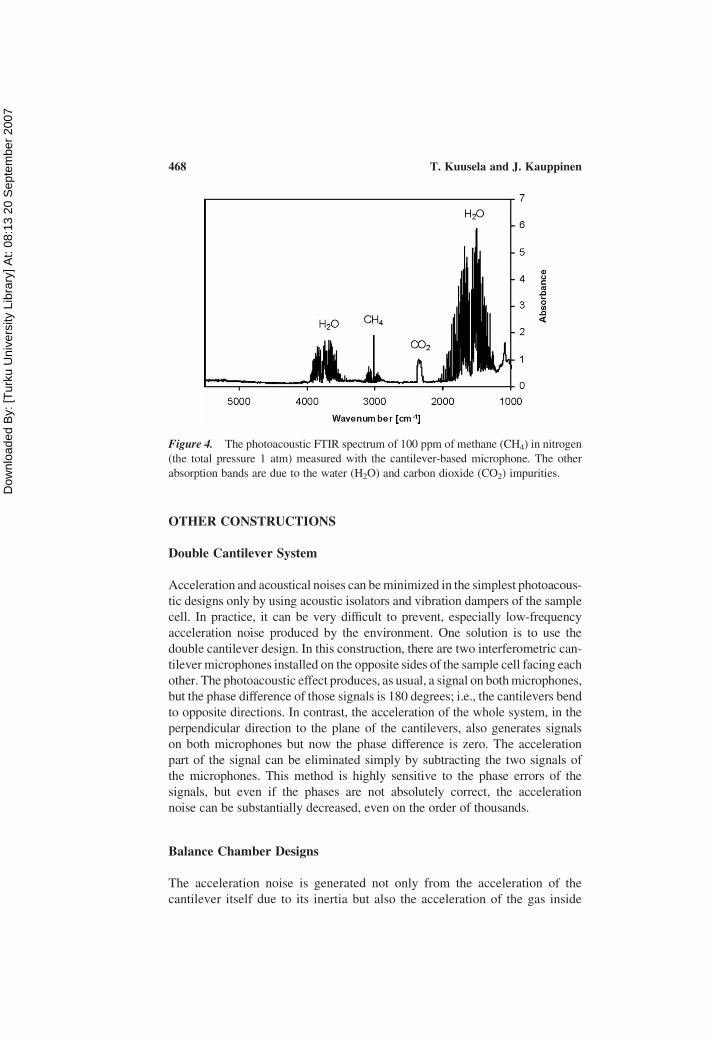
The example spectrum of methane of 100 ppm in nitrogen from the first
preliminary study with a cantilever microphone in FTIR spectrometer is
presented in Figure 4. The original detector in the commercial FTIR system
was replaced with the photoacoustic cell for measurements. The broadband
spectrum of methane compares very well with one obtained by using the
conventional detector.
Photoacoustic Gas Analysis 467
Dow
nloa
ded
By:
[Tur
ku U
nive
rsity
Lib
rary
] At:
08:1
3 20
Sep
tem
ber 2
007
OTHER CONSTRUCTIONS
Double Cantilever System
Acceleration and acoustical noises can beminimized in the simplest photoacous-
tic designs only by using acoustic isolators and vibration dampers of the sample
cell. In practice, it can be very difficult to prevent, especially low-frequency
acceleration noise produced by the environment. One solution is to use the
double cantilever design. In this construction, there are two interferometric can-
tilever microphones installed on the opposite sides of the sample cell facing each
other. The photoacoustic effect produces, as usual, a signal on bothmicrophones,
but the phase difference of those signals is 180 degrees; i.e., the cantilevers bend
to opposite directions. In contrast, the acceleration of the whole system, in the
perpendicular direction to the plane of the cantilevers, also generates signals
on both microphones but now the phase difference is zero. The acceleration
part of the signal can be eliminated simply by subtracting the two signals of
the microphones. This method is highly sensitive to the phase errors of the
signals, but even if the phases are not absolutely correct, the acceleration
noise can be substantially decreased, even on the order of thousands.
Balance Chamber Designs
The acceleration noise is generated not only from the acceleration of the
cantilever itself due to its inertia but also the acceleration of the gas inside
Figure 4. The photoacoustic FTIR spectrum of 100 ppm of methane (CH4) in nitrogen
(the total pressure 1 atm) measured with the cantilever-based microphone. The other
absorption bands are due to the water (H2O) and carbon dioxide (CO2) impurities.
T. Kuusela and J. Kauppinen468
Dow
nloa
ded
By:
[Tur
ku U
nive
rsity
Lib
rary
] At:
08:1
3 20
Sep
tem
ber 2
007
the sample cell. These can be eliminated or at least decreased using the double
cantilever system, but there is also another, much simpler, method to decrease
these kinds of disturbances.
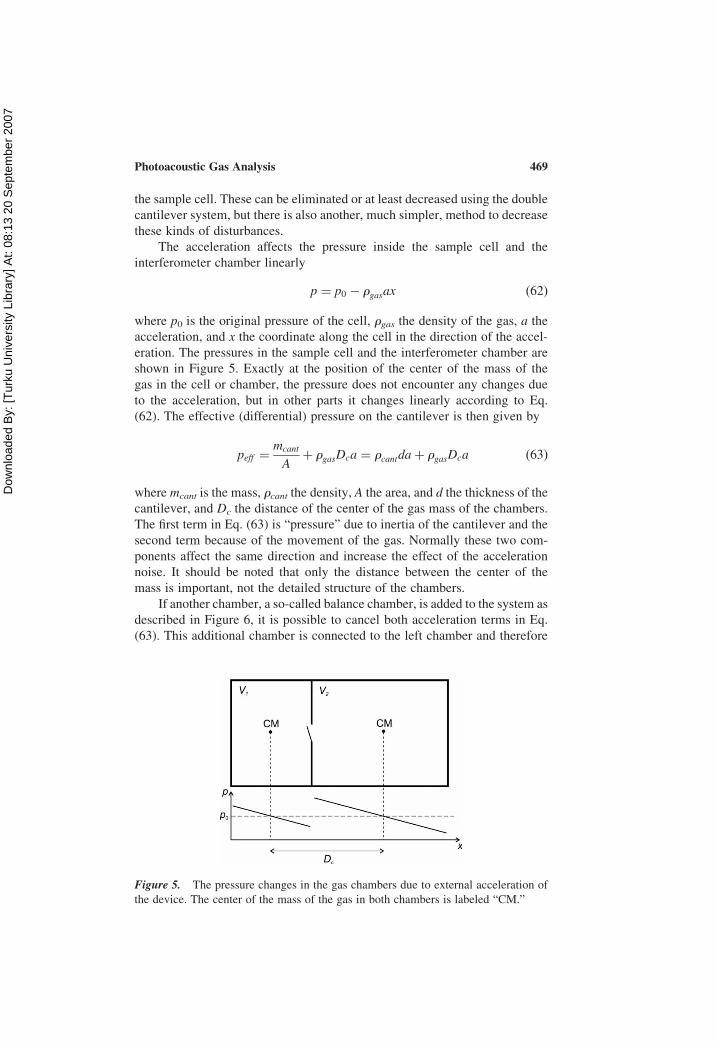
The acceleration affects the pressure inside the sample cell and the
interferometer chamber linearly
p ¼ p0 � rgasax ð62Þ
where p0 is the original pressure of the cell, rgas the density of the gas, a the
acceleration, and x the coordinate along the cell in the direction of the accel-
eration. The pressures in the sample cell and the interferometer chamber are
shown in Figure 5. Exactly at the position of the center of the mass of the
gas in the cell or chamber, the pressure does not encounter any changes due
to the acceleration, but in other parts it changes linearly according to Eq.
(62). The effective (differential) pressure on the cantilever is then given by
peff ¼mcant
Aþ rgasDca ¼ rcantdaþ rgasDca ð63Þ
where mcant is the mass, rcant the density, A the area, and d the thickness of the
cantilever, and Dc the distance of the center of the gas mass of the chambers.
The first term in Eq. (63) is “pressure” due to inertia of the cantilever and the
second term because of the movement of the gas. Normally these two com-
ponents affect the same direction and increase the effect of the acceleration
noise. It should be noted that only the distance between the center of the
mass is important, not the detailed structure of the chambers.
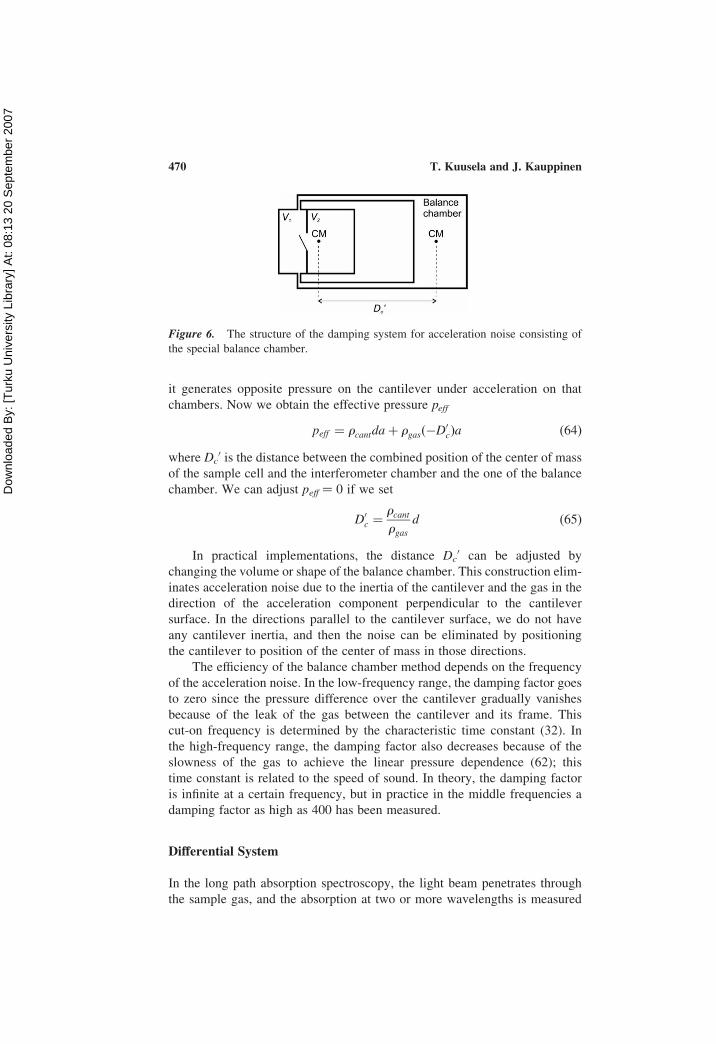
If another chamber, a so-called balance chamber, is added to the system as
described in Figure 6, it is possible to cancel both acceleration terms in Eq.
(63). This additional chamber is connected to the left chamber and therefore
Figure 5. The pressure changes in the gas chambers due to external acceleration of
the device. The center of the mass of the gas in both chambers is labeled “CM.”
Photoacoustic Gas Analysis 469
Dow
nloa
ded
By:
[Tur
ku U
nive
rsity
Lib
rary
] At:
08:1
3 20
Sep
tem
ber 2
007
it generates opposite pressure on the cantilever under acceleration on that
chambers. Now we obtain the effective pressure peff
peff ¼ rcantdaþ rgasð�D0cÞa ð64Þ
where Dc0 is the distance between the combined position of the center of mass
of the sample cell and the interferometer chamber and the one of the balance
chamber. We can adjust peff ¼ 0 if we set
D0c ¼
rcantrgas
d ð65Þ
In practical implementations, the distance Dc0 can be adjusted by
changing the volume or shape of the balance chamber. This construction elim-
inates acceleration noise due to the inertia of the cantilever and the gas in the
direction of the acceleration component perpendicular to the cantilever
surface. In the directions parallel to the cantilever surface, we do not have
any cantilever inertia, and then the noise can be eliminated by positioning
the cantilever to position of the center of mass in those directions.
The efficiency of the balance chamber method depends on the frequency
of the acceleration noise. In the low-frequency range, the damping factor goes
to zero since the pressure difference over the cantilever gradually vanishes
because of the leak of the gas between the cantilever and its frame. This
cut-on frequency is determined by the characteristic time constant (32). In
the high-frequency range, the damping factor also decreases because of the
slowness of the gas to achieve the linear pressure dependence (62); this
time constant is related to the speed of sound. In theory, the damping factor
is infinite at a certain frequency, but in practice in the middle frequencies a
damping factor as high as 400 has been measured.
Differential System
In the long path absorption spectroscopy, the light beam penetrates through
the sample gas, and the absorption at two or more wavelengths is measured
Figure 6. The structure of the damping system for acceleration noise consisting of
the special balance chamber.
T. Kuusela and J. Kauppinen470
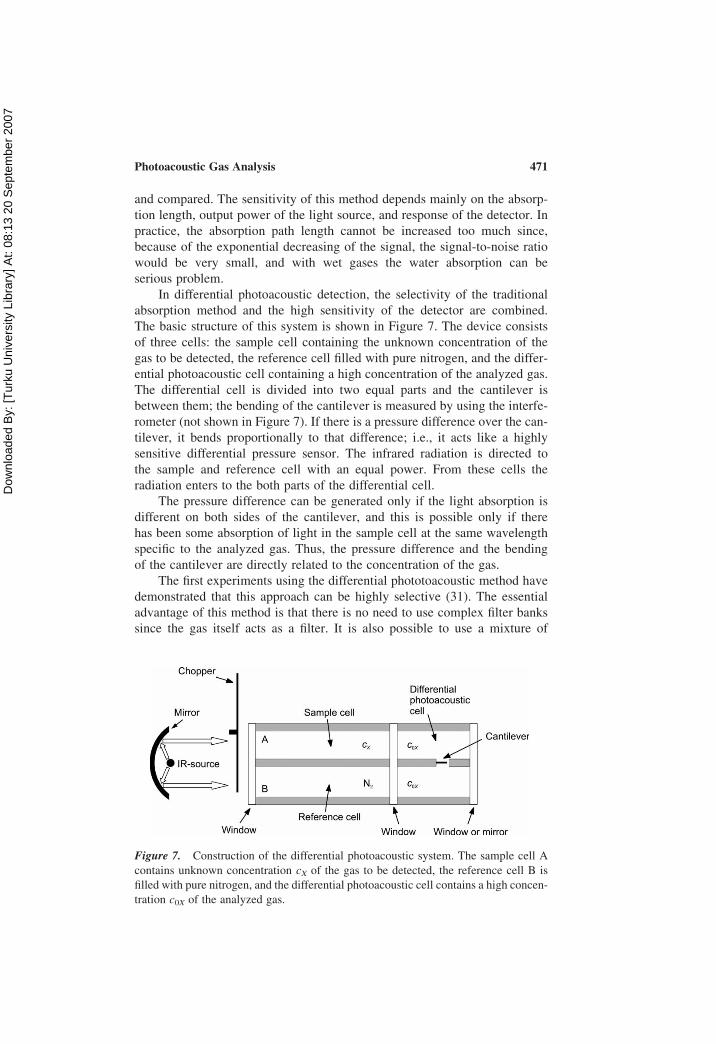
Dow
nloa
ded
By:
[Tur
ku U
nive
rsity
Lib
rary
] At:
08:1
3 20
Sep
tem
ber 2
007
and compared. The sensitivity of this method depends mainly on the absorp-
tion length, output power of the light source, and response of the detector. In
practice, the absorption path length cannot be increased too much since,
because of the exponential decreasing of the signal, the signal-to-noise ratio
would be very small, and with wet gases the water absorption can be
serious problem.
In differential photoacoustic detection, the selectivity of the traditional
absorption method and the high sensitivity of the detector are combined.
The basic structure of this system is shown in Figure 7. The device consists
of three cells: the sample cell containing the unknown concentration of the
gas to be detected, the reference cell filled with pure nitrogen, and the differ-
ential photoacoustic cell containing a high concentration of the analyzed gas.
The differential cell is divided into two equal parts and the cantilever is
between them; the bending of the cantilever is measured by using the interfe-
rometer (not shown in Figure 7). If there is a pressure difference over the can-
tilever, it bends proportionally to that difference; i.e., it acts like a highly
sensitive differential pressure sensor. The infrared radiation is directed to
the sample and reference cell with an equal power. From these cells the
radiation enters to the both parts of the differential cell.
The pressure difference can be generated only if the light absorption is
different on both sides of the cantilever, and this is possible only if there
has been some absorption of light in the sample cell at the same wavelength
specific to the analyzed gas. Thus, the pressure difference and the bending
of the cantilever are directly related to the concentration of the gas.
The first experiments using the differential phototoacoustic method have
demonstrated that this approach can be highly selective (31). The essential
advantage of this method is that there is no need to use complex filter banks
since the gas itself acts as a filter. It is also possible to use a mixture of
Figure 7. Construction of the differential photoacoustic system. The sample cell A
contains unknown concentration cX of the gas to be detected, the reference cell B is
filled with pure nitrogen, and the differential photoacoustic cell contains a high concen-
tration c0X of the analyzed gas.
Photoacoustic Gas Analysis 471
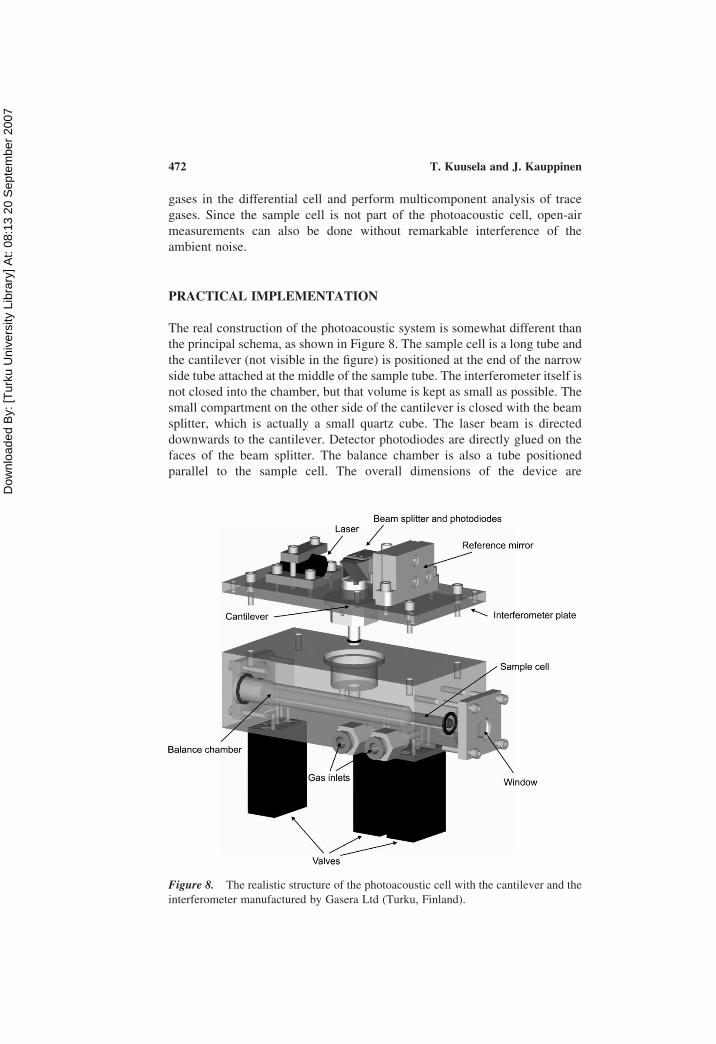
Dow
nloa
ded
By:
[Tur
ku U
nive
rsity
Lib
rary
] At:
08:1
3 20
Sep
tem
ber 2
007
gases in the differential cell and perform multicomponent analysis of trace
gases. Since the sample cell is not part of the photoacoustic cell, open-air
measurements can also be done without remarkable interference of the
ambient noise.
PRACTICAL IMPLEMENTATION
The real construction of the photoacoustic system is somewhat different than
the principal schema, as shown in Figure 8. The sample cell is a long tube and
the cantilever (not visible in the figure) is positioned at the end of the narrow
side tube attached at the middle of the sample tube. The interferometer itself is
not closed into the chamber, but that volume is kept as small as possible. The
small compartment on the other side of the cantilever is closed with the beam
splitter, which is actually a small quartz cube. The laser beam is directed
downwards to the cantilever. Detector photodiodes are directly glued on the
faces of the beam splitter. The balance chamber is also a tube positioned
parallel to the sample cell. The overall dimensions of the device are
Figure 8. The realistic structure of the photoacoustic cell with the cantilever and the
interferometer manufactured by Gasera Ltd (Turku, Finland).
T. Kuusela and J. Kauppinen472
Dow
nloa
ded
By:
[Tur
ku U
nive
rsity
Lib
rary
] At:
08:1
3 20
Sep
tem
ber 2
007
120 � 120 � 60 mm3. Three valves are used to purge, flush, and fill the
sample tube. This construction has been used in the experiments reported in
Koskinen et al. (29).
REFERENCES
1. Bell, A.G. (1881) Upon the production of sound by radiant energy. PhilosophicalMagazine J. Sci., 11: 510–528.
2. Tyndall, J. (1881) Action of an intermittent beam of radiant heat upon gaseousmatter. Proceedings of the Royal Society, 31: 307–317.
3. Kerr, E.L. and Atwood, J.G. (1968) The laser illuminated absorptivity spectro-phone: A method for measurement of weak absorptivity in gases at laser wave-lengths. Applied Optics, 7: 915–921.
4. Kreuzer, L.B. (1971) Ultralow gas concentration infrared absorption spectroscopy.Journal of Applied Physics, 42: 2934–2943.
5. West, G.A., Barret, J.J., Siebert, D.R., and Reddy, K.V. (1983) Photoacoustic spec-troscopy. Review of Scientific Instruments, 54: 797–817.
6. Miklos, A. and Hess, P. (2001) Application of acoustic resonators in photoacoustictrace gas analysis and metrology. Review of Scientific Instruments, 72: 1937–1955.
7. Wilcken, K. and Kauppinen, J. (2003) Optimization of a microphone for photoa-coustic spectroscopy. Applied Spectroscopy, 57: 1087–1092.
8. Kauppinen, J., Wilcken, K., Kauppinen, I., and Koskinen, V. (2004) High sensi-tivity in gas analysis with photoacoustic detection. Microchemical Journal, 76:151–159.
9. Koskinen, V., Fonsen, J., Kauppinen, J., and Kauppinen, I. (2006) Extremelysensitive trace gas analysis with modern photoacoustic spectroscopy. VibrationalSpectroscopy, 42: 239–242.
10. de Paula, M.H., de Carvalho, A.A., Vinha, C.A., Cella, N., and Vargas, H. (1988)Optical microphone for photoacoustic spectroscopy. Journal of Applied Physics,64: 3722–3724.
11. Park, S.M. and Diebold, G.J. (1987) Interferometric microphone for photoacousticspectroscopy. Review of Scientific Instruments, 58: 772–775.
12. Kosterev, A.A., Bakhirkin, Yu.A., Curl, R.F., and Tittel, F.K. (2002) Quartz-enhanced photoacoustic spectroscopy. Optics Letters, 27: 1902–1904.
13. Kosterev, A.A., Bakhirkin, Y.A., and Tittel, F.K. (2005) Ultrasensitive gasdetection by quartz-enhanced photoacoustic spectroscopy in the fundamentalmolecular absorption bands region. Applied Physics B, 80: 133–138.
14. Rabe, U., Janser, K., and Arnold, W. (1996) Vibrations of free and surface-coupledatomic force microscope cantilevers: Theory and experiment. Review of ScientificInstruments, 67: 3281–3293.
15. Carslaw, H.S. and Jaeger, J.C. (1959) Conduction of Heat in Solids; OxfordUniversity Press: London.
16. Gittes, F. and Schmidt, C.F. (1998) Thermal noise limitations of micromechanicalexperiments. European Biophysics Journal, 27: 75–81.
17. Salapaka, M.V., Berg, H.S., Lai, J., Majumdar, A., and McFarland, E. (1997)Multi-mode noise analysis of cantilevers for scanning probe microscopy.Journal of Applied Physics, 81: 2480–2487.
18. Saulson, P.R. (1990) Thermal noise in mechanical experiments. Physical ReviewD, 42: 2437–2445.
Photoacoustic Gas Analysis 473
Dow
nloa
ded
By:
[Tur
ku U
nive
rsity
Lib
rary
] At:
08:1
3 20
Sep
tem
ber 2
007
19. Callen, H.B. and Greene, R.F. (1952) On a theorem of irreversible thermodyn-amics. Physical Review, 86: 702–710.
20. Bruland, K.J., Garbini, J.L., and Dougherty, W.M. (1996) Optimal control of forcemicroscope cantilevers. II. Magnetic coupling implementation. Journal of AppliedPhysics, 80: 1959–1964.
21. Garbini, J.L., Bruland, K.J., and Dougherty, W.M. (1996) Optimal control of forcemicroscope cantilevers. I. Control design. Journal of Applied Physics, 80:1951–1958.
22. Liang, S., Medich, D., Czajkowsky, D.M., Sheng, S., Yuan, J.-Y., and Shao, Z.(2000) Thermal noise reduction of mechanical oscillators by actively controlledexternal dissipative forces. Ultramicroscopy, 84: 119–125.
23. Tamayo, J. (2005) Study of the noise of micromechanical oscillators under qualityfactor enchancement via driving force control. Journal of Applied Physics, 97:044903-1-10.
24. Laurila, T., Cattaneo, H., Koskinen, V., and Kauppinen, J. (2005) Diode laser-based photoacoustic spectroscopy with interferometrically-enhanced cantileverdetection. Optics Express, 13: 2453–2458.
25. Laurila, T., Cattaneo, H., Koskinen, V., and Kauppinen, J. (2005) Diode laser-based photoacoustic spectroscopy with interferometrically-enhanced cantileverdetection: Erratum. Optics Express, 14: 4195–4195.
26. Laurila, T., Cattaneo, H., Poyhonen, T., Koskinen, V., Kauppinen, J., andHernberg, R. (2006) Cantilever-based photoacoustic detection of carbon dioxideusing a fiber-amplified diode laser. Applied Physics B, 83: 285–288.
27. Laurila, T., Cattaneo, H., Poyhonen, T., Koskinen, V., Kauppinen, J., andHernberg, R. (2006) Cantilever-based photoacoustic detection of carbon dioxideusing a fiber-amplified diode laser. Erratum. Applied Physics B, 83: 669.
28. Cattaneo, H., Laurila, T., and Hernberg, R. (2006) Photoacoustic detection ofoxygen using cantilever enhanced technique. Applied Physics B, 85: 337–341.
29. Koskinen, V., Fonsen, J., Rorh, K., and Kauppinen, J. (2007) cantilever enhancedphotoacoustic detection of carbon dioxide using a tunable diode laser source.Applied Physics B, 86: 451–454.
30. Lindley, R.E., Parkes, A.M., Keen, K.A., McNaghten, E.D., and Orr-Ewing, A.J.(2007) A sensitive comparison of three photoacoustic cells containing a singlemicrophone, a differential dual microphone or a cantilever pressure sensor.Applied Physics B, 86: 707–713.
31. Uotila, J., Koskinen, V., and Kauppinen, J. (2005) Selective differential photo-acoustic method for trace gas analysis. Vibrational Spectroscopy, 38: 3–9.
T. Kuusela and J. Kauppinen474


![Practice sheet 38.A. ARGUE-[quarrel] AWKWARD-[clumsy] DECIDE-[determine] (use “f” handshape, not “d”)](https://static.fdocuments.us/doc/165x107/56649ccd5503460f94998637/practice-sheet-38a-argue-quarrel-awkward-clumsy-decide-determine-use.jpg)