Applied Photo Interpretation for Airbrush Cartography...APPLIED PHOTO INTERPRETATION FOR AIRBRUSH...
12
w FRONTISPIECE:. Progressive stages in the portrayal of relief using airbrush and eraser techniques. JAY L. INGE PATRICIA M. BRIDGES U. S. Geological Survey Flagstaff, AZ 86001 Applied Photo Interpretation for Airbrush Cartography An airbrush portrayal technique has been developed for the interpretation of satellite television imagery of the moon and planets. (Abstract on next page) INTRODUCTION T UNAR AND PLANETARY EXPLORATION has L required the development of new techniques of cartographic portrayal. Whereas in conventional photogrammetric mapping, original map data (i.e., stereo- scopic aerial photographs) frequently contain more information than can be shown legibly on a map, lunar and planetary data have had much lower resolution, requiring intensive interpretation and utilization of all available material. Data for the maps have consisted largely of telescopic photographs or satellite television images taken under a wide variety of conditions. These pictures provide planimetric and morphologic information, but are usually unsuited to conventional photogrammetric treabnent. As a result, the use of shaded relief portrayal of photo in- terpretations has been greatly expanded. These techniques, as they are now applied, are far more complex than the conventional shading of contour maps and have required illustrators to become skilled photo inter- preters. Relief illustration is accomplished using a unique airbrush technique in which highlights are accentuated with an electric eraser. Extensive production controls are in- stituted throughout the preparation of a map to insure consistency. The cartographic methods now used allow a versatile approach to the mapping of all planets and a form of map portrayal in which details of surface mottling and structure are presented to the map user with a clarity not often found in more conventional maps. PHOTOGRAMMETRIC ENGINEERING AND REMOTE SENSING, Vol. 42, No.6, June 1976, pp. 749-760. 749
Transcript of Applied Photo Interpretation for Airbrush Cartography...APPLIED PHOTO INTERPRETATION FOR AIRBRUSH...
w ~ ~
FRONTISPIECE:. Progressive stages in the portrayal of relief using airbrush and eraser techniques.
JAY L. INGE
PATRICIA M. BRIDGES
U. S. Geological SurveyFlagstaff, AZ 86001
Applied Photo Interpretation forAirbrush Cartography
An airbrush portrayal technique has been developed for theinterpretation of satellite television imagery of the moon andplanets.
(Abstract on next page)
INTRODUCTION
T UNAR AND PLANETARY EXPLORATION hasL required the development of newtechniques of cartographic portrayal.Whereas in conventional photogrammetricmapping, original map data (i.e., stereoscopic aerial photographs) frequently containmore information than can be shown legiblyon a map, lunar and planetary data have hadmuch lower resolution, requiring intensiveinterpretation and utilization of all availablematerial. Data for the maps have consistedlargely of telescopic photographs or satellitetelevision images taken under a wide varietyof conditions. These pictures provideplanimetric and morphologic information,but are usually unsuited to conventionalphotogrammetric treabnent. As a result, the
use of shaded relief portrayal of photo interpretations has been greatly expanded.These techniques, as they are now applied,are far more complex than the conventionalshading of contour maps and have requiredillustrators to become skilled photo interpreters. Relief illustration is accomplishedusing a unique airbrush technique in whichhighlights are accentuated with an electriceraser. Extensive production controls are instituted throughout the preparation of a mapto insure consistency.
The cartographic methods now used allowa versatile approach to the mapping of allplanets and a form of map portrayal in whichdetails of surface mottling and structure arepresented to the map user with a clarity notoften found in more conventional maps.
PHOTOGRAMMETRIC ENGINEERING AND REMOTE SENSING,Vol. 42, No.6, June 1976, pp. 749-760.
749

750 PHOTOGRAMMETRIC ENGIl EERI G & REMOTE SE SING, 1976
HISTORY
Systematic mapping of the moon, begunearly in the last decade by the AeronauticalChart and Information Center of the U.S. AirForce, provided the first base materialsutilizing photo interpretation by shaded relief illustrators. Methods have been developed for obtaining lunar topographic contour data (Kopal and Carder, 1974), but thedata lacked sufficient detail for mapping atlarge scales. Shaded relief illustrators had torely solely upon small scale photographytaken through Earth-based telescopes. Because the photographic resolution was adversely affected by the Earth's atmosphere,illustrators learned to employ many procedures used in traditional photo interpreta-
velopment of the photo interpretive and airbrush techniques because a large scale mapseries was not instituted using these data attheir resolution limits.
Reapplication of the technique becamenecessary with receipt of Mariner 9 television images of Mars, beginning in 1971. Unlike other orbiting spacecraft pictures,Mariner 9 images were taken under a widevariety of atmospheric, illumination, andsurface conditions. Because the Mariner 9data undelwent computer image processing,artifacts often seriously complicated interpretation of the data. Different kinds ofimage processing of single frames producedlarge and often unwieldy data sets. Elevation information was not sufficiently dense
ABSTRACT: New techniques of cartographic portrayal have been developed for compilation of maps of lunar and plentary surfaces.Conventional photo interpretive methods utilizing size, shape,shadow, tone, pattern, and texture are applied to computer processed satellite television images. The variety of the image data allowsthe illustrator to interpret image details by inter-comparison andintra-comparison of photographs. Comparative judgements are affected by illumination, resolution, variations in surface coloration,and transmission o-r processing artifacts. The validity of the interpretation process 'is tested by making a representational drawingby a unique airbrush portrayal technique. Production controls insurethe consistency ofa map series. Photo interpretive cartographic portrayal skills are used to prepa're two kinds of map series and areadptable to map products of different kinds and purposes.
tion to provide maximum detail representation. Since contour maps v,,'ere limited ornon-existent, slopes were shown using different density values of tone. A mid-grey density implied a flat surface and increasi nglydark or light densities delineated slopes, aswould be the case in a photograph of a reliefmodel. The apparent light source was alwaysassumed to be from the west. For clarity onlysurface relief was shown, and surface coloration was suppressed by careful interpretation of the photography during illustration.Later, telescopic observation of the mappingarea by the illustrator provided further refinement of mapping detail. Increasing skillsoon allowed illustrators to infer detail fromapparently analogous but poorly resolved relief. In the latter part of the last decadephotographic information returned by artificial satellites resulted in a surplus of highresolution photography of the lunar surface.The level of detail in the photographyseemed to end the need for further de-
to provide shading control. Photo interpretive mapping of Mars was therefore essentialfor synthesizing the data set into a comprehensible cattographic format. The returnof television pictures of Mercury by Mariner10 in 1974 and 1975 further expanded theneed for planetary photo interpretive mapping.
METHODS
Celtain initial steps in planetary photo interpretive mapping are similar to photo interpretive methods outlined by Colwell(1952) and Rabben and others (1960). However, departure from traditional photo interpretation methods occurs when the illustrator justifies an interpretation by actuallydrawing the feature lll1der study. The drawing, in effect, is a double check of the interpretation. In performing the transfer ofdata to a drawing, the illustrator is affectedby several considerations.

APPLIED PHOTO INTERPRETATION FOR AIRBRUSH CARTOGRAPHY 751
SIZE AND SHAPE
Unlike other methods of satellite photo interpretation, which require high resolutionand are not sensitive to image size and shape(Carter and Stone, 1974), these two elementsare vital in planetary photo interpretation.The highly representational detail in aplanetary map demands awareness of sizeand shape of physiographic features. Size isof additional importance during the interpretation and portrayal because indistinct features must be related to distinct ones to insure the correct size and position of both.Because the planetary maps describe form,careful evaluation of shape and size is a toolfor the comparative classification of featuresseen in photographic images. An initialbreakdown of features into craters and noncraters simplifies much of the interpretivetask. The predominantly circular shape ofthe craters allows the illustrator to classifyand analyze the features at the limits ofphotographic resolution.
SHADOW
Images affected by extremely low sun angles are usually avoided during planetarymapping. Cast shadows obscure detail andvery fine details are excessively exaggerated(Kopal and Carder, 1974). High sun angle
images are similarly avoided since the absence of shadow makes the shape and size offorms difficult to perceive. In fortunate circumstances the illustrator selects an imagedata set which has sun angles only slightlylower than the average slope angles of thefeatures. In practice, however, such idealimages are difficult to obtain, so the illustrator must utilize his judgment and experience in the selection of optimum data.
TONE, PATTERN, AND TEXTURE
When dealing with shaded relief maps,the illustrator must remain concerned withthe slope and form of surfaces, not the apparent brightness of those surfaces. The factorswhich affect the surface coloration of aplanet are complex and not completely understood. The inclusion of surface colorationin a planetmy relief maps would require theuse of tonal densities that would conflictwith those reserved to show slope elevationsand angles. Photo interpretation is thereforeused to exclude surface coloration from mostplanetaIY relief map drawings and to includepatterns and textures that are discernible asdiscrete relief features.
DATA
The logic and experience used in map il-
FIG. lao Horizontally high-passfiltered version of Mariner 9 picture (DAS 09378154) of highfrequency contrast data.
FIG. lb. Vertically high-passfiltered version of figure la picture showing similar enhancement of high frequency contrasts but suppressing surfacecoloration.
FIG. Ie. Shading correctedversion of figure la picture presenting a more "natural" appearance of the Martian surface.The picture has been correctedfor known electronic shading,and the contrast has been enhanced, but no other processinghas been.done.
752 PHOTOGRAMMETRIC ENGINEERING & REMOTE SENSING, 1976
lustration depends on a number of valuejudgements made over a long period of time.The opportunity to accumulate this experience is augmented by the extensive datacomparisons necessary to use limited sets ofplanetary photographs. Most often, only oneor two pictures are available for studying aparticular area. The illustrator must apply interpretive methods to their limits and relyheavily upon the use of analogy to infer the
nature of alien topography. The preparationof a map is thus strongly affected by thephotographic data available to the illustratorand by the comparative methods employedto use the data.
Image data sets contain several versions ofan image that has been subjected to someform of computer image processing (LevinthaI and others, 1973). The image data set becomes quite extensive when subjected to
w ~
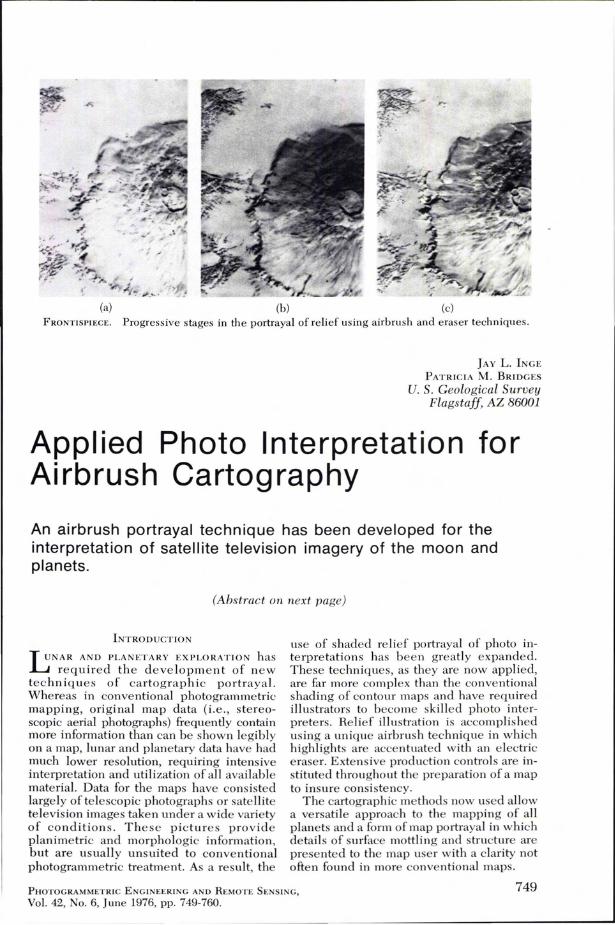
FIG. 2. Mariner 9 pictures taken with different illumination clarify slope and fonn (DAS 07686248,Figure 2a, DAS 12186067, Figure 2b).
FIG. 3. High resolution Mariner 9 "B" frames (DAS 09591129 and DAS 06640693) outlinedwithin a low resolution "A" frame (DAS 07756248). The B-frames show more detailed relief andindicate more clearly the overall character of an area.

APPLIED PHOTO I TERPRETATIO FOR AIRBRUSH CARTOGRAPHY 753
computer image processing. For Mars mapping, photographs are often categorized byresolution, date of spacecraft acquisition,and by the kind of computer processing pro-
vided. Of nearly 20 such categories, all maybe subjected to high-pass filtration in thecomputer which accentuates high frequencydetail while suppressing broad tonal varia-
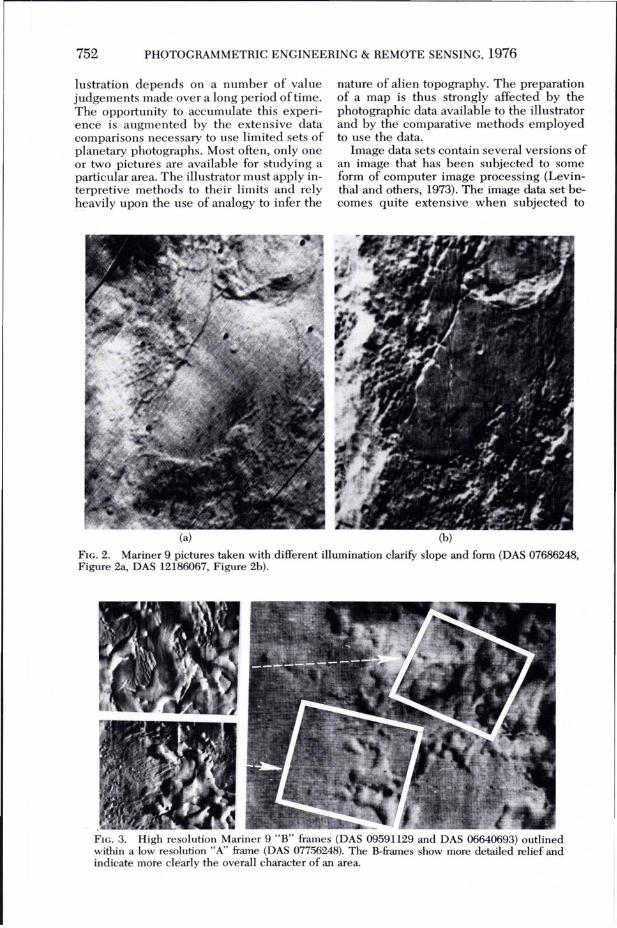
(a) (b)FIG.4. Cloud obscuration of relief on Mariner 9 pictures is evident by comparison of Figure 4a (DAS07615128) with Figure 4b (DAS 09089824). Blemishes on the television vidicon tube are indicated byarrows in Figure 4b.
I'',1;,#\1,,11'1'+I~' ,
FIG. 5. Mariner 9 pictures (DAS 07147388 and DAS 09953554) showing (by arrows) areas that displayvariation of surface coloration with time.
754 PHOTOGRAMMETRIC ENGINEERING & REMOTE SENSING, 1976
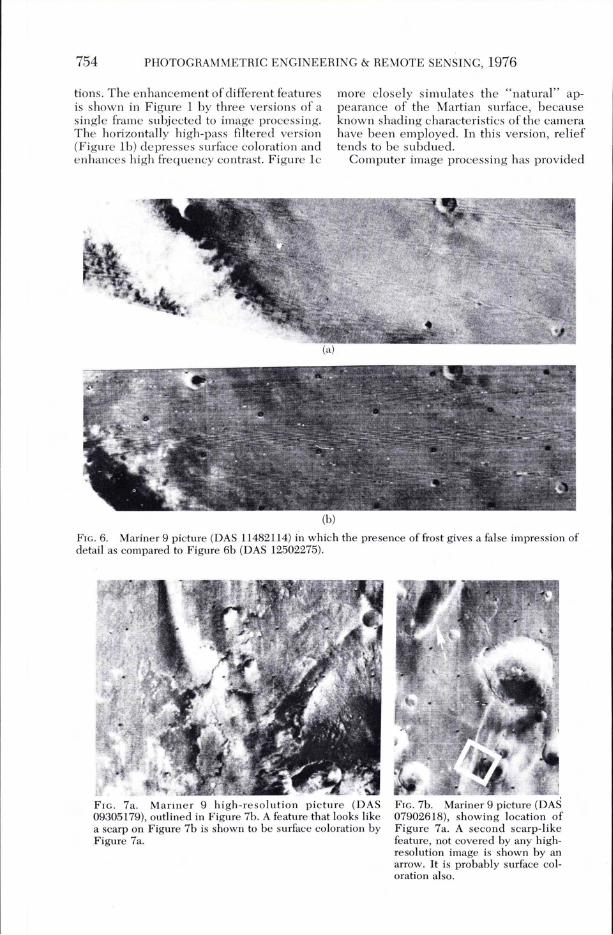
tions. The enhancement of different featuresis shown in Figure 1 by three versions of asingle frame subjected to image processing.The horizontally high-pass filtered version(Figure Ib) depresses surface coloration andenhances high fi'equency contrast. Figure Ic
more closely simulates the "natural" appearance of the Martian surface, becauseknown shading characteristics of the camerahave been employed. In this version, relieftends to be subdued.
Computer image processing has provided
(b)
FIG. 6. Mariner 9 picture (DAS 11482114) i'n which the presence of frost gives a false impression ofdetail as compared to Figure 6b (DAS 12502275).
FIG. 7a. Mariner 9 high-resolution picture (DAS09305179), outlined in Figure 7b. A feature that looks likea scarp on Figure 7b is shown to be surface coloration byFigure 7a.
IIr
FIG. 7b. Mariner 9 picture (DAS07902618), showing location ofFigure 7a. A second scarp-likefeature, not covered by any highresolution image is shown by anarrow. It is probably surface coloration also.

APPLIED PHOTO INTERPRETATION FOR AIRBRUSH CARTOGRAPHY 755
the illustrator with a remarkable range ofdata that allows both inter-comparison of different photographs and intra-comparison of aphotograph's different variations. In addition to the clarification of detail information,the elimination of artifacts and variablenon-relief features is affected by themethods of data utilization during comparative study of the photography given below.
ILUMINATION
Efficient study of a relief feature isachieved by examination and comparison ofimages taken at different times and with different sun angles of illumination. When lightsource varies, the appearance of some reliefchanges relative to other relief. For example,steeper slopes are affected less by smallchanges in illumination than are subtleslopes. This study of interrelated slope angles through use of varying illumination issimilar in practice to early telescopic observation of lunar features. Comparison of differently processed versions of a given imagecan reveal false enhancement of relief byother phenomena. Although it is convenient
FIG. 8a. Mariner 9 picture (DAS 07255188),showing a faint residual image from Figure 8b.
to examine images with a western lightsource, similar to the map, images with aneastern light source are nevertheless useful.Such opposite illumination (Figure 2)clarifies slopes and reveals subtle formswhich may have tone values obscured byphoto-mechanical problems such as printdensity. In addition, the character of nonrelief phenomena is altered, allowing clearervisibility of form and slope.
RESOLUTION
There are a number of isolated high resolution images within a set of planetary images. Although the area portrayed is oftentoo small to be included in a map, such images can provide a clue or clarification oftherelief character of a region. As shown in Figure 3, high resolution images convey detailed structure obscured by low resolution.
I Through examination of the high resolution, pictures, the illustrator can infer the natureof the surrounding areas.
Detail can be resolved more clearly insome versions of an image than in others.Figures la and Ib compared with Figure Icare examples.
FIG. 8b. Mariner 9 picture (DAS 0725438). Thehigh contrast image "burned" the picture tubeand affected subsequent pictures.
756 PHOTOGRAMMETRIC ENGI EERING & REMOTE SE SING, 1976
NO -RELIEF PHE OME 'A
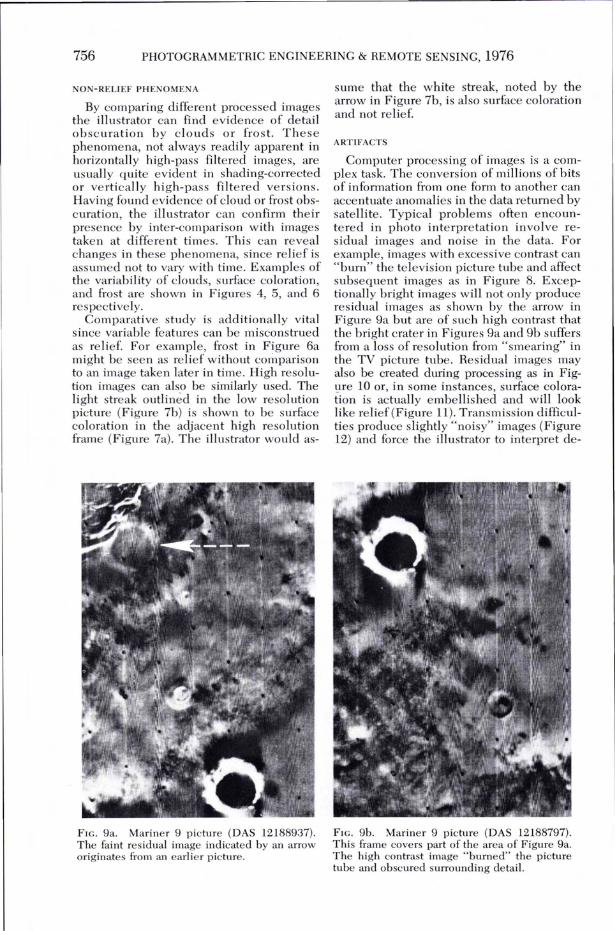
By comparing different processed imagesthe illustrator can find evidence of detailobscuration by clouds or frost. Thesephenomena, not always readily apparent inhorizontally high-pass filtered images, areusually quite evident in shading-correctedor vertically high-pass filtered versions.Having found evidence of cloud or frost obscuration, the illustrator can confirm theirpresence by inter-comparison with imagestaken at different times. This can revealchanges in these phenomena, since relief isassumed not to vary with time. Examples ofthe variability of clouds, surface coloration,and frost are shown in Figures 4, 5, and 6respectively.
Comparative study is additionally vitalsince variable features can be misconstruedas relief. For example, frost in Figure 6amight be seen as relief without cOlnparisonto an image taken later in time. High resolution images can also be similarly used. Thelight streak outlined in the low resolutionpicture (Figure 7b) is shown to be surfacecoloration in the adjacent high resolutionframe (Figure 7a). The illustrator would as-
FIG. 9a. Mariner 9 picture (DAS 12188937).The faint residual image indicated by an arroworiginates from an earlier picture.
sume that the white streak, noted by thearrow in Figure 7b, is also surface colorationand not relief.
ARTIFACTS
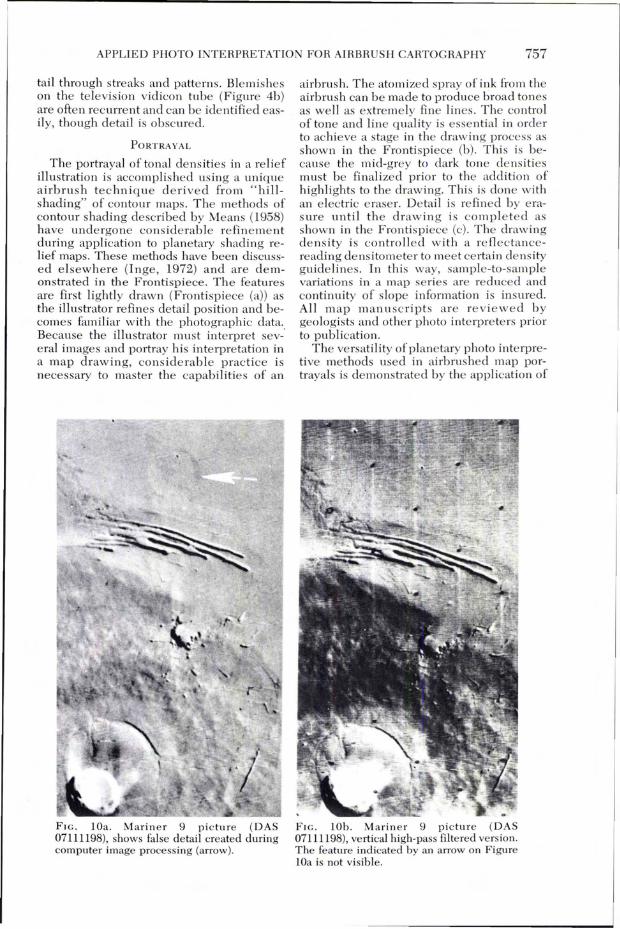
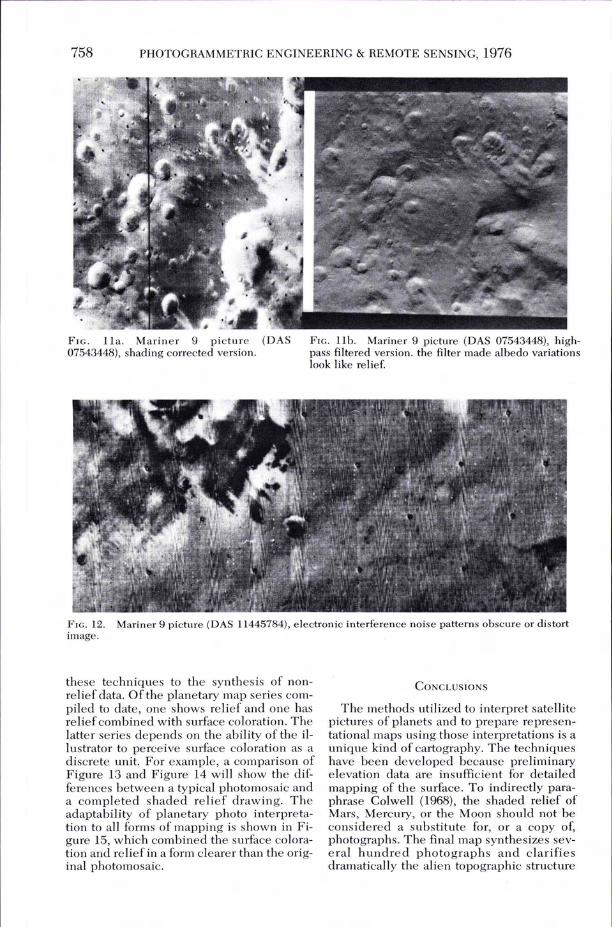
Computer processing of images is a complex task. The conversion of millions of bitsof information from one form to another canaccentuate anomalies in the data returned bysatellite. Typical problems often encountered in photo interpretation involve residual images and noise in the data. Forexample, images with excessive contrast can"burn" the television picture tube and affectsubsequent images as in Figure 8. Exceptionally bright images will not only produceresidual images as shown by the arrow inFigure 9a but are of such high contrast thatthe bright crater in Figures 9a and 9b suffersfrom a loss of resolution from "smearing" inthe TV picture tube. Residual images mayalso be created during processing as in Figure 10 or, in some instances, surface coloration is actually embellished and will looklike relief(Figure 11). Transmission difficulties produce slightly "noisy" images (Figure12) and force the illustrator to interpret de-
FIG. 9b. Mariner 9 picture (DAS 12188797).This frame covers part of the area of Figure 9a.The high contrast image "burned" the picturetube and obscured surrounding detail.
APPLIED PHOTO INTERPRETATION FOR AIRBRUSH CARTOGRAPHY 757
tail through streaks and patterns. Blemisheson the television vidicon tube (Figure 4b)are often recurrent and can be identified easily, though detail is obscured.
PORTRAYAL
The portrayal of tonal densities in a reliefillustration is accomplished using a uniqueairbrush technique derived from "hillshading" of contour maps. The methods ofcontour shading described by Means (1958)have undergone considerable refinementduring application to planetary shading relief maps. These methods have been discussed elsewhere (Inge, 1972) and are demonstrated in the Frontispiece. The featuresare first lightly drawn (Frontispiece (a)) asthe illustrator refines detail position and becomes familiar with the photographic data.Because the illustrator must interpret sev-'eral images and portray his interpretation ina map drawing, considerable practice isnecessary to master the capabilities of an
airbrush. The atomized spray of ink fi'om theairbrush can be made to produce broad tonesas well as extremely fine lines. The controlof tone and line quality is essential in orderto achieve a stage in the drawing process asshown in the Frontispiece (b). This is because the mid-grey to dark tone densitiesmust be finalized prior to the addition ofhighlights to the drawing. This is done withan electric eraser. Detail is refined by erasure until the drawing is completed asshown in the Frontispiece (c). The drawingdensity is controlled with a reflectancereading densitometer to meet certain densityguidelines. In this way, sample-to-samplevariations in a map series are reduced andcontinuity of slope information is insured.All map manuscripts are reviewed bygeologists and other photo interpreters priorto publication.
The versatility ofplanetary photo interpretive methods used in airbrushed map portrayals is demonstrated by the application of
Flc. lOa. Mariner 9 picture (DAS07111198), shows false detail created duringcomputer image processing (arrow).
Flc. lOb. Mariner 9 picture (DAS07111198), vertical high-pass filtered version.The feature indicated by an arrow on FigurelOa is not visible.
758 PHOTOGRAMMETRIC ENGINEERING & REMOTE SENSING, 1976
FIG. lla. Mariner 9 picture (DAS07543448), shading corrected version.
FIG. llb. Mariner 9 picture (DAS 07543448), highpass filtered version. the filter made albedo variationslook like relief.
FIG. 12. Mariner 9 picture (DAS 11445784), electronic interference noise patterns obscure or distortimage.
these techniques to the synthesis of nonrelief data. Of the planetary map series compiled to date, one shows relief and one hasrelief combined with surface coloration. Thelatter series depends on the ability of the illustrator to perceive surface coloration as adiscrete unit. For example, a comparison ofFigure 13 and Figure 14 will show the differences between a typical photomosaic anda completed shaded relief drawing. Theadaptability of planetary photo interpretation to all forms of mapping is shown in Figure 15, which combined the surface coloration and relief in a form clearer than the original photomosaic.
CONCLUSIONS
The methods utilized to interpret satellitepictures of planets and to prepare representational maps using those interpretations is aunique kind of cartography. The techniqueshave been developed because preliminaryelevation data are insufficient for detailedmapping of the surface. To indirectly paraphrase Colwell (1968), the shaded relief ofMars, Mercury, or the Moon should not beconsidered a substitute for, or a copy of,photographs. The final map synthesizes several hundred photographs and clarifiesdramatically the alien topographic structure
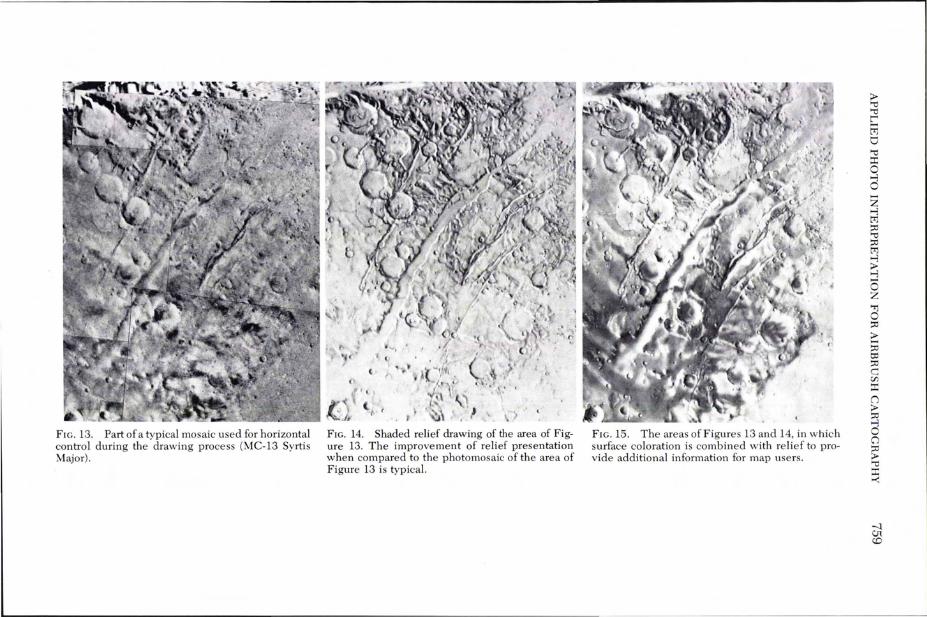
FIG. 13. Part ofa typical mosaic used for horizontalcontrol during the drawing process (MC-13 SyrtisMajor).
FIG. 14. Shaded relief drawing of the area of Figure 13. The improvement of relief presentationwhen compared to the photomosaic of the area ofFigure 13 is typical.
FIG. 15. The areas of Figures 13 and 14, in whichsurface coloration is combined with relief to provide additional information for map users.
:>"0"0L'......t'1o"0::co...,oZ...,t'1::0"0::0t'1...,:>...,(3Z."o::0:>;;ttl::0c::C/J::c():>:Joog:"0::c.-<
-.:ICllCO

760 PHOTOGRAMMETRIC ENGINEERING & REMOTE SENSING, 1976
of a planet. Because these photo interpretivetechniques allow the maximum utilization oflimited data sets, they will be invaluable ininterpreting data acquired in future spacecraft missions. It is possible that thesemethods could be employed in certainsmaller-scaled maps of the Earth, condensing a huge amount of photographic data intoa usable format. This kind of cartography is aform of data processing that is impartial,rapid, and highly adaptable.
ACKNOWLEDGMENTS
The authors wish to express their gratitudeto Mr. Raymond M. Batson who firstsuggested this paper and provided supportthroughout its preparation.
This work has been supported by theNASA Planetary Programs Office under contract No. W-13709.
RUERENC£S
Carter, Louis, D., and Richard O. Stone, 1974, Interpretation of Orbital Photographs; Photo-
grammetric Engineering, v. 40, no. 2, p. 193197.
Colwell, Robert N., 1952, Photographic Interpretation for Civil Purposes, in Manual of Photogrammetry: Washington, D.C., American Society of Photogrammetry, p. 535-602.
Inge, J. L., 1972, Principles of Ltmar Illustration:Aeronautical Chart and Inf. Center Ref. Pub.RF-72-1, 60 p.
Kopal, Zdenek, and Robert W. Carder, 1974,Mapping of the Moon, Past and Present: Dordrecht, Holland; D. Reidel Publishing Co.,234 p.
Levinthal, E. C., W. B. Green, J. A. Cutts, E. D.Jaheilka, R. A. Johansen, M. J. Sander, J. B.Seidman, A. T. Young, and L. A. Soderblom,1973, Mariner 9-Image Processing and Products: Icarus, v. 18, no. 1, p. 75-101.
Means, Ruth, 1958, Shaded Relief: U. S. Coast andGeodetic Survey, Aeronautical Chart Division Tech. Man. RM-895.
Rabben, Ellis, E. Lawrence Chalmers, Jr., EugeneManley, Jack Pickup, 1960, Fundamentals ofPhoto Interpretation, in Manual of Photographic Interpretation: Washington, D.C.American Society of Photogrammetry, p. 99168.
CALL FOR PAPERS4th CANADIAN SYMPOSIUM
ON REMOTE SENSINGThe 4th Canadian Symposium has been scheduled for May 16, 17 and 18, 1977, in Quebec
City, Quebec. The Department of Lands and Forests of the Province ofQuebec will host themeeting, which is sponsored by the Canadian Remote Sensing Society of the CanadianAeronautics and Space Institute and other professional societies and government departments.
The Symposium will examine Remote Sensing as a vital and mature technology whichembodies conceptual problem definition, technologica development, and proven application. It hopes to demonstrate the wide applicability of particular sensors and internff~tation
algorithms in a way which enhances our appreciation of the interdependence of processeson the earth's surface, its water bodies and in the atmosphere.
Those wishing to present a paper at the 4th Canadian Remote Sensing Symposium areasked to send a detailed, comprehensive summary of 250 words (in English or French) nolater than September 30, 1976, to the address given below. Since selection of papers to bepresented at the meeting will be based upon this summary, it must include an outline of theproblem, .methods used in its solution, and results obtained. Papers accepted for presentation will be refereed prior to publication in the Symposium Proceedings. Papers may bepresented in either English or French.
Dr. J. KruusTechnical Program Chairman4th Canadian Symposium on Remote SensingCanada Centre for Remote Sensing2464 Sheffield RoadOttawa, OntarioKIA OE4