Applications of HUGIN to Diagnosis and Control of ...
20
Applications of HUGIN to Diagnosis and Control of Autonomous Vehicles Anders L. Madsen 1 and Uffe B. Kjærulff 2 1 HUGIN Expert A/S, Gasværksvej 5, DK-9000, Aalborg, Denmark 2 Aalborg University, Department of Computer Science, Fredrik Bajers Vej 7E, DK-9220, Aalborg, Denmark Abstract. We present an application of HUGIN to solve problems related to diag- nosis and control of autonomous vehicles. The application is based on a distributed architecture supporting diagnosis and control of autonomous units. The purpose of the architecture is to assist the operator or piloting system in managing fault detec- tion, risk assessment, and recovery plans under uncertainty.To handle uncertainty, we focus on the use of probabilistic graphical models (PGMs) as implemented in the HUGIN tool. We describe the application of PGMs to three problems of diagnosis and con- trol of autonomous vehicles. Based on the HUGIN tool, limited memory influence diagrams (LIMIDs) are used to represent and solve complex problems of diagnosis and control of autonomous ground and underwater vehicles. In particular, we de- scribe how battery monitoring and control problems related to an underwater and a ground vehicle are solved and how to solve the problem of assessing the quality of a sonar image related to an underwater vehicle. 1 Introduction The HUGIN tool [1,5,13] supports construction and deployment of complex statistical models known as probabilistic graphical models (PGMs) for rea- soning and decision making under uncertainty. We describe how a particular kind of PGMs, known as limited memory influence diagrams (LIMIDs), have been applied to solve complex reasoning and decision making problems re- lated to autonomous ground vehicles and autonomous underwater vehicles. The ADVOCATE project (acronym for Advanced On-board Diagnosis and Control of Autonomous Systems), which was formed in 1997 under the IST program of the European Commission, had as one of its objectives to increase the performance of unmanned underwater vehicles in terms of availability, ef- ficiency, and reliability of the systems and in terms of safety for the systems themselves as well as for their environments. The aim of the follow-up project, ADVOCATE II, was partly to design and develop a general-purpose software architecture for Autonomous Underwater Vehicles (AUVs) and Autonomous Ground Vehicles (AGVs) and partly to develop software-based systems to in- crease the degree of automation, efficiency, and reliability of the vehicles. The interest of such a concept from the market point of view was demonstrated by a market study.
Transcript of Applications of HUGIN to Diagnosis and Control of ...

Applications of HUGIN to Diagnosis and
Control of Autonomous Vehicles
Anders L. Madsen1 and Uffe B. Kjærulff2
1 HUGIN Expert A/S, Gasværksvej 5, DK-9000, Aalborg, Denmark2 Aalborg University, Department of Computer Science, Fredrik Bajers Vej 7E,
DK-9220, Aalborg, Denmark
Abstract. We present an application of HUGIN to solve problems related to diag-nosis and control of autonomous vehicles. The application is based on a distributedarchitecture supporting diagnosis and control of autonomous units. The purpose ofthe architecture is to assist the operator or piloting system in managing fault detec-tion, risk assessment, and recovery plans under uncertainty. To handle uncertainty,we focus on the use of probabilistic graphical models (PGMs) as implemented inthe HUGIN tool.
We describe the application of PGMs to three problems of diagnosis and con-trol of autonomous vehicles. Based on the HUGIN tool, limited memory influencediagrams (LIMIDs) are used to represent and solve complex problems of diagnosisand control of autonomous ground and underwater vehicles. In particular, we de-scribe how battery monitoring and control problems related to an underwater anda ground vehicle are solved and how to solve the problem of assessing the qualityof a sonar image related to an underwater vehicle.
1 Introduction
The HUGIN tool [1,5,13] supports construction and deployment of complexstatistical models known as probabilistic graphical models (PGMs) for rea-soning and decision making under uncertainty. We describe how a particularkind of PGMs, known as limited memory influence diagrams (LIMIDs), havebeen applied to solve complex reasoning and decision making problems re-lated to autonomous ground vehicles and autonomous underwater vehicles.
The ADVOCATE project (acronym for Advanced On-board Diagnosis andControl of Autonomous Systems), which was formed in 1997 under the ISTprogram of the European Commission, had as one of its objectives to increasethe performance of unmanned underwater vehicles in terms of availability, ef-ficiency, and reliability of the systems and in terms of safety for the systemsthemselves as well as for their environments. The aim of the follow-up project,ADVOCATE II, was partly to design and develop a general-purpose softwarearchitecture for Autonomous Underwater Vehicles (AUVs) and AutonomousGround Vehicles (AGVs) and partly to develop software-based systems to in-crease the degree of automation, efficiency, and reliability of the vehicles. Theinterest of such a concept from the market point of view was demonstratedby a market study.

2 Anders L. Madsen and Uffe B. Kjærulff
The latter objective was reached by adding artificial intelligence (AI)into existing and new control software to diagnose and recover from anydysfunction or failure situation of the system. To improve the managementof uncertainty in AUVs and AGVs it was decided that the ADVOCATE IIarchitecture should allow for easy incorporation and merging of different AItechniques in a highly modular fashion.
Three end-user partners were involved in the ADVOCATE II project:University of Alcala designs piloting modules for AGVs for surveillance ap-plications, Ifremer designs AUVs for scientific applications, and ATLAS Elek-tronik designs AUVs and semi-AUVs for industrial applications. Each end-user partner presented diagnosis and control problems related to a singlevehicle. Several such problems were presented for each vehicle involving dif-ferent kinds of dysfunctions and failures:
• Thruster or motor failure diagnosis and recovery in case of abnormalbehaviour of the vehicle due to thrusters or motors.
• Sensor malfunction diagnosis and recovery on sensor state in order toaccount for failure situations in case of corrupt sensor signals due, forinstance, to noise.
• Power consumption diagnosis and recovery monitoring the level of re-maining energy in a vehicle battery in order to avoid mission abortion.
• Motion diagnosis and recovery monitoring and assessing the motion char-acteristics of a vehicle.
Three different AI techniques have been applied for solving these diag-nosis and control problems, namely probabilistic graphical models (PGMs),neuro-symbolic systems (NSSs), and fuzzy logic (FL). In this chapter, wefocus on the development and application of PGMs for a selected set of theproblems. We discuss how LIMIDs have been used to represent and solvecomplex problems of diagnosis and control of AGVs and AUVs. In partic-ular, we describe how battery monitoring and control problems related toan AUV and an AGV are solved and how a sonar image quality assessmentproblem related to an AUV is solved.
In Sect. 2, we briefly present the HUGIN tool used for constructing andexecuting the LIMIDs. Section 3 introduces the problem domain of semi-autonomous ground and underwater vehicles. The ADVOCATE II commu-nication architecture is described in Sect. 4. Section 5 presents some pre-liminaries and notation on the LIMID representation used to model andsolve the diagnosis and control problems. The knowledge extraction processand method developed as part of the ADVOCATE II project is described inSect. 6. Section 7 describes the models developed to solve the diagnosis andcontrol problems, while in Sect. 8 we discuss how the developed LIMIDs aresolved. Section 9 describes model integration and validation, and presents theresults of real world trials. Finally, Sect. 10 ends the chapter with a discussionof our work.

Applications of HUGIN 3
2 The HUGIN Tool
The HUGIN tool [1,5,13] is a general purpose tool for constructing and de-ploying probabilistic graphical models (PGMs) such as Bayesian networksand influence diagrams.
In the HUGIN tool, inference in PGMs is performed through messagepassing in a secondary computational structure known as a junction tree [7].The junction tree is constructed from the PGM through processes known asmoralization and triangulation [12]. The nodes of a junction tree are some-times referred to as cliques. To each clique (containing a subset of the variablesof the PGM) is associated tables representing joint probability and utilityfunctions over variables of the clique. The messages passed between cliquesrepresent joint probability and utility functions over variables common toboth the sending and the receiving clique.
The HUGIN tool consists of a graphical user interface (HUGIN Graphi-cal User Interface) and an inference engine (HUGIN Decision Engine). TheHUGIN Decision Engine has Application Programming Interfaces (APIs) forfour different programming languages: C, C++, Java, and Visual Basic forApplications.
The core functionality of the HUGIN Decision Engine is implementedin the C programming language according to the ANSI C standard. Thismakes the HUGIN Decision Engine highly efficient and portable. Interfacesfor C++, Java and Visual Basic for Applications are constructed on top of thecore implementation. The HUGIN Graphical User Interface is implementedin Java, which makes it highly portable.
The HUGIN Decision Engine has been deployed on a large number ofdifferent platforms ranging from PDAs to multiprocessor mainframes.
3 Problem Domain
The transition of autonomous vehicles from experimental research tools toreal applications increases the need for reliable and safe performance of thevehicles. This includes detection, avoidance, and recovery from any dysfunc-tion.
Both the AGVs and the AUVs considered in the ADVOCATE II projectare supplied with energy from batteries. This poses the problem of monitoringthe remaining energy level of the battery and providing diagnosis and recoveryactions in order to manage the mission parameters related to the energyconsumption and to avoid unnecessary mission aborts. One AUV is equippedwith an advanced object detection and avoidance system. This system workswell in situations where obstacles can be detected by sonar. Hence, it isimportant to assess the quality of the sonar image and to suggest recoveryactions to improve the sonar image quality or to suggest reductions in speedin case of poor image quality.

4 Anders L. Madsen and Uffe B. Kjærulff
The ADVOCATE II consortium consisted of eight partners from five dif-ferent European countries. Each partner served different roles in the consor-tium. The roles were robot manufactures and end-users, technology providers,marketing and communication specialists, and project coordinator. HUGINExpert A/S served the role as technology provider and developer of intelligentmodules.
3.1 The DeepC AUV
ATLAS Elektronik is developing a new type of underwater vehicle operatingwith autonomous mission durations of up to 60 hours. This vehicle is referredto as DeepC (see Fig. 1).
The long mission durations impose the need for advanced AI techniquesto detect, avoid, and recover from any dysfunction. All end-users and ATLASElektronik in particular were faced with problems, which could not easily besolved by existing systems. The current approach to handle mission faults isto abort the mission, which is, however, very expensive.
Fig. 1. The DeepC underwater vehicle
As a fully autonomous system, the DeepC vehicle has to rely on its sensorsto survive operationally. The DeepC is equipped with an advanced objectdetection and avoidance system. The object detection system consists of amechanically scanning, forward looking sonar and its control electronics. Thissystem works well when the sonar image is of sufficient quality. The problemconsidered is to construct a model for assessing the sonar image quality andfor suggesting actions to avoid object collisions.
3.2 The VORTEX AUV
Ifremer has developed the remotely operated underwater vehicle VORTEX(see Fig. 2), which for our purpose is functionally considered as an AUV, asit allows programming of autonomous complex missions.
The motivation for equipping the vehicle with AI technology is much thesame as for the DeepC, including optimization of the mission plan, diagnosis

Applications of HUGIN 5
Fig. 2. The VORTEX underwater vehicle
of abnormalities, recovery planning in case of abnormalities, avoidance ofmission abortion (which is very expensive), and avoidance of vehicle loss.
3.3 The BART AGV
To put the ADVOCATE II concept into practice also for autonomous groundvehicles, University of Alcala was deploying a telesurveillance applicationusing the BART AGV (see Fig. 3). Two independent actuators powered byan on-board battery drive the vehicle.
Fig. 3. The BART autonomous ground vehicle
In order to increase the probability of mission success in case of energyproblems or in case the vehicle gets stalled, the overall mission of the vehicleas well as other navigational issues can be managed using ADVOCATE IItechnology. The ADVOCATE II system provides the AGV with intelligentdiagnosis capabilities and ability to recommend optimal recovery actions re-sulting in more reliable and safer operations. The diagnosis and recoverycapabilities are concerned with aspects of navigation, energy system, sensors,actuators, etc.

6 Anders L. Madsen and Uffe B. Kjærulff
4 ADVOCATE II Architecture
The ADVOCATE II architecture is a distributed architecture based on ageneric communication protocol. The architecture is modular and easy toevolve and adapt to future piloting systems.
The purpose of the architecture is to assist the operator or piloting sys-tem in managing fault detection, risk assessment, and recovery plans underuncertainty. The generic communication protocol is based on SOAP/XMLtechnology implementing HTTP for communication between different typesof modules (see Fig. 4).
Directory
Module
Decision
Module
Robot Piloting
Module
Intelligent
Module
Intelligent
Module
Http − Soap/XML documents
Fig. 4. The communication architecture
The architecture is generic, open, and modular consisting of a set of inter-acting modules including a decision module and a set of intelligent modules.The decision module communicates with the intelligent modules to requestand obtain diagnosis and recovery action proposals based on data obtainedfrom the robot piloting module.
The architecture is designed to allow easy integration of different AI tech-niques into preexisting systems. The decision to support the simultaneous useof multiple AI techniques was made to allow these techniques to collaborateon the task of reasoning and making decisions under uncertainty. This raisesthe question of how to most efficiently integrate different AI techniques intonew and existing systems. We have found that this is most efficiently donethrough an open and generic architecture with a sophisticated communica-tion interface.
The architecture consists of four different types of modules.

Applications of HUGIN 7
4.1 Robot Piloting Module
The robot piloting module manages mission plans and communicates directlywith the sensors and actuators of the vehicle. This module also implementsrecovery plans received from the decision module into actions on the vehicle.
Each end-user partner of the ADVOCATE II project was responsible forthe piloting module corresponding to the end-user vehicle.
4.2 Decision Module
The decision module manages the diagnosis and recovery action process. Thisincludes integration of information provided by different intelligent modules,user validation of diagnosis and recovery actions when required by the system,and translation of recovery actions into recovery plans.
The decision module communicates with the intelligent modules receivingdiagnoses and recovery actions, the robot piloting module, and the user.
4.3 Intelligent Module
The role of an intelligent module is to provide possible diagnoses, suggestionsfor recovery actions, or both. An intelligent module encapsulates a knowledgebase to a specific problem domain and an inference engine.
A diagnosis on an operational vehicle corresponds to identification of sys-tem state while a recovery action corresponds to performing a sequence ofactions on the vehicle (e.g., to avoid collision or to recover from any dysfunc-tion).
The intelligent module communicates with the robot vehicle piloting mod-ule and the decision module. The robot vehicle piloting module supplies theintelligent module with data. These data are used in conjunction with theknowledge base to generate diagnoses and recovery actions. The diagnosis orrecovery action is communicated to the decision module.
There may be multiple intelligent modules connected to the ADVOCATE IIarchitecture. Multiple intelligent modules may consider the same or differentproblems related to the vehicle. Each intelligent module implements the com-munication protocol defined for the ADVOCATE II architecture.
In each application considered, the HUGIN Decision Engine is used forboth reasoning and decision making under uncertainty, i.e., both to make adiagnosis and to generate recovery actions.
4.4 Directory Module
The architecture is organized around the directory module. The directorymodule is the central point of communication in the sense that it maintainsa list of registered and on-line modules.

8 Anders L. Madsen and Uffe B. Kjærulff
5 Limited Memory Influence Diagram
Limited memory influence diagrams are used to represent and solve the se-lected set of diagnosis and recovery action problems. An influence diagram [3]is a compact and intuitive probabilistic graphical model for reasoning aboutdecision making under uncertainty. It is a graphical representation of a deci-sion problem involving a sequence of interleaved decisions and observations.In essence, an influence diagram is a Bayesian network [2,6,14,15] augmentedwith decision variables and preference (or utility) functions.
An influence diagram N = (X ,G,P ,U) over random variables XC anddecision variables XD such that X = XC ∪XD consists of an acyclic, directedgraph G = (V, E) over nodes V , connected by directed links E ⊆ V × V , aset of conditional probability distributions P , and a set of utility functionsU . The nodes V of G represent the random variables, decision variables, andutility functions of N .
Each decision variable, D, represents a specific point in time under themodel of the problem domain where the decision maker has to make a deci-sion. The decision options or alternatives are the finite set of states (d1, . . . , dn)of D where n is the size of the state space of D. The usefulness of a decisionoption di is measured by local utility functions associated with D or one ofits descendants in G.
Mathematically, an influence diagram is a compact representation of ajoint expected utility (EU) function:
EU(V ) =∏
X∈XC
P (X |π(X))∑
u∈U
u,
where π(X) denotes the immediate predecessors (or parents) of variable X
in N .To solve an influence diagram N is to determine an optimal strategy for
the decision maker to follow. The strategy consists of one decision policyδD for each decision variable D ∈ XD. A policy δD is a mapping from therequisite past of D (i.e., past observations that may impact the choice ofdecision option for D) to the state space of D ∈ XD .
In the graphical representation of an influence diagram, random variablesare represented as ovals, decision variables as rectangles, and utility func-tions as diamond-shaped nodes. A link into a node representing a randomvariable represents a probabilistic dependence relation, a link into a utilitynode identifies a domain variable of the corresponding utility function, anda link into a node representing a decision variable specifies that the parent isobserved prior to the decision is made. Links into decision nodes are referredto as informational links.
An influence diagram supports the representation and solution of sequen-tial decision problems under the no-forgetting assumption (i.e., assumingperfect recall of all observations and decisions made in the past that are in-fluential in a given decision situation). A LIMID [11] is an influence diagram
Applications of HUGIN 9
relaxing the no-forgetting assumption to a limited memory assumption. Thisimplies that all information available to the decision maker must be specifiedusing informational links for each decision. This is contrary to an influencediagram where some informational links may be implicitly assumed present.
Figure 5 shows a LIMID representation of a simple decision problem in-volving two decisions D1 and D2.
X1 X2
D1 U1
X3 U2
D2
Fig. 5. A decision problem with two decisions
If the graph in Fig. 5 is interpreted as an influence diagram, then thedomain of the decision policy for D2 will consist of X1, D1, and X2 (due tothe no-forgetting assumption). If, on the other hand, the graph in Fig. 5 isinterpreted as a LIMID, then the domain of the decision policy for D2 willconsist only of X2. In a LIMID, all informational links are shown explicitly.
In the HUGIN tool, an influence diagram is solved by message passing ina so-called strong junction tree [4]. A LIMID, on the other hand, is solved bymessage passing in an ordinary junction tree. The difference in computationalcomplexity between a strong junction tree and an ordinary junction tree canbe tremendous [11].
An OO LIMID is an extension of a LIMID with support for object-orientedconstructions [10], considering a LIMID as a class of which instances can existin several other classes (LIMIDs). Thus, in addition to the elements of aLIMID, an OO LIMID contains instance nodes. An instance node representsan instantiation (or realization) of one LIMID class within another LIMIDclass following the object-oriented paradigm. In graphical representations ofLIMIDs, instance nodes are represented using box-shaped nodes with roundedcorners. The interface of a class is its input and output variables (indicated asnodes with a gray outer part, where input nodes have a dashed black border);see Fig. 9 for an example.
6 Knowledge Extraction Methodology
Unfortunately, the construction of a PGM can be a labour intensive taskwith respect to both knowledge acquisition and formulation. LIMIDs are notexceptional in this respect. The knowledge acquisition and formulation pro-cess associated with building the three LIMID models in the ADVOCATE IIproject involved knowledge engineers and domain experts located in four dif-ferent countries. The knowledge engineers and domain experts had limited

10 Anders L. Madsen and Uffe B. Kjærulff
Fig. 6. Cause hierarchy for the BART AGV energy problem
possibilities for face-to-face meetings and the domain experts had limitedknowledge of LIMIDs. Therefore, a knowledge acquisition scheme had to bedeveloped that did not rely on familiarity with terminology of probabilisticgraphical models and direct contact with the knowledge engineers.
The scheme is based on building a problem hierarchy for an overall prob-lem. The problems (or causes) of the hierarchy relate to the states of thedifferent parts of a vehicle and its environment.
Figure 6 shows such a cause hierarchy related to the energy problem ofthe BART AGV. The causes of the hierarchy are grouped into causes thatqualify as satisfactory explanations of the overall problem and causes that donot. The first group of causes are referred to as permissible diagnoses. Thesubset of these that can actually be identified based on available informationare referred to as possible diagnoses. Possible diagnoses are marked with a“+” in Fig. 6, and permissible diagnoses that are not possible are markedwith a “−”.
The cause hierarchy acts as a road-map for describing the relevant diag-nostic information and the possible recovery actions. A cause of a sub-tree ofthe cause hierarchy that does not contain any possible diagnoses is unlikely toprovide relevant diagnostic information or error recovery information. Thus,if there are no observable manifestations of the cause strong enough to iden-tify a possible diagnosis for the cause, we need not worry about it wheneliciting the diagnostic and error recovery information. In particular, none ofthe causes below the dotted line in Fig. 6 contain any possible diagnoses. Thedomain expert provides the relevant diagnostic information and the recoveryactions in matrix form with one row for each cause “above the dotted line”

Applications of HUGIN 11
and one column for each kind of diagnostic information (i.e., backgroundinformation and symptoms) and one column for possible recovery actions.
The qualitative knowledge elicited following such a scheme provides asufficient basis for a knowledge engineer to construct the structure of a PGM,on the basis of which the quantitative knowledge can then be elicited.
For a detailed description of the knowledge acquisition scheme, we referthe reader to [9].
7 Models
Using the knowledge extraction method described in Sect. 6, one LIMIDmodel for each of the vehicles has been developed in collaboration with theend-user. For reasons of space limitations, we include only a subset of thecause hierarchies and models developed.
7.1 The VORTEX AUV
The purpose of the PGM intelligent module of the VORTEX is to assess thestatus of the energy consumption of the actuators and the payload systemsof the AUV. The payload systems consist of various sensors for scientificinvestigations. More concretely, the task of the module is to compute theprobabilities of the various possible root causes of unexpected high energyconsumption and the expected utilities of the various recovery actions giventhe information available.
There are two different aspects (or sub-causes) of “Energy consumptionproblem”, namely “High energy consumption” indicating that the currentlevel of energy consumption is significantly higher than recommended, and“Low state of charge (SOC)” indicating either an abnormally high level ofcumulative energy consumption or a poor state of the battery (SOB). Thesetwo aspects relate to, respectively, the present energy consumption and thecumulative energy consumption. The present energy consumption is definedas the average consumption over the last 10 seconds.
To identify the cause of low SOC as a high cumulative energy consump-tion, the model should either be dynamic, capable of representing phenom-ena evolving over time, or rely on a measurement of the cumulative totalconsumption and an indication of the recommended cumulative total con-sumption at any given point of the mission. We decided to go with the latterapproach, as a dynamic model would result in serious computational complex-ity problems. Also, given that periodic requests are issued from the decisionmodule to the VORTEX intelligent module, determining that the cumulativeenergy consumption is high is a straightforward task that might as well beperformed by the decision module itself.
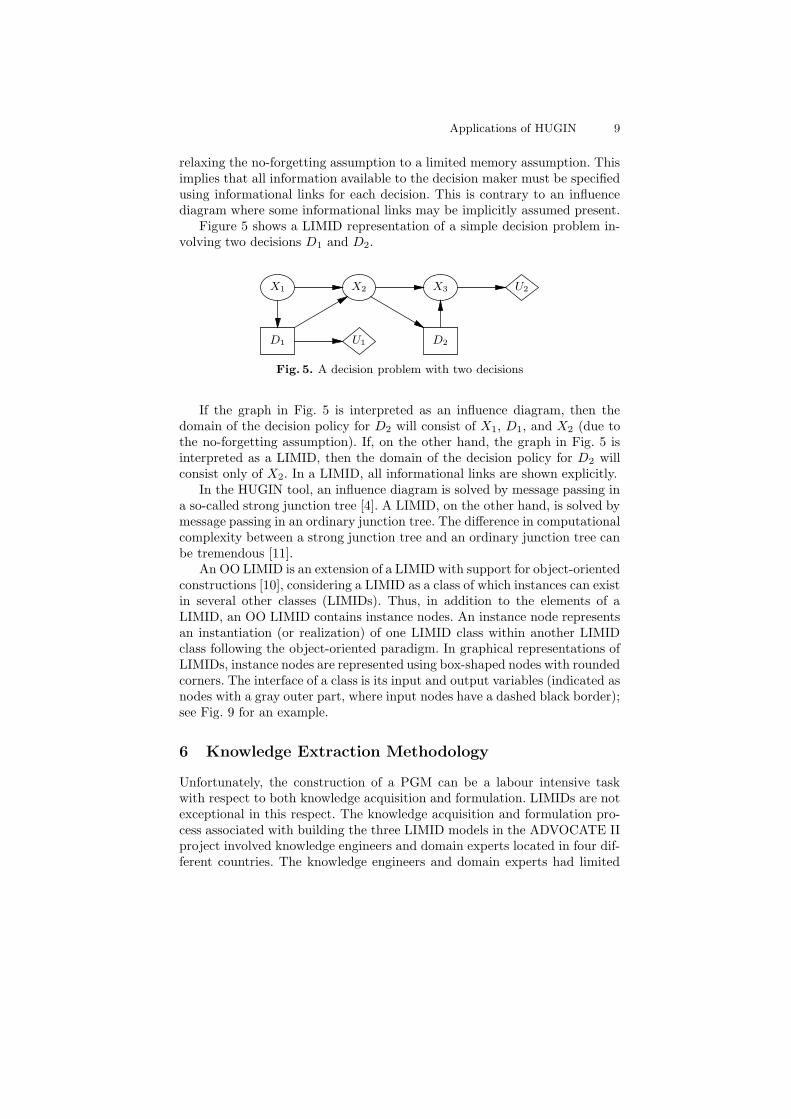
Figure 7 shows the resulting LIMID. There are four groups of randomvariables in Fig. 7: Ten diagnosis variables, eleven background information
12 Anders L. Madsen and Uffe B. Kjærulff
Fig. 7. The VORTEX LIMID
variables, nine symptom variables, and eighteen auxiliary variables. The tendiagnosis variables represent the following distinct root causes of an energyconsumption problem of the VORTEX: Old battery, Long-term heavy work-ing conditions, Poor SOB, Cold battery, High cumulative energy consumption,Obstructing object, Strong currents, Fast acceleration, Actuator problem, andUnhealthy payload. The posterior probability distributions for these diagnosesare computed on the basis of information provided through the twenty evi-dence variables (symptom measurements and background information).
The domain experts identified a group of nine different actions that canbe performed in response to energy problems: Mission action (e.g., “Con-tinue”, “Reduce velocity”, “Abort mission”, etc.), Test SOB, Replace battery,Back/forth manoeuvre (i.e., to escape from an obstructing object), Check pay-load sensors, etc.
Except that Replace battery must be preceded by a Test SOB actionthere are no natural orderings among the actions. Also, observations willbe provided for all twenty evidence variables (symptom measurements andbackground information) before any decisions are going to be made. Thesetwo facts imply that the model is not naturally represented as an influencediagram. Also, it would make exact inference absolutely intractable.
The LIMID framework therefore offers an ideal representation of this com-bined diagnosis and decision problem. In fact, the size of the junction tree forthe network in Fig. 7 is only about 30K (measured as the sum of the sizes ofthe clique tables). We should note, however, that the “limited memory” as-pect of the model contributes significantly to this fact, as there are observed

Applications of HUGIN 13
variables that belong to the “relevant past” [16] of some decision variablesthat do not appear as parents of these variables. For example, according tothe model in Fig. 7 the observed variables RPM of actuators and Velocityappear to be relevant for the Mission action decision, but there are no in-formation links from these variables to the decision variable, as the Actuatorconsumption and the Ground velocity variables are assumed to cater for theirinfluences.
Despite the “limited memory” aspect of the model in Fig. 7, preliminaryevaluations of the model provided satisfactory results.
7.2 The BART AGV
The purpose of the PGM intelligent module of the BART AGV is very similarto that of the VORTEX AUV. The fact that the BART carries no payloadsystems and the obvious difference that the BART is an AGV and the VOR-TEX an AUV, give rise to some differences in the two models, but for themost part, the BART model shown in Fig. 8 constitutes a subset of the VOR-TEX model. After some adjustments of the model, a preliminary evaluation
Fig. 8. The BART LIMID
of the model showed an almost complete agreement between expert diagnosesand recommendations and those provided by the model.
7.3 The DeepC AUV
The purpose of the PGM intelligent module of the DeepC is to assess thequality of the sonar image and in the case of bad sonar image quality to

14 Anders L. Madsen and Uffe B. Kjærulff
suggest appropriate actions to avoid damage to the vehicle or even loss ofvehicle.
The assessment of the sonar image quality is based on the computation ofthree sonar image quality indicators. The quality indicators are determinedby the robot piloting module and fed into the model as evidence. The sonarimage quality indicators are pixel entropy, pixel mean value, and pixel sub-stance, see [8] for details. From the above description of the problem domain,it is clear that the amount of disturbance in the sonar image and the presenceof objects is time dependent.
The main modeling challenges were to capture the dynamics of the process(how the quality indicators relate to the position and behaviour of the vehicle,the noise sources, and the quality of the image), to address the inherentinfinite horizon problem, and to maintain a computationally efficient model(small cliques and policies).
We model the problem as a discrete time, finite horizon partially observedMarkov decision process. The model is dynamic in the sense that it models thebehaviour of the system over (discrete) time. The state of the system at anygiven point in time is partially observed as sensor readings are available, butnot all entities of the problem domain are observed. The process is representedas an OO LIMID.
Fig. 9. The generic time-slice model for sonar image assessment
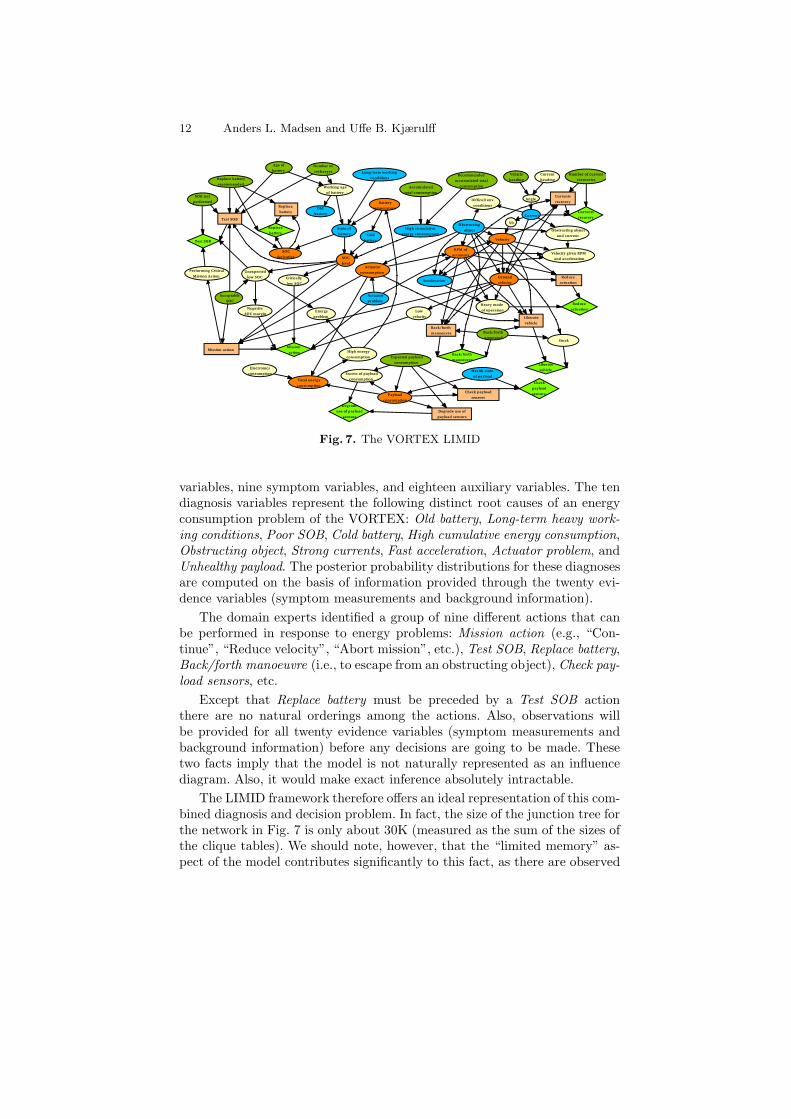
The top-level LIMID class N contains three instantiations, Mi, Mi+1,and Mi+2, of the class M shown in Fig. 9; see Fig. 10 where Mi has label T i.The input variables are located at the top of Fig. 9, while the output variablesare located at the bottom. In N , the output variables of Mi are connectedto the input variables of the subsequent time-slice Mi+1, and similarly forMi+1 and Mi+2.
Applications of HUGIN 15
T0 T1 T2
Fig. 10. The top-level LIMID class for sonar image assessment is a time-slicedmodel of three instances of the model (class) shown in Fig. 9
Each instantiation of M represents the system at a given point in time.The model N represents the system at three consecutive time steps with an8 seconds interval, which is the time the image analysis component needs toanalyze a single sonar image.
To avoid combinatorial explosion and thereby maintain computationalefficiency, the model specifies that Altitude, Depth, Pitch, and Speed are ob-served prior to the decision Recovery Action, but not the image quality indi-cators. The values computed for the image quality indicators are inserted asevidence and subsequently policies are recomputed. Hence, the policy for thedecision in the next time-slice will only depend on the most recent observa-tions on Altitude, Depth, Pitch, and Speed. Since the image quality indicatorsare observed each time a sonar image is analyzed, we need to resolve theLIMID with the observations on the image quality indicators entered as evi-dence.
The decision has a potential impact on speed, altitude, and depth of thevehicle. Deciding on a recovery action changing any of these properties willimpact the quality of the next sonar image. The probability of a collision ismodeled in the class instance Speed.
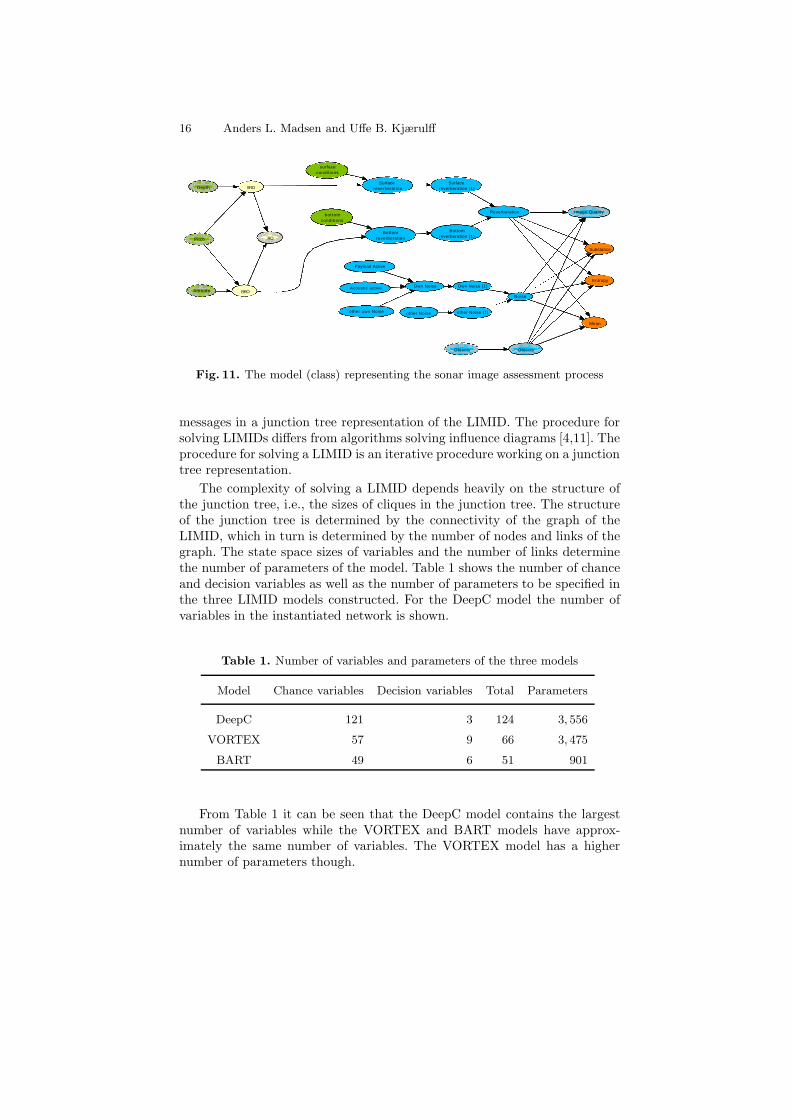
The instance Sonar Image Analysis, which is an instance of the networkclass shown in Fig. 11, models the sonar image assessment process. The threeimage quality indicators are represented in this class by the variables Entropy,Mean, and Substance. The quality indicators are influenced by the presenceof disturbance or objects in the sonar image. Disturbance may be caused byreverberation or noise.
The hierarchical construction of the LIMID enforced by the object-orientedparadigm has simplified the knowledge acquisition phase considerably as it iseasy to focus on well-defined subparts of the LIMID in isolation. Using classinstances, it is a simple task to create and maintain multiple instances of thesame LIMID class. Furthermore, it is a simple task to change the class of aninstance to another class. This is particularly useful in the knowledge acqui-sition phase where each LIMID class has been revised and updated multipletimes.
For further details on the DeepC model, see [8].
8 Solving Models
A LIMID is solved using a message passing procedure in a junction tree asbriefly described in Sect. 5. This procedure proceeds by iteratively passing
16 Anders L. Madsen and Uffe B. Kjærulff
other Noise (1)
Own Noise (1)
Bottomreverberation (1)
Surface reverberation (1)
Entropy
Image Quality
Pitch
Objects
Substance
Mean
Own Noise
other Noise
bottomconditions
surfaceconditions
Reverberation
Bottomreverberation
Surface reverberation
BRO
SRO
RO
Noise
Payload Active
Acoustic active
other own Noise
Objects
Altitude
Depth
Fig. 11. The model (class) representing the sonar image assessment process
messages in a junction tree representation of the LIMID. The procedure forsolving LIMIDs differs from algorithms solving influence diagrams [4,11]. Theprocedure for solving a LIMID is an iterative procedure working on a junctiontree representation.
The complexity of solving a LIMID depends heavily on the structure ofthe junction tree, i.e., the sizes of cliques in the junction tree. The structureof the junction tree is determined by the connectivity of the graph of theLIMID, which in turn is determined by the number of nodes and links of thegraph. The state space sizes of variables and the number of links determinethe number of parameters of the model. Table 1 shows the number of chanceand decision variables as well as the number of parameters to be specified inthe three LIMID models constructed. For the DeepC model the number ofvariables in the instantiated network is shown.
Table 1. Number of variables and parameters of the three models
Model Chance variables Decision variables Total Parameters
DeepC 121 3 124 3, 556
VORTEX 57 9 66 3, 475
BART 49 6 51 901
From Table 1 it can be seen that the DeepC model contains the largestnumber of variables while the VORTEX and BART models have approx-imately the same number of variables. The VORTEX model has a highernumber of parameters though.

Applications of HUGIN 17
Table 2 shows the total clique state space of the optimal junction treesused for solving each LIMID where the optimality criterion is clique statespace size. The total clique state space size is defined as
∑C∈C
∏X∈C
‖X‖,where C denotes the set of cliques of the junction tree and ‖X‖ denotes thenumber of states of variable X .
Table 2. Total clique state space size of the three models
Model Influence Diagram LIMID
DeepC > 232− 1 108, 841
VORTEX > 232− 1 26, 099
BART 14, 017, 742 39, 322
Table 2 also shows the total clique state space size when each model issolved as an influence diagram. The table shows that the DeepC and VOR-TEX models when considered as influence diagrams cannot be solved on astandard 32 bits PC platform (each vehicle is equipped with a standard 32 bitsPC platform running either Windows or Linux operating systems). Thus, ap-plying probabilistic graphical models to diagnosis and control of autonomousvehicles would be infeasible without the use of LIMIDs.
9 Integration, Validation, and Real-World Trials
Each LIMID model is encapsulated in an intelligent module of the ADVO-CATE II architecture (see Fig. 4). The intelligent module takes care of thecommunication with the decision module and robot piloting modules. Moduleintegration was performed using a special-purpose integration tool, which hasgreatly simplified the integration process as it allows developers to integratetheir modules into an architecture consisting of a mix of mock-up modules,man-machine interfaces, and real modules. This was very helpful as moduledevelopers were located in different countries with different working hoursand with limited possibilities for face-to-face meetings.
The validation of each module is equivalent to validation of the knowledgebases (models). The validation of a model was performed by a careful inves-tigation of the performance and behaviour of the system based on a selectedset of test scenarios.
Extensive prototyping has helped to ensure appropriate performance andbehaviour of each module. The test cases used to validate and measure theperformance of a model covers all important, critical situations that possiblycan occur in realistic operations. Finally, domain expert(s) and the knowledgeengineers have evaluated the model against the test cases iteratively.

18 Anders L. Madsen and Uffe B. Kjærulff
The usefulness of each LIMID was evaluated by a sequence of trials whereeach LIMID was deployed as an intelligent module as part of the ADVO-CATE II architecture on the vehicles described above. In each trial the LIMIDwas deployed in an instantiation of the architecture consisting of a directorymodule, a decision module, a robot piloting module, and an intelligent mod-ule.
The DeepC model had an 88.4% accuracy on image quality assessment onthe test set consisting of 1048 sonar images. The sonar images were recordedat the ATLAS test pond in Bremen where the real sea trials were performed.
The BART model had a 93.4% accuracy on 36 selected test cases. The testcases where hand generated to reflect operation of BART at the Universityof Alcala campus.
No real trial data was available for the VORTEX model. Preliminary re-sults on simulated data were promising, but the data is of insufficient qualityfor a proper validation.
10 Discussion
We have presented an application of HUGIN to solve reasoning and deci-sion making problems under uncertainty related to diagnosis and controlof autonomous vehicles. The application is based on the ADVOCATE IIarchitecture. The ADVOCATE II architecture is a distributed architecturesupporting diagnosis and control of autonomous vehicles.
The main objective of the ADVOCATE II project was to develop anarchitecture to allow the implementation of intelligent modules for AGVsand AUVs in order to increase their reliability and efficiency.
The performance of the ADVOCATE II architecture is constrained by(soft) real-time requirements. This implies that the performance of the com-munication protocol and the intelligent modules needs to be very high. Thishas implied a high focus on computational performance in the model con-struction.
Not only does the communication architecture enable efficient integrationof different AI technologies into new and existing systems, but it also allowsvarious AI techniques to interact (through the decision module and robot pi-loting module, though). This option of interactions has been used to dedicatePGMs to certain types of problems and to have variables in a PGM representthe output of an NSS intelligent module (e.g., variable “NSS vehicle stalled”of the BART LIMID; see Fig. 8). In addition, different AI techniques maybe used to solve the same problem. This will often be the case for missioncritical error handling. In our case, this raises the issue of a common scale ofmeasurement of the usefulness of actions. We have chosen to use normalizedexpected utility as the measurement of usefulness of recovery actions.
Even though the framework of PGMs have been available for more than15 years, it is our experience that the efficient use of these models in certain

Applications of HUGIN 19
domains still requires some research and development. It is often a problemfor the PGM technology that only a few very convincing success stories areavailable to the public. Often a PGM captures all or almost all the knowledgea company has in a particular business area. This implies that the companyis not interested in sharing this model or even sharing the knowledge thatsuch a model exists. The results of the ADVOCATE II project, however, addto the increasing number of successful applications of PGMs available to thepublic.
One of our key experiences from research and development projects is thateven though graphical models are intuitive, they are difficult to build for in-experienced domain experts. In the ADVOCATE II project, it was necessaryto develop a new methodology to solve the knowledge acquisition task. Wehave developed a knowledge elicitation and formulation method, which is ap-plicable in general to problems of reasoning and decision making on complexmachinery such as AGVs and AUVs.
The LIMID representation [11] and the object-oriented knowledge rep-resentation paradigm [10] implemented in the HUGIN tool [1,5] have beentwo major cornerstones of the success of Bayesian modeling in the ADVO-CATE II project. Still a lot of work remains to develop the object-orientedframework further.
Acknowledgment We acknowledge the partners of ADVOCATE II: Uni-versity of Alcala (Spain), Getronics (France), Technical University of Madrid(Spain), ATLAS Elektronik GmbH (Germany), Ifremer (France), HUGIN Ex-pert A/S (Denmark), Innova S.p.A (Italy), and e-motive (France). The EUCommission supported the ADVOCATE II project under grant IST-2001-34508. Visit the project web-site for more information on ADVOCATE II:
http://www.advocate-2.com
Please visit the company web-site for more information on applicationsusing HUGIN software:
http://www.hugin.com
References
1. S. K. Andersen, K. G. Olesen, F. V. Jensen, and F. Jensen. HUGIN — a Shellfor Building Bayesian Belief Universes for Expert Systems. In Proceedings of
IJCAI’89, pages 1080–1085, 1989.2. R. G. Cowell, A. P. Dawid, S. L. Lauritzen, and D. J. Spiegelhalter. Probabilistic
Networks and Expert Systems. Springer-Verlag, 1999.3. R. A. Howard and J. E. Matheson. Influence Diagrams. In The Principles and
Applications of Decision Analysis, volume 2, chapter 37, pages 721–762. 1981.4. F. Jensen, F. V. Jensen, and S. L. Dittmer. From Influence Diagrams to Junc-
tion Trees. In Proceedings of 10th Conference on UAI, pages 367–373, 1994.

20 Anders L. Madsen and Uffe B. Kjærulff
5. F. Jensen, U. B. Kjærulff, M. Lang, and A. L. Madsen. HUGIN - The Tool forBayesian Networks and Influence Diagrams. In Proceedings of PGM’02, pages212–221, 2002.
6. F. V. Jensen. Bayesian Networks and Decision Graphs. Springer-Verlag, 2001.7. F. V. Jensen, S. L. Lauritzen, and K. G. Olesen. Bayesian updating in causal
probabilistic networks by local computations. Computational Statistics Quar-
terly, 4:269–282, 1990.8. J. Kalwa and A. L. Madsen. Sonar image quality assessment for an autonomous
underwater vehicle. In Proceedings of ISORA’04, 2004.9. U. B. Kjærulff and A. L. Madsen. A methodology for acquiring qualitative
knowledge for probabilistic graphical models. In Proceedings of IPMU’04, pages143–150, 2004.
10. D. Koller and A. Pfeffer. Object-oriented Bayesian networks. In Proceedings of
UAI’97, pages 302–313, 1997.11. S. L. Lauritzen and D. Nilsson. Representing and solving decision problems
with limited information. Management Science, 47:1238–1251, 2001.12. S. L. Lauritzen and D. J. Spiegelhalter. Local computations with probabilities
on graphical structures and their application to expert systems. Journal of the
Royal Statistical Society, Series B, 50(2):157–224, 1988.13. A.L. Madsen, M. Lang, U. Kjærulff, and F. Jensen. The Hugin Tool for Learning
Bayesian Networks. In Proceedings of 7th European Conference on Symbolic and
Quantitative Approaches to Reasoning with Uncertainty, pages 594–605, 2003.14. R. E. Neapolitan. Learning Bayesian Networks. Prentice Hall, 2003.15. J. Pearl. Probabilistic Reasoning in Intelligence Systems. Series in Representa-
tion and Reasoning. Morgan Kaufmann Publishers, 1988.16. R. Shachter. Efficient Value of Information Computation. In Proceedings of
UAI’99, pages 594–601, 1999.