applications of graph theory in computer science an overview
12
S.G. Shrinivas et. al. / International Journal of Engineering Science and Technology Vol. 2(9), 2010, 4610-4621 APPLICATIONS OF GRAPH THEORY IN COMPUTER SCIENCE AN OVERVIEW S.G.Shirinivas, Dept of Computer Applications, Chettinad College of Engineering and Technology Karur ,Tamilnadu,India-639114 S.Vetrivel Dept of Computer Applications, Chettinad College of Engineering and Technology Karur ,Tamilnadu,India-639114 Dr. N.M.Elango Professor, Dept of Computer Applications Oxford College of Engineering, Bangalore. Abstract: The field of mathematics plays vital role in various fields. One of the important areas in mathematics is graph theory which is used in structural models. This structural arrangements of various objects or technologies lead to new inventions and modifications in the existing environment for enhancement in those fields. The field graph theory started its journey from the problem of Koinsberg bridge in 1735. This paper gives an overview of the applications of graph theory in heterogeneous fields to some extent but mainly focuses on the computer science applications that uses graph theoretical concepts. Various papers based on graph theory have been studied related to scheduling concepts, computer science applications and an overview has been presented here. Keywords: Bipartite graph, Ad-hoc networks, Geometric spanner, Median graph, Voronoi graph. Introduction: Graph theoretical ideas are highly utilized by computer science applications. Especially in research areas of computer science such data mining, image segmentation, clustering, image capturing, networking etc., For example a data structure can be designed in the form of tree which in turn utilized vertices and edges. Similarly modeling of network topologies can be done using graph concepts. In the same way the most important concept of graph coloring is utilized in resource allocation, scheduling. Also, paths, walks and circuits in graph theory are used in tremendous applications say traveling salesman problem, database design concepts, resource networking. This leads to the development of new algorithms and new theorems that can be used in tremendous applications. This paper has been divided into two sections. First section gives the historical background of graph theory and some applications in scheduling. Second section emphasizes how graph theory is utilized in various computer applications Section – I: History of Graph theory: The origin of graph theory started with the problem of Koinsber bridge, in 1735. This problem lead to the concept of Eulerian Graph. Euler studied the problem of Koinsberg bridge and constructed a structure to solve the problem called Eulerian graph. In 1840, A.F Mobius gave the idea of complete graph and bipartite graph and Kuratowski proved that they are planar by means of recreational problems. The concept of tree, (a connected graph without cycles[7]) was implemented by Gustav Kirchhoff in 1845, and he employed graph theoretical ideas in the calculation of currents in electrical networks or circuits. In 1852, Thomas Gutherie found the famous four color problem. Then in 1856, Thomas. P. Kirkman and William R.Hamilton studied cycles on polyhydra and invented the concept called Hamiltonian graph by studying trips that visited certain sites exactly once. In 1913, H.Dudeney mentioned a puzzle problem. Eventhough the four color problem was invented it was solved only after a century by Kenneth Appel and Wolfgang Haken. This time is considered as the birth of Graph Theory. ISSN: 0975-5462 4610
-
Upload
truongkien -
Category
Documents
-
view
221 -
download
1
Transcript of applications of graph theory in computer science an overview
S.G. Shrinivas et. al. / International Journal of Engineering Science and Technology Vol. 2(9), 2010, 4610-4621
APPLICATIONS OF GRAPH THEORY IN COMPUTER SCIENCE AN OVERVIEW
S.G.Shirinivas, Dept of Computer Applications,
Chettinad College of Engineering and Technology Karur ,Tamilnadu,India-639114
S.Vetrivel Dept of Computer Applications,
Chettinad College of Engineering and Technology Karur ,Tamilnadu,India-639114
Dr. N.M.Elango Professor, Dept of Computer Applications Oxford College of Engineering, Bangalore.
Abstract:
The field of mathematics plays vital role in various fields. One of the important areas in mathematics is graph theory which is used in structural models. This structural arrangements of various objects or technologies lead to new inventions and modifications in the existing environment for enhancement in those fields. The field graph theory started its journey from the problem of Koinsberg bridge in 1735. This paper gives an overview of the applications of graph theory in heterogeneous fields to some extent but mainly focuses on the computer science applications that uses graph theoretical concepts. Various papers based on graph theory have been studied related to scheduling concepts, computer science applications and an overview has been presented here. Keywords: Bipartite graph, Ad-hoc networks, Geometric spanner, Median graph, Voronoi graph.
Introduction:
Graph theoretical ideas are highly utilized by computer science applications. Especially in research areas of computer science such data mining, image segmentation, clustering, image capturing, networking etc., For example a data structure can be designed in the form of tree which in turn utilized vertices and edges. Similarly modeling of network topologies can be done using graph concepts. In the same way the most important concept of graph coloring is utilized in resource allocation, scheduling. Also, paths, walks and circuits in graph theory are used in tremendous applications say traveling salesman problem, database design concepts, resource networking. This leads to the development of new algorithms and new theorems that can be used in tremendous applications. This paper has been divided into two sections. First section gives the historical background of graph theory and some applications in scheduling. Second section emphasizes how graph theory is utilized in various computer applications
Section – I:
History of Graph theory:
The origin of graph theory started with the problem of Koinsber bridge, in 1735. This problem lead to the concept of Eulerian Graph. Euler studied the problem of Koinsberg bridge and constructed a structure to solve the problem called Eulerian graph. In 1840, A.F Mobius gave the idea of complete graph and bipartite graph and Kuratowski proved that they are planar by means of recreational problems. The concept of tree, (a connected graph without cycles[7]) was implemented by Gustav Kirchhoff in 1845, and he employed graph theoretical ideas in the calculation of currents in electrical networks or circuits. In 1852, Thomas Gutherie found the famous four color problem. Then in 1856, Thomas. P. Kirkman and William R.Hamilton studied cycles on polyhydra and invented the concept called Hamiltonian graph by studying trips that visited certain sites exactly once. In 1913, H.Dudeney mentioned a puzzle problem. Eventhough the four color problem was invented it was solved only after a century by Kenneth Appel and Wolfgang Haken. This time is considered as the birth of Graph Theory.
ISSN: 0975-5462 4610
S.G. Shrinivas et. al. / International Journal of Engineering Science and Technology Vol. 2(9), 2010, 4610-4621
Caley studied particular analytical forms from differential calculus to study the trees. This had many implications in theoretical chemistry. This lead to the invention of enumerative graph theory. Any how the term “Graph” was introduced by Sylvester in 1878 where he drew an analogy between “Quantic invariants” and co-variants of algebra and molecular diagrams. In 1941, Ramsey worked on colorations which lead to the identification of another branch of graph theory called extremel graph theory. In 1969, the four color problem was solved using computers by Heinrich. The study of asymptotic graph connectivity gave rise to random graph theory. [7]
Applications of Graph theory: Graph theoretical concepts are widely used to study and model various applications, in different areas.
They include, study of molecules, construction of bonds in chemistry and the study of atoms. Similarly, graph theory is used in sociology for example to measure actors prestige or to explore diffusion mechanisms. Graph theory is used in biology and conservation efforts where a vertex represents regions where certain species exist and the edges represent migration path or movement between the regions. This information is important when looking at breeding patterns or tracking the spread of disease, parasites and to study the impact of migration that affect other species. Graph theoretical concepts are widely used in Operations Research. For example, the traveling salesman problem, the shortest spanning tree in a weighted graph, obtaining an optimal match of jobs and men and locating the shortest path between two vertices in a graph. It is also used in modeling transport networks, activity networks and theory of games. The network activity is used to solve large number of combinatorial problems. The most popular and successful applications of networks in OR is the planning and scheduling of large complicated projects. The best well known problems are PERT(Project Evaluation Review Technique) and CPM (Critical Path Method). Next, Game theory is applied to the problems in engineering, economics and war science to find optimal way to perform certain tasks in competitive environments. To represent the method of finite game a digraph is used. Here, the vertices represent the positions and the edges represent the moves.
Graphs in Chemistry: Graphs are used in the field of chemistry to model chemical compounds. In computational biochemistry
some sequences of cell samples have to be excluded to resolve the conflicts between two sequences. This is modeled in the form of graph where the vertices represent the sequences in the sample. An edge will be drawn between two vertices if and only if there is a conflict between the corresponding sequences. The aim is to remove possible vertices, (sequences) to eliminate all conflicts. In brief, graph theory has its unique impact in various fields and is growing large now a days. The subsequent section analyses the applications of graph theory especially in computer science.
Algorithms and graph theory: The major role of graph theory in computer applications is the development of graph algorithms. Numerous
algorithms are used to solve problems that are modeled in the form of graphs. These algorithms are used to solve the graph theoretical concepts which intern used to solve the corresponding computer science application problems. Some algorithms are as follows: 1. Shortest path algorithm in a network 2. Finding a minimum spanning tree 3. Finding graph planarity 4. Algorithms to find adjacency matrices. 5. Algorithms to find the connectedness 6. Algorithms to find the cycles in a graph 7. Algorithms for searching an element in a data structure (DFS, BFS) and so on.
Various computer languages are used to support the graph theory concepts. The main goal of such languages is to enable the user to formulate operations on graphs in a compact and natural manner Some graph theoretic languages are
1. SPANTREE – To find a spanning tree in the given graph. 2. GTPL – Graph Theoretic Language 3. GASP – Graph Algorithm Software Package 4. HINT – Extension of LISP 5. GRASPE – Extension of LISP 6. IGTS – Extension of FORTRAN 7. GEA – Graphic Extended ALGOL (Extension of ALGOL) 8. AMBIT – To manipulate digraphs 9. GIRL – Graph Information Retrieval Language 10. FGRAAL – FORTRAN Extended Graph Algorithmic Language [7]
ISSN: 0975-5462 4611
S.G. Shrinivas et. al. / International Journal of Engineering Science and Technology Vol. 2(9), 2010, 4610-4621
Use of graph enumeration techniques: Graph enumeration technique is used to identify the computerized chemical identification. The list of all
distinct chemical structures will be generated based on the given chemical formula and the valence rules for any new substance. To identify the chemical compounds automatically, a computer language called DENDRAL has been developed.[7]
Graph Theory in OR:
Graph theory is a very natural and powerful tool in combinatorial operations research. Some important OR problems that can be solved using graphs are given here. A network called transport network where a graph is used to model the transportation of commodity from one place to another. The objective is to maximize the flow or minimize the cost within the prescribed flow. The graph theoretic approach is found more efficient for these types of problems though they have more constraints [7].
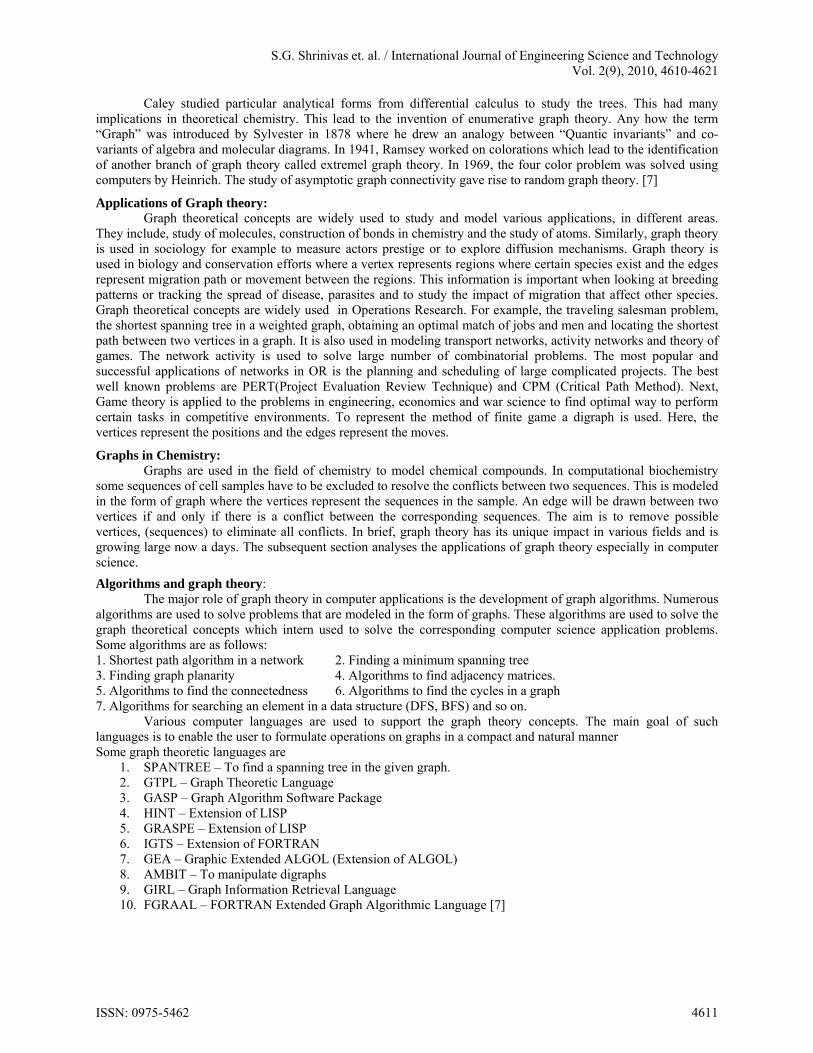
Graph Coloring: Graph coloring is one of the most important concepts in graph theory and is used in many real time
applications in computer science. Various coloring methods are available and can be used on requirement basis. The proper coloring of a graph is the coloring of the vertices and edges with minimal number of colors such that no two vertices should have the same color. The minimum number of colors is called as the chromatic number and the graph is called properly colored graph [7].
C1 C2
C2 C3 Figure -1 Figure -2 Proper vertex coloring with Chromatic number 3 Proper edge coloring with Chromatic number 3
Graph coloring techniques in scheduling: Here some scheduling problems that uses variants of graph coloring methodologies such as precoloring, list
coloring, multicoloring, minimum sum coloring are given in brief.
Job scheduling: Here the jobs are assumed as the vertices of the graph and there is an edge between two jobs if they cannot
be executed simultaneously. There is a 1-1 correspondence between the feasible schedulings of the jobs and the colorings of the graph. [4]
Aircraft scheduling: Assuming that there are k aircrafts and they have to be assigned n flights. The ith flight should be during
the time interval (ai, bi). If two flights overlap, then the same aircraft cannot be assigned to both the flights. This problem is modeled as a graph as follows.
The vertices of the graph correspond to the flights. Two vertices will be connected, if the corresponding time intervals overlap. Therefore, the graph is an interval graph that can be colored optimally in polynomial time. [4]
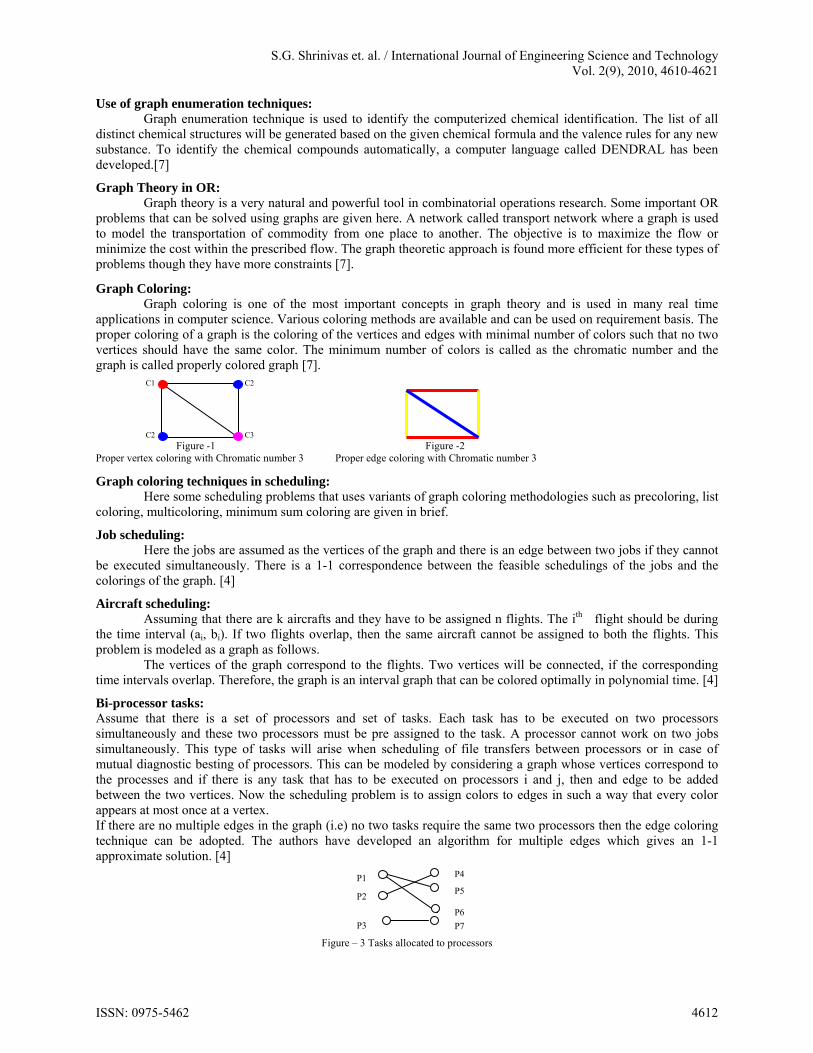
Bi-processor tasks: Assume that there is a set of processors and set of tasks. Each task has to be executed on two processors simultaneously and these two processors must be pre assigned to the task. A processor cannot work on two jobs simultaneously. This type of tasks will arise when scheduling of file transfers between processors or in case of mutual diagnostic besting of processors. This can be modeled by considering a graph whose vertices correspond to the processes and if there is any task that has to be executed on processors i and j, then and edge to be added between the two vertices. Now the scheduling problem is to assign colors to edges in such a way that every color appears at most once at a vertex. If there are no multiple edges in the graph (i.e) no two tasks require the same two processors then the edge coloring technique can be adopted. The authors have developed an algorithm for multiple edges which gives an 1-1 approximate solution. [4]
Figure – 3 Tasks allocated to processors
P1
P2
P3
P4
P5 P6
P7
ISSN: 0975-5462 4612
S.G. Shrinivas et. al. / International Journal of Engineering Science and Technology Vol. 2(9), 2010, 4610-4621
The diagram shows the tasks namely task1, task2, task3 and task4 are allocated to the processors (P1, P5); (P1, P6); (P2, P4) and (P3, P7) respectively
Precoloring extension: In certain scheduling problems, the assignments of jobs are already decided. In such cases precoloring
technique can be adopted. Here some vertices of the graph will have preassigned color and the precoloring problem has to be solved by extending the coloring of the vertices for the whole graph using minimum number of colors. [4].
List coloring: In list coloring problem, each vertex v has a list of available colors and we have to find a coloring where
the color of each vertex is taken from the list of available colors. This list coloring can be used to model situations where a job can be processed only in certain time slots or can be processed only by certain machines.[4]
Minimum sum coloring: In minimum sum coloring, the sum of the colors assigned to the vertices is minimal in the graph. The
minimum sum coloring technique can be applied to the scheduling theory of minimizing the sum of completion times of the jobs. The multicolor version of the problem can be used to model jobs with arbitrary lengths. Here, the finish time of a vertex is the largest color assigned to it and the sum of coloring is the sum of the finish time of the vertices. That is the sum of the finish times in a multicoloring is equal to the sum of completion times in the corresponding schedule.[4]
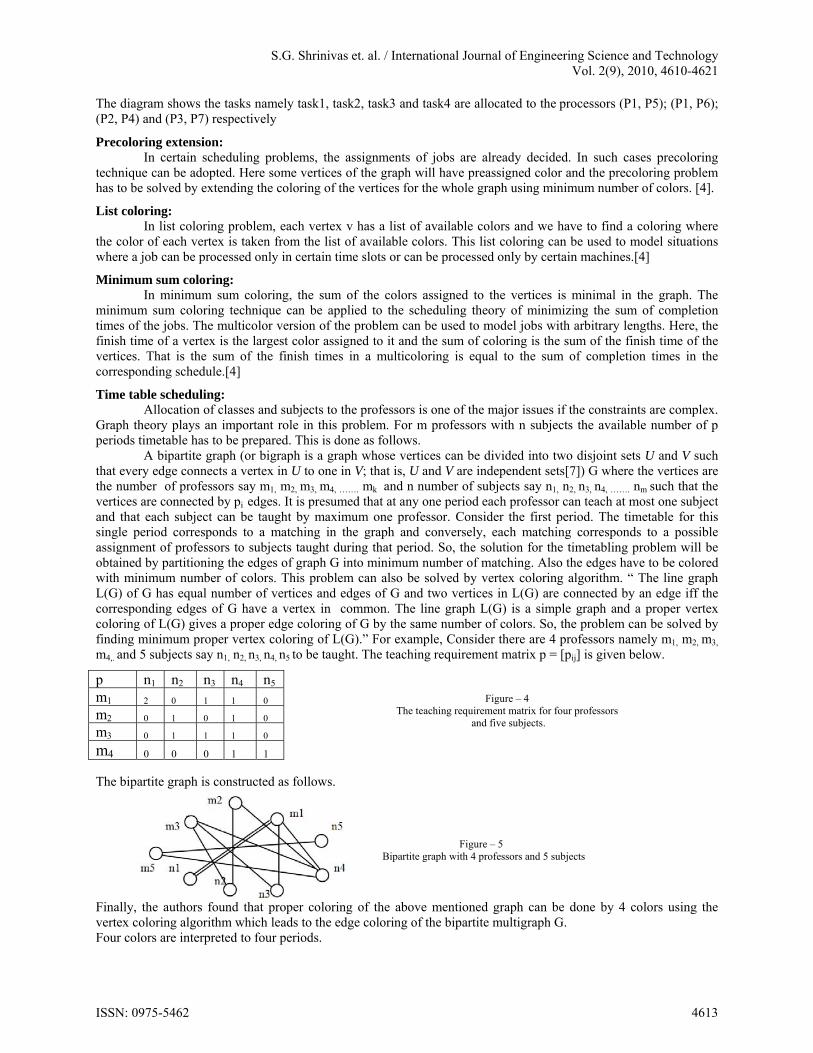
Time table scheduling: Allocation of classes and subjects to the professors is one of the major issues if the constraints are complex.
Graph theory plays an important role in this problem. For m professors with n subjects the available number of p periods timetable has to be prepared. This is done as follows.
A bipartite graph (or bigraph is a graph whose vertices can be divided into two disjoint sets U and V such that every edge connects a vertex in U to one in V; that is, U and V are independent sets[7]) G where the vertices are the number of professors say m1, m2, m3, m4, ……. mk and n number of subjects say n1, n2, n3, n4, ……. nm such that the vertices are connected by pi edges. It is presumed that at any one period each professor can teach at most one subject and that each subject can be taught by maximum one professor. Consider the first period. The timetable for this single period corresponds to a matching in the graph and conversely, each matching corresponds to a possible assignment of professors to subjects taught during that period. So, the solution for the timetabling problem will be obtained by partitioning the edges of graph G into minimum number of matching. Also the edges have to be colored with minimum number of colors. This problem can also be solved by vertex coloring algorithm. “ The line graph L(G) of G has equal number of vertices and edges of G and two vertices in L(G) are connected by an edge iff the corresponding edges of G have a vertex in common. The line graph L(G) is a simple graph and a proper vertex coloring of L(G) gives a proper edge coloring of G by the same number of colors. So, the problem can be solved by finding minimum proper vertex coloring of L(G).” For example, Consider there are 4 professors namely m1, m2, m3,
m4,. and 5 subjects say n1, n2, n3, n4, n5 to be taught. The teaching requirement matrix p = [pij] is given below.
Figure – 4 The teaching requirement matrix for four professors
and five subjects.
The bipartite graph is constructed as follows.
Figure – 5 Bipartite graph with 4 professors and 5 subjects
Finally, the authors found that proper coloring of the above mentioned graph can be done by 4 colors using the vertex coloring algorithm which leads to the edge coloring of the bipartite multigraph G. Four colors are interpreted to four periods.
p n1 n2 n3 n4 n5
m1 2 0 1 1 0
m2 0 1 0 1 0
m3 0 1 1 1 0
m4 0 0 0 1 1
ISSN: 0975-5462 4613
S.G. Shrinivas et. al. / International Journal of Engineering Science and Technology Vol. 2(9), 2010, 4610-4621
Figure - 6 The schedule for the four subjects
One more timetabling problem: College Course Timetabling Problem (CCTP) can be solved by graph coloring algorithm. Based on the
constraints the algorithm has been developed. It consists of three modules. Creation of vertices and edges of the graph from the constraints. Finding the coloration of the created graph with the specified number of colors using soft computing
approach. Preparation of final time table.
Since this paper focuses to stress the importance of graph applications the graph theory part of the CCTP paper is given here. Some constraints are
Class room utilization Classes held for the same stream lab as well as theory Room preferences Professors available Number of periods Preference of practical classes by the professors etc., Here, a single vertex is represented by the structure with the members namely, the course code, course type,
stream, semester, time_of_day, number of days, period, room and vertex number. The graph is created by means of a two dimensional matrix n x n where n represents the number of vertex. Each vertex represents a class. An edge will be drawn between two vertices that satisfy all the given constraints.
Consider the values of two vertices V1: course code - cs301; Course type – theory; Instructor – Prof. A; Stream – CSE; Group – 0; Semester – 2; Time of day – 1; Number of days – 3; Period – 1; Room – A-304; Vertex number – 30; and the vertex V2 with course code - cs303; course type – theory; Instructor – Prof B; Stream – CSE; Group – 0; Semester – 2; Time of day – 3; Number of days – 3; period – 1; Room – A-306; vertex number 61.
The two vertices have the same values for stream, semester and group and so they cannot occur simultaneously. Therefore, an edge will be drawn between v1 and v2. The algorithm is given by the authors as follows:
Graph construction algorithm: Enter the course structure with the details Enter the number of available rooms Allocate the rooms to the courses satisfying different constraints in a fashion. Create vertices of the graph Update the edges and adjacency matrix using the current constraints.
Secondly, the authors have used a hybrid soft computing algorithm to color the graph. 1) A heuristic search using ACO to generate initial population. 2) The Evolutionary Algorithm with some modification Combination of the above two is used to represent the set of integers (chromosomes) where the integer set is the
color of the nodes. The position of these integers is the node numbers to which a particular color is assigned. Then the authors used a special mutation operator to improve the chromosome in the pool. The adjacency matrix is given as input to the mementic algorithm (The combination of ACO and modified GA)which has been developed to color the graph. The best coloration is chosen as the output. Then from the above coloration method, the final timetable is prepared. [2]
Job shop scheduling problems: (JSS)
Various techniques are available to schedule job shop problems. Number of machines have to be utilized effectively to complete the task. In this paper the authors have constructed a tabu search technique and they have developed a new algorithm.
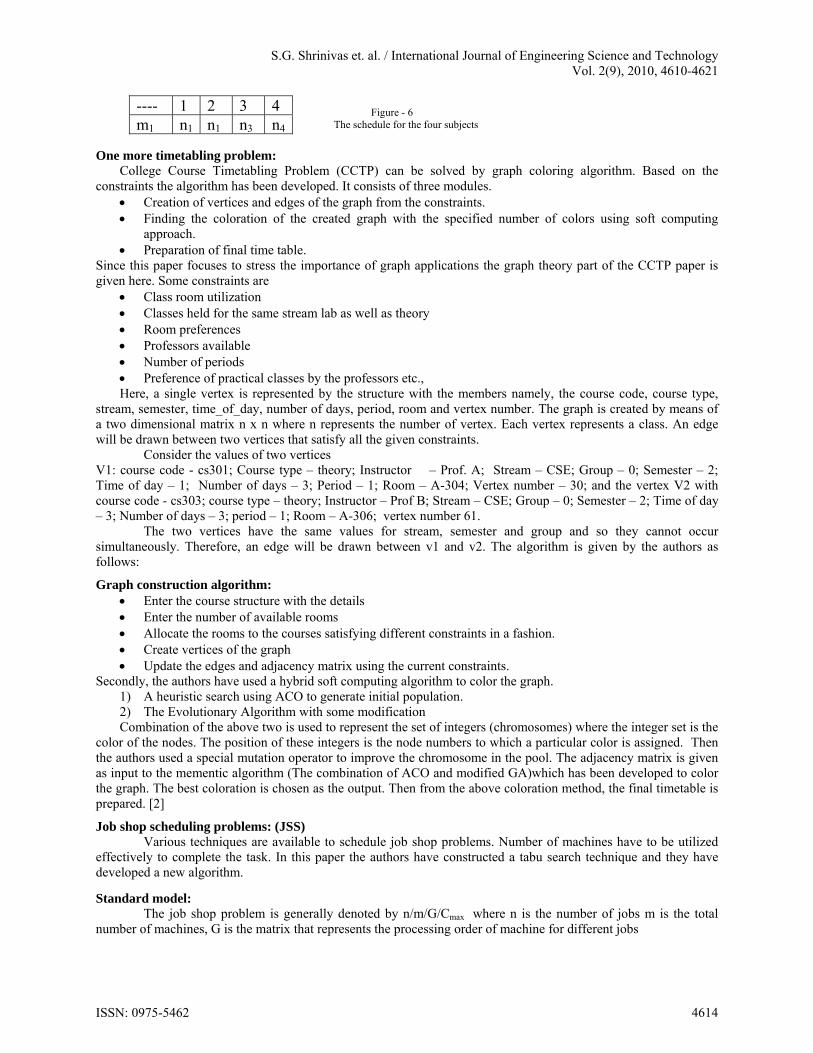
Standard model: The job shop problem is generally denoted by n/m/G/Cmax where n is the number of jobs m is the total
number of machines, G is the matrix that represents the processing order of machine for different jobs
---- 1 2 3 4 m1 n1 n1 n3 n4
ISSN: 0975-5462 4614
S.G. Shrinivas et. al. / International Journal of Engineering Science and Technology Vol. 2(9), 2010, 4610-4621
M2 M3 M1
G = M1 M2 M3
M3 M1 M2
Cmax represents the completion time of the last operation. The objective is to minimize the value of Cmax Let J= Set of jobs 1,2,3,4,….n. M = The set of machines
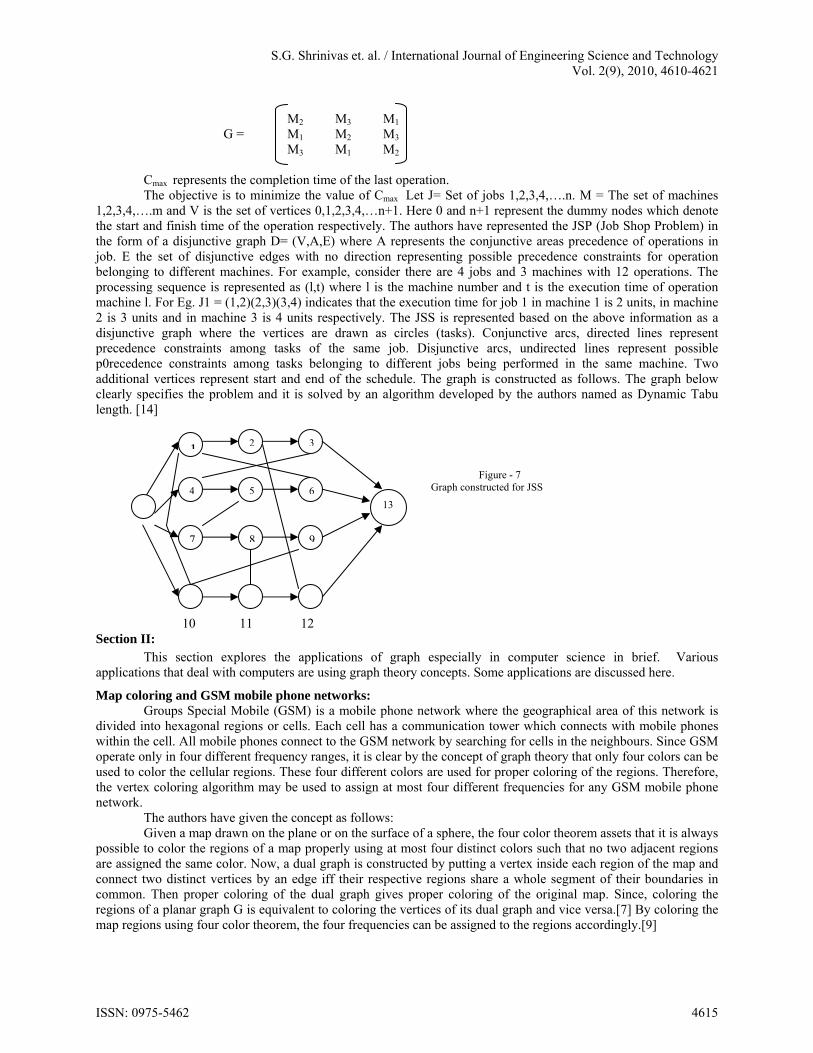
1,2,3,4,….m and V is the set of vertices 0,1,2,3,4,…n+1. Here 0 and n+1 represent the dummy nodes which denote the start and finish time of the operation respectively. The authors have represented the JSP (Job Shop Problem) in the form of a disjunctive graph D= (V,A,E) where A represents the conjunctive areas precedence of operations in job. E the set of disjunctive edges with no direction representing possible precedence constraints for operation belonging to different machines. For example, consider there are 4 jobs and 3 machines with 12 operations. The processing sequence is represented as (l,t) where l is the machine number and t is the execution time of operation machine l. For Eg. J1 = (1,2)(2,3)(3,4) indicates that the execution time for job 1 in machine 1 is 2 units, in machine 2 is 3 units and in machine 3 is 4 units respectively. The JSS is represented based on the above information as a disjunctive graph where the vertices are drawn as circles (tasks). Conjunctive arcs, directed lines represent precedence constraints among tasks of the same job. Disjunctive arcs, undirected lines represent possible p0recedence constraints among tasks belonging to different jobs being performed in the same machine. Two additional vertices represent start and end of the schedule. The graph is constructed as follows. The graph below clearly specifies the problem and it is solved by an algorithm developed by the authors named as Dynamic Tabu length. [14]
Figure - 7
Graph constructed for JSS
10 11 12 10 11 12 Section II:
This section explores the applications of graph especially in computer science in brief. Various applications that deal with computers are using graph theory concepts. Some applications are discussed here.
Map coloring and GSM mobile phone networks: Groups Special Mobile (GSM) is a mobile phone network where the geographical area of this network is
divided into hexagonal regions or cells. Each cell has a communication tower which connects with mobile phones within the cell. All mobile phones connect to the GSM network by searching for cells in the neighbours. Since GSM operate only in four different frequency ranges, it is clear by the concept of graph theory that only four colors can be used to color the cellular regions. These four different colors are used for proper coloring of the regions. Therefore, the vertex coloring algorithm may be used to assign at most four different frequencies for any GSM mobile phone network.
The authors have given the concept as follows: Given a map drawn on the plane or on the surface of a sphere, the four color theorem assets that it is always
possible to color the regions of a map properly using at most four distinct colors such that no two adjacent regions are assigned the same color. Now, a dual graph is constructed by putting a vertex inside each region of the map and connect two distinct vertices by an edge iff their respective regions share a whole segment of their boundaries in common. Then proper coloring of the dual graph gives proper coloring of the original map. Since, coloring the regions of a planar graph G is equivalent to coloring the vertices of its dual graph and vice versa.[7] By coloring the map regions using four color theorem, the four frequencies can be assigned to the regions accordingly.[9]
1 2 3
4 5 6
7 8 9
13
ISSN: 0975-5462 4615
S.G. Shrinivas et. al. / International Journal of Engineering Science and Technology Vol. 2(9), 2010, 4610-4621
Graph algorithm in computer network security: The vertex cover algorithm (Given as input a simple graph G with n vertices labeled 1, 2, …, n, search for a
vertex cover of size at most k. At each stage, if the vertex cover obtained has size at most k, then stop.[7]) is used to simulate the propagation of stealth worms on large computer networks and design optimal strategies to protect the network against virus attacks in real time. Simulation was carried out in large internet like virtual network and showed that the topology routing has big impact on worm propagation. The importance of finding the worm propagation is to hinder them in real time. The main idea here is to find a minimum vertex cover in the graph whose vertices are the routing servers and the edges are the connections between the routing servers. Then an optimal solution is found for worm propagation and a network defense strategy is defined. [9]
In a graph G, a set of edges g is said to cover G if every vertex in G is incident on atleast one edge in g. The set of edges that covers a graph G is said to be an edge covering or a covering subgraph or simply a covering of G. Eg. A spanning tree in a connected graph is a covering. A Hamiltonian circuit is also a covering. [7]
The sample computer network with corresponding minimum vertex cover is shown below.
6 4 5
Figure - 8 1 The vertex Set g={2,4,5} covers all the vertices in G
3 2
Graph theory relevant to ad-hoc networks:
Here, the authors have discussed the role of graph theory related to the issues in Mobile Adhoc Networks (MANETS). In Adhoc networks, issues such as connectivity, scalability, routing, modeling the network and simulation are to be considered. Since a network can be modeled as a graph, the model can be used to analyze these issues. Graphs can be algebraically represented as matrices. Also, networks can be automated by means of algorithms. The issues such as node density, mobility among the nodes, link formation between the nodes and packet routing have to be simulated. To simulate these concepts random graph theory is sued. The connectivity issues are analyzed by using graph spanners, (A geometric spanner or a k-spanner graph or a k-spanner was initially introduced as a weighted graph over a set of points as its vertices and every pair of vertices has a path between them of weight at most k times the spatial distance between these points, for a fixed k.[21]) proximity graphs,(A proximity graph is simply a graph in which two vertices are connected by an edge if and only if the vertices satisfy particular geometric requirements), sparsification and spectral graph theory. Various algorithms are also available to analyze the congestion in MANET’s where these networks are modeled based on graph theoretical ideas.[13]
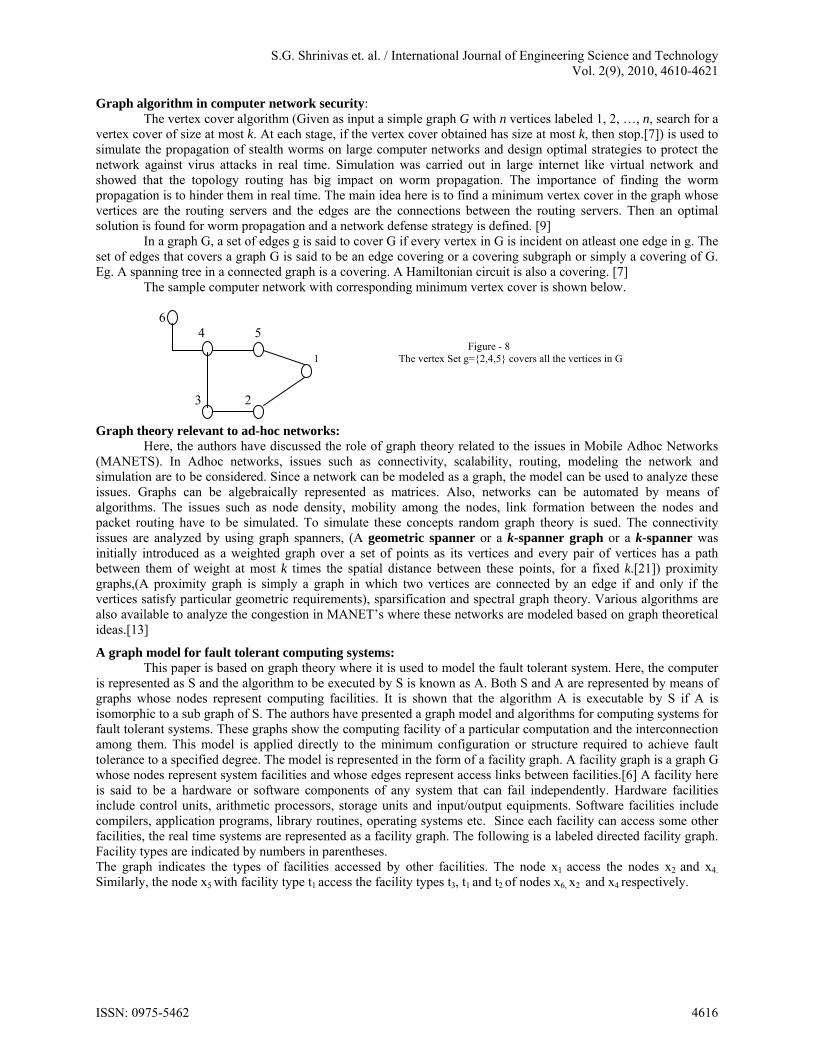
A graph model for fault tolerant computing systems: This paper is based on graph theory where it is used to model the fault tolerant system. Here, the computer
is represented as S and the algorithm to be executed by S is known as A. Both S and A are represented by means of graphs whose nodes represent computing facilities. It is shown that the algorithm A is executable by S if A is isomorphic to a sub graph of S. The authors have presented a graph model and algorithms for computing systems for fault tolerant systems. These graphs show the computing facility of a particular computation and the interconnection among them. This model is applied directly to the minimum configuration or structure required to achieve fault tolerance to a specified degree. The model is represented in the form of a facility graph. A facility graph is a graph G whose nodes represent system facilities and whose edges represent access links between facilities.[6] A facility here is said to be a hardware or software components of any system that can fail independently. Hardware facilities include control units, arithmetic processors, storage units and input/output equipments. Software facilities include compilers, application programs, library routines, operating systems etc. Since each facility can access some other facilities, the real time systems are represented as a facility graph. The following is a labeled directed facility graph. Facility types are indicated by numbers in parentheses. The graph indicates the types of facilities accessed by other facilities. The node x1 access the nodes x2 and x4.
Similarly, the node x5 with facility type t1 access the facility types t3, t1 and t2 of nodes x6, x2 and x4 respectively.
ISSN: 0975-5462 4616
S.G. Shrinivas et. al. / International Journal of Engineering Science and Technology Vol. 2(9), 2010, 4610-4621
Figure – 9 The facility graph
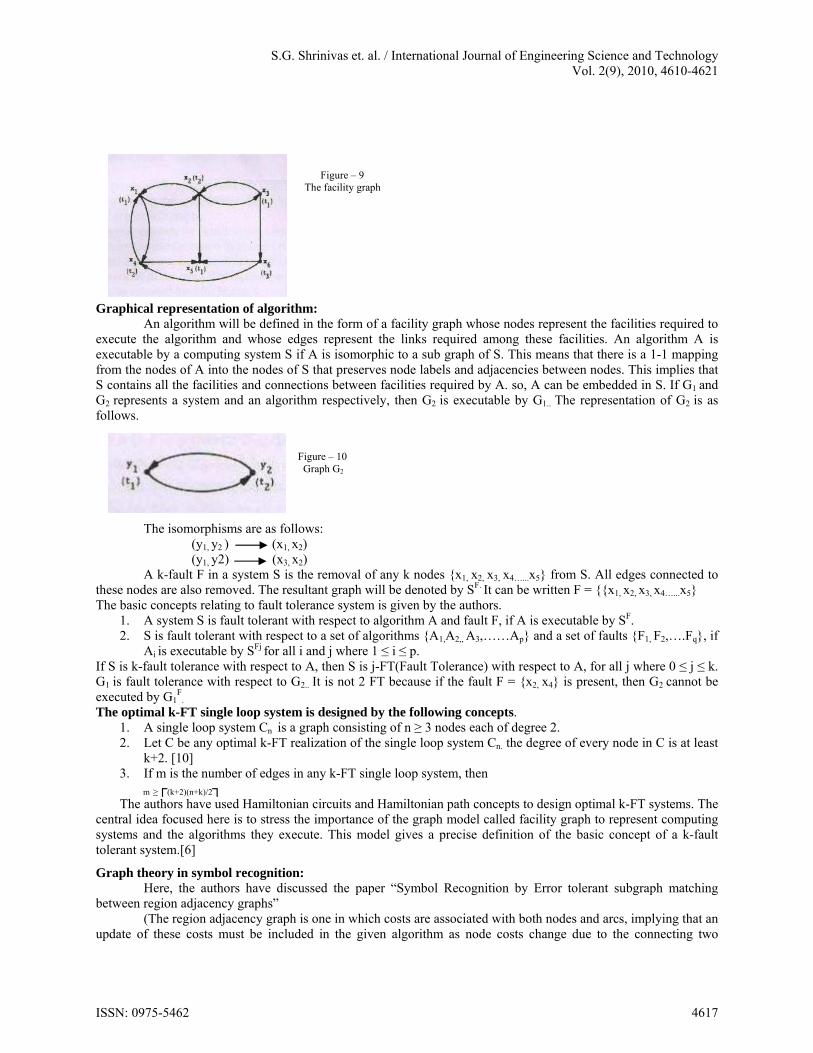
Graphical representation of algorithm: An algorithm will be defined in the form of a facility graph whose nodes represent the facilities required to
execute the algorithm and whose edges represent the links required among these facilities. An algorithm A is executable by a computing system S if A is isomorphic to a sub graph of S. This means that there is a 1-1 mapping from the nodes of A into the nodes of S that preserves node labels and adjacencies between nodes. This implies that S contains all the facilities and connections between facilities required by A. so, A can be embedded in S. If G1 and G2 represents a system and an algorithm respectively, then G2 is executable by G1.. The representation of G2 is as follows.
Figure – 10 Graph G2
The isomorphisms are as follows: (y1, y2 ) (x1, x2) (y1, y2) (x3, x2)
A k-fault F in a system S is the removal of any k nodes {x1, x2, x3, x4…...x5} from S. All edges connected to these nodes are also removed. The resultant graph will be denoted by SF. It can be written F = {{x1, x2, x3, x4…...x5} The basic concepts relating to fault tolerance system is given by the authors.
1. A system S is fault tolerant with respect to algorithm A and fault F, if A is executable by SF. 2. S is fault tolerant with respect to a set of algorithms {A1,A2,, A3,……Ap} and a set of faults {F1, F2,….Fq}, if
Ai is executable by SFj for all i and j where 1 ≤ i ≤ p. If S is k-fault tolerance with respect to A, then S is j-FT(Fault Tolerance) with respect to A, for all j where 0 ≤ j ≤ k. G1 is fault tolerance with respect to G2.. It is not 2 FT because if the fault F = {x2, x4} is present, then G2 cannot be executed by G1
F.
The optimal k-FT single loop system is designed by the following concepts. 1. A single loop system Cn is a graph consisting of n ≥ 3 nodes each of degree 2. 2. Let C be any optimal k-FT realization of the single loop system Cn. the degree of every node in C is at least
k+2. [10] 3. If m is the number of edges in any k-FT single loop system, then m ≥┌(k+2)(n+k)/2┐ The authors have used Hamiltonian circuits and Hamiltonian path concepts to design optimal k-FT systems. The
central idea focused here is to stress the importance of the graph model called facility graph to represent computing systems and the algorithms they execute. This model gives a precise definition of the basic concept of a k-fault tolerant system.[6]
Graph theory in symbol recognition: Here, the authors have discussed the paper “Symbol Recognition by Error tolerant subgraph matching
between region adjacency graphs” (The region adjacency graph is one in which costs are associated with both nodes and arcs, implying that an
update of these costs must be included in the given algorithm as node costs change due to the connecting two
ISSN: 0975-5462 4617
S.G. Shrinivas et. al. / International Journal of Engineering Science and Technology Vol. 2(9), 2010, 4610-4621
regions Ri and Rj. The graphs shown below are the segmented graph, the region adjacency graphs and its dual graph respectively) Figure – 11 Segmented graph, Region adjacency graph and its dual graph
The distorted image subgraph is matched with the model graph. That is the image region and the model
region are modeled as the image subgraph and model graph. The cost of adding a neighbour to the correspondence is the cost of the string edit distance aligning the polygonally approximated outer boundaries of the graphs consisting of the matched regions and the neighbour region candidates. This method is applicable to any region adjacency graph representation.[10]
Automatic channel allocation for small wireless local area networks using graph coloring algorithm approach:
In this paper the authors focuses channel allocation issue in wireless LAN by means of modeling the network in the form of a graph and solving it using graph coloring methodology.
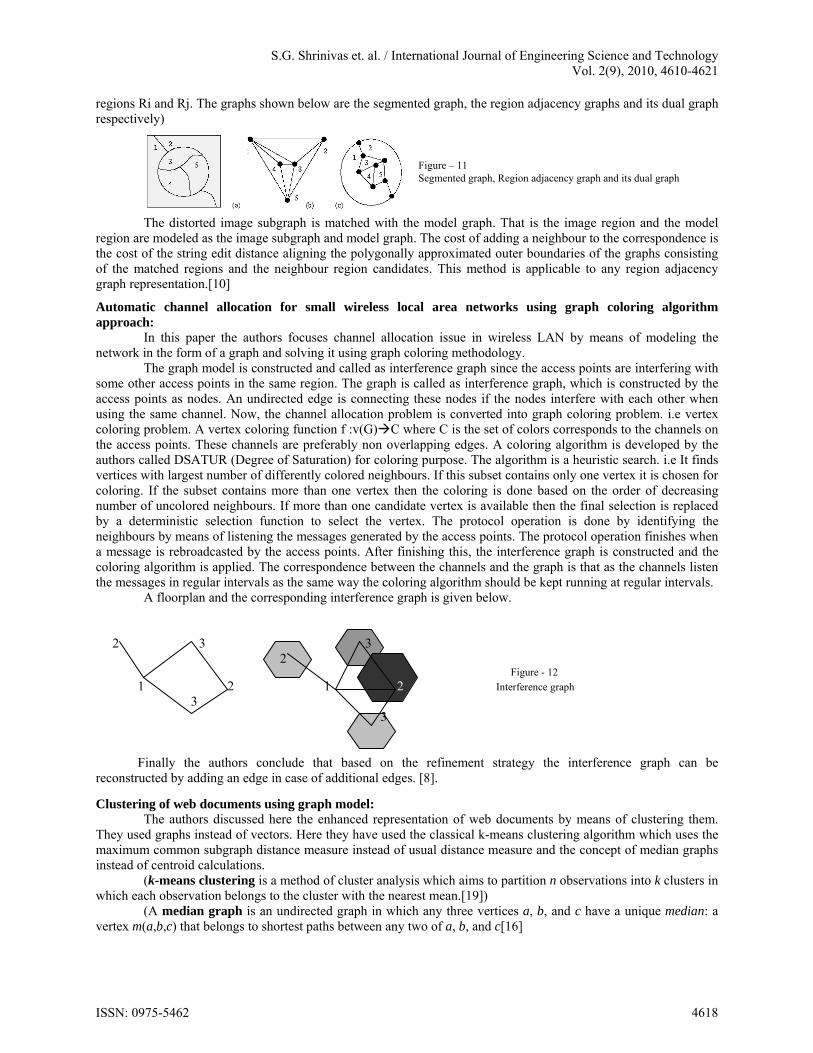
The graph model is constructed and called as interference graph since the access points are interfering with some other access points in the same region. The graph is called as interference graph, which is constructed by the access points as nodes. An undirected edge is connecting these nodes if the nodes interfere with each other when using the same channel. Now, the channel allocation problem is converted into graph coloring problem. i.e vertex coloring problem. A vertex coloring function f :v(G)C where C is the set of colors corresponds to the channels on the access points. These channels are preferably non overlapping edges. A coloring algorithm is developed by the authors called DSATUR (Degree of Saturation) for coloring purpose. The algorithm is a heuristic search. i.e It finds vertices with largest number of differently colored neighbours. If this subset contains only one vertex it is chosen for coloring. If the subset contains more than one vertex then the coloring is done based on the order of decreasing number of uncolored neighbours. If more than one candidate vertex is available then the final selection is replaced by a deterministic selection function to select the vertex. The protocol operation is done by identifying the neighbours by means of listening the messages generated by the access points. The protocol operation finishes when a message is rebroadcasted by the access points. After finishing this, the interference graph is constructed and the coloring algorithm is applied. The correspondence between the channels and the graph is that as the channels listen the messages in regular intervals as the same way the coloring algorithm should be kept running at regular intervals.
A floorplan and the corresponding interference graph is given below.
2 3 3
2 Figure - 12
1 2 1 2 Interference graph 3 3
Finally the authors conclude that based on the refinement strategy the interference graph can be reconstructed by adding an edge in case of additional edges. [8].
Clustering of web documents using graph model: The authors discussed here the enhanced representation of web documents by means of clustering them.
They used graphs instead of vectors. Here they have used the classical k-means clustering algorithm which uses the maximum common subgraph distance measure instead of usual distance measure and the concept of median graphs instead of centroid calculations.
(k-means clustering is a method of cluster analysis which aims to partition n observations into k clusters in which each observation belongs to the cluster with the nearest mean.[19])
(A median graph is an undirected graph in which any three vertices a, b, and c have a unique median: a vertex m(a,b,c) that belongs to shortest paths between any two of a, b, and c[16]
ISSN: 0975-5462 4618
S.G. Shrinivas et. al. / International Journal of Engineering Science and Technology Vol. 2(9), 2010, 4610-4621
Figure - 13
The median of three vertices in a median graph Since, traditional clustering methods are working purely on numeric feature vectors, the origi9nal data needs to be converted to a vector of numeric values by discarding possibly useful structural information. Otherwise, new customized algorithms have to be developed for specific representation.
Modeling the web documents as graphs has two significant benefits. 1. It keeps the inherent structure of the original documents, rather to arrive numeric feature vectors that
contain term frequencies. 2. There is no necessity to build new clustering algorithm completely from scratch. But the extension of
classical algorithms can be developed to deal with graphs that use numerical vectors. The graph model of the web documents has constructed by the following method.
1. Each word that appears in the web document except stop words is a vertex in the graph representing that document. This is executed by a node labeling function which gives labels to each node. Even though a word is repeated more than once, it is represented as only one vertex. Therefore each vertex in the graph represents a unique word and is labeled with a unique term which is not used to label any other node.
2. If any word say b follows another word say a then there is a directed edge between these two words a and b. If these two words are in a section say s, then the edge between a and b will be labeled as s.
3. Some punctuation marks are not taken into account for edge creation. 4. Three sections are defined here. They are sections for title tag, Section link and Section text. 5. The nodes and their corresponding incident edges to the words such as the, end, of, a, for, to etc., are
removed because these words don’t play much role. 6. A stemming check is performed for plural forms. 7. The most infrequent words are removed from each page by leaving maximum nodes say m for each and
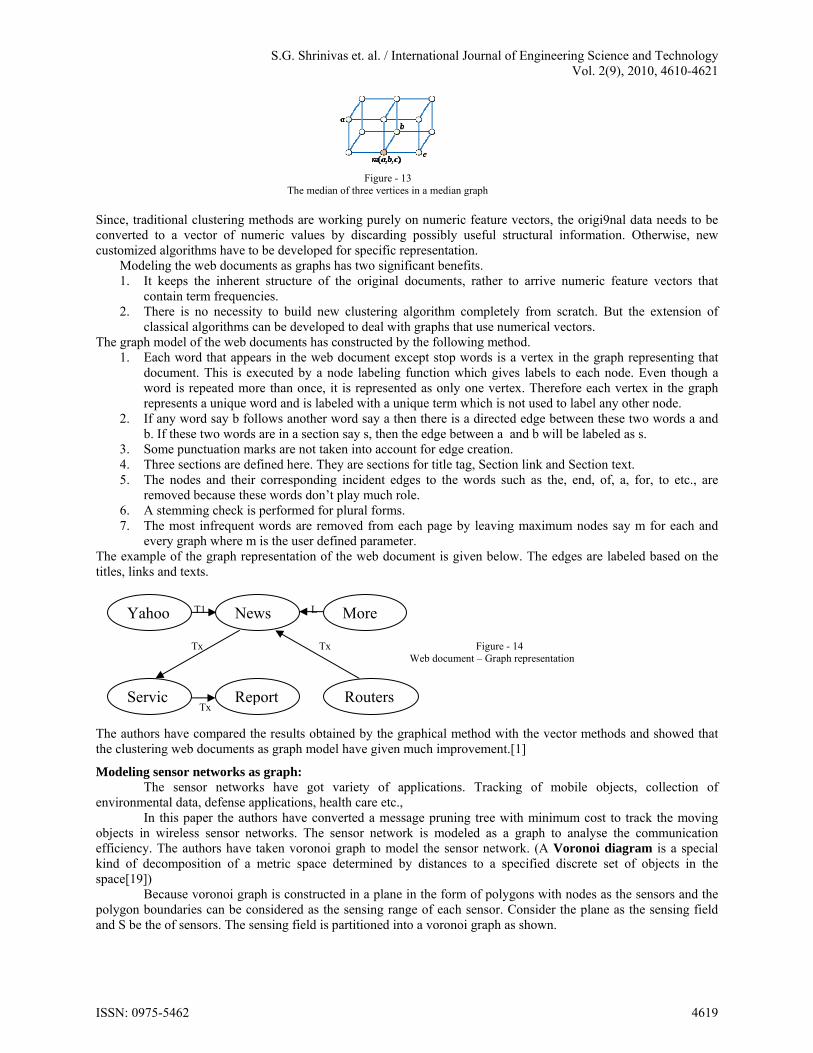
every graph where m is the user defined parameter. The example of the graph representation of the web document is given below. The edges are labeled based on the titles, links and texts. T1 L Tx Tx Figure - 14 Web document – Graph representation Tx
The authors have compared the results obtained by the graphical method with the vector methods and showed that the clustering web documents as graph model have given much improvement.[1]
Modeling sensor networks as graph: The sensor networks have got variety of applications. Tracking of mobile objects, collection of
environmental data, defense applications, health care etc., In this paper the authors have converted a message pruning tree with minimum cost to track the moving
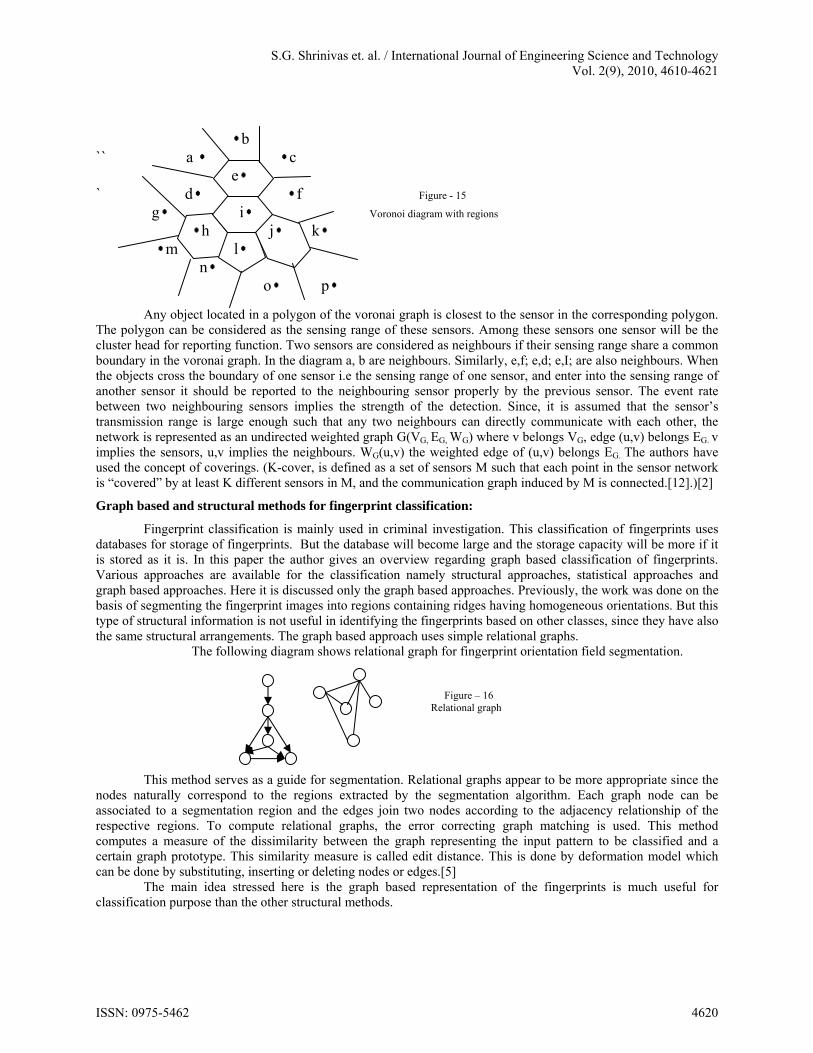
objects in wireless sensor networks. The sensor network is modeled as a graph to analyse the communication efficiency. The authors have taken voronoi graph to model the sensor network. (A Voronoi diagram is a special kind of decomposition of a metric space determined by distances to a specified discrete set of objects in the space[19])
Because voronoi graph is constructed in a plane in the form of polygons with nodes as the sensors and the polygon boundaries can be considered as the sensing range of each sensor. Consider the plane as the sensing field and S be the of sensors. The sensing field is partitioned into a voronoi graph as shown.
Yahoo News More
Servic Report Routers
ISSN: 0975-5462 4619
S.G. Shrinivas et. al. / International Journal of Engineering Science and Technology Vol. 2(9), 2010, 4610-4621
b `` a c e ` d f Figure - 15
g i Voronoi diagram with regions h j k
m l n
o p
Any object located in a polygon of the voronai graph is closest to the sensor in the corresponding polygon. The polygon can be considered as the sensing range of these sensors. Among these sensors one sensor will be the cluster head for reporting function. Two sensors are considered as neighbours if their sensing range share a common boundary in the voronai graph. In the diagram a, b are neighbours. Similarly, e,f; e,d; e,I; are also neighbours. When the objects cross the boundary of one sensor i.e the sensing range of one sensor, and enter into the sensing range of another sensor it should be reported to the neighbouring sensor properly by the previous sensor. The event rate between two neighbouring sensors implies the strength of the detection. Since, it is assumed that the sensor’s transmission range is large enough such that any two neighbours can directly communicate with each other, the network is represented as an undirected weighted graph G(VG, EG, WG) where v belongs VG, edge (u,v) belongs EG. v implies the sensors, u,v implies the neighbours. WG(u,v) the weighted edge of (u,v) belongs EG. The authors have used the concept of coverings. (K-cover, is defined as a set of sensors M such that each point in the sensor network is “covered” by at least K different sensors in M, and the communication graph induced by M is connected.[12].)[2]
Graph based and structural methods for fingerprint classification:
Fingerprint classification is mainly used in criminal investigation. This classification of fingerprints uses databases for storage of fingerprints. But the database will become large and the storage capacity will be more if it is stored as it is. In this paper the author gives an overview regarding graph based classification of fingerprints. Various approaches are available for the classification namely structural approaches, statistical approaches and graph based approaches. Here it is discussed only the graph based approaches. Previously, the work was done on the basis of segmenting the fingerprint images into regions containing ridges having homogeneous orientations. But this type of structural information is not useful in identifying the fingerprints based on other classes, since they have also the same structural arrangements. The graph based approach uses simple relational graphs.
The following diagram shows relational graph for fingerprint orientation field segmentation.
Figure – 16 Relational graph
This method serves as a guide for segmentation. Relational graphs appear to be more appropriate since the
nodes naturally correspond to the regions extracted by the segmentation algorithm. Each graph node can be associated to a segmentation region and the edges join two nodes according to the adjacency relationship of the respective regions. To compute relational graphs, the error correcting graph matching is used. This method computes a measure of the dissimilarity between the graph representing the input pattern to be classified and a certain graph prototype. This similarity measure is called edit distance. This is done by deformation model which can be done by substituting, inserting or deleting nodes or edges.[5]
The main idea stressed here is the graph based representation of the fingerprints is much useful for classification purpose than the other structural methods.
ISSN: 0975-5462 4620
S.G. Shrinivas et. al. / International Journal of Engineering Science and Technology Vol. 2(9), 2010, 4610-4621
Conclusion:
The main aim of this paper is to present the importance of graph theoretical ideas in various areas of compute applications for researches that they can use graph theoretical concepts for the research. An overview is presented especially to project the idea of graph theory. So, the graph theory section of each paper is given importance than to the other sections. Researches may get some information related to graph theory and its applications in computer field and can get some ideas related to their field of research.
References:
[1] Adam Schenker, Mark Last, horst Banke,Abraham andel,”Clustering of Web documents using a graph model”, Springer werlog, Septermber 2007.
[2] Anindya J.Pal, Samar S.Sarma, Biman Ray, “CCTP, Graph Coloring algorithms – Soft computing Solutions IEEE, 2007 [3] Bing Hong Liu, Wel Chieh Ke, Chin-Hsien Tsai, Ming-Jer Tsai, “Constructing a message pruning tree with minimum cost for tracking
moving objects in wireless sensor networks”, IEEE Volume 57, Number 6, July 2008 [4] Daniel Marx, “Graph Coloring problems and their applications in scheduling”, [5] Gian Luca Marcialis, Fabio Roli, Alessandra Serrau, “Graph Based and Structural Methods for Fingerprint Classification, Springer verlag,
Berlin Heidelberg 2007 [6] John.P.Hayes, “A graph Model for Fault Tolerant Computing Systems”, IEEE September 1976 [7] Narasingh Deo, “Graph theory with applications to engineering and computer science”, Prentice Hall of India, 1990. [8] Perri Mehonen, Janne Riihijarvi, Marina Petrova, “Automatic Channel allocation for small wireless area networks using graph coloring
algorithm approach”, IEEE 2004 [9] Shariefuddin Pirzada and Ashay Dharwadker, “Journal of the Korean Society for Industrial and applied Mathematics, Volume 11, No.4,
2007 [10] Sven Dickinson, Pelillo, Ramin Zabih, “Introduction to the special section on graph algorithms in computer vision”, IEEE on pattern
analysis, Vol 23 No. 10, September 2001 [11] V.P.Eswaramoorthy, “New algorithm for analyzing performance of neighbourhood strategies in solving job shop scheduling problems,
Journal of Scientific & Industrial Research, August 2008 [12] Zongheng Zhou,† Samir Das, Himanshu Gupta, “Connected K-Coverage Problem in Sensor Networks” [13] http://www.britinaca.com/bps/additionalcontent/18/33373769/concepts-of-graph-theory-relevant-to-Adhoc-Networks [14] http://www.dharwadker.org/vertex_cover/ [15] http://www.icaen.uiowa.edu/~dip/LECTURE/Understanding6.html [16] wj:math.sfsu.edu/beck/teach [17] wikipedia.org/wiki/Median graph [18] http://en.wikipedia.org/wiki/Bipartite_graph [19] pedia.org/wiki/Voronoi_diagram [20] http://en.wikipedia.org/wiki/K-means_clustering [21] http://en.wikipedia.org/wiki/Geometric_spannerWiki
ISSN: 0975-5462 4621