Applications of Gaseous
83
APPLICATIONS OF GASEOUS INSULANTS H.M. Ryan 1. 1 Introduction This chapter introduces the subject of gaseous insulation and provides information relating to the application of gaseous insulants to high voltage systems. It examines atmospheric air, compressed gases and illustrates how, by linking available experimental test data from such sources with a knowledge of the 'effectiveness' of various practical gas-gap clearances, the designer can achieve reliable insulation design. The chapter also briefly discusses the need for high voltage and extra high voltage (EHV) test areas or laboratories. Evidence is presented of how laboratory studies, on representative insulation systems and electrode arrangements provide the designer with choices relating to electrical stresses, clearance levels, service performance and testing procedures. Gas insulated substations (GIS) using sulphur hexafluoride (SF 6 ) gaseous insulation have been used in transmission systems worldwide for more than 35 years. The service reliability of this class of equipment is of paramount importance. In addition, the chapter presents a large amount of experimental breakdown information on SF 6 and briefly reviews the application of field computation strategies in support of GIS and other 1
-
Upload
abhishek-roy -
Category
Documents
-
view
218 -
download
1
description
Information
Transcript of Applications of Gaseous

APPLICATIONS OF GASEOUS INSULANTS
H.M. Ryan
1. 1 Introduction
This chapter introduces the subject of gaseous insulation and provides information relating to the application of gaseous insulants to high voltage systems. It examines atmospheric air, compressed gases and illustrates how, by linking available experimental test data from such sources with a knowledge of the 'effectiveness' of various practical gas-gap clearances, the designer can achieve reliable insulation design. The chapter also briefly discusses the need for high voltage and extra high voltage (EHV) test areas or laboratories. Evidence is presented of how laboratory studies, on representative insulation systems and electrode arrangements provide the designer with choices relating to electrical stresses, clearance levels, service performance and testing procedures. Gas insulated substations (GIS) using sulphur hexafluoride (SF6) gaseous insulation have been used in transmission systems worldwide for more than 35 years. The service reliability of this class of equipment is of paramount importance. In addition, the chapter presents a large amount of experimental breakdown information on SF6 and briefly reviews the application of field computation strategies in support of GIS and other equipment designs. Several of the major factors influencing the insulation design and in-service behaviour and reliability of SF6 gaseous and epoxy resin support insulations, as used in GIS equipment, will also be considered.
Atmospheric air is the most abundant dielectric material which has played a vital role in providing a basic insulating function in almost all electrical components and equipment. However, because it has a comparatively low
1

dielectric strength, large electrical clearances are required in air for high voltage applications such as overhead line bundle conductor or tower design or open-type EHV switchyards. Air clearances will be discussed in Section 1.2. Much research activity has taken place during the past 50 years to investigate compressed air and to develop other gases with even better characteristics than air. Some important characteristics of compressed gaseous insulation, including air, SF6 and other gases, will be touched on in Sections 1. 3 and 1.4.
As discussed elsewhere [1-5], the dielectric strength of air and other gaseous insulation is a function of gas density (). Advantage has been taken of this fact for many years in transmission switchgear, where high pressure gases have been used to provide essential insulation and arc interruption characteristics in heavy-duty interrupters. The concept of high pressure gaseous insulation has now been extended into combined metal-clad switchgear and connecting cables, termed gas insulated systems (GIS). Sometimes, gas insulated cables are referred to as gas insu-lated lines (GIL). Strategic aspects relating to gaseous insulation systems as used in GIS will be discussed in Section 1. 4.
Since gas does not offer mechanical support for live conductors, switches, etc., it is used in combination with solid insulation. The gas/solid interface region must be looked at very carefully from an electrical design viewpoint, otherwise design weaknesses could result in problems in service, with the possibility of consequential breakdown or flashover of equipment. Even when the very best design principles have been adopted, breakdowns can still occur in air/solid interfaces under adverse environmental conditions such as pollution, fog, ice, snow or humidity. These aspects are outside the scope of this chapter and are dealt with elsewhere [5-8].
Whatever dielectric medium is used, be it solid, liquid or gas or combinations thereof, it is essential that careful
2

consideration be given to the electrostatic field design of insulating components to produce compact, efficient, economic and reliable designs of high voltage equipment which will give long and trouble-free life in service. To this end, designers rely on analytical field analysis techniques to model electrostatic and other aspects of specific designs and, when appropriate, to optimize the shape and disposition of components. The general availability of commercial packages to carry out 'advanced' digital field techniques during the past 35 years has greatly assisted equipment designers.
Section 1.5 give a brief indication of the purpose, scope and application of field analysis methods to provide valuable design information from extensive SF6 gaseous insulation studies relating to simple electrode arrangements through to EHV equipment designs.1.2 Atmospheric air clearances
1.2.1 Test areas In dry, unpolluted areas, air clearances between live equipment and earth can be defined reliably. Legg [9] has described the minimum clearances necessary for high voltage test areas. The majority of high voltage tests on equipment are carried out indoors to avoid large variations in atmospheric conditions. When high voltage laboratories are constructed, the test voltages to be used are generally known and the physical size of the laboratory is determined by the dimensions of the voltage generating plant, the test objects and the clearances required to prevent flashover to the walls of the laboratory. The flashover voltage of rod-rod and rod-plane gaps as a function of the gap spacing [9] is illustrated in Figure 1. From these graphs, the required dimensions of laboratories can be estimated. It will be noted that the lowest flashover voltages are experienced with positive switching surges and 50 Hz voltages, applied to rod-plane gaps. For this reason, the performance of a rod-plane gap under positive switching surges may be usefully taken as a datum (for required laboratory clearances) because all other combinations of gap geometry and voltage waveform produce higher
3

flashover voltages. The spark over of any gap is subject to statistical variation, and some knowledge of this is required before clearances can be estimated for a laboratory, etc. This essential consideration of statistical aspects also applies in day to day testing or measuring within laboratories (see Sections 1. 3, 1 .4). The breakdown voltages reproduced in Figures 1.1 and 1.2 relate to 50% flashover levels [9]. That is, if a large number of voltage tests at this level were applied to the gap, one-half of these tests would be expected to cause flashover. Breakdown to the walls of a laboratory or Test-chamber must be avoided; therefore greater clearances than these are required.
Figure 1.1 50% flashover voltages for (a) rod-rod and (b) rod-plane gaps
4

Figure 1.2 Illustrating probability of flashover
In Figure 1.2, the 50% flashover voltage is 1200 kV for this particular gap. The voltage corresponding to the 16% probability line (1090 kV) is one standard deviation (σ) less than V50, i.e. V50 - σ. The voltage corresponding to the 2% line is V50 - 2σ (980 kV) and that to the 0.1% line is V50 - 3σ (870 kV). In practice, one takes the withstand voltage of the gap as 2 or 3 standard deviations less than the 50% flashover voltage, i.e. V50 - 2σ or V50 - 3σ. The withstand voltage of the gap represented by Figure 1.2 is therefore 980 or 870 kV. For 1/50 μs impulse waves, the standard deviation is of the order of 1 to 4%, the lower values occurring at the highest voltages, whereas for switching surges the standard deviation is of the order of 5-12% and increases with voltage. For 50 cycle voltages up to 1500 kV RMS, the standard deviation is approximately:
1.5 – 4% for rod-plane gaps0.5 – 2.5% for rod-rod gaps1.0 – 4% for dry insulators1.5 – 6% for wet insulators
Having established the withstand voltage for various gaps –
5

or conversely the gap required to withstand the various test voltages – the dimensions of a laboratory can be estimated. Even clearances based on V50 - 3σ are often increased for two reasons. First, the walls of the laboratory can influence the flashover voltage and invalidate the test. Second, clearances are required for radio interference or partial discharge measurements. During partial discharge tests, one may be looking for very small internal discharges (often as small as 1 pC) in the test object so that spurious discharges from the circuit (busbars, transformers, etc.) must be an order smaller. If the clearances are too small, even though they are adequate to prevent flashover, then small discharges may flow to the walls of the laboratory, thereby preventing accurate measurements. Test area dimensions are given in Table 1.1. For very high voltage test equipment (>3 MV), it may be uneconomic to build an enclosure with adequate clearances are the test equipment can be moved and used outdoors.
Ryan and Whiskard [10] describe the design, planning and supervision of the construction of a new UHV testing laboratory (see Figure1.3). The main purpose of this laboratory was to provide a major facility in the UK for the development of switchgear rated up to 765 kV. The authors report on some of the dielectric research undertaken to achieve this position. Following the opening of the laboratory in 1970, these workers were closely connected with the development of new ranges of open-terminal and metal-clad SF6 switchgear, rated up to 550 kV and for fault current levels up to 63 kA. These switchgear design activities were supported by extensive dielectric research studies, which enabled the major factors influencing the insulation integrity of practical equipment to be determined. Much of this work has been extensively reported in the literature.
Ryan and Whiskard [10] outlines:
a) the criteria used in designing the UHV laboratory, and presents a critical appraisal of the facilities during the first 15 years of its operational life [for information, now BSTS Clothier Laboratory]
6

b) some significant laboratory activities, including examples of studies on various switchgear and non-switchgear components for systems up to 765 kV, all having been subjected to rigorous dielectric proving tests
c) the use of specific high voltage test procedures (e.g. climatic, artificial rainfall and mixed voltage testing, together with important technical factors which have influenced the dielectric design of apparatus
Table 1.1 Approximate dimensions of test hall for 50 Hz 3-phase tests [9]
Figure 1.3 Major items of laboratory equipment [10]
a) view of 2 MV transformer, 4MV impulse generator and UHV divider and test object in test hall
b) View of 2 MV sphere-gaps, control room and galleries
E.Gockenbach discuss basic measuring techniques, basic testing techniques, partial discharge measuring techniques and digital measuring techniques. R.C.Hughes considers the strategically important topic of traceable measurements in high voltage tests. These two workers have been extremely
7

active in strategic develop-ments within IEC/CIGRE in these sectors in recent years. The reader should be are that modern UHV laboratories exist in several countries, including Brazil, Canada, France, Germany, Italy, Japan, UK and USA. Numerous ‘quality’ technical papers have been presented by experts from these organizations (see IEC/CIGRE/IEEE/IEE Publications).
1.2.2 Sphere gaps
A convenient use of air gaps is as a calibration for high voltages. It is useful in that no voltage dividers or electronic equipment is required (which can malfunction), but suffers from lack of accuracy, ± 3% (this covers the whole range of voltage). Spark gaps are recognized in IEC52, 1960. The sphere gap is accurate and reproducible over its range, which extends to gaps equal to 0.5 sphere diameter, after which it loses accuracy due to field distortion. It is also necessary to take account of humidity, temperature and pressure, all of which affect the breakdown voltage. The sphere gap records peak voltage and can therefore be used for AC or impulse voltages with only slight variations for positive or negative pulses. For very fast impulses (< 10 μs), it is necessary to irradiate the gap with a radioactive source in one sphere (or use a UV source) to provide the necessary initiating electrons.
Modern EHV and UHV laboratories are capable of measuring voltages to high accuracy, being equipped with precision voltage dividers, used in conjunction with the 'latest' digital measuringtechniques incorporating sophisticated software support. However, in industrial laboratory test facilities, it is still common for sphere gaps to be used (e.g. Figure 1.3(b)) to calibrate another measuring system because it can be easily verified by the inspectors. The revision document of IEC 52, 1960 is currently under consideration by the National Committees. No change has been made to the extensive tabulated values of 'sparking voltage against gap’, since existing values are considered to constitute 'a consensus standard of measurement' which has been unchanged for 75
8

years.
Sphere gap sparking voltages given in the tables can be considered to have uncertainties of ±3% for a 95% confidence level. A spark gap can be regarded as 'fit-for-purpose' provided its flashover performance characteristic 'conforms', i.e. to be less than a specified value. Otherwise, a high value of o (obtained in a test series) indicates something is wrong (e.g. dirt, dust, insufficient source of ionising ions) while a sufficiently low value of σ indicates that particular sphere gap is acceptable for calibration use.
1.2.3 Spark gaps
9

Spark gaps are used for protection of equipment against high voltage surges, for all voltage ranges, the advantage being that the dielectric is recoverable. Historically, spark gaps range from the common GPO arrester, having low pressure N2 in a ceramic body, with voltage ratings of 150-1000 V and current ratings of 103 amps, to low pressure gas or vacuum 'bottles' with voltage ratings of 1 to 50 kV and current ratings of 50 kA for railway equipment protection, for example. The simplest and most common spark gap is the rod-gap, used on outdoor equipment such as transformers, substations and bushings. Its characteristics are well documented (e.g. Figure 1.4); its simplicity is offset by a variable breakdown voltage with respect to time and polarity. Special designs with improved characteristics have been developed recently for EHV and UHV systems. For equipment protected by a rod-gap, it is important to know its 'breakdown voltage against time' characteristic relative to that of the equipment being protected to ensure that the
10

rod-gap operates first, under all surge conditions. Such protection is known as insulation co-ordination, as covered by IEC Technical Committee 28 and discussed (e.g. see also Figures 1.5 and 1.6).
Figure 1.4 Rod-gap characteristics [11]
Many workers have derived empirical relationships to correlate breakdown voltage with gap spacing for rod-plane gaps [1]. For example, Ryan and Whiskard, working in the laboratory [10], reconfirmed results of earlier Russian workers by studying the 50 Hz breakdown characteristic of three rod-plane electrode systems [i.e. (i) a 1.27 cm square
cut rod, (ii) a 0.2 cm diameter hemi-spherically ended rod
11

and (iii) a 0.5 cm diameter sphere]. It was originally established by Tikhodeyev and Tushnov (1958) – see [1], p.617 – that the breakdown voltage (Vs) could be predicted, to within 1% for air gaps with (1 ≤ g ≤ 9) m, using an expression of the form
Vs = 0.0798 + 0.4779 g – 0.0334 g2 + 0.0007 g3 MVpk
where g is the gap in metres. A simpler equation (Vs = 1.62 g1/3 – 1.1), was found to be accurate to ± 5%. Ryan and Powell found that, for rod-plane gaps in the range 1 – 5 m, the measured 50 Hz breakdown voltages lay within 3.5% of the values given by the large equation above when (i) the end of the rod was square cut
a) Typical relationships for critical flashover voltage per meter as a function of time to flashover (3 m gap): 1 Rod-rod gap; 2 conductor-plane gap; PF=Power Frequency CFO
b) Typical relationships for flashover voltage per meter as a function of gap spacing: 1 1.2/50 μs impulse; 2 200/2000 μs impulse (rod-rod, H/D = 1.0 positive dry); 3 power frequency
c) Switching surge flashover strength of rod-rod and rod-plane gaps; wave fronts of 100-200 μs; vapour pressure = 12.5 mean Hg
12

Figure 1.5 Transformer protections by rod-gap and surge arrester [11]
Figure 1.6 Insulation co-ordination diagram [10]
A. Typical V/t characteristics of 420 kV GIS
B. Representative characteristics of 396 kV ZnO arrester
C. Lower Limit curve of a line gap for specific gap settings
(i). Upper limit 40 kA amplitude (ii). Lower limit 3 kA amplitude
and within 3% when it was hemispherically terminated (ii) The corresponding results with electrode system (iii) gave breakdown results some several percentage points higher than those given by the above equation. It is worth emphasizing that, although the form of the rod termination had little effect on the breakdown voltage, the three electrode systems exhibited widely different values of corona onset voltage [1].
The role of rod-gaps and surge-arresters, widely used as over voltage protective devices, is summarised elsewhere [11]. Voltage-time 'withstand' characteristics exist for
13

different types of insulation when subjected to various types of over voltage. The various time regions refer to particular types or shapes of test voltage. The 'withstand' levels used for self-restoring insulation are at a suitably chosen level below the ' V50/time' characteristic (a selected multiple of a below), while characteristics for *non-self-restoring' insulation are obtained from withstand characteristics corresponding to the specified test voltages for the various categories of test voltage. The example reported by Diesendorf [11], reproduced in Figure 1. 5, illustrates that protection can be achieved in any time region in which the protective characteristic lies below the withstand characteristics of the insulation concerned. The 120 kV surge arrester (curve D) protects the transformer over the entire time-range, whereas the 26 inch (660 mm) rod-gap (B) protects the transformer only against surges with front slopes less than OX. Steeper surges would cause the insulation to breakdown before the rod-gap could operate. To achieve reliable protection, comprehensive test data must exist both for the protective devices and the insulation components of any system [12].
Figure 1.6 provides further results from extensive insulation co ordination studies [10, 13], on this occasion for 420 kV GIS assemblies; V/t characteristics for GIS and for corresponding 396 kV (rated) ZnO arresters and standard line-gaps are compared. This investigation looked into the strategic question of insulation co-ordination for GIS. Zinc oxide (ZnO) arresters are now used worldwide to provide robust protection to modern transmission systems [14]. It is also interesting to observe in passing the remarkable expansion of the application of metal oxide arresters to overhead lines at lower system voltages in recent years. The voltage class of these applications ranges from several kilovolts to EHV/UHV voltage.
1.2.4 Overhead lines and conductor bundles
Various classifications of dielectric stress may be encountered during the operation of any equipment ranging from (i) sustained normal power frequency voltages, (ii)
14

temporary over voltages, (iii) switching over-voltages to (iv) lightning over voltages. These are represented in the laboratory, for test purposes, by standard test waves: power frequency, switching impulse and lightning voltages. The strength of external insulation is dependent on geometric factors, on air density, temperature, humidity (appropriate correction factors are available), precipitation and contamination (due to natural or industrial pollution). The presence of ice and snow can influence the flashover performance of outdoor insulators (see Reports of CIGRE Task Force 33.04.09 [7, 8]. Ice and snow accretions can present serious problems in many cold regions of the world; there is well documented evidence that the number of single phase-faults increases substantially during cold precipitation and after accretion when followed by a rise in air temperature. Further research is required to provide a better understanding of such flashover events.
Before effective insulation co-ordination can be achieved, a large amount of experimental test data is required on arrangements such as support insulators (various shapes), rod-plane gaps (for protective purposes), rod-plane, ring-plane gaps, etc. which approximate to practical conditions (e.g. air insulator strings for transmission lines (vertical, horizontal, vee-strings, disc, longrod, fog-type, etc.). A variety of typical characteristics for various arrangements have been summarised and pre-sented by Diesendorf [11, 12]. Examples are reproduced in Figure 1.7.
The mean breakdown stress, i.e. V/g, in large practical gaps (Figure 1.4), is typically 500 V/mm, somewhat reduced from the 2 kV/mm in sphere gaps. This can decrease even further in wet weather, such that breakdown of air under lightning can occur at
15

Figure 1. 7 Switching surge characteristics of string insulators (a) Flashover strength; (b) along tangent strings
See EHV transmission line reference book, Edison Electric Inst., New York, 1968
stresses as low as 20 V/mm. In overhead line design [11], it is nece-ssary to design conductor bundles such that the stress at the surface of the bundle is less than that to initiate corona, otherwise radio noise would be generated and losses and corrosion would increase. An indication of surface stress levels of various UHV conductor bundle designs are given in Figure 1.8. Special problems to be overcome before effective over voltage protection can be achieved in practice are considered elsewhere [11].
It should be noted that, during the IEE School on High voltage Engineering and Testing, a visit is normally made to the Clothier UHV Laboratory (now part of the British Short Circuit Testing Station, Hebburn) to witness examples of pre-breakdown discharge activities in large practical gaps, for AC, DC and impulse voltages. This workshop complements lectures by Messrs. Hughes, Gockenbach and Allen and is relevant to material.
1.2.5 Guidelines for live working
Live working [15] allows necessary maintenance and repairs to be performed on high voltage systems without the necessity for interruption of the power supply to customer(s). To achieve effective live working, safety of workers and total reliability of the operation is vital. To this
16

end, ‘safe working distances’, i.e. the air insulation distances to be maintained in the various ‘working configurations’ in order that the risk of occurrence of flashovers, which (i) could possibly be harmful to all personnel working nearby and (ii) could cause disturbances to the system, are sufficiently low.
Safe working distances can be determined by applying the principles of insulation co-ordination which is based on [15] three main elements:
i. knowledge of stresses which occur at worksiteii. knowledge of the electrical strength of the work site
insulation when subjected to such stresses iii. assessment of the probability of occurrence of
insulation failures in the situation under consideration of stresses and strength.
Figure 1.8 Typical surface gradients on overhead transmission line conductors see EHV transmission line reference
book, Edison Electric Inst., New York, 1968
A recent CIGRE Brochure, summarised in [15], deals with the insulation in live working and also addresses special considerations, namely safety aspects related to the exposure of workers to electric and magnetic fields. It
17

provides:
a) a general subject overview
b) a discussion on voltage stresses at the work site and the effect of the adoption of over voltage limiting measures and devices
c) dielectric withstand characteristics of the work site insulation, starting from the reference conditions and addressing the influence of conducting bodies at floating potentials of damaged insulators and insulating tools and of atmospheric conditions and altitude
d) procedure for evaluation of the risk of failure during live working and for the assessment of working distances (case study examples are given of application)
e) assessment of minimum working distances as from viewpoint of exposure of workers to electric and magnetic fields [EMF].
In live working, the main concern is the performance under transient over voltages. These activities are usually restricted to periods of ‘good’ weather. Consequently, lightning over voltages are generally not important, and there is normally little risk of power frequency pollution flashover [15].
1.3 Other gases
The availability and characteristics of air makes it the most used gaseous insulant. In enclosed equipment, e.g. heavy duty gas blast circuit-breakers, by using air at high gas pressures, the dielectric performance, etc. could be greatly enhanced. However, because of limitations, gases other than air have been considered. The most popular of these has been sulphur hexaflouride gas (SF6), which has dielectric strength about twice as good as air and also offers excellent thermal and arc interruption characteristics. Despite this, the search continues for other gases with improved characteristics.
There has been considerable research activity (for example, see Reference 16) to find alternative gases and
18

gas mixtures, which may have comparable breakdown strengths as SF6 (see Figures 1.9, 1.10) but can offer technical, environmental and economic advantages. Binary mixtures with inexpensive gases like N2, air, CO2 and N2O have been under continuous investigation to arrive at efficient and economical mixtures and obtain a better understanding of the dielectric processes involved. The mixture of SF6 and N2 is the only mixture to achieve significant commercial application in switchgear, mainly to overcome problems associated with low ambient temperature conditions (in Canada, for example).
Environmental constraints are now assuming greater signify-cance and these have resulted in great attention being necessary for
Figure 1.9 Uniform-field break- down voltages for SF6 – air mixtures
19

Figure 1.10 Pashen curves for SF6 – N2 mixtures at 20oC (50 Hz)
packaging, transport and reclaiming of used SF6 and renewed interest in the choice of N2/SF6 mixtures for gas insulated systems. The attraction of such mixtures is that N2
gas predominates, enabling the amount of SF6 used to be kept to a minimum. Much work was carried out in the 1970s and 1980s by switchgear manufacturers, universities and others, and dielectric characteristics were obtained for a wide range of electrode configurations, some similar to those shown in Figures 1.9-1.1l.Thesestud-ies revealed that the dielectric withstand characteristics of N2 increases rapidly with only a small percentage of SF6, present. The commercial and environmental implications are that N2/SF6
mixtures with < 20% SF6 can achieve a 'significant' dielectric withstand performance for a greatly reduced SF6 gas requirement (see also 'Guide for SF6 mixtures', CIGRE Report 163, August 2000, by Working Group 23.02; Task Force 01).
In the present extremely environmentally conscious climate (e.g. concern regarding the depletion of Earth-shielding ozone by chlorofluorocarbons (CFCs) and the resulting large ‘ozone hole’ having opened up over Antarctica covering up to 11 million square miles), a major reduction of SF6 gas requirement for large substations appears attractive to many people and this could well provide the ‘incentive’ for a strategic re-evaluation
20

21

Figure 1.11 Further breakdown characteristics in N2- SF6
mixtures [29]
(a) Spacers(b) Pressure dependency of surface breakdown voltages of post
spacer model A under dean condition; neg. LI, SF6/N2 mixed gas
(c) Dependence of negative LI surface breakdown voltages on SF, content under clean condition; post spacer model A, SF6/N2 mixed gas
(d) Dependence of breakdown voltages of conical spacer B on SF6 content under clean condition in SF6/N2 mixed gas
(e) Conical spacer model C; x = Attached particles
22

(f)Particle-initiated breakdown voltages of conical spacer C at 0.4 MPa
(g) Particle-initiated AC breakdown voltages of conical spacer B in SF6/N2 mixed gas
(see Figure 1.11) of N2/SF6 mixtures for gas insulated sub-stations (GIS). Similarly, present day difficulties during planning/ commissioning of certain new overhead line(s), due partly to delays caused by consideration of a plethora of 'alleged' environmental concerns raised by small protest groups, has resulted in serious consideration being given to the adoption of an alternative line technology, the so-called gas insulated line (GIL) approach. N2/SF6 gas mixtures have again been suggested and evaluation studies are currently being carried out by EDF and others in Europe.
Ternary gaseous dielectrics have been extensively investigated, such as N2 + SF6 or CHF3 + SF6, in conjunction with perfluorocarbons. Fluoro-carbons, when mixed with SF6, may exhibit interesting synergistic effects which at present are not fully explained. A variety of gaseous insulating systems has been investigated (see CIGRE Report 163, referred to above), comprising multi-component gas mixtures carefully selected on the basis of physicochemical knowledge, especially on the interactions of low energy electrons with atoms and molecules. Much valuable research work in this field has been carried out by a group, led for many years by L.G. Christophorou, at Oak Ridge National Laboratory, Knoxville, TN, USA.
1.4 Switchgear and GIS
1.4.1 Introduction
High voltage switchgear, which forms an integral part of any substation (i.e. switching station), is essentially a combination of switching and measuring devices [2, 17]. The switches (circuit-breakers), connect and disconnect the circuits and the measuring devices (instrument trans-formers), monitor the system and detect faults. Particular care must be given to the selection of switchgear since security of power supply is dependent on their reliability. The reliability of any circuit-breaker depends on insulation
23

security, circuit-breaking capability, mechanical design and current carrying capacity. Considering modern switchgear practice, circuit-breakers can be broadly classified according to the insulating medium used for arc-extinction: bulk-oil; air-break; SF6 gas; small oil-volume; air-blast; vacuum.
Several types exist for indoor or outdoor service conditions. There are established relationships between types of switchgear selected and the design of the system, Briefly, until about 1980; (i) for voltages up to 11 kV, most circuit-breakers were of the oil-break type, or of the air-break type, using air at atmospheric pressure; (ii) from 11 to 66 kV, oil circuit-breakers were mainly used while, at 132 and 275 kV, the market was shared by oil interrupters (both bulk-oil and small oil-volume) and gas blast circuit-breakers.
Recent developments have seen a move towards 'oil-free' devices and the increased demand for vacuum and 'rotating-arc' SF6 circuit-breakers for distribution systems and the increased use of SF6 circuit-breakers for system voltages 66 kV/132 kV, up to and beyond 565 kV. However, it should be appreciated that (i) modular 'small-oil-volume' designs proved to be popular for all but the highest ratings [2] and that earlier generation of 420 kV air-blast circuit-breaker designs, originally developed in the 1960s, are likely to remain in service in the UK grid for at least the first 20 years of this new millenium. Later chapters will discuss transmission and distribution switchgear, substation design, condition monitoring techniques together with the timely and topical themes of 'life management1 of network assets and 'working systems harder'[18, 19].
Historically, it is worth noting that, in the 1960s, the second generation air-blast transmission circuit-breakers for 420 kV had six breaks per phase [2]. As stated in the previous paragraph, many of these designs are still in service in the UK grid. The prediction that such interrupters would develop to higher rating was not fulfilled and the recent trend has been towards compact SF6 switchgear. By incremental research, it has been possible to develop SF6, dead-tank circuit-breakers for 550 kV, 63 kA rating, with only
24

two breaks per phase [20, 21]. Recent developments are discussed.
1.4.2 Arc extinction media
The basic construction of any circuit-breaker entails the separation of contacts in an insulating 'fluid'. The insulating 'fluid' which fills the circuit-breaker chamber must fulfill a dual function. First, it must extinguish the arc drawn between the contacts when the circuit-breaker opens, and second, it must provide adequate, and totally reliable, electrical insulation between the contacts and from each contact to earth.
Selection of arc extinction 'fluid' is dependent on the rating and type of circuit-breaker. The insulating media commonly used for circuit-breakers are:
air - (at atmospheric pressure)
oil - (which produces hydrogen for arc-extinction)
compressed air - (at pressure 7 MPa)
sulphur hexafluoride, SF6 vacuum. - (at pressure < 0.85 MPa)
The principle of circuit interruption techniques and their application in circuit-breakers, either of single or multiple break design. However, it is appropriate to comment briefly here on interruption techniques, relevant to SF6 circuit-breakers, to illustrate basic principles relevant to the application of gaseous/solid insulation systems. The complex discharge products of SF6 are discussed. Earlier studies have described extensive research and development [2] on interrupter nozzle performance, relevant to the design of air blast interrupters. Table 1.2 provides a convenient summary of single or double pressure SF6 interrupter processes [4] together with a brief explanation of live-tank and dead-tank design philosophies.
Single or Double-pressure
The flow of SF6 gas necessary for circuit-breaking may be produced in either of two ways. In both cases, however, the
25

actual process of current interruption is similar, i.e. the arc is established through a nozzle by the separation of the con-tacts and/or gas flow and is subjected to an 'axial' gas blast which abstracts energy from the arc, resulting in extinction at a current zero.
The gas flow may be achieved by the use of a two-pressure system (Figure A) whereby the operation of a blast valve allows gas to flow from a high pressure reservoir through a nozzle into a low pressure reservoir. The alternative is a single-pressure system (Figure B) where compression of the gas is caused by movement of a cylinder over a fixed piston (or vice versa). In this system, commonly called the 'puffer' (Figure C), the moving contact system and cylinder are usually joined together so that the movement of only a single component is necessary for arc initiation and interruption.
The single-pressure system is inherently less complicated than the double-pressure, which requires two separate gas reservoirs with associated seals, a compressor and gas-handling system, and heaters to prevent liquefaction at low temperatures. Furthermore, in the double-pressure system there is the necessity of synchronising the blast-valve and the contact driving systems.
26

Very high
unit interrupting ratings can now be achieved with both systems, though the high performance single-pressure system requires a more powerful operating mechanism to ensure a suffi-ciently high velocity for the contact/ cylinder arrangement. This, however, is easily obtainable with either pneumatic or hydraulic power units, and at the lower performance levels, spring opening mechanisms also offer a practical alternative.
Initially the performance limitations of the single-pressure system meant that earlier types of circuit-breaker incorpor-ated double-pressure interrupters; but the continuing development of the single-pressure puffer interrupter has led to designs which are capable of the highest ratings. It seems likely, therefore, that such interrupter systems will be the basis of most future EHV circuit-breakers. They will also find wider application in the high voltage distribution field.
In any axial gas blast interrupter, the unit performance may be significantly improved by using a dual-blast construction in which the arc is drawn through two nozzles. In this construction, the gas now is towards both arc roots, and metal vapour from the contacts is not blown into the arc column. In the partial duo-blast construction (Figure D) one of these nozzles has a smaller diameter, which reduces the amount of gas passed through the nozzles and hence also the mechanical energy input without a significant reduction in performance compared to the full duo-nozzle construction. The Reyrolle puffer interrupters incorporate
27

partial duo-blast constructions.Live or dead tankThe SF6 interrupter can be incorporated in either live-tank or dead-tank circuit-breakers (Figure E). The type chosen will depend on economics and/or the type of application; for example, the dead-tank construction (in which all interrupters are enclosed within an earthed pressure vessel) is essential for use in complete metal-clad installations, although the same breaker may be used with terminal bushings in open-type layouts. In assessing relative economics of live and dead- tank constructions, the cost of any associated current transformers should be considered. Accommodation for current transformers is, of course, integral in the dead-tank circuit-breaker, but separate post-type units are usually necessary with the live-tank design for outdoor installations. With indoor installations the current transformers may be accommodated in the through-wall bushings or cable-sealing ends.
28

Generally it might be expected that at the lower end of the voltage/ current scale, where only one or two series breaks per phase are required, i.e. up to 420 kV the live-tank construction is probably more economical; but at higher voltages with three or four (or more) series breaks, the dead-tank construction tends to have an economic advantage because of the reduced amount of external insulation.
It is worthwhile noting that dead-tank circuit-breakers are inherently more suitable for areas subject to earthquakes.
Figure 1.12 Sectional view through a typical 420/550kV GIS duplicate busbar circuit (Courtesy VA Tech Reyrolle)
1.4.3 General dielectric considerations
Because of the widespread use of SF6 insulated GIS (see Figures 1.12 and 1.13), it is appropriate to touch briefly on some general points relating to the dielectric performance of gas-gaps and gas/solid insulation interfaces in SF6 under clean and contaminated conditions. The literature on this subject is vast, and extensive bibliographies exist (References 13, 23-28, for example), listing some important papers which can be arbitrarily grouped into topic areas: particulate contamination and detection, diagnostic techniques, operating experience, breakdown studies, internal-arcing, spacer experience and dielectric discharge performance.
29

1.4.3.1 Dielectric withstand capabilities, gas-gap data
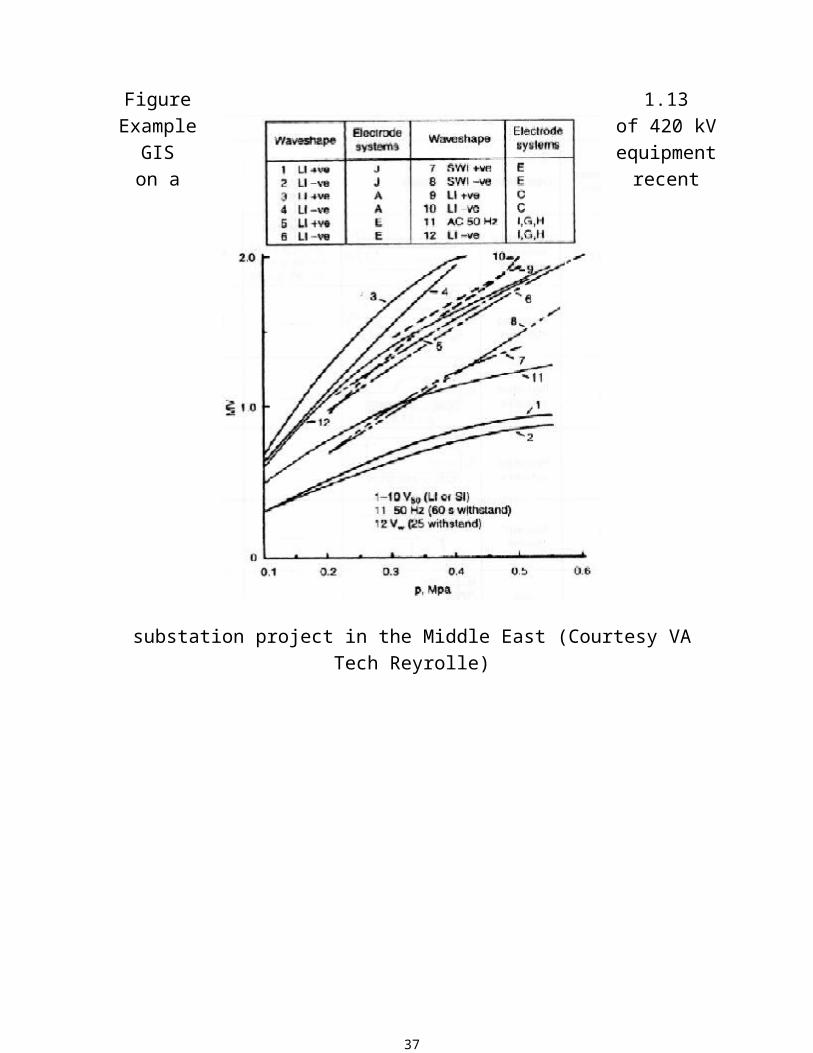
Figure 1.14 shows a selection of typical SF6 breakdown characteristics for the electrode systems illustrated in Table 1.3 [13]. From the vast amount of breakdown data accrued, the limits of lightning of large practical GIS gas-gap type configurations were produced and are illustrated in Figure 1.15 for SF6 pressures in the range (0.1 < p < 0.6) MPa.
Figure 1.13 Example of 420 kV
GIS equipment on a recent
substation project in the Middle East (Courtesy VA Tech
Reyrolle)
30

Figure 1.14 Example of SF6 breakdown characteristics [13]
Experimental determination of critical breakdown (E50) and highest withstand (EB) gradient values were obtained using similar test techniques to those adopted previously [13] (i.e. E= V/ηg; see Section 1.5.2). It should be emphasised that these curves present typical design type gradient relationships and encompass the results obtained for a large family of coaxial cylinder and perturbed electrode configurations for gas-gaps in the range 50< g < 180 mm. Theoretical breakdown gradient levels are also given in Figure 1.15(a-d); it is readily apparent that practical results deviate from theory as SF6 gas pressure increases [13]. A corresponding withstand curve for 50 Hz conditions is also shown in both Figures 1.14 and 1-15.
To provide a better understanding of statistical variations possible with 50 Hz dielectric breakdown characteristics, relating to practical GIS
31

Table 1.3 Electrode Systems [13]
.* various resin formulations have been studied, including, silica, alumina, bauxite and dolomite filled systems.
† Using corrugated outer cylinder.
32

Figure 1.15 Typical limits of 50% breakdown gradient (E50) and critical withstand gradient (Ew) on SF6 pressure for large coaxial and perturbed cylindrical electrode systems under clean conditions [13] curves
(a),(b),(c),(d): Lightning impulse (LI) waveshape (1.2/50μs)(e),(f),(g),(h): Switching impulse (SI) waveshape (250/2500μs)also show in curve c, the lower limiting 50 Hz withstand characteristic (Ew)E50 data: curves a, b, e and f; Ew data: curves c, d, g and h
type assemblies, it is relevant to consider the following results [13]. Figures 1.16-1.18 show the variation in individual short-term 50 Hz breakdown performance, with
33

repeated sparking, for large perturbed and unperturbed cylindrical systems. For comparison, the corresponding 60’s highest withstand levels (Vw) are also given.
Some salient findings emerge:
34

1. Figure 1.16, curves (a), (b) and (c), relate to a 50 Hz voltage test sequence for three ‘successive’ test series for a concentric cylindrical electrode system.
Curve (a) illustrates that whereas the highest ’60 s withstand level’ Vm was 480.8 kVpk, the sequence of ‘twenty-five instantaneous’ breakdown levels was significantly higher, being within the range 520-595 kVpk. For the purposes of comparison, the theoretical critical (E/P)lim= 89 kV mm-1 MPa-1.
Curves (b) and (c) show corresponding results for two repeat series. Here, it can be seen that the corresponding ‘60s withstand’ levels (Vm) increased significantly to 565.7 and 594 kVpk, obtainable in the first test series, i.e. curve (a).
Similarly, it can be seen from the sequence of individual ‘instantaneous breakdown’ levels (Vb) that, despite occasional low level breakdowns, a significant ‘conditioning’ effect has taken place and, in curve (c),
35

approximately 10 of the 25 ‘instantaneous breakdown’ levels achieved breakdown values of ≈600 kVpk, i.e. within 3.5% of the theoretical limiting breakdown level.
2. Figure 1.17 shows comparable 50 Hz results for a perturbed concentric cylinder electrode system (F). As before, the results presented in curves (a), (b) and (c), respectively, relate to three complete test series. Once again, the sequence of ‘instantaneous breakdown’ results exhibit a noticeable voltage ‘conditioning’ effect, with occasional low level results, e.g. curve (c), the conditioned level of ≈590 kVpk being within 3% of the theoretical breakdown value. Returning briefly to the sequence of highest ’60 s withstand’ levels for the test series (a), (b) and (c) (Figure 1.17), it is noted that Vw
increases as the test series proceeds, corresponding values being 509.1, 544.5 and 558.6 KVpk, respectively.
3. Figure 1.18 provides comparable results, obtained at higher SF6 gas pressures. Under these conditions, ‘instantaneous breakdown’ values were significantly lower than corresponding theoretical levels, e.g. being lower at 0.2 MPa, by between 15 and 31%, for this electrode arrangement.
4. Figure 1.19 shows some further results for a larger concentric cylinder electrode system (I), [see Table 1.3], which illustrate similar trends at 0.1 MPa but show a very significant spread in the SF6 ‘instantaneous breakdown’ levels as compared to the ’60 s withstand’ level (Vw) of 795 kVRMS, at the higher gas pressure 0.45 MPa [see curves (d), (e) and (a)]. Here, the values of Vw tend to be lower than the theoretical limiting levels VTH by between 18 and 605, the difference increasing with SF6 pressure. It should also be noted [curve (a)], that the lowest recorded breakdown level corresponds to a stress figure
36
of ≈ 8 kVRMS/mm, significantly higher than the working stresses for GIS equipment referred to earlier.
37

Extensive data exists for SF6 gas-gaps under clean and contaminated conditions (see References 13, 23-28, for example). It is now established that the presence of particulate contamination of lengths 2-20 mm can reduce the dielectric withstand capabilities of practical gaps by varying amounts up to typically 30, 40 and 70% for lightning impulse, switching impulse and power frequency conditions, respectively, at working SF6 pressure. Figure 1.20 illustrates a typical spread in 50 Hz flashover levels for varying degrees of gross contamination and represents the maximum lowering of withstand that can be expected [13].
Barrier Performance Data:
Figure 1.19
Sequence of50 Hz breakdown levels in SF6 for large concentric cylinders (Electrode system I, SF66 pressure: 0.1-
38

0.45 MPa) individual spark breakdownVw maximum (1 min) withstand level, established
immediately prior to test run.
Careful design and assembly of the cast resin support barriers used in SF6 insulated GIS equipment is vitally important. It should be noted that, for a particular gas pressure, the withstand characteristics of support barriers in SF6 under clean conditions depends on the particular resin formulation used, the insulation shape and on the disposition of stress relieving fitting, insert, etc. Typical withstand gradient levels of 11.6, 8.7 and 6.6k Vpk/mm can be achieved under lightning, switching impulse and 50 Hz short term voltage conditions, respectively [13].
Figure 1.20 50Hz flashover characteristics of energy of epoxy resin conical spacers under varying degrees of metallic
contamination [10]
The presence of particulate contamination can reduce the 50 Hz withstand capability of cast-resin support barriers in SF6, gas by varying amounts (e.g. up to < 30%) depending on particulate size and disposition. For the most onerous dispositions of cast-resin support barriers, the percentage lowering of 'withstand' performance under
39

impulse conditions tends to be much less than that experienced for 50 Hz test conditions, for comparable levels of contamination (see Figures 1.20 and 1.21, for example) at spacer gas gap interfaces. The reader should compare these findings for 100% SF6 with Figure 1.11, diagrams e.g., relating to particle initiated breakdown in SF6/N2 mixtures. These workers [29] consider that particle initiated breakdown is more complicated in SF6/N2 mixed gas than in 100% SF6 gas and they recommend that further studies are necessary to achieve a better understanding of the discharge mechanisms.
1.4.3.2 GIS equipment: power frequency (V/t) characteristics
An understanding of voltage gradients that can be safely sustained in service in GIS emerges from extensive laboratory studies, relating specifically to long-time 50 Hz test conditions. The ratio E/p is a convenient measure of the stress applied to GIS equipment in service. Typical normalised working stress/gas pressure ratios (E/p) are 7 MV/MPa and 3 MV/MPa for SF6 insulated switchgear including instrument transformers, for 300 and 420 kV systems [4,13], are shown m Figure 1.22. This figure was originally prepared in 1983, at which time many of these units had been in service for periods up to 15 years and excellent service reliability had been demonstrated. It should be noted that this equipment continues to provide excellent service reliability, some 30+ years after going into service [13].
40

Figure 1.21 Limit of lightning impulse withstand capabilities of epoxy resin conical spacers under clean and contaminated
conditions
It is readily apparent (see Figure 1.22) that the maximum service stress levels for gas-gaps in SF6, insulated switchgear are relatively low, i.e. < 4 kVRMS/mm, when compared to the significantly higher attainable withstand characteristics achievable (see curves, Figure 1.15). The working stress levels shown in Figure 1.22 can be considered to be generally representative of modern GIS installations. By restricting these gradient levels well below the limiting values, deduced from long-term laboratory studies, manufacturers ensure the long-term dielectric integrity of their equipment - provided, of course, that the normal rigorous quality control and in-service condition monitoring procedures have been maintained.
The importance of component cleanliness, achieved during factory construction, testing, site assembly and commissioning of GIS, and subsequently throughout the entire service life of SF6 insulated equipment, is now fully appreciated worldwide. Cleanliness, linked with good design, assembly and the introduction of sophisticated 'in-service condition monitoring practices are recognised as being vitally important factors to resolve if safe and reliable operation is to be achieved throughout the service lifetime of GIS, which should exceed > 40 years. In recent years there has been much progress in the development of effective UHF condition monitoring techniques [30-32]. These strategic developments are considered further in several of the later chapters.
41

Figure 1.22 Normalized 50 Hz service ELP levels for SF6 insulated
switchgear equipment.
a, A 420 kV post-type current transformersb, B 300 kV post-type current transformerse,c,C 300 kV GIS equipmentf,d,D 420 kV GIS equipmenta,b,c,d,e Service stress levelsA,B,C,D factory 50 Hz 1 min test level at working
pressure
Working Pressure:
a, A 0.38 MPab, B 0.38 MPac, C 0.40 MPad,D 0.55 MPa
Critical areas of metalclad designs have been identified which merit special manufacturing, testing and assembly controls, and these aspects will be further considered in Section 1.5 and also in later chapters. Several papers have considered the power frequency (V/t) characteristics of gaseous and solid insulation using model gas-gaps and gas/insulator arrangement for large electrode systems under conditions with ‘gross’ contamination present and with varying gas pressures [13].
1.4.4 Performance under contaminated conditionsAs has been demonstrated above, the achievable design stress and reliability of SF6 insulated apparatus under normal
42

power frequency service conditions is crucially affected by particulate contamination. Particles in the gas space and on the insulator surface can significantly lower the dielectric strength of the system. In SF6, the breakdown voltage for a relatively long particle, fixed in contact with the conductor, is considerably higher than that for a number of free conducting particles, over a limited range of pressures. Under power-frequency voltage excitation, free conducting particles tend to bounce along the bottom of the enclosure or across the surface of the insulators. The amplitude of indi-vidual bounces depends on the particle size and shape, the potential on the system and other random parameters. Particle initiated breakdown can occur at voltages considerably lower than those required for breakdown due to the roughness of the electrode surfaces and is, in general, lower for negative impulse polarity voltages [26]. Since then, switchgear and CGIT manufacturers - in support of GIS and GIL equipment develop-ments - have undertaken comprehensive evaluation of the dielectric performance characteristics of practical gas-gap arrangements and solid support insulation configurations in SF6, under both clean and contaminated conditions. Such studies can involve comprehensive laboratory tests to determine, and quantify, the effects of particulate contamination size on the breakdown voltage in SF6, under conditions representative of both gas insulated 'backparts', circuit-breakers, disconnect switches, etc. and for GIL configurations, for widely varying experimental conditions.
Numerous interrelated factors can influence the degree to which the presence of particles can lower the dielectric 'withstand capabilities' of GIS under normal service conditions. These depend on:
length and diameter of particles present whether particles are metallic or nonmetallic quantity and nature of contamimant material (density,
etc.) position of particles relative to electric field and also to
various GIS components actual design and physical disposition of GIS
43

components (e.g. whether circuit-breaker, backparts, etc. are mounted horizontally or vertically)
type of particle movement, when electrostatic forces exceed those of gravity
working gas pressure of SF6 or gas mixtures effectiveness of particle 'collection' or 'trapping'
techniques.
The above factors are now well known and appropriate procedures are implemented to avoid any problems (see Section 1.4.3.2 above). Manufacturers and utilities take immense care in the design, testing, site-commissioning and also the ongoing 'in-service performance monitoring of GIS' throughout the lifetime of the equipment. At the outset, for a user to be able to decide on what GIS, 'data' are needed on which to judge investment and maintenance decisions. To cover these strategic aspects, very high frequency, UHF, condition monitoring techniques have been developed and installed in many GIS installations wordwide [30-32]. Currently, the need, justification, design, dependability, management of information, and future application of monitoring and diagnostic techniques are under critical review by CIGRE [32].
1.4.5 GIS service reliability
A recently issued report [33], briefly outlining the findings of a second major CIGRE survey, states that GIS technology has contributed very effectively to increasing the reliability of new substations and to improving the asset life-cycle of existing ones. This extensive study on high voltage substations provides a database of GIS service experience survey on SF6 insulated equipment, covering collected information referring to more than 13 500 circuit-breaker bays and 118 500 bay years. The survey presents a valuable history, providing an analysis of results on installation and GIS major failure reports data, including:
(a) general data about GIS installations
(b) data concerning GIS failure frequencies
44

(i) Failure frequency overview, trend of major failure frequency during the GIS lifetime
(ii) Failure frequency-comparison with 1st CIGRE, GIS survey
(c) major failure characteristics
(i) Basic characteristic data over-voltage classes (identification of main component, or GIS part involved in the failure, identification of sub-assembly or component responsible for the failure
(ii)Classification of symptoms, cause of the failure, service circumstances, operational circumstances
(iii)Type of repair, immediate consequences of the failure, characteristics of the repair, correlation between basic characteristic failure data.
Also considered in this survey were life expectancy, maintenance and environmental issues:(a) life expectancy
(i) for already installed GIS
(ii) for newly installed GIS
(b) maintenance practice (i) routine preventive maintenance
(ii) major preventive maintenance
(c) extension and uprating
(d) environmental issues
(i) SF6 handling(ii) SF6 leakage rates(iii) analysis of failure relating to SF6 gas
(e) electromagnetic phenomena.
It is hoped that the data presented [33] will provide a valuable resource and benchmark for both users and manufacturers operating within the field of GIS substation planning, design, construction and service. This is undoubtedly a valuable document for anyone interested in the application of gaseous insulation. Nevertheless, it must
45

be recognised that the document has certain shortcomings, due to commercial and statistical constraints, which prevents one obtaining a totally 'holistic understanding' of all failure patterns, etc.
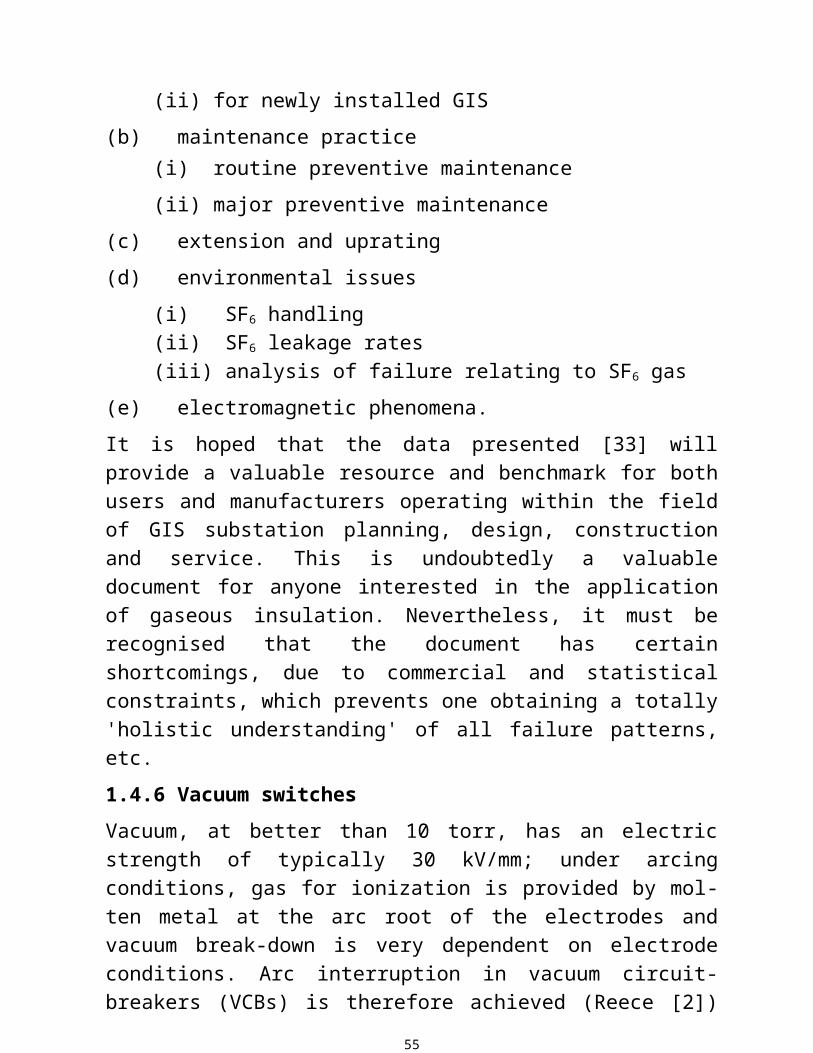
1.4.6 Vacuum switches
Vacuum, at better than 10 torr, has an electric strength of typically 30 kV/mm; under arcing conditions, gas for ionization is provided by molten metal at the arc root of the electrodes and vacuum break-down is very dependent on electrode conditions. Arc interruption in vacuum circuit-breakers (VCBs) is therefore achieved (Reece [2]) by cooling the arc root quickly to suppress the hot spot. This is achieved by rotating the arc root rapidly under its own magnetic field and by using electrode materials of high boiling point and good thermal conductivity. The high electric strength of vacuum ensures that once the arc is suppressed, usually at the first current zero, no re-ignition occurs and dielectric recovery is achieved within a few us.
The contacts are housed in a sealed glass or ceramic bottle (Figure 1.23) with a moving metal bellows and are maintenance-free. Excellent service performance has been demonstrated for fault currents of <40 kA and 33 kV operation. VCB are ideal for use where many breaker operations are required, for example in railways and arc-furnaces. The impulse level (150 kV) on the small gap (10 mm) limits the working voltage of a single bottle, but bottles have been stacked in series to provide 32 kV breakers (Reece [2]). The major use of VCBs is in 11, 33 or 66kV applications for distribution use where an 'oil-free', 'maintenance-free', breaker is required. Typical applications of VCBs and SF6 interrupters are discussed further by Pryor and Ali respectively.
1.5 System modelling
1.5.1 Field analysis techniques
The electrostatic fields of high voltage equipment are satisfied by the well known Laplacian equation which takes
46

the form
where is the potential at any point in the Cartesian co-ordinate system x, y, z. The field distribution in any design is dependent on the shape, size and disposition of the electrodes and insulation and also, in general, on the permittivities of the insulating materials used.
One criterion which can be applied to the evaluation of the electrostatic design of high voltage equipment is the ratio of the average to maximum field. This parameter, termed the utilisation factor η, is considered below, together with details of a related parameter termed the normalised effective electrode separation. Brief reference is made in Section 1.5.1.3 to a simple approximate two-dimensional method which can often be used to estimate maximum voltage gradients for complicated arrangements which cannot be solved directly by available numerical methods.
Analytical solutions of the Laplace equation can only be obtained for relatively simple electrode systems, where the conducting surfaces (electrodes) are cylinders, spheres, spheroids or other surfaces conforming to equipotentials surrounding some simple charge distribution. Generally, the multiplicity of boundary conditions for the complicated contours encountered in high voltage equipment means that analytical solutions of the potential are not possible. Because of this difficulty, several approximation methods have been investigated, the more important of these being (i) analogue methods and (ii) numerical methods [21, 34].
47

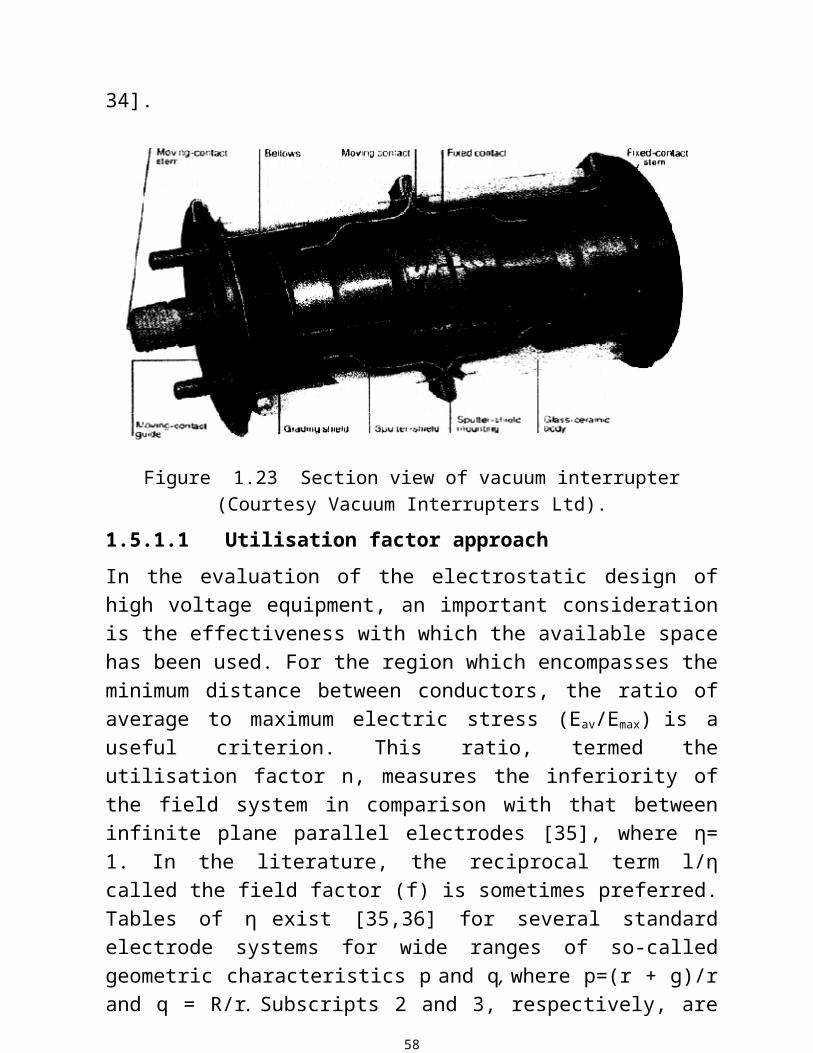
Figure 1.23 Section view of vacuum interrupter (Courtesy Vacuum Interrupters Ltd).
1.5.1.1 Utilisation factor approach
In the evaluation of the electrostatic design of high voltage equipment, an important consideration is the effectiveness with which the available space has been used. For the region which encompasses the minimum distance between conductors, the ratio of average to maximum electric stress (Eav/Emax) is a useful criterion. This ratio, termed the utilisation factor n, measures the inferiority of the field system in comparison with that between infinite plane parallel electrodes [35], where η= 1. In the literature, the reciprocal term l/η called the field factor (f) is sometimes preferred. Tables of η exist [35,36] for several standard electrode systems for wide ranges of so-called geometric characteristics p and q, where p=(r + g)/r and q = R/r. Subscripts 2 and 3, respectively, are used to denote two- and three-dimensional systems. Appropriate formulas are given elsewhere, use being made of existing solutions of Laplace's equations [34-41]. These calculations assume constant permittivity but techniques can be extended to multi-dielectric problems.
48

Some calculated values of are also presented in graphical form in Figure 1.24. It is immediately evident that η for each geometry tends to decrease as the geometric characteristic p = (r + g)/r increases. This can be explained by the increased divergence of the field as p increases.
Furthermore, it is noted that, for a particular
Figure 1.24 Dependence of η upon geometric characteristic p for a few simple geometries
(a) Curves 1. cylinder-cylinder, 2. cylinder-plane, 3. sphere-sphere (symmetrical supply) , 4. sphere-sphere (unsymmetrical supply) 5. sphere-plane
(b) Curves 1. hyperbolic cylinder 2. hyperboloid (points) 3. hyperboloid (point)-plane
value p, η for a three-dimensional geometry is lower than that for the corresponding two-dimensional geometry (e.g. compare cylinder-plane and sphere-plane, curves 2 and 5, Figure 1.24). Once again, this may be attributed to the greater field divergence in the three-dimensional arrangements. Brief mention will be made later to the simple relationship existing between η for corresponding two- and three-dimensional systems. To summarise, utilisation factors, or field factors, or field factors, may be calculated for many practical arrange-ments either as a result of
49

precise analysis for simple geometries or, for more difficult configurations, by approximate numerical or ana-logue techniques together with appropriate difference equations discussed elsewhere [36].
1.5.1.2 Efficiency factor conceptFor certain design problems, conditions of fixed axial distance must be complied with. The utilisation factor has the limitation that it does not take into account the space necessary to accommodate the elec-trode geometry. To allow for this, can be multiplied by the electrode sep-aration g. The product of these terms gives the 'effective electrode separation' of the system. If, now, is divided by some measure of the total dimension available, a new quantity is obtained, which is really the normalised effective electrode separa-tion of the system. The efficiency factor concept ( ) is sometimes useful when designing high voltage equipment, particularly when conditions of fixed axial distance d exist [35]. For a particular opera-ting voltage V it is possible to keep the maximum stress at the electrode surface to a minimum by selecting the best size, shape and disposition of electrodes for conditions of constant d (see Figure 1.25). Under these conditions = and Em = V/ d.
All the results referred to above assume a single value for the dielectric constant. If two or more dielectrics are being considered, then the concepts of utilisation factor and efficiency factor could be applied to each dielectric separately. These techniques have been widely used to assist in electrostatic aspects of GIS design for many years.1.5.1.3 Approximate two/three-dimensional concept The electrode arrangements considered above contained at least one axis of symmetry. In many practical arrangements, however, such symmetry does not exist. In the absence of symmetry, the problem of making accurate pronouncements on maximum field strengths for practical three-dimensional systems often becomes complicated since it is sometimes either exceedingly difficult or even impossible to make single realistic numerical or analogue model representation without introducing appreciable errors.
50

Figure1.25 Dependenccd of X upon p for several standard geometries
Curve I parallel cylinders; curve 2 cylinder-plane; curve 3 concentric cylinders; curve 4 sphere-sphere (symmetrical
supply): curve 5 sphere-sphere (unsymmetrical supply); curve 6 sphere -plane; curve 7 concentric spheres.
It would be useful if, for example, one could obtain even an approxi-mate solution for a particular practical three-dimensional representa-tions (having conductors similar to axial and radial sections of the original three-dimensional conducting surfaces), which, in general, can be more easily solved. Boag and later Galloway et al.[34] investi-gated the possibilities of this simple approach and have analysed numerous simple configurations. Ryan has produced useful correc-tion curves (see Figure 1.26), which can be used with acceptable accuracy.
1.5.1.4 Numerical methods
Numerical methods of solution, which express the Laplacian equation in finite terms, provide a powerful means of calculating the electric fields of practical arrangements. A great deal of published literature exists relating to this subject. For a useful background overview of this sector, the reader should refer to the technical literature, which contains many useful practical applications of the numerical modelling techniques now readily available to support gaseous/solid/liquid insulation studies, covering electrostatic, electro-magnetic, thermal and arc interruption
51

modelling and equipment design. A few sources are given as follows:
1. In contrast to other workers who have used relaxation techniques Ryan and colleagues [34, 37, 41] developed a computer program to solve the Laplace equation in two dimensions and three dimensions with one axis of symmetry by an exact noniterative method. This method was selected after various techniques for solving the resultant set of simultaneous equations had been studied. The main details of this program, together with numerous illustrations of its extensive application in support of switchgear design are given in References 34 and 41. Two important examples of such work are shown in Figures 1.27 and 1.28 will be considered in the next two sections.
Figure 1.26 Correction curves [37]
(a) Applies for concentric cylinders and concentric spheres cylinder-plane and sphere-plane hyperbolic cylinder-plane and hyperboloid plane parabolic cylinders and paraboloids of
52

revolution
(b) Applies for systems shown in Figure 1.25
Figure 1.27 Computer field study of an early 300 kV metal-clad switchgear design [21 ]
(a) Part of single phase layout; (b) field plot at lower end of bushing; (c) field plot of barrier supporting isolator, (d) field
53

plot in vicinity of open isolator
2. Binns and Randall [42] have described an overrelaxation method and give details of various accelerated finite difference formulas used. In this investigation, potential gradients were calculated around a spherical high voltage electrode separated from an earthed plane of a recessed dielectric slab. The potential gradient transitions were determined and analysed at the point where the surface of the recessed dielectric slab meets the sphere surface.
3. Storey and Billings [43] have described a successive over-relaxation method suitable for determining axially symmetric field distributions. They also discuss a method for the determination of the three-dimensional electric field distribution in a curved bushing.
4. The ISH Symposia series (International symposium on High voltage engineering) provides an excellent resource to keep abreast of the latest work in the HV sector, including numerical field techniques. This symposia series has been held at regular intervals over more than 27 years: Munich (1972), Zurich (1975), Athens (1983), Braunsweig (1987), New Orleans (1989), Dresden (1991), Yokohama (1993), Gratz (1995), Montreal (1997), London (1999) and Bangalore (2001).
Since the work [34, 37, 41] was carried out, much valuable information has appeared in the literature regarding finite element, finite difference, boundary integral and other variants. Numerous commercial field analysis packages are now available. Indeed, further examples are presented in later chapters. A detailed discussion of relation methods, difference formulas, accelerating factors, etc. is outside the scope of this chapter. A strategic message from this writer is that, whatever package is to be used, care should be exercised to confirm its effectiveness, and the achievable accuracy, by means of simple validation studies.
54
Once this has been demonstrated and carefully verified, the techniques successfully used by Ryan and others can be
adopted with confidence.
55

Figure 1.28 E-field design studies relating to the development of heavy duty SF6 interrupters in the 1980s (21)
(i) Identification of regions of interest: (a) general location of regions 2-9; (b) plan view, illustrating three radial sections. A, B and C
(ii) Typical E-field plots: first interrupter o/4-break design; through capacitor (section A)
(iii)Typical E-field plots: first interrupter of2-break design; through empty support tube (section B)
1.5.1.5 GIS backparts and insulating spacer design
With the widespread interest in gas insulated cables, busbars, etc., considerable attention has been given to the design of spacer shapes for such equipment. The examples summarised in Figure 1.27 illustrate the extensive use made of analytical field techniques, during early insulation development work on a EHV, SF6, insulated metal-clad
56

switchgear installation [21].
1.5.1.6 GIS interrupter design
In the 1980s, the trend with GIS equipment was towards more compact designs and interrupters with fewer breaks per phase. As a consequence, the dielectric design and performance of SF6 circuit-breakers became more critical. Careful shaping of stress shields, optimization of stress in gas-gaps and the careful selection and profiling of insulation materials, including support insulation (e.g. spacers/barriers) were required. All these and other aspects were thoroughly considered at the design stage, using available software tools, e.g. computer field analysis programs, which had been carefully develop, verified and used extensively to study, critically analyse and optimize, design stresses in GIS and other switchgear designs, for over 35 years [14, 34, 41]. Earlier papers have described field studies during the sequential development of 4-, 2- and 1-break, heavy duty, high performance SF6 puffer circuit-breakers, for voltages up to the highest system rating (see[21]). Figure 1.28 shows typical field plots for 4- and 2-break designs. Briefly, after extensive field studies, closely linked with HV and high power development testing for a 4-break design, it was possible to critically analyse all results, before ‘sequentially’ repeating the exercise for 2-break design and later for a 1-break design. However, the vital difference was that the extensive database gathered, prior to and during development of 4-break interrupter design, enabled the dimensions, profile, etc. for the 2-break, and subsequently a 1-break, design to be carefully, and indeed appropriately, selected prior to costly testing. Indeed, it could be argued that this successful development represented a good example of ‘rapid-prototyping’ or even ‘vitual-prototyping’ [21]. In any event, it is hoped that this brief example provides the reader with evidence of the strategic use, with significant savings regarding product development time and cost, that can be gained from the effective use of available ‘design databases’ together with analytical tools, such as
57
the field analysis modeling techniques referred to in this chapter.
1.5.2 Prediction of breakdown voltages
1.5.2.1 Empirical approach
In 1961, Ryan first investigated the feasibility of using simple estimation methods of predicting the minimum breakdown voltage levels of nonuniform field configurations in gas insulated equipment.
Initially, the method suggested by Schwaiger was considered and later extended [35-41] to more complex electrode configurations by incorporating simple perturbation principles. The method does not consider breakdown mechanisms but is based on a simple discharge-law concept [40].
By ignoring space charge effects, the breakdown voltage V is given by the relationship
Vs = Eηg(1.1)
where E and g are the appropriate breakdown gradient and gap dimension, respectively, and η, derived from Laplacian field analysis, is the utilisation factor (ratio of average to maximum voltage gradient (Eav /Em). Initially, standard electrode geometries amenable to precise electrostatic field solution were considered, and extensive tabulated field data has been published [35, 36]. Results of early investigations (e.g. Figure 1.29) firmly established the useful-ness of this simple concept for estimating minimum breakdown voltage levels.
In the past, the only major limitation to the application of this empirical approach to switchgear insulation design evaluation has been the lack of reliable breakdown information. Ryan and colleague have made significant contributions [25, 39] in this area and have shown that critical breakdown gradients (E50) and highest withstand gradients (Ew) in air and SF6 can be accurately represented by relationships of the form
58

rE = K1pr + K2
(1.2)
where K1 and K2 are constants, p = [(r + g)/r] and r is the radius of the inner cylinder or sphere. The real virtue of this simple empirical breakdown estimation technique is the fact that one can often consider practical electrode systems to be perturbations of the same simple geometry [37].
The simple electrode system shown in Figure 1.29 provides a good example to illustrate the effectiveness of this simple empirical breakdown estimation technique. An estimate of the anticipated breakdown voltage characteristics of this arrangement (Figure 1.29) is required, in atmospheric air under standard conditions [T= 20 °C, P = 760 mm]. We can consider this electrode system to be a 'perturbed' coaxial cylinder system, which will break down when the electric gradient (Es) at the inner cylinder (along the plane of minimum airgap), reaches the critical break-down gradient value - known for the corresponding unperturbed coaxial (and concentric) cylinder system, to occur in air at standard temperature and pressure conditions when E=Es=21.2 + 13.35 √r, where r is the radius of the inner cylinder in centimeters. Predicted and experimental results agreed to within ± 5% for all sizes of inner conductor (radius r) considered.
Predicted and experimental sparking voltages have also
59

been compared for numerous gaseous insulants, for a wide range of gas temperatures and pressures and for many different electrode systems, using simple perturbation field techniques. Excellent agreement has been demonstrated (e.g see Table 1.4). For example, designers of GIS switchgear in the 1980s had access to a vast reliable database relating to the characteristics of numerous insulating materials and SF6 to assist them to achieve effective, competitive and reliable designs as a result of much dielectric research and development activities (see, for example, References 1, 13 and 21).
1.5.2.2 Semi-empirical approach
As an alternative to the above empirical method, the author and his colleagues have investigated a so-called semi-empirical breakdown estimation method, based on streamer theory of gas breakdown [1], For air, the criterion for minimum breakdown voltage was given by Pederson [44, 45] as
(1.3)
where x is the numerical value of , Townsend’s first ionization coefficient, at the head of the avalanche, of length x, at which the critical ion number is reached in an electron avalanche; in a nonuniform field, streamers are formed, resulting in corona or breakdown. Table 1.4 Breakdown data for hemi spherically ended rod/plane arrangement (r=12.7 mm) [39]
GAP g,mm
Breakdown voltage at relative density, kV
3 5 7Experimental Empirical*Semi-empirical
20
100102103
158158162
210214220
Experimental Empirical*Semi-empirical
40127126129
200197203
259267276
Experimental Empirical*Semi-empirical 80
144143142
227222227
288301310
60

* Estimate using equation 1.1 together with equation of form rE=k1pr + k2 derived from concentric sphere hemisphere data
61

The left-hand side of equation 1.3 is evaluated from the electro-static field distribution, obtained using a general field analysis program for practical arrangements or from precise equations for standard geometries [38,39], The right-hand side of equation 1.3 is computed from existing empirical breakdown potential gradient data for uniform fields of gap x. The values of a used in both sides of eqn. 1.3 for the examples discussed in previous studies [38, 39] have been published by earlier workers [1, 39].
This semi-empirical approach was extended to SF6 using a modified form of eqn. 1.3 namely
(1.4)where and η are Townsend’s first ionization coefficient and attachment coefficient, respectfully, in SF6. An essential prerequisite of Pederson’s semi-empirical approach for any particular set of conditions is information concerning the following parameters:
(a) uniform field breakdown potential gradients(b) and η values(c) potential-gradient distribution across the nonuniform gap.
General purpose digital computer programs have been developed which are capable of solving equations of the form of equ. 1.3 to predict, with acceptable accuracy, the minimum breakdown voltage, V, for a wide range of standard and practical electrode arrangements in air, N2 and SF6, for pressures in the range 1-5 atmospheres [38, 39, 41] and for air at high temperatures.
Similarity and Paschen's law type relationships were also studied. For example, with uniform field gaps of 0.5-2.0 cm and temperatures 20-1100 °C, Powell and Ryan obtained results for the static breakdown of atmospheric air which fitted a relationship of the form Vs = 24.49 (∂g) + 6.61/(√∂g) (kV) to within +5% and -2% Here, the same constants were selected as given by Boyd et al. from their
62

earlier study at standard atmospheric conditions, where the relative air density ∂ = 1.0, p=1013 mbar and T = 293 K (20oC).
An example of these techniques is given in Table 1.4, which compares experimental and estimated breakdown voltages in air, at relative air densities (d) of 3, 5 and 7, respectively, for a hemispheri-cally ended rod/ plate arrangement [radius r = 12.7 mm]. It is clearly seen that both these estimation methods are capable of predicting breakdown voltage levels to within ± 5% over the range of gaps and air pressures considered.
1.6 Summary
This chapter has provided a general introduction to the application of gaseous insulation systems. Although it has only been possible to touch very briefly on some major aspects, important strategic issues will be further developed in other chapters focusing on special areas. An indication has been given in this chapter of numerical field techniques which have found widespread application in the insulation design of GIS and other switchgear for many years. The simple breakdown estimation methods (empirical and semi-empirical) by Ryan et al, which are extensions of the work by Schwaiger (1954) and Pederson (1967) [44,45] together with an available experimental database obtained from extensive Paschen's Law/similarity type studies in gaseous insulants, have been thoroughly developed to such a degree that minimum breakdown voltages of practical GIS design layouts (as well as a host of gas-gap arrangements; see [1.5]) can be estimated to within a few per cent, at the design stage, often without recourse to expensive development testing. Such derived voltages are generally the minimal withstand levels attainable under practical conditions. Undoubtedly, there is still considerable scope in the future to predict dielectric performance by utilising advanced planning simulation tools incorporating genetic algorithms and artificial intelligence techniques, linked to various 'extensive databases' relating to breakdown characteristics of gaseous insulation, including equipment service performance data (e.g. from surveys similar
63

to [33]).
Finally, it is anticipated that the continuing, and growing, environmental concerns will influence the development of the next generation of gas insulated switchgear but a commercial replacement for 100% SF6 gas, for interruption purposes at the higher ratings, still seems remote!
1.7 Acknowledgments
The author wishes to thank the Directors of NEI Reyrolle Ltd (now VA TECH REYROLLE) for permission to publish earlier papers which have been extensively referred to in the studies reported in this chapter. He also gratefully acknowledges the assistance given by many of his former colleagues and for their contributions and generous support over the years.
1.8 References1 BLAIR, D.T.A.: 'Breakdown voltage characteristics', in
MEEK, J.M. and CRAGGS, J.D. (eds): 'Electrical breakdown of gases' (J. Wiley & Sons, 1978), Chap. 6, pp. 533-653
2 FLURSCHE1M, C.H. (ed.): Tower circuit-breaker theory and design' (Peter Perigrinus Ltd., 1982)
3 RAETHER, H.: 'Electron avalanches and breakdown in gases' (But-terworth, 1964)
4 BRADWELL, A. (ed.): 'Electrical insulation' (Peter Perigrinus Ltd., 1983)
5 WATERS, R.T.: 'Spark breakdown in non uniform fields1 in MEEK, J.M. and CRAGGS, J.D. (eds): "Electrical breakdown of gases' (J. Wiley & Sons, 1978), pp. 385-532
6 LOOMS, J.S.T.: 'Insulators for high voltages' (Peter Perigrinus Ltd., 1990)
7 CIGRE Task Force 33.04.09 Report.: 'Influence of ice and snow on the flashover performance of outdoor insulators. Part I: Effects of ice'. Electro, 1999,187, Dec, pp. 91 -111
8 CIGRE Task Force 33.04.09 Report.: 'Influence of ice and snow on the flashover performance of outdoor insulators, Part II: Effects of snow', Electra, 2000, 188, Feb., pp. 55-
64

699 LEGG, D.: 'High-voltage testing techniques'. Internal
Reyroile Research Report, 197010 RYAN, H.M. and WHISKARD, X: 'Design and operation
perspective of a British UHV laboratory', IEE Proc. A, 1986, 133, (8), pp. 501-521 DIESENDORF, W.: 'Insulation co-ordination in high voltage electric power systems' (Butterworths, 1974)
11 IEEE Committee Report.: 'Sparkover characteristics of high voltage protective gaps', IEEE Trans., 1974, PAS-93, pp. 196-205
13 RYAN, H.M., LIGHTLE, D. and MILNE, D.: 'Factors influencing dielectric performance of SF6 insulated GIS', IEEE Trans., 1985, PAS-104, (6), pp. 1527-1535
14 CIGRE Working Group 33.11, Task Force 03, SCHEI, A., Convenor WG33.11.: 'Application of metal metal oxide surge arresters to overhead lines', Electra, 1999, 186, Oct., pp. 83-112
15 CIGRE Working Group 33.07 Report: 'Insulation coordination in live working and other special conditions in electrical system', Guidelines for insulation coordination in live working, Electra, 2000,188, Feb., pp. 139-143
16 MALIK, N.H. and QURESHI, A.H.: 'A review of electrical breakdown in mixtures of SF6 and other gases', IEEE Tram. Electr. InsuL, 1979, El-14, pp. 1-14
17 RYAN, H.M. and JONES, G.R.: 'SF6 switchgear' (Peter Perigrinus Ltd., 1989)
18 JEFFERIES, D.: 'Transmission today: lessons from a decade of change', Electra, 1999, 187, Dec, pp. 9-18. Reproduced opening speech: London CIGRE Symposium: Working plant and systems harder: Enhancing the management and performance of plant and power systems' 7-9 June 1999
19 URWIN, R.J.: 'Engineering challenges in a competitive electricity market'. Keynote address, ISH: High voltage symposium, 22-27 Aug. 1999, London, Paper 5.366.SO
65

20 ALI, S.M.G., RYAN, H.M., LIGHTLE, D., SHIMM1N, D., TAYLOR, S. and JONES, G.R.: 'High power short circuit studies on a commercial 420 kV, 60 kA puffer circuit-breaker', IEEE Trans., 1985, PAS-104, (2), pp. 459^68
21 RYAN, H.M.: 'GIS barriers: application of field computation strategies to switchgear'. IEE Colloquim on Field modeling: applications to high voltage power apparatus, London, 17th Jan. 1996
22 RAGALLER, K.: 'Current interruption in high voltage networks' (Plenum Press, 1978)
23 MOSCH, W. and HAUSCHILD, W: 'High voltage insulation with sulphur hexafluoride, VEB Verlag Technik Berlin, 1979
24 BOGGS, S.A., CHU, F.Y, HICK, M.A., RISHWORTH, A.B., TROL- LIET, B. and VIGREUX, J.: 'Prospect of improving the reliability and maintainability of EHV gas insulated substations', CIGRE, 1982, Paper 23-10
25 RYAN, H.M. and WATSON, W.L.: 'Impulse breakdown characteristics in SF6 for non-uniform field gaps', CIGRE, 1978, Paper 15-01
26 LAGHARI, J.R.: 'Review - A review of particle contaminated gas break down', IEEE Trans. Electr. InsuL, 1981, EL-16, p. 388
27 ISHIKAWA, M. and HATTIRI, T.: 'Voltage-time characteristics of particle initiated breakdown in SF6 gas'. 3rd Int. Symp. On Gaseous dielectrics Knoxville, USA, 1982, Paper No. 28
28 ETEIBA, M.G. and R1ZK, A.M.: 'Voltage-time characteristics of particle- initiated impulse breakdown in SF6, and SF6,-N2, IEEE Trans. Power Appar. Syst., 1983, PAS-102, (5), pp. 1352-1360
29 TAKUMA, T. et al: interfacial insulation characteristics in gas mixtures as alternative to SF6 and application to power equipment', C1GRE, 2000, Paper 15-207
30 HAMPTON, B.F., PEARSON, IS., JONES, C.I, IRW1N. T., WELCH, I.M. and PRYOR, B.M.: 'Experience and progress with UHF diagnostics in GIS. CIGRE, 1992, Paper 15/23-03
66

31 JONES. C.J., HALL, W.B.. JONES, C.J., FANG, M.T.C. and WISEALL, S.S.: 'Recent development in theoretical modelling and monitoring tech niques for high voltage circuit-breakers'. CIGRE 1994, Paper 13-109
32 CIGRE Working Group 13.09.: 'Monitoring and diagnostic techniques for switching equipment', Convenor JONES, C.J., United Kingdom, Electro, 1999, 184, June, p. 27
33 CIGRE Working Group 23.02, Task Force 02 Report.: 'Report on the second international survey on high voltage gas insulated substations(GIS) service experience', Electra, 2000, 188, Feb., p. 127.
34 GALLOWAY, R.H., RYAN, H.M. and SCOTT, M.F: 'Calculation of electric fields by digital computer', Proc IEE, 1967, 114, (6), pp. 824-829
35 RYAN, H.M. and WALLEY, C.A.: 'Field auxiliary factors for simple electrode geometries'. Proc. IEE, 1967, 114, (10), pp. 1529-1534
36 MATTINGLEY, J.M. and RYAN, H.M.: 'Potential and potential-gradient for standard and practical electrode systems', Proc. IEE, 1971, 118, (5), pp. 720-732
37 RYAN, H.M.: 'Prediction of electric fields and breakdown voltage levels for practical 3-dimensional field problems'. Eighth Universities Power Engin eering Conference. 1973, University of Bath
38 BLACKETT, 1, MATTINGLEY, J.M. and RYAN, H.M.: 'Breakdown voltage estimation in gases using semi-empirical concept'. IEE Conf. Publ. 70, 1970, pp. 293-297
39 MATTINGLEY, J.M. and RYAN, H.M.: ^Breakdown voltage estimation in air and nitrogen'. NRC Conference on Electrical and Dielectric Phenomena, 1971, Williamsburgh, USA, November.
40 RYAN, H.M.: 'Prediction of alternating sparking voltages for a few simple electrode systems by means of a general discharge-law concept, Proc. IEE, 1967, 114, (11), pp. 1815-1821; (6), pp. 830 –831.
67

41 SCOTT, M.F., MATTINGLEY, J.M. and RYAN, H.M.: 'Computation of electric fields: Recent developments and practical applications', IEEE Trans. Electr Insul. 1974, El-9, (1), pp. 18 -25
42 BINNS, D.F. and RANDALL. T.J.: 'Calculation of potential gradients for a dielectric slab placed between a sphere and a plane*, Proc. IEE, 1967, 114, (10), pp. 1521-28
43 STOREY, J.T. and BILLINGS, M.J.: 'Determination of the 3-dimensional electrostatic field of a curved bushing', Proc. IEE, 1969,116,(4), pp. 639-643
44 PEDERSON, A.: 'Calculation of spark breakdown or corona starting voltages in non-uniform fields', IEEE Trans., 1967, PAS-86, pp. 200-206
45 PEDERSON, A.: 'Analysis of spark breakdown characteristics for sphere gaps', IEEE Trans., 1967, PAS-86, pp. 975-978
68