Applicationofthedual …shearwave Thestandard(1BW)consistsofestimating evaluating...
1
Application of the dual-beamwidth method to a narrow beam MF radar for estimation of spectral width R. Latteck, , N. Engler W. Singer Leibniz-Institut für Atmosphärenphysik, Schloss-Str. 6, D-18225 Kühlungsborn, Germany 10th International Workshop on Technical and Scientific Aspects of MST Radar Piura, Peru, May 13-20, 2003 Introduction Spectral widths observed by narrow beam VHF/UHF Doppler radars are used to estimate turbulent energy dissipation rates. In case of broader beams, the observed spectral widths have to be corrected for the influence of beam and shear broadening using simultaneously measured horizontal winds. VanZandt et al. developed a new dual-beam width method to estimate the turbulent com- ponent of spectral width from MST radar observations without any additional assumptions and tested it successfully for the troposphere. Insummer2002thenewSauraMFradarwasputintooperationontheAndoya island in Norway.The system has high flexibility in antenna beam forming allo- wing off-zenith beams with different beam widths. In addition, the beam stee- ring capabilities of the Saura MF radar and the nearby located ALWIN VHF radar provide common volume observations at mesospheric altitudes in sum- mer during the appearance of PMSE. Experiments with different beam widths have been carried out with the MF radar to test the dual-beam width method at mesospheric altitudes. We compare spectral width estimates from both the single-beam width and the dual-beam width method on a case study basis. The method The Saura MF radar z The (2BW) considers that the dominant terms in dual-beamwithmethod σ θ σ θ σ θ θ σ σ 2 2 2 2 2 2 2 beam+shear corr corr n w obs,n obs,w are proportional to what means that is also approximately pro- portional to . If is measured simultaneously in nested volumes with a narrow beamwidth and a broad beamwidth two simultaneous equations for and can be solved, what results in: The variance of the observed radar Doppler spectral width is related to velocity variance due to turbulence and influenced by and what are variances due to the interaction of the background wind and shear and of waves with the radar beam: σ 2 obs σ σ σ 2 2 2 turb beam+shear wave The standard (1BW) consists of estimating evaluating single-beamwidth method σ σ 2 2 wave beam+shear and by and substracting σ σ σ 2 2 2 corr obs turb from to get . Tx/Rx 2kW Tx/Rx 2kW Tx/Rx 2kW Tx/Rx 2kW + + DDS DDS DDS DDS Envelope 1 2 3 4 cntrl 1...16 Controler module 1 Tx/Rx 2kW Tx/Rx 2kW Tx/Rx 2kW Tx/Rx 2kW + + DDS DDS DDS DDS Envelope 61 62 ref ref ref Controler module 16 1 2 31 … Transceiver (4 channel) Controller Synthesiser & Reference Generator IF Combiner Rx4 Rx3 Rx2 Rx1 D A D A D A D A cntrl Control Analysis Transmitter 5.5° N Mills Cross Antenna IP1 IP2 IP3 IP4 QP1 QP2 QP3 QP4 SAURA MF RADAR SIMPLIFIED BLOCK DIAGRAM Radiation pattern plots of Saura MF radar antenna for a 17.2° tilded narrow (red) and broad (blue) beam to northwest direction. The red and blue lines in the contour plots mark the plane of the slices through the 3D radiation diagram shown obove. -40 -35 -30 -25 -20 -15 -10 -5 0 -1 -0.5 0 0.5 1 -1 -0.5 0 0.5 1 sin( ) . cos( ) θ ϕ N E -40 -35 -30 -25 -20 -15 -10 -5 0 -1 -0.5 0 0.5 1 -1 -0.5 0 0.5 1 sin( ).cos( ) θ ϕ N E Radiation pattern (top view) of tilded narrow beam Radiation pattern (top view) of tilded broad beam -30 -20 -10 0 10 20 30 0 2 4 6 8 10 12 14 16 18 20 22 θ[°] Radiation pattern ( = 320.5 / =17.2°) ϕ θ 19.25 dB 15.82 dB ∆θ -3dB = 6.6° ∆θ -3dB = 13.8° -17.2 Advantage: neither the coefficients in equation (2) nor the wind speeds and shears appear in equations (3) and (4) σ θ σ θ σ θ θ turb w obs n n obs w w n 2 2 2 2 2 2 2 = - - , , σ θ σ σ θ θ corr n n obs w obs n w n , , , 2 2 2 2 2 2 = - - σ θ θ σ corr w w n corr n , , 2 2 2 2 = (3) (4) (5) σ σ σ σ σ σ obs turb beam shear wave turb corr 2 2 2 2 2 2 = = (1) ( ( ( [ ] σ θ α α α α beam shear z z U V UuR uR = - 2 2 2 2 2 4 2 3 2 cos cos sin sin (2) Radar frequency: 3.17 MHz Peak power: 116 kW Mean power: (0.2% dc): Pulse form: Gauss Pulse width: >7 s Range resolution: 1000 m Antenna: 29 crossed half wave dipols Half power beam width:6,4° Beam directions: vertical, off-zenith 230 W μ The experiment The 29 crossed dipols of the new Saura MF radar are connected to individual transceiver modules each. If less than 29modules are used a broad antenna beam is formed. A sequence of narrow beam ( ) and broad beam experiments, each pointing interleaved with towards NW and SE, were run in April 2003 to test the dual beam me- thod. Additionally 4 DBS narrow beam experiments at 7.3° off-zenith provided the horizontal wind infor- mation. ( ) 17.2° off-zenith θ θ HPFW HPFW =6.6° =13.8° 06:00 09:00 12:00 15:00 18:00 60 70 80 90 SE (140.5°) narrow beam SE (140.5°) broad beam 06:00 09:00 12:00 15:00 18:00 60 70 80 90 NW (320.5°) narrow beam NW (320.5°) broad beam 06:00 09:00 12:00 15:00 18:00 60 70 80 90 06:00 09:00 12:00 15:00 18:00 60 70 80 90 23-Apr-2003 [UT] Radial velocity [m/s] -10 0 10 [m/s] -10 0 10 [m/s] -10 0 10 [m/s] -10 0 10 06:00 09:00 12:00 15:00 18:00 60 70 80 90 SE (140.5°) narrow beam SE (140.5°) broad beam [dB] 40 60 80 100 06:00 09:00 12:00 15:00 18:00 60 70 80 90 NW (320.5°) narrow beam NW (320.5°) broad beam [dB] 40 60 80 100 06:00 09:00 12:00 15:00 18:00 60 70 80 90 [dB] 40 60 80 100 06:00 09:00 12:00 15:00 18:00 60 70 80 90 23-Apr-2003 [UT] [dB] 40 60 80 100 Signal power 06:00 09:00 12:00 15:00 18:00 60 70 80 90 SE (140.5°) narrow beam SE (140.5°) broad beam 06:00 09:00 12:00 15:00 18:00 60 70 80 90 NW (320.5°) narrow beam NW (320.5°) broad beam 06:00 09:00 12:00 15:00 18:00 60 70 80 90 06:00 09:00 12:00 15:00 18:00 60 70 80 90 23-Apr-2003 [UT] Spectral width [m/s] 0 5 10 [m/s] 0 5 10 [m/s] 0 5 10 [m/s] 0 5 10 References VanZandt,T.E., G.D.Nastrom, J. Furumoto, T. Tsuda, and W.L. Clark, A dual- beamwidth radar method for measuring atmospheric turbulent kinetic energy, Geophys. Res. Lett., Vol.29,No.12,13-1-13-3,2002 Lübken, F.-J., The thermal structure of the Arctic summer mesosphere, , 104, 9135-9149, 1999. Müllemann, A., M. Rapp, F.-J. Lübken, and Peter Hoffmann, In situ measurements of mesospheric turbulence during spring transition of theArctic mesosphere, J. Geophys. Res. Geophys. Res. Lett., Vol. 29, No. 10, 115-1 - 115-4, 2002. NW 14° NE 14° SW 14° SE 14° NW 7° SW 7° SE 7° NE 7° W 17,2° S 17,2° E 17,2° N 17,2° W 7,3° S 7,3° N 7,3° E 7,3° 0 10 20 30 40 50 50 km Future common MF/VHF experiments The high flexible beam steering of the Saura MF radar allows common volume observations at mesospheric altitudes with the Southeast and Southwest beams of the .All pos- sible beams of the ALWIN VHF radar and most of the possible Saura MF radar beams point also into the volume that is illumi- nated by the Andenes MF radar as well. This makes it possible to compare results obtained from the same volume but with radars operating on different frequencies and using similar or different analysis techniques. Furthermore f the Saura MF radar beam is steered to the volume where the ALWIN NW 7° or NW14° beam point to, the rocket trajectories have intersections with both radar beams at altitudes between 75 and 90 km. nearby locatedALWIN VHFradarandwiththelidarexperimentsatALOMAR comparisons with in-situ measurements from sounding rockets launched from the Andoya Rocketrange are possible. I Areas by oblique and vertical beams ofALWIN VHF radar (green),AndenesMFradar (blue) and at 85km altitude illuminated SauraMFradar(red). Northern part of Andoya island. 0 1 2 3 4 5 km ALWIN VHF radar Andenes MF radar Saura MF radar ALOMAR Andoya Rocket Range Experiment configurations broad narrow DBS beam beam wind PRF [Hz] 150 150 150 Coherent integrations 16 16 8 Data points per beam 512 512 800 Range start [km] 50 50 50 Range end [km] 98 98 98 Sampling interval [km] 2 2 2 Pulse width [ s] 26.67 26.67 26.67 Beam direction sequence 140.5/17.2 140.5/17,2 50.5/7.3 (azimuth/zenith) 320.5/17.2 320.5/17.2 230.5/7.3 140.5/7.3 320.5/7.3 Time resolution t [ms] 213.33 213.33 213.33 Experiment run time [s] 109.23 109.23 170.67 μ ∆ Results The dual-beamswereformed at 17.2° ze- nith angle with a minimum of the antenna radiation pattern in vertical direction to re- duce the contamination by specular re- flections. Individual estimates of turbu- lent spectral width are obtained from con- secutive narrow and broad beam obser- vations every 8 minutes with interleaved NW/SE observations for the narrow and broad beam. The 3-hour mean profile of shows velocity variances between 5 and about 15 m /s below 78 km where contributions from specular reflections should be small or negligi- ble. These turbulent velocity variances correspond to energy dissipation rates between 10 and 60 mW/kg based on a mean temperature profile for April after falling sphere measurements atAndenes (Lübken, 1999). The estimated dissipation rates are in agreement with rocket observations du- ring spring transition (Müllemann et al., 2002). During the first dual-beamwidth observations the wind speeds were small (less than 10m/s)andthe correction for beam and shear broadening used in the single-beamwidthmethod is negligible. (Note: different abscissa scales in the middle panels!) σ 2 2 2 turb Contour plots of signal power, radial velocity, and spectral width obtained with narrow and broad beam experiments at 17.2° solar zenith angle. The differences in signal power between narrow and broad beams are due to less numbers of antennas forming the broad beam. The effective radiated power is reduced by about 50 per cent. The radial velocities in the middle panel show reversed signs for the opposite directed narrow and broad beams. For the broad beams lager spectral widths are observed all the time (right panel). σ 2 obs 2 2 (m s - ) σ 2 corr 2 2 (m s - ) σ 2 turb (m s - ) 2 2 0 10 20 30 64 68 72 76 80 84 88 SE NW 0 2 4 6 8 10 0 10 20 30 64 68 72 76 80 84 88 NWSE 23-Apr- 2003 10:47 - 13:56 UT Dual-Beamwidth Spectral-Width Method (VanZandt et al., 2002) ( narrow beam, HPHW=3.4°, SZA=17° / ------ broad beam, HPHW=7°, SZA=17°) Single-Beamwidth Spectral-Width Method ( narrow beam, HPHW=3.4°, SZA=17°) 0 10 20 30 64 68 72 76 80 84 88 SE NW 0.0 0.5 1.0 0 10 20 30 4 68 72 76 80 84 88 23-Apr-2003 10:47 - 13:56 UT NW SE σ 2 obs 2 2 (m s - ) σ 2 corr 2 2 (m s - ) σ 2 turb (m s - ) 2 2
Transcript of Applicationofthedual …shearwave Thestandard(1BW)consistsofestimating evaluating...
Application of the dual-beamwidth method to a narrow beam MF radarfor estimation of spectral width
R. Latteck, , N. EnglerW. SingerLeibniz-Institut für Atmosphärenphysik, Schloss-Str. 6, D-18225 Kühlungsborn, Germany10th International Workshop on Technical and Scientific Aspects of MST Radar
Piura, Peru, May 13-20, 2003
IntroductionSpectral widths observed by narrow beam VHF/UHF Doppler radars are usedto estimate turbulent energy dissipation rates. In case of broader beams, theobserved spectral widths have to be corrected for the influence of beam andshear broadening using simultaneously measured horizontal winds. VanZandtet al. developed a new dual-beam width method to estimate the turbulent com-ponent of spectral width from MST radar observations without any additionalassumptions and tested it successfully for the troposphere.
In summer 2002 the new SauraMFradarwasputintooperationontheAndoyaisland in Norway.The system has high flexibility in antenna beam forming allo-wing off-zenith beams with different beam widths. In addition, the beam stee-ring capabilities of the Saura MF radar and the nearby located ALWIN VHFradar provide common volume observations at mesospheric altitudes in sum-merduring the appearance of PMSE.
Experiments with different beam widths have been carried out with the MFradar to test the dual-beam width method at mesospheric altitudes. We comparespectral width estimates from both the single-beam width and the dual-beamwidth method on a case study basis.
The method
The Saura MF radar
z
The (2BW) considers that the dominant terms indual-beamwithmethodσ θ σ
θ σθ θ
σ σ
2 2 2
2 2
2 2
beam+shear corr
corr
n w
obs,n obs,w
are proportional to what means that is also approximately pro-portional to . If is measured simultaneously in nested volumes with anarrow beamwidth and a broad beamwidth two simultaneous equationsfor and can be solved, what results in:
The variance of the observed radar Doppler spectral width is related tovelocity variance due to turbulence and influenced by andwhat are variances due to the interaction of the background wind and shear andof waves with the radar beam:
σ2obs
σ σ σ2 2 2turb beam+shear wave
The standard (1BW) consists of estimatingevaluating
single-beamwidth method σσ
2
2wave
beam+shearand by
and substracting σ σ σ2 2 2corr obs turbfrom to get .
Tx/Rx2kW
Tx/Rx2kW
Tx/Rx2kW
Tx/Rx2kW
+
+
DDS
DDS
DDS
DDS
Envelope
1
2
3
4
cntrl 1...16
Controler module 1
Tx/Rx2kW
Tx/Rx2kW
Tx/Rx2kW
Tx/Rx2kW
+
+
DDS
DDS
DDS
DDS
Envelope
61
62
ref
ref
ref
Controler module 16
1 2 31…
Transceiver(4 channel)
Controller
Synthesiser& Reference
Generator
IF CombinerRx4
Rx3
Rx2
Rx1
DA
DA
DA
DA
cntrl
Control Analysis
Transmitter5.5°
NMills CrossAntenna
IP1
IP2
IP3
IP4
QP1
QP2
QP3
QP4
Tx/Rx2kW
Tx/Rx2kW
Tx/Rx2kW
Tx/Rx2kW
+
+
DDS
DDS
DDS
DDS
Envelope
1
2
3
4
cntrl 1...16
Controler module 1
Tx/Rx2kW
Tx/Rx2kW
Tx/Rx2kW
Tx/Rx2kW
+
+
DDS
DDS
DDS
DDS
Envelope
61
62
ref
ref
ref
Controler module 16
1 2 31…
Transceiver(4 channel)
Controller
Synthesiser& Reference
Generator
IF CombinerRx4
Rx3
Rx2
Rx1
DA
DA
DA
DA
cntrl
Control Analysis
Transmitter5.5°
NMills CrossAntenna
IP1
IP2
IP3
IP4
QP1
QP2
QP3
QP4 SAURA MF RADARSIMPLIFIED BLOCK DIAGRAM
Radiation pattern plots of Saura MF radar antennafor a 17.2° tilded narrow (red) and broad (blue) beamto northwest direction. The red and blue lines in thecontour plots mark the plane of the slices through the3D radiation diagram shown obove.
-40
-35
-30
-25
-20
-15
-10
-5
0
-1 -0.5 0 0.5 1-1
-0.5
0
0.5
1
sin( ).cos( )θ ϕ
N
E
-40
-35
-30
-25
-20
-15
-10
-5
0
-1 -0.5 0 0.5 1-1
-0.5
0
0.5
1
sin( ).cos( )θ ϕ
N
E
Radiation pattern (top view)of tilded narrow beam
Radiation pattern (top view)of tilded broad beam
-30 -20 -10 0 10 20 300
2
4
6
8
10
12
14
16
18
20
22
θ[°]
Radiation pattern ( = 320.5 / =17.2°)ϕ θ
19.25 dB
15.82 dB∆θ-3dB = 6.6°
∆θ-3dB = 13.8°
-17.2
Advantage:neither the coefficients in equation (2) nor the windspeeds and shears appear in equations (3) and (4)
σθ σ θ σ
θ θturbw obs n n obs w
w n
22 2 2 2
2 2=⋅ − ⋅
−, ,
σ θσ σ
θ θcorr n nobs w obs n
w n,
, ,2 22 2
2 2=−−
σθθ
σcorr ww
ncorr n, ,
22
22=
⋅
(3)
(4)
(5)
σ σ σ σ σ σobs turb beam shear wave turb corr2 2 2 2 2 2= + + = ++ (1)
( ) ( ) ( )[ ]σθ
α α α αbeam shear z zU V U u R u R+ = + − +2 2 2 2 2 4 2
32cos cos sin sin (2)
Radar frequency: 3.17 MHzPeak power: 116 kWMean power:(0.2% dc):Pulse form: Gauss
Pulse width: > 7 sRange resolution: 1000 mAntenna: 29 crossed
half wave dipolsHalf power beam width:6,4°Beam directions: vertical,
off-zenith
230 W
µ
The experimentThe 29 crossed dipols of the new Saura MF radar areconnected to individual transceiver modules each. Ifless than 29modules are used a broad antenna beam isformed. A sequence of narrow beam ( ) andbroad beam experiments, each pointinginterleaved with towards NW andSE, were run in April 2003 to test the dual beam me-thod. Additionally 4 DBS narrow beam experimentsat 7.3° off-zenith provided the horizontal wind infor-mation.
( )17.2° off-zenith
θθ
HPFW
HPFW
=6.6°=13.8°
06:00 09:00 12:00 15:00 18:00
60
70
80
90
SE (140.5°) narrow beam
SE (140.5°) broad beam06:00 09:00 12:00 15:00 18:00
60
70
80
90
NW (320.5°) narrow beam
NW (320.5°) broad beam06:00 09:00 12:00 15:00 18:00
60
70
80
90
06:00 09:00 12:00 15:00 18:00
60
70
80
90
23-Apr-2003 [UT]
Radial velocity[m/s]
-10
0
10
[m/s]
-10
0
10
[m/s]
-10
0
10
[m/s]
-10
0
10
06:00 09:00 12:00 15:00 18:00
60
70
80
90
SE (140.5°) narrow beam
SE (140.5°) broad beam
[dB]
40
60
80
100
06:00 09:00 12:00 15:00 18:00
60
70
80
90
NW (320.5°) narrow beam
NW (320.5°) broad beam
[dB]
40
60
80
100
06:00 09:00 12:00 15:00 18:00
60
70
80
90
[dB]
40
60
80
100
06:00 09:00 12:00 15:00 18:00
60
70
80
90
23-Apr-2003 [UT]
[dB]
40
60
80
100
Signal power
06:00 09:00 12:00 15:00 18:00
60
70
80
90
SE (140.5°) narrow beam
SE (140.5°) broad beam06:00 09:00 12:00 15:00 18:00
60
70
80
90
NW (320.5°) narrow beam
NW (320.5°) broad beam06:00 09:00 12:00 15:00 18:00
60
70
80
90
06:00 09:00 12:00 15:00 18:00
60
70
80
90
23-Apr-2003 [UT]
Spectral width[m/s]
0
5
10
[m/s]
0
5
10
[m/s]
0
5
10
[m/s]
0
5
10
ReferencesVanZandt,T.E., G.D.Nastrom, J. Furumoto, T. Tsuda, and W.L. Clark, A dual-beamwidth radar method for measuring atmospheric turbulent kinetic energy,Geophys. Res. Lett., Vol. 29,No.12,13-1-13-3,2002Lübken, F.-J., The thermal structure of the Arctic summer mesosphere,
, 104, 9135-9149, 1999.Müllemann, A., M. Rapp, F.-J. Lübken, and Peter Hoffmann, In situmeasurements of mesospheric turbulence during spring transition of theArcticmesosphere,
J.Geophys. Res.
Geophys. Res. Lett., Vol. 29, No. 10, 115-1 - 115-4, 2002.
NW 14° NE 14°
SW 14°SE 14°
NW 7°
SW 7° SE 7°
NE 7°
W 17,2°
S 17,2°
E 17,2°
N 17,2°
W 7,3°
S 7,3°
N 7,3°
E 7,3°
0 10 20 30 40 50 50km
Future common MF/VHF experimentsThe high flexible beam steering of the Saura MF radar allowscommon volume observations at mesospheric altitudes with theSoutheast and Southwest beams of the
.All pos-sible beams of the ALWIN VHF radar and most of the possibleSaura MF radar beams point also into the volume that is illumi-nated by the Andenes MF radar as well. This makes it possibleto compare results obtained from the same volume but withradars operating on different frequencies and using similar ordifferent analysis techniques. Furthermore
f the Saura MF radar beamis steered to the volume where the ALWIN NW 7° or NW14°beam point to, the rocket trajectories have intersections withboth radar beams at altitudes between 75 and 90 km.
nearby locatedALWINVHF radar andwiththelidarexperiments atALOMAR
comparisons within-situ measurements from sounding rockets launched from theAndoya Rocketrange are possible. I
Areas byoblique and vertical beams ofALWINVHF radar (green),AndenesMFradar(blue) and
at 85km altitude illuminated
SauraMFradar(red).Northern part of Andoya island.
0 1 2 3 4 5km
ALWINVHF radar
AndenesMF radar
SauraMF radar
ALOMAR
AndoyaRocket Range
Experimentconfigurations broad narrow DBS
beam beam windPRF [Hz] 150 150 150Coherent integrations 16 16 8Data points per beam 512 512 800Range start [km] 50 50 50Range end [km] 98 98 98Sampling interval [km] 2 2 2Pulse width [ s] 26.67 26.67 26.67Beam direction sequence 140.5/17.2 140.5/17,2 50.5/7.3
(azimuth/zenith) 320.5/17.2 320.5/17.2 230.5/7.3140.5/7.3320.5/7.3
Time resolution t [ms] 213.33 213.33 213.33Experiment run time [s] 109.23 109.23 170.67
µ
∆
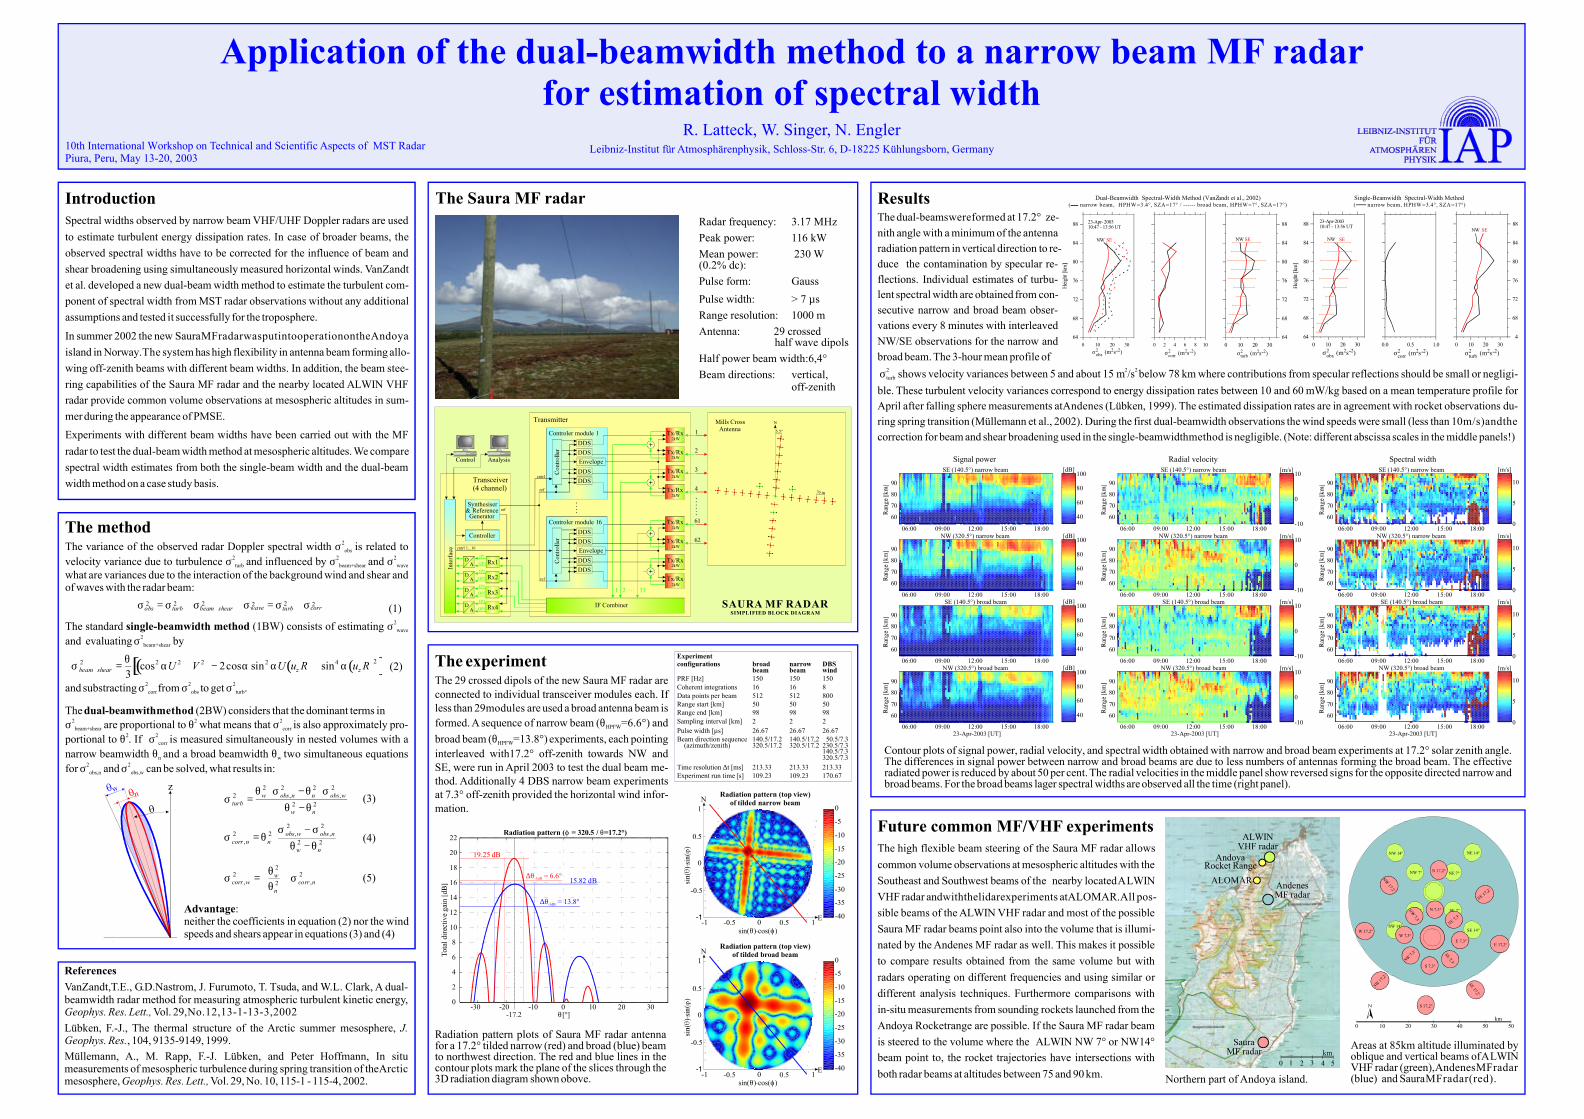
ResultsThe dual-beamswereformed at 17.2° ze-nith angle with a minimum of the antennaradiation pattern in vertical direction to re-duce the contamination by specular re-flections. Individual estimates of turbu-lent spectral width are obtained from con-secutive narrow and broad beam obser-vations every 8 minutes with interleavedNW/SE observations for the narrow andbroad beam. The 3-hour mean profile of
shows velocity variances between 5 and about 15 m /s below 78 km where contributions from specular reflections should be small or negligi-ble. These turbulent velocity variances correspond to energy dissipation rates between 10 and 60 mW/kg based on a mean temperature profile forApril after falling sphere measurements atAndenes (Lübken, 1999). The estimated dissipation rates are in agreement with rocket observations du-ring spring transition (Müllemann et al., 2002). During the first dual-beamwidth observations the wind speeds were small (less than 10m/s)andthecorrection for beam and shear broadening used in the single-beamwidthmethod is negligible. (Note: different abscissa scales in the middle panels!)
σ2 2 2turb
Contour plots of signal power, radial velocity, and spectral width obtained with narrow and broad beam experiments at 17.2° solar zenith angle.The differences in signal power between narrow and broad beams are due to less numbers of antennas forming the broad beam. The effectiveradiated power is reduced by about 50 per cent. The radial velocities in the middle panel show reversed signs for the opposite directed narrow andbroad beams. For the broad beams lager spectral widths are observed all the time (right panel).
σ2obs
2 2(m s- ) σ2corr
2 2(m s- ) σ2turb (m s- )2 2
0 10 20 3064
68
72
76
80
84
88
SENW
0 2 4 6 8 10 0 10 20 3064
68
72
76
80
84
88
NW SE
23-Apr- 200310:47 - 13:56 UT
Dual-Beamwidth Spectral-Width Method (VanZandt et al., 2002)( narrow beam, HPHW=3.4°, SZA=17° / ------ broad beam, HPHW=7°, SZA=17°)
Single-Beamwidth Spectral-Width Method( narrow beam, HPHW=3.4°, SZA=17°)
0 10 20 3064
68
72
76
80
84
88
SENW
0.0 0.5 1.0 0 10 20 304
68
72
76
80
84
8823-Apr-200310:47 - 13:56 UT
NW SE
σ2obs
2 2(m s- ) σ2corr
2 2(m s- ) σ2turb (m s- )2 2