Application Portfolio Optimization (APO) and Project Governance Prepared for: Indiana Digital...
25
Application Portfolio Optimization (APO) and Project Governance Prepared for: Indiana Digital Government Summit June 7, 2005 Doug Masten, PMP Service Delivery Manager
-
Upload
agnes-golden -
Category
Documents
-
view
213 -
download
0
Transcript of Application Portfolio Optimization (APO) and Project Governance Prepared for: Indiana Digital...

Application Portfolio Optimization (APO) and Project Governance
Prepared for:
Indiana Digital Government Summit June 7, 2005
Doug Masten, PMP
Service Delivery Manager

Page 2
Application Portfolio Optimization Review
• What is APO?
• Why do it?
• Approach
• Outputs & Results
• Moving to Project Governance

Page 3
• Aligning IT Investments With Business Strategy
• No Budget
• Failed Development Projects
• Poor Project Management
• Inadequate Performance Metrics
• Inefficiencies
• Escalating Costs
• Poor Process & Management Disciplines
• Reactive
• Expensive, Antiquated Technologies
• Inflexible Systems
• Unmet Business Needs
• Redundant Applications
• Disparate Applications
• End-of-Life Applications
Application Lifecycle OptimizationChallenges
Benefits
Costs
ApplicationDevelopmentApplication
DevelopmentApplication
ManagementApplication
ManagementApplications
RationalizationApplications
Rationalization
Co
st
& B
en
efi
t

Page 4
Benefits
Costs
ApplicationDevelopmentApplication
DevelopmentApplication
ManagementApplication
ManagementApplications
RationalizationApplications
Rationalization
• Increase ROI by reducing development costs
• Gain benefits faster by cutting time-to-market
• Lower risk through strong project mgmt
• Fund with budget taken from low value projects
• Increase business value by:
– Extending usage
– Expanding functionality
• Reduce costs through
– Rigorous processes
– Higher productivity
– Proactive mgmt
• Increase business value by:
– Extending the life of useful applications
– Enhancing flexibility
• Reduce costs by:
– Consolidating redundancy
– Retiring low value applications
– Standardizing technology platforms
Co
st
& B
en
efi
t
Application Lifecycle OptimizationOpportunities

Page 5
Why APO?
• APO provides an objective framework to:
– Assess, align, and strengthen the existing application portfolio based on inherent value, cost, and risk to the business
– Assure alignment with key business objectives to gain the most business advantage from each IT dollar invested
– Change the business view of applications to assets for investment to achieve business objectives, not costs with un-quantified business value

Page 6
APO is Focused on Existing Applications
Source: META Group
IT Strategy
Establish Enterprise Priorities
Identify AssetImprovements
Manage AssetUsage
Assess Value
AssetRetirement
Manage PortfolioExecution
ImplementProjects/Programs
Assess Value
Adjust ProjectPortfolio
Asset TransformationProject Proposals
New/ModifiedAssets
EnterpriseProgram(Project
Portfolio)Management
Asset PortfolioManagement
TransformationalProcess
OperationalProcess
APO FocusGovernance Focus

Page 7
Potential APO Benefits
• Significant cost reductions
• Free IT staff and budget for higher value purposes
• Enable simplification of IT platforms
• Extend the life of value-generating functionality
• Accelerate portfolio evaluations as part of mergers and acquisitions
• Minimize risk, maximize potential of core and emerging applications
• Builds business alignment and buy-in
• Institute IT Governance / Portfolio Management processes and tools
Page 8
APO makes extensive use of Portfolio Analysis methods and tools
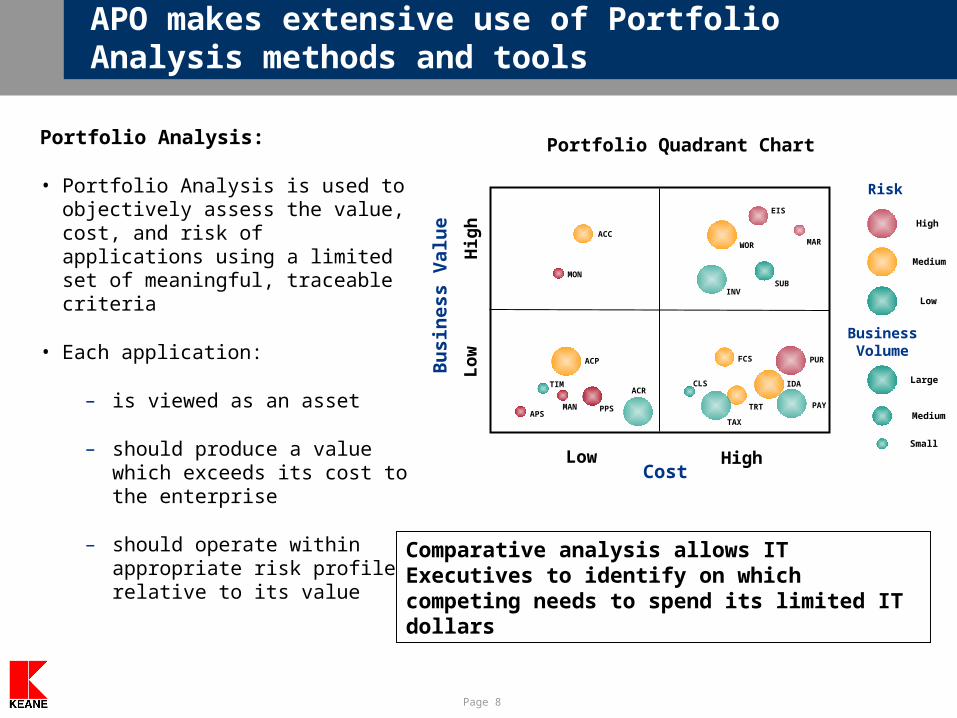
Portfolio Analysis:
• Portfolio Analysis is used to objectively assess the value, cost, and risk of applications using a limited set of meaningful, traceable criteria
• Each application:
– is viewed as an asset
– should produce a value which exceeds its cost to the enterprise
– should operate within appropriate risk profiles relative to its value
HighL
ow
Hig
hLow
Bu
sin
ess
Val
ue
Cost
Risk
High
Medium
Low
Large
Medium
Small
Business Volume
PUR
MON
ACC
PAY
ACR
ACP
SUBINV
WOR
EIS
TAX
MAR
MAN
TIM
TRT
IDA
FCS
PPSAPS
CLS
Portfolio Quadrant Chart
Comparative analysis allows IT Executives to identify on which competing needs to spend its limited IT dollars

Page 9
APO Assessment Framework
Cost
Risk
Value
StrategicAlignment
OperationalEfficiency
TechnicalCapability
InvestmentCosts
SupportCosts
Platform ServicesCosts
BusinessRisk
Technology Risk
– The customization of the framework centers around three Key Performance Areas (KPAs):
• Value
• Cost
• Risk
– Each KPA consists of several categories used to rate each application
– The ratings are used to determine an application’s index within each KPA

Page 10
APO Context Diagram
OptimizePortfolio
Portfolio Recommendations
/ Deliverables
Business Objectives
Current Portfolio (e.g,
Scorecard, Disposition)
Current Initiatives
Other Constraints

Page 11
APO Key Elements of Success
Key ComponentsKey Elements
Standard templates and tools
Objective assessment
Measurable metrics
Information Gathering
Clear business strategy
Defined decision criteria
Authority and budget to act
Recommendations and Decisions
Objective and believable data
Data is tied to a source
Metrics tell a story
Validated Output
Business Value
Cost
Risk
Evaluation Framework
Stakeholders agree to the approach
Participation in the process
Value the results
Business Buy-in
Page 12
Portfolio Management Tools support Comparative Analysis
Application X1: RETIRE CANDIDATE
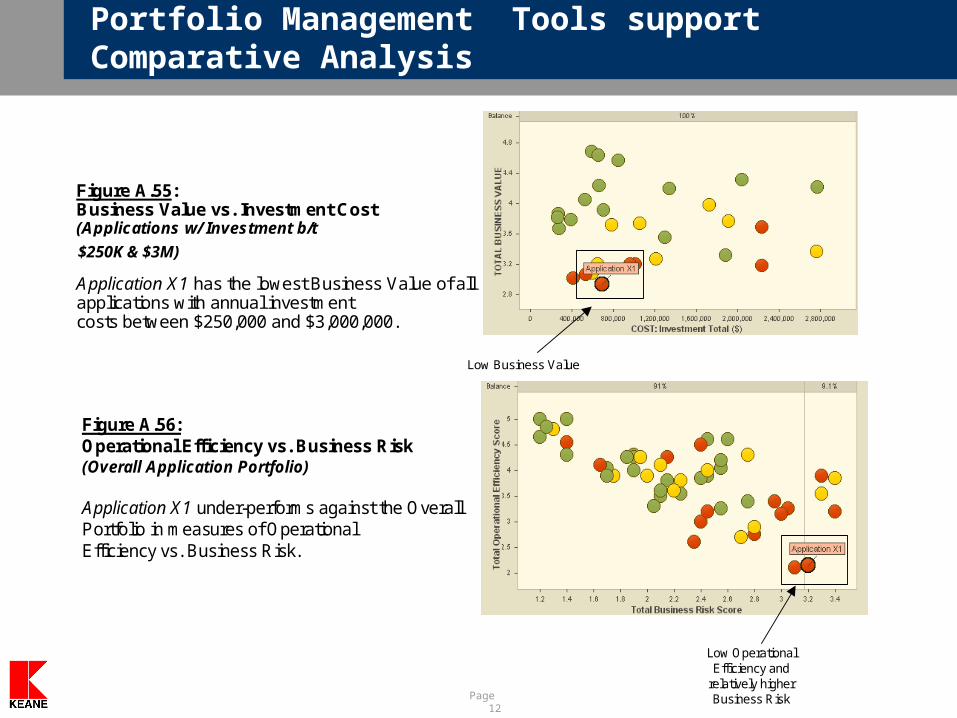
It had been previously noted by Company Z IT that Application X1 has redundancy in functionality with Application X2. AR Analysis indicates that there would be a business case for retiring Application X1 and migrating its functionality into Application X2 in the near-term. The dollar-based business case is supported by the $2.3 million for the annual IT cost of ownership of Application X1, including nearly $950,000 in annual investment cost. Figure A.55 below maps the Business Value of all applications which have annual investment costs between $250,000 and $3,000,000. Application X1 has the lowest Business Value of all the applications in this segment of the portfolio. This indicates that the dollars spent on Application X1 are getting an abnormally low rate of return for Company Z IT.
Figure A.55:Business Value vs. Investment Cost(Applications w/ Investment b/t $250K and $3)
Application X1 has the lowest Business Value of all applications with annual investment costs between $250,000 and $3,000,000.
Low Business Value
Application X1 continued
The business case for retirement of Application X1 is also supported by Application X1 being identified as one of the worst performing applications throughout the overall portfolio in measurement of Operational Efficiency vs. Business Risk. This is not a desirable profile for an aging application processing 35,000 mission-critical transactions per day.
Figure A.56:Operational Efficiency vs. Business Risk(Overall Application Portfolio)
Application X1 under-performs against the Overall Portfolio in measures of Operational Efficiency vs. Business Risk.
Low Operational Efficiency and
relatively higher Business Risk
$250K & $3M)

Page 13
Sample Deliverables: Application Roadmap
• To ensure detection of redundant functionality and to present the aggregate changes in the portfolio over time via execution of AR Recommendations, functional-based Roadmaps are developed. A Current View, Intermediate Views, and Recommended View are created through the course of the engagement.

Page 14
Methodology Details – Disposition Definitions
• Each application is given one of four dispositions:
Develop substantive, defendable recommendations for each application, or logical group of applications
Disposition Description
Retain Application supports business needs adequately; current maintenance and investment strategy will be continued
Invest Incrementally increase investment in the application to positively impact value, cost, or risk to the organization
Replace Replicate current functionality within a new application
Retire Migrate functionality into another application, or cease utilizing the application

Page 15
Sample Deliverables: Executive Summary
BS = Develop Business StrategyPS = Develop Product and Services StrategyMP = Market Products
PO = Process OrdersSC = Service CustomersCR = Manage Customer Relationships
FS = Manage Financial SolutionsBO = Manage Business Operations
Key:
Application Process Retain Enhance Replace Retire Application #1 CR App #2 PO App #3 BO App #4 SC App #5 BO App #6 BS App #7 PO App #8 BS App #9 BO App #10 MP App #11 FS App #12 PO App #13 PO App #14 SC App #15 SC App #16 SC App #17 PO App #18 CR App #19 SC App #20 CR App #21 SC App #22 SC App #23 SC App #24 CR App #25 FS App #26 CR App #27 SC App #28 SC
• This table provides an example of applications by Business Process, Portfolio Category, and Action Code.
• Potential business case exists to replace or retire the application
• Significant risk can be mitigated by replacing or retiring the application
• Strong asset can potentially be leveraged more broadly to increase business value or reduce cost
Take Action
• Similar functionality exists in whole or in part within another application
• Lacks a strong business case to replace or retire the application, despite lower business value score
• Moderate to high technology architecture risks threaten long-term viability of the application
Seek Additional
Opportunities
• Strong Business Value vs. Cost vs. Risk ratios
• Strong Cost vs. Risk ratios with moderate to low Business Value
Monitor as Needs
Change
Attribute PossibilitiesMeaningAction Code
BS = Develop Business StrategyPS = Develop Product and Services StrategyMP = Market Products
PO = Process OrdersSC = Service CustomersCR = Manage Customer Relationships
FS = Manage Financial SolutionsBO = Manage Business Operations
Key:
Application Process Retain Enhance Replace Retire Application #1 CR App #2 PO App #3 BO App #4 SC App #5 BO App #6 BS App #7 PO App #8 BS App #9 BO App #10 MP App #11 FS App #12 PO App #13 PO App #14 SC App #15 SC App #16 SC App #17 PO App #18 CR App #19 SC App #20 CR App #21 SC App #22 SC App #23 SC App #24 CR App #25 FS App #26 CR App #27 SC App #28 SC

Page 16
Sample Deliverables: Executive Summary
• Segmenting the portfolio by action codes dramatically highlights that nearly 27% (15 of 55) of the applications in the portfolio presented this organization with an immediate opportunity to “Take Action”, and improve business value or reduced cost.
Portfolio Category Applications
Total FTEs People Cost ETS Cost
Total Annual Cost
Retain 28 383 $44,156,886 $40,789,955 $84,946,841Enhance 0 0 0 0 0Replace 0 0 0 0 0Retire 0 0 0 0 0Totals 28 383 $44,156,886 $40,789,955 $84,946,841
Portfolio Category Applications
Total FTEs People Cost ETS Cost
Total Annual Cost
Retain 5 118 $13,869,350 $6,506,896 $20,376,246Enhance 4 463 54,160,514 20,287,698 74,448,212Replace 2 17 1,867,763 1,492,129 3,359,892Retire 1 30 3,441,409 1,330,159 4,771,568Totals 12 628 $73,339,036 $29,616,882 $102,955,918
Portfolio Category Applications
Total FTEs People Cost ETS Cost
Total Annual Cost
Retain 0 0 $0 $0 $0Enhance 4 37 4,569,403 2,296,129 6,865,532Replace 6 163 18,771,925 5,609,649 24,381,574Retire 5 28 3,418,947 1,793,620 5,212,567Totals 15 229 $26,760,275 $9,699,398 $36,459,673

Page 17
Key Questions Answered by APO
• What are the most valuable activities to pursue, and why?
• How does the current state of the application portfolio impact current activity and spending related to new development, incremental enhancement, and maintenance?
• How well aligned is IT spending with strategic objectives?
• How much redundancy exists in the application portfolio, and is there value in reducing it?
• What is the disposition strategy for each application in the portfolio (Retain, Invest, Replace, Retire)?
Page 18
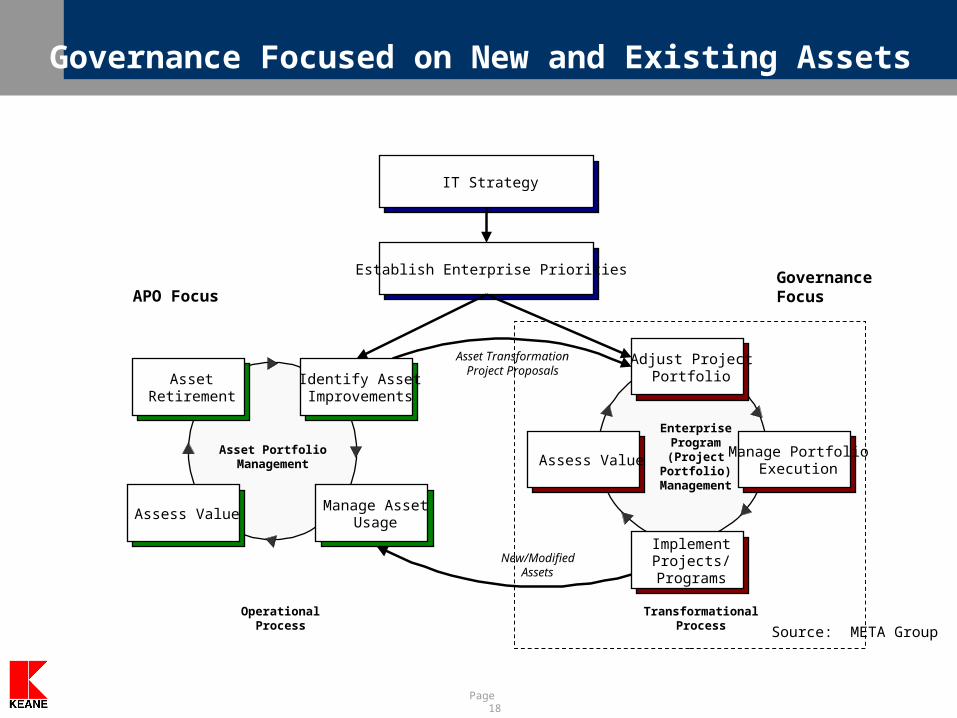
Governance Focused on New and Existing Assets
Source: META Group
IT Strategy
Establish Enterprise Priorities
Identify AssetImprovements
Manage AssetUsage
Assess Value
AssetRetirement
Manage PortfolioExecution
ImplementProjects/Programs
Assess Value
Adjust ProjectPortfolio
Asset TransformationProject Proposals
New/ModifiedAssets
EnterpriseProgram(Project
Portfolio)Management
Asset PortfolioManagement
TransformationalProcess
OperationalProcess
Governance FocusAPO Focus

Page 19
Continuous Operational Loops

Page 20
Governance Committee Role
Governance Committee ensures benefits are achieved:• At Project Selection
– Prioritize projects based upon value, cost, risk
– Align investments with objectives
• At project initiation– Clear understanding of the mechanisms through which benefits will be
achieved
– Measurements (quantification and qualitative) determined during planning
– Risks identified
• Review at key points to ensure all required mechanism are in place
• Assessment at project end MAKINGTHECASE
RISK OPTIONANALYSIS
OPTIONS CONSIDERATION
BENEFITSDEFINITION
& ANALYSIS
COST SCENARIOS
ONGOINGREVIEWS
DOCUMENTING
THE CASE

Page 21
Maintaining Optimization Through Governance
IT GovernanceIT GovernanceIT GovernanceIT Governance
Project Governance processes ensure they receive value Project Governance processes ensure they receive value from investments in projects and that risks are managedfrom investments in projects and that risks are managedProject Governance processes ensure they receive value Project Governance processes ensure they receive value from investments in projects and that risks are managedfrom investments in projects and that risks are managed
Selection andSelection andApproval of Approval of
ProjectsProjects
Selection andSelection andApproval of Approval of
ProjectsProjects
Project Project Oversight Oversight
MechanismsMechanisms
Project Project Oversight Oversight
MechanismsMechanisms
Project Project ManagementManagement
Project Project ManagementManagement
Monitoring of PerformanceMonitoring of PerformanceMonitoring of PerformanceMonitoring of Performance

Page 22
Summary
• Budget Constraints, Competing Priorities, and Accountability Demand Optimization of Investments
• Application Portfolio Optimization Delivers Cost Reduction and Alignment with Strategic Objectives
• Once Application Portfolio is Optimized, Keep it that way through Governance Processes
• View Applications as Assets vs. Expenses
• Align IT with Business
Page 23
QUESTIONS?

Page 24
THANK YOU!
(513) 218-1671
State of Indiana Service Delivery [email protected]
(513) 520-2372