Application of Wind Tunnel Free-Flight Technique for …mln/ltrs-pdfs/NASA-97-tp3672.pdf ·...
74
National Aeronautics and Space Administration Langley Research Center • Hampton, Virginia 23681-2199 NASA Technical Paper 3672 Application of Wind Tunnel Free-Flight Technique for Wake Vortex Encounters Jay M. Brandon, Frank L. Jordan, Jr., and Robert A. Stuever Langley Research Center • Hampton, Virginia Catherine W. Buttrill Unisys Corporation • Hampton, Virginia November 1997
-
Upload
trinhthuan -
Category
Documents
-
view
217 -
download
0
Transcript of Application of Wind Tunnel Free-Flight Technique for …mln/ltrs-pdfs/NASA-97-tp3672.pdf ·...

National Aeronautics and Space AdministrationLangley Research Center • Hampton, Virginia 23681-2199
NASA Technical Paper 3672
Application of Wind Tunnel Free-FlightTechnique for Wake Vortex EncountersJay M. Brandon, Frank L. Jordan, Jr., and Robert A. StueverLangley Research Center • Hampton, Virginia
Catherine W. ButtrillUnisys Corporation • Hampton, Virginia
November 1997

Printed copies available from the following:
NASA Center for AeroSpace Information National Technical Information Service (NTIS)800 Elkridge Landing Road 5285 Port Royal RoadLinthicum Heights, MD 21090-2934 Springfield, VA 22161-2171(301) 621-0390 (703) 487-4650
Available electronically at the following URL address: http://techreports.larc.nasa.gov/ltrs/ltrs.html

Summary
A wind tunnel study was conducted to determine thefeasibility of using the free-flight test technique to studywake vortex encounters. A generic business-class jet air-plane model was instrumented and flown in the vicinityof a wake vortex generated by a simple wing. Thestrength of the vortex could be varied by adjusting thegenerating-wing angle of attack. The variation in thestrength of the vortex allowed researchers to study arange of simulated vortex strengths for a fixed-span ratioof 0.75 and enabled the simulation of various followingdistances and generator airplane weights without theuncertainties in vortex decay and atmospheric effects.The study showed that the free-flight test technique was aviable and useful tool in the study of the wake vortexencounters—combining vortex flow fields, airplanedynamics, sensors, and flight control aspects.
Data obtained during this test included qualitativeand quantitative results. Steady-state limits of controlla-bility were documented as a function of vortex strength.By flying several vortex encounter trajectories at highvortex strengths, a mapping was conducted of roll angle,roll rate, lateral velocity, and vortex-induced roll-rateacceleration. The data quantified the effects of the modelentering vortex flow fields of varying strengths.
Introduction
The National Aeronautics and Space Administration(NASA) is conducting research that will enable safeimprovements in the capacity of the air transportationsystem. As part of this research, the Terminal Area Pro-ductivity (TAP) program has the goal of safely achievingcapacity levels during instrument meteorological condi-tions equivalent to those currently achievable undervisual meteorological conditions. One element of TAP,Reduced Spacing Operations (RSO), focuses on both lat-eral and longitudinal separation requirements. A keyconcern for reducing spacing requirements, especiallywhen an airplane is following large aircraft on anapproach, is the danger of upsets generated by the wakevortex of the preceding aircraft. Consequently, part of thecurrent NASA research effort focuses on developing andvalidating the technologies required for an automatedAircraft Vortex Spacing System (AVOSS, ref. 1), whichwill properly select safe separation distances for differentweather conditions based on the aircraft pair andpredicted-measured vortex behavior. Although theAVOSS will generally attempt to space aircraft to avoidany wake encounter at all, it must be able to select a sep-aration distance at which a wake encounter is safe andoperationally satisfactory, should one occur.
Defining a safe, operationally satisfactory wakeencounter for a given aircraft pair under any one condi-tion has proved very difficult. In addition to being able toadequately model the decay and advection of a wake vor-tex in the atmosphere, an equally important element is avalid model that represents the wake vortex encounteritself. Substantial analytical research has been conductedin vortex modeling (refs. 2 through 4), in vortex-airplaneinteraction, and in resulting forces and motions (refs. 5through 7) to try and quantify or predict hazards. Experi-mental research has been conducted both in flight (refs. 8through 10) and in wind tunnels (refs. 11 and 12) to pro-vide information on the wake vortex flow fields pro-duced by various airplanes and to investigate loadsimposed by an aircraft wake vortex on followingairplanes.
The free-flight test reported in this paper extends theresearch database by experimentally investigating thedynamic response characteristics of a follower aircraftduring wake vortex encounters. This was the first attemptto conduct such tests in a wind tunnel, and was viewedprimarily as a feasibility test to determine whether thefree-flight test technique was a useful research tool inwake vortex encounter research. Specific objectives forthis test were (1) to see if the model could be flownsafely and maneuvered accurately in a wake vortex flowfield of specified strengths, (2) to develop photogramme-try techniques for measuring the position of the modelrelative to the vortex, (3) to estimate rolling momentsimposed on the model due to the vortex flow field whileflying, and (4) to conduct exploratory qualitative evalua-tions of relative upsets for various encounter trajectories.Related work involved selecting appropriate flight con-trol system approaches to enable these tests to be con-ducted successfully. Flight test data obtained in the pastwere very difficult to analyze and apply in any generalsense due to large uncertainties in the data. For example,two significant uncertainties are the strength and positionof the vortex which is encountered. It is well-known(ref. 13, for example) that atmospheric effects play a pre-dominant role in the dissipation characteristics of a wakevortex. Also, it is very difficult in flight experiments torepeatably conduct the same encounter flight paths whichwould allow high confidence in the results. In proposingthis wind tunnel experiment, it was assumed that the vor-tex characteristics in the wind tunnel would remainessentially constant with time (only be affected by turbu-lence levels in the tunnel and temperature-pressure varia-tions during the day). Additionally, the level of thevortex strength may be easily controlled by increasing ordecreasing the lift of the wake vortex generator. In thisway, the effects of vortex strength on the dynamics of anairplane can be studied. The results of this study can beapplied to a range of generating airplane pairs (with span

2
ratios of 0.75) and separation distances by calculating ormeasuring the vortex intensity at the follower-airplanelocation.
The metric defining a safe and operationally satisfac-tory vortex encounter may entail very small allowableperturbations in aircraft attitude, as well as relativelylittle required corrective control activity. However, inlight of the wake encounters reported herein that werebeing flown as part of a feasibility test to evaluate thefree-flight technique, it is important to note that the sub-sequent upsets often and deliberately exceeded whatmight be regarded as acceptable. Exceeding what wereregarded as acceptable upsets was necessary to determinethe feasibility limits for planned follow-on tests and toestablish how an aircraft will respond to wake turbulenceand the magnitude of controls that must be provided tocorrect for it. Similarly, although the results from this testmay be combined with results from other research effortsto identify wake encounter metrics, it should be notedalso that the intent of this experiment was not to establishan acceptable level for an upset metric.
Symbols
b wingspan, ft
lift coefficientlift-curve slope per deg
rolling-moment coefficient
= per deg
= per deg
c mean aerodynamic chord, ft
g normalized acceleration
IX roll axis inertia, slug-ft2
IY pitch axis inertia, slug-ft2
IZ yaw axis inertia, slug-ft2
it horizontal tail incidence angle, deg
ny lateral acceleration, g units (positive right)
nz normal acceleration,g units (positive up)
p roll rate, deg/sec
q pitch rate, deg/sec
dynamic pressure, psf
R distance of follower model from vortex core,in.
r yaw rate, deg/sec
S reference wing area, ft2
t30 time required to reach 30° bank angle
free-stream wind tunnel velocity, ft/sec
Vso stall speed in landing configuration, ft/sec
x downstream distance measured from thegenerating-wing quarter-chord
z vertical distance, ft
α angle of attack, deg
αv = 0.5(αs − αp), deg
β angle of sideslip, deg
Γ vortex strength, ft2/sec
δa aileron deflection, deg
δe elevator deflection, deg
δr rudder deflection, deg
θ pitch angle
θv radial location of follower model relative tovortex core location, deg
σ density ratio of air at full-scale flight condi-tions to model flight conditions at sea level
τr roll mode time constant
φ roll angle, deg
ψ yaw angle, deg
Subscripts:
f follower airplane
fs full scale
g vortex generator wing
p port side
ms model scale
s starboard side
ss steady state
v vortex induced
Abbreviations:
ARI aileron-rudder interconnect
ATP advanced turboprop
AVOSS Aircraft Vortex Spacing System
FAR Federal Aviation Regulations
FCS flight control system
FS full-scale value
hsw hardware switch
MS model scale value
N model scale
CL
CLαCl
Clδa
Cl∂δa∂
--------,
Clδr
Cl∂δr∂
--------,
q
U∞
δasδap
–
2---------------------,

3
NLF natural laminar flow
RSO Reduced Spacing Operations
TAP Terminal Area Productivity
Model Description and Test Techniques
The overall test technique used for the free-flightexperiment is illustrated in figure 1. The primary compo-nents are a wing in the forward section of the wind tunnelto generate a wake vortex flow field, a model flyingunconstrained behind the wing in and around the wakevortex flow field, and instrumentation required to fly themodel and to obtain data for analysis. Further details ofthe test setup and conduct will be given herein. The coor-dinate system used in the tests was based on the locationof the starboard vortex of the generating wing. Modelposition data presented will be referenced to a radial dis-tance from the measured vortex core location and anangle. The angleθv is defined as increasing clockwisefrom the horizontal three o’clock position relative to thevortex.
Vortex Generator Wing
The model used to generate the wake vortex was arectangular planform aspect ratio 7.0 wing with a span of12 ft, a chord of 1.71 ft, and a NLF(1)-0215F general avi-ation airfoil section. The wing was constructed of fiber-glass and epoxy with an aluminum spar. Further detailsregarding the airfoil section can be found in reference 14.Overall aerodynamic forces and moments acting on themodel were measured on an internal six-component bal-ance, in part to enable estimation of the subsequent shedvortex strength from lift but also to monitor loads on thetest rig. Smoke generator tubes using heated propyleneglycol vapor were installed along the wing trailing edgeto produce smoke at the wingtips to seed the vortex sothat it would be visible for the flight encounters. The fig-ure 2 photograph shows the wing installed in the Langley30- by 60-Foot Tunnel (with the smoke generators oper-ating). During the free-flight vortex encounters, all avail-able smoke was concentrated in the starboard vortex toimprove visual definition of the vortex core location. Thefigure 2 photograph also shows illumination of the vorti-ces by a laser light-sheet technique, which will bedescribed subsequently in the Free-Flight Tests section.
Follower Airplane
The geometric characteristics of the follower modelairplane are depicted in figure 3. The model wasconstructed of fiberglass and epoxy. The mass andgeometric properties were scaled to simulate a represen-tative business-commuter aircraft for the purpose ofdetermining flight characteristics from free-flight tests inthe Langley 30- by 60-Foot Tunnel. Geometric and mass
characteristics of the model are shown in table I. Theintent of the investigation was to explore vortex encoun-ters with the follower model in the high-lift-landing-approach condition; therefore, the configuration had thetrailing-edge flaps deflected 35°. Model control-surfacedeflection limits wereδa = +20° to −20°; δe = +15° to−25°; andδr = +20° to −20°. Horizontal tail incidenceangleit could be varied from+2° to −10° to provide anextended range of pitch trim; however,it was fixed at 0°for the current test. No landing-gear geometry wasincluded on the model.
The model also incorporated full-span Krüger flaps.Previous free-flight test results of the model configuredas an advanced turboprop (ATP) (ref. 14) indicated thatthis configuration exhibits an abrupt wing drop andautorotative departure against full corrective control atthe stall angle of attack. Static wind tunnel test resultsshowed that the wing drop was due to an abrupt asym-metric wing stall that produced a pronounced rollingmoment. Additional free-flight tests of the configuration,modified to include wing leading-edge devices such asKrüger flaps, showed that the modified configurationshad acceptable overall flying qualities and no significantstability and control problems, even at post-stall anglesof attack. Sketches and other details of the full-spanKrüger flaps that were used on the model can be found inreference 15.
The model was powered with two thrust tubesinstalled on each side of the aft part of the fuselage. Thethrust tubes only provided thrust to fly the model, and noattempt was made to simulate thrust characteristics ofany specific airplane configuration.
Scaling Discussion
A straight, unflapped wing was selected to bethe wake vortex generator because of the propertiesof rapid vortex rollup and essentially constant vortexstrength for long downstream distances (ref. 16).Because of these characteristics, vortex strength at thelocation of the follower model could be estimated for anelliptically loaded wing by using the approximation:
The vortex core size may not have been
representative of full-scale flight conditions in thesetests. This core size is currently believed to be of minorimportance due to the large ratio of wingspan to vortexcore diameter both in flight and in these wind tunneltests.
To scale results from the current test and relate themto a full-size airplane, the flow angularity distributioncaused by the vortex on the current follower model andthe full-scale airplane must be equivalent. Additionally,
Γ2CLU∞Sg
πbg------------------------.=

4
the follower model must have appropriate dynamicallyscaled mass and inertia values and similar aerodynamiccharacteristics compared to the full-scale airplane.
The scaling considerations dictate that the results aredependent on wingspan ratio between the generatingwing and the follower aircraft. To apply the resultsdirectly, the span ratio must be equivalent in flight to thewind tunnel test values, and the model mass characteris-tics must be appropriately scaled. Then, the vortexstrength estimated at the point of the encounter (at thefollower airplane location) can be related to the presentresults by using generating-wing lift coefficients. For thecurrent test, the wingspan ratio wasbf /bg = 0.75. For dis-cussion later in this report, the follower model willbe considered to be at 0.175 scale, which is representa-tive of an experimental test bed aircraft described inreference 17. These factors result in conditions represen-tative of a business jet airplane following a commuterairline airplane. Table II shows a comparison ofgenerating-wing lift coefficient, vortex strength, andfull-scale vortex strength. The lift characteristics of thegenerating wing are shown in figure 4. Due to dynamicscaling relationships, the small-scale models tested withthe free-flight test technique develop considerably fasterresponses than full-scale airplanes. Some scaling factorsare shown in table III.
Free-Flight Tests
The wind tunnel free-flight tests were conducted inthe Langley 30- by 60-Foot Tunnel with the techniqueillustrated in figure 1. With this technique, the remotelycontrolled, dynamically scaled model was flown in theopen test section of the Langley 30- by 60-Foot Tunnel.For most of the tests, a vortex generating wing wasmounted in the forward section of the wind tunnel. Aspreviously discussed, the generating-wing angle of attackwas varied to enable selection of an approximate vortexstrength. The vortex core was marked with propyleneglycol smoke to enable the free-flight pilots to positionthe flying model in desired locations relative to thewingtip vortex created by the upstream wing. Figure 5 isa photograph of the model flying in the vortex during thetest. The wind tunnel free-flight tests were used first toevaluate the flying characteristics of the airplane with thevarious control laws and then to evaluate the dynamicresponse and controllability of the model near vortices ofvarious strengths. Hence, prior to mounting the generat-ing wing in the tunnel, the free-flight model was flown toevaluate the control law implementation and to adjust thegains to ensure that the model was well-behaved in freeair. Next, for the vortex encounter tests, the model wasfirst flown near the vortex, and then penetrations of thevortex were made from various trajectory paths. The
resulting model motions were measured, and pilotcomments were recorded for each flight condition. Allvortex encounters were conducted at a tunnel speed cor-responding to 1.3Vso with the airplane flaps configuredfor landing.
During the free-flight tests, the model was attachedto an umbilical chord which supplied pneumatic andelectric power and control signals to the model. Thechord also contained a 1/8-in. steel safety cable that wascontrolled by a safety cable operator using a high-speedpneumatic winch. The safety cable operator’s functionwas to help launch the model at the start of a test, toretrieve the model at the end of a test, to keep tension offthe model from the umbilical cable during the test, and toattempt to protect the model in an out-of-control situationby pulling the model out of the airstream.
In addition to the safety cable operator, the modelflight crew consisted of a pitch pilot, a thrust pilot, and aroll-yaw pilot. These piloting functions were located inthe positions shown in figure 1 to afford the best view forcontrolling the pertinent axes. The separation of thepiloting duties is very advantageous for several reasons.By separating pilots by axes, effective evaluations can beobtained more easily because the pilot is only controllingthe axes he is trying to evaluate. Model control is alsoenhanced by providing the optimal visual perspective forcontrol of each axis. Due to dynamic scaling, the modelmotions are substantially faster than those of the full-scale airplane, so separation of piloting tasks is beneficialfor that reason as well.
The primary component in the free-flight controlsystem is a digital minicomputer that was programmedwith the flight control laws (presented in the appendix).The computer processed sensor information from themodel and command inputs from the pilots to generatecommand signals to drive the high-speed pneumaticactuators onboard the model. The data sensors on themodel included a three-axis rate gyro to measure angularrates, an accelerometer package to measure normal-,axial-, and side-force accelerations, a boom-mountedα/βvane sensor on each wingtip for angle of attack and side-slip, potentiometers to measure control-surface positions,and a transducer to measure pressure at the thrust tube forthrust estimations. These sensor data, along with pilotcontrol inputs, were recorded in the computer forpostflight analysis. Angular rates, linear accelerations,andα/β vane sensor data were filtered with a first orderlag filter with a time constant of 0.05 sec before enteringthe FCS. Additionally,α and β from the wingtipmounted vanes were corrected for angular rates. Post-flight data reduction included incorporating upwashcorrections to theα data based on static wind tunnel testresults obtained previously, correction of accelerometer

5
data to the model center-of-gravity location, and calcula-tion of angular accelerations by differentiation of mea-sured angular rate data.
Additional quantitative flight data were recorded byusing photogrammetry techniques applied to free-flighttesting for the first time (ref. 18). The model and thewind tunnel test section were marked with photo reflec-tive spots at known locations. A camera above the exitcone in the tunnel was used to track the model. Postflightanalysis of the tracker camera data was used to obtainmodel Euler angles and position in the wind tunnel. Thelocation of the wingtip vortex produced by the generatingwing also was located photogrammetrically. The smokewas marked in three locations by a laser light sheet. Theforward position was illuminated by an Argon laserlocated just outside the balcony used by the pitch andthrust pilots. The middle and aft positions were illumi-nated by diode lasers mounted on the wind tunnel groundboard. The intersection of the smoke and the light sheetswas then used to determine the vortex core location dur-ing the test. Figure 6 is a photograph of the test setupshowing the lasers. The locations of the plane of the laserlight sheets relative to the quarter-chord of the generatorwing are shown in table IV. Additional qualitative datawere recorded, including pilot comments and videorecordings of the model flights. Table V lists the trans-ducer accuracies and data system resolutions which wereavailable for the key recorded parameters during the test.A discussion of the photogrammetry data factors is avail-able in reference 18.
Free-Flight Test Results
During the wind tunnel free-flight tests, the modelwas evaluated by using various flight control system fea-tures. Although the flight control system was not consid-ered a primary area of interest for this test, it wasnecessary to provide the pilots with a model possessinggood flying qualities to conduct the vortex encounterflights. Three longitudinal flight control system architec-tures were developed for the test:α-command, pitch ratecommand, andg-command. Theα-command system wasa direct link between the pitch stick and elevator posi-tions and also included pitch rate damping. The pitch ratecommand system used the pitch stick position to com-mand a pitch rate, and with no pitch stick input, themodel control laws would attempt to maintain the currentpitch attitude. Theg-command system used the pitchstick position to command normal acceleration (load fac-tor), and with no pitch stick input, would seek a 1g flightcondition. Additionally, because of the higher ratesdeveloped in dynamic model testing, roll and yaw ratedamping augmentation was added to aid in flying themodel in the wind tunnel. More detail about the flight
control system is presented in the appendix. This testrepresented the first time the wind tunnel free-flight testtechnique was used to study wake effects on a flyingmodel. As such, several challenges were overcome toprovide pertinent results. These challenges included fly-ing the model in very precise locations in the wind tun-nel, relative to the vortex, and measuring the modelposition and attitude angles in addition to the vortex corelocation for postflight analysis. Additionally, tests wereconducted without the vortex generating wing installedto determine model flying characteristics and to establishminimum controllable airspeed (Vso), which determinedthe tunnel speed for the remainder of the testing.
Free-Air Flight Characteristics
The model was easily flown in free air (no vortexgenerating wing upstream) in each of the longitudinalflight command modes. Theα-command mode was usedthroughout most of the free-air flights because it is a tra-ditional flight control system and pilots are very familiarwith it. The airplane could be flown with pitch ratedamping removed; however, the resulting airplanemotions were much more lively. The pitch rate commandmode was very easy to fly; however, some pilot learningwas involved for pilots to become comfortable with theintegrated control path, which resulted in the pitch atti-tude remaining wherever it was when the stick wasreleased. Theg-command system also resulted in an eas-ily controllable model.
Several options were programmed into the lateral-directional control laws. Similar to the longitudinal case,some experimentation was conducted to arrive at anacceptable flying airplane for the wake vortex encountertask. The unaugmented airplane was found to exhibitunfavorably low damping in roll and therefore requiredartificial roll damping for acceptable handling qualities.Additionally, the aileron-to-rudder interconnect (ARI)feature was used to alleviate adverse yaw and to enablethe model to fly in the lateral axis with only one control-ler (roll). Yaw rate feedback to the rudder was used toreduce Dutch-roll oscillations during flight. Side acceler-ation feedback to the rudder was flown with and withoutthe ARI engaged and was found to increase the ease ofmaintaining a lateral position in the tunnel; however, itdegraded the maneuver capability needed to repositionthe model. Differential angle-of-attack feedback to theailerons from the two wingtip booms was also evaluated,but as expected, because theα signals were rate cor-rected, they did not influence the flight characteristics ofthe model in free air. After the flying qualities investiga-tion was complete, the baseline configuration for thelateral-directional control system consisted of an ARIand artificial roll and yaw rate damping.

6
Flight-determined static stability.The lift coeffi-cient and pitching-moment characteristics could bededuced in flight by stabilizing at 1g flight conditions atvarious tunnel speeds. As the tunnel airflow speed wasdecreased, the angle of attack of the model increased forlevel flight. A comparison of lift coefficient measured inflight with that measured during a static wind tunnel testof the same model is shown in figure 7. It is important tonote that the data from reference 15 include pylon-mounted engines with propellers generating zero thrustwith an untrimmed model. These data show reasonableagreement with data measured on the model ofreference 15. Indications of pitching-moment character-istics are shown in figure 8 as average elevator angle atthe trim angles of attack. Comparison with data calcu-lated from reference 15 shows that the model is some-what less stable in the current configuration without thepylons and propellers. The roll control effectiveness wasnot directly measured in flight, but the static wind tunnelresults from reference 15 are shown in figure 9.
Identification of 1.3Vso. The airflow velocity in thewind tunnel was progressively slowed to evaluate theslow-speed characteristics of the model and to determinethe minimum controllable flight speed in the power-approach configuration. The model departed controlledflight due to insufficient pitch and roll control at adynamic pressure of 5.4 psf, which resulted in a modelangle of attack of approximately 10°. Based on theseresults and Federal Aviation Regulations (FAR), whichallow an approach speed of at least 1.3Vso, the remainderof the testing was conducted at a tunnel dynamic pressureof 9.0 psf, which is equivalent to a full-scale approachspeed of about 120 knots.
Dynamic response characteristics.Flight controlsystem (FCS) gains were adjusted in real time duringinitial flights in the wind tunnel to arrive at acceptableflying qualities for the tests. After setting the FCS gains,dynamic response characteristics were converted tofull-scale values and compared with airplane handlingqualities criteria to ensure that the model was still repre-sentative of actual full-scale airplanes. Model dynamicresponse characteristics for the various flight control sys-tem modes were obtained by performing doublet controlinputs and observing the resultant model motions. Thetypical free-flight control system has traditionally beenan α-command system with proportional feedbacks forstability. Theα-command system, which provided thepilot with what he considered to be good characteristics,gave a short-period mode with a frequency of approxi-mately 1.56 Hz (0.65 Hz full scale) and a damping ratioof approximately 0.6. These dynamic characteristics,along with an/α = 5.9g/rad, meet level I requirementsfor a full-scale airplane based on military specifications
(ref. 19). Theg-command and q-command control sys-tems introduced higher order dynamics; however, eachsystem resulted in a model with very desirable handlingcharacteristics for the free-flight task of limited maneu-vering in free air conditions.
The lateral dynamic response was similarly obtainedboth with dampers-on and dampers-off conditions. Alllateral-directional maneuvers were conducted with theARI engaged. The roll mode time constant and maxi-mum roll rates achieved during free-flight handlingqualities evaluations for the bare airframe (dampers off)and the augmented configuration (dampers on) areshown in table VI. These values also are shown scaled torepresentative full-scale values and are compared toreference 19 requirements for a class II land-based air-plane during approach. As can be seen, the roll ratedamper limited roll rate capability because it did not dif-ferentiate between a commanded or an uncommandedroll rate.
Vortex Flow Field Encounters
After establishing flight control system gains toensure good flying characteristics for the model, the vor-tex generating wing was installed in the forward portionof the wind tunnel test section. Initial flights were madewith the wing at zero lift angle of attack, and it was notedthat there was significantly more turbulence experiencedby the model due to the wing and its support (fig. 6). Aninteresting phenomenon occurred when the generating-wing angle of attack was slightly increased to generate asmall amount of lift. The flow in the tunnel appearedmuch smoother when there was a slight increase ofgenerating-wing angle of attack when flying the model.The wake generated by the wing at low lift coefficients isbelieved to have smoothed out the turbulence generatedby the support structure by the time it reached the area inwhich the model was flying.
As the wing angle of attack was further increased,generating wake vortices, the flow field characteristicswere very evident in the flight characteristics of themodel. Figure 10 shows a schematic of the flow fieldcharacteristics around the wake vortex. The starboardvortex (right vortex looking upstream) was the vortexused for vortex encounters. The figure shows an area ofupwash to the right of the vortex and downwash to theleft of the vortex (between the starboard and left wing-tip vortices). This upwash-downwash flow field made itvery difficult to accurately position the model vertically,while maneuvering laterally. Each longitudinal com-mand mode was evaluated to determine the bestconfiguration for conducting the vortex encounters. Theg-command mode minimized the vertical excursions ofthe model while it was flying through the vortex flow

7
field. This command mode was used in all transient vor-tex encounters presented herein.
The vortex generated by the upstream wing exhib-ited its own set of dynamics. The vortex core locationwandered approximately±5 in. in the vertical and lateraldirections, as shown in figure 11. These data representthe vortex core location movement over a time interval ofapproximately 0.5 sec, with the wind tunnel operating ata dynamic pressure of approximately 5.3 psf. The datawere obtained with the free-flight model removed fromthe test section. The vortex core position was measuredby using photogrammatic techniques described in refer-ence 18 to locate spatially the centroid of the smokemarking the vortex core that was illuminated by laser 3.Laser 3 was located beneath the vortex track a distance ofx/bg = 2.6. Most free-flight testing was conducted at awind tunnel dynamic pressure of 9.0 psf; however, themeander of the vortex was qualitatively the same ateither wind tunnel dynamic pressure.
A simple calculation was made to estimate thevortex-induced rolling moment on the follower modelduring vortex encounters. The assumptions required forthis calculation were that the control power effectivenesswas invariant during the encounter (given by the datain fig. 9). Effects of roll rate damping and dihedralwere neglected. Specifically, the vortex-induced rollingmoment was estimated by
Although not a part of the current study, a compari-son between statically measured and dynamicallyderived rolling moments may be useful in addressing theimportance of dynamic effects in predicting vortexencounter hazards.
Steady-state encounters.A systematic set of vortexencounters were flown to establish steady-state condi-tions in the vortex. These test points were conducted byestablishing the generating-wing angle of attack and theresulting flow field, and then the model was flown intothe smoke marking the vortex core of the tip vortex. Themodel was stabilized with the fuselage in the center ofthe vortex core (marked by smoke) for several secondsfor data recording. The test runs started with the generat-ing wing at zero lift, and then the angle of attack of thewing was increased in 1° increments until the free-flightmodel could no longer maintain position in the vortexflow field. To aid in the application of these data in ageneral sense, all generating-wing vortex strength datawill be represented by using the wing lift coefficient asshown previously in table II. Figure 12 shows the resultof the steady-state encounters. The model could be stabi-
lized in the vortex flow field up to a of approxi-mately 0.7. At that point, roll control on the model wassaturated, and the model could not maintain position inthe vortex.
As the vortex in which the model was flyingincreased in strength, the flow field sensed by thewingtip-mountedα/β vanes showed the increase in rota-tional flow. Figure 13 shows the difference between theangle-of-attack measurement at the left and rightwingtips. These data were obtained with the model posi-tioned directly in the vortex core. The data show that asthe vortex strength is increased, the difference in theangle of attack of the right and left wingtip increases.The predicted rolling-moment effects on the model dueto the vortex flow field are shown in figure 14. Thesedata were calculated by using the differential wing angleof attack and by assuming a linear upwash-downwashdistribution across the span of the model with the follow-ing equation:
where = 0.107 was obtained from free-flight datarecords. Though the assumption of linear upwash-downwash distribution across the span of the model doesnot physically represent typical vortex flow-field charac-teristics, the prediction based on differentialα showsreasonable agreement with free-flight data (fig. 12) as tothe strength of the vortex in which the model can beflown in steady-state controlled flight.
Transient vortex encounters.Most research flightmaneuvers were conducted to obtain data as the modelwas maneuvered near and through the core of the star-board vortex. As previously discussed, several encounterprofiles were flown with the generating wing set at vari-ous angles of attack to provide a wake vortex strengthvariation. The transient vortex encounters began with agenerating-wing angle of attack of 8° for a ofapproximately 0.95 and ended at the maximum wingangle of attack of 13.4° that was available in the tunnelfor a of approximately 1.25. As previously men-tioned, testing was conducted with vortex strengths farbeyond what would be expected to yield acceptable flightencounter boundaries. This testing was done primarilyfor two reasons: (1) to validate and explore fully the useof the free-flight test technique in these applications, and(2) to obtain a set of data with large amplitude effects forpossible use later in the validation of modeling andprediction techniques. Additionally, the large vortexstrength data ensured that the observed effects were sig-nificantly greater in magnitude than would occur due tonormal wind tunnel turbulence.
Clv
φ̇̇ f I X
qSb------------ Clδa
δa– Clδr
δr–=
CLg
∆Cl
CLααv
6----------------–=
CLα
CLg
CLg

8
Time-history data for vortex encounters for a rangeof vortex strengths and for the four general encounter tra-jectories are discussed in this section, and overall trendsfrom the data will be discussed subsequently. The fourencounter trajectories were (1) to descend directlythrough the starboard vortex core, (2) to climb directlythrough the vortex core, (3) to translate from the rightside of the vortex to between the generating-wing vortexpair, and (4) to translate from between the vortex pairthrough the vortex to the right side outside the vortex.Model position data will be presented relative to the vor-tex position which was measured during the run at laserlocation 2 at the initiation of a data run. Note that theactual vortex core location at the follower model likelywould differ due to downstream distance and the interfer-ence effects of the follower model on the vortex. Thevortex core (marked by smoke) tended to go around themodel rather than to impact directly; therefore, it wasvery difficult to position the model directly in the vortexcenter. The sign convention for the position (radius andangular position) is shown in figure 15. Most of the free-flight data were obtained at a downstream distance fromthe generating-wing quarter-chord location of approxi-mately 24 ft (2 spans of generating wing). Figure 16shows a histogram of the distance between the generatingwing and the follower model, including all data pointsreported herein.
Figures 17 and 18 show data for a vortex strengthcorresponding to = 0.95. Figure 17 shows a horizon-tal approach from right to left. As the model crossesthrough the starboard vortex core (t = 5.5 sec), the vortexflow field causes the model to descend and roll to theleft. The time-history data show full-right lateral controlsto oppose the vortex-induced moments while the modelis near the vortex core. As the left wingtip approaches thevortex, the flow vanes on the wingtip boom show a largeupwash and also substantial sidewash. As the wingtippasses beyond the vortex core location, an abrupt changefrom upwash to downwash occurs. After crossingthrough the vortex, pitch attitude increased to enablelevel flight in the downwash flow field that existedbetween the two vortices created by the generating wing.
Figure 18 shows a vortex penetration attempt begin-ning between the vortex pair and translating to the right.Despite nearly full-right controls, less than 10° of rightbank could be generated, and thus the translation ratewas very small. Even with full-right controls while nearthe starboard vortex, the model was rolled to the left, wasunable to pass through the vortex, and instead translatedback to a lateral location between the vortex pair. Thismaneuver was repeated at a faster lateral translation rateand resulted in a successful transition through the vortexto the free air on the right side of the tunnel.
Pilot comments at a = 0.95 indicated that thevortex produced rolling moment when the model wasnear the vortex core, exceeded the control capability ofthe model, and usually resulted in uncommanded left rollrate and translation down and to the left. Recovering con-trol of the model, once it was away from the core loca-tion, was accomplished easily, and the ability to regainpositive control of the model before exceeding the windtunnel test section area was never seriously in doubt.
Figures 19 through 21 show data for = 1.07.Figure 19 shows a horizontal approach from right toleft. The trajectory shows, by a rise in the flight path, theeffect of the upwash as the model approaches the vortex.As the model crosses through the vortex, it develops aleft-wing-down-roll attitude and descends out to the leftof the generating-wing starboard vortex The left wingtipprobe dramatically shows the crossing of the vortex bythe large upwash just prior to the wingtip entering thevortex core and by the immediate change to large,negative-sensed angles of attack after the wingtip crossedthrough the vortex core. The distance to the vortex coreat which α begins to increase (t = 1.3 sec) is approxi-mately 80 in. from the model center of gravity or 26 in.from the wingtip. At this location, the vortex flow fieldproduces a small, positive rolling momentThe model center of gravity distance to the vortex is29 in. before vortex-induced rolling moment to the left
is produced. As seen for the = 0.95 case,the model controls are saturated against the vortex-induced left rolling moment as the model flies throughthe vortex core. The large roll angle, to which the modelwas disturbed due to the vortex, elicited pilot commentsthat this condition resulted in less certainty of easilyregaining control after the vortex encounter; however,the control was regained without exceeding the wind tun-nel test envelope limitations.
Vortex penetration attempts were also flown byusing descending trajectories (fig. 20) and climbing tra-jectories (fig. 21). During the descending trajectory, thepilot had difficulty in positioning the model directly overthe vortex core due to the effects of the rotational vortexflow field. The trajectory shows that the model passed tothe left of the vortex position rather than through the coreas intended. Roll control and roll rate activity show thedifficulty experienced by the pilot in attempting to posi-tion the model. When the model approached the vortex,full controls were used again to oppose the vortex-induced rolling motions while the model was rolled anddescended out the vortex to the left. The climb throughthe vortex (fig. 21) shows that the model again failed topass directly through the reference vortex core location,although it was very close. Again, full opposing controlswere required, and the model was pushed away towardsthe left of the vortex as it climbed. The wingtip probe did
CLg
CLg
CLg
Clv0>( ).
Clv0<( ) CLg

9
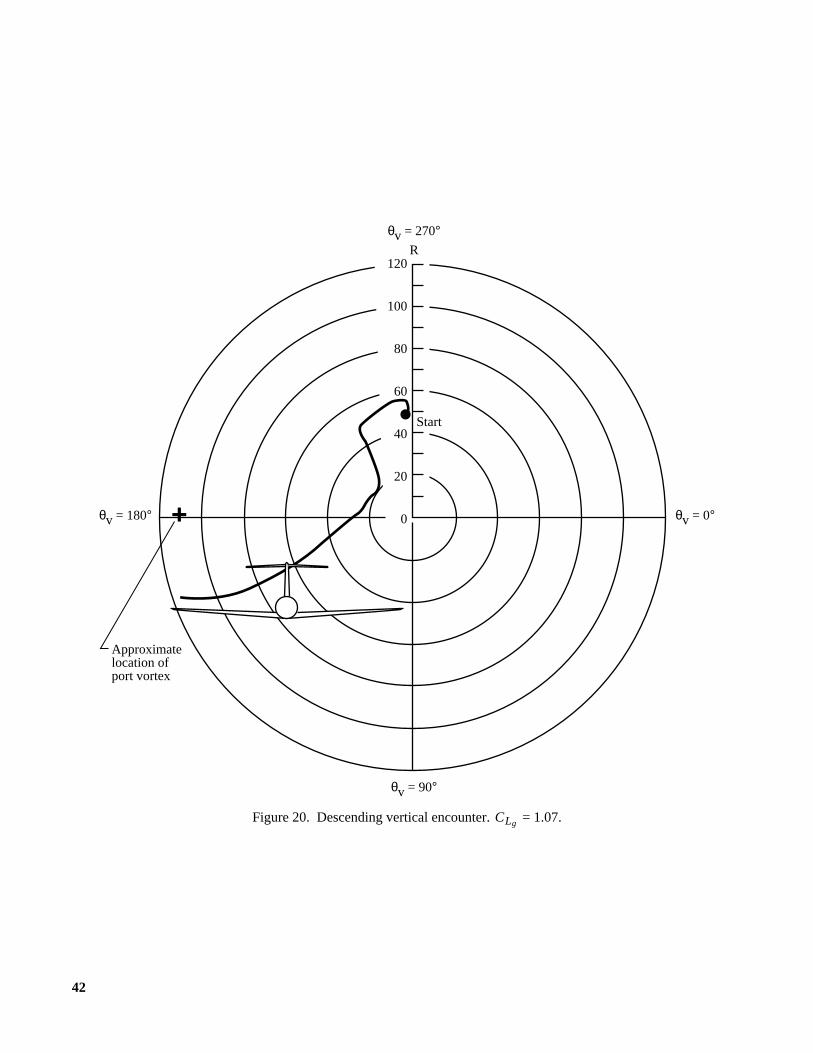
not indicate the presence of the vortex prior to theencounter for the vertical trajectories. Pilot commentsindicated that the vertical trajectories were much lessdramatic than the horizontal trajectories for thisgenerating-wing angle of attack because of the largerbank angles generated from the horizontal entry, andbecause the controls were set to substantial left roll com-mands in order to penetrate the vortex, which then had tobe rapidly reversed when the model had reached nearlyinto the vortex core. For the vertical entries, large left-roll control was not needed, and the resultant roll angleperturbations were less.
Figures 22 through 25 show data for a vortexstrength corresponding to = 1.18. Figure 22 shows ahorizontal approach from right to left. As the modelapproached the vortex, the upwash flow field generated apositive (roll-away) moment as indicated by positive val-ues of and required the lateral control deflections.The maximum value of positive rolling moment occurredwhen the model center of gravity was approximately50 in. from the vortex. The sign of the vortex-inducedmoment changed at approximately 29 in. and reached amaximum value at the minimum distance, that is, modelcenter of gravity in the vortex core. Controls were satu-rated for a substantial time during the penetration tooppose the left roll generated by the vortex. The wingtipprobe showed the effect of the vortex with an increase inupwash that was measured beginning at a distance of118 in. (t = 0.9 sec) and then a further rapid increasebeginning at about 80 in.(t = 1.8 sec). The flow changedto downwash again as the wingtip passed the vortex posi-tion. Sideslip for this encounter showed a rapid increasebeginning at about 62 in. (t = 2.1 sec) from the referencevortex position and changed sign to negative sideslip asthe wingtip crossed the vortex. This sideslip responsediffers from the results shown at = 1.07 where thesideslip initially showed negative values as the vortexwas approached from the right. Slight differences in thevertical positioning of the model, relative to the vortex,may be responsible for this measured difference. Addi-tionally, as previously noted, the vortex tended to movearound the model when the model approached the vortex.This motion is not reflected in the plotted data becausepositions were recorded relative to the reference vortexlocation.
Vortex encounters also were flown from left to right,and pilot comments indicated that the model was moredifficult to position than for right-to-left translations.Unless a reasonable translation rate was established, itwas impossible to overcome the left rolling moment andsuccessfully pass through the vortex. Figure 23 shows anexample of an unsuccessful penetration attempt from theleft. The trajectory shows the model translating from leftto right, and when the model just reaches the vortex, it is
pushed out rather violently to the left and down. Full-right lateral control was required, beginning when themodel was within 29 in. of the reference vortex position.The wingtip probe shows that the wing experienceseffects of the left generating-wing vortex flow field at thebeginning of the run. Also note that the model pitch atti-tude is much higher (9° versus 3°) for the case in whichthe model is initially between the generating-wing vortexpair. The increased pitch attitude is an indication of thedownwash field between the vortices, and pilot com-ments noted difficulty in climbing while in this location.
Vertical trajectories through the vortex were flownwith both descending and climbing approaches (figs. 24and 25). For the descending approach, it was very diffi-cult to position the model to result in a good penetrationof the center of the vortex, as had been seen at the previ-ous lower vortex strengths. Additionally, recovery wascomplicated by the lack of climb performance capabilitywhen the model was positioned between the generating-wing vortex pair. Figure 24 shows a high-to-low vortexpenetration. The trajectory shows that the model was ini-tially pushed slightly to the left; then, right controls wereapplied to attempt an intersection with the vortex coreand fuselage. Typically, in these flights, the model stillslightly missed flying directly through the vortex core.Other than the positioning problems, the encounter wassimilar to what had been experienced at the previous vor-tex strengths. Figure 25 shows a low-to-high vortex pen-etration. The trajectory of the model shows a largeperturbation to the left after the encounter. Roll controlswere saturated for a long period. This penetration geome-try was repeated several times, and some of the penetra-tions resulted in the model being recovered by the safetycable operator after going out of control and exceedingthe wind tunnel test section envelope. Pilot commentsindicated that control of the airplane through the vortexwas much more difficult, and confidence was low on theability to retain control of the model. Another interestingnote is that control seemed more in question at this vor-tex strength for vertical penetrations, whereas at lowervortex strengths, it was felt that the lateral penetrationswere more hazardous.
Figures 26 through 28 show data for vortex encoun-ters with = 1.25. Several attempts were made tocross the vortex from right to left. Figure 26 shows oneof these penetration attempts. As the trajectory plotshows, the model did not pass through the vortex. Theupwash field on the right side of the vortex induced moreright roll than was available through the controls. Thedata showed full left lateral controls while the model wasmoving away from the vortex to the right. The wingtipprobe showed that it apparently crossed the vortex corebriefly during the encounter attempt with the largeincrease in upwash followed by downwash when the
CLg
Clv
CLg
CLg

10
wingtip probe went through the vortex core. Sideslip datashowed a large negative sidewash approaching the coreand positive sidewash once the wingtip probe wasthrough the core. Pilot comments and video recordsshowed that it was very hard to intersect the vortex coredue to model interaction with the changing upwash field.Additionally, large translational rates were required tosuccessfully penetrate through the vortex because ofinsufficient lateral control power to oppose the vortex-generated moments. Even with the faster rates, when themodel was flown just below or just above the vortex, asmarked by the smoke, it could translate across the vortex;however, when flown vertically, even with the vortex, itwas not possible for the model to move horizontally pastthe vortex.
Vertical trajectories were flown through the vortexas shown in figures 27 and 28. Nearly every penetrationresulted in large bank angles and large lateral displace-ments after encountering the vortex. As a result, nearlyall encounters terminated with recovery on the safetycable after the model went out of control and exceededthe wind tunnel test envelope.
Vortex Encounter Data Trends
As previously mentioned, the primary objective ofthe current test was to determine whether the free-flighttest technique could be used to fly a model in the pres-ence of a wake vortex flow field. Because of the prelimi-nary nature of the test, time constraints prevented anexhaustive data set with which to make statistically validconclusions; however, the data may be analyzed to showsome general trends.
The vortical flow field produced varying rollingmoments on the model, depending not only on the vortexstrength, but also on the relative position of the modeland the wake vortex system. An example of the rollingmoment produced by the vortex on the model, as a per-cent of roll control power available, is shown in figure 29for a = 1.18. This figure is a combination of alldynamic data available when the model was at approxi-mately the 0° radial location from the reference vortexposition. The data show a slightly increasing right rollingmoment as the model gets closer to the vortex, with amaximum occurring at about 50 in. (approximately onehalf the span of the following model) from the vortex.For example, as presented in reference 20, these trendsare consistent with general rolling moment predictionsfor this span ratio. At the maximum, the roll requirementis approximately 70 percent of the available roll controlavailable. As the model moves nearer to the vortex refer-ence position, the control requirement rapidly shifts to aleft rolling moment due to the vortex, which exceeds theroll capability of the model as it approaches the vortex.
Note that the percentage of roll control power availablein figure 29 is estimated based on aileron effectivenessmeasured in a static wind tunnel test outside the influ-ence of the wake vortex system.
To identify systematically the effects of flightthrough a wake vortex as the vortex strength wasincreased, data were obtained from all vertical trajectoryvortex encounters. The horizontal encounter data werenot included due to the large amounts of scatter attribut-able to differences in pilot technique between runs. Oneproposed measure of identifying wake vortex hazard isby quantifying maximum allowable bank angle excur-sions. Reference 21 proposes a maximum bank angleupset of 7° as being the maximum for safe acceptableoperations during the final part of the approach. Free-flight results of bank angle perturbations, as a result ofencounters with vortex wakes of various strengths, areshown in figure 30. The data indicate that by using thecriteria of reference 21, a maximum of approxi-mately 0.95 would be allowable. Note that these testswere flown with a control system with relatively high-gain feedback loops that respond more rapidly to upsetsthan a pilot would in a typical business jet aircraft.Therefore, the comparison with reference 21 criteria isfor illustrative purposes only.
Another indicator which will be a key pilot-observedresponse is the roll rate generated by a vortex encounter.Figure 31 shows the roll rates, converted to full-scalevalues, which would be experienced during encounterswith vortices of various strengths. These values comparewith a maximum roll rate achievable by the airplane, infree air, of approximately 33.5°/sec (dampers off). Inaddition to bank angle upsets, significant lateral displace-ments occur as a result of a vortex encounter. The lateraldisplacements are particularly undesirable on a precisionapproach to landing where very accurately flown groundtrack paths are required. Figure 32 shows the maximumlateral translation velocities across the ground thatoccurred during the tests. The data show uncommandedlateral velocities up to 20 percent of the approachvelocity.
Conclusions
A wind tunnel study was conducted to determine thefeasibility of using the free-flight test technique to studywake vortex encounters. A generic business class jet air-plane model was instrumented and flown in the vicinityof a wake vortex generated by a rectangular wing. Thestrength of the vortex was varied by adjusting thegenerating-wing angle of attack and allowed study of arange of generating-airplane pairs (with span ratios of0.75) and separation distances without the uncertaintiesin vortex decay and atmospheric effects. The study
CLg
CLg

11
showed that the free-flight test technique was a viableand useful tool in the study of wake vortex encounters—combining vortex flow fields, airplane dynamics, sen-sors, and flight control aspects.
Data obtained during this test included qualitativeand quantitative results. The test indicated that althougheach of the longitudinal control schemes provided aneasy-to-fly airplane, the g-command system reduced thelongitudinal upsets slightly more than the pitch rate orangle-of-attack command systems. Steady-state limits ofcontrollability during flight were documented as a func-tion of vortex strength. These data showed limits of con-trollability for steady flight to be at a vortex strengthcorresponding to a lift coefficient of approximately 0.7on the generator wing. By flying several vortex encoun-ter trajectories at high vortex strengths, a mapping of rollangle, roll rate, lateral velocity, and vortex-induced rollrate acceleration was conducted. The data quantified theeffects of an airplane entering vortex flow fields of vary-ing strengths, and just as importantly, demonstrated theability to fly safely and to recover from scale-modelwake encounters in a confined test area. Pilot commentsindicated that the selected flight trajectory through thevortex and the vortex strength affected the perceived
difficulty of maintaining control. Specific conclusionsreached are as follows:
1. The free-flight test technique can be used to fly amodel in the vicinity of and to conduct encounters with avortex generated from upstream models.
2. Accurate model and vortex-positioning data dur-ing flight can be derived by using postflight photogram-metry measurement techniques.
3. Mapping of approximate induced rolling momentdue to the vortex flow field can be conducted.
4. Effects of vortex encounters on airplane modelresponses can be measured and repeated in well-controlled conditions with known vortex strengths.Results showed vertical trajectories to be the mostdemanding for encounters with high-strength vortices,and lateral penetrations were the most demanding atlower vortex strengths.
NASA Langley Research CenterHampton, VA 23681-2199June 12, 1997

12
Appendix
Control Laws for Follower Model
Basic Considerations
The flight control laws for the model were developedto provide good flying qualities for flying a model in thewind tunnel. The operational envelope modeled duringthe tests was the landing-final approach configuration atlow speed and sea level altitude. The control laws wereimplemented on a digital minicomputer using an updaterate of 200 iterations/sec. All flight control system gainscould be modified in flight by a computer operator.Selected flight control system switches and gain pathscould be activated by switches on the pilot control boxes.Block diagrams of the flight control laws are shown infigures A1 through A4. Switch default values and gainvalues shown in the figures correspond to the baseline(g-command) system used throughout most of thetesting.
Longitudinal Axis
There were several control law options in each of thelateral and longitudinal axes. The longitudinal axes hadeither proportional or proportional plus integral modesusing either normal acceleration or pitch rate in the inte-grator. The feedback gains for pitch rate, angle of attack,and normal acceleration could be adjusted in flight.
Angle-of-attack command mode.The angle-of-attack command mode was the most simple control lawscheme. This mode bypassed the integrator by setting aswitch to zero. The only parameter in the feedback loopwith the α command system was pitch rate. The pitchpilot had the option of adding normal acceleration feed-
back, removing pitch rate feedback, or addingα feed-back for static stability augmentation by using either oneor both of the wingtip boom vanes. The pitch pilot couldchange these parameters with switches on the pitch con-trol box during a flight.
Pitch rate command mode.The pitch rate com-mand mode was entered by selecting a switch on thepitch pilot control box. This command mode combinedthe pitch rate and pilot command signals through a for-ward path integrator. Additional proportional feedbackof pitch rate was added after the integrator. This modechanged the pilot input commands to represent pitch ratecommands, and with centered stick, it was essentially apitch attitude hold system.
g-command mode.The g-command mode wasselected by switches on the pitch pilot control box. Thismode combined the pilot commands with normal accel-eration through the forward path integrator. Proportionalpitch rate feedback was used outside the integrator. Withcentered control stick, this mode attempted to maintain1g flight and resulted in a more lively model than theprevious modes. Pitch rate damping was increased toprovide better flying qualities.
Lateral-Directional Axes
The lateral-directional control laws included anaileron-to-rudder interconnect (ARI) so that one pilotcould fly the roll-yaw axes of the airplane with one con-trol. Switches on the roll-yaw pilot control box enabledselection of roll rate, yaw rate, side acceleration, or side-slip from one or both wingtip booms to be selected asfeedbacks during flight. Additionally, differential signalsof angle of attack between the two wingtip mountedvanes could be used as a feedback.

13
Figure A1. Model longitudinal control laws.
20
0.654
0
nz, g
q, deg/sec
50
5
hsw 13
hsw 13
0
10
hsw 8
hsw 1
0
1
1
0
1
0
Elevator
command,deg
+-
++-
+ -
++
+++ ++
+
1
0
10
15
2
hsw 4
Pitchtrim
±1
Pitchstick
±1
0
1
-125 ++
Limiter+100
-100
Limiter+100
-100
Limiter+100
-100
Limiter+15
-25
Limiter+500
-500
Limiter
+15
-25
Limiter
+15
-25
hsw 2
1
0
0.175
αcorrection
++
hsw3
0
1
0
hsw 4
1
0
αcorrection
0
0
5s
hsw 1hsw 2hsw 3hsw 4hsw 8hsw 13
111011
Switch defaults
Left vaneα, deg
Right vaneα, deg
Dead band
.02
.02

14
Figure A2. Model lateral control laws.
hsw 9
1
0
0
hsw 14
1
0
0
hsw 10
1
0
0
Left vane α, deg
Right vane α, deg
hsw 11
1
0
0
0.5
hsw 5
1
0
0
-0.5
10 2
-0.4363
20
-2
++
-+
++
++
++++
Aileron command, deg
Limiter+100
-100
Limiter+100
-100
Limiter+100
-100
Left vane β, deg
Right vane β, deg
Roll stick±1
Roll trim±1
Roll rate,deg/sec
Dead band
.02
.02
hsw 5hsw 9hsw 10hsw 11hsw 14
11100
Switch defaults

15
Figure A3. Model directional control laws.
Rudder command,
deg
0.333
-20
-1
hsw 12
hsw 7
1
0
1
0
hsw 6
1
0
0
0.65
0
0
-2
50 ++
++++
++
Limiter+100
-100
Limiter+200
-200
Limiter+200
-200
Limiter+500
-500
Limiter+20
-20
hsw 9
1
0
0
hsw 10
1
0
0
hsw 11
1
0
0
++
Left vane β, deg
Right vane β, deg
ny,g
20
Dead band
Roll stick±1
Yaw trim,±1
Yaw rate,deg/sec
.02
.02
hsw 6hsw 7hsw 9hsw 10hsw 11hsw 12
111100
Switch defaults

16
Figure A4. Aileron combiner. Note: All data reported herein used zero symmetric aileron command.
+-
Right aileron command,
deg
Left aileron command,
deg
++
+-
+-
-1
-1
Limiter
-20
20
-20
20
+20
-20
Limiter+20
-20
Aileron command,deg
Symmetric aileron command,
deg

17
References
1. Hinton, David A.:Aircraft Vortex Spacing System (AVOSS)Conceptual Design. NASA TM-110184, 1995.
2. Rossow, V. J.: Inviscid Modeling of Aircraft Trailing Vortices.Wake Vortex Minimization, NASA SP-409, Feb. 1976,pp. 9–60.
3. Bilanin, A. J.; Teske, M. E.; Donaldson, C.; and Snedeker,R. S.: Viscous Effects in Aircraft Trailing Vortices.Wake Vor-tex Minimization, NASA SP-409, Feb. 1976, pp. 61–128.
4. Lee, T.; and Lan, C. E.: Navier-Stokes Calculation of WingWake Structure. AIAA-94-1882, June 1994.
5. McGowan, W. A.:Calculated Normal Load Factors on LightHeavy Transport Airplanes. NASA TN D-829, 1961.
6. McMillian, O. J.; Schwind, R. G.; Nielsen, J. N.; andDillenius, M. F. E.: Rolling Moments in a Trailing Vortex FlowField. NASA CR-151961, 1977.
7. Stuever, Robert A.; and Greene, George C.: An Analysis ofRelative Wake-Vortex Hazards for Typical Transport Aircraft.AIAA-94-0810, Jan. 1994.
8. Garodz, L. J.; Lawrence, D. M.; and Miller, N. J.:Measure-ment of the Trailing Vortex Systems of Large Transport Air-craft, Using Tower Fly-by and Flow Visualization—Summary,Comparison and Application. FAA-RD-75-127, Jan. 1976.(Available from DTIC as AD A021305/8.)
9. Brashears, M. R.; and Zalay, A. D.: Laser Doppler Velocime-ter Measurements of B-747 Wake Vortex Characteristics.Proceedings of the Aircraft Wake Vortices Conference,J. N. Hallock, ed., FAA, Mar. 1977. (Available from DTIC asAD A055510.)
10. Smith, H. J.:A Flight Test Investigation of the RollingMoments Induced on a T-37B Airplane in the Wake of a B-747Airplane. NASA TM X-56031, 1975.
11. Rossow, V. J.; Sacco, J. N.; Askins, P. A.; Bisbee, L. S.; andSmith, S. M.: Measurements in 80- by 120-Foot Wind Tunnel
of Hazard Posed by Lift-Generated Wakes. AIAA-93-3518,Aug. 1993.
12. Rossow, Vernon J.: Wake-Vortex Structure From Lift andTorque Induced on a Following Wing. AIAA-93-3013, July1993.
13. Greene, G. C.: An Approximate Model of Vortex Decay in theAtmosphere.J. Aircr., vol. 23, July 1986, pp. 566–573.
14. Somers, D. M.:Design and Experimental Results for aFlapped Natural-Laminar-Flow Airfoil for General AviationApplications. NASA TP-1865, 1981.
15. Coe, Paul L., Jr.; Turner, Steven G.; and Owens, D. Bruce:Low-Speed Wind-Tunnel Investigation of the Flight DynamicCharacteristics of an Advanced Turboprop Business/Commuter Aircraft Configuration. NASA TP-2982, 1990.
16. Ciffone, D. L.; and Orloff, K. L.: Application of Laser Veloci-metry to Aircraft Wake-Vortex Measurements.Wake VortexMinimization, NASA SP-409, Feb. 1976, pp. 157–192.
17. Riley, Donald R.; Brandon, Jay M.; and Glaab, Louis J.:Piloted Simulation Study of an ILS Approach of a Twin-Pusher Business/Commuter Turboprop Aircraft Configuration.NASA TM-4516, 1994.
18. Childers, Brooks A.; Snow, Walter L.; Jones, Stephen B.; andFranke, John M.: Support of Wake Vortex Detection Researchin Flight and Wind Tunnel Testing Using Videometric Tech-niques. Paper presented at ISPRS Commission V IntercongressSymposium, Mar. 1994.
19. Military Specification: Flying Qualities of Piloted Airplanes.MIL-F-8785C, Nov. 1980.
20. Rossow, Vernon J.; and Tinling, Bruce E.: Researchon Aircraft/Vortex-Wake Interactions to Determine Accept-able Level of Wake Intensity.J. Aircr., vol. 25, June1988, pp. 481–492.
21. Sammonds, Robert I.; Stinnett, Glen W., Jr.; and Larson,William E.: Criteria Relating Wake Vortex Encounter Hazardto Aircraft Response.J. Aircr., vol. 14, no. 10, Oct. 1977,pp. 981–987.

18
Table I. Geometric and Mass Characteristics of Follower Model
Geometric characteristics:Fuselage:
Length, ft. . . . . . . . . . . . . . . . . . . . . . . . . . . . . . . . . . . . . . . . . . . . . . . . . . . . . . . . . . . . . . . 7.833Maximum diameter, in.. . . . . . . . . . . . . . . . . . . . . . . . . . . . . . . . . . . . . . . . . . . . . . . . . . . . . 11.2
Wing:Area (trapezoidal reference), ft2 . . . . . . . . . . . . . . . . . . . . . . . . . . . . . . . . . . . . . . . . . . . . 9.869Span, ft . . . . . . . . . . . . . . . . . . . . . . . . . . . . . . . . . . . . . . . . . . . . . . . . . . . . . . . . . . . . . . . . 9.072Quarter-chord sweep, deg . . . . . . . . . . . . . . . . . . . . . . . . . . . . . . . . . . . . . . . . . . . . . . . . . . . 1.41Aspect ratio . . . . . . . . . . . . . . . . . . . . . . . . . . . . . . . . . . . . . . . . . . . . . . . . . . . . . . . . . . . . . . . 8.3Taper ratio (trapezoidal reference) . . . . . . . . . . . . . . . . . . . . . . . . . . . . . . . . . . . . . . . . . . . . 0.35Mean aerodynamic chord, in. . . . . . . . . . . . . . . . . . . . . . . . . . . . . . . . . . . . . . . . . . . . . . . 14.172Dihedral, deg. . . . . . . . . . . . . . . . . . . . . . . . . . . . . . . . . . . . . . . . . . . . . . . . . . . . . . . . . . . . . . 4.0
Horizontal tail:Area, ft2. . . . . . . . . . . . . . . . . . . . . . . . . . . . . . . . . . . . . . . . . . . . . . . . . . . . . . . . . . . . . . . .2.067Span, ft . . . . . . . . . . . . . . . . . . . . . . . . . . . . . . . . . . . . . . . . . . . . . . . . . . . . . . . . . . . . . . . . 3.211Aspect ratio . . . . . . . . . . . . . . . . . . . . . . . . . . . . . . . . . . . . . . . . . . . . . . . . . . . . . . . . . . . . . 4.988Quarter-chord sweep, deg . . . . . . . . . . . . . . . . . . . . . . . . . . . . . . . . . . . . . . . . . . . . . . . . . . . 31.6Dihedral, deg. . . . . . . . . . . . . . . . . . . . . . . . . . . . . . . . . . . . . . . . . . . . . . . . . . . . . . . . . . . . . −3.0Taper ratio. . . . . . . . . . . . . . . . . . . . . . . . . . . . . . . . . . . . . . . . . . . . . . . . . . . . . . . . . . . . . . 0.35Mean geometric chord, in. . . . . . . . . . . . . . . . . . . . . . . . . . . . . . . . . . . . . . . . . . . . . . . . . 8.324
Vertical tail:Area, ft2. . . . . . . . . . . . . . . . . . . . . . . . . . . . . . . . . . . . . . . . . . . . . . . . . . . . . . . . . . . . . . . .2.016Height, in. . . . . . . . . . . . . . . . . . . . . . . . . . . . . . . . . . . . . . . . . . . . . . . . . . . . . . . . . . . . . . 18.223Quarter-chord sweep, deg . . . . . . . . . . . . . . . . . . . . . . . . . . . . . . . . . . . . . . . . . . . . . . . . . . 50.0Mean geometric chord, in. . . . . . . . . . . . . . . . . . . . . . . . . . . . . . . . . . . . . . . . . . . . . . . . . 16.259
Mass characteristics:Weight, lb . . . . . . . . . . . . . . . . . . . . . . . . . . . . . . . . . . . . . . . . . . . . . . . . . . . . . . . . . . . . . . . . . . 92.5Moment of inertia:
IX, slug-ft2 . . . . . . . . . . . . . . . . . . . . . . . . . . . . . . . . . . . . . . . . . . . . . . . . . . . . . . . . . . . . . . 4.636IY, slug-ft2 . . . . . . . . . . . . . . . . . . . . . . . . . . . . . . . . . . . . . . . . . . . . . . . . . . . . . . . . . . . . . 14.547IZ, slug-ft2 . . . . . . . . . . . . . . . . . . . . . . . . . . . . . . . . . . . . . . . . . . . . . . . . . . . . . . . . . . . . . 16.666

19
Table II. Generating-Wing Vortex Strength
αg Γms Γfs
−6.0 −0.929 −8.80 −120.22−4.0 .054 5.14 70.27−2.0 .195 18.45 252.080.0 .360 34.08 465.462.0 .516 48.92 668.244.0 .669 63.36 865.456.0 .810 76.72 1048.038.0 .945 89.53 1222.99
10.0 1.071 101.50 1386.4212.0 1.185 112.22 1532.9113.4 1.247 118.13 1613.65
Table III. Dynamic Scaling Relationships
[In current test,N = 0.175]
Parameter Model Full scale
Time. . . . . . . . . . . . . . . . . . . . . . . . . . . . . . . . . . . .
Linear velocity. . . . . . . . . . . . . . . . . . . . . . . . . . . .
Linear acceleration . . . . . . . . . . . . . . . . . . . . . . . . FS MS
Angular velocity . . . . . . . . . . . . . . . . . . . . . . . . . .
Angular acceleration . . . . . . . . . . . . . . . . . . . . . . . FS MS
Weight . . . . . . . . . . . . . . . . . . . . . . . . . . . . . . . . . .
Moment of inertia . . . . . . . . . . . . . . . . . . . . . . . . .
Dynamic pressure . . . . . . . . . . . . . . . . . . . . . . . . .
CLg
FS NMS
N---------
FS NMS
N---------
FS
N-------- MS N
N3
σ------ FS× σ
N3
------ MS×
N5
σ------ FS× σ
N5
------ MS×
Nσ---- FS× σ
N---- MS×

20
aEstimated based on repeated calibrations during test.
Table IV. Test Setup Geometry
Component Downstream distance,x/bg
Generating-wing quarter-chordLaser 1 0.84Laser 2 1.92Laser 3 2.61
Table V. Sensor Accuracies and Resolution
Free-flightmodel sensors Range Accuracy Resolution
Roll rate gyro ±200°/sec ±0.7°/sec 0.1°/secYaw rate gyro ±200°/sec ±0.7°/sec 0.1°/secPitch rate gyro ±200°/sec ±0.7°/sec 0.1°/secAx accelerometer ±20g ±0.002g 0.01gAy accelerometer ±20g ±0.002g 0.01gAz accelerometer ±20g ±0.002g 0.01gBoomα −10° to 80° a±2° 0.06°Boomβ ±30° a±1° 0.03°Aileron position ±30° a±1° 0.02°Elevator position ±30° a±1° 0.03°Rudder position ±30° a±1° 0.03°
Table VI. Model Dynamic Characteristics
ParameterModel scale,
dampers on/offFull scale,
dampers on/offLevel I requirements
(ref. 19)
τr, sec . . . . . . . . . . . . . . . . . . . . . . . 0.24/0.38 0.56/0.89 <1.4t30, sec . . . . . . . . . . . . . . . . . . . . . . 0.98/0.69 2.35/1.65 <1.8pss, deg/sec. . . . . . . . . . . . . . . . . . . 40/80 16.7/33.5

21
Figure 1. Sketch of free-flight test technique.
Safety cableoperator
Tunneloperator
Pitchpilot
Thrustoperator
Flight controlcomputer
Power andcontrol cable
Tracking cameras
Tunnel ground boardRolland yaw
pilot
Safetycable

22
L-93-4368Figure 2. Generating wing in Langley 30- by 60-Foot Tunnel.

23
Figure 3. Free-flight model. Dimensions are in inches.
42.6545.25
53.57
39.968.75
1.82
108.60
21.06
108.86
38.53c = 14.17
0.25c
0.25c
11.42

24
Figure 4. Generating-wing lift coefficient.
1.4
1.2
1.0
.8
.6
.4
.2
0
–.2–10 –5
CL
0 5α, deg
10 15 20

25
L-94-01277Figure 5. Model in vortex during free-flight test.

26
Figure 6. Wake vortex free-flight test setup.
Generatingwing
Free-flightmodel
Laser 1
Laser 2
Laser 3
Vortexcore

27
Figure 7. Flight-determined lift characteristics of free-flight model.
Figure 8. Trim tail settings in flight.
Free flight
Ref. 14
1.8
1.6
1.4
1.2
1.0
.8–2 0
CL
2 4 6α, deg
8 10 12
Free flight
Ref. 14
2
0
–2
–4
–6
–8
–10
–12
–140 2 4 6
α, deg8 10 12
δe, deg

28
Figure 9. Roll control effectiveness (ref. 14).
–.0031
–.0030
–.0029
–.0028
–.0027
–.0026
–.0025
–2 0 2 4 6 8 10 12
.00022
.00024
.00026
.00028
.00030
.00032
.00034
α, deg
–2 0 2 4 6 8 10 12α, deg
Clδa
Clδr

29
Figure 10. Flow-field schematic.
Figure 11. Photogrammetry-determined vortex position dynamics. Data span 0.5 sec; = 5.3 psf.
Upwash
Upwash
Downwash
Vortexrotation
Vortexrotation
Generating wingU∞
–10
10
10 –10
z, in.
x, in.
q

30
Figure 12. Roll control required for steady flight in vortex.
Figure 13. Vortex-induced differential angle of attack at wingtip probes while flying in center of vortex core.
25
50
75
100
0 .2 .4 .6 .8 1.0CLg
Average rollcontrol required,
percent
8
7
6
5
4
3
2
1
0 .2
αs – αp,deg
.4 .6
CLg
.8 1.0

31
Figure 14. Linear prediction of rolling moment based on induced differential angle of attack at wingtips.
0
–.01
–.02
–.04
–.03
–.05
–.06
–.07
–.08
.2 .4 .6 .8 1.0CLg
∆Cl
Maximum static roll-control power

32
Figure 15. Sign convention for model location relative to vortex.
Figure 16. Histogram of downstream distance between model and generating wing. All runs included.
θv
R
Laser 2
R
Plan view Rear view
Vortex generating wing
1600
1400
1200
1000
800
600
400
200
01.2
Count
1.4 1.6 1.8
Downstream distance, x/bg
2.0 2.2 2.4

33
Figure 17. Right-to-left horizontal encounter. = 0.95.
120
100
80
60
40
20
0
θv = 270°R
θv = 90°
θv = 0°θv = 180°
Start
Approximatelocation of port vortex
+
CLg

34
Figure 17. Continued.
360
300
240
180
120
60
0
Distance R, in.or
θv, deg
.10
.08
.06
.04
.02
0
–.02
–.04
–.06
–.08
–.10
Clv
25
20
15
10
5
0
–5
–10
–15
–20
–25
Controlpositions,
deg
0 2 4 6 8 10Time
δaδe
Rθv

35
Figure 17. Concluded.
80
60
40
20
0
–20
–40
–60
–80
Angular rates,deg/sec
30
20
10
0
–10
–20
–30
–40
–50
Attitude,deg
15
10
5
0
–5
–10
–15
Flow anglesat left wingtip
probe, deg
0 2 4 6 8 10Time
αβ
pqr
φθψ

36
Figure 18. Left-to-right horizontal encounter. = 0.95.
+Start
Approximatelocation of port vortex
120
100
80
60
40
20
0
θv = 270°R
θv = 90°
θv = 0°θv = 180°
CLg

37
Figure 18. Continued.
360
300
240
180
120
60
0
Distance R, in.or
θv, deg
.10
.08
.06
.04
.02
0
–.02
–.04
–.06
–.08
–.10
Clv
25
20
15
10
5
0
–5
–10
–15
–20
–25
Controlpositions,
deg
0 1 2 3 4 5Time
δaδe
Rθv

38
Figure 18. Concluded.
80
60
40
20
0
–20
–40
–60
–80
Angular rates,deg/sec
30
20
10
0
–10
–20
–30
–40
–50
Attitude,deg
15
10
5
0
–5
–10
–15
Flow anglesat left wingtip
probe, deg
0 1 2 3 4 5Time
αβ
pqr
φθψ

39
Figure 19. Right-to-left horizontal encounter. = 1.07.
+
Start
Approximatelocation of port vortex
θv = 270°R
θv = 90°
θv = 0°θv = 180°
120
100
80
60
40
20
0
CLg

40
Figure 19. Continued.
360
300
240
180
120
60
0
Distance R, in.or
θv, deg
.10
.08
.06
.04
.02
0
–.02
–.04
–.06
–.08
–.10
Clv
25
20
15
10
5
0
–5
–10
–15
–20
–25
Controlpositions,
deg
0 1 2 3 4 5Time
δaδe
Rθv

41
Figure 19. Concluded.
80
60
40
20
0
–20
–40
–60
–80
Angular rates,deg/sec
30
20
10
0
–10
–20
–30
–40
–50
Attitude,deg
15
10
5
0
–5
–10
–15
Flow anglesat left wingtip
probe, deg
αβ
pqr
φθψ
0 1 2 3 4 5Time
42
Figure 20. Descending vertical encounter. = 1.07.
+
Start
Approximatelocation of port vortex
120
100
80
60
40
20
0
θv = 270°R
θv = 90°
θv = 0°θv = 180°
CLg

43
Figure 20. Continued.
360
300
240
180
120
60
0
Distance R, in.or
θv, deg
.10
.08
.06
.04
.02
0
–.02
–.04
–.06
–.08
–.10
Clv
25
20
15
10
5
0
–5
–10
–15
–20
–25
Controlpositions,
deg
0 1 2 3 4 5Time
δaδe
Rθv

44
Figure 20. Concluded.
80
60
40
20
0
–20
–40
–60
–80
Angular rates,deg/sec
30
20
10
0
–10
–20
–30
–40
–50
Attitude,deg
15
10
5
0
–5
–10
–15
Flow anglesat left wingtip
probe, deg
0 1 2 3 4 5Time
αβ
pqr
φθψ

45
Figure 21. Ascending vertical encounter. = 1.07.
+
Start
Approximatelocation of port vortex
120
100
80
60
40
20
0
θv = 270°R
θv = 90°
θv = 0°θv = 180°
CLg

46
Figure 21. Continued.
360
300
240
180
120
60
0
Distance R, in.or
θv, deg
.10
.08
.06
.04
.02
0
–.02
–.04
–.06
–.08
–.10
Clv
25
20
15
10
5
0
–5
–10
–15
–20
–25
Controlpositions,
deg
δaδe
Rθv
0 1 2 3 4 5Time

47
Figure 21. Concluded.
80
60
40
20
0
–20
–40
–60
–80
Angular rates,deg/sec
30
20
10
0
–10
–20
–30
–40
–50
Attitude,deg
15
10
5
0
–5
–10
–15
Flow anglesat left wingtip
probe, deg
0 1 2 3 4 5Time
αβ
pqr
φθψ

48
Figure 22. Right-to-left horizontal encounter. = 1.18.
+
Start
Approximatelocation of port vortex
120
100
80
60
40
20
0
θv = 270°R
θv = 90°
θv = 0°θv = 180°
CLg

49
Figure 22. Continued.
360
300
240
180
120
60
0
Distance R, in.or
θv, deg
.10
.08
.06
.04
.02
0
–.02
–.04
–.06
–.08
–.10
Clv
25
20
15
10
5
0
–5
–10
–15
–20
–25
Controlpositions,
deg
0 1 2 3 4 5Time
δaδe
Rθv

50
Figure 22. Concluded.
80
60
40
20
0
–20
–40
–60
–80
Angular rates,deg/sec
30
20
10
0
–10
–20
–30
–40
–50
Attitude,deg
15
10
5
0
–5
–10
–15
Flow anglesat left wingtip
probe, deg
0 1 2 3 4 5Time
αβ
pqr
φθψ

51
Figure 23. Left-to-right horizontal encounter. = 1.18.
+Start
Approximatelocation of port vortex
120
100
80
60
40
20
0
θv = 270°R
θv = 90°
θv = 0°θv = 180°
CLg

52
Figure 23. Continued.
360
300
240
180
120
60
0
Distance R, in.or
θv, deg
.10
.08
.06
.04
.02
0
–.02
–.04
–.06
–.08
–.10
Clv
25
20
15
10
5
0
–5
–10
–15
–20
–25
Controlpositions,
deg
0 1 2 3Time
δaδe
Rθv

53
Figure 23. Concluded.
80
60
40
20
0
–20
–40
–60
–80
Angular rates,deg/sec
30
20
10
0
–10
–20
–30
–40
–50
Attitude,deg
15
10
5
0
–5
–10
–15
Flow anglesat left wingtip
probe, deg
0 1 2 3Time
αβ
pqr
φθψ

54
Figure 24. Descending vertical encounter. = 1.18.
+
Start
Approximatelocation of port vortex
120
100
80
60
40
20
0
θv = 270°R
θv = 90°
θv = 0°θv = 180°
CLg

55
Figure 24. Continued.
360
300
240
180
120
60
0
Distance R, in.or
θv, deg
.10
.08
.06
.04
.02
0
–.02
–.04
–.06
–.08
–.10
Clv
25
20
15
10
5
0
–5
–10
–15
–20
–25
Controlpositions,
deg
0 1 2 3 4 5Time
δaδe
Rθv

56
Figure 24. Concluded.
80
60
40
20
0
–20
–40
–60
–80
Angular rates,deg/sec
30
20
10
0
–10
–20
–30
–40
–50
Attitude,deg
15
10
5
0
–5
–10
–15
Flow anglesat left wingtip
probe, deg
0 1 2 3 4 5Time
αβ
pqr
φθψ

57
Figure 25. Ascending vertical encounter. = 1.18.
+
Start
Approximatelocation of port vortex
120
100
80
60
40
20
0
θv = 270°R
θv = 90°
θv = 0°θv = 180°
CLg

58
Figure 25. Continued.
360
300
240
180
120
60
0
Distance R, in.or
θv, deg
.10
.08
.06
.04
.02
0
–.02
–.04
–.06
–.08
–.10
Clv
25
20
15
10
5
0
–5
–10
–15
–20
–25
Controlpositions,
deg
0 1 2 3 4 5Time
δaδe
Rθv

59
Figure 25. Concluded.
80
60
40
20
0
–20
–40
–60
–80
Angular rates,deg/sec
30
20
10
0
–10
–20
–30
–40
–50
Attitude,deg
15
10
5
0
–5
–10
–15
Flow anglesat left wingtip
probe, deg
0 1 2 3 4 5Time
αβ
pqr
φθψ

60
Figure 26. Right-to-left horizontal encounter. = 1.25.
+
Start
Approximatelocation of port vortex
120
100
80
60
40
20
0
θv = 270°R
θv = 90°
θv = 0°θv = 180°
CLg

61
Figure 26. Continued.
360
300
240
180
120
60
0
Distance R, in.or
θv, deg
.10
.08
.06
.04
.02
0
–.02
–.04
–.06
–.08
–.10
Clv
25
20
15
10
5
0
–5
–10
–15
–20
–25
Controlpositions,
deg
0 1 2 3 4 5Time
δaδe
Rθv
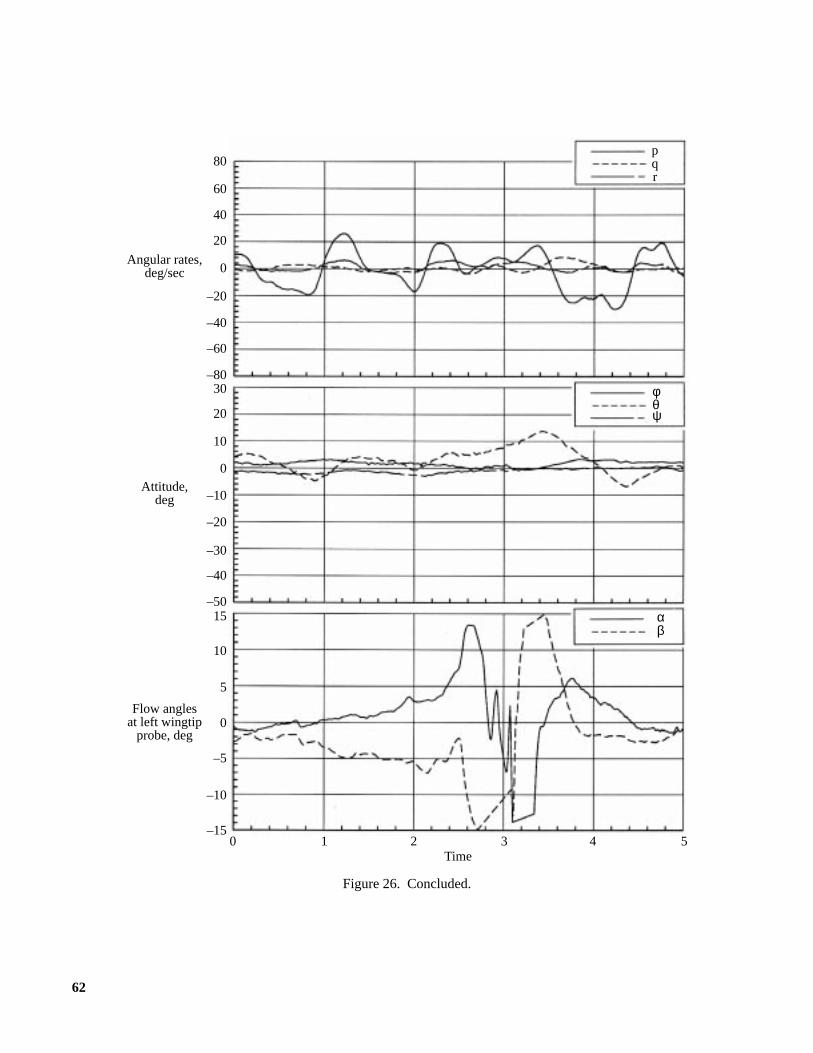
62
Figure 26. Concluded.
80
60
40
20
0
–20
–40
–60
–80
Angular rates,deg/sec
30
20
10
0
–10
–20
–30
–40
–50
Attitude,deg
15
10
5
0
–5
–10
–15
Flow anglesat left wingtip
probe, deg
0 1 2 3 4 5Time
αβ
pqr
φθψ

63
Figure 27. Descending vertical encounter. = 1.25.
+
Start
Approximatelocation of port vortex
120
100
80
60
40
20
0
θv = 270°R
θv = 90°
θv = 0°θv = 180°
CLg

64
Figure 27. Continued.
360
300
240
180
120
60
0
Distance R, in.or
θv, deg
.10
.08
.06
.04
.02
0
–.02
–.04
–.06
–.08
–.10
Clv
25
20
15
10
5
0
–5
–10
–15
–20
–25
Controlpositions,
deg
0 1 2 3 4 5Time
δaδe
Rθv

65
Figure 27. Concluded.
80
60
40
20
0
–20
–40
–60
–80
Angular rates,deg/sec
30
20
10
0
–10
–20
–30
–40
–50
Attitude,deg
15
10
5
0
–5
–10
–15
Flow anglesat left wingtip
probe, deg
0 1 2 3 4 5Time
αβ
pqr
φθψ

66
Figure 28. Ascending vertical encounter. = 1.25.
+
Start
Approximatelocation of port vortex
120
100
80
60
40
20
0
θv = 270°R
θv = 90°
θv = 0°θv = 180°
CLg

67
Figure 28. Continued.
360
300
240
180
120
60
0
Distance R, in.or
θv, deg
.10
.08
.06
.04
.02
0
–.02
–.04
–.06
–.08
–.10
Clv
25
20
15
10
5
0
–5
–10
–15
–20
–25
Controlpositions,
deg
0 1 2 3 4 5Time
δaδe
Rθv

68
Figure 28. Concluded.
80
60
40
20
0
–20
–40
–60
–80
Angular rates,deg/sec
30
20
10
0
–10
–20
–30
–40
–50
Attitude,deg
15
10
5
0
–5
–10
–15
Flow anglesat left wingtip
probe, deg
0 1 2 3 4 5Time
αβ
pqr
φθψ

69
Figure 29. Rolling moment produced on model due to vortex interactions. = 1.18 along 0° radial±30°.
Figure 30. Maximum roll angle produced by vortex encounter.
100
50
0
–50
–100
–1500 20 40 60 80
Distance, in.
100 120 140
Clv,percent
Maximum right
Maximum left
CLg
–50
–40
–30
–20
–10
0
0 .2 .4 .6 .8 1.0 1.2 1.4CLg
Maximumroll angle,
deg

70
Figure 31. Maximum roll rate produced by vortex encounter.
Figure 32. Maximum lateral translation velocity produced by vortex encounter.
–30
–25
–20
–15
–10
–5
0
0 .2 .4 .6 .8
Maximumfull-scaleroll rate,deg/sec
1.0 1.2 1.4CLg
5
10
15
20
0 .2 .4 .6 .8 1.0 1.2 1.4CLg
Lateraltranslation,
percentforwardspeed


Form ApprovedOMB No. 0704-0188
Public reporting burden for this collection of information is estimated to average 1 hour per response, including the time for reviewing instructions, searching existing data sources,gathering and maintaining the data needed, and completing and reviewing the collection of information. Send comments regarding this burden estimate or any other aspect of thiscollection of information, including suggestions for reducing this burden, to Washington Headquarters Services, Directorate for Information Operations and Reports, 1215 JeffersonDavis Highway, Suite 1204, Arlington, VA 22202-4302, and to the Office of Management and Budget, Paperwork Reduction Project (0704-0188), Washington, DC 20503.
1. AGENCY USE ONLY (Leave blank) 2. REPORT DATE 3. REPORT TYPE AND DATES COVERED
4. TITLE AND SUBTITLE 5. FUNDING NUMBERS
6. AUTHOR(S)
7. PERFORMING ORGANIZATION NAME(S) AND ADDRESS(ES)
9. SPONSORING/MONITORING AGENCY NAME(S) AND ADDRESS(ES)
11. SUPPLEMENTARY NOTES
8. PERFORMING ORGANIZATIONREPORT NUMBER
10. SPONSORING/MONITORINGAGENCY REPORT NUMBER
12a. DISTRIBUTION/AVAILABILITY STATEMENT 12b. DISTRIBUTION CODE
13. ABSTRACT (Maximum 200 words)
14. SUBJECT TERMS
17. SECURITY CLASSIFICATIONOF REPORT
18. SECURITY CLASSIFICATIONOF THIS PAGE
19. SECURITY CLASSIFICATIONOF ABSTRACT
20. LIMITATIONOF ABSTRACT
15. NUMBER OF PAGES
16. PRICE CODE
NSN 7540-01-280-5500 Standard Form 298 (Rev. 2-89)Prescribed by ANSI Std. Z39-18298-102
REPORT DOCUMENTATION PAGE
November 1997 Technical Paper
Application of Wind Tunnel Free-Flight Technique for Wake VortexEncounters WU 505-64-13-15
Jay M. Brandon, Frank L. Jordan, Jr., Catherine W. Buttrill, and Robert A.Stuever
L-17462
NASA TP-3672
Buttrill: Unisys Corp., Hampton, VA.
A wind tunnel investigation was conducted in the Langley 30- by 60-Foot Tunnel to assess the free-flight test tech-nique as a tool in research on wake vortex encounters. A typical 17.5-percent scale business-class jet airplanemodel was flown behind a stationary wing mounted in the forward portion of the wind tunnel test section. The spanratio (model span-generating wingspan) was 0.75. The wing angle of attack could be adjusted to produce a vortexof desired strength. The test airplane model was successfully flown in the vortex and through the vortex for a rangeof vortex strengths. Data obtained included the model airplane body axis accelerations, angular rates, attitudes, andcontrol positions as a function of vortex strength and relative position. Pilot comments and video records were alsorecorded during the vortex encounters.
Free flight; Wake vortex; Wind tunnel 74
A04
NASA Langley Research CenterHampton, VA 23681-2199
National Aeronautics and Space AdministrationWashington, DC 20546-0001
Unclassified–UnlimitedSubject Category 08Availability: NASA CASI (301) 621-0390
Unclassified Unclassified Unclassified