Application of the EEMD Method to Rotor Fault Diagnosis of Rotating Machinery
13
See discussions, stats, and author profiles for this publication at: http://www.researchgate.net/publication/223907370 Application of the EEMD method to rotor fault diagnosis of rotating machinery. Mech Syst Signal Process ARTICLE in MECHANICAL SYSTEMS AND SIGNAL PROCESSING · MAY 2009 Impact Factor: 2.26 · DOI: 10.1016/j.ymssp.2008.11.005 CITATIONS 101 READS 208 3 AUTHORS, INCLUDING: Yaguo Lei Xi'an Jiaotong University 44 PUBLICATIONS 1,028 CITATIONS SEE PROFILE Zhengjia He Xi'an Jiaotong University 169 PUBLICATIONS 2,330 CITATIONS SEE PROFILE All in-text references underlined in blue are linked to publications on ResearchGate, letting you access and read them immediately. Available from: Yaguo Lei Retrieved on: 15 November 2015
-
Upload
striko-ivko -
Category
Documents
-
view
237 -
download
6
description
EEMD rotory
Transcript of Application of the EEMD Method to Rotor Fault Diagnosis of Rotating Machinery

Seediscussions,stats,andauthorprofilesforthispublicationat:http://www.researchgate.net/publication/223907370
ApplicationoftheEEMDmethodtorotorfaultdiagnosisofrotatingmachinery.MechSystSignalProcess
ARTICLEinMECHANICALSYSTEMSANDSIGNALPROCESSING·MAY2009
ImpactFactor:2.26·DOI:10.1016/j.ymssp.2008.11.005
CITATIONS
101
READS
208
3AUTHORS,INCLUDING:
YaguoLei
Xi'anJiaotongUniversity
44PUBLICATIONS1,028CITATIONS
SEEPROFILE
ZhengjiaHe
Xi'anJiaotongUniversity
169PUBLICATIONS2,330CITATIONS
SEEPROFILE
Allin-textreferencesunderlinedinbluearelinkedtopublicationsonResearchGate,
lettingyouaccessandreadthemimmediately.
Availablefrom:YaguoLei
Retrievedon:15November2015

ARTICLE IN PRESS
Contents lists available at ScienceDirect
Mechanical Systems and Signal Processing
Mechanical Systems and Signal Processing 23 (2009) 1327–1338
0888-32
doi:10.1
� Cor
E-m
journal homepage: www.elsevier.com/locate/jnlabr/ymssp
Application of the EEMD method to rotor fault diagnosisof rotating machinery
Yaguo Lei �, Zhengjia He, Yanyang Zi
State Key Laboratory for Manufacturing Systems Engineering, Xi’an Jiaotong University, Xianning West Road # 28, Xi’an 710049, PR China
a r t i c l e i n f o
Article history:
Received 22 September 2008
Received in revised form
30 October 2008
Accepted 2 November 2008Available online 24 November 2008
Keywords:
Ensemble empirical mode decomposition
Empirical mode decomposition
Intrinsic mode function
Rotating machinery
Fault diagnosis
70/$ - see front matter & 2008 Elsevier Ltd. A
016/j.ymssp.2008.11.005
responding author.
ail address: [email protected] (Y. Lei).
a b s t r a c t
Empirical mode decomposition (EMD) is a self-adaptive analysis method for nonlinear
and non-stationary signals. It may decompose a complicated signal into a collection of
intrinsic mode functions (IMFs) based on the local characteristic time scale of the signal.
The EMD method has attracted considerable attention and been widely applied to fault
diagnosis of rotating machinery recently. However, it cannot reveal the signal
characteristic information accurately because of the problem of mode mixing. To
alleviate the mode mixing problem occurring in EMD, ensemble empirical mode
decomposition (EEMD) is presented. With EEMD, the components with truly physical
meaning can be extracted from the signal. Utilizing the advantage of EEMD, this paper
proposes a new EEMD-based method for fault diagnosis of rotating machinery. First, a
simulation signal is used to test the performance of the method based on EEMD. Then,
the proposed method is applied to rub-impact fault diagnosis of a power generator and
early rub-impact fault diagnosis of a heavy oil catalytic cracking machine set. Finally, by
comparing its application results with those of the EMD method, the superiority of the
proposed method based on EEMD is demonstrated in extracting fault characteristic
information of rotating machinery.
& 2008 Elsevier Ltd. All rights reserved.
1. Introduction
Rotating machinery covers a broad range of mechanical equipment and plays an important role in industrialapplications. With rapid development of science and technology, rotating machinery in modern industry is growing larger,more precise and more automatic. Its potential faults become more difficult to find. Therefore, the need to increasereliability against possible failures has attracted considerable interests in fault diagnosis of rotating machinery in recentyears. Because vibration signals carry a great deal of information representing mechanical equipment condition, thevibration-based signal processing technique is one of the principal tools for diagnosing faults of rotating machinery [1,2].With the signal processing techniques, fault characteristic information can be extracted from the vibration signals.However, it is a challenge to develop and adopt effective signal processing techniques that can extract key fault informationfrom the vibration signals [3].
Conventional signal processing techniques include time-domain statistical analysis and Fourier transform, which haveproved to be effective in fault diagnosis of rotating machinery. However, these techniques are based on the assumption thatthe process generating signals is stationary and linear. They usually result in false information when they are applied to themechanical fault signals, because the mechanical faults by nature are non-stationary and transient events [4]. To deal with
ll rights reserved.

ARTICLE IN PRESS
Y. Lei et al. / Mechanical Systems and Signal Processing 23 (2009) 1327–13381328
non-stationary signals, time–frequency analysis, such as wavelet transform, has been applied to fault diagnosis of rotatingmachinery and attracted more and more attention during the past decade. However, the wavelet transform being non-adaptive has the shortcoming that its analysis results depend on the choice of the wavelet base function. This may lead to asubjective and a priori assumption on the characteristics of the investigated vibration signal. As a result, only the signalcharacteristics that correlate well with the shape of the wavelet base function have a chance to produce high-valuecoefficients. Any other characteristics will be masked or completely ignored.
Empirical mode decomposition (EMD), as a new time–frequency analysis technique, has been developed and widelyapplied in fault diagnosis of rotating machinery recently, for example, gear fault diagnosis [4,6,7], rolling bearing faultdiagnosis [8–10] and rotor fault diagnosis [11–13]. EMD is based on the local characteristic time scales of a signal and coulddecompose the complicated signal into a set of complete and almost orthogonal components named intrinsic modefunction (IMF) [5]. The IMFs represent the natural oscillatory mode embedded in the signal and work as the basis functions,which are determined by the signal itself, rather than pre-determined kernels. Thus, it is a self-adaptive signal processingmethod that can be applied to nonlinear and non-stationary process perfectly. However, one of the major drawbacks ofEMD is the mode mixing problem, which is defined as either a single IMF consisting of components of widely disparatescales, or a component of a similar scale residing in different IMFs.
To alleviate the problem of mode mixing in EMD, ensemble empirical mode decomposition (EEMD), an improvedmethod of EMD, is presented by Wu and Huang [14] recently. EEMD is a noise-assisted data analysis method and by addingfinite white noise to the investigated signal, the EEMD method can eliminate the mode mixing problem in all casesautomatically. Therefore, the EEMD represents a major improvement of EMD.
In this paper, a fault diagnosis method based on EEMD is proposed to increase the precision of EMD in fault diagnosis ofrotating machinery. The proposed method is applied to rub-impact fault diagnosis of a power generator and a heavy oilcatalytic cracking machine set. And the characteristics of rub-impact faults are successfully detected with it. Comparing theapplication results of the proposed method with those of EMD, it is shown that the proposed method based on EEMDobtains a more precise diagnosis result.
2. Empirical mode decomposition
2.1. EMD algorithm
The EMD method is able to decompose a signal into some IMFs. An IMF is the function that satisfies the two followingconditions: (1) in the whole data set, the number of extrema and the number of zero-crossings must either equal or differat most by one, and (2) at any point, the mean value of the envelope defined by local maxima and the envelope defined bythe local minima is zero [5]. An IMF represents simple oscillatory mode embedded in the signal. With the simpleassumption that any signal consists of different simple IMFs, the EMD method was developed to decompose a signal intoIMF components. The EMD process of a signal x(t) can be described as follows:
(1)
Initialize: r0 ¼ x(t), and i ¼ 1. (2) Extract the ith IMF.(a) Initialize: hi(k�1) ¼ ri, k ¼ 1.(b) Extract the local maxima and minima of hi(k�1).(c) Interpolate the local maxima and the minima by cubic spline lines to form upper and lower envelops of hi(k�1).(d) Calculate the mean mi(k�1) of the upper and lower envelops of hi(k�1).(e) Let hik ¼ hi(k�1)�mi(k�1).(f) If hik is a IMF then set IMFi ¼ hik, else go to step (b) with k ¼ k+1.
(3)
Define ri+1 ¼ ri�IMFi. (4) If ri+1 still has least 2 extrema then go to step (2) else decomposition process is finished and ri+1 is the residue of thesignal.
At the end of the procedure we have a residue rI and a collection of I IMFs ci (i ¼ 1,2,y, I). Summing up all IMFs and thefinal residue rI, we obtain
xðtÞ ¼XI
i¼1
ci þ rI (1)
Thus, we can achieve a decomposition of the signal into I IMFs and a residue rI, which is the mean trend of x(t). The IMFsc1,c2,y, cI include different frequency bands ranging from high to low. The frequency components contained in eachfrequency band are different and they change with the variation of signal x(t), while rI represents the central tendency ofsignal x(t). A more detailed explanation of EMD can be found in Ref. [5].

ARTICLE IN PRESS
Y. Lei et al. / Mechanical Systems and Signal Processing 23 (2009) 1327–1338 1329
2.2. Mode mixing
One shortcoming of the EMD method is the appearance of mode mixing. Mode mixing is defined as a single IMFincluding oscillations of dramatically disparate scales, or a component of a similar scale residing in different IMFs. It is aresult of signal intermittency. As discussed by Huang et al. [5], the intermittence could not only cause serious aliasing in thetime–frequency distribution, but also make physical meaning of individual IMF unclear. When the mode mixing problemoccurs, an IMF can cease to have physical meaning by itself, suggesting falsely that there may be different physicalprocesses represented in a mode.
To illustrate the mode mixing problem in EMD, a simulation signal x(t) is considered in this section. The simulationsignal, shown in Fig. 1(a), is a sine wave of 36 Hz attached by small impulses. Thus, it is a combined signal and involves twocomponents. Performing EMD on the signal, the decomposed two IMFs are shown in Fig. 1(b) and (c).
It is obvious that the two IMFs obtained by EMD are distorted seriously. Mode mixing is occurring between IMFs c1 andc2. The sine wave and the impulses are decomposed into the same IMF (c1). Moreover, the sine wave is decomposed into thetwo IMFs. Thus, both IMFs c1 and c2 of EMD fail to represent the characteristics of signal x(t) accurately. This is a typicalproblem of mode mixing.
3. Ensemble empirical mode decomposition
To overcome the problem of mode mixing in EMD, a new noise-assisted data analysis method is proposed. It is EEMD,which defines the true IMF components as the mean of an ensemble of trials. Each trial consists of the decompositionresults of the signal plus a white noise of finite amplitude [14]. This new method is based on the insight from recent studiesof the statistical properties of white noise [15,16], which showed that the EMD method is an effective self-adaptive dyadicfilter bank when applied to the white noise. Additionally, the result studied by Flandrin et al. [17] demonstrated that noisecould help data analysis in the EMD method. All these investigation promotes the advent of the EEMD method.
3.1. EEMD algorithm
The principle of the EEMD algorithm is the following: the added white noise would populate the whole time–frequencyspace uniformly with the constituting components of different scales. When a signal is added to this uniformly distributedwhite noise background, the components in different scales of the signal are automatically projected onto proper scales ofreference established by the white noise in the background. Because each of the noise-added decompositions consists ofthe signal and the added white noise, each individual trial may certainly produce very noisy results. But the noise in eachtrial is different in separate trials. Thus it can be decreased or even completely canceled out in the ensemble mean ofenough trails. The ensemble mean is treated as the true answer because finally, the only persistent part is the signal asmore and more trials are added in the ensemble. The EEMD principle advanced here is based on the following observations[14]:
(1)
A collection of white noise cancels each other out in an ensemble mean; therefore, only the signal can survive andpersist in the final noise-added signal ensemble mean.0 0.02 0.04 0.06 0.08 0.1 0.12-1
0
1
0 0.02 0.04 0.06 0.08 0.1 0.12-1
0
1
0 0.02 0.04 0.06 0.08 0.1 0.12
-1
0
1
Fig. 1. The decomposition result with EMD: (a) the simulation signal, (b) IMF c1, and (c) IMF c2.

ARTICLE IN PRESS
Y. Lei et al. / Mechanical Systems and Signal Processing 23 (2009) 1327–13381330
(2)
White noise is necessary to force the ensemble to find all possible solutions; the white noise makes the different scalesignals reside in the corresponding IMFs, and render the resulting ensemble mean more meaningful.(3)
The decomposition with truly physical meaning of EMD is not the one without noise; it is designated to be theensemble mean of a large number of trials consisting of the noise-added signal.Based on the principle and observations above, the EEMD algorithm can be given as follows.
(1)
Initialize the number of ensemble M, the amplitude of the added white noise, and m ¼ 1. (2) Perform the mth trial on the signal added white noise.(a) Add a white noise series with the given amplitude to the investigated signal
xmðtÞ ¼ xðtÞ þ nmðtÞ (2)
where nm(t) indicates the mth added white noise series, and xm(t) represents the noise-added signal of the mthtrial.
(b) Decompose the noise-added signal xm(t)into I IMFs ci,m(i ¼ 1,2,y, I) using the EMD method described in Section 2.1,where ci,m denotes the ith IMF of the mth trial, and I is the number of IMFs.
(c) If moM then go to step (a) with m ¼ m+1. Repeat steps (a) and (b) again and again, but with different white noiseseries each time.
(3)
Calculate the ensemble mean ci of the M trials for each IMFci ¼ 1MXM
m¼1
ci;m; i ¼ 1;2; . . . ; I; m ¼ 1;2; . . . ; M (3)
(4)
Report the mean ci (i ¼ 1,2,y, I) of each of the I IMFs as the final IMFs.To demonstrate the EEMD performance of overcoming the mode mixing problem, the simulation signal in Fig. 1(a) isdecomposed again using EEMD with the ensemble number 100 and the added noise amplitude 0.01 time standarddeviation of the signal. The decomposition result is shown in Fig. 2. From Fig. 2(b) and (c), it is seen that the twocomponents contained in the signal are decomposed into two IMFs perfectly. IMF c1 denotes the impulse components andIMF c2 indicates the sine wave. Thus, the EEMD method is able to solve the problem of mode mixing and achieve animproved decomposition with physical meaning.
3.2. Parameter setting in EEMD
The previous section has introduced the EEMD algorithm and its capability of extracting components with physicalmeaning from the signal. However, the number of ensemble and the amplitude of the added white noise are twoparameters needed to be set when the EEMD method is used. The following two sections will discuss the choice of thesetwo parameters.
0 0.02 0.04 0.06 0.08 0.1 0.12-1
0
1
0 0.02 0.04 0.06 0.08 0.1 0.12
-0.5
0
0.5
0 0.02 0.04 0.06 0.08 0.1 0.12
-0.5
0
0.5
Fig. 2. The decomposition result with EEMD: (a) the simulation signal, (b) IMF c1, and (c) IMF c2.

ARTICLE IN PRESS
Y. Lei et al. / Mechanical Systems and Signal Processing 23 (2009) 1327–1338 1331
3.2.1. The number of ensemble
The relationship among the ensemble number, the amplitude of the added white noise and the effect of the added noiseis given in the following equation [14].
e ¼affiffiffiffiNp (4)
or
ln eþa
2ln N ¼ 0 (5)
where N is the number of ensemble, a is the amplitude of the added white noise, and e is the standard deviation of error,which is defined as the difference between the input signal and the corresponding IMFs.
When the EEMD procedure is performed, the added white noise with small amplitude may lead to a small error. But, ifthe added noise amplitude is too small, then it may not cause the change of extrema that the EEMD method relies on. Thisis true when the investigated signal has a large gradient. Therefore, in order to make EEMD effective, the amplitude of theadded noise should not be too small. However, by increasing the number of ensemble, the error caused by the added whitenoise could always be reduced to a quite small even negligible level. Generally, an ensemble number of a few hundred willlead to an exact result, and the remaining noise would cause less than a fraction of one percent of error if the added noisehas the amplitude that is a fraction of the standard deviation of the investigated signal [14].
3.2.2. The amplitude of the added white noise
The investigation in reference [14] indicated that EMD is a noise-friendly method. And increasing noise amplitudes andensemble numbers changes the decomposition results little as long as the added noise has moderate amplitude and theensemble has a large enough number.
It is noticed that when the amplitude of noise increases, the number of ensemble should increase to reduce thecontribution of the added noise in the decomposed results. It is suggested that the amplitude of the added white noise isabout 0.2 time standard deviation of the investigated signal [14]. But it is not always the proper amplitude of the addednoise for any cases. Generally, when the signal is dominated by high-frequency components, the noise amplitude needs tobe smaller. And when the signal is dominated by low-frequency components, the noise amplitude should be increased.However, there is no a specific equation reported in the literature to guide the choice of the noise amplitude until now.Thus, for an investigated signal, different noise levels should be tried to select the appropriate one.
4. Simulation experiment
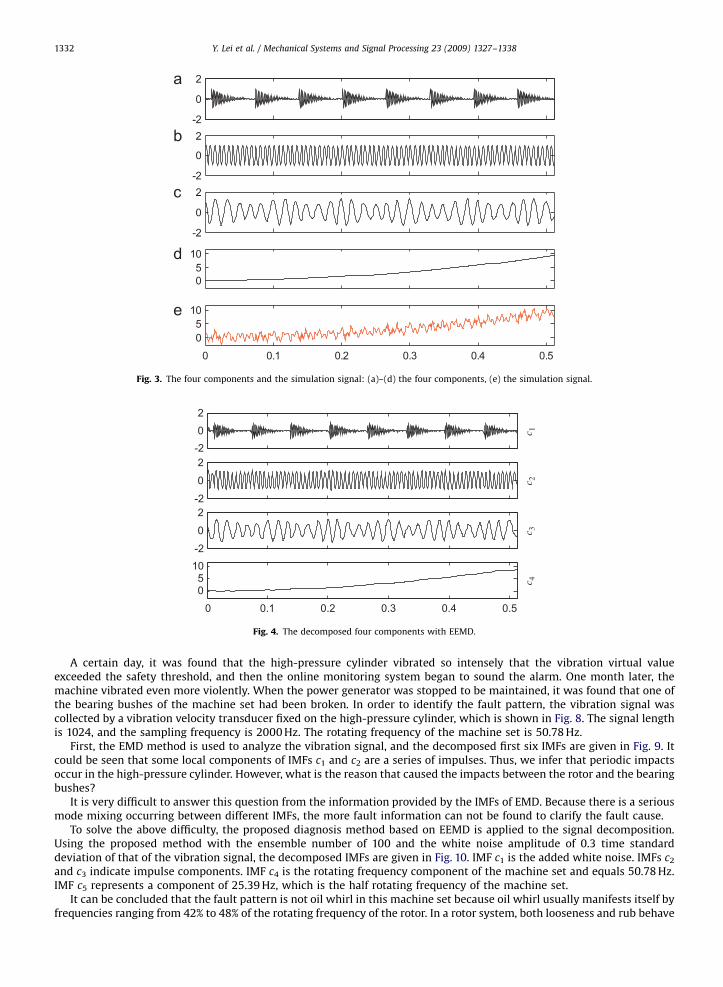
In fault diagnosis of rotating machinery, modulation and impact are two typical fault events. Therefore, the proposedmethod based on EEMD is tested on a simulation signal including modulation and impact components. The simulationsignal also consists of a sine wave representing a certain rotating frequency of machinery and a trend item. Thus, there arealtogether four components corresponding to different physical meaning in the simulation signal. The four componentsand the simulation signal combined by them are shown in Fig. 3(a)–(e), respectively.
Applying the EEMD method to the decomposition of the simulation signal, the decomposition result is given in Fig. 4. Itcan be seen from Fig. 4 that components c1, c2, c3 and c4 respectively correspond to the impact component, a certainrotating frequency, modulation component and trend item. Comparing the decomposed components shown in Fig. 4 withthe real components given in Fig. 3, it is found that the different components embedded in the signal can be extractedaccurately using the EEMD method.
For comparison, the simulation signal is analyzed again using the EMD method and the decomposition result isdisplayed in Fig. 5. It is clear that the problem of mode mixing appears between different IMFs and there are seriousdistortions for each IMF. This result shows that the EMD method fails to provide the reasonable decomposition.Additionally, observing the errors of EEMD and EMD shown in Fig. 6, which are obtained through calculating the absolutevalues of the differences between the decomposition components and the corresponding real components as shown in Fig.3, the errors of EEMD are far smaller than those of EMD. Thus, the decomposition result of the EEMD method is better thanthat of the EMD method.
5. Applications to the fault diagnosis of rotating machinery
5.1. Rub-impact fault diagnosis of a power generator
A power generator is important equipment in energy supply. It is significant to diagnose the faults occurring in thepower generator for guaranteeing the regular energy supply, avoiding the economic loss and saving the production cost.Fig. 7 displays a structure sketch of a power generator in a thermal-electric plant in China. This machine set consists of ahigh-pressure cylinder, a low-pressure cylinder, a motor and an exciter.
ARTICLE IN PRESS
-20
2
-2
0
2
-2
0
2
0 0.1 0.2 0.3 0.4 0.5
0510
c 1c 2
c 3c 4
Fig. 4. The decomposed four components with EEMD.
-2
0
2
-2
0
2
-2
0
2
0510
0 0.1 0.2 0.3 0.4 0.5
0510
Fig. 3. The four components and the simulation signal: (a)–(d) the four components, (e) the simulation signal.
Y. Lei et al. / Mechanical Systems and Signal Processing 23 (2009) 1327–13381332
A certain day, it was found that the high-pressure cylinder vibrated so intensely that the vibration virtual valueexceeded the safety threshold, and then the online monitoring system began to sound the alarm. One month later, themachine vibrated even more violently. When the power generator was stopped to be maintained, it was found that one ofthe bearing bushes of the machine set had been broken. In order to identify the fault pattern, the vibration signal wascollected by a vibration velocity transducer fixed on the high-pressure cylinder, which is shown in Fig. 8. The signal lengthis 1024, and the sampling frequency is 2000 Hz. The rotating frequency of the machine set is 50.78 Hz.
First, the EMD method is used to analyze the vibration signal, and the decomposed first six IMFs are given in Fig. 9. Itcould be seen that some local components of IMFs c1 and c2 are a series of impulses. Thus, we infer that periodic impactsoccur in the high-pressure cylinder. However, what is the reason that caused the impacts between the rotor and the bearingbushes?
It is very difficult to answer this question from the information provided by the IMFs of EMD. Because there is a seriousmode mixing occurring between different IMFs, the more fault information can not be found to clarify the fault cause.
To solve the above difficulty, the proposed diagnosis method based on EEMD is applied to the signal decomposition.Using the proposed method with the ensemble number of 100 and the white noise amplitude of 0.3 time standarddeviation of that of the vibration signal, the decomposed IMFs are given in Fig. 10. IMF c1 is the added white noise. IMFs c2
and c3 indicate impulse components. IMF c4 is the rotating frequency component of the machine set and equals 50.78 Hz.IMF c5 represents a component of 25.39 Hz, which is the half rotating frequency of the machine set.
It can be concluded that the fault pattern is not oil whirl in this machine set because oil whirl usually manifests itself byfrequencies ranging from 42% to 48% of the rotating frequency of the rotor. In a rotor system, both looseness and rub behave

ARTICLE IN PRESS
-20
2
-2
02
-2
0
2
0 0.1 0.2 0.3 0.4 0.50510
c 1c 2
c 3c 4
Fig. 5. The decomposed four components with EMD.
0
2
0
2
0
2
0.1 0.2 0.3 0.4 0.50
2
EEMD EMD
Fig. 6. The decomposition errors of EEMD and EMD.
High pressurecylinder
Motor
Low pressurecylinder
#1 #2 #3 #4 #5 #6 #7 #8
Exciter
Fig. 7. The structure sketch of the power generator.
0 0.1 0.2 0.3 0.4 0.5
-20
0
20
Am
plitu
de (
mm
s-1)
Time (s)
Fig. 8. The vibration signal collected from the high-pressure cylinder.
Y. Lei et al. / Mechanical Systems and Signal Processing 23 (2009) 1327–1338 1333

ARTICLE IN PRESS
-10010
-10010
-10010
-10010
-10010
0 0.1 0.2 0.3 0.4 0.5-10010
c 1c 2
c 5c 3
c 6c 4
Am
plitu
de (
mm
s-1)
Time (s)
Fig. 9. The decomposed result of the vibration signal of the high-pressure cylinder with EMD.
-10010
-10010
-10010
-10010
-10010
0 0.1 0.2 0.3 0.4 0.5-10010
c 1c 2
c 5c 3
r 5c 4
Am
plitu
de (
mm
s-1)
Time (s)
Fig. 10. The decomposed result of the vibration signal of the high-pressure cylinder with EEMD.
Y. Lei et al. / Mechanical Systems and Signal Processing 23 (2009) 1327–13381334
themselves by the half rotating frequency. Because there are impacts between the rotor and the bearing bushes, weconsider that the fault of the power generator is the rub-impact pattern. That implies the rotor system of the high-pressurecylinder rub and at the same time impact the bearing bushes when the power generator is operating. Then impulsecomponents are generated. Finally, the intense impacts broke one of the bearing bushes.
5.2. Early rub-impact fault diagnosis of a heavy oil catalytic cracking machine set
In this section, the proposed method based on EEMD is applied to an early rub-impact fault diagnosis of a machine setnamed heavy oil catalytic cracking unit in an oil refinery. This machine set consists of a gas turbo, a compressor, a gearboxand a driving motor. The structure sketch of the machine set is shown in Fig. 11. The gas turbo is used to transform heatenergy to mechanics energy. Two bearing cases (bushes #1 and #2) are used to support the gas turbo shaft, another two(bushes #3 and #4) are used to support the compressor shaft and bush #5 is to support the gearbox shaft. The hub and thelaminas (left components of the gas turbo) on the shaft are a cantilever structure. The rotating speed of the machine set is5859 rpm (97.65 Hz). The instrument of a Bently 3300 system was equipped to monitor its operating condition. Eddycurrent transducers are mounted on each bearing case in vertical and horizontal directions respectively to capturevibration signals. A computer online monitoring system is available for data acquisition and record.
It was found that the vibration on bush #5 was over the safety threshold and greater than the other monitoring pointswhen the machine set was running. To investigate the reason, a vibration signal of bush #5 with the length of 1024 and the

ARTICLE IN PRESS
Gas turbo Compressor Gearbox Motor
#1 #2 #3 #4 #5
Fig. 11. The structure sketch of the heavy oil catalytic cracking machine set.
0 0.1 0.2 0.3 0.4 0.5-40
-20
0
20
40
Am
plitu
de (
um)
Time (s)
Fig. 12. The vibration signal of bush #5.
-20020
-40-2002040
-10
0
10
0 0.1 0.2 0.3 0.4 0.5-10
0
10
c 1c 2
c 3c 4
Am
plitu
de (
um)
Time (s)
0.031 s
0.0395 s
Fig. 13. The decomposed result of the vibration signal of bush #5 with EEMD.
Y. Lei et al. / Mechanical Systems and Signal Processing 23 (2009) 1327–1338 1335
sampling frequency of 2000 Hz is analyzed, which is displayed in Fig. 12. The proposed method based on EEMD is used toanalyze this vibration signal.
The decomposed first four IMFs, which cover the most characteristic information, are presented in Fig. 13. There are aseries of impulses in IMF c1 and the interval between the two adjacent impulses is roughly close to 31 ms, whichapproximately equals three times revolution period (1/97.65 ¼ 10.24 ms) of the machine set. The rotating frequency of themachine set is represented by IMF c2. The impulse in IMF c1 occurs every three revolution cycles in IMF c2, which means theimpulse frequency is equal to 1/3 of the rotating frequency of the machine set. IMFs c3 and c4 are mostly dominated by acomponent with a period of about 39.5 ms, which implies that the frequency of the components included in IMFs c3 and c4
is 25.32 Hz.The frequency spectrum of the vibration signal is also performed and shown in Fig. 14. In the frequency spectrum, there
are three dominant components and the corresponding frequencies are f1 ¼ 25.35 Hz, f2 ¼ 97.65 Hz, and f3 ¼ 193.36 Hz,

ARTICLE IN PRESS
0 200 400 600 8000
10
20
Am
plitu
de (
um)
Frequency (Hz)
f1
f2
f3
Fig. 14. FFT spectrum of the vibration signal of bush #5.
-40-2002040
-40-2002040
-20
0
20
0 0.1 0.2 0.3 0.4 0.5-10
0
10
c1c2
c3c4
Am
plitu
de (
um)
Time (s)
Fig. 15. The decomposed result of the vibration signal of bush #5 with EMD.
Y. Lei et al. / Mechanical Systems and Signal Processing 23 (2009) 1327–13381336
respectively. Obviously, f2 is the rotating frequency, and f3 is a harmonic component and equals two times rotatingfrequency of the machine set. The component with 1/3 of the rotating frequency cannot be found from the frequencyspectrum. However, this component is critical to indicate the fault occurrence in the machine set because the 1/3 fractionalharmonic component of the rotating frequency is a symptom of an early rub-impact fault in rotor systems [18]. Therefore, itcould be concluded that an early rub-impact fault between the rotor and the bearing bushes occurred when the machineset was running. Furthermore, frequency f1 ¼ 25.35 Hz exists both in the frequency spectrum and the decomposition resultof the proposed method. It seems to be a fractional harmonic of the rotating frequency, which equals 1/4 of the rotatingfrequency. But it is verified by further investigation that it is the rotating frequency of the low speed axle of the gearbox.
For comparison, the EMD method is used to decompose the same vibration signal. The decomposed first four IMFs areshown in Fig. 15. Because of the problem of mode mixing, the IMFs obtained with the EMD method are distorted severely,and therefore the decomposition result cannot reveal the signal characteristics and provide accurate information. Thus, theproposed method based on EEMD is able to effectively extract the rub-impact features that cannot be found from theoriginal vibration signal, its frequency spectrum as well as the IMFs of EMD.
5.3. Discussion
(1)
From the results of the simulation experiment and rub-impact fault diagnosis of two rotating machine sets, it can beseen that the EEMD method is able to solve the problem of mode mixing existing in the EMD method and achievebetter decomposition results than the EMD method. Thus, the proposed method based on EEMD is a powerful tool forearly rub-impact fault diagnosis in rotating machinery. It is also a promising diagnosis method for other faultsoccurring in rotating machinery.(2)
Although the EEMD method achieves the obvious improvement compared to the EMD method, other issues, such as theuse of splines in the interpolation procedure, the calculation of mean value and signal end effects, still remain in theEEMD method. Actually, a simple but effective ensemble method to alleviate end effects is used in the EEMD method ofthis paper, which is described in Ref. [14]. In addition, the EEMD method introduces its own problems that have to dowith the magnitude of noise and number of ensembles. However, the main purpose of this paper is to apply EEMD to
ARTICLE IN PRESS
Y. Lei et al. / Mechanical Systems and Signal Processing 23 (2009) 1327–1338 1337
fault diagnosis of rotating machinery to overcome the problem of mode mixing existing in EMD. Finally, the EEMDmethod produces better results than the EMD method. Actually, as some experts said, every method has itsshortcomings. For the advanced signal processing techniques presently used in fault diagnosis, wavelet transform,spectral kurtosis, cyclostationarity analysis, EMD, etc., it is difficult to find one technique is superior to the others in anycases. Generally, aiming at the specific diagnosis problem, the best one may be selected by comparison.
(3)
Moreover, both EMD and EEMD methods are not suitable for the automatic detection of faults. When using these twomethods, significant expertise is required. User need to know physical interpretation of the results and mechanism ofthe diagnosis object. Otherwise, it is difficult to obtain a reliable diagnosis result. Thus, there is a demand fortechniques recently that can make decision on the running health of the machine automatically and reliably. Thesetechniques can allow relatively unskilled users to make reliable decisions without the need for a diagnosis specialist toexamine data and diagnose problems. Some researchers have been investigating these techniques. For example, Refs.[4,19] presented energy features extracted from IMFs of EMD, which can be used to automatic detection of gear faults.Also, Refs. [20,21] proposed automatic fault detection methods of rolling element bearings based on EMD and artificialintelligent techniques. These ideas can be introduced to fault diagnosis of other components in rotating machinery. It isan interesting and significant research topic to develop automatic fault diagnosis methods based on EEMD. The authorswould like to investigate this topic in future.6. Conclusions
The empirical mode decomposition (EMD) method provides a powerful tool for nonlinear and non-stationary signalanalysis. However, it has the problem of mode mixing so that the decomposed IMFs are distorted and unable to reflect thefault characteristics in fault diagnosis of rotating machinery precisely. To overcome this shortcoming, we propose a newmethod based on ensemble empirical mode decomposition (EEMD) to diagnose rotating machinery faults in this paper. Asimulation experiment demonstrates that the EEMD based method can increase the decomposition precision and thereforeproduce the IMFs with physical meaning. Two vibration signals from a rub-impact fault in a power generator and an earlyrub-impact fault in a heavy oil catalytic cracking machine set are analyzed using the proposed method to diagnose thefaults. The application results show that the proposed method is able to extract the fault characteristic information andidentify the faults effectively.
Acknowledgements
This work was supported by the key project of National Nature Science Foundation of China (No. 50335030) andNational Hitech Research and Development Program of China (2006AA04Z430).
References
[1] H. Ocak, K.A. Loparo, F.M. Discenzo, Online tracking of bearing wear using wavelet packet decomposition and probabilistic modeling—A method forbearing prognostics, Journal of Sound and Vibration 302 (2007) 951–961.
[2] Y.G. Lei, Z.J. He, Y.Y. Zi, et al., New clustering algorithm-based fault diagnosis using compensation distance evaluation technique, Mechanical Systemsand Signal Processing 22 (2008) 419–435.
[3] C.D. Duan, Z.J. He, H.K. Jiang, A sliding window feature extraction method for rotating machinery based on the lifting scheme, Journal of Sound andVibration 299 (2007) 774–785.
[4] S.J. Loutridis, Damage detection in gear systems using empirical mode decomposition, Engineering Structures 26 (2004) 1833–1841.[5] N.E. Huang, Z. Shen, S.R. Long, The Empirical mode decomposition and the Hilbert spectrum for nonlinear and non-stationary time series analysis,
Proceedings of the Royal Society of London 454 (1998) 903–995.[6] J.S. Cheng, D.J. Yu, J.S. Tang, et al., Application of frequency family separation method based upon EMD and local Hilbert energy spectrum method to
gear fault diagnosis, Mechanism and Machine Theory 43 (2008) 712–723.[7] B. Liu, S. Riemenschneider, Y. Xu, Gearbox fault diagnosis using empirical mode decomposition and Hilbert spectrum, Mechanical Systems and Signal
Processing 20 (2006) 718–734.[8] J.S. Cheng, D.J. Yu, Y. Yang, The application of energy operator demodulation approach based on EMD in machinery fault diagnosis, Mechanical
Systems and Signal Processing 21 (2007) 668–677.[9] Y.G. Lei, Z.J. He, Y.Y. Zi, Fault diagnosis of rotating machinery based on multiple ANFIS combination with GAs, Mechanical Systems and Signal
Processing 21 (2007) 2280–2294.[10] V.K. Rai, A.R. Mohanty, Bearing fault diagnosis using FFT of intrinsic mode functions in Hilbert–Huang transform, Mechanical Systems and Signal
Processing 21 (2007) 2607–2615.[11] J.S. Cheng, D.J. Yu, J.S. Tang, et al., Local rub-impact fault diagnosis of the rotor systems based on EMD, Mechanism and Machine Theory (2008).[12] F.J. Wu, L.S. Qu, Diagnosis of subharmonic faults of large rotating machinery based on EMD, Mechanical Systems and Signal Processing (2008).[13] Q. Gao, C.D. Duan, H. Fan, et al., Rotating machine fault diagnosis using empirical mode decomposition, Mechanical Systems and Signal Processing 22
(2008) 1072–1081.[14] Z.H. Wu, N.E. Huang, Ensemble empirical mode decomposition: a noise assisted data analysis method, Advances in Adaptive Data Analysis 1 (2009)
1–41.[15] P. Flandrin, G. Rilling, P. Gonc-alves, Empirical mode decomposition as a filter bank, IEEE Signal Processing Letter 11 (2004) 112–114.[16] Z.H. Wu, N.E. Huang, A study of the characteristics of white noise using the empirical mode decomposition method, Proceedings of the Royal Society
of London 460A (2004) 1597–1611.[17] P. Flandrin, P. Gonc-alves, G. Rilling, EMD equivalent filter Banks, from interpretation to applications, In: N. E. Huang, S. S. P. Shen (Eds.),
Hilbert–Huang Transform: Introduction and Applications, World Scientific, Singapore, pp 67–87, p. 360.

ARTICLE IN PRESS
Y. Lei et al. / Mechanical Systems and Signal Processing 23 (2009) 1327–13381338
[18] F.L. Chu, W.X. Lu, Experimental observation of nonlinear vibrations in a rub-impact rotor system, Journal of Sound and Vibration 283 (2005)621–643.
[19] S.J. Loutridis, Instantaneous energy density as a feature for gear fault detection, Mechanical Systems and Signal Processing 20 (2006) 1239–1253.[20] Y.G. Lei, Z.J. He, Y.Y. Zi, A new approach to intelligent fault diagnosis of rotating machinery, Expert Systems with Applications 35 (2008) 1593–1600.[21] Y.G. Lei, Z.J. He, Y.Y. Zi, Application of a novel hybrid intelligent method to compound fault diagnosis of locomotive roller bearings, Transactions of the
ASME: Journal of vibration and acoustics 130 (2008) 0345011–0345016.