Application of Stress Field Detection (SFD®) Technology ... · PDF fileNo single...
17
Application of Stress Field Detection (SFD®) Technology for Identifying Areas of Hydrocarbon Potential in the Gulf of Mexico Region José Antonio Escalera 1 , Marco Vázquez García 1 , José de Jesús Hernández Olazarán 1 , Antonio Tamez Ponce 1 , Oscar Vázquez García 1 , Manuel Hurtado Cardador 2* and George Liszicasz 2 , 1 Petróleos Mexicanos (“PEMEX”), México City, México 2 NXT Energy Solutions Inc. (“NXT”), Calgary, Canada Presenting author 2013 Petróleos Mexicanos (“PEMEX”), México City, México2 NXT Energy Solutions Inc. (“NXT”), Calgary, Canada* Presenting Author NXT 7/23/2013
Transcript of Application of Stress Field Detection (SFD®) Technology ... · PDF fileNo single...

Application of Stress Field Detection (SFD®) Technology for Identifying Areas of Hydrocarbon Potential in the Gulf of Mexico Region José Antonio Escalera1, Marco Vázquez García1, José de Jesús Hernández Olazarán1, Antonio Tamez Ponce1, Oscar Vázquez García1, Manuel Hurtado Cardador2*
and George Liszicasz2, 1 Petróleos Mexicanos (“PEMEX”), México City, México 2 NXT Energy Solutions Inc. (“NXT”), Calgary, Canada
Presenting author
2013
Petróleos Mexicanos (“PEMEX”), México City, México2 NXT Energy Solutions Inc. (“NXT”), Calgary, Canada* Presenting Author
NXT 7/23/2013

Presented at Next Generation Oil & Gas Summit Latin America, Cartagena, July 23-25, 2013
Presented at Next Generation Oil & Gas Summit Latin America, Cartagena, July 23-25, 2013
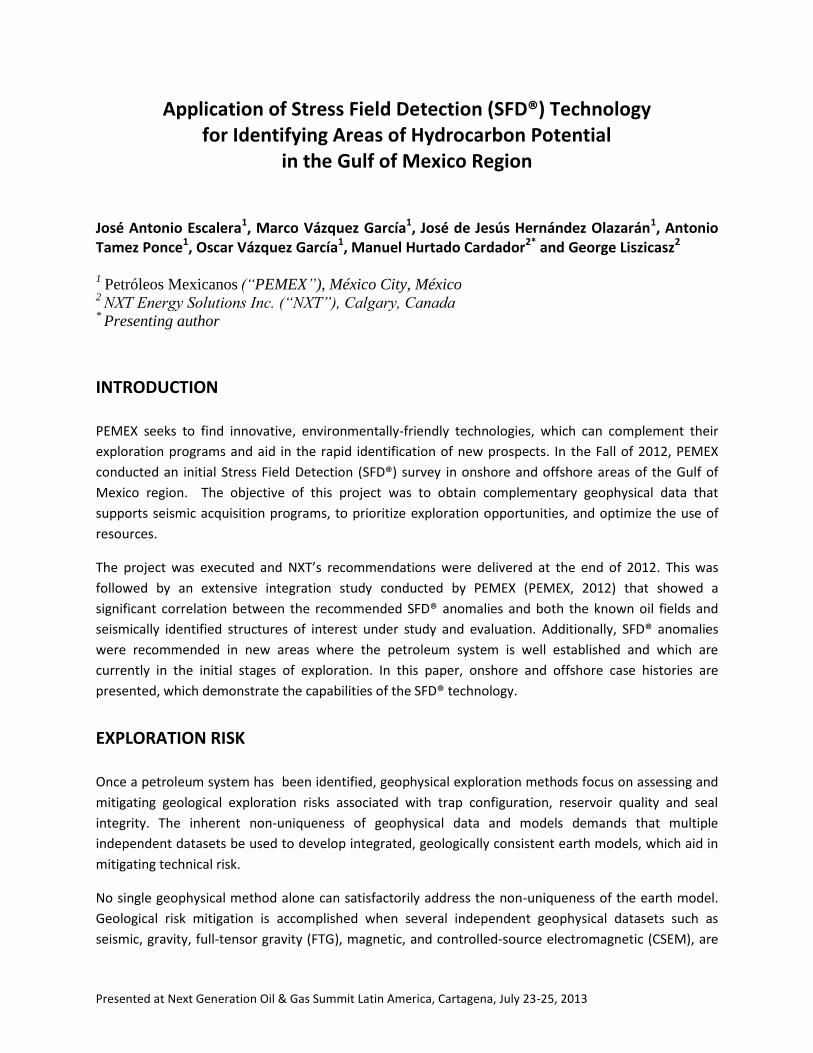
Application of Stress Field Detection (SFD®) Technology for Identifying Areas of Hydrocarbon Potential
in the Gulf of Mexico Region
José Antonio Escalera1, Marco Vázquez García1, José de Jesús Hernández Olazarán1, Antonio Tamez Ponce1, Oscar Vázquez García1, Manuel Hurtado Cardador2* and George Liszicasz2 1 Petróleos Mexicanos (“PEMEX”), México City, México
2 NXT Energy Solutions Inc. (“NXT”), Calgary, Canada
* Presenting author
INTRODUCTION
PEMEX seeks to find innovative, environmentally-friendly technologies, which can complement their
exploration programs and aid in the rapid identification of new prospects. In the Fall of 2012, PEMEX
conducted an initial Stress Field Detection (SFD®) survey in onshore and offshore areas of the Gulf of
Mexico region. The objective of this project was to obtain complementary geophysical data that
supports seismic acquisition programs, to prioritize exploration opportunities, and optimize the use of
resources.
The project was executed and NXT’s recommendations were delivered at the end of 2012. This was
followed by an extensive integration study conducted by PEMEX (PEMEX, 2012) that showed a
significant correlation between the recommended SFD® anomalies and both the known oil fields and
seismically identified structures of interest under study and evaluation. Additionally, SFD® anomalies
were recommended in new areas where the petroleum system is well established and which are
currently in the initial stages of exploration. In this paper, onshore and offshore case histories are
presented, which demonstrate the capabilities of the SFD® technology.
EXPLORATION RISK
Once a petroleum system has been identified, geophysical exploration methods focus on assessing and
mitigating geological exploration risks associated with trap configuration, reservoir quality and seal
integrity. The inherent non-uniqueness of geophysical data and models demands that multiple
independent datasets be used to develop integrated, geologically consistent earth models, which aid in
mitigating technical risk.
No single geophysical method alone can satisfactorily address the non-uniqueness of the earth model.
Geological risk mitigation is accomplished when several independent geophysical datasets such as
seismic, gravity, full-tensor gravity (FTG), magnetic, and controlled-source electromagnetic (CSEM), are

Presented at Next Generation Oil & Gas Summit Latin America, Cartagena, July 23-25, 2013
used in conjunction to reduce the number of possible models. The correlation of SFD® data with other
geophysical, geological and engineering information is a fundamental step in assessing whether lead
areas are then elevated to prospects, which can aid in risk reduction.
It is equally important to address the need to reduce the cost and time associated with hydrocarbon
exploration. The SFD® system aids in rapid identification of prospect areas with potential trap, reservoir
quality and seal integrity.
SFD® SYSTEM OVERVIEW
Methodology
The SFD® system utilizes quantum-scale sensors to detect gravity field perturbations induced by
terrestrial stress energy variations, primarily in the horizontal plane. Significant subsurface
discontinuities (anomalies) are inherently associated with and dependent on subsurface principal
stresses (Bell, 1996; Zoback, 1998). As a consequence, the discontinuities will distort stress fields,
resulting in a unique in-situ stress pattern. In addition to local effects, principal horizontal stresses
define migration pathways, reservoir orientation and fluid expulsion (Baranova et al., 2011; Zeng et al.,
2004).
The subsurface geological condition required for SFD® to detect gravity field perturbations due to stress
variations in the horizontal direction is the occurrence of a structural and/or stratigraphic change
(interface) with sufficient difference in elastic properties. An important source of elastic variations is the
presence of trapped fluids (oil, gas, or water). Other sources include faulting / fracturing, over-pressure,
major lithological changes and basin boundaries; generally, all major discontinuities will evoke a distinct
SFD® response. For instance, if a dry rock body is in contact with a fluid saturated rock, the shear stress
at the interface will be significantly reduced because fluids cannot support shear but the normal
component of the stress remains continuous (Walley and Field, 2005). In general, the variation of shear
component in reservoirs will result in the redistribution and orientation change of the stress fields. For
the purposes of this paper, the term reservoir is used only in reference to porous rock containing
trapped fluids.
Operation and Interpretation
The SFD® survey system is completely self-contained within the survey aircraft and utilizes 22 sensors (6
primary, 8 secondary and 8 Research and Development) flying at an altitude of roughly 3,000 m and a
speed of approximately 500 km/h (Figure 1). A standard SFD® survey is normally flown in a grid pattern
and is designed to detect anomalies with a linear extent of 2 km to 20 km. SFD® data are acquired at
2,000 samples/second and the output is displayed as voltage (V) vs. flight time (seconds). Anomalous
areas which are identified during the SFD® interpretation process are assigned a relative ranking,
indicative of the trap and reservoir potential.

Presented at Next Generation Oil & Gas Summit Latin America, Cartagena, July 23-25, 2013
Figure 1: The SFD® system and a sample signal response over a 2.5 billion barrel field in Colombia.
Signal analysis (frequency, amplitude and character/pattern changes) and interpretation for each sensor
are performed to identify prospective areas, without the aid of any a priori knowledge of the underlying
geotechnical and engineering data along the SFD® flight path. The anomalies are also compared with
NXT’s database of SFD® signals that have been obtained over various geological features worldwide,
which serve as templates for interpretation. SFD® anomalies are then ranked and then categorized
according to prospectivity. For the purposes of this paper the sensor referred to as “String” is shown as
an example of an SFD® signal.
Based on past experience, NXT has established that the area of investigation as identified by SFD®
sensors is within 1.5 km on either side of the flight path. SFD® sensors adapt to the background stress
field and only respond to the presence of an anomaly within the sedimentary column. At present, SFD®
does not determine the depth of the anomaly or the type of trapped fluids.
SFD® SURVEY CONDUCTED BY PEMEX
The initial survey that NXT conducted for PEMEX in Fall 2012 focused on two objectives: 1) a “blind” test
of the SFD® system over areas with significant proprietary geological and geophysical (G&G)
information, and 2) identifying new prospective areas in the region. The survey area is geologically
complex and covers the Salina del Istmo, Salina del Istmo Deep Gulf portion, Reforma Akal Pilar,
Macuspana basins as well as the Sierra de Chiapas area and the Yucatan Platform. The sediments of
these basins are terrigenous, carbonates, and in some areas there is presence of salt bodies.
Presented at Next Generation Oil & Gas Summit Latin America, Cartagena, July 23-25, 2013
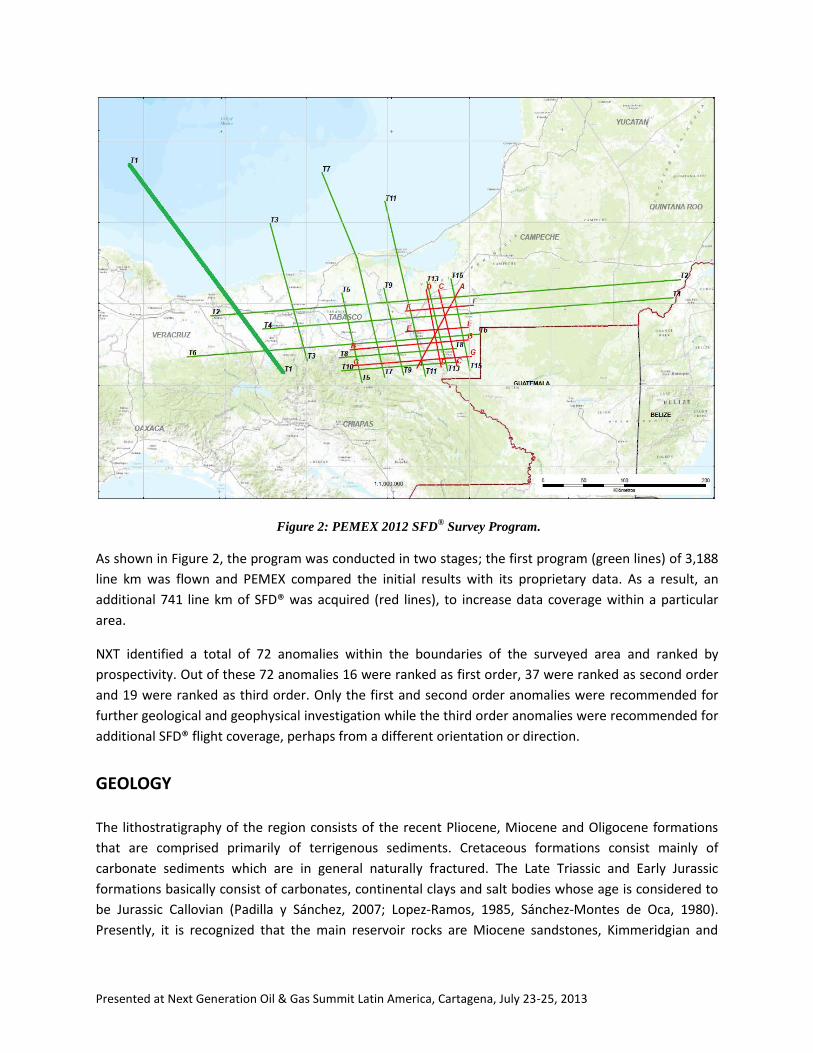
Figure 2: PEMEX 2012 SFD® Survey Program.
As shown in Figure 2, the program was conducted in two stages; the first program (green lines) of 3,188
line km was flown and PEMEX compared the initial results with its proprietary data. As a result, an
additional 741 line km of SFD® was acquired (red lines), to increase data coverage within a particular
area.
NXT identified a total of 72 anomalies within the boundaries of the surveyed area and ranked by
prospectivity. Out of these 72 anomalies 16 were ranked as first order, 37 were ranked as second order
and 19 were ranked as third order. Only the first and second order anomalies were recommended for
further geological and geophysical investigation while the third order anomalies were recommended for
additional SFD® flight coverage, perhaps from a different orientation or direction.
GEOLOGY
The lithostratigraphy of the region consists of the recent Pliocene, Miocene and Oligocene formations
that are comprised primarily of terrigenous sediments. Cretaceous formations consist mainly of
carbonate sediments which are in general naturally fractured. The Late Triassic and Early Jurassic
formations basically consist of carbonates, continental clays and salt bodies whose age is considered to
be Jurassic Callovian (Padilla y Sánchez, 2007; Lopez-Ramos, 1985, Sánchez-Montes de Oca, 1980).
Presently, it is recognized that the main reservoir rocks are Miocene sandstones, Kimmeridgian and
Presented at Next Generation Oil & Gas Summit Latin America, Cartagena, July 23-25, 2013
Upper Cretaceous-Paleocene limestone, and that the hydrocarbon source rocks are mainly Tithonian
Jurassic shales (Schlumberger, 1984; WEC Mexico 2009).
SFD® RESULTS AND CORRELATIONS
The integration results show significant correlation between SFD® anomalies and known hydrocarbon
accumulations. The designed lines crossed a total of 64 known hydrocarbon accumulations of various
sizes. PEMEX determined that SFD® successfully identified 47 of these known accumulations.
Furthermore, these 64 accumulations represent an estimated total of 12,047.9 MMBoe of 3P reserves
out of which the identified 47 accumulations represent a total of 11,918.7 MMBoe. The remaining
unidentified 17 accumulations have a reserve total of 129.2 MMBoe that are primarily in isolated
locations and have a linear extent of less than 2 km.
Furthermore, in areas of active exploration, it was shown that the SFD® anomalies exhibit significant
correlation with seismically identified prospects as well as with prospects that were confirmed or
located with other methods.
The results demonstrate that SFD® technology is capable of detecting geological traps with reservoir
potential, irrespective of lithology. Moreover, the proximity to or position of salt bodies or water depth,
does not inhibit the capabilities of SFD®.
The following case histories highlight the correlation of SFD® data in offshore and onshore scenarios
with both known production and potential areas that are currently being investigated by PEMEX.
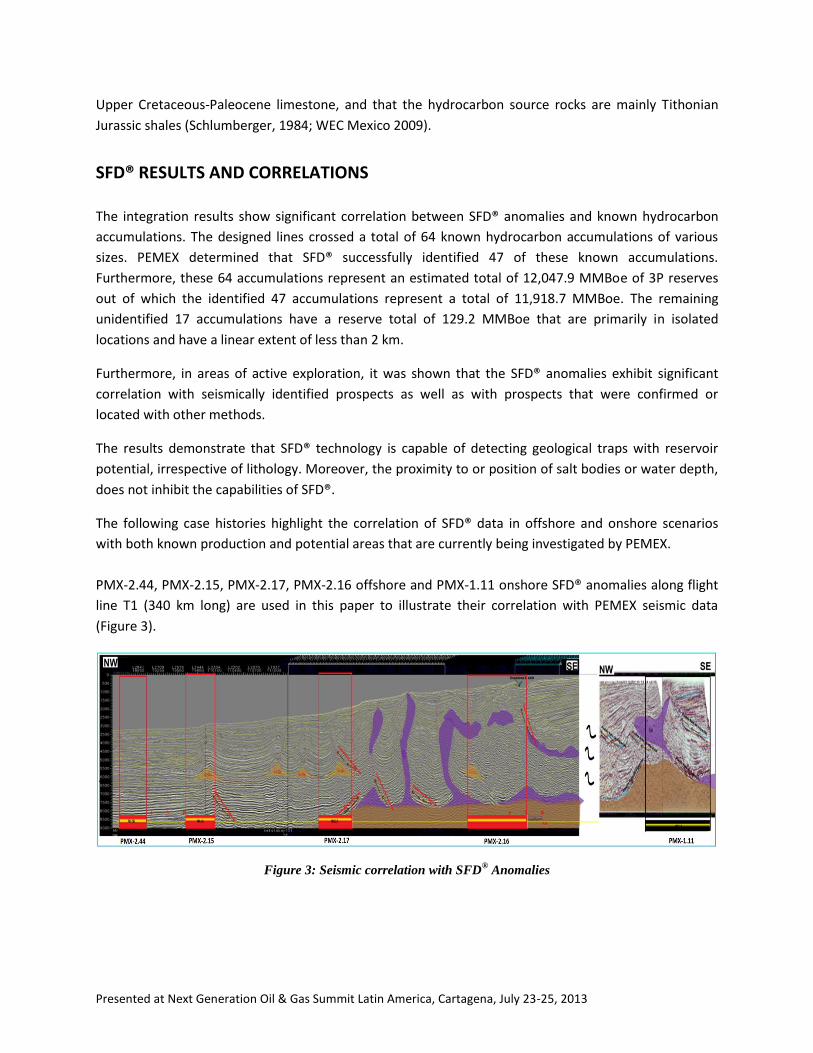
PMX-2.44, PMX-2.15, PMX-2.17, PMX-2.16 offshore and PMX-1.11 onshore SFD® anomalies along flight
line T1 (340 km long) are used in this paper to illustrate their correlation with PEMEX seismic data
(Figure 3).
Figure 3: Seismic correlation with SFD® Anomalies

Presented at Next Generation Oil & Gas Summit Latin America, Cartagena, July 23-25, 2013
Case A: Offshore PMX-2.44, PMX-2.15 and PMX-2.17
The PMX-2.44 anomaly is located on a stratigraphic trap in the Deep Gulf of Mexico region where the
water depth is between 2400 to 2600 meters. The target itself is located in the Upper Miocene
approximately 3500 meters below the seabed. This prospect is currently in evaluation. The length of this
anomaly is approximately 10 km (Figure 4).
Figure 4: Seismic correlation with SFD® Anomaly PMX-2.44
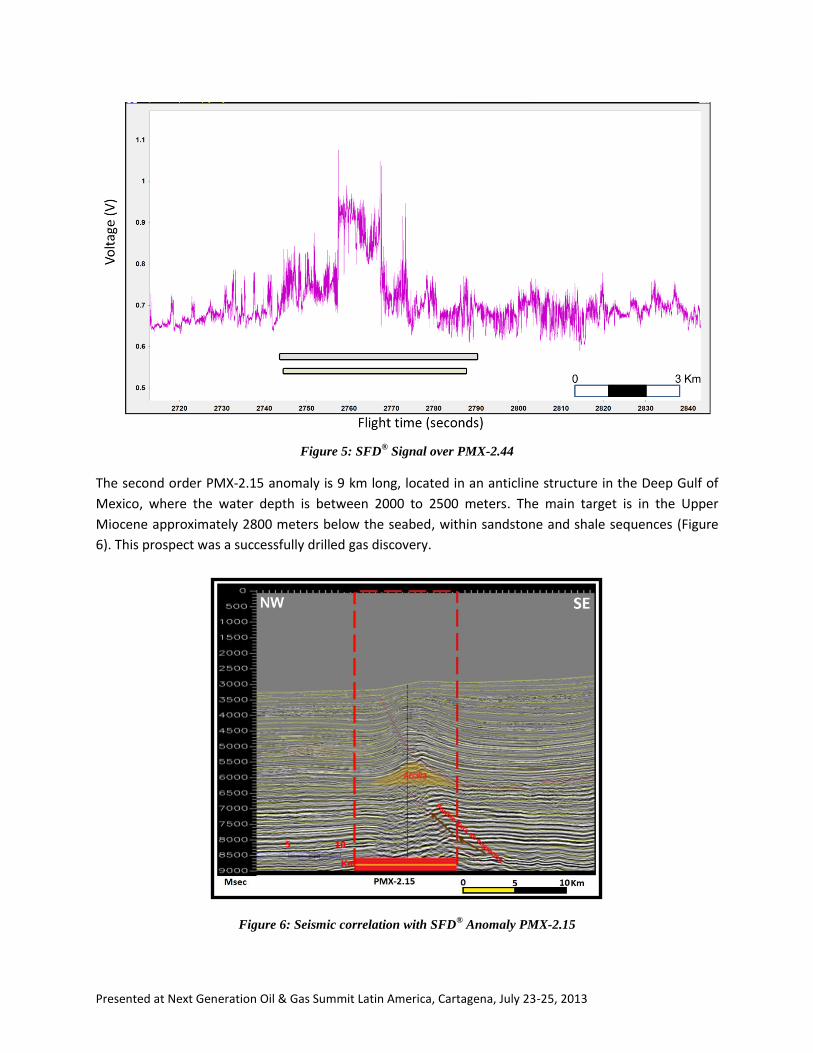
The SFD® signal obtained over the PEMEX prospect PMX-2.44 is shown in Figure 5. Note that in general,
when the baseline voltage is above 0.8 V anomalies will be recognizable around peaks and when the
baseline voltage is below 0.8 V anomalies will be identifiable in the troughs. The upper bar represents
the extent of the anomalous area while the lower bar represents the trap area. The center of the trap is
at approximately 2760s where the strongest signal pattern and frequency changes can be observed.
Presented at Next Generation Oil & Gas Summit Latin America, Cartagena, July 23-25, 2013
Figure 5: SFD
® Signal over PMX-2.44
The second order PMX-2.15 anomaly is 9 km long, located in an anticline structure in the Deep Gulf of
Mexico, where the water depth is between 2000 to 2500 meters. The main target is in the Upper
Miocene approximately 2800 meters below the seabed, within sandstone and shale sequences (Figure
6). This prospect was a successfully drilled gas discovery.
Figure 6: Seismic correlation with SFD® Anomaly PMX-2.15

Presented at Next Generation Oil & Gas Summit Latin America, Cartagena, July 23-25, 2013
The SFD® signal for PMX-2.15 is shown in Figure 7. The center of the trap is at approximately 2950s where the strongest signal pattern and frequency changes can be observed.
Figure 7: SFD
® Signal over PMX-2.15
Studies in the PMX-2.44 and PMX-2.15 anomalies have been conducted with controlled source
electromagnetic surveys (CSEM) that confirm the presence of resistive fluid in these structures (Figure
8).
Figure 8: CSEM Resistivity anomaly correlation with the PMX-2.44 and PMX-2.15 SFD® anomalies
Presented at Next Generation Oil & Gas Summit Latin America, Cartagena, July 23-25, 2013
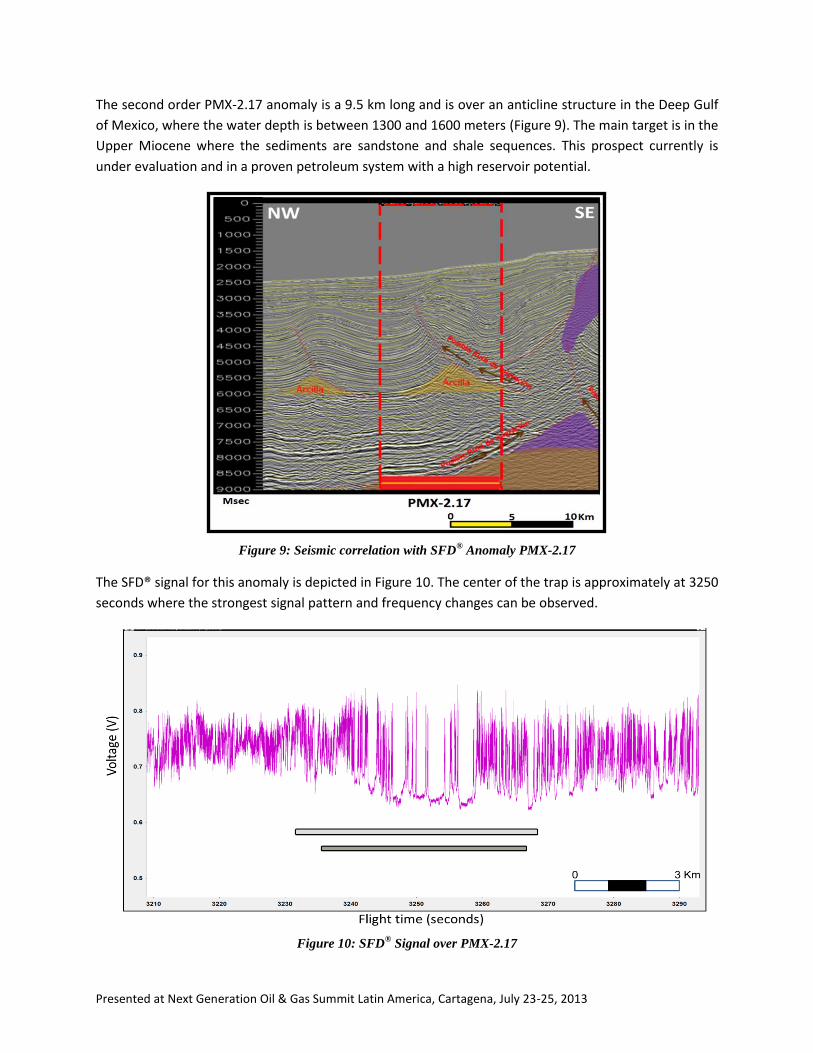
The second order PMX-2.17 anomaly is a 9.5 km long and is over an anticline structure in the Deep Gulf
of Mexico, where the water depth is between 1300 and 1600 meters (Figure 9). The main target is in the
Upper Miocene where the sediments are sandstone and shale sequences. This prospect currently is
under evaluation and in a proven petroleum system with a high reservoir potential.
Figure 9: Seismic correlation with SFD® Anomaly PMX-2.17
The SFD® signal for this anomaly is depicted in Figure 10. The center of the trap is approximately at 3250
seconds where the strongest signal pattern and frequency changes can be observed.
Figure 10: SFD
® Signal over PMX-2.17
Presented at Next Generation Oil & Gas Summit Latin America, Cartagena, July 23-25, 2013
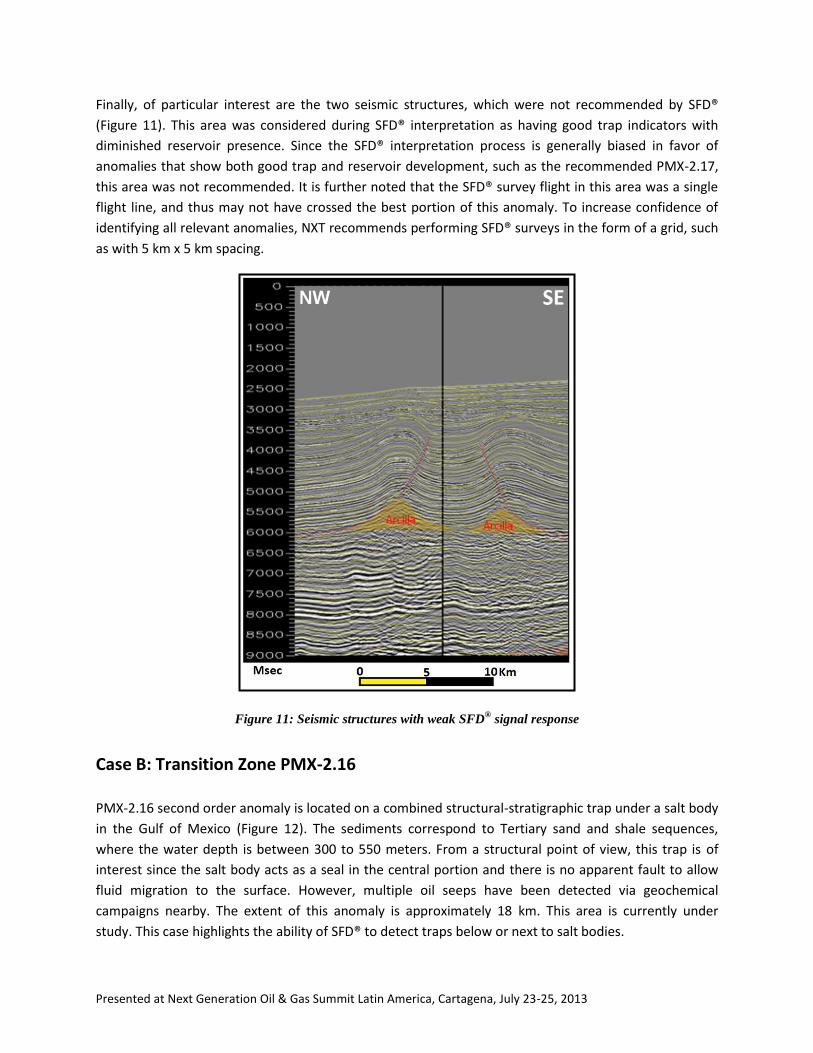
Finally, of particular interest are the two seismic structures, which were not recommended by SFD®
(Figure 11). This area was considered during SFD® interpretation as having good trap indicators with
diminished reservoir presence. Since the SFD® interpretation process is generally biased in favor of
anomalies that show both good trap and reservoir development, such as the recommended PMX-2.17,
this area was not recommended. It is further noted that the SFD® survey flight in this area was a single
flight line, and thus may not have crossed the best portion of this anomaly. To increase confidence of
identifying all relevant anomalies, NXT recommends performing SFD® surveys in the form of a grid, such
as with 5 km x 5 km spacing.
Figure 11: Seismic structures with weak SFD® signal response
Case B: Transition Zone PMX-2.16
PMX-2.16 second order anomaly is located on a combined structural-stratigraphic trap under a salt body
in the Gulf of Mexico (Figure 12). The sediments correspond to Tertiary sand and shale sequences,
where the water depth is between 300 to 550 meters. From a structural point of view, this trap is of
interest since the salt body acts as a seal in the central portion and there is no apparent fault to allow
fluid migration to the surface. However, multiple oil seeps have been detected via geochemical
campaigns nearby. The extent of this anomaly is approximately 18 km. This area is currently under
study. This case highlights the ability of SFD® to detect traps below or next to salt bodies.
Presented at Next Generation Oil & Gas Summit Latin America, Cartagena, July 23-25, 2013
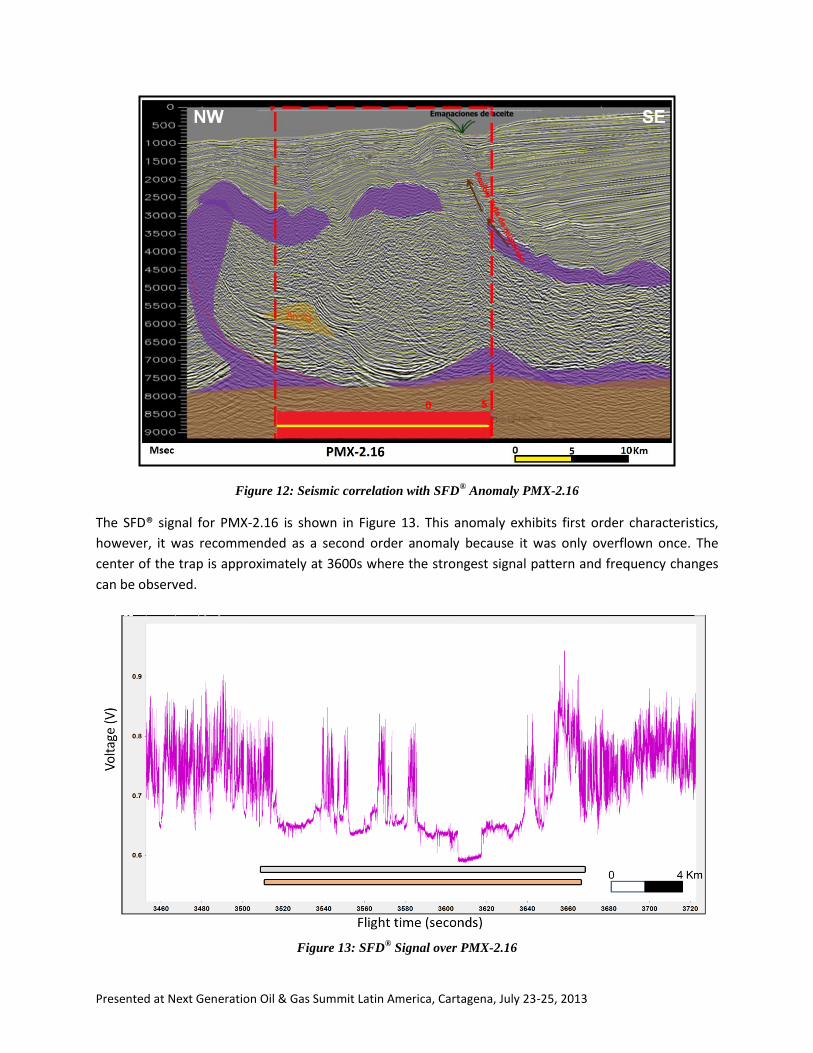
Figure 12: Seismic correlation with SFD® Anomaly PMX-2.16
The SFD® signal for PMX-2.16 is shown in Figure 13. This anomaly exhibits first order characteristics,
however, it was recommended as a second order anomaly because it was only overflown once. The
center of the trap is approximately at 3600s where the strongest signal pattern and frequency changes
can be observed.
Figure 13: SFD
® Signal over PMX-2.16

Presented at Next Generation Oil & Gas Summit Latin America, Cartagena, July 23-25, 2013
Case C: Onshore PMX-1.11
PMX-1.11 is a first order SFD® anomaly located over a structural trap associated with a salt body about 5 km long. In this area there are several important fields with oil and gas production in Tertiary formations in Tabasco State, with cumulative remaining 3P (proven, probable and possible) of 393 MMboe (Secretaría de Energía, 2012). This anomaly is approximately 22 km long (Figure 14).
Figure 14: PMX-1.11 Seismic showing the structural trap and the associated salt body.
The SFD® signal for this anomaly is shown in Figure 15. The rapid evolution of signal amplitude suggests the presence of significant geologic changes. There are two highly anomalous areas centered at approximately 4190s and at 4290s. The signal relaxation events are indicators of excellent trap presence. This signal pattern has been observed in previous SFD® surveys over significant accumulations.
Figure 15: SFD® Signal over PMX-1.11

Presented at Next Generation Oil & Gas Summit Latin America, Cartagena, July 23-25, 2013
CONCLUSIONS
Integration of PEMEX G&G data with SFD® anomalies shows significant correlation with known
hydrocarbon producing fields.
SFD® anomalies have significant correlation with PEMEX seismically interpreted structures in
active exploration areas.
In regions with little or no existing G&G data, new areas of exploratory interest were identified
by SFD®.
SFD® is most effective at detecting anomalies with a linear extent greater than 2km.
SFD® can detect geological traps which are prospective for storing fluids, regardless of the water
depth or the presence of salt.
SFD® is effective in both onshore and offshore environments.
The SFD® system aids in rapid identification of prospect areas with potential trap, reservoir
quality and seal integrity.
SFD® helps focus and prioritize seismic programs.
ACKNOWLEDGEMENTS
We wish to thank all the people involved in the realization of this project. We are especially grateful for the collaboration and support of the PEMEX exploration staff and for allowing the use of proprietary materials contained in this paper.

Presented at Next Generation Oil & Gas Summit Latin America, Cartagena, July 23-25, 2013
REFERENCES
Baranova, V. et al., 2011. Integrated Geomechanical Reservoir Characterization Approach to Study
Migration and Accumulation of Hydrocarbons in Llanos Basin, Colombia. Presentation at AAPG
International Conference and Exhibition, Milan, Italy, October 23-26, 2011.
Bell, J. S., 1996. In Situ Stresses in Sedimentary Rocks (Part II): Applications of Stress Measurements.
Geoscience Canada, vol. 23, no. 3, pp. 135-153.
Hillis, R. R., 2001. Coupled changes in pore pressure and stress in oil fields and sedimentary basins.
National Centre for Petroleum Geology and Physics, Australian Petroleum Cooperative Research
Centre, Adelaide University, Adelaide, Australia.
López Ramos, E., 1999. Geología General y de México. ed. Trillas. México.
Marmisolle-Daguerre, D. et al., 1984. Evaluación de Formaciones en México. Petróleos Mexicanos.
Schlumberger Offshore Services.
Padilla y Sánchez, R. J., 2007. Evolución Geológica del Sureste Mexicano desde el Mesozoico al presente
en el contexto regional del Golfo de México. Boletín de la Sociedad Geológica Mexicana, Tomo LIX
Núm. 1, pp. 19-42.
PEMEX, 2012. Informe Final Reporte de Integración. Contrato PEMEX-NXT.
Sánchez-Montes de Oca, R., 1980. Geología Petrolera de la Sierra de Chiapas. Bol. Asoc. Mex. Geol.
Petrol., vol. 31, no. 1-2, pp. 67-77.
Schlumberger, 1984. Evaluación de Formaciones en México, Septiembre, 1984.
Secretaría de Energía, 2012. Prospectiva de petróleo crudo 2012-2026.
http://www.aiest.unam.mx/biblio/PPCI_2012_2026.pdf.
Walley, S. M., Field J. E., 2005. Elastic Wave Propagation in Materials. Encyclopedia of Materials: Science
and Technology, pp. 1-7.
WEC México, 2009. Provincias Petroleras de México - Capitulo 2, pp. 2.106-2.145.
Zeng, L., Tan, C., Zhang, M., 2004. Tectonic stress fireld and its effect on hydrocarbon migration and
accumulation in Mesozoic and Cenozoic in Kuga depression, Tarim basin. Science in China, Ser. D Earth
Sciences, vol. 47, Supp. II, pp. 114-124.
Zoback, M., 1998. Scientific Drilling into the San Andres Fault and Site Characterization Research:
Planning and Coordination Efforts, Final Technical Report, U.S. Department of Energy, August 30,
1998.
Presented at Next Generation Oil & Gas Summit Latin America, Cartagena, July 23-25, 2013