Application of Remote Sensing to Plant Breeding · “Application of Remote Sensing to ... Remote...
31
“Application of Remote Sensing to Plant Breeding” William Schapaugh, Brent Christenson, Hatice Aslan, Randi Clark, Kevin Price, Nan An, Vara Prasad and John Boyer
Transcript of Application of Remote Sensing to Plant Breeding · “Application of Remote Sensing to ... Remote...
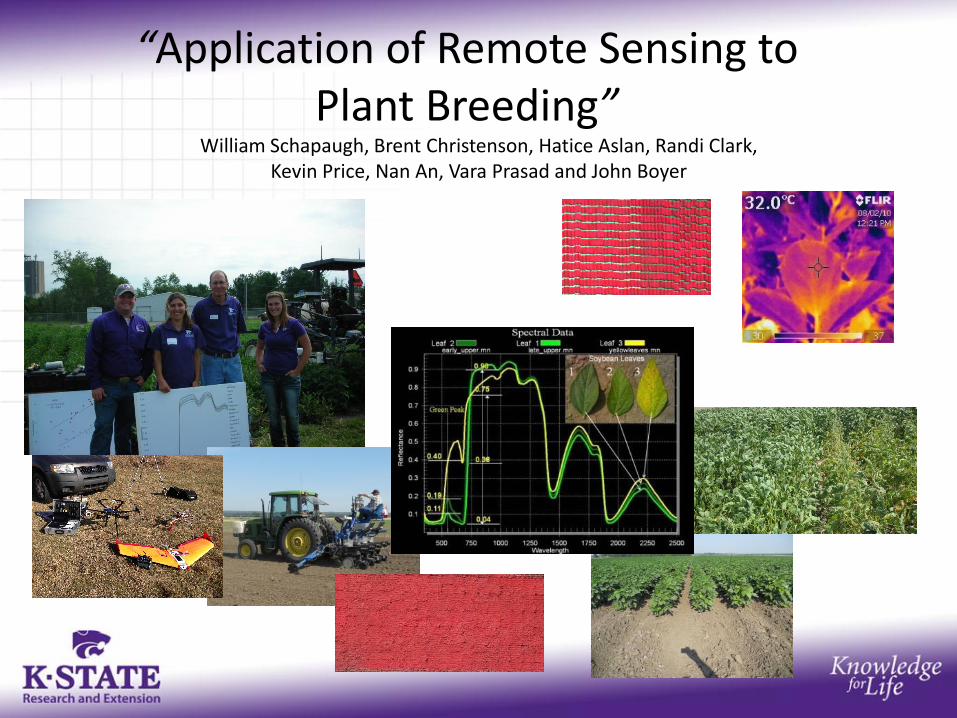
“Application of Remote Sensing to Plant Breeding”
William Schapaugh, Brent Christenson, Hatice Aslan, Randi Clark, Kevin Price, Nan An, Vara Prasad and John Boyer

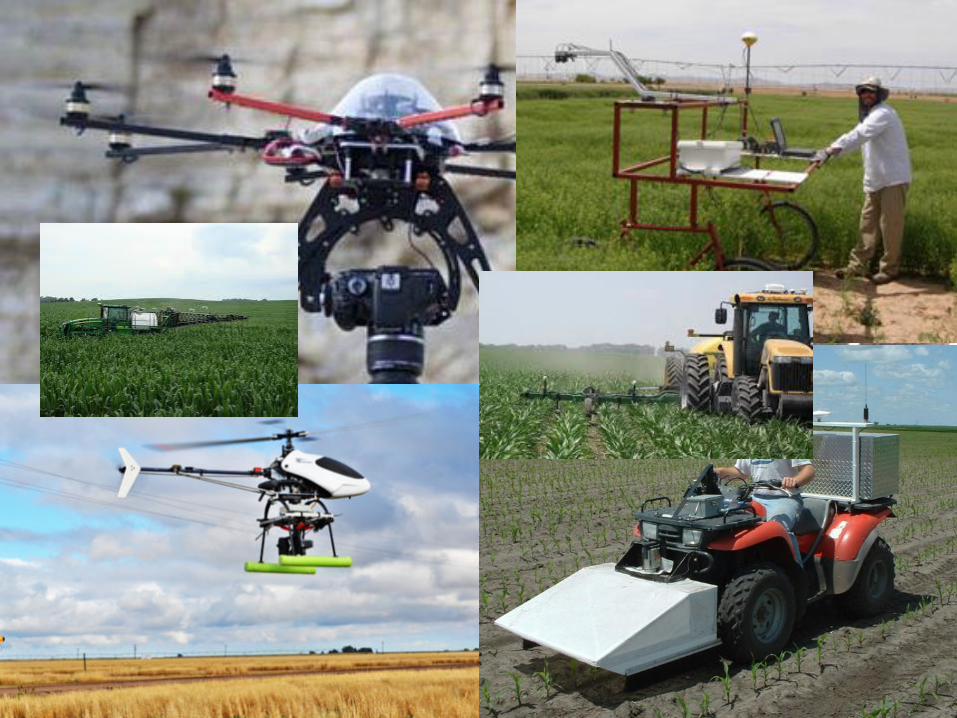
Remote sensing Using instruments mounted on satellites, in planes, etc. to produce images

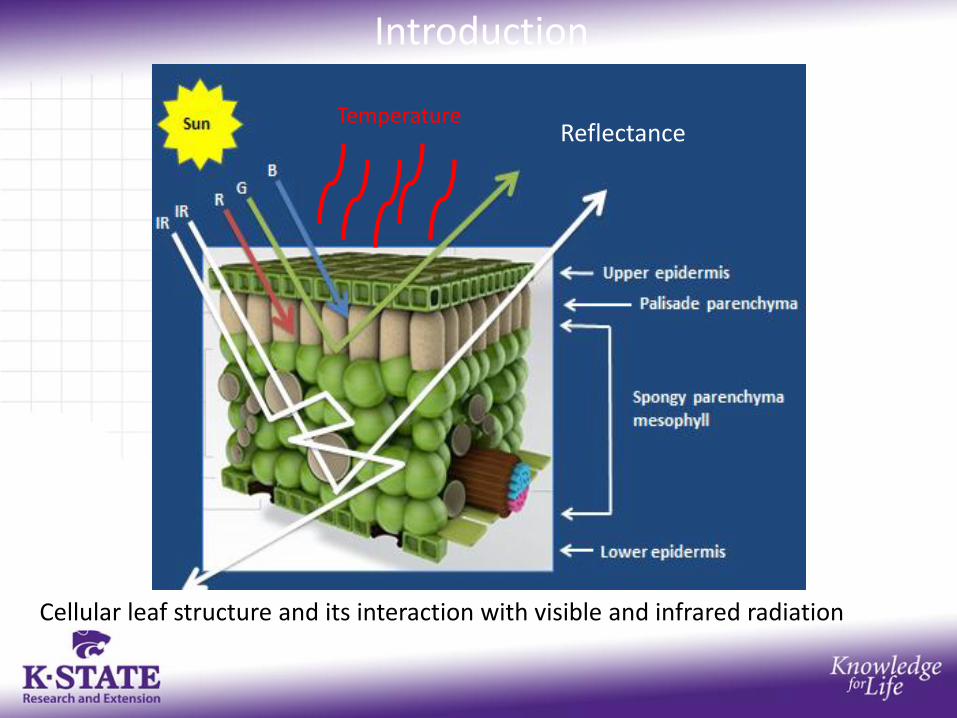
Introduction
Cellular leaf structure and its interaction with visible and infrared radiation
Temperature Reflectance

Color spectrum seen by passing white light through prism
Electromagnetic
Spectrum

http://www.trimble.com/Agriculture/greenseeker.aspx

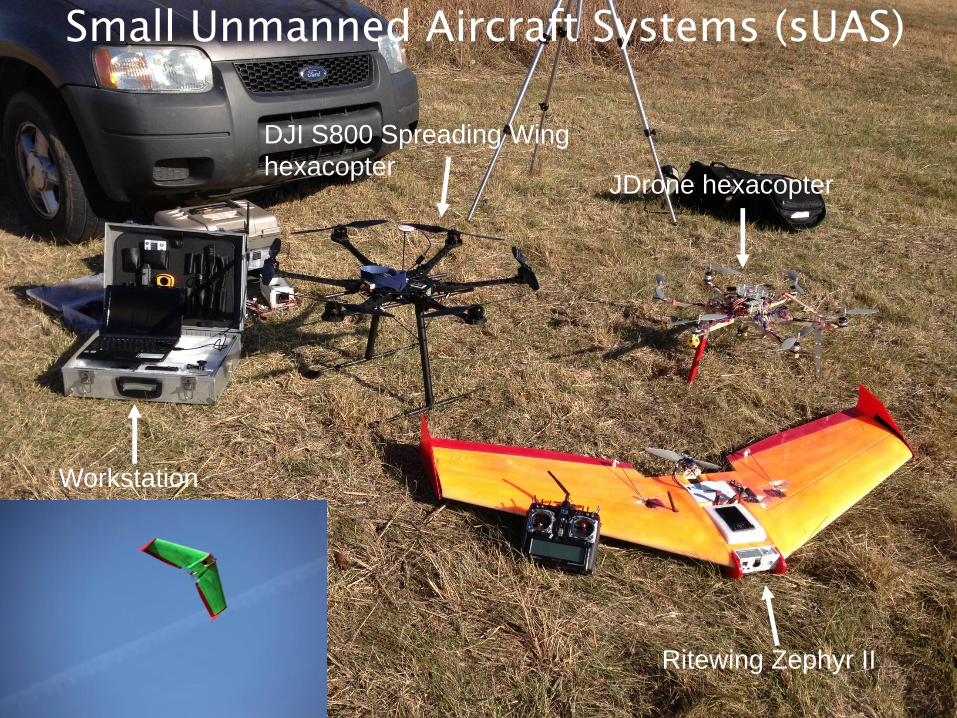
Ritewing Zephyr II
DJI S800 Spreading Wing
hexacopter JDrone hexacopter
Workstation
Small Unmanned Aircraft Systems (sUAS)

10

Green
Blue UV Red
Red Edge
Red Shoulder
Water Absorption Near-
infrared (NIR)
Plateau
Typical spectral reflectance from a living leaf

1 2 3 4 5 6 7 8


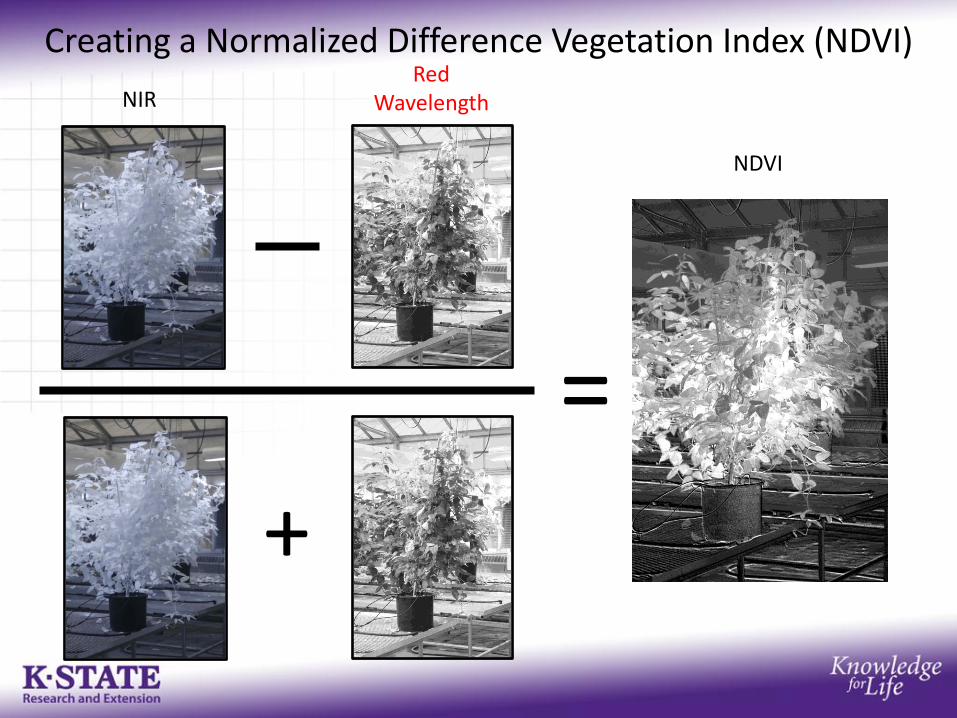
Red Wavelength
Creating a Normalized Difference Vegetation Index (NDVI)
NIR
=
+
NDVI
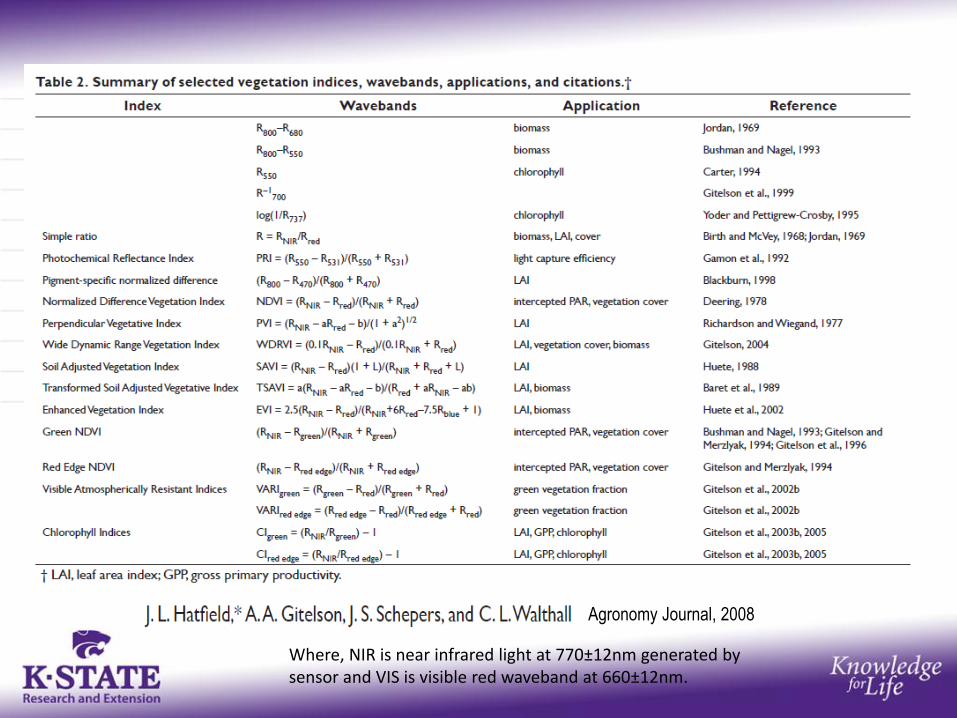
Agronomy Journal, 2008
Where, NIR is near infrared light at 770±12nm generated by sensor and VIS is visible red waveband at 660±12nm.
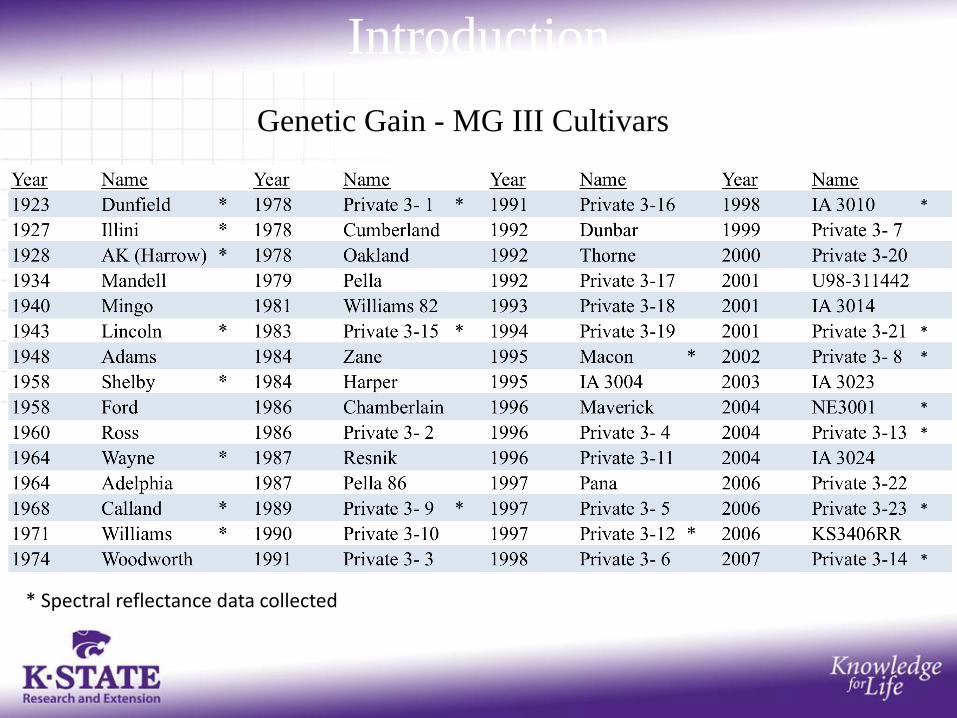
Introduction
Genetic Gain - MG III Cultivars
* Spectral reflectance data collected
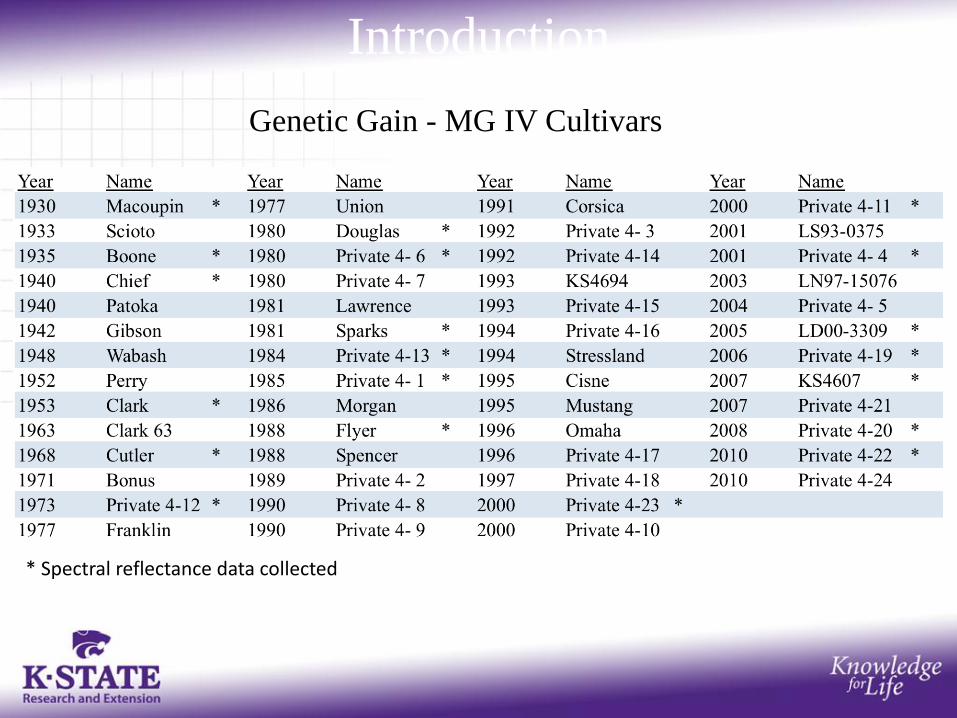
Introduction
Genetic Gain - MG IV Cultivars
* Spectral reflectance data collected

20
25
30
35
40
45
50
55
60
65
70
1920 1930 1940 1950 1960 1970 1980 1990 2000 2010
Yie
ld (
bu
ac-1
)
Year of Release
MGIII MGIV
Seed Yield and Year of Release
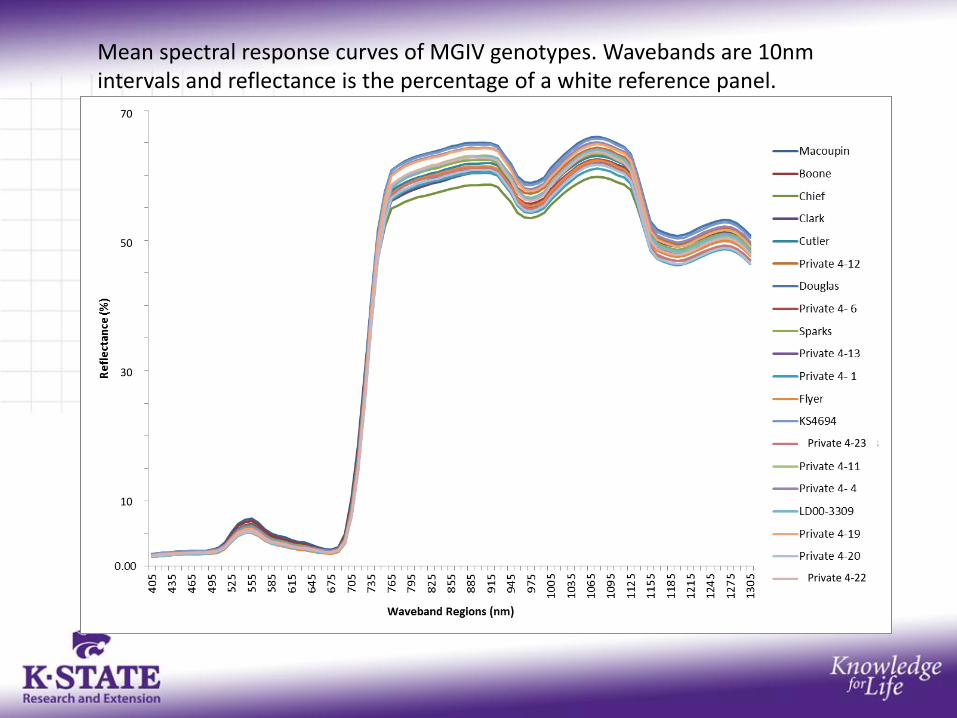
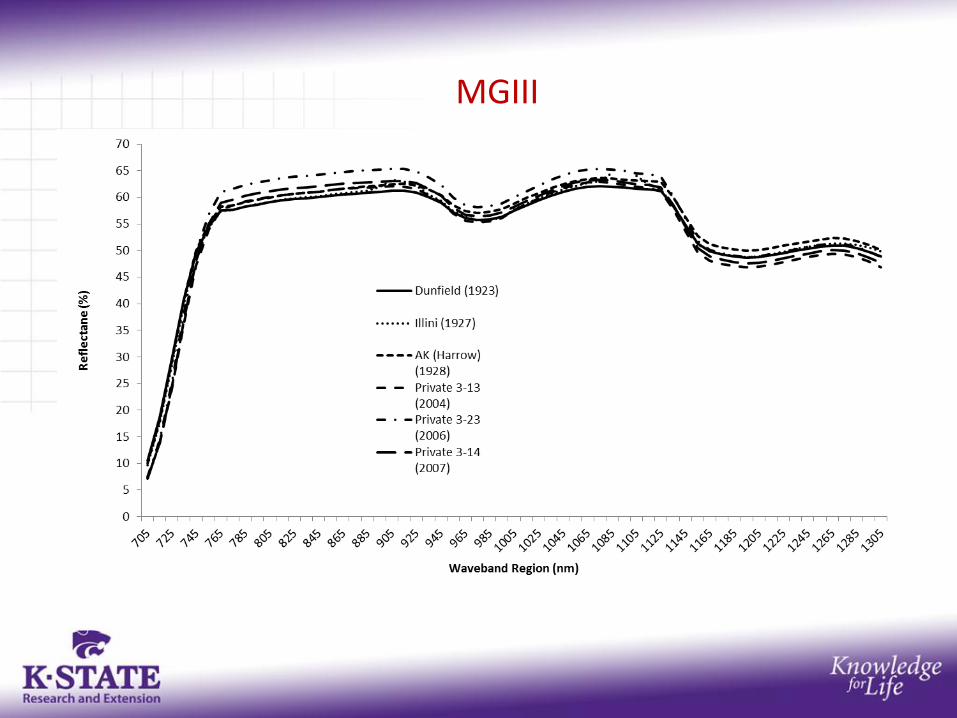
Mean spectral response curves of MGIV genotypes. Wavebands are 10nm intervals and reflectance is the percentage of a white reference panel.
Private 4-23
Private 4-22
70 50 30 10
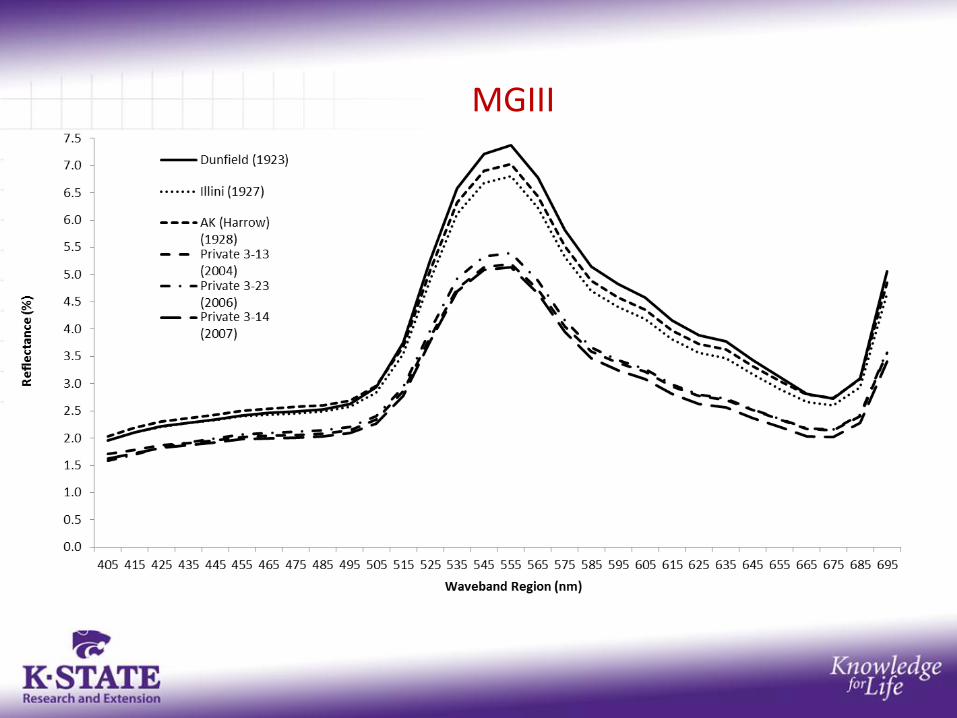
MGIII

MGIII
-1.00
-0.80
-0.60
-0.40
-0.20
0.00
0.20
0.40
0.60
0.80
1.00
40
5
43
5
46
5
49
5
52
5
55
5
58
5
61
5
64
5
67
5
70
5
73
5
76
5
79
5
82
5
85
5
88
5
91
5
94
5
97
5
10
05
10
35
10
65
10
95
11
25
11
55
11
85
12
15
12
45
12
75
13
05
Co
rre
lati
on
Co
effi
cie
nt
(r)
Waveband (nm)
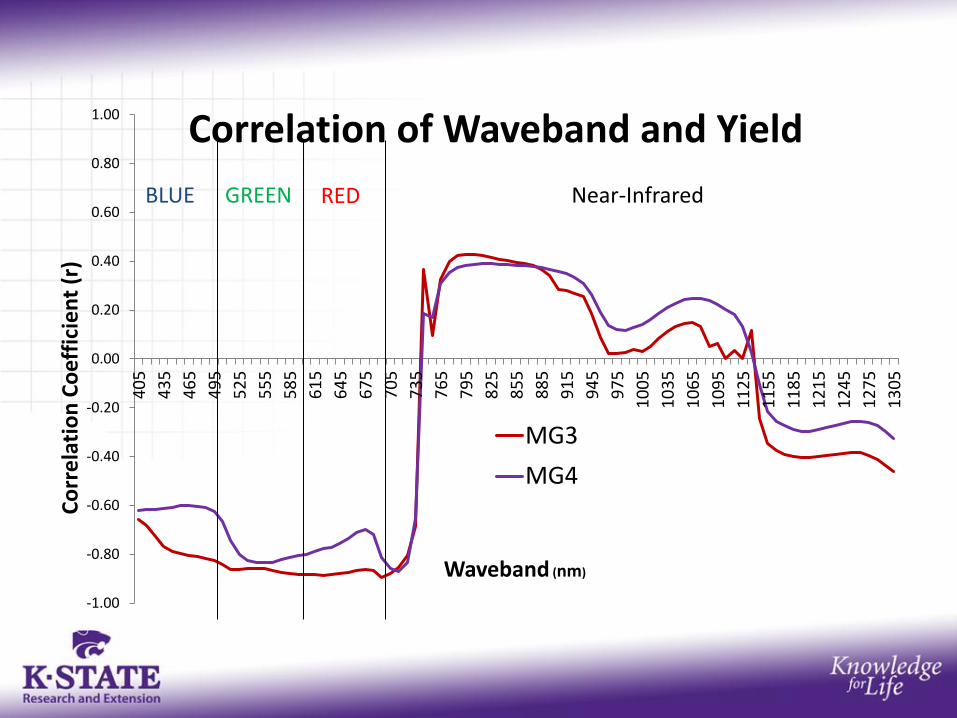
Correlation of Waveband and Yield
MG3
MG4
BLUE GREEN RED Near-Infrared
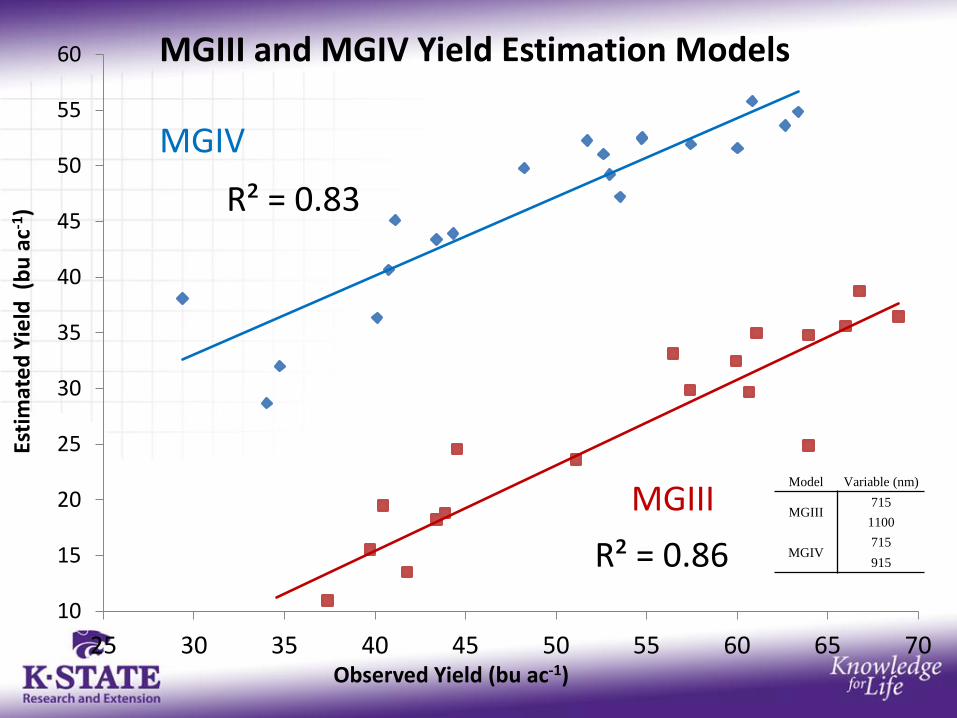
Model Variable (nm)
MGIII 715
1100
MGIV 715
915
R² = 0.83
R² = 0.86
10
15
20
25
30
35
40
45
50
55
60
25 30 35 40 45 50 55 60 65 70
Esti
mat
ed
Yie
ld (
bu
ac-1
)
Observed Yield (bu ac-1)
MGIII and MGIV Yield Estimation Models
MGIII
MGIV
MGIII

0.75
0.80
0.85
0.90
0.95
25 30 35 40 45 50 55 60 65
Cal
cula
ted
Ind
ice
Val
ue
Observed Yield (bu ac-1)
MGIV
NDVI 900,680
NDVI 780,670
NDVI 815,615
NDVI 760,615
GNDVI 780,550
WI 970/900
r = 0.79
r = 0.90
r = 0.87
r = 0.82
r = 0.83
r = 0.78
29.5
30.0
30.5
31.0
31.5
32.0
32.5
500 1000 1500 2000 2500 3000 3500 4000
Can
op
y t
emp
eratu
re (
oC
)
Seed yield (bu ac-1)
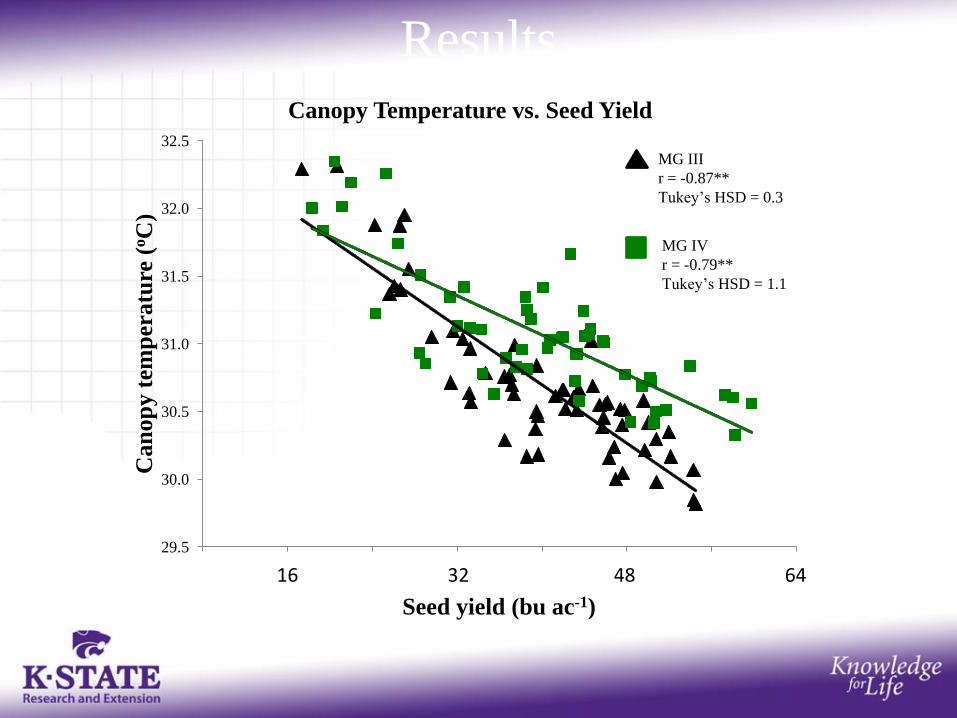
Canopy Temperature vs. Seed Yield
MG III
r = -0.87**
Tukey’s HSD = 0.3
MG IV
r = -0.79**
Tukey’s HSD = 1.1
Results
16 32 48 64
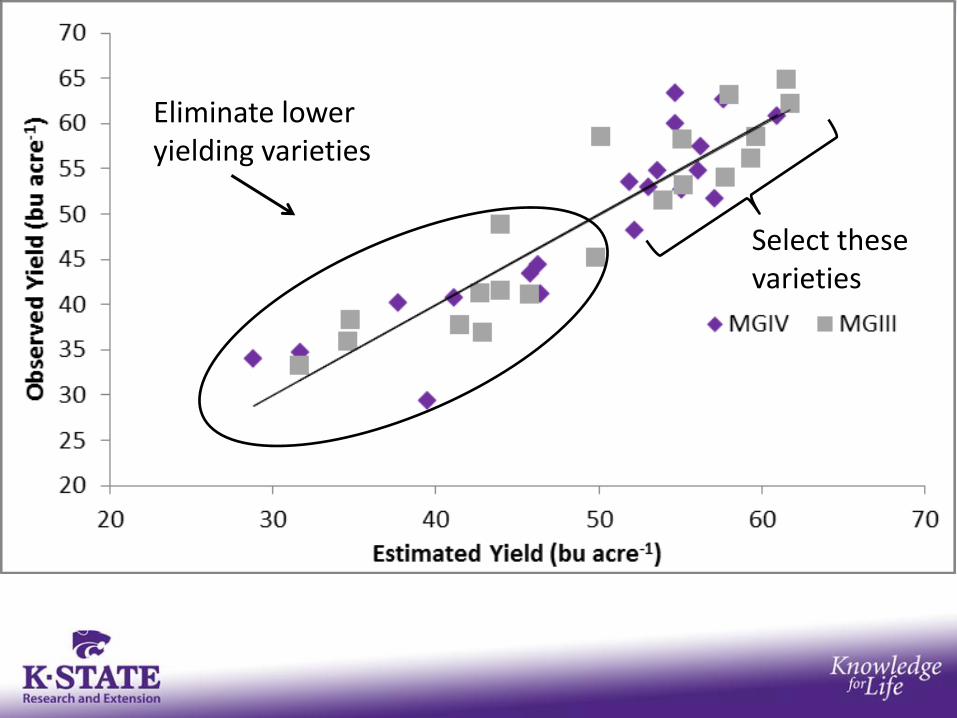
Select these varieties
Eliminate lower yielding varieties

• Higher yielding varieties have lower reflectance values in the VIS and red-edge spectra portions and higher values in the NIR portion of the spectra and lower canopy temperatures than lower yielding varieties.
• Canopy temperature and canopy reflectance measurements can account for a large portion of variability in seed yield among varieties.
• Attempting to build upon these results to develop applications in high throughput phenotyping.
Conclusions
Acknowledgements Agronomy • William Schapaugh • Brent Christensen • Hatice Aslan • Randi Clark • Kevin Price • Nan An • Vara Prasad • Russell Dille • M. Djanaguiraman • Nathan Keep Statistics • John Boyer • Leigh Murray • Nick Bleodow Plant Pathology • Tim Todd • Tom Oakley Vet. Medicine • Deon van der Merwe

K-State Research and Extension Soybean Breeding and Genetics
Thanks for your support!
Questions?