Application of Multispectral Reflectance Studies of Soils ...
12
Purdue University Purdue e-Pubs LARS Technical Reports Laboratory for Applications of Remote Sensing 1-1-1980 Application of Multispectral Reflectance Studies of Soils: Pre-Landsat S. J. Kristof M. R. Baumgardner R. A. Weismiller S. M. Davis Follow this and additional works at: hp://docs.lib.purdue.edu/larstech is document has been made available through Purdue e-Pubs, a service of the Purdue University Libraries. Please contact [email protected] for additional information. Kristof, S. J.; Baumgardner, M. R.; Weismiller, R. A.; and Davis, S. M., "Application of Multispectral Reflectance Studies of Soils: Pre- Landsat" (1980). LARS Technical Reports. Paper 49. hp://docs.lib.purdue.edu/larstech/49
Transcript of Application of Multispectral Reflectance Studies of Soils ...

Purdue UniversityPurdue e-Pubs
LARS Technical Reports Laboratory for Applications of Remote Sensing
1-1-1980
Application of Multispectral Reflectance Studies ofSoils: Pre-LandsatS. J. Kristof
M. R. Baumgardner
R. A. Weismiller
S. M. Davis
Follow this and additional works at: http://docs.lib.purdue.edu/larstech
This document has been made available through Purdue e-Pubs, a service of the Purdue University Libraries. Please contact [email protected] foradditional information.
Kristof, S. J.; Baumgardner, M. R.; Weismiller, R. A.; and Davis, S. M., "Application of Multispectral Reflectance Studies of Soils: Pre-Landsat" (1980). LARS Technical Reports. Paper 49.http://docs.lib.purdue.edu/larstech/49

i
_ !tit'
LARS Technical Report 060280
Application of MultisRectral Reflectance Studies of Soils
Pre -Landsat S. J. Kristof, M. F. Baumgardner, R. A. Weismiller & S. M. Davis
••• f lll ... ' ... " •••••••• f' • F1I' , ..... .(, .... t"£ ................. . • "" """ll •••••••• ff,. .... 1.1llFff I ••••••• ••• -.f •• •• fff'u .. u ••••...• ff' ..... " .. U', ................. . f 1~~ .. mm,···::: ::t~:::: rf mf: ~ i:::::~::: ii:i:~: fWIlljU' IF •••• If ••• U .. 'U .. '.I •• - ••••• • •• If ••• ,
... t 1 UI'-.. !:::;:w'·"'m·~::::i::::::::~1i~f .h ... , • .I II I,Uu .. /ff,I .. iizl, .... L .•... I ••• , •••• ff,J 1/ .fl""'llllll' '" •••• f." ..... ll' .. ' •••••• I ••••••• ff .... ,.
.. £wJwIJllllll .. l=h/:;-:m',m~m~::::::::::~:::~=n~ f .•. U ..... f 11 1 .. , •• I.-IIf ... 1l ... UI ... I •••••• f •.•••... ff .. 'ff' ... /llll,l ' .. , .. ll ••• 1-·.·'· .. , .... , .. , ................. I.'. ffff'" .. , I i ...... ···,··-·/ff/ ..... , .. -... "ffi········,-···· fF." .. ,".fl 'IOF'f' •• ··fFfF'lf""' ........ ", .••• _ •• _ •• 1 •• _ .fU"'''' ...... ,.., IlI-fl' ...... ,llU ........ " ... , ••• _ ••••• I •• fF 1I .. 1f #'1"" d"ffp .. ' ...... F/"""FII' .. ,Fl-I .,"S'Flf •• f ••••• f ••••
• ~f ~1~1.1 ~H ",J .... fm:~m=:~~;IF~£;~;;!!I;F~m~: ::; ::~;:i{{ f-HZZ .. ,,, ,11 I1ff' 1 .... I .. I.." .... Fl" .... , •••••• f.fFF' .••••••. IlIJ mmll'I·IWi!I:lf .. ~M£= .. ~ .. £;;==mmf!!:!::!:FHiFf.::::::i~f'l~ ' .... 1'.. I I' f 1 ................. .. , ...... ' .... l.I •••• I •• -ff.' •... I •••• fFl I 1/1 If I MlF """"" ...... '''"''M/1, ••••••• - •• -/flf ••••••• flllll
~~ I~~:~f J:IIIIFJf:=A~~~~~:~=::=~:~s~~ i:: :': :::: ::~i :::::::: i ill',I'{ FFF 'lfIF.UM'ZF ""FM""FM-Z""'M __ ""-"-ff 1.1 ••••• -1 •• -1.1 ••• Flll I ."'"F ZII-MFff' .... l-.. '"" .. ""F.'.,'I""-Mfff-I •••• _ ••••••••••••• Zll II """II"'fl-I/F '""'II""FIlI""'""""""'-/FF"" ••••• - ••••••••• F lllil
l""'lf '''1' If'''F , ............ , ............. " .. "" ..... ,.. " ••••••••• 1 •• 1 fF "i' II ' .. 1I1U·1FfI'F u .. ., .... ' .... , ....... " .... /ff ..... Ff. • •••• - ••• fl •• F 'I'lll 1{1 ~~Hm~,,~~,~mm=m===m!;:!!!~!:.:::::::!:;::::::~.mmll IF 1'''IFFff-,. "'M .. ' .... , .... "FI'. F •• F .-1-. F ••• • /F .I-.".Ff .F I flU II II IF I •• 'U'll'F"~ .. l .. " ........ ll.l •• I •••• I •••• - ••• I.ILZ'ffl.F 'fl 1 '''/l11'''' 1l11 .... lllM' .. " .... ..,.F. I If •• -1.1 .-1. FfF .. " IF", .•• F l',Ull lI"l'!l # U l , .. U ........ " .. I .. , .... FI.F I I I •••• ",. """.F If.,l. F If'' Uf' ~f~£b~,~~:~~~f=m=i .. fH::::F~~~~;fFftf~mmi:{U~!::~ii(({~I 1I11 III IFfF"'F""l11ll""'III ••• 1 "FF. '.'"ZfF U ... llUi"'" UZ Ull lljl',.I'Fffllllllll." .. I.,I.,.. Ffll' I.FFf'"U"'''U I' Z"ll' zp .. U " .. f·)·IIFfI"II, ........ F·~··'fI'/FfFfFlF' ...... ',fJqiz llllllhl" , C' t:m .. H ml .. ld~.:~f!mm:f!~mmll h,'ffHHh .. l1 i 1flf/.lFIIll .. , '''" f/.fI •.. 'FII ••• Z'''/FU .... Z. ,"ilf llU'lillF'
•• 11 'i/fF""~{ ,,",F I 11 •• 1' ••• I I 1I' ........ ll .. U, IfFF i lUll! {llllli • •• , fm~ !m=:F1lwf~·:::ii:!~~:~~m~~~rz:fH~!~~zt,FHflHf~:f:::: •• 1I.1Z111l111F .. l 1 •••••• 1 ••• 1 •• IF'. FlI/I-F.I .1fllllUll .. ,Fll'", ·:il:f;f;JmH~I~:;I::i:::::i~;:i~~!~~~:;:~F:ffH~fm=ll=~~:;fi:: I •• F. fFF lu, .... ,lF •• t ••••• fl •••• •• f •• 1 I I.' I .1 • • Ff, U OF' lUU F"" •••
' •••• F ,,", lMt U "M/"/F. 1.1 • ••••••••• • -FF.,I·/F-.F .FF, III "MMF 1M' " •• f • •• Ff "'1'''11'11/1 •• , •• 11.-•• ••• • 1 ••• -Fl •• -.F.FfZ .1 .. Ffli ff""fi ' ••• '.Hl ' .. , .......... ' •• , •• II-II ••••• ,-.-·,-,.·, ... If ..... I.ll 'i'lf . • fFff'FIZ"Ml,,""," "'·,l,'-F ••• ".,-•• -.-•••••• I •• ""Ff'I_ .. ' Fll II
::;:m~=fm~H~t~'t'~Wf~~:~~i*f::!!~::::~::f:f:~~~~f~~~£~liilH .FFFfMfII"ZMMI, •• U',lf ... III .. "' fIIM""""FM" ••••• - •• - •••• f. "'ffFF/"F If Il l' .ff"H .. '"I11 .. 'FfFFFJllF ""ll"UFII •••• - • • '.1 .. I •• fF.fF/fF .F-" .. . fI'"' ff'M/. II.lFflFF 'lU,,'ll' U' 1 •••••• 1 •••• I ••• • ff' .FFF'FI-ffFlF 'ff""l1 UZZIll'll.FF l'IIIIZ .... """ .. F ••••••••••• ,fFfFFFFF .. F." 'J'll .Fl .. U"'f,",,·,·Uffl 1 .. Fllfllll.II •••••••• I •• ffFf''' •• FfF fl • • Hl11I" 1I11 •• IfFF'F U/"/F .... " 11-1 ••••• - ..... , .FfFF"F "'f'''' :mA"il{flf'i~~m'lfll FIIJ'H~;~Hi~~~ii~:::::::~;:Jf~~m~~~Ff'fMii Fn.... ,. .. 1 ""M' If l" •• '.I-.FH-I •••••• ff.FFfF."FMFF If-II FFffl '''I ""Z,," " 1.t: ••• - •• I •••• F •• - •••• F-FFF-1FFflllMKl •• """M"'''ZZ z"ll'l Iii .. I.-, ••• -.I ••• -.I •• FF.-fF-Ffl'l"ZI.".I F.. , .... " fIIN= , ",,' ••••• - 1 ••••••••••••• , •••• "-fF FIFFI F.' ,lfllfFlfHffffi IMi If/L •••• ," •• f • • -, •• , •••• /F.-.fFFUF-lll' ••• r! h 'M 11 1 h.. 11 ••••••••••• - ••• - •••• I-F-IlIFlllFF f •• -1 MZ .. l .... ' .. 111111ZZlll Ill' /I •••• 11 ••• 1.1 •• 1-• •• I-•• FF.IfFF .... I •• _. ~MIF"/1"'''F 'PI HI'" 1
' .... , ' I , •••• 1 I ••••••••••• -1 .-••• 1.' .''''ff ••••• _
~~l=~f =~m~M "11 m~~J~Mlm.:: ::::::::; ::::i::::;::!~~t:::;;mffJ~~~ l"l"'l1111M'l "' •• FFIIII ••••• ••••• •••••••• F •• - •• -I ••••• ' •••• FFl/f • • FJf .... -fF .. U.1l I I I •• FFI.lfl •• I •• 1 I •• - •• --1-• • - •••• F ••• ,. F •• -fFFFf. 'I Ilf 11I1.1.' •••••• I •• , •••••• II ••••• --•• If ••••• _._ •• _.,'_._ •••• I MFI" II ••• F •••• '.I •••••••• I-•• I •• ,._I ••• F •••• _ •••• _ 1.-••• ,., """l F lllll' •• I •• f/.F.I •• 1 ••• 1 ./f. ~Ff • • /F'.' • • ' •• F-F •• _ ••••• F/ ••••• f
m~f~;;" :: i!: ::~iJ ;t~:~: ~t ;~~F~F ~~:~~mti:~m:F:::::' :~::::::IF .... /M .. f .. / ••• 1 •••• I I I 11 .... Ff IFF ZIf IF I IFfM"fFFFFF ll' .... fff •••••••••• "1 ...... , /11 •• 1 •••• I.F •••• M.fFlil U .fF/F'FFFffF''''''-.. -F'''-'_lF •••••••• 'JHPII' •• ••••• ••• 1 •• 'ff.,111 11111 I .fflff, .. F-Zl-F_'FFFFIf •• "1" flJU:;:{::::::::::;f':~:mm~'~~~~·Ff~~m~!;::~~~~m:F ~f lUlii II.I.f •••••• ff.Fflllll" I.-I •• ,J-, .. FFFF/.Ufl I ••• •••• nil FF "'''ll1l1l ••• ••• •••• IfFll.llI11 1.1 .f ••• 1f .11 .FFII .1.--•• •••• f.'FfFFf
Laboratory for Applications of Remote Sensing Purdue University West Lafayette, Indiana 47906 USA
1980

LARS Technical Report 060280
APPLICATION OF MULTISPECTRAL REFLECTANCE STUDIES OF SOILS: PRE-LANDSAT
S. J. KRISTOF 1 M. F. BAUMGARDNER1
R. A. WEISMILLER AND S. M. DAVIS Purdue University/LARS
I. ABSTRACT
It was recognized in the 1960's that measuring the spectral, spatial and temporal variation of electromagnetic fields reflected and emitted from the Earth's surface had many potential applications in the field of agriculture. As a result, computer-implemented pattern recognition techniques were used to analyze multispectral data for the purpose of delineating soil differences. Spectral data were obtained (1) in the laboratory by scanning soil samples with a double-beam spectrophotometer (Beckman DK-2A) and (2) in the field by scanning large areas of soils with an airborne multispectral scanner.
The results obtained through this early research clearly illustrated relationships between the reflected and emitted energy from soils ar.d other physical and chemical properties of those soils. The possibility of sampling large geographic areas and obtaining information about various soil parameters within a relatively short time period appeared to be of great value to potential users, i.e., soil surveyors, soil conservationists and other resource management personnel.
II. INTRODUCTION
In January 1966 the Laboratory for Applications of Remote Sensing (LARS), Purdue University, was chosen by the U.S. Department of Agriculture, in cooperation with the National Aeronautics and Space Administration, to develop rew.ote sensing, pattern recognition techniques for applicat jon to agricultural and forestry resources. Investigations were initiated in the study of spectral, temporal, and spatial reflectance and emittance characteristics of plants, water and soils and other. agricultural features S,1O,ll. The principle that energy is either absorbed, reflected, transmitted or emitted from
objects in specific wavelengths in amounts that are characteristic to a particular kind of matter suggested to soil scientists at LARS that many soil parameters could be measured through the use of their spectral variations~~e.
W. L. Kubiena 9 , world renowned European pedologist, wrote in 1938, "Pedology as a natural science, after a promising start, still is developing slowly. We are not much further with pedology in its present stage than we were in the middle of the last century." Kubiena repeated these words about pedology when he visited Purdue University in 1965, one year before LARS was established.
In contrast to Kubiena's statement, now we are able to say that within the past decade significant advances have been made in the development of airborne and satellite-borne remote sensor systems which make it possible to obtain vast quantities of earth resources data over large geographical areas within a very short time 7
• Such data acquisition capabilities, coupled with computer-implemented analysis techniques, provide a rapid capability for inventoIYing and monitoring earth resources~b~ • Instrumentation in this research to measure the radiation properties of different soils in the various portions of the electromaqnetic spectrum included a DK-2A spectrophotometer and an aircraft optical-mechanical scanner.
III. SPECTRAL CHARACTERISTICS OF SOILS
Laboratory studies were essential for developing an understanding of energy interactions with the soil. In one important study spectral measure~ents were obtained on 250 soil samples representing tWtnty-two soil series, ten textures, and four drainage profiles. In addition, samples of betonite, muscovite and kaolinite were investigated. This study provided informatic:n
1980 Machine Processing of Remotely Sensed Data Symposium

about which wavelength bands were useful for observing spectral variations in soil: additional knowledge was gained about the influence of some chemical and physical soil properties on reflected energy. Wavelengths in both the visible and infrared portions of the spectrum were found to be important. For eX3mple, the 0.58-0.61 \.1m visible band was found to be extremely useful for quantitative characterization of soil col~r. Soil textures were best differentiated in the 0.73-0.76 \.1m and 0.88-0.90 ~m spectral ranges. The potential for using reflectance measurements to determlne soil moisture contents was shown by analysis of the three water absorption bands, 1.43-1.45, 1.62-1.65 and 1.91-1.94 \.1m. Bands at 2.07-2.09 and 2.16-2.19 \.1m were especially useful in quantifying the clay content of the soils. In both bands the high reflectance values were related to the soil with generally less than 20% clay and less than 2% organic matter.
Descriptive information for three soil series is presented to illustrate some of the important soil differences among the soils studied (Table 1). Reflectance values for air-dry and moist samples of these three series were determined for eight wavelength intervals (Table 2). The Raub, a dark colored soil with high organic matter content, gave the lowest reflectance values for air dry soil in all wave~ands. In general, an increase in water content results in a decrease in reflectance for all wavelengths for all three soils, although the decrease was most pronounced for the Miami.
IV. INITIAL SOIL INVENTORIES
The use of digital analysis of multispectral data appeared to be a useful aid for mapping soils. Therefore, a study was designed how this new technology might best be employed to discriminate meaningful soil boundaries in the field.
Table 1. Descriptive information for three 50il series.
Niami Fincastle Raub
Texture silt silt silt loam loam loam
Native forest vegetation forest prairie
Water holding medium high very capacity high
Organic matter low content
medium high
Natural well somewhat somewhat
drainage poorly poorly
Structure coarse medium moderate granular granular granular
% moisture in air-dry 2.5 1.0 2.7 samples
% moisture in moist 33.9 49.9 59.1 samples
Surface ye l.lcMish- brownish-very dark brown gray color
10YR 4/2 10YR 3/2 10YR 2/2
An area (SAl) of bare soil in the central part of Indiana (Norgan County) was selected for this study. The soils are primarily Alfisols and Mollisols developed under dense forest cover in Wisconsin glacial till, outwash or eolian materials. The multispectral data over SAl were collected on 28 April 1967 from an altitude
Table 2. Reflectance values from soil peds of three soil series, air dry and moist.
Wavelengths Miami Fincastle Raub in \.1m
Dry Noist Dry Noist Dry Moist ---,--
0.58-0.61 22.7 6.2 22.5 13 ~6 12.3 5.7 0.73-0.76 29.8 8.5 29.9 19.8 17.4 9.1 0.88-0.91 34.9 10.4 34.5 23.4 24.1 14.4 1.43-1.45 46.0 8.0 46.0 16.5 39.5 11.8 1.62-1.65 48.8 13.1 49.0 29.7 43.3 24.3 1.91-1.94 52.2 3.8 48.8 6.0 39.7 3.4 2.07-2.09 54.5 8.7 52.5 17.3 45.3 11.8 2.16-2.19 54.0 10.8 50.6 21.8 43.7 15.8
-2-
1980 Machine Processing of Remotely Sensed Data Symposium

"
of 914 meters in 18 wavelength bands. Also aerial photographs of the study si~e.w:re taken within a week after the acqulsltlon of scanner data. The photographs were used to locate ground features such as soi~ patterns, vegetative cover and water bod~es. Based on the grayscale output of the lnfrared channels, ten areas were selected for training samples. Eleven wavelength bands were used in the analysis: six visible (0.40-0.72 \.1m) and five infrared (0.72-2.60 \.1m). Three surface features, green vegetation, bare soil and water were easily identified and mapped by spectral analysis (Figure 1).
Figure 1. Aerial photograph and computer printout of green vegetation (I), soil (-) and water (H) (Kristof, 1971).
Since dark and light soil patterns can be seen on aerial photographs, a new training set was selected from the bare soil areas only. The computer was trained with new data from the dark and light colored soil areas. Vegetation and water cl~sses were excluded. The resulting spectral map of the dark and light colored soils in the study area compared well with the variations in the dark and light colored soil areas on the aerial photographs (Figure 2a). A training set was then selected to produce six spectral separations using similar techniques as described above (Figure 2b). On closer examination of the aerial photographs a good comparison exists even in this more complex case. A thorough study of the data revealed a large standard deviation in the reflectance of some spectral classes of soils. This suggests the possibility of using spectral properties to delineate even more soil differences.
Another area (SA2), containing several large fields of bare soil, located about 5 km from the first study area, was chosen to determine whether the classification technique and accuracy could be repeated. In this area an additional large spectral variation existed among the soils. Even with this more complex spectral situation,
-3-
,
~ lIf· .. , .~:. -,~., .
/ . -... "
,~ 'i~ ," t l f
~ ,
,~
• • "' I' \; r
t~ #, ) 1. ~, ,
'i ' , . il' ~ f' '{' - . 1.'1'
~ - ,. _.j , -ij
a. b.
Two spectral classes Six spectral classes
Figure 2. Spectral classes of soils of S/U (Kristof, 1971).
the soils were easily classified into a larger number of spectral classes (eight instead of six).
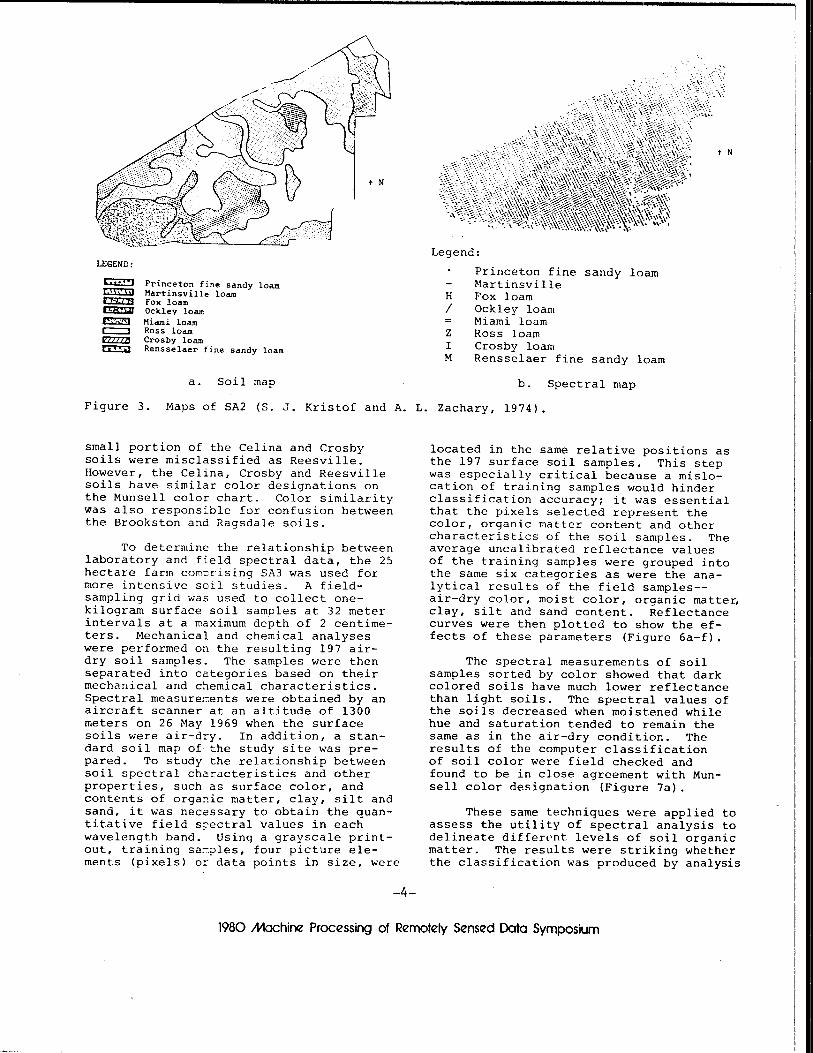
The results were more striking when the computer classification output was compared with the conventionally prepared soil map where the soil hac been delineated on the basis of morphology, color, structure, drainage, and texture. The eight spectral classe~ of SA2 corresponded reasonably well to the eight diff e rent soil series shown on the conventionai soil survey map (Figure 3a and b). This study illustrated that soil surface conditions can be delineated with reasonable accuracy by spectral analysis ..
A further attempt was made to map soils in a transitional zone between prairie and forest soils in Tippecanoe County, Indiana. Two soil areas, SA) and SA4, a few kilometers from each other were chosen. Both areas containe d Alfisols and l-101Iisols. Multispectral data were collected on 26 May 1969 from an altitude of 1300 meters. Each data point represents an area 16 x 24 meters. Eleven wavelength bands were used in the analysis: six visible (0.40-0.72 \.1m) and five reflective infrared (0.72-2.60 \.1m). Training and test samples were selected from the grayscale output in the 0.72-0.80 urn band. The sample selection was based on existing conventional soil survey maps. The area SA) was classified into 9 and area SA4 into 7 spectral classes. Reasonably g ood agreement exists bet .... 'een the soil survey map and the spectral map of SA3 (Flgure 4 ) . The separation of two liaht soil s , Xeni~ and Russell, which differ only in subsurface drainage, was not spectrally separable.
The soil map and spectral classification of the area SA4 aoain illustrate similar pattern delineations (Figure 5). A
1980 Nochine ProceSSing of Remotely Sensed Data Symposium
LEGEND:
Princeton fine sandy loam Martinsville loam Fox loam Ockley loam Miami loam Ross loam Crosby loam Rensselaer fine sandy loam
a. Soil map
Legend:
H /
Z I M
Princeton fine sandy loam Martinsville Fox loam Ockley loam Miami loam Ross loam Crosby loam Rensselaer fine sandy loam
b. Spectral map
Figure 3. Maps of SA2 (S. J. Kristof and A. L. Zachary, 1974).
small portion of the Celina and Crosby soils were misclassified as Reesville. However, the Celina, Crosby and Reesville soils have similar color designations on the Munsell color chart. Color similarity was also responsible for confusion between the Brookston and Ragsdale soils.
To determine the relationship between laboratory and field spectral data, the 25 hectare farm cOID8rising SA3 was used for more intensive soil studies. A fieldsampling grid was used to collect onekilogram surface soil samples at 32 meter intervals at a maximum depth of 2 centimeters. Mechanical and chemical analyses were performed on the resulting 197 airdry soil samples. The samples were then separated into categories based on their mechanical and chemical characteristics. Spectral measureGents were obtained by an aircraft scanner at an altitude of 1300 meters on 26 May 1969 when the surface soils were air-dry. In addition, a standard soil map of the study site was prepared. To study the relationship between soil spectral characteristics and other properties, such as surface color, and contents of orga~ic matter, clay, silt and sand, it was necessary to obtain the quantitative field s~ectral values in each wavelength band. Using a grayscale printout, training sa~?les, four picture elements (pixels) or data points in size, were
-4-
located in the same relative positions as the 197 surface soil samples. This step was especially critical because a mislocation of training samples would hinder classification accuracy; it was essential that the pixels selected represent the color, organic matter content and other characteristics of the soil samples. The average uncalibrated reflectance values of the training samples were grouped into the same six categories as were the analytical results of the field samples-air-dry color, moist color, organic matte4 clay, silt and sand content. Reflectance curves were then plotted to show the effects of these parameters (Figure 6a-f).
The spectral measurements of soil samples sorted by color showed that dark colored soils have much lower reflectance than light soils. The spectral values of the soils decreased when moistened while hue and saturation tended to remain the same as in the air-dry condition. The results of the computer classification of soil color were field checked and found to be in close agreement with Munsell color designation (Figure 7a).
These same techniques were applied to assess the utility of spectral analysis to delineate differpnt levels of soil organic matter. The results were striking whether the classification was produced by analysis
1980 Machine Processing of Remotely Sensed Data Symposium

I
Legend:
Fincastle silt loam Xenia silt loam Russell silt loam Toronto silt loam Brookston silt loam Brookston silty clay loam Kokomo silty clay loam Metea sandy loam Del Rey silt loam
a. Soil map
·/iHi:lli··:::~:::::!:!:~~~~=~==~~:~::=~:::Mt latHHI-IH -llltl ••• IIIHI"IM~H"H"HHIH""" IIHH1IHMI .llll.l.l ••• IHHHIHH""H"H""H"" .11IHIH".- 1.1I.I •• l ••• HH1-11""'I"H""1 ··IIIH"IH.I- .llllll ••••• I"t~"HH"HHHHH ···IHHHH· •••• llll1111.11.11·"I"""H""" 1 ·-HHHIH I •• 11Ill'.I.l ••••• IM""""" i:·i!~I!~~~~~:ffiii~~iiil::;~~~=H" .•• ··.IIHH·"""""I/.IIIIZ··I"""
·--IIII,,·IHIHHI""·lllll···IH' • . 1-111IZ-.II-JHHHHHHl/aE.·.H" .1 •• 1 •••• ···1"""""'"" .• IIH
'.-I.II, ••••• J"HH"H~"HIHHHHH .1.1Illll····H""HHH~"HHHH""
.. l .. ····""HHHHHH""""""" 'Hllllt •• IIH""" "11~H"""M"1 i ·I·· •••• HH ~""."""H"M.M iHHI·I····HM HHHHHMHHHMM"" iH.II •• IHHI ItM"""H"HI"" iHllH •••• IHI"""""" !/.·I· .1.llll .·IHIIHH"" .-l.lll.-1 llllll' III.""" l-ll.l •• lllll.lll •• ·.··I"
·-.llIlllllllllll •••• H"""" ••• l-l-l-l •• llll'····MH""" - •• - -I 1--1.-••• 11M""" --III-----l'.'·····I"MHH""1 1--------.11l- •••• MHHHM" -.1--1 - 1/.1- •••• 11""""" ----- -••. -l".=-"HHII""_ -----llll·l/ll··IHel··H" • • --.-lll.llll'llll/l" H ---lll·l···HI.III/Il.·· • • -l •• -.l·.I··IIIII···· :z~-:l~iili~:;::ifi:' -l-.-I.ll-l ••• 1'1" -- - •• --- 1-· ••••••
••• -ll-I -"'.11' .ll-•• /Z.I-" 'H -.,,-.Z,Z-Z···H' 1l.1I •• I •• I.·.H
-1-fl· •• III··· -.1 •• • MHIHH."" 11l.llll··HM-H 1 •. ·11111 .. " l-.HIIII"HH •••• HIHI·H"" H'I II I··IH • . ·,tl·.·.H" 1t11·1--H.H '"I I 1'1" 1I'1I11 HI 'HI I •
• ~I' I.' 'HH I .. " ·HH :1
Legend:
Z Fincastle silt loam Xenia silt loam Russell silt loam
I Toronto silt loam H Brookston silt loam H Brookston silty clay loam M Kokomo silty clay loam / Metea sandy loam
Del Rey silt loam (Blank areas indicate "threshold" points, no classification decision made.)
b. Spectral map
Figure 4. Maps of SA3 (Kristof and Zachary, 1974).
of reflectance (Figure 7b) or thermal (Figure 7c) data. It was found that the soils with more than 1.5% organic matter dramatically decreased soil reflectance throughout the reflective portion of the spectrum. Additional research has confirmed that multispectral measurements can be used to map different levels of soil organic matter.
Variations in soil reflectance can be affected by the relative proportion of clay, silt and sand in the soil. Spectral data showed a distinct decrease in reflectance with increasing clay content. On
-5-
the other hand, reflectance curves for silt and sand contents showed a significant increase of reflected energy when the amount of silt and sand increased.
One of the methods commonly used to assess classification performance is to determine the percentage of all pixels in n training set which are correctly cln:,sified. The following classification performance was obtained for the spectral analysis of training sets of SA3 to identify the six soil parameters:
1980 Machine Processing of Remotely Sensed Data Symposium

color, air-dry color, moist organic matter content clay content silt content sand content
LEGEND:
! .. ,.: ... ~: .. ..
-~ ..... ',~ ...
Ragsdale silty clay loam Brookston silty clay loam Brookston silt loam Toronto silt loam
Crosby silt loam Celina silt loam Reesville silt loam
a. Soil map
96.2% 98.8%
100.0% 59.0% 66.5% 23.1%
These results were verified with aircraft scanner data obtained on 6 May 1970 over an area of 6000 hectares. With the previously used 197 training samples the entire area was classified into the appropriate organic matter level categories.
;~: flllllll .......... ........ Ff .fff ... ,.,.lLf'I,..t-' ........................... .. • MFF 11M' 111 ............ Ffff"'"f 1. IlIFf fl ................. -.f .... • .... f f 11111111l ... ............ FF fMM' Ff Mlill .................................... .. F .ff 111""11'1 ......... • /f .fff IIIIZl'If"lFf ........ -F ............... f .. f z. UH IllIll .......... FM.FFflll""lf .1 ............... • II.F .1.1 fUflllllllf If ... •• /F •• fllMlllf~l.l •• - ........ _ .. • /F ..... 11
. ",:ll'!'I!'j'!'!'!I-I~~:: :i:::\h '!I!'~m~:::: i::::::: :~ii~H .fFMFFM 1 1 1l1 •• /fFll"1 I l""I •••••• I ••• I •••• Hlll
" .flF IMf IUIUf Illl •••• F .. FFMM.lllMI ......... • 1 ........... • HMFflF ..
"m'!w!'!j1um=li I :i:~~m:!/m=~~:::::::;::~: ::~:~:~! f .. f.ll,,"";1 tllU~FI •• l.-IIF."FI FMIllM.I •••••• F •• F ...... fH
.... fFf IfJIIIllllllllF llllMZMll ••• 1-_.' FfMl"'"lI'UMff.f ............ - .. .. I.FF.
f;~~~~~t~~iiUiilii U~:~iii~:: :f:;:H=~~';"=!:H i:::::: ::~:i: ::~ F ; ~~~~~~/~~~; iliAii ~~:i=~!: ~~i~=F ~~~~~ I i ~~~~:~ ~I ~i~ :;::::: F: ~i: : F I-f If IF UF 11l1l11ll"UMIIIMI.M/FM.HMZ. J ... /Ff .. F"'''"'I .......... I ..... 11 ..
f MZ1"fMlff lllll"lf "'"ZI'~""IIM"""'1 MIll F IMf lfl--/Ff Ff IF .... .. • 1 ...... , .F II f f-lflUUI llFFflllf llllMM/M/MI/tl'MFllfM"' ........... HffH ....... -. _./UfF fMlfIClilliF IlF IIF IIlIMIZlMMMI-M"llll'tlllll-l • • F •• lf 1. .. ........... F UFI
1~:i~~HH'!~fll~i~:=~:=:=:i=~::~i::~~~:: ::i: :::~:i:~::,::: :~Filii lILFlf IFll HMIF 1l1"MM"UU'IMFf""LFMlll ........... - • • -IF IF .......... uf HUll MF lFF"F IIMllllfl""IM'''''''"'MM"""MM"flFf •••••••••• 1 •• -.- ....... 11lZll
~H ~~~il£~~HH~=~=~=~~~~:~:~~=:~~ ~ ~:Ii: i:::::: ~~ ::i: i::: HH Ii Ii ·=~:t~SFi:I'~~:~~~i":~::=~=:::=}~~/:::~f/.:: :::'::::::::::i· 1 UUh 1 M"IlF IMlF lUMF !"MM"MMl"FJIIF "'JIIIF """'JIII"""'F"l" •••• - ••••• • 1 .... 1 F f!1 iF Hl fMlIlllFlFF/fFl "Fl""l.ulll"""FJII"''''"/FFF"JIIFF ....... - .... Fl ... F •• FI 1 till ~~~i=il~A~~~~:~£I~I::~~::=~} i!i: ~~!~ ~:.:::::: :~: i::;::: ~~ 1~ f lif lii !'{l.'ffFf-!'.,""'."l."."' •. , .. , .-1-.' .... /f .I-.ff.ff .fl'j'!!"l!
, l.fFFllF ZF'"l"l"""'"MM"ll.I •• I ..... I •••• - .... I.lLllfFl.Fl F Ul F"'ll MFfllllMMlll"lMJII"'''''"l.F .11F .. .o--I.I.-I.FFFJIIFFZFMl • • FFIIllUl1 lIMlllll.l U/Mll"",,,,',,,",,,!M/ •. • .oF I. Fill ••• • /fFF IF"""' Iff ll. f If If I1F 11 fl""Z1'"."fFfl"'"'.' 1 Zl •• - •• fflf .. .. Il 'f llfF 'i' 1 I! fl .. ' i!jl!'l 1 1l1",f"lltMMZMll""lM"lMIII • .o •• FF/./FfFFFlf.Ut"""' JIll f.... F 1 I.lllllllfFFMlFMMlll11MMIIII ••• IIFff.' .FMIFF IlFMIll!!lf •• • 111 1l'!1 111111./fFFFl11111MFMMf.II./F.Ffltf/FfFfFMllMlMI1l lUlHl 1"!1' ""~l.l .fflf'li"".".' .1 .. fFlf/fFffflff"""flllllZ'lZ!!'"l I' ;1 II .lIfFllH! ,",,./It'' ·'' ilIff If/fffl'"'."!l!"lZ 'j!! If 1 1/ .. M/FMMf ll"'llfl .... /F.ltFfffFf-MllMfU'" Z lllllli lit f 1 fIll. 1 F"11M 111M"11/.1' ••• F fll.·f IF "' IF 11""",lFfF IlllF 111Z1111/lFF f
•• 11 1 .. /FFFIMFZlltMlFII 1I •• If •• • III1FM"MtUZJIIUlIFfF J lUll Ullllll ••• Ff
F{~~~I!~m~mm~::::ii:~~~~~~m~m,m5~~~~,HH!!!H!~=!::::: •• 1/ .. 111111111fMl1 l ....... 1 .... 1 •• lff.flll'-F .I.IF 1111Z111"lFl1f.F ••
.. : il :~;~ il~~~~i~ I~ ~ if: :i::::: i ~ i: i ~~~~ ~~: i: ~f:F~H~ ~~~i:II=~~: f~f::: 1 ... F .. fFFIUZJII"zh •• l ....... f/ •• •••• F ... lll.II.I •• FFF11fFF1llllf"11 ••••
I ...... f FFMF IMlll MM/""f .1.1 .......... ..... -F Ff- II-IF -.F'OF f F III ~ .. "'u 1 MF 11 •• F • f •• ff tff iF I"zz ZI !I·I •• 11. - ••••• • 1 • •• --fl •• --. f. f fl fl"H'i H.ff H·I . :;~Ff 1111="~:=7~I",i!i i ~ ~:: ~~: iF ::::::~:~:: ~::i ~~~:~~ f~ :!"~I~ i~ F 1 i j : :F~H~~=f~~{~iHt~~t ~::~H~:~~iff'::: ~~~::::~: :i::: HHEH~H11IHj .FFFf""'Ml"'Ml/."lf IIF"'"""f!"""'''''''"FMM ...... - •• - •••• F .IIFFFff/MflF II Iff fHFIl F"llllll",ffFFFF Illf ""'UJIIllFII •••• - • • F.I •• I_. FF. fF/FF .F-H IF j
.FlFMlffZM/ .. II .. IFF IFfllll1"11lFllFl ........ 1 •••• 1 ••• • FFf. fffFF/-FFFlFJ
~H=~i ~lH~H'~~~1 iH~fUHU~~~:~~~~: i i:::::::: ~~ ~n:: n~~~:: in f~ ~ i; II f~jJII1' ~ ~ ~Fi:~;~ ~~i j j 1!iii1~~~;'~'~~:~ i::::: :~;: .. ~;~~;;~:~ i~ Ii ~~)i .'ff·HUi"Il' 'Fui" f Fl"llf/'-"Il ........ . "ff.fff·VU'I" . ~; ~~~f I~=' f~'~'~f i It I~f Ill:. t::.:~: i ~~~:::: ::: :~!F~~~:~~~~F ~ 11 ~"i! ~: fF"M""'l",llIl)1,llF llllZlll ... 1. -1 ••• -.1 .... -.I ... FF .-Ff-fFlfIMII .. F/.I .
. , IMUF " .. "111 .... II1F 111""'/ •• ... • -.1 •••• ........ .o. f ..... "-F F llFlff l.f.F ·f ZZF!Fl!' II! !'./jZlll •...... I •.. ' .. - ....••.. If.- ... f .. -U.U,. I III FM F U" IFlll ..... I ....... -.f •• I-•• F.I-F-lli llLFFLF.t'-
: 1 "lJIIIM"lMIZU II 1 llUF lilif II •••• 11 • • • 1.1 •• 1- • • • 1-- • • FFf IfFF"" I. --.' : "MIF"/l"I"' 1111111",F 11"MIII ••••• 11 • ........... -I. - ••• I.f -F .. FFF .. F •• F-
;=:1:'1 =A~~S:~~i Ii ~'~J~MI~~~~:::::::::: i ::::'i:: ::; :~: :t:::;~:~F;;I~~~' ; IMl"111111"111111 ... ffllll ....... .............. f •• --.-I ••••• F .··.fFI/F •.
;M~ H~~F1~~H::~' ~!:: ~~ ~: ~~ ~:: ~ ::::: ,::. !::~:if :::: :~:::!: ~ ii:~ ~~~F F ~ill"F 1 (IIIi'll .... F ..... • 1.1 ......... 1-- •• I •• I:-I .... f ...... • -- ... -. ---f I. - .... 'F . • """lFllllll •• 1 • • F/.F.I • • 1 .... I .. /F ./FF ... /ff.I •• F_.f_f ... - ... _ • • f/_ .... • fl
~~=f~~~"~1 :: i ~:::~ iFi:~::::: i ~ ~;~:: ::~H~Hi~~~~~ ~F::::: ~:~::::::H I ="",""f"'/ .... 1 ..... 11111.fF.fF/f'F I/F If Ilff"FfFFfFff 111M_ .FFf .... - ...... J.I :"l"M"'III •• 1 ...... 1. F ... F -". fF 11/1/ • ff I FF fffFFffMIII-"-F"F -F-1fF ....... ,,1 FIlll1111 ............ 1 • • FfFFIIIIIIIIII.fFHff",-ll-F""-lFFfF IF ••• _.F ..
~f l f 1 t=i: ~:: :: ::::: :F~F~~~i~~~~ ~~ F ~ ~ ~~: F F :~~;~ ~~~;"!/::~ ~! ~~I~:~ CI; F :11Il111'.I.F ....... ff .. FF1111111'. -I • • /F-F •• fFFF/.IIFII ••••• • FIFFJ!FF rMlMl1llll ........... • /FFtH 111111.I.F.!! I~ .11.fF II.I .. ;-f ... ~ •• f Iffff~~.
Legend:
M Z F
/
Ragsdale silty clay loam Brookston silty clay loam Brookston silty loam Toronto silt loam Crosby silt loam Celina silt loam Reesville silt loam
b. Spectral map
Figure 5. Maps of SA4 (Kristof and Zachary, 1974).
-6-
1980 Machine Processing of Remotely Sensed Data Symposium

I
,
200 -10YR 4/2 --10YR 5/2 ----- lOYR 6/2
180 ········lOYR 6/3
c-- 160 ~ .. 0 c 140
'" U .. ';ii 120 a:
100
80
of I! !!
.40-.45 .55-.58 .62-.66 .SO -1.00 1.50-1.SO
200
180
- 160 ~ .. u c 140
'" U .. , ';ii 120 a:
100
80
Wavelength (micrometers)
a. color, air dry
-3_5-6.0% --2.5-3.5% -----1.5-2_5% ········0.5-1.5%
of. ! ! I I I
.40-.45 .55-.58 .62-.66 _SO-I_00 1.50-1.SO
200
180
~ 160
'" u C 140
'" U .. ~ 120 a:
100
80
Wavelength (micrometers)
c. organic ~atter content
-0-55% --55-60% -----60-65% -·····--65-70%
of I II!
.40-.45 .55-.58 .62'.66 .SO-I.00 1.50-1.SO Wavelength (micrometers)
e. silt content
200
180
~ 160
.. u c 140
'" U .. 'g 120 a:
100
80
.40-.45 .55-.58 .62-.66 .SO-1.OO Wavelength (micrometers)
b. color, moist
200
180
2 '60
.. o C 140 <0
U .. ~ 120 a:
100
60
01 I ! I I
.40-.45 .55-.58 .62-.66 .SO-I.00
200
180
~ 160 .. o C 140 to U .. :; 120 c.:
100
80
Wavelength (micrometers)
d. clay content
01 ' 1 1 ,
.40-.45 .55-.58 .62-.66 _SO-I.00 Wavelength (micrometers)
f. sand content
-IOYR 2/2 --lOYR 3/2 ----- lOYR 4/2 ···--···10YR 4/3
I.SO-1.SO
-25-30% --20-25% -----15-20% -·-·····5-15%
I.SO-1.SO
-5-15% --15-20% ----- 20-30% ····--··30-40%
1.50-1.SO
Figure 6. Relationship between soil reflectance and other soil properties (uncalibrated multispectral data).
-7-
1980 Machine Processing of Remotely Sensed Data Symposium

Legend:
Munsell color notation
10YR 6/3 10YR 6/2 10YR 5/2 10YR 4/2
(water, vegetation)
a. Soil color
Symbol
/ M
S,+
IIll 'u<o Ioi~ .... .. i' .... "i_ ... 0
::a :: :: :: :: :: :! " .~ ... .. ::: ~ , ... ,.H ,.-. I." .... .. -, h_. • • ~Q ... , :: ~ ~ .... '''~ ' ... :: ~ ! .... : ::~ I •• ,
'" I .... to .. .... :::! "'~ " 'u .. II ioU loll 10"
"" :::~ :: :: ... (1 .... lou ,0,1 '00. :::! Itl' h ..
,:: :::::: ii II i:::::!!! I: II ~~:;;:::: ::::::: :::: ::~.. "ii , •••••• ,'" " •••••••• ,"",... .................. . J .. .. .. "'''''"'' .. .... .. """ ... ",........ ...... " ... .. ." , "'"",, , .. ....... "" ,... ............... .." .. ,,/ ,,,,,,,,,,,,, . __ ..... " III' .. ····.. ........ Ii •• u"\\ .,' "" '"'''''·--.. · ·1''''' .... ,... ....... ,,," II I' ·11" "11""" ...... , "'"........ ...... • .. "" \
~, . :: :::~~~~~::~iiii ;!1: 1::: I:: ::::::::; ,:::WIIIII 111.""11''''11'11111'11'11 1''..... .. ..".111111 1 • " "" """"'" ",...... . "',,' .-!::::::::: ::::::::!!::::::::' ::::. .. ::::: ::::' I: I,!!::: • .. ·· · .. 111" ... .... "" "" ••• ..", , ••• ", 1111' •..•..• ..... . .. '" · ...... · 1111' .. ., " ...... . " • • _ •• _
;:;;::::::::: ::::::::::::::::' dm:::::mn Iii;:::::: d:: i:::::: !:::;::!:!:::: :;: . . :::~! rn I;; ~: D W::::::: "" I" "', .. "" ........ ..... " .. ," I,,, 1111,,1 ••• ·-. ,~~:::;!:''''::;:;;: ::::: :::. .:~;:;;::! i::: I:; :~:::::::: !!!:! I:;~! I!:::!! I::::;; ::::. :::::::::::!! ~~; I:::::::: .. ................ " ," II .... .. ......... "", ..... _ .. ... __ ... ____ ...... , '" ,...... ···········""I ...... oon ..... --..... ....... " , ...... , ........... "" ........... . :: :;i;:::: :::::::::::!:::::: , ;::: ::::: ::: I: ::::: ::::::: ::::::: :::::. :; ; II \ \::::: ::., .. :::: ::::!! ;;: ::::::::::::: , ............ " ",,. ,, ..... , .' ... .. "'" .............. . __ .... __ ... , "" 1""' ,.... " ... ,," 'fI" ....... - ... . .......... 1' L' 'I., fI' I II '" ./ .. " 'I" 1'·1' ..... ·.--. ,· ...... ·" '''''''''1' ''.. " .... ., II -- ............... . ~~ ~~~~ ~~111 ~ 1!!; llll:!~ I: ;: ~i~; ~~ ~ ~ ~~ 1:: ~~~~~~~~~~~~mf .............. """" " ......... " .................. .. ......... ' ... ""'" ... , ........ .,,, ................. .. ...... .. .... ,""'" ... " ......... ", .... -- ........... .. ........ ".,"'"'' .", ........... " ............ _ .. -. :::::: ; II; I::::::" ::;::::::::::::;::: :::::::::::::::::1 .... ,""''''','' • .............. ·· " '1 .... · .... · .. · .. 11' ::;: I::: : ::::::., .. ~:;: ::::: ::::::: : ;::. ~:i;"': i' III J. ~ 'II ""'". '"' ." ................. " " '" 111,,1, ..... 1 ,,' """",,, "II .......... ...... II ' I'''' "III I .. • ... . • ,,,,,,,,"10' .", ............ ,', .,", ......... , ..... .. """""... .,', ........................... '\1 1 ...... ' ""' '''''.' ' •• " . ....... .... . . .. ....... .... " I .... '" 1",,""'11 .. " ........................... " If .. ·."
/""""., • .......... · , ·,,,· .... • ...... "JII 11"''''1 111111'''' ........... "'."'., ......... """ "'''jl\ 111111'" .......... """,,,, 'I ,,, .. " "11111" '''l :~;::I:" '''::;: :::;::~~!!1 1:1::::1':;~W'''· 1~:l!1 11'11 ."""1111'''' .... 1 .... ·",1,,,.,111111· .. • .. 1, """ ,,,,,,,,,,,, .... ...... 1'11"11"1" .. • .. • .. 1 ' ,,, 11111''''',·,· .... '1'·, · .. ··,·,·,''· '· .... · .. 1'' V ,:W:;\jW: tt Iii: 111~!~::::~!~IIIII;;iiiiiiii "
Legend:
, organic matter Symbol
0.5 1.5 - , = 1.5 2.5 / 2.5 3.5 I 3.5 6.0 •
(!,..·ater, vegetation) +
b. Organic matter content (reflectance data)
Figure 7. Spectral classes based on four different parameters determined for training sets.
Organic matter content was determined on 400 soil samples from random test fields. The overall classifiction performance was 95.6 percent for the test samples.
V. CONCLUSIONS
It should be emphasized that the technology at the time of this work was sti ll evolving and was very experimental in nature. However, it was determined thc1t remotely sensed radiation could serve as a useful tool for surveying, identifying, differentiating and inventorying soil and some of its important properties.
-8-
Spectral measurements collected with a spectrometer on 25 different soils incrcc1sed our knowledge about the influence of the physical dnd chemical soil properties on soil rcflect~ncc. Also, these spectra illustrated th~t increasing soil moi~ture decr~ases reflectance in all wavelcnoth bands. the effect being greater for light colored soils than for dark so~ls.
Analysis of multispectral data obtained by an airborn~ scanner over many fields cf bare soi l confirmed these relation st. ips uet .... -ccn soil reflectance and other soil rropcrties. These ~esults
1980 Machine Proc~ssing 01 R~mol~ly S~nsed Data Symposium
. .
..

"
Legend:
% organic matter
0.5 - 1.5 1.5 - 2.5 2.5 - 3.5 3.5 - 6.0
Symbol
• ,N I,F Z,H
-,=,/
c. Organic matter content (thermal data)
Figure 7. (Continued)
indicate that much of the variation in soil reflectance is a function of soil color, organic matter content, moisture content and texture.
The positive results from both laboratory and field examination of the relationships bet~een soil reflectance and other soil properties introduced a valuable new aid for soil survey. Spectrally derived maps may delineate with reasonable accuracy important information about surface soil conditions. Inasmuch as conventional soil cate90ries are basco on both surface and subsurface soil ch~racteristics, the techniques described in this paper can b e expected to serve only as an aid to soil survey.
-9-
Legend:
% clay
5-15 15-20 20-25 25-30
(water, vegetation)
Symbol
I M
+, blank
d. Clay content
VI. LITERATURE CITED
1. AI-Abbas, A. H., P. H. Swain and M. F. Baumgardner. 1972. Relating organic matter and clay content to the multispectral radiance of soils. Soil Sci. 114: 477-485.
2. Baumgardner, M. F., S. J. Kristof,
3.
C. J. Johannsen and A. L. Zachary. 1970. Effects of organic matter on the multispectral properties of soils. Proc. Indiana Acad. of Sci. 79:413-422.
Baum9ardner, M. F .. C. J. and S. J. Kristof. 1969. tra1 studies of soils and
Johannsen, Nultispec
clay
1980 MachtnQ Processing of Remotely Sensed Data Symposium

minerals. Proc. German Soil Sci. Soc. Meetings, Hannover, W. Germany. Sept.
4. Hoffer, R. M. and C. J. Johannsen. 1968. Ecological potential in spectral signature analysis. Remote Sensing in Ecology. pp. 1-16.
5. Gates, D. M. 1965. Radiant energy, its receipt and disposal. Meteorological Monographs. Vol. 6:28:1-26.
6. Kristof, S. J. 1971. Preliminary multispectral stUdies of soils. J. Soil and \';ater Conservation 26: 15-18.
7. Kristof, S. J., M. F. Baumgardner and C. J. Johannsen. 1974. Spectral mapping of soil organic matter. ITC Journal. The Netherlands. 4:479-489.
8. Kristof, S. J. and A. L. Zachary. 1974. Mapping soil features from multispectral scanner data. Photogramrnetric Engineering. Vol. 40: (12) 1427-1434.
9. Kubiena, W. L. 1938. Collegiate Press, Inc.
Micropedology. Ames, Iowa.
10. Laboratory for Agricultural Remote Sensing (LARS). 1968. Remote multispectral sensing in agriculture. Annual Report, Vol. 3. Res. Bull. 844. Agric. Exp. Sta., Purdue University, West Lafayette, IN.
11. Obukhov, A. I. and D. S. Orlov. 1964. Spectral reflectivity of the major soil groups and possibility of using diffuse.reflection in s011 investigat10ns. Soviet Soil Science. No.2, 174-184.
12. Shields, J. A., E. A. Paul, R. J. St. Arnaud and W. K. Head. 1968. Spectrophotometric measurement of soil color and its relationship to moisture and organic matter. Can. J. Soil Sci. 48:271-280.
-10-
1980 A1achine Processing of Remotely Sensed Data Symposium