Application of liquid protein supplements on intake and digestibility of low quality forages Sandy...
25
Application of liquid protein supplements on intake and digestibility of low quality forages Sandy Johnson NW ASI Update Nov. 7, 2012
-
Upload
alanna-martinez -
Category
Documents
-
view
214 -
download
0
Transcript of Application of liquid protein supplements on intake and digestibility of low quality forages Sandy...

Application of liquid protein supplements on intake and
digestibility of low quality foragesSandy Johnson
NW ASI Update
Nov. 7, 2012

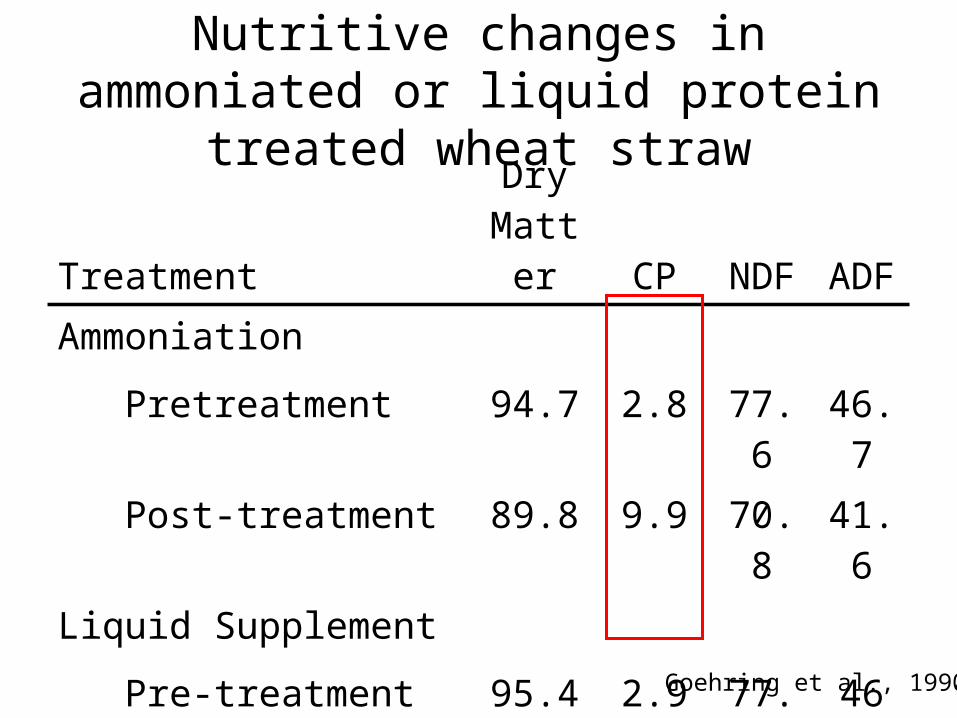
Nutritive changes in ammoniated or liquid protein treated wheat straw
TreatmentDry
Matter CP NDF ADFAmmoniation
Pretreatment 94.7 2.8 77.6 46.7
Post-treatment 89.8 9.9 70.8 41.6
Liquid Supplement
Pre-treatment 95.4 2.9 77.8 46
Post-treatment 95.2 3.5 75.7 42.2
Goehring et al., 1990
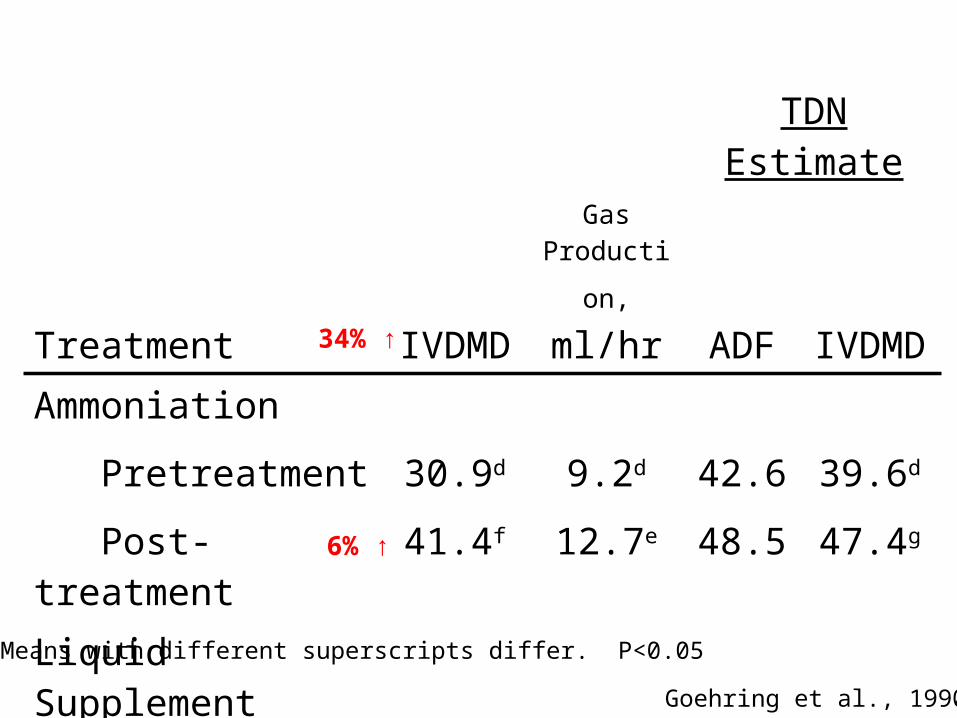
Gas
Production, ml/hr
TDN Estimate
Treatment IVDMD ADF IVDMDAmmoniation
Pretreatment 30.9d 9.2d 42.6 39.6d
Post-treatment 41.4f 12.7e 48.5 47.4g
Liquid Supplement
Pre-treatment 33.3e 9.1d 43.5 41.3e
Post-treatment 35.2g 10.0d 47.8 42.8fd,e,f,g Means with different superscripts differ. P<0.05
Goehring et al., 1990
34% ↑
6% ↑

Control NaOHLiquid Suppl Ammoniated
Cow Trial
ADG, lb .26b 0a .10a .88c
Straw intake, lb 19.3a 17.3a 17.8a 23.0b
Sheep metabolism trial
DM digestibility,% 53.6a 53.5a 52.4a 59.7a
Intake, lb .99a 1.30b 1.32b 1.43c
IVDMD,% 50.3a 54.2b 49.7a 57.7c
Faulkner et al., 1981 (yr?)
a,b,c, Unlike superscripts in a row differ (P<0.05) using orthogonal contrasts

Cow Preference for NaOH or Liquid Supplement treated straw compared to untreated straw
Trial 1 Trial 2
Treatment Untrt NaOH Untrt LS Estimated intake, lb 2.3 13.3 2.5 12.1
IVDMD 37.6 46.7 37.6 41.1
NDF, % 87.7 82.0 87.7 86
Crude Protein, % 3.3 4.5 3.3 8.6
Paterson et al., 1980

Hay quality following injection with molasses-urea solution - LSU
Study 1 – Bermudagrass hay
Study 2 – Johnsongrass-crabgrass hay
Item (%DM) Control Injected Control Injected
CP 12.3 13.2 7.8 7.5
ADF 39.5 38.6 47.3 47.0
NDF 70.7 70.3 74.7 73.9
TDN 53.0 54.0 44.1 44.4
IVDMD 69.8 71.6 64.3 64.2
McCormick et al., 2010
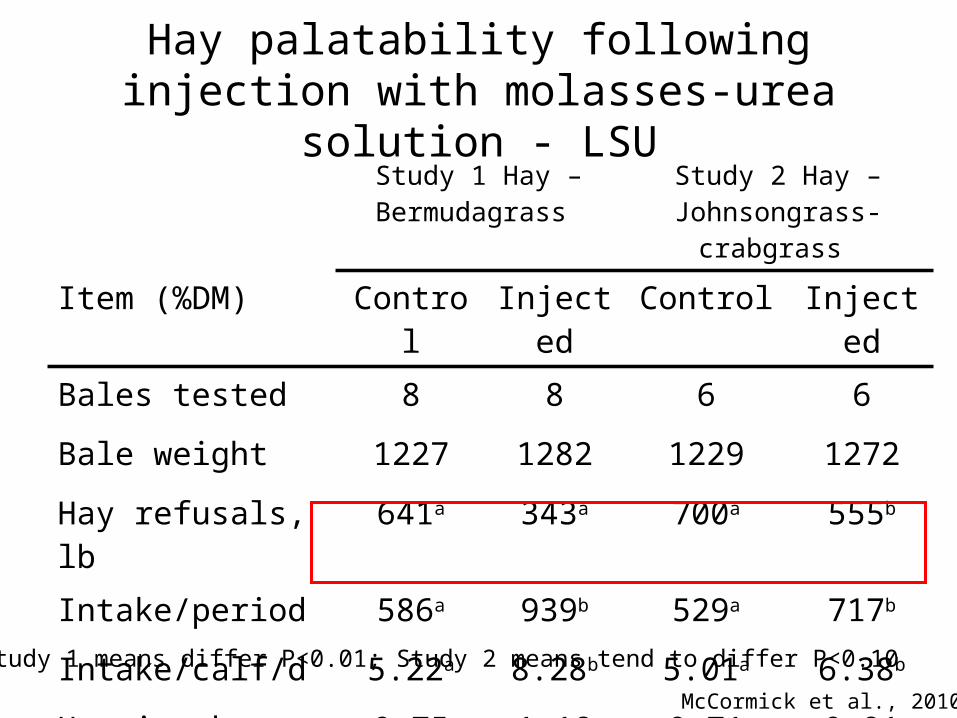
Hay palatability following injection with molasses-urea solution - LSU
Study 1 Hay – Bermudagrass
Study 2 Hay – Johnsongrass-
crabgrass
Item (%DM) Control Injected Control Injected
Bales tested 8 8 6 6
Bale weight 1227 1282 1229 1272
Hay refusals, lb 641a 343a 700a 555b
Intake/period 586a 939b 529a 717b
Intake/calf/d 5.22a 8.28b 5.01a 6.38b
Hay intake, %BW 0.75 1.18 0.71 0.91
McCormick et al., 2010
a,b, Study 1 means differ P<0.01; Study 2 means tend to differ P<0.10
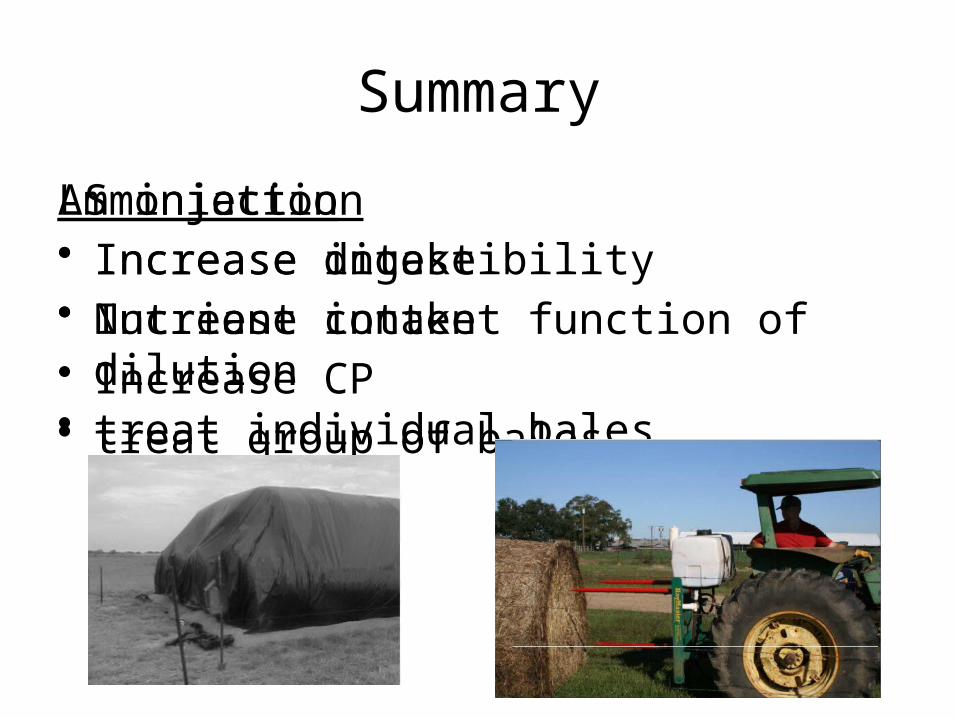
Summary
Ammoniation• Increase digestibility• Increase intake• Increase CP• treat group of bales
LS injection• Increase intake• Nutrient content function of dilution • treat individual bales

• Ammoniation Project


Gas
Production, ml/hr
TDN Estimate
Treatment IVDMD ADF IVDMDAmmoniation
Pretreatment 30.9d 9.2d 42.6 39.6d
Post-treatment 41.4f 12.7e 48.5 47.4g
Liquid Supplement
Pre-treatment 33.3e 9.1d 43.5 41.3e
Post-treatment 35.2g 10.0d 47.8 42.8fd,e,f,g Means with different superscripts differ. P<0.05
Goehring et al., 1990
20%

Nitrates
• KPICS

Nitrate Concentration in Forages Survey
• Date• Location of forage sampled (City)• County/District of forage sampled

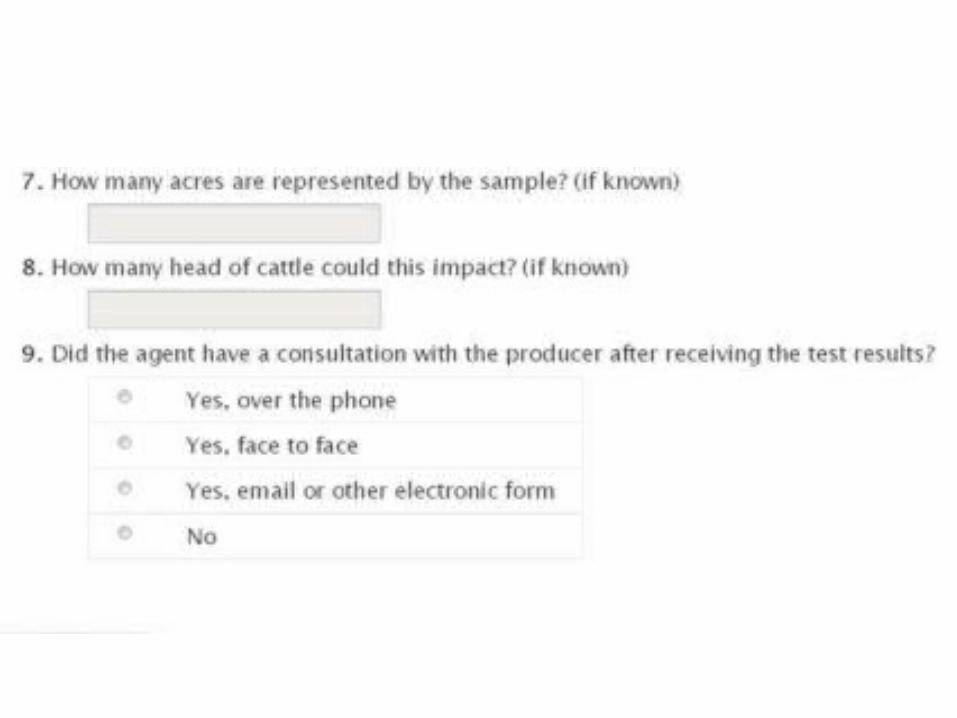

Nitrate tests
• KPICS • Sub-samples you were asked to collect
correct sub sample procedure
2 teaspoons to ¼ cup
type of forage
actual nitrate value and associated units (copy analysis sheet)

Starting weight and condition
EW NW
n 18 18
Cow age, yr 4.3 ± .6 4.6 ± .6
Julian calving date 57 ± 3 60 ± 3
Calf weight, lbs. 351 ± 13 367 ± 13
Cow weight, lbs. 1023 ± 39 1072 ± 38
Cow body condition 3.6 ±.2 3.9 ± .2
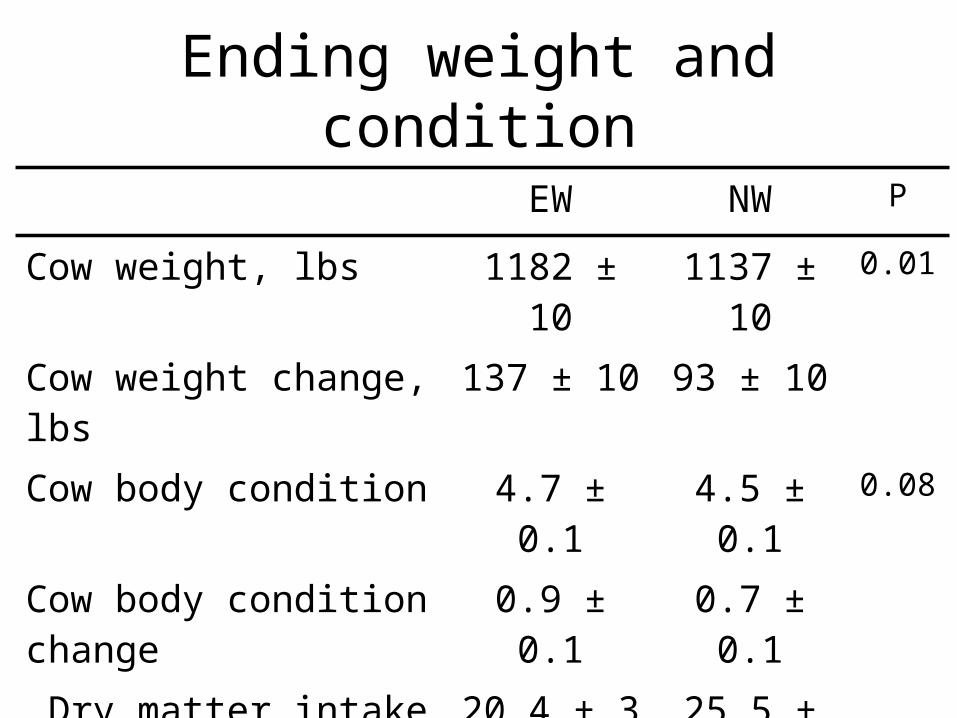
Ending weight and condition
EW NW P
Cow weight, lbs 1182 ± 10 1137 ± 10 0.01
Cow weight change, lbs 137 ± 10 93 ± 10
Cow body condition 4.7 ± 0.1 4.5 ± 0.1 0.08
Cow body condition change
0.9 ± 0.1 0.7 ± 0.1
Dry matter intake 20.4 ± 3 25.5 ± 3

Body condition change in 2-yr old and mature cows after a 77 day re-feeding
period following nutrient restriction
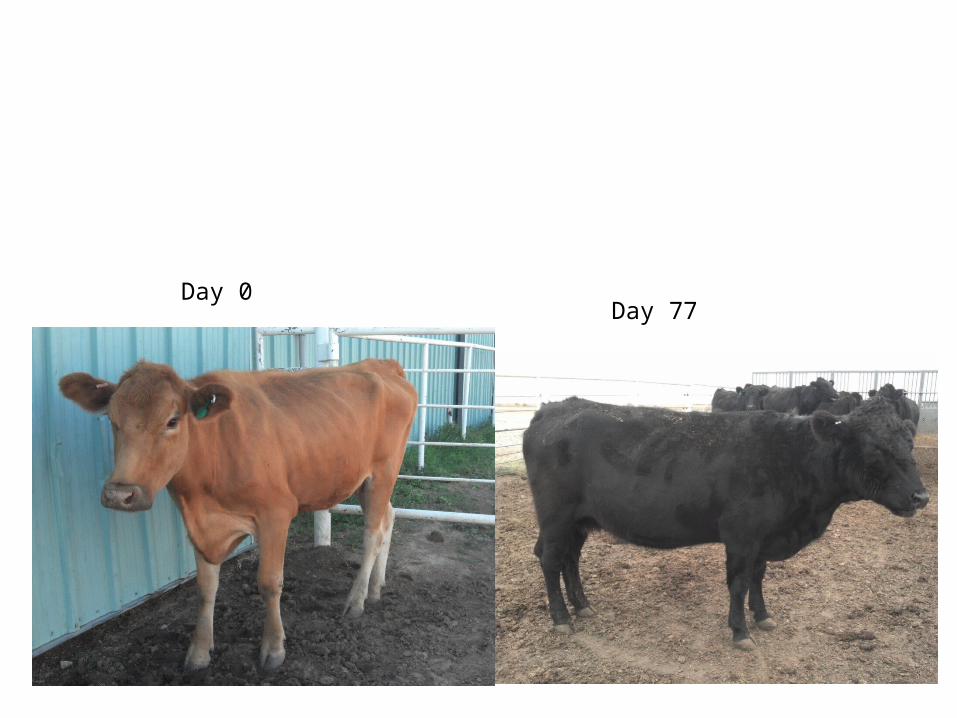
Day 0Day 77

Ideas for local demonstrations
• technology that isn’t being used• scales

• Hay waste – – Feeder type– Access time– Shred vs unrolling– At current cost of hay when does it pay to buy
bunks/processing ect.

Methods of Feeding Hay
Method Amount Wasted• Unrolled on the grounda 22%• Processed, fed on grounda 16%• Processed, fed in bunka 11%• Hay Feeders 7-9
%• Ground Hay
<5%?aBlasi et al., 1993 Cattlemen’s Day

Access time to hay
3 hours 6 hours 9 hoursFree choice
Weight change, lbs a 119 161 191 207Body condition change a 0.1 0.5 0.7 0.8Hay disappearance, lbs DM/d a 17.6 24.4 29.3 34.1Hay waste, lbs DM/d b 5.9 5.7 9.2 13.4Manure production, lbs DM/d b 11.7 15.0 19.6 22.7
a linear and quadratic effects (P<0.01) b linear effect (P<0.01)