APPLICATION OF INSAR TECHNOLOGY IN GEOGRAPHICAL SITUATION ...
7
APPLICATION OF INSAR TECHNOLOGY IN GEOGRAPHICAL SITUATION MONITORING WANG Yuhong 1 , TIAN Qixia 2 1.Yunnan remote sensing center, Kunming, China - [email protected] 2.BeijingSupermap Software Co., Ltd. Kunming office, Kunming, China - [email protected] KEY WORDS: InSAR, Geographical situation monitoring, D-InSAR, The terrain Deformation, Interference figure, Application ABSTRACT: In this paper, based on the geographical situation monitoring project of the earthquake zone of ludian county, zhaotong city, yunnan province,using the data of the radarsat-2 satellite( time frame is 20140304-20150416 ), InSAR technology is used to monitor the topography of the earthquake zone(about 420 square kilometers of monitoring area).Through the analysis of topographic deformation results, the scope of the terrain change is obtained, and the application and problems of InSAR technique in topographic geomorphological monitoring are discussed. _______________________________ Corresponding author Wang yuhong The International Archives of the Photogrammetry, Remote Sensing and Spatial Information Sciences, Volume XLII-3, 2018 ISPRS TC III Mid-term Symposium “Developments, Technologies and Applications in Remote Sensing”, 7–10 May, Beijing, China This contribution has been peer-reviewed. https://doi.org/10.5194/isprs-archives-XLII-3-1841-2018 | © Authors 2018. CC BY 4.0 License. 1841
Transcript of APPLICATION OF INSAR TECHNOLOGY IN GEOGRAPHICAL SITUATION ...

APPLICATION OF INSAR TECHNOLOGY IN GEOGRAPHICAL
SITUATION MONITORING
WANG Yuhong1, TIAN Qixia2
1.Yunnan remote sensing center, Kunming, China - [email protected]
2.BeijingSupermap Software Co., Ltd. Kunming office, Kunming, China - [email protected]
KEY WORDS: InSAR, Geographical situation monitoring, D-InSAR, The terrain Deformation, Interference
figure, Application
ABSTRACT:
In this paper, based on the geographical situation monitoring project of the earthquake zone of ludian county,
zhaotong city, yunnan province,using the data of the radarsat-2 satellite( time frame is 20140304-20150416 ),
InSAR technology is used to monitor the topography of the earthquake zone(about 420 square kilometers of
monitoring area).Through the analysis of topographic deformation results, the scope of the terrain change is
obtained, and the application and problems of InSAR technique in topographic geomorphological
monitoring are discussed.
_______________________________
Corresponding author
Wang yuhong
The International Archives of the Photogrammetry, Remote Sensing and Spatial Information Sciences, Volume XLII-3, 2018 ISPRS TC III Mid-term Symposium “Developments, Technologies and Applications in Remote Sensing”, 7–10 May, Beijing, China
This contribution has been peer-reviewed. https://doi.org/10.5194/isprs-archives-XLII-3-1841-2018 | © Authors 2018. CC BY 4.0 License. 1841

1. INTRODUCTION
Thesynthetic aperture radar interferometry (InSAR)
andthesynthetic aperture radar differential
interferometry (D-Insar) are The rapid development of
space to observe new technologies after the 20th
century.Compared with traditional spatial remote
sensing technology, synthetic aperture radar has full
range the weather, full day, high resolution, the ability
to penetrate the vegetation and the ground have some
outstanding advantages, not only traditional method of
photography measurement and remote sensing has
been effectively complemented, and new observation
methods and application fieldshave been
developed.InSAR technology not only should
surveying and mapping such as topographic mapping
and DEM generation, itcan also be applied to thematic
mapping such as agriculture and forestry mapping.
The monitoring of geographical situation is a major
project developed by the country in recent years. The
project has been applied to a number of high-tech
technologies,suchasGIS,GPS and RS technology.New
space observation technology is developed in the late
twentieth Century,InSAR technology will be further
implemented in national-disaster monitoring projects.
Based on the geographical situation monitoring
project of the earthquake area of ludian county in
zhaotong city, yunnan province, this paper discusses
application and encountered problems on the
technique of InSAR monitored in the terrain and
geomorphology.
2. MAIN BODY OF TEXT
2.1 Basic principles of InSAR
This section focuses on the basic principles of
Insar.The interference analysis of two SAR images in
the same area obtained at different time/location can
be understood as the co-conjugate of pixel complex
values is multiplied, that is
IF(r,a) =M (r,a)·S(r,a)* (1)
Here, (r, a) is the pixel slope, azimuth direction
coordinates, M, S, respectively, main SAR image and
secondary image, and IF is obtained the interferogram
(plural).As shown in FIG. 1, aconjugate multiplication
actually implies a phase reduction of the
corresponding pixel,that is
21 - (2)
Therefore, the phase principal value of each complex
number in the graph is dominated by equation (1), and
the phase difference between the images corresponds
to the pixel.That is the interference phase.
Figure 1 Basicprinciple diagram of InSAR
2.2 Dataprocessingflow
2.2.1 The data clipping: The SAR data purchased is
the data of the Canadian Radarsat-2 satellite, and the
overall SAR data coverage is 125km x 125km, it is
much larger than the required monitoring range (about
420 square kilometers of monitoring area), for the
convenience of data processing and to reduce the
amount of computation, you need to cut it to just
cover the monitoring area.The data processing
software uses GAMMA software of the Swiss
GAMMA company Research and development.
2.2.2 Image co-registration: Because the two images
in the InSAR are taken at different times and satellites
posture, the pixels between them are not
corresponding to each one, the pixel point registration
is required, which is to calculate the reference image
(the main image) and the registration ( the secondary
The International Archives of the Photogrammetry, Remote Sensing and Spatial Information Sciences, Volume XLII-3, 2018 ISPRS TC III Mid-term Symposium “Developments, Technologies and Applications in Remote Sensing”, 7–10 May, Beijing, China
This contribution has been peer-reviewed. https://doi.org/10.5194/isprs-archives-XLII-3-1841-2018 | © Authors 2018. CC BY 4.0 License.
1842

image ) the relationship between Azimuth and
distance (Range) is used to use this relationship to
treat the registration image row coordinate
transformation and resampling.
FIG. 2 shows the intensity of image interference in the
main image (a) and the secondary image (b) after
registration .
Figure 2 The intensity diagram of the main image (a)
and the secondary image (b) (after registration)
2.2.3 Generated interference pattern: The multiple
conjugate multiplied from the image and the main
image after the resampling is multiplied to produce a
complex interferogram.In order to evaluate the
interference phase quality,at the same time, a coherent
coefficient diagram corresponding to the interference
phase diagram is generated while generating the
interference phase diagram (FIG. 3).In terms of the
effect of computer display, the purple region in the
figure shows the region with high coherence, and its
interference phase striation is clear, interferometric
phase observation is reliable;In contrast, a large area
of cyan area indicates a region with low coherence
and its interference phase is affected by noise.The
interferencephase is seriously affected by the
noise,and the observation quality is low.
Figure 3 Original coherent graph
The International Archives of the Photogrammetry, Remote Sensing and Spatial Information Sciences, Volume XLII-3, 2018 ISPRS TC III Mid-term Symposium “Developments, Technologies and Applications in Remote Sensing”, 7–10 May, Beijing, China
This contribution has been peer-reviewed. https://doi.org/10.5194/isprs-archives-XLII-3-1841-2018 | © Authors 2018. CC BY 4.0 License.
1843

Figure 4 Differential interference pattern
2.2.4 Remove ground and topographic phase: The
flatland effect refers to the change of the phase of the
flat phase in the interference fringes with the change
of distance and orientation the phase of the change.It
is mainly affected by the geometry of SAR system,
such as platform height, the lower Angle of antenna
and baseline length the effect of the element.
In addition to the flat phase, the original interference
fringe pattern includes the topographic phase.The
topographic phase is based on the monitoring area the
fluctuation is caused by the inverse ratio of the radar
wavelength and radar to the ground distance, which is
proportional to the vertical baseline and the terrain
height.In order to score from the deformable phase,
you must remove the flat and topographic phase.For
this reason, the external DEM data can be used for flat
and topographic phasethe simulation of bits is then
subtracted from the original phase to form the
differential interference graph (shown in figure 4).
2.2.5 Phase filter: Because the generated
InSARinterferogram is caused by geometric
overthrust, system thermal noise, time change and
local match misalignment,the influence of the
incoherent noise and other factors, signal-to-noise
ratio of the generated InSARinterferogram is low and
needs to be filtered and processed in this paper, the
signal-to-noise ratio of the interference graph is
improved, and the reliability of the phase solution and
the interpretation ability of the interference graph are
further improved.Figure 5 shows the following the
interferogram (a) and the coherent graph (b) after the
complex image filtering.Compared to figure 4 and 5,
the coherence value and phase value of the filter are
available,there was a marked improvement in
readability.
Figure 5 The differential interferogram graph (a)
and coherence graph after filtering(b)
2.2.6 Phase unwrapping: Because of the generated
phase interference graph, each pixel has the problem
of the fuzzy degree of the phase, which is extracted
from the interferogram,is actually the main value of
phase, its value in the rangeof , in between.In
order to get a real phase difference, You have to add
an integer multiple of 2 to this range.Phase
unwrapping is especially an important stepin InSAR
treatment, the quality of the final data product of
InSAR is directly affected by the quality of the phase
solution.Figure 6 is the least used the interferometric
phase of the phase unwrapping is carried out.
The International Archives of the Photogrammetry, Remote Sensing and Spatial Information Sciences, Volume XLII-3, 2018 ISPRS TC III Mid-term Symposium “Developments, Technologies and Applications in Remote Sensing”, 7–10 May, Beijing, China
This contribution has been peer-reviewed. https://doi.org/10.5194/isprs-archives-XLII-3-1841-2018 | © Authors 2018. CC BY 4.0 License.
1844

Figure 6 Interference phase diagram (after phase
unwrapping)
Figure 7 Map of deformation (after geocoding)
2.2.7 Geocoding: The resulting phase is in the radar
coordinate system (line number, column number,
elevation), and it needs to be converted to the right
Angle coordinate system (longitude, latitude,elevation)
of an ellipsoidal coordinate system,it can be used by
us, namely, geo-coding processing.Figure 7 for the
deformation diagram after the geocoding.
2.3 Analysis of topographic deformation results
The deformation results obtained by the interference
of image are shown in figure 8, where the red
pentagonal star is the epicenter location and the black
curve is the monitoring range, the red curve is the area
of deformation area and the brown solid line is the
position of the profile line.From FIG. 8 analysis, two
distinct areas of surface change have been created due
to ludian earthquake , one located at the northwest
corner of the epicentre( line AA,
location)and one
located at the epicenter of the earthquake south east
corner (line BB,
location).The deformation of the
northwest corner is mainly the subsidence, the
maximum subsidence of about 16cm, the deformation
area is close to 100 km2.The deformation of the
southeast corner mainly shows up as an increase, the
maximum increase is about 15cm, and the
deformation area is close to 85 km2.In addition, some
50km2 subsurface subsidence occurred in the
northeast corner of the epicenter.These three surface
changes were in August 2014.The results of the
magnitude 6.5 earthquake and its aftershocks have
been the most damaging.
In order to further show the magnitude of the
deformation, the deformation values of double AA,
and BB,
in figure 8 are extracted, as shown in FIG.
9.FIG. 9 shows that the shape variable of the
deformation area of AA,
and BB,
shows the large
distribution of the middle and the line ,contrary to the
deformation of AA,
and BB,
, this phenomenon is
consistent with the deformation caused by the
earthquake.
Figure 8 Deformation figure
The International Archives of the Photogrammetry, Remote Sensing and Spatial Information Sciences, Volume XLII-3, 2018 ISPRS TC III Mid-term Symposium “Developments, Technologies and Applications in Remote Sensing”, 7–10 May, Beijing, China
This contribution has been peer-reviewed. https://doi.org/10.5194/isprs-archives-XLII-3-1841-2018 | © Authors 2018. CC BY 4.0 License.
1845
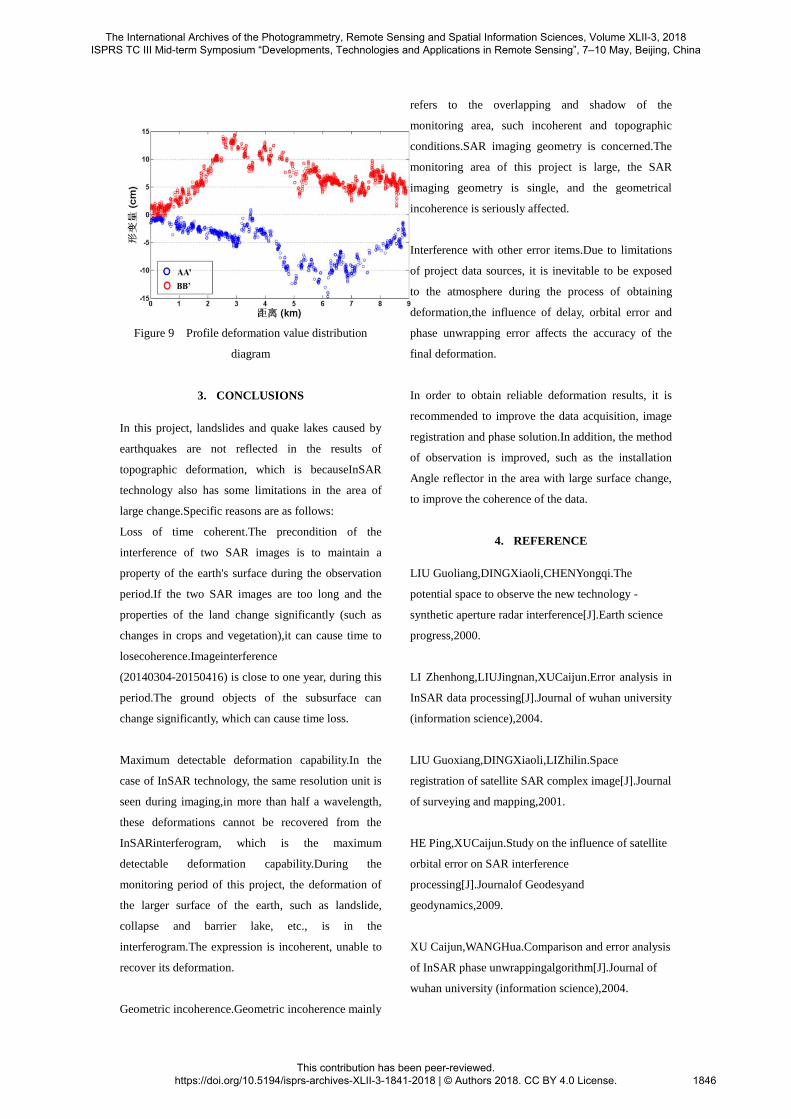
Figure 9 Profile deformation value distribution
diagram
3. CONCLUSIONS
In this project, landslides and quake lakes caused by
earthquakes are not reflected in the results of
topographic deformation, which is becauseInSAR
technology also has some limitations in the area of
large change.Specific reasons are as follows:
Loss of time coherent.The precondition of the
interference of two SAR images is to maintain a
property of the earth's surface during the observation
period.If the two SAR images are too long and the
properties of the land change significantly (such as
changes in crops and vegetation),it can cause time to
losecoherence.Imageinterference
(20140304-20150416) is close to one year, during this
period.The ground objects of the subsurface can
change significantly, which can cause time loss.
Maximum detectable deformation capability.In the
case of InSAR technology, the same resolution unit is
seen during imaging,in more than half a wavelength,
these deformations cannot be recovered from the
InSARinterferogram, which is the maximum
detectable deformation capability.During the
monitoring period of this project, the deformation of
the larger surface of the earth, such as landslide,
collapse and barrier lake, etc., is in the
interferogram.The expression is incoherent, unable to
recover its deformation.
Geometric incoherence.Geometric incoherence mainly
refers to the overlapping and shadow of the
monitoring area, such incoherent and topographic
conditions.SAR imaging geometry is concerned.The
monitoring area of this project is large, the SAR
imaging geometry is single, and the geometrical
incoherence is seriously affected.
Interference with other error items.Due to limitations
of project data sources, it is inevitable to be exposed
to the atmosphere during the process of obtaining
deformation,the influence of delay, orbital error and
phase unwrapping error affects the accuracy of the
final deformation.
In order to obtain reliable deformation results, it is
recommended to improve the data acquisition, image
registration and phase solution.In addition, the method
of observation is improved, such as the installation
Angle reflector in the area with large surface change,
to improve the coherence of the data.
4. REFERENCE
LIU Guoliang,DINGXiaoli,CHENYongqi.The
potential space to observe the new technology -
synthetic aperture radar interference[J].Earth science
progress,2000.
LI Zhenhong,LIUJingnan,XUCaijun.Error analysis in
InSAR data processing[J].Journal of wuhan university
(information science),2004.
LIU Guoxiang,DINGXiaoli,LIZhilin.Space
registration of satellite SAR complex image[J].Journal
of surveying and mapping,2001.
HE Ping,XUCaijun.Study on the influence of satellite
orbital error on SAR interference
processing[J].Journalof Geodesyand
geodynamics,2009.
XU Caijun,WANGHua.Comparison and error analysis
of InSAR phase unwrappingalgorithm[J].Journal of
wuhan university (information science),2004.
The International Archives of the Photogrammetry, Remote Sensing and Spatial Information Sciences, Volume XLII-3, 2018 ISPRS TC III Mid-term Symposium “Developments, Technologies and Applications in Remote Sensing”, 7–10 May, Beijing, China
This contribution has been peer-reviewed. https://doi.org/10.5194/isprs-archives-XLII-3-1841-2018 | © Authors 2018. CC BY 4.0 License.
1846

Suksmono A B. Adaptive Noise Reduction of InSAR
Image Based on a Complex2Valued MRF Model and
Its Application to Phase Unwrapping Problem. IEEE
Trans.Geosci. Remote Sens , 2003 ,41(3) : 699~709.
Dixon T. SAR Interferometry and Surface Change
Detection.http://PPsouthport.jpl.nasa.Gov/scienceapps
/dixon/index.html ,2003.
GoldsteinR. Atmospheric Limitations to Repeat-track
Radar Interferometry. Geophys. Res. Lett , 1995 , 22
(18) : 2517~2520.
Ding,x.L.,G.X.Liu,Z.W.Li,and Y.Q.Chen,
Ground subsidence monitoring in Hong Kong with
satellite SAR interferometry[J].Photogrammetry
Engineering&RemoteSensingVo1.70,No.10,PP.
1131—1137,2004.
MassonnetD , Feigl K L. Radar Interferometry and Its
Application to Changes in the Earth’s Surface.
Rev.Geophys. , 1998 ,36 (4) :441~500.
The International Archives of the Photogrammetry, Remote Sensing and Spatial Information Sciences, Volume XLII-3, 2018 ISPRS TC III Mid-term Symposium “Developments, Technologies and Applications in Remote Sensing”, 7–10 May, Beijing, China
This contribution has been peer-reviewed. https://doi.org/10.5194/isprs-archives-XLII-3-1841-2018 | © Authors 2018. CC BY 4.0 License.
1847