
Application of Hybrid PCM Thermal Energy Storages with and ...
21
applied sciences Article Application of Hybrid PCM Thermal Energy Storages with and without Al Foams in Solar Heating/Cooling and Ground Source Absorption Heat Pump Plant: An Energy and Economic Analysis Renato Lazzarin, Marco Noro , Giulia Righetti and Simone Mancin * Department of Management and Engineering, University of Padova, 36100 Vicenza, Italy; [email protected] (R.L.); [email protected] (M.N.); [email protected] (G.R.) * Correspondence: [email protected]; Tel.: +39-0444998746 Received: 14 February 2019; Accepted: 6 March 2019; Published: 11 March 2019 Abstract: The use of phase change materials (PCM) can be considered an effective way to improve the energy storage capabilities of hybrid water thermal energy storage (TESs) in solar heating and cooling plants. However, due to a few shortcomings, their use is still limited. This paper aims to give a direct estimation of the considerable advantages achievable by means of these hybrid TESs by simulating the annual performance of an existing gymnasium building located in northern Italy. The solar heating/cooling and ground source absorption heat pump plant is simulated using Trnsys. A validated type allows for the simulation of the hybrid water TESs, and also includes the possibility to use aluminum foams to enhance the heat transfer capabilities of the paraffin waxes used as PCM. This paper presents an optimization of the plant design from both energy and economic points of view by considering different cases: all three tanks modeled as sensible (water) storage, or one of the tanks modeled as PCM storage, or as enhanced PCM with metal foam. Keywords: hybrid thermal energy storage; PCM; metal foam; solar thermal collector; dual source heat pump; ground source heat pump; absorption heat pump 1. Introduction One of the main aspects of solar systems is storage. Storage density, in terms of the amount of energy per unit of volume or mass, is an important issue for applications in order to optimize the solar ratio, that is, how much of the solar radiation is useful for the heating/cooling purposes. Efficiency of appliances such as solar thermal collectors and absorption heat pumps/chillers and room consumption are important issues as well. For these reasons, it is important to investigate the possibility of using phase change materials (PCMs) in solar system applications. PCMs can potentially increase the energy density of small sized hybrid water thermal energy storage (TES) tanks, thus reducing solar storage volume for a given solar fraction, or increasing the solar fraction for a given available volume [1]. For example, for a 10 ◦ C temperature drop that is common in many applications such as ambient heating or single stage absorption cooling, the specific volume required can drastically decrease from values in the order of 0.1 m 3 kWh -1 (36 MJ m -3 ) to values as low as 0.02 m 3 kWh -1 (180 MJ m -3 ). As a further advantage, heat storage and delivery normally occur over a fairly narrow temperature range (the transition zone) [2]. Chidambaram et al. [3] report a review of several studies developed during recent years concerning PCM heat storage. They are all related to the performance of the storage itself rather than of the system. Oró [4] reports a study on a solar cooling and refrigeration plant in which different PCM have been tested under different conditions. Recently, many studies have been devoted to Appl. Sci. 2019, 9, 1007; doi:10.3390/app9051007 www.mdpi.com/journal/applsci
Transcript of Application of Hybrid PCM Thermal Energy Storages with and ...

applied sciences
Article
Application of Hybrid PCM Thermal Energy Storageswith and without Al Foams in Solar Heating/Coolingand Ground Source Absorption Heat Pump Plant:An Energy and Economic Analysis
Renato Lazzarin, Marco Noro , Giulia Righetti and Simone Mancin *
Department of Management and Engineering, University of Padova, 36100 Vicenza, Italy;[email protected] (R.L.); [email protected] (M.N.); [email protected] (G.R.)* Correspondence: [email protected]; Tel.: +39-0444998746
Received: 14 February 2019; Accepted: 6 March 2019; Published: 11 March 2019�����������������
Abstract: The use of phase change materials (PCM) can be considered an effective way to improvethe energy storage capabilities of hybrid water thermal energy storage (TESs) in solar heating andcooling plants. However, due to a few shortcomings, their use is still limited. This paper aims togive a direct estimation of the considerable advantages achievable by means of these hybrid TESsby simulating the annual performance of an existing gymnasium building located in northern Italy.The solar heating/cooling and ground source absorption heat pump plant is simulated using Trnsys.A validated type allows for the simulation of the hybrid water TESs, and also includes the possibilityto use aluminum foams to enhance the heat transfer capabilities of the paraffin waxes used as PCM.This paper presents an optimization of the plant design from both energy and economic points ofview by considering different cases: all three tanks modeled as sensible (water) storage, or one of thetanks modeled as PCM storage, or as enhanced PCM with metal foam.
Keywords: hybrid thermal energy storage; PCM; metal foam; solar thermal collector; dual sourceheat pump; ground source heat pump; absorption heat pump
1. Introduction
One of the main aspects of solar systems is storage. Storage density, in terms of the amount ofenergy per unit of volume or mass, is an important issue for applications in order to optimize the solarratio, that is, how much of the solar radiation is useful for the heating/cooling purposes. Efficiency ofappliances such as solar thermal collectors and absorption heat pumps/chillers and room consumptionare important issues as well. For these reasons, it is important to investigate the possibility of usingphase change materials (PCMs) in solar system applications. PCMs can potentially increase the energydensity of small sized hybrid water thermal energy storage (TES) tanks, thus reducing solar storagevolume for a given solar fraction, or increasing the solar fraction for a given available volume [1].For example, for a 10 ◦C temperature drop that is common in many applications such as ambientheating or single stage absorption cooling, the specific volume required can drastically decrease fromvalues in the order of 0.1 m3 kWh−1 (36 MJ m−3) to values as low as 0.02 m3 kWh−1 (180 MJ m−3).
As a further advantage, heat storage and delivery normally occur over a fairly narrow temperaturerange (the transition zone) [2].
Chidambaram et al. [3] report a review of several studies developed during recent yearsconcerning PCM heat storage. They are all related to the performance of the storage itself ratherthan of the system. Oró [4] reports a study on a solar cooling and refrigeration plant in which differentPCM have been tested under different conditions. Recently, many studies have been devoted to
Appl. Sci. 2019, 9, 1007; doi:10.3390/app9051007 www.mdpi.com/journal/applsci

Appl. Sci. 2019, 9, 1007 2 of 21
identifying possible solutions to increase the thermal conductivity of PCMs as this is usually very low(in the order of 0.2 W m−1 K−1), causing slow melting and solidifying processes [5,6].
In this regard, open-cell metal foams seem to be a promising way to enhance the PCM heat transferperformance. They consist of a stochastic distribution of interconnected pores almost homogenous insize and shape, allowing a high heat transfer area per unit of volume and high thermal conductivity [7].Mancin et al. [8] carried out some experiments measuring the improvement of the heat transfer bya metal foam during the solid–liquid phase change process of different paraffin waxes. More recently,Lazzarin et al. have conducted an extensive campaign measuring the temperature distribution andloading and unloading times of hybrid water PCM TES with and without aluminum (Al) foams [9–11].They demonstrated significantly higher conduction heat transfer rates with the use of metal foams,as a consequence of their higher thermal conductivities.
Some numerical models for integrating PCM systems into commercial programs have beenproposed in literature [12]. Among the different available simulation tools, Trnsys [13] is a widespreadtransient simulation tool for dynamic simulation of heating, ventilation, and air conditioning (HVAC)plants using renewables and heat pumps (HP). For this reason, it has been selected and implementedin the present work.
During the last decades some attempts to incorporate PCM systems in Trnsys have been made,above all into building components [14,15]. Active systems with PCMs as part of the thermal storagesystem have been investigated as well [16,17]. Bony and Citherlet [18] developed a Trnsys typecalled “type 860” to simulate water storage tanks including PCM modules (vertical cylinders, plates,or spherical beds). The model takes conduction and convection into PCM into the account as wellas at the interface between PCM and water, and it is based on an enthalpy approach. Hysteresis andsubcooling of PCM are also considered. To evaluate the accuracy of the model, numerical results werevalidated against some experimental data, showing a good agreement [19].
However, there is still a lack in literature of research that integrate PCM with metal foams inorder to include hybrid water–PCM TES in dynamic thermo-energetic building simulations. Recently,the authors simulated the use of Al foams to improve the heat transfer capabilities of paraffin waxesin hybrid water TESs based on Trnsys type 860 [20,21]. They demonstrated the suitability of theseenhanced surfaces for speeding up both the loading and unloading processes. The results were basedon simulations with experimental validation. Nevertheless, no study concerning energy and economicevaluation of a complex HVAC plant (i.e., using solar heating/cooling and a multi-source heat pump)comparing PCM vs. enhanced PCM vs. sensible heat storage is available, to the best of the authors’knowledge. Lazzarin et al. [22] conducted a similar study, but it is limited to the comparison betweensensible vs. PCM TES.
This paper reports a study of a dual source (solar thermal and ground) absorption heat pumpsystem. The solar thermal energy is used directly for domestic hot water (DHW) and for heating, and itis also used as heat source for the heat pump, or to regenerate the ground when the system operatesfor summer air conditioning. In this case, condensation heat from the absorption chiller can be usefullydirected to the post-heating coils of the air handling units, or to regenerate the ground as well.
Annual simulations by the dynamic simulation software Trnsys are carried out based onan existing building that will be retrofitted during 2019 to become a nearly zero energy building(nZEB). The building is an old school sited in Feltre, northern Italy. The dual source and solarcooling/heating plant presents three thermal storage tanks: the first producing hot water for heating,the second for DHW, and the third producing cold water for cooling. An optimization of the solarand ground field designs from both energy and economic point of view is performed by dynamicsimulations. Subsequently, the energy performance of the plant is evaluated by considering differentcases: all the three tanks modeled as sensible (water) storage, or one of the tanks modeled as PCMstorage, or as enhanced PCM with metal foam.
In the first part of the paper, the Trnsys type 860 is validated against some data collected duringexperimental tests. Then, two issues are examined with the aim of minimizing the primary energy

Appl. Sci. 2019, 9, 1007 3 of 21
consumption and maximizing the economic advantage with respect to a traditional heating/coolingplant: the evaluation of the best size of the solar field/ground probes/thermal storage tanks, and thebest choice for designing one of the three storages as a “PCM storage” or “enhanced PCM storage”.
It is suitable to introduce the analysis by a brief description of PCM–water hybrid thermal storagefrom the modeling point of view, and its validation with experimental data (Section 2.1). Subsequently,the retrofitting intervention on the building is described with the aim to calculate the heating, cooling,and DHW thermal loads (Section 2.2). Then, the HVAC plant and its control logic modeled in Trnsysare described (Sections 2.3 and 2.4). Section 2.5 reports on the correct setting of the parameters of type860 to simulate PCM and enhanced PCM with Al foam. In Section 3, the main energy and economicresults of the optimization analysis are reported and discussed.
2. Materials and Methods
2.1. PCM–Water Hybrid Thermal Storage
2.1.1. Dynamic Simulation Model
A simulation model was developed in Trnsys based on type 860 proposed by Bony andCitherlet [18] to simulate water storage tanks including PCM modules (vertical cylinders, plates,or spheres bed). The model is a useful tool to predict the possible improvement of thermal energystorage capacity of PCM with Al-foam with respect to PCM. A detailed validation with experimentaldata was done in previous works [21,23] by comparing the temperature along the section of the tubesat fixed heights. Here, for the sake of clarity, only the main aspects of the analysis and validation of thetype 860 are reported and discussed.
This model is based on an enthalpy approach which means that, for a given volume and material,a continuous and reversible function can be evaluated to obtain the local temperature, depending onthe calculated enthalpy. This temperature is used to determine the node temperature, according tothe enthalpy of the system at a given time. The type takes into the account both the conduction andconvection into PCM as well as at the interface between PCM and water.
The tank was modeled to be made of stainless steel, 700 mm height, 350 mm diameter, 1 mm thick,water inlet at 700 mm height, and outlet at the bottom base, in order to validate it with previouslymeasured experimental data [9–11]. The tank was vertically divided into 35 water nodes (derivatives)and 30 PCM nodes, so axial nodes are 2 cm apart each other (Figure 1a).
The simulations were made at an imposed inlet temperature in order to make them comparable tothe experimental tests. This condition was obtained by fixing tank inlet water flow rate and temperatureat 500 L h−1 and 50 ◦C, respectively. Type 860 was set up with many parameters, among those:
• the temperature–enthalpy characteristic of the PCM (Figure 1b reports the curve of the paraffinwax considered in the simulations);
• type and dimensions of the encapsulation: the PCM was considered inserted into two Al tubes(height 600 mm, inner diameter 48.6 mm, outer diameter 50.8 mm). One tube was supposed to befilled with the PCM, the other one with the PCM embedded in the Al-foam;
• values of solid and liquid thermal conductivity, specific heat capacity, and latent heat of fusion ofthe PCM as described in Table 1;
• the hysteresis parameter of type 860 was set up at 2.5 ◦C.

Appl. Sci. 2019, 9, 1007 4 of 21Appl. Sci. 2019, 9, x FOR PEER REVIEW 4 of 21
(a) (b)
Figure 1. (a) Schematic of the simulated system (not in scale, in millimeters); (b) enthalpy–temperature curve for the paraffin used in the simulations for type validation.
Table 1. Main thermo-physical properties of the paraffin RT40.
Phase Change Temperature (range) (°C)
Density (solid)
(kg m−3)
Density (liquid) (kg m−3)
Latent Heat
Capacity (kJ kg−1)
Specific Heat
Capacity (solid) (kJ kg−1 K−1)
Specific Heat
Capacity (liquid) (kJ
kg−1 K−1)
Thermal Conductivity (W m−1 K−1)
Volume Expansion
(%)
38–43 880 760 165 3.00 2.30 0.21 12.5
As type 860 cannot directly simulate metal foams inside the PCM encapsulation, the parameters related to radial and axial thermal conductivity of PCM in the liquid phase were simulated by the simplified model by Wang et al. [24]. The present authors estimated an apparent thermal conductivity of paraffin/Al foam composite phase change material, calculated as the equivalent thermal conductivity of an ideal homogeneous material exchanging the same heat as the real paraffin/Al foam composite. As the thermal conductivity of the Al foam alloy is equal to λAl = 170 W m−1 K−1, and that of the paraffin λPCM = 0.21 W m−1 K−1, the model estimates the apparent thermal conductivity of the composite PCM (λa) by a series–parallel model of metal material and filler material as by Wang et al. [24]. The apparent thermal conductivity is within two limits, λmin and λmax, defined when Al and paraffin are arranged in series and in parallel, respectively (Equation (1)): 𝜆 = 𝜆 𝜆𝜀𝜆 + (1 − 𝜀)𝜆 𝜆 = 𝜀𝜆 + (1 − 𝜀)𝜆 (1)
where λAl and λPCM are the thermal conductivities of Al foam and paraffin respectively, and ε is the porosity of Al foam. The apparent thermal conductivity λa can be calculated by Equation (2) once the angle β between heat flux and the arrangement of materials is determined [25]:
𝜆 = 𝜆 𝑐𝑜𝑠 𝛽 + 𝜆 𝑠𝑖𝑛 𝛽 where 𝑡𝑎𝑛 𝛽 = 16(1 − ε)𝜀 (2)
As such, for porosity ε fixed at 0.90, 0.93, and 0.95 according to the experiment carried out by Lazzarin et al. [11,20], the apparent thermal conductivity for the composite PCM in the liquid phase was 17.2, 12.1, and 8.70 W m−1 K−1, respectively. Instead, the thermal conductivity of the composite PCM in the solid phase was fixed to be the same as the PCM (0.21 W m−1 K−1). In fact, the thermal energy exchange inside the solid PCM with Al-foam is due to conduction (convective heat transfer is negligible), as already demonstrated in Mancin et al. [8]. For such a reason, and because of the previous cited setting of the type parameters, no useful validation error was reported in the following analysis.
2.1.2. Experimental Setup, Test Procedure, and Model Assessment
Figure 1. (a) Schematic of the simulated system (not in scale, in millimeters); (b) enthalpy–temperaturecurve for the paraffin used in the simulations for type validation.
Table 1. Main thermo-physical properties of the paraffin RT40.
PhaseChange
Temperature(range) (◦C)
Density(solid)
(kg m−3)
Density(liquid)
(kg m−3)
Latent HeatCapacity(kJ kg−1)
Specific HeatCapacity (solid)(kJ kg−1 K−1)
Specific HeatCapacity(liquid)
(kJ kg−1 K−1)
ThermalConductivity(W m−1 K−1)
VolumeExpansion
(%)
38–43 880 760 165 3.00 2.30 0.21 12.5
As type 860 cannot directly simulate metal foams inside the PCM encapsulation, the parametersrelated to radial and axial thermal conductivity of PCM in the liquid phase were simulated bythe simplified model by Wang et al. [24]. The present authors estimated an apparent thermalconductivity of paraffin/Al foam composite phase change material, calculated as the equivalentthermal conductivity of an ideal homogeneous material exchanging the same heat as the realparaffin/Al foam composite. As the thermal conductivity of the Al foam alloy is equal to λAl =170 W m−1 K−1, and that of the paraffin λPCM = 0.21 W m−1 K−1, the model estimates the apparentthermal conductivity of the composite PCM (λa) by a series–parallel model of metal material and fillermaterial as by Wang et al. [24]. The apparent thermal conductivity is within two limits, λmin and λmax,defined when Al and paraffin are arranged in series and in parallel, respectively (Equation (1)):
λmin =λAlλPCM
ελAl + (1 − ε)λPCMλmax = ελPCM + (1 − ε)λAl (1)
where λAl and λPCM are the thermal conductivities of Al foam and paraffin respectively, and ε is theporosity of Al foam. The apparent thermal conductivity λa can be calculated by Equation (2) once theangle β between heat flux and the arrangement of materials is determined [25]:
λa =√
λ2maxcos2β + λ2
minsin2β where tan2β = 16(1 − ε)ε3ln(
λAlλPCM
)(
λAlλPCM
− 1) (2)
As such, for porosity ε fixed at 0.90, 0.93, and 0.95 according to the experiment carried out byLazzarin et al. [11,20], the apparent thermal conductivity for the composite PCM in the liquid phasewas 17.2, 12.1, and 8.70 W m−1 K−1, respectively. Instead, the thermal conductivity of the compositePCM in the solid phase was fixed to be the same as the PCM (0.21 W m−1 K−1). In fact, the thermalenergy exchange inside the solid PCM with Al-foam is due to conduction (convective heat transfer isnegligible), as already demonstrated in Mancin et al. [8]. For such a reason, and because of the previouscited setting of the type parameters, no useful validation error was reported in the following analysis.

Appl. Sci. 2019, 9, 1007 5 of 21
2.1.2. Experimental Setup, Test Procedure, and Model Assessment
The experimental test rig presented in Figure 2 was already described in previous works of theauthors [10,20,23]. However, for reader’s convenience, the main characteristics of the experimentalsetup are reported here. It is designed to study the heat transfer performance of PCMs with andwithout Al foam as a heat transfer medium in hybrid water TESs. The temperature of the water inthe tank was kept at the desired value by controlling the electrical power and the water flow rate.The hot water coming from the 70 L water tank first passed through a brazed plate heat exchanger(BPHE) to be cooled down by tap water, and then it was pumped into an electrical heater (9 kW) drivenby a PID (Proportional, Integrative, Derivative) regulator. Then it entered again into the water tank.As illustrated in Figure 2, two similar tubes could be tested at the same time, both containing around1 kg of paraffin wax, but only one was implementing the enhanced surface. Both tubes were tested atconstant water temperatures in order to monitor and to directly compare the loading and unloadingtimes, and to study the effects of Al foams on the heat transfer performance during the solid–liquidphase change of the paraffin wax.
Appl. Sci. 2019, 9, x FOR PEER REVIEW 5 of 21
The experimental test rig presented in Figure 2 was already described in previous works of the authors [10,20,23]. However, for reader’s convenience, the main characteristics of the experimental setup are reported here. It is designed to study the heat transfer performance of PCMs with and without Al foam as a heat transfer medium in hybrid water TESs. The temperature of the water in the tank was kept at the desired value by controlling the electrical power and the water flow rate. The hot water coming from the 70 L water tank first passed through a brazed plate heat exchanger (BPHE) to be cooled down by tap water, and then it was pumped into an electrical heater (9 kW) driven by a PID (Proportional, Integrative, Derivative) regulator. Then it entered again into the water tank. As illustrated in Figure 2, two similar tubes could be tested at the same time, both containing around 1 kg of paraffin wax, but only one was implementing the enhanced surface. Both tubes were tested at constant water temperatures in order to monitor and to directly compare the loading and unloading times, and to study the effects of Al foams on the heat transfer performance during the solid–liquid phase change of the paraffin wax.
(a) (b)
Figure 2. (a) Schematic of the experimental setup and (b) location of the temperature probes (in millimeters).
The commercial paraffin wax Rubitherm® RT40 was used in the tests. Table 1 reports its main thermophysical properties. As it can be noticed, the selected paraffin shows many desirable characteristics: high latent heat, low vapor pressure in the melt, chemical inertia and stability, non-toxicity, and a very low price. Nevertheless, two main drawbacks are present: low thermal conductivity and high volume change during the melting process.
The test samples consisted of 800 mm long, 2” (50.8 mm) OD tubes, closed on one side. One of these tubes was empty and it was filled up with the selected paraffin wax; the others were manufactured to locate different 600 mm long Al-foam cylinders, which were brazed to the inside tube wall to minimize the contact resistance. As reported in Figure 2b, each tube was equipped with 6 calibrated T-type thermocouples with an accuracy of ±0.05 K to monitor the phase-change process at different tube heights: two thermocouples, one in the centre (25 mm from the surface) and one at half of the section (12.5 mm from the surface), at three different heights of the tubes called top, centre, and bottom.
The tests involved both the melting and solidification processes. The water contained in the tank (around 70 L) was heated up to the set temperature, 50 °C, by means of the electrical heater. Then, the two instrumented tubes were inserted in the water tank and all the data were recorded (i.e., loading process). Once the measured paraffin temperatures read by the installed thermocouples asymptotically approached the water temperature and remained almost constant, the hot water was purged out and the tank reloaded with tap water to study the solidification (i.e., unloading process). The unloading (i.e., solidification) process was considered concluded when all the paraffin temperature readings became constant, close to that of the water tank. The imposed experimental boundary condition was then “constant water temperature”, and it was fixed by monitoring the
Figure 2. (a) Schematic of the experimental setup and (b) location of the temperature probes(in millimeters).
The commercial paraffin wax Rubitherm® RT40 was used in the tests. Table 1 reports its mainthermophysical properties. As it can be noticed, the selected paraffin shows many desirable characteristics:high latent heat, low vapor pressure in the melt, chemical inertia and stability, non-toxicity, and a very lowprice. Nevertheless, two main drawbacks are present: low thermal conductivity and high volume changeduring the melting process.
The test samples consisted of 800 mm long, 2” (50.8 mm) OD tubes, closed on one side. One ofthese tubes was empty and it was filled up with the selected paraffin wax; the others were manufacturedto locate different 600 mm long Al-foam cylinders, which were brazed to the inside tube wall tominimize the contact resistance. As reported in Figure 2b, each tube was equipped with 6 calibratedT-type thermocouples with an accuracy of ±0.05 K to monitor the phase-change process at differenttube heights: two thermocouples, one in the centre (25 mm from the surface) and one at half of thesection (12.5 mm from the surface), at three different heights of the tubes called top, centre, and bottom.
The tests involved both the melting and solidification processes. The water contained in the tank(around 70 L) was heated up to the set temperature, 50 ◦C, by means of the electrical heater. Then,the two instrumented tubes were inserted in the water tank and all the data were recorded (i.e., loadingprocess). Once the measured paraffin temperatures read by the installed thermocouples asymptoticallyapproached the water temperature and remained almost constant, the hot water was purged out andthe tank reloaded with tap water to study the solidification (i.e., unloading process). The unloading(i.e., solidification) process was considered concluded when all the paraffin temperature readingsbecame constant, close to that of the water tank. The imposed experimental boundary condition was
Appl. Sci. 2019, 9, 1007 6 of 21
then “constant water temperature”, and it was fixed by monitoring the water temperatures at differenttank heights (Figure 2) with registered differences always less than 0.1 K.
Simulations were aimed to determine the radial (along the section of the tubes) temperaturedistribution at different heights of the tubes, in order to compare it against experimental results.The comparison is between a tank with two tubes with paraffin only, and one with two tubes with theparaffin/Al-foam composite PCM. Each tube, which was 700 mm high, was divided in 35 nodes. Thus,the PCM occupied the height from the 6th to the 35th node from the top (Figure 1a).
The comparison between simulation and experimental data was done in order to validate thenumerical model. For such a reason, the simulations were run at the same initial conditions as theexperiments: for example, for loading the initial PCM–Al-foam tubes at a temperature of 20 ◦C,the water temperature was fixed at 50 ◦C.
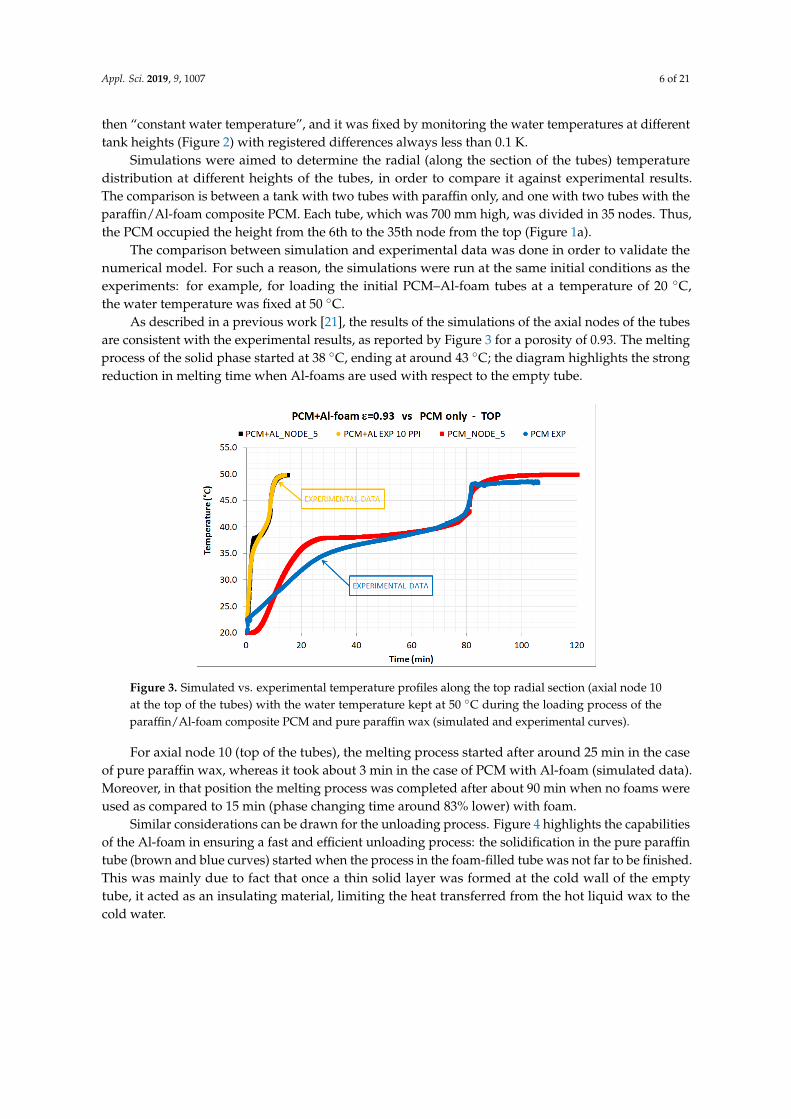
As described in a previous work [21], the results of the simulations of the axial nodes of the tubesare consistent with the experimental results, as reported by Figure 3 for a porosity of 0.93. The meltingprocess of the solid phase started at 38 ◦C, ending at around 43 ◦C; the diagram highlights the strongreduction in melting time when Al-foams are used with respect to the empty tube.
Appl. Sci. 2019, 9, x FOR PEER REVIEW 6 of 21
water temperatures at different tank heights (Figure 2) with registered differences always less than 0.1 K.
Simulations were aimed to determine the radial (along the section of the tubes) temperature distribution at different heights of the tubes, in order to compare it against experimental results. The comparison is between a tank with two tubes with paraffin only, and one with two tubes with the paraffin/Al-foam composite PCM. Each tube, which was 700 mm high, was divided in 35 nodes. Thus, the PCM occupied the height from the 6th to the 35th node from the top (Figure 1a).
The comparison between simulation and experimental data was done in order to validate the numerical model. For such a reason, the simulations were run at the same initial conditions as the experiments: for example, for loading the initial PCM–Al-foam tubes at a temperature of 20 °C, the water temperature was fixed at 50 °C.
As described in a previous work [21], the results of the simulations of the axial nodes of the tubes are consistent with the experimental results, as reported by Figure 3 for a porosity of 0.93. The melting process of the solid phase started at 38 °C, ending at around 43 °C; the diagram highlights the strong reduction in melting time when Al-foams are used with respect to the empty tube.
Figure 3. Simulated vs. experimental temperature profiles along the top radial section (axial node 10 at the top of the tubes) with the water temperature kept at 50 °C during the loading process of the paraffin/Al-foam composite PCM and pure paraffin wax (simulated and experimental curves).
For axial node 10 (top of the tubes), the melting process started after around 25 min in the case of pure paraffin wax, whereas it took about 3 min in the case of PCM with Al-foam (simulated data). Moreover, in that position the melting process was completed after about 90 min when no foams were used as compared to 15 min (phase changing time around 83% lower) with foam.
Similar considerations can be drawn for the unloading process. Figure 4 highlights the capabilities of the Al-foam in ensuring a fast and efficient unloading process: the solidification in the pure paraffin tube (brown and blue curves) started when the process in the foam-filled tube was not far to be finished. This was mainly due to fact that once a thin solid layer was formed at the cold wall of the empty tube, it acted as an insulating material, limiting the heat transferred from the hot liquid wax to the cold water.
Figure 3. Simulated vs. experimental temperature profiles along the top radial section (axial node 10at the top of the tubes) with the water temperature kept at 50 ◦C during the loading process of theparaffin/Al-foam composite PCM and pure paraffin wax (simulated and experimental curves).
For axial node 10 (top of the tubes), the melting process started after around 25 min in the caseof pure paraffin wax, whereas it took about 3 min in the case of PCM with Al-foam (simulated data).Moreover, in that position the melting process was completed after about 90 min when no foams wereused as compared to 15 min (phase changing time around 83% lower) with foam.
Similar considerations can be drawn for the unloading process. Figure 4 highlights the capabilitiesof the Al-foam in ensuring a fast and efficient unloading process: the solidification in the pure paraffintube (brown and blue curves) started when the process in the foam-filled tube was not far to be finished.This was mainly due to fact that once a thin solid layer was formed at the cold wall of the emptytube, it acted as an insulating material, limiting the heat transferred from the hot liquid wax to thecold water.

Appl. Sci. 2019, 9, 1007 7 of 21
Appl. Sci. 2019, 9, x FOR PEER REVIEW 7 of 21
Figure 4. Temperature profiles (axial node 10 at the top of the tubes) during the unloading process of paraffin/Al-foam composite PCM and pure paraffin wax (simulated and experimental curves). Water temperature was kept at 23 °C. Experimental temperature was measured in the centre of the section.
2.2. Building Retrofitting and Thermal Loads Calculation
The building that is going to be retrofitted in 2019 is part of an old (completed in 1960) high school building of Feltre, situated in the province of Belluno, northern Italy, in the Dolomiti Mountains area. The climate is rather severe in wintertime (3100 degree-days). The gym and the laboratories will be retrofitted in order to become a nZEB. The retrofitting will be done by the Belluno Province Administration, a public authority charged with the public education service. The main part of the retrofitted building is a large gym (33 m × 25 m × 8.40 m, expanding on two levels). Changing rooms, bathrooms with toilet and showers, and technical rooms are located on the ground floor; an office, a small gym, and a bar are on the first floor. On the second floor, six laboratories will be retrofitted and made newly available (Figures 5 and 6).
(a) (b)
Figure 5. The retrofitting intervention and definition of thermal zones for the ground floor (a) and first floor (b).
Figure 4. Temperature profiles (axial node 10 at the top of the tubes) during the unloading process ofparaffin/Al-foam composite PCM and pure paraffin wax (simulated and experimental curves). Watertemperature was kept at 23 ◦C. Experimental temperature was measured in the centre of the section.
2.2. Building Retrofitting and Thermal Loads Calculation
The building that is going to be retrofitted in 2019 is part of an old (completed in 1960) highschool building of Feltre, situated in the province of Belluno, northern Italy, in the Dolomiti Mountainsarea. The climate is rather severe in wintertime (3100 degree-days). The gym and the laboratorieswill be retrofitted in order to become a nZEB. The retrofitting will be done by the Belluno ProvinceAdministration, a public authority charged with the public education service. The main part of theretrofitted building is a large gym (33 m × 25 m × 8.40 m, expanding on two levels). Changing rooms,bathrooms with toilet and showers, and technical rooms are located on the ground floor; an office,a small gym, and a bar are on the first floor. On the second floor, six laboratories will be retrofitted andmade newly available (Figures 5 and 6).
Appl. Sci. 2019, 9, x FOR PEER REVIEW 7 of 21
Figure 4. Temperature profiles (axial node 10 at the top of the tubes) during the unloading process of paraffin/Al-foam composite PCM and pure paraffin wax (simulated and experimental curves). Water temperature was kept at 23 °C. Experimental temperature was measured in the centre of the section.
2.2. Building Retrofitting and Thermal Loads Calculation
The building that is going to be retrofitted in 2019 is part of an old (completed in 1960) high school building of Feltre, situated in the province of Belluno, northern Italy, in the Dolomiti Mountains area. The climate is rather severe in wintertime (3100 degree-days). The gym and the laboratories will be retrofitted in order to become a nZEB. The retrofitting will be done by the Belluno Province Administration, a public authority charged with the public education service. The main part of the retrofitted building is a large gym (33 m × 25 m × 8.40 m, expanding on two levels). Changing rooms, bathrooms with toilet and showers, and technical rooms are located on the ground floor; an office, a small gym, and a bar are on the first floor. On the second floor, six laboratories will be retrofitted and made newly available (Figures 5 and 6).
(a) (b)
Figure 5. The retrofitting intervention and definition of thermal zones for the ground floor (a) and first floor (b). Figure 5. The retrofitting intervention and definition of thermal zones for the ground floor (a) andfirst floor (b).

Appl. Sci. 2019, 9, 1007 8 of 21Appl. Sci. 2019, 9, x FOR PEER REVIEW 8 of 21
(a) (b)
Figure 6. The retrofitting intervention and definition of thermal zones for the second floor (a); building as is and post-intervention (b).
The building has a total floor area of 2435 m2, an outward surface area of 2505 m2, and an enclosed gross heated volume of 11,060 m3. The design of the retrofit intervention is carried out to obtain a nZEB: the envelope is well insulated, with outer walls and roof allowing for an average thermal transmittance of approximately 0.15 W m−2 K−1, floor to the ground of 0.5 W m−2 K−1, and the glazing system of 0.7 W m−2 K−1. In Italy, such an intervention benefits from the “conto termico 2.0” (thermal incentive 2.0) that has been operating since 2016 (see Section 3.2).
Based on the Trnsys 17 dynamic simulation, each thermal zone of the building is defined by means of scheduling the presence of people, type of activity, lighting and other internal gains, and air temperature set points. For the heating season, temperature is fixed at values between 17 °C and 20 °C for the large gym (at ground floor) and the small gym (at first floor), whereas it is fixed at 19–21 °C for the other rooms, depending on the time of day. The same set point for cooling is fixed at 22–24 °C and 24–27 °C, respectively. For ventilation, the set point for inlet air is fixed at 18 °C for gyms and 19 °C for other rooms for heating, and 21 °C and 24 °C respectively for cooling.
The HVAC system provides ventilation (by two air handling units, AHU), space heating and cooling, and DHW production. Figure 7 reports the heating, cooling, and DHW monthly energy needs calculated with a 0.25 h simulation time step.
Figure 7. Monthly energy needs in terms of heating, cooling, ventilation (hot and cold coils of air handling units (AHU)), and domestic hot water (DHW).
Figure 6. The retrofitting intervention and definition of thermal zones for the second floor (a); buildingas is and post-intervention (b).
The building has a total floor area of 2435 m2, an outward surface area of 2505 m2, and an enclosedgross heated volume of 11,060 m3. The design of the retrofit intervention is carried out to obtain a nZEB:the envelope is well insulated, with outer walls and roof allowing for an average thermal transmittanceof approximately 0.15 W m−2 K−1, floor to the ground of 0.5 W m−2 K−1, and the glazing system of0.7 W m−2 K−1. In Italy, such an intervention benefits from the “conto termico 2.0” (thermal incentive2.0) that has been operating since 2016 (see Section 3.2).
Based on the Trnsys 17 dynamic simulation, each thermal zone of the building is defined bymeans of scheduling the presence of people, type of activity, lighting and other internal gains, and airtemperature set points. For the heating season, temperature is fixed at values between 17 ◦C and 20 ◦Cfor the large gym (at ground floor) and the small gym (at first floor), whereas it is fixed at 19–21 ◦C forthe other rooms, depending on the time of day. The same set point for cooling is fixed at 22–24 ◦C and24–27 ◦C, respectively. For ventilation, the set point for inlet air is fixed at 18 ◦C for gyms and 19 ◦C forother rooms for heating, and 21 ◦C and 24 ◦C respectively for cooling.
The HVAC system provides ventilation (by two air handling units, AHU), space heating andcooling, and DHW production. Figure 7 reports the heating, cooling, and DHW monthly energy needscalculated with a 0.25 h simulation time step.
Appl. Sci. 2019, 9, x FOR PEER REVIEW 8 of 21
(a) (b)
Figure 6. The retrofitting intervention and definition of thermal zones for the second floor (a); building as is and post-intervention (b).
The building has a total floor area of 2435 m2, an outward surface area of 2505 m2, and an enclosed gross heated volume of 11,060 m3. The design of the retrofit intervention is carried out to obtain a nZEB: the envelope is well insulated, with outer walls and roof allowing for an average thermal transmittance of approximately 0.15 W m−2 K−1, floor to the ground of 0.5 W m−2 K−1, and the glazing system of 0.7 W m−2 K−1. In Italy, such an intervention benefits from the “conto termico 2.0” (thermal incentive 2.0) that has been operating since 2016 (see Section 3.2).
Based on the Trnsys 17 dynamic simulation, each thermal zone of the building is defined by means of scheduling the presence of people, type of activity, lighting and other internal gains, and air temperature set points. For the heating season, temperature is fixed at values between 17 °C and 20 °C for the large gym (at ground floor) and the small gym (at first floor), whereas it is fixed at 19–21 °C for the other rooms, depending on the time of day. The same set point for cooling is fixed at 22–24 °C and 24–27 °C, respectively. For ventilation, the set point for inlet air is fixed at 18 °C for gyms and 19 °C for other rooms for heating, and 21 °C and 24 °C respectively for cooling.
The HVAC system provides ventilation (by two air handling units, AHU), space heating and cooling, and DHW production. Figure 7 reports the heating, cooling, and DHW monthly energy needs calculated with a 0.25 h simulation time step.
Figure 7. Monthly energy needs in terms of heating, cooling, ventilation (hot and cold coils of air handling units (AHU)), and domestic hot water (DHW).
Figure 7. Monthly energy needs in terms of heating, cooling, ventilation (hot and cold coils of airhandling units (AHU)), and domestic hot water (DHW).
Appl. Sci. 2019, 9, 1007 9 of 21
The maximum cooling load (21.6 kW) occurs at the beginning of June, when the school is still fullyoperating, that is, it is open to students and professors, and gyms are open to extracurricular activitiesas well. The maximum heating load (−44.6 kW) occurs in the second half of January. However,even during summer months, post heating ventilation requires some heat. During the heating season,ventilation needs are prevailing with respect to heating needs; this is a consequence of the very highthermal insulation of the retrofitted building and of the minimization of thermal bridges. Moreover,DHW needs (2000 L per day at 45 ◦C) are a large quota of the total heat request.
2.3. The HVAC Plant
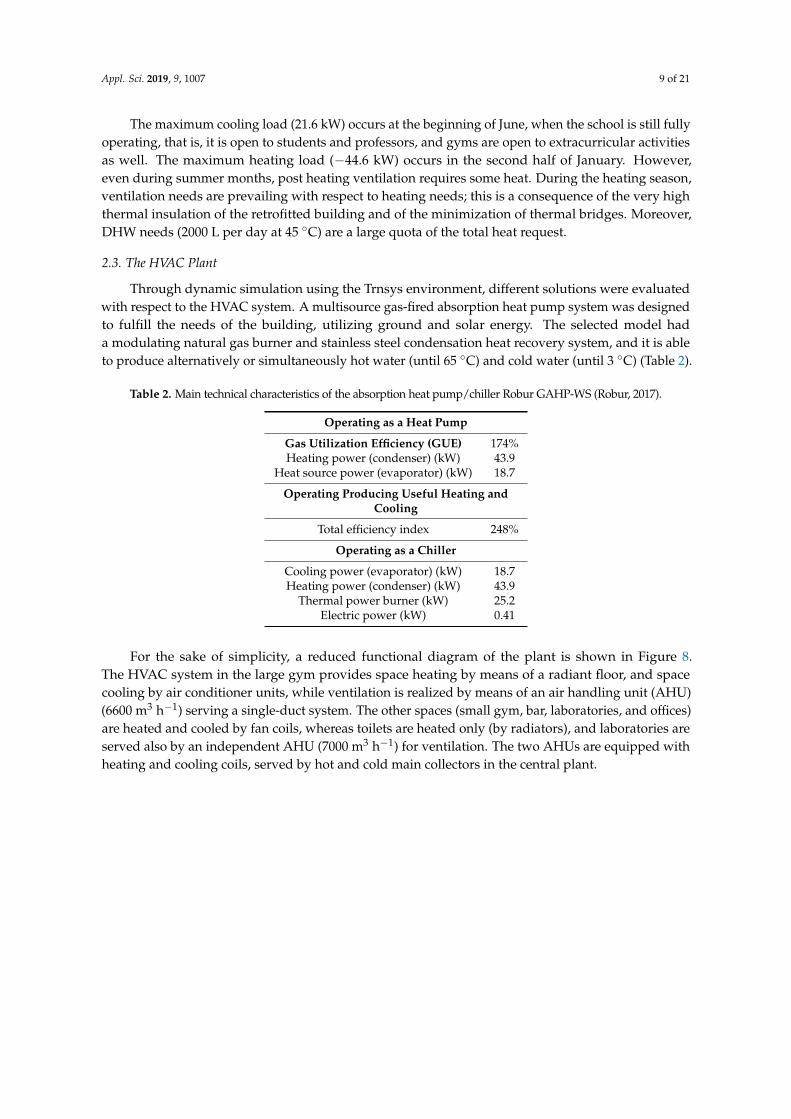
Through dynamic simulation using the Trnsys environment, different solutions were evaluatedwith respect to the HVAC system. A multisource gas-fired absorption heat pump system was designedto fulfill the needs of the building, utilizing ground and solar energy. The selected model hada modulating natural gas burner and stainless steel condensation heat recovery system, and it is ableto produce alternatively or simultaneously hot water (until 65 ◦C) and cold water (until 3 ◦C) (Table 2).
Table 2. Main technical characteristics of the absorption heat pump/chiller Robur GAHP-WS (Robur, 2017).
Operating as a Heat Pump
Gas Utilization Efficiency (GUE) 174%Heating power (condenser) (kW) 43.9
Heat source power (evaporator) (kW) 18.7
Operating Producing Useful Heating andCooling
Total efficiency index 248%
Operating as a Chiller
Cooling power (evaporator) (kW) 18.7Heating power (condenser) (kW) 43.9
Thermal power burner (kW) 25.2Electric power (kW) 0.41
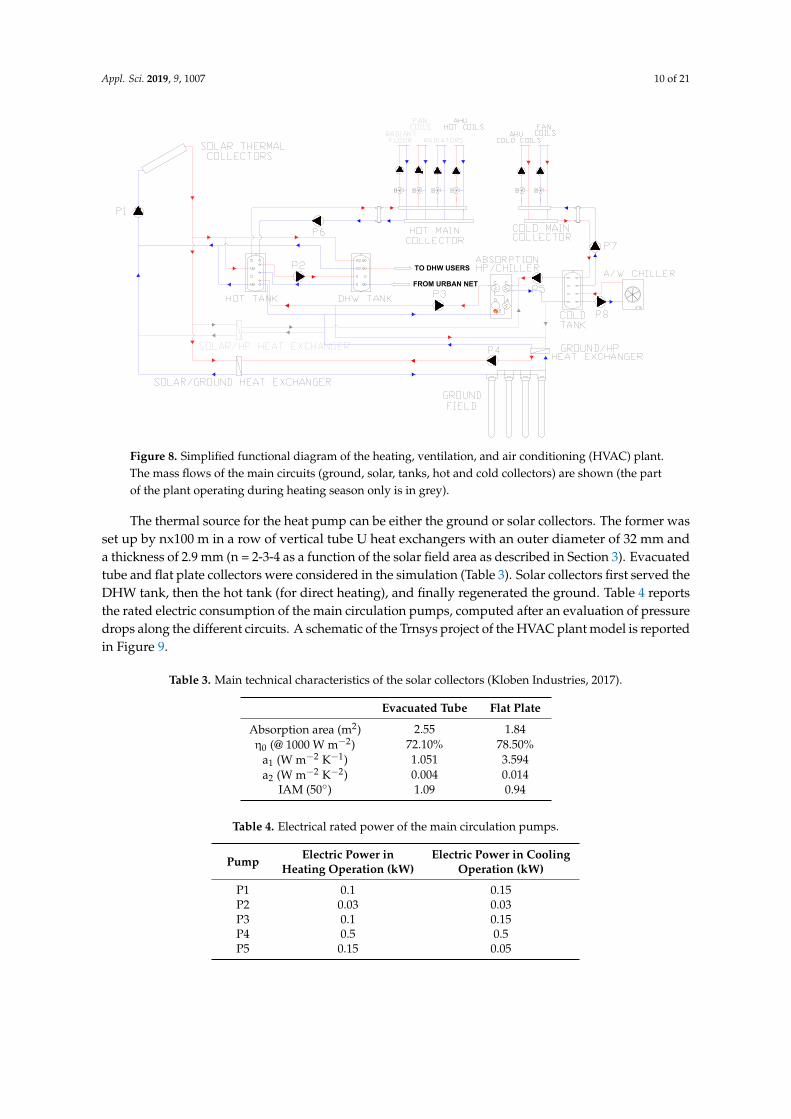
For the sake of simplicity, a reduced functional diagram of the plant is shown in Figure 8.The HVAC system in the large gym provides space heating by means of a radiant floor, and spacecooling by air conditioner units, while ventilation is realized by means of an air handling unit (AHU)(6600 m3 h−1) serving a single-duct system. The other spaces (small gym, bar, laboratories, and offices)are heated and cooled by fan coils, whereas toilets are heated only (by radiators), and laboratories areserved also by an independent AHU (7000 m3 h−1) for ventilation. The two AHUs are equipped withheating and cooling coils, served by hot and cold main collectors in the central plant.
Appl. Sci. 2019, 9, 1007 10 of 21Appl. Sci. 2019, 9, x FOR PEER REVIEW 10 of 21
Figure 8. Simplified functional diagram of the heating, ventilation, and air conditioning (HVAC) plant. The mass flows of the main circuits (ground, solar, tanks, hot and cold collectors) are shown (the part of the plant operating during heating season only is in grey).
The thermal source for the heat pump can be either the ground or solar collectors. The former was set up by nx100 m in a row of vertical tube U heat exchangers with an outer diameter of 32 mm and a thickness of 2.9 mm (n = 2-3-4 as a function of the solar field area as described in Section 3). Evacuated tube and flat plate collectors were considered in the simulation (Table 3). Solar collectors first served the DHW tank, then the hot tank (for direct heating), and finally regenerated the ground. Table 4 reports the rated electric consumption of the main circulation pumps, computed after an evaluation of pressure drops along the different circuits. A schematic of the Trnsys project of the HVAC plant model is reported in Figure 9.
Table 3. Main technical characteristics of the solar collectors (Kloben Industries, 2017).
Evacuated Tube Flat Plate Absorption area (m2) 2.55 1.84 η0 (@ 1000 W m−2) 72.10% 78.50%
a1 (W m−2 K−1) 1.051 3.594 a2 (W m−2 K−2) 0.004 0.014
IAM (50°) 1.09 0.94
Table 4. Electrical rated power of the main circulation pumps.
Pump Electric Power in Heating Operation (kW)
Electric Power in Cooling Operation (kW)
P1 0.1 0.15 P2 0.03 0.03 P3 0.1 0.15 P4 0.5 0.5 P5 0.15 0.05
Figure 8. Simplified functional diagram of the heating, ventilation, and air conditioning (HVAC) plant.The mass flows of the main circuits (ground, solar, tanks, hot and cold collectors) are shown (the partof the plant operating during heating season only is in grey).
The thermal source for the heat pump can be either the ground or solar collectors. The former wasset up by nx100 m in a row of vertical tube U heat exchangers with an outer diameter of 32 mm anda thickness of 2.9 mm (n = 2-3-4 as a function of the solar field area as described in Section 3). Evacuatedtube and flat plate collectors were considered in the simulation (Table 3). Solar collectors first served theDHW tank, then the hot tank (for direct heating), and finally regenerated the ground. Table 4 reportsthe rated electric consumption of the main circulation pumps, computed after an evaluation of pressuredrops along the different circuits. A schematic of the Trnsys project of the HVAC plant model is reportedin Figure 9.
Table 3. Main technical characteristics of the solar collectors (Kloben Industries, 2017).
Evacuated Tube Flat Plate
Absorption area (m2) 2.55 1.84η0 (@ 1000 W m−2) 72.10% 78.50%
a1 (W m−2 K−1) 1.051 3.594a2 (W m−2 K−2) 0.004 0.014
IAM (50◦) 1.09 0.94
Table 4. Electrical rated power of the main circulation pumps.
Pump Electric Power inHeating Operation (kW)
Electric Power in CoolingOperation (kW)
P1 0.1 0.15P2 0.03 0.03P3 0.1 0.15P4 0.5 0.5P5 0.15 0.05

Appl. Sci. 2019, 9, 1007 11 of 21Appl. Sci. 2019, 9, x FOR PEER REVIEW 11 of 21
Figure 9. Schematic of the Trnsys project of the HVAC plant model.
2.4. Control Logic of the HVAC Plant
The large gym AHU is scheduled to work from 8 a.m. to 10 p.m. every day, and that of the laboratories from 8 a.m. to 6 p.m. from Monday to Friday. The solar system is activated whenever the measured global solar radiation on the plane of collectors (tilt 18°, orientation South-East) exceeds a threshold radiation (100 W m−2). This is the radiation that provides the minimum acceptable efficiency once the solar field characteristics, the minimum average temperature desired, and the outdoor temperature are fixed [26–28]. Solar energy is always first directed to the DHW tank, and successively to the hot tank. When the two tanks exceed the set point temperature at the top (43 °C and 48 °C respectively) and the solar circuit outlet fluid temperature is above 15 °C, the flow is directed to the ground field to regenerate it. In this case, when the absorption machine is operating as a heat pump (heating season), the heat pump evaporator is supplemented by the solar section when its outlet temperature is lower than 30 °C. The DHW tank is first served by solar energy. If solar energy is not enough, thermal energy is provided by the hot tank. The hot tank is fed by the solar circuit, and by the HP condenser. In both tanks, an electric auxiliary heater is present. The absorption HP/chiller is activated once the hot/cold tank temperature falls below/above the given set points (48 °C and 7 °C respectively).
2.5. Setting Parameters of Type 860
As a limit of type 860, it can be used only once in a Trnsys project: no configurations with two PCM storage tanks can be simulated. Thus, concerning the configuration of the three thermal storage tanks represented in Figure 8, seven alternatives are considered (Table 5).
The values of the main parameters of type 860 simulating the three hybrid water–PCM thermal storage tanks are reported in Table 6. The dimensions of the tanks refer to real data from suppliers. The PCM thermal conductivity was fixed as described in previous Section 2.1.1. The thickness of PCM tubes was supposed to be negligible, whereas their number was fixed, allowing a suitable space between each other in order to avoid the risk of laminar water flow around them. Figure 10 reports the enthalpy–temperature curve for the PCMs used in the three tanks. The commercial paraffin waxes Rubitherm® RT47, RT42, and RT7 are used for the hot, DHW, and cold tanks respectively, with phase change temperatures centered in the most suitable range for each tank.
In the case of enhanced Al-foam PCM, the porosity was fixed at 0.93, so its apparent thermal conductivity in liquid phase was 12.1 W m−1 K−1. At ambient temperature, each tube contained 3.63 kg and 3.35 kg for the PCM and enhanced PCM cases respectively.
Figure 9. Schematic of the Trnsys project of the HVAC plant model.
2.4. Control Logic of the HVAC Plant
The large gym AHU is scheduled to work from 8 a.m. to 10 p.m. every day, and that of thelaboratories from 8 a.m. to 6 p.m. from Monday to Friday. The solar system is activated whenever themeasured global solar radiation on the plane of collectors (tilt 18◦, orientation South-East) exceedsa threshold radiation (100 W m−2). This is the radiation that provides the minimum acceptableefficiency once the solar field characteristics, the minimum average temperature desired, and theoutdoor temperature are fixed [26–28]. Solar energy is always first directed to the DHW tank,and successively to the hot tank. When the two tanks exceed the set point temperature at the top(43 ◦C and 48 ◦C respectively) and the solar circuit outlet fluid temperature is above 15 ◦C, the flow isdirected to the ground field to regenerate it. In this case, when the absorption machine is operating asa heat pump (heating season), the heat pump evaporator is supplemented by the solar section when itsoutlet temperature is lower than 30 ◦C. The DHW tank is first served by solar energy. If solar energy isnot enough, thermal energy is provided by the hot tank. The hot tank is fed by the solar circuit, and bythe HP condenser. In both tanks, an electric auxiliary heater is present. The absorption HP/chilleris activated once the hot/cold tank temperature falls below/above the given set points (48 ◦C and7 ◦C respectively).
2.5. Setting Parameters of Type 860
As a limit of type 860, it can be used only once in a Trnsys project: no configurations with twoPCM storage tanks can be simulated. Thus, concerning the configuration of the three thermal storagetanks represented in Figure 8, seven alternatives are considered (Table 5).
The values of the main parameters of type 860 simulating the three hybrid water–PCM thermalstorage tanks are reported in Table 6. The dimensions of the tanks refer to real data from suppliers.The PCM thermal conductivity was fixed as described in previous Section 2.1.1. The thickness ofPCM tubes was supposed to be negligible, whereas their number was fixed, allowing a suitable spacebetween each other in order to avoid the risk of laminar water flow around them. Figure 10 reports theenthalpy–temperature curve for the PCMs used in the three tanks. The commercial paraffin waxesRubitherm® RT47, RT42, and RT7 are used for the hot, DHW, and cold tanks respectively, with phasechange temperatures centered in the most suitable range for each tank.

Appl. Sci. 2019, 9, 1007 12 of 21
In the case of enhanced Al-foam PCM, the porosity was fixed at 0.93, so its apparent thermalconductivity in liquid phase was 12.1 W m−1 K−1. At ambient temperature, each tube contained3.63 kg and 3.35 kg for the PCM and enhanced PCM cases respectively.
Table 5. Alternatives (all based on alternative A3 in Table 7) simulated with different storagetank configurations.
Alternative Hot Tank DHW Tank Cold Tank
B1≡A3 Sensible (water) Sensible (water) Sensible (water)B2 Enhanced PCM Sensible (water) Sensible (water)B3 PCM Sensible (water) Sensible (water)B4 Sensible (water) Enhanced PCM Sensible (water)B5 Sensible (water) PCM Sensible (water)B6 Sensible (water) Sensible (water) Enhanced PCMB7 Sensible (water) Sensible (water) PCM
Table 6. Main parameters of type 860 simulating the three hybrid water–PCM thermal storage tanks asdescribed in Figure 8.
DHW Tank Hot Tank Cold Tank
Tank diameter (mm) 1318 1318 841Tank height (mm) 2200 2200 1800
Tubes diameter (mm) 50 50 50Tube height (mm) 2100 2100 1700Number of tubes 216 216 85PCM radial liquid
conductivity (W m−1 K−1)0.21 0.21 0.21
Enhanced PCM radial liquidconductivity (W m−1 K−1)
12.1 12.1 12.1
Appl. Sci. 2019, 9, x FOR PEER REVIEW 12 of 21
Table 5. Alternatives (all based on alternative A3 in Table 7) simulated with different storage tank configurations.
Alternative Hot Tank DHW Tank Cold Tank B1≡A3 Sensible (water) Sensible (water) Sensible (water)
B2 Enhanced PCM Sensible (water) Sensible (water) B3 PCM Sensible (water) Sensible (water) B4 Sensible (water) Enhanced PCM Sensible (water) B5 Sensible (water) PCM Sensible (water) B6 Sensible (water) Sensible (water) Enhanced PCM B7 Sensible (water) Sensible (water) PCM
Table 6. Main parameters of type 860 simulating the three hybrid water–PCM thermal storage tanks as described in Figure 8.
DHW Tank Hot Tank Cold Tank Tank diameter (mm) 1318 1318 841
Tank height (mm) 2200 2200 1800 Tubes diameter (mm) 50 50 50
Tube height (mm) 2100 2100 1700 Number of tubes 216 216 85 PCM radial liquid
conductivity (W m−1 K−1) 0.21 0.21 0.21
Enhanced PCM radial liquid conductivity (W m−1 K−1)
12.1 12.1 12.1
Figure 10. Enthalpy–temperature curves for the paraffin used in the simulations.
3. Results and Discussion
A full system energy performance evaluation was undertaken at the design stage, firstly considering all three tanks (hot, cold and DHW tanks) as sensible (water) storages. Such an evaluation is useful to select the most viable mixed solution, and to optimize the size of the solar and ground fields (Table 7). As the ground field extension can be reduced when increasing the solar field area, a first attempt of economic analysis was reported in order to evaluate the viability of the proposed solutions, and to identify the most advantageous one. For this, first, energy analysis results were reported on a monthly basis (Section 3.1). Subsequently, annual energy performance results were reported (Sections 3.2 and 3.3) in order to determine the best storage tank configuration among sensible, PCM, and enhanced PCM systems (Table 5).
Figure 10. Enthalpy–temperature curves for the paraffin used in the simulations.
3. Results and Discussion
A full system energy performance evaluation was undertaken at the design stage, firstlyconsidering all three tanks (hot, cold and DHW tanks) as sensible (water) storages. Such an evaluationis useful to select the most viable mixed solution, and to optimize the size of the solar and groundfields (Table 7). As the ground field extension can be reduced when increasing the solar field area,a first attempt of economic analysis was reported in order to evaluate the viability of the proposed
Appl. Sci. 2019, 9, 1007 13 of 21
solutions, and to identify the most advantageous one. For this, first, energy analysis results werereported on a monthly basis (Section 3.1). Subsequently, annual energy performance results werereported (Sections 3.2 and 3.3) in order to determine the best storage tank configuration among sensible,PCM, and enhanced PCM systems (Table 5).
Table 7. Different alternatives simulated with solar field, ground boreholes, and storage tankdimensions (all considering sensible (water) storage).
Alternative Type ofCollector
Solar Field Area(m2)—Ground
Boreholes Depth (m)
DHWTank (L)
HotTank (L)
ColdTank (L)
A1 - 0 1500 1500 1000A2 Evacuated tube 20–400 1500 2000 1000A3 Evacuated tube 40–300 3000 3000 1000A4 Evacuated tube 60–200 3000 5000 1000A5 Flat plate 50–300 3000 5000 1000
3.1. Monthly Energy Analysis
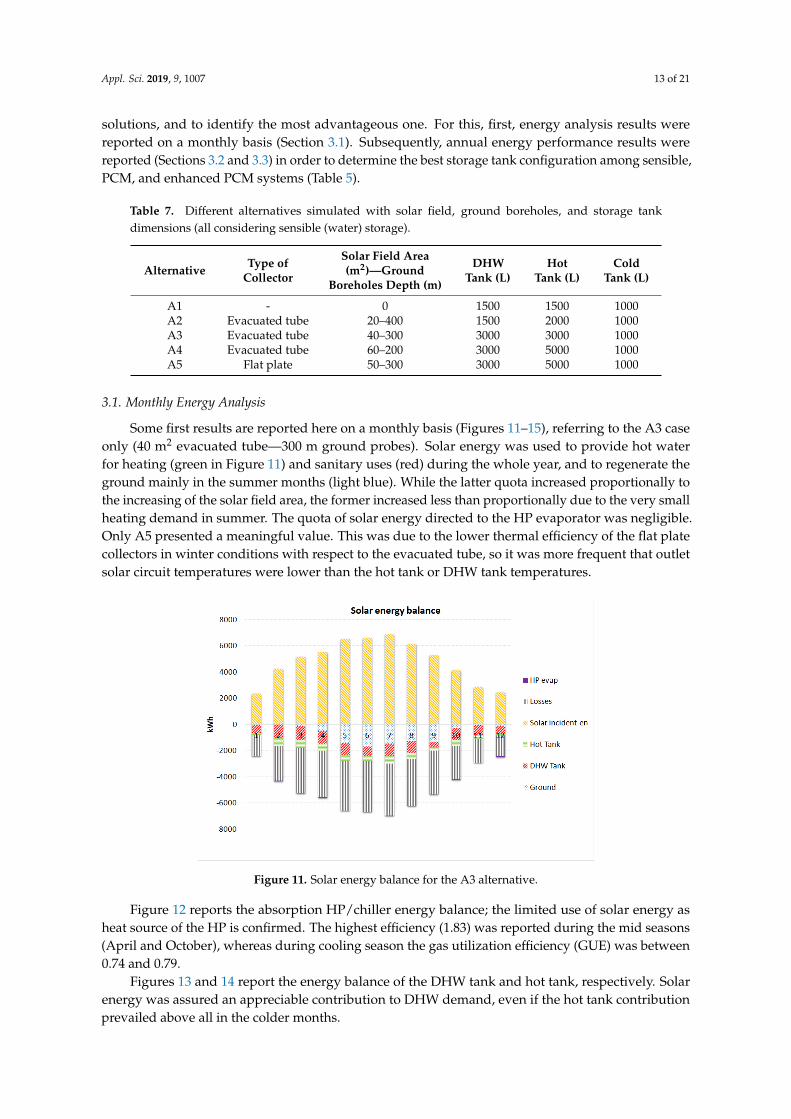
Some first results are reported here on a monthly basis (Figures 11–15), referring to the A3 caseonly (40 m2 evacuated tube—300 m ground probes). Solar energy was used to provide hot waterfor heating (green in Figure 11) and sanitary uses (red) during the whole year, and to regenerate theground mainly in the summer months (light blue). While the latter quota increased proportionally tothe increasing of the solar field area, the former increased less than proportionally due to the very smallheating demand in summer. The quota of solar energy directed to the HP evaporator was negligible.Only A5 presented a meaningful value. This was due to the lower thermal efficiency of the flat platecollectors in winter conditions with respect to the evacuated tube, so it was more frequent that outletsolar circuit temperatures were lower than the hot tank or DHW tank temperatures.
Appl. Sci. 2019, 9, x FOR PEER REVIEW 13 of 21
Table 7. Different alternatives simulated with solar field, ground boreholes, and storage tank dimensions (all considering sensible (water) storage).
Alternative Type of
Collector
Solar Field Area (m2)—Ground Boreholes
Depth (m)
DHW Tank (L)
Hot Tank (L)
Cold Tank (L)
A1 - 0 1500 1500 1000 A2 Evacuated tube 20–400 1500 2000 1000 A3 Evacuated tube 40–300 3000 3000 1000 A4 Evacuated tube 60–200 3000 5000 1000 A5 Flat plate 50–300 3000 5000 1000
3.1. Monthly Energy Analysis
Some first results are reported here on a monthly basis (Figures 11–15), referring to the A3 case only (40 m2 evacuated tube—300 m ground probes). Solar energy was used to provide hot water for heating (green in Figure 11) and sanitary uses (red) during the whole year, and to regenerate the ground mainly in the summer months (light blue). While the latter quota increased proportionally to the increasing of the solar field area, the former increased less than proportionally due to the very small heating demand in summer. The quota of solar energy directed to the HP evaporator was negligible. Only A5 presented a meaningful value. This was due to the lower thermal efficiency of the flat plate collectors in winter conditions with respect to the evacuated tube, so it was more frequent that outlet solar circuit temperatures were lower than the hot tank or DHW tank temperatures.
Figure 11. Solar energy balance for the A3 alternative.
Figure 12 reports the absorption HP/chiller energy balance; the limited use of solar energy as heat source of the HP is confirmed. The highest efficiency (1.83) was reported during the mid seasons (April and October), whereas during cooling season the gas utilization efficiency (GUE) was between 0.74 and 0.79.
Figures 13 and 14 report the energy balance of the DHW tank and hot tank, respectively. Solar energy was assured an appreciable contribution to DHW demand, even if the hot tank contribution prevailed above all in the colder months.
The contribution of electric auxiliaries was quite limited, and it was present mainly during the summer or mid-season. This was because in winter the absorption machine operated as HP, and it was controlled by the hot tank set point temperature. In this way, the DHW tank was also satisfied mainly by solar energy and the hot tank. Differently, during the summer or mid-season the
Figure 11. Solar energy balance for the A3 alternative.
Figure 12 reports the absorption HP/chiller energy balance; the limited use of solar energy asheat source of the HP is confirmed. The highest efficiency (1.83) was reported during the mid seasons(April and October), whereas during cooling season the gas utilization efficiency (GUE) was between0.74 and 0.79.
Figures 13 and 14 report the energy balance of the DHW tank and hot tank, respectively. Solarenergy was assured an appreciable contribution to DHW demand, even if the hot tank contributionprevailed above all in the colder months.

Appl. Sci. 2019, 9, 1007 14 of 21
The contribution of electric auxiliaries was quite limited, and it was present mainly during thesummer or mid-season. This was because in winter the absorption machine operated as HP, and itwas controlled by the hot tank set point temperature. In this way, the DHW tank was also satisfiedmainly by solar energy and the hot tank. Differently, during the summer or mid-season the absorptionmachine operated as chiller, controlled by the cold tank set point temperature. Then heat recovered bythe condenser was available from the absorption machine only when it is on.
The hot tank was quite fully satisfied by solar energy (light blue in Figure 14) during thesummer months.
Appl. Sci. 2019, 9, x FOR PEER REVIEW 14 of 21
absorption machine operated as chiller, controlled by the cold tank set point temperature. Then heat recovered by the condenser was available from the absorption machine only when it is on.
The hot tank was quite fully satisfied by solar energy (light blue in Figure 14) during the summer months.
Figure 12. Absorption HP/chiller energy balance for the A3 alternative.
Figure 13. Energy balance for the DHW tank for the A3 alternative.
Figure 12. Absorption HP/chiller energy balance for the A3 alternative.
Appl. Sci. 2019, 9, x FOR PEER REVIEW 14 of 21
absorption machine operated as chiller, controlled by the cold tank set point temperature. Then heat recovered by the condenser was available from the absorption machine only when it is on.
The hot tank was quite fully satisfied by solar energy (light blue in Figure 14) during the summer months.
Figure 12. Absorption HP/chiller energy balance for the A3 alternative.
Figure 13. Energy balance for the DHW tank for the A3 alternative. Figure 13. Energy balance for the DHW tank for the A3 alternative.
Appl. Sci. 2019, 9, 1007 15 of 21
Appl. Sci. 2019, 9, x FOR PEER REVIEW 15 of 21
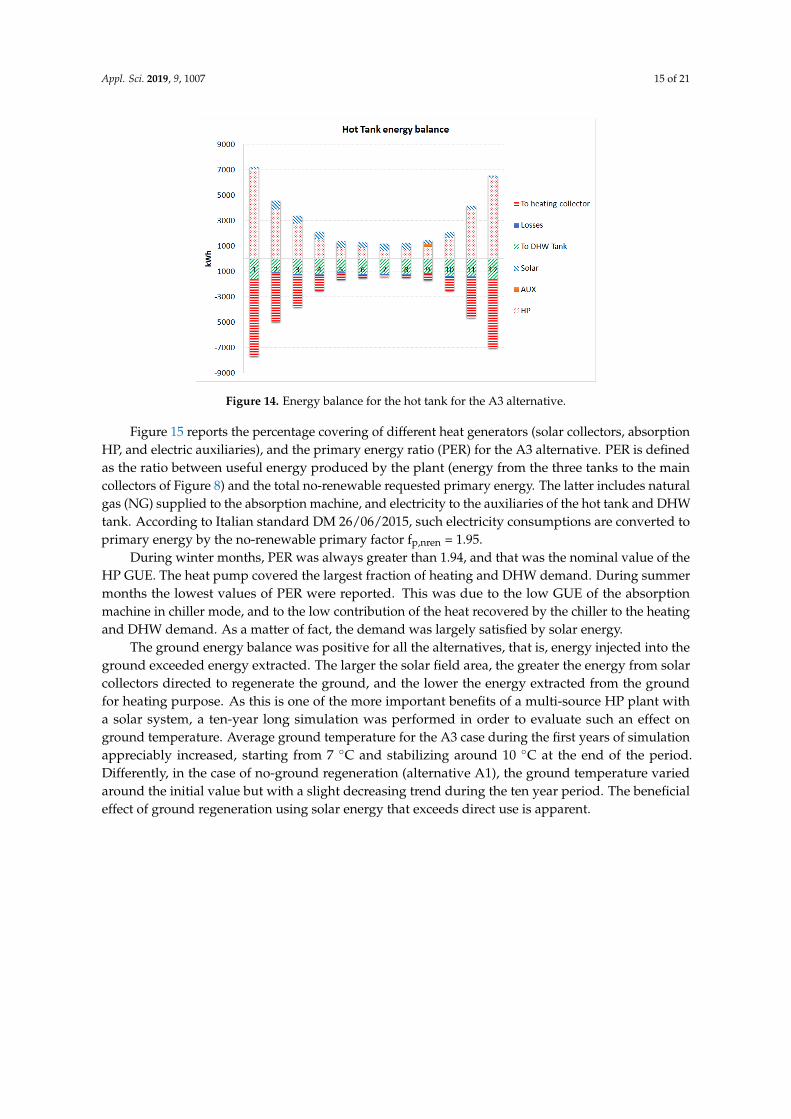
Figure 14. Energy balance for the hot tank for the A3 alternative.
Figure 15 reports the percentage covering of different heat generators (solar collectors, absorption HP, and electric auxiliaries), and the primary energy ratio (PER) for the A3 alternative. PER is defined as the ratio between useful energy produced by the plant (energy from the three tanks to the main collectors of Figure 8) and the total no-renewable requested primary energy. The latter includes natural gas (NG) supplied to the absorption machine, and electricity to the auxiliaries of the hot tank and DHW tank. According to Italian standard DM 26/06/2015, such electricity consumptions are converted to primary energy by the no-renewable primary factor fp,nren = 1.95.
During winter months, PER was always greater than 1.94, and that was the nominal value of the HP GUE. The heat pump covered the largest fraction of heating and DHW demand. During summer months the lowest values of PER were reported. This was due to the low GUE of the absorption machine in chiller mode, and to the low contribution of the heat recovered by the chiller to the heating and DHW demand. As a matter of fact, the demand was largely satisfied by solar energy.
The ground energy balance was positive for all the alternatives, that is, energy injected into the ground exceeded energy extracted. The larger the solar field area, the greater the energy from solar collectors directed to regenerate the ground, and the lower the energy extracted from the ground for heating purpose. As this is one of the more important benefits of a multi-source HP plant with a solar system, a ten-year long simulation was performed in order to evaluate such an effect on ground temperature. Average ground temperature for the A3 case during the first years of simulation appreciably increased, starting from 7 °C and stabilizing around 10 °C at the end of the period. Differently, in the case of no-ground regeneration (alternative A1), the ground temperature varied around the initial value but with a slight decreasing trend during the ten year period. The beneficial effect of ground regeneration using solar energy that exceeds direct use is apparent.
Figure 14. Energy balance for the hot tank for the A3 alternative.
Figure 15 reports the percentage covering of different heat generators (solar collectors, absorptionHP, and electric auxiliaries), and the primary energy ratio (PER) for the A3 alternative. PER is definedas the ratio between useful energy produced by the plant (energy from the three tanks to the maincollectors of Figure 8) and the total no-renewable requested primary energy. The latter includes naturalgas (NG) supplied to the absorption machine, and electricity to the auxiliaries of the hot tank and DHWtank. According to Italian standard DM 26/06/2015, such electricity consumptions are converted toprimary energy by the no-renewable primary factor fp,nren = 1.95.
During winter months, PER was always greater than 1.94, and that was the nominal value of theHP GUE. The heat pump covered the largest fraction of heating and DHW demand. During summermonths the lowest values of PER were reported. This was due to the low GUE of the absorptionmachine in chiller mode, and to the low contribution of the heat recovered by the chiller to the heatingand DHW demand. As a matter of fact, the demand was largely satisfied by solar energy.
The ground energy balance was positive for all the alternatives, that is, energy injected into theground exceeded energy extracted. The larger the solar field area, the greater the energy from solarcollectors directed to regenerate the ground, and the lower the energy extracted from the groundfor heating purpose. As this is one of the more important benefits of a multi-source HP plant witha solar system, a ten-year long simulation was performed in order to evaluate such an effect onground temperature. Average ground temperature for the A3 case during the first years of simulationappreciably increased, starting from 7 ◦C and stabilizing around 10 ◦C at the end of the period.Differently, in the case of no-ground regeneration (alternative A1), the ground temperature variedaround the initial value but with a slight decreasing trend during the ten year period. The beneficialeffect of ground regeneration using solar energy that exceeds direct use is apparent.

Appl. Sci. 2019, 9, 1007 16 of 21
Appl. Sci. 2019, 9, x FOR PEER REVIEW 16 of 21
Figure 15. Energy demand percentage covering of different energy sources and the primary energy ratio (PER)
(alternative A3).
3.2. Annual Energy and Economic Analysis
The annual PER is reported in Figure 16, also considering the electricity consumption by the circulation pumps (PER*). The latter was not negligible at all, mainly due to the pressure drops of the ground circuit. For example, for the A3 case the annual pump electricity consumption was around 1650 kWh: this was 3% of the total thermal and cooling useful energy, and around 11% of the total no-renewable primary energy supplied to the plant. Such a percentage was consistent with data found in previous authors’ work in similar multi-source heat pump plants [26,27].
Figure 16. PER and electricity consumption by the circulation pumps (PER*) for the different
alternatives.
From the energy performance point of view, the best solution was A4 (PER = 2.12, PER* = 1.92), whereas A3 was in second place.
A more comprehensive choice of the preferred alternative can be done by considering the economic point of view as well. A reasonable estimate of the absorption single effect machine investment cost, and the evacuated tube and flat plate solar collectors specific cost was 26,500 €, 545 € m−2, and 310 € m−2 respectively (literature and manufacturer's average values [29–33]). The total investment costs for the solar thermal plant reported in Table 8 were determined by further reasonable hypotheses about the cost of other equipment (pumps, tubes, boiler, valves, etc.), and
Figure 15. Energy demand percentage covering of different energy sources and the primary energyratio (PER) (alternative A3).
3.2. Annual Energy and Economic Analysis
The annual PER is reported in Figure 16, also considering the electricity consumption by thecirculation pumps (PER*). The latter was not negligible at all, mainly due to the pressure drops of theground circuit. For example, for the A3 case the annual pump electricity consumption was around1650 kWh: this was 3% of the total thermal and cooling useful energy, and around 11% of the totalno-renewable primary energy supplied to the plant. Such a percentage was consistent with data foundin previous authors’ work in similar multi-source heat pump plants [26,27].
Appl. Sci. 2019, 9, x FOR PEER REVIEW 16 of 21
Figure 15. Energy demand percentage covering of different energy sources and the primary energy ratio (PER)
(alternative A3).
3.2. Annual Energy and Economic Analysis
The annual PER is reported in Figure 16, also considering the electricity consumption by the circulation pumps (PER*). The latter was not negligible at all, mainly due to the pressure drops of the ground circuit. For example, for the A3 case the annual pump electricity consumption was around 1650 kWh: this was 3% of the total thermal and cooling useful energy, and around 11% of the total no-renewable primary energy supplied to the plant. Such a percentage was consistent with data found in previous authors’ work in similar multi-source heat pump plants [26,27].
Figure 16. PER and electricity consumption by the circulation pumps (PER*) for the different
alternatives.
From the energy performance point of view, the best solution was A4 (PER = 2.12, PER* = 1.92), whereas A3 was in second place.
A more comprehensive choice of the preferred alternative can be done by considering the economic point of view as well. A reasonable estimate of the absorption single effect machine investment cost, and the evacuated tube and flat plate solar collectors specific cost was 26,500 €, 545 € m−2, and 310 € m−2 respectively (literature and manufacturer's average values [29–33]). The total investment costs for the solar thermal plant reported in Table 8 were determined by further reasonable hypotheses about the cost of other equipment (pumps, tubes, boiler, valves, etc.), and
Figure 16. PER and electricity consumption by the circulation pumps (PER*) for the different alternatives.
From the energy performance point of view, the best solution was A4 (PER = 2.12, PER* = 1.92),whereas A3 was in second place.
A more comprehensive choice of the preferred alternative can be done by considering the economicpoint of view as well. A reasonable estimate of the absorption single effect machine investment cost, andthe evacuated tube and flat plate solar collectors specific cost was 26,500 €, 545 € m−2, and 310 € m−2
respectively (literature and manufacturer’s average values [29–33]). The total investment costs forthe solar thermal plant reported in Table 8 were determined by further reasonable hypotheses about
Appl. Sci. 2019, 9, 1007 17 of 21
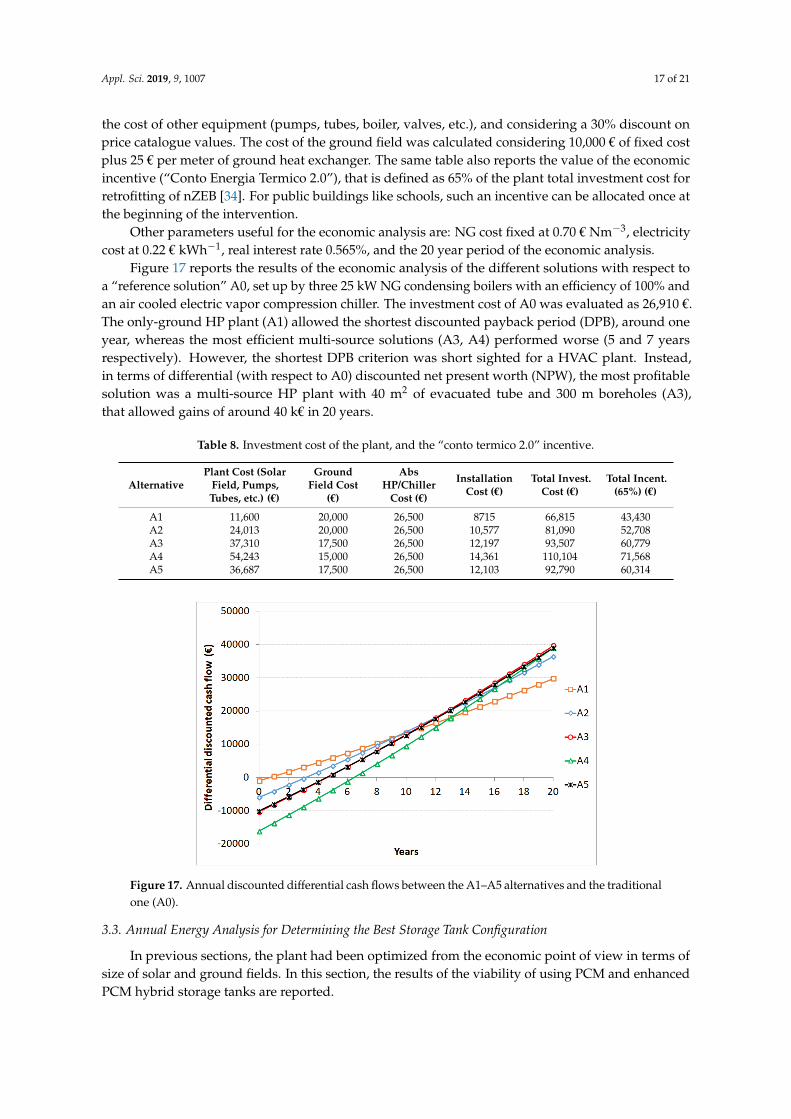
the cost of other equipment (pumps, tubes, boiler, valves, etc.), and considering a 30% discount onprice catalogue values. The cost of the ground field was calculated considering 10,000 € of fixed costplus 25 € per meter of ground heat exchanger. The same table also reports the value of the economicincentive (“Conto Energia Termico 2.0”), that is defined as 65% of the plant total investment cost forretrofitting of nZEB [34]. For public buildings like schools, such an incentive can be allocated once atthe beginning of the intervention.
Other parameters useful for the economic analysis are: NG cost fixed at 0.70 € Nm−3, electricitycost at 0.22 € kWh−1, real interest rate 0.565%, and the 20 year period of the economic analysis.
Figure 17 reports the results of the economic analysis of the different solutions with respect toa “reference solution” A0, set up by three 25 kW NG condensing boilers with an efficiency of 100% andan air cooled electric vapor compression chiller. The investment cost of A0 was evaluated as 26,910 €.The only-ground HP plant (A1) allowed the shortest discounted payback period (DPB), around oneyear, whereas the most efficient multi-source solutions (A3, A4) performed worse (5 and 7 yearsrespectively). However, the shortest DPB criterion was short sighted for a HVAC plant. Instead,in terms of differential (with respect to A0) discounted net present worth (NPW), the most profitablesolution was a multi-source HP plant with 40 m2 of evacuated tube and 300 m boreholes (A3),that allowed gains of around 40 k€ in 20 years.
Table 8. Investment cost of the plant, and the “conto termico 2.0” incentive.
AlternativePlant Cost (Solar
Field, Pumps,Tubes, etc.) (€)
GroundField Cost
(€)
AbsHP/Chiller
Cost (€)
InstallationCost (€)
Total Invest.Cost (€)
Total Incent.(65%) (€)
A1 11,600 20,000 26,500 8715 66,815 43,430A2 24,013 20,000 26,500 10,577 81,090 52,708A3 37,310 17,500 26,500 12,197 93,507 60,779A4 54,243 15,000 26,500 14,361 110,104 71,568A5 36,687 17,500 26,500 12,103 92,790 60,314
Appl. Sci. 2019, 9, x FOR PEER REVIEW 17 of 21
considering a 30% discount on price catalogue values. The cost of the ground field was calculated considering 10,000 € of fixed cost plus 25 € per meter of ground heat exchanger. The same table also reports the value of the economic incentive (“Conto Energia Termico 2.0”), that is defined as 65% of the plant total investment cost for retrofitting of nZEB [34]. For public buildings like schools, such an incentive can be allocated once at the beginning of the intervention.
Other parameters useful for the economic analysis are: NG cost fixed at 0.70 € Nm−3, electricity cost at 0.22 € kWh−1, real interest rate 0.565%, and the 20 year period of the economic analysis.
Figure 17 reports the results of the economic analysis of the different solutions with respect to a “reference solution” A0, set up by three 25 kW NG condensing boilers with an efficiency of 100% and an air cooled electric vapor compression chiller. The investment cost of A0 was evaluated as 26,910 €. The only-ground HP plant (A1) allowed the shortest discounted payback period (DPB), around one year, whereas the most efficient multi-source solutions (A3, A4) performed worse (5 and 7 years respectively). However, the shortest DPB criterion was short sighted for a HVAC plant. Instead, in terms of differential (with respect to A0) discounted net present worth (NPW), the most profitable solution was a multi-source HP plant with 40 m2 of evacuated tube and 300 m boreholes (A3), that allowed gains of around 40 k€ in 20 years.
Table 8. Investment cost of the plant, and the “conto termico 2.0” incentive.
Alternative
Plant Cost (Solar Field, Pumps, Tubes, etc.) (€)
Ground Field Cost
(€)
Abs HP/Chiller
Cost (€)
Installation Cost (€)
Total Invest. Cost
(€)
Total Incent. (65%) (€)
A1 11,600 20,000 26,500 8715 66,815 43,430 A2 24,013 20,000 26,500 10,577 81,090 52,708 A3 37,310 17,500 26,500 12,197 93,507 60,779 A4 54,243 15,000 26,500 14,361 110,104 71,568 A5 36,687 17,500 26,500 12,103 92,790 60,314
Figure 17. Annual discounted differential cash flows between the A1–A5 alternatives and the traditional one (A0).
3.3. Annual Energy Analysis for Determining the Best Storage Tank Configuration
In previous sections, the plant had been optimized from the economic point of view in terms of size of solar and ground fields. In this section, the results of the viability of using PCM and enhanced PCM hybrid storage tanks are reported.
Among the alternatives here considered (Table 5), the best performances were featured by the B2 and B3 solutions (Figure 18). They allowed for the lowest no-renewable primary energy consumption and the highest PER of the plant. As a matter of fact, using PCM in the hot tank
Figure 17. Annual discounted differential cash flows between the A1–A5 alternatives and the traditionalone (A0).
3.3. Annual Energy Analysis for Determining the Best Storage Tank Configuration
In previous sections, the plant had been optimized from the economic point of view in terms ofsize of solar and ground fields. In this section, the results of the viability of using PCM and enhancedPCM hybrid storage tanks are reported.

Appl. Sci. 2019, 9, 1007 18 of 21
Among the alternatives here considered (Table 5), the best performances were featured by the B2and B3 solutions (Figure 18). They allowed for the lowest no-renewable primary energy consumptionand the highest PER of the plant. As a matter of fact, using PCM in the hot tank allowed the increaseof the use of solar energy for heating because 7% more energy could be stored in the tank. Moreover,placing PCM tubes in the DHW tank was advantageous as well, as it increased the use of solar energyfor DHW production (the increase of stored energy was 19%), even if at the same time the use of solarenergy in the hot tank decreased by 32% (Figure 19). As a consequence, as the heat pump operatedat a higher temperature to produce hot water for the hot tank with respect to the DHW tank, higherenergy saving could be obtained using PCM tubes in the hot tank because the heat pump operatedwith a higher GUE.
Appl. Sci. 2019, 9, x FOR PEER REVIEW 18 of 21
allowed the increase of the use of solar energy for heating because 7% more energy could be stored in the tank. Moreover, placing PCM tubes in the DHW tank was advantageous as well, as it increased the use of solar energy for DHW production (the increase of stored energy was 19%), even if at the same time the use of solar energy in the hot tank decreased by 32% (Figure 19). As a consequence, as the heat pump operated at a higher temperature to produce hot water for the hot tank with respect to the DHW tank, higher energy saving could be obtained using PCM tubes in the hot tank because the heat pump operated with a higher GUE.
Figure 18. No-renewable primary energy consumption and primary energy ratio for the different alternatives.
Figure 19. Useful solar radiation from thermal collectors to ground, hot tank and DHW tank.
Using enhanced PCM did not allow appreciable energy savings with respect to PCM (Figure 18). However, an advantage was a narrower temperature range of hot water at the outlet of the tank when the Al-foam enhanced PCM tubes were used. This in principle might seem like a minor advantage, but it means that the heat stored inside the PCM was efficiently rejected to the water when the Al-foams were used. One of the main drawbacks of the PCMs was related to their low thermal conductivity; thus, the melting and solidification processes always occur slowly (see Figure 4). In fact, when the DHW tank was loaded, the energy could not be effectively extracted and the outlet water temperature could not be kept constant without foam. For example, Figure 20 reports the outlet temperature of the DHW tank for two typical days in three cases: sensible (water), PCM,
Figure 18. No-renewable primary energy consumption and primary energy ratio for the different alternatives.
Appl. Sci. 2019, 9, x FOR PEER REVIEW 18 of 21
allowed the increase of the use of solar energy for heating because 7% more energy could be stored in the tank. Moreover, placing PCM tubes in the DHW tank was advantageous as well, as it increased the use of solar energy for DHW production (the increase of stored energy was 19%), even if at the same time the use of solar energy in the hot tank decreased by 32% (Figure 19). As a consequence, as the heat pump operated at a higher temperature to produce hot water for the hot tank with respect to the DHW tank, higher energy saving could be obtained using PCM tubes in the hot tank because the heat pump operated with a higher GUE.
Figure 18. No-renewable primary energy consumption and primary energy ratio for the different alternatives.
Figure 19. Useful solar radiation from thermal collectors to ground, hot tank and DHW tank.
Using enhanced PCM did not allow appreciable energy savings with respect to PCM (Figure 18). However, an advantage was a narrower temperature range of hot water at the outlet of the tank when the Al-foam enhanced PCM tubes were used. This in principle might seem like a minor advantage, but it means that the heat stored inside the PCM was efficiently rejected to the water when the Al-foams were used. One of the main drawbacks of the PCMs was related to their low thermal conductivity; thus, the melting and solidification processes always occur slowly (see Figure 4). In fact, when the DHW tank was loaded, the energy could not be effectively extracted and the outlet water temperature could not be kept constant without foam. For example, Figure 20 reports the outlet temperature of the DHW tank for two typical days in three cases: sensible (water), PCM,
Figure 19. Useful solar radiation from thermal collectors to ground, hot tank and DHW tank.
Using enhanced PCM did not allow appreciable energy savings with respect to PCM (Figure 18).However, an advantage was a narrower temperature range of hot water at the outlet of the tank whenthe Al-foam enhanced PCM tubes were used. This in principle might seem like a minor advantage,but it means that the heat stored inside the PCM was efficiently rejected to the water when the Al-foamswere used. One of the main drawbacks of the PCMs was related to their low thermal conductivity;thus, the melting and solidification processes always occur slowly (see Figure 4). In fact, when the

Appl. Sci. 2019, 9, 1007 19 of 21
DHW tank was loaded, the energy could not be effectively extracted and the outlet water temperaturecould not be kept constant without foam. For example, Figure 20 reports the outlet temperature ofthe DHW tank for two typical days in three cases: sensible (water), PCM, and enhanced PCM storage.The more constant temperature of hot water at the outlet of the tank when using enhanced PCMguaranteed a higher level of service for the DHW produced.
Appl. Sci. 2019, 9, x FOR PEER REVIEW 19 of 21
and enhanced PCM storage. The more constant temperature of hot water at the outlet of the tank when using enhanced PCM guaranteed a higher level of service for the DHW produced.
Figure 20. Temperature and flow rate of water at the outlet of the DHW tank in the case of sensible (water), phase change materials (PCM), and the enhanced PCM DHW tank.
4. Conclusions
The study reports the energy and economic analysis of a multi-source (solar and ground) absorption heat pump plant for the heating and cooling of a retrofitted school building. The main objective of the analysis is to define the size and the type (sensible or PCM or enhanced PCM) of the three thermal energy storage systems (for DHW production, for heating, and for cooling). As a matter of fact, the operating temperature of the storage depends on the solar collectors’ area, on the volume of the storage tanks, and on the kind and entity of the thermal loads to be faced. For this reason, only a transient simulation allows a reliable comparison between different layouts and sizes of system components. From the energy point of view, the best solution is given by 40 m2 evacuated tube, 300 m ground probes, 3000 L hot tank and DHW tank capacity, and 1000 L cold tank capacity, the former tanks filled with PCM RT47, and the other as sensible storage (water). Such a configuration features the higher primary energy ratio and solar ratio between the different scenarios considered, because the mean operating temperature of the hot tank is longer near the melting temperature of the PCM during the year. The use of Al-foam enhanced PCM does not yield an additional advantage from the energy performance point of view. Instead, a more constant hot water temperature is guaranteed. This allows a higher level of service for the hot water produced. Further development of this research could address a wider economic evaluation of the proposed study, as the greater investment cost of PCM and enhanced PCM technologies with respect to sensible storage means their viability must be carefully evaluated.
Author Contributions: R.L. and S.M. contributed to the idea and funding support for this paper, S.M., M.N., and G.R. contributed to the methodology, S.M. and M.N. and G.R. contributed to the writing of this paper, R.L. contributed to revision of this paper.
Funding: This research was funded by the SID2016 Research Project (“Utilization of PCMs (phase change materials) in short, middle or long terms thermal storages”) by the University of Padova.
Acknowledgments: The authors would like to thank Lorenzo Zamboni and Alberto Matteazzi for supporting the simulations.
Conflicts of Interest: The authors declare no conflict of interest.
References
Figure 20. Temperature and flow rate of water at the outlet of the DHW tank in the case of sensible(water), phase change materials (PCM), and the enhanced PCM DHW tank.
4. Conclusions
The study reports the energy and economic analysis of a multi-source (solar and ground) absorptionheat pump plant for the heating and cooling of a retrofitted school building. The main objective of theanalysis is to define the size and the type (sensible or PCM or enhanced PCM) of the three thermal energystorage systems (for DHW production, for heating, and for cooling). As a matter of fact, the operatingtemperature of the storage depends on the solar collectors’ area, on the volume of the storage tanks, and onthe kind and entity of the thermal loads to be faced. For this reason, only a transient simulation allowsa reliable comparison between different layouts and sizes of system components. From the energy pointof view, the best solution is given by 40 m2 evacuated tube, 300 m ground probes, 3000 L hot tank andDHW tank capacity, and 1000 L cold tank capacity, the former tanks filled with PCM RT47, and the otheras sensible storage (water). Such a configuration features the higher primary energy ratio and solar ratiobetween the different scenarios considered, because the mean operating temperature of the hot tank islonger near the melting temperature of the PCM during the year. The use of Al-foam enhanced PCM doesnot yield an additional advantage from the energy performance point of view. Instead, a more constanthot water temperature is guaranteed. This allows a higher level of service for the hot water produced.Further development of this research could address a wider economic evaluation of the proposed study,as the greater investment cost of PCM and enhanced PCM technologies with respect to sensible storagemeans their viability must be carefully evaluated.
Author Contributions: R.L. and S.M. contributed to the idea and funding support for this paper, S.M., M.N.,and G.R. contributed to the methodology, S.M. and M.N. and G.R. contributed to the writing of this paper, R.L.contributed to revision of this paper.
Funding: This research was funded by the SID2016 Research Project (“Utilization of PCMs (phase changematerials) in short, middle or long terms thermal storages”) by the University of Padova.
Acknowledgments: The authors would like to thank Lorenzo Zamboni and Alberto Matteazzi for supportingthe simulations.
Conflicts of Interest: The authors declare no conflict of interest.
Appl. Sci. 2019, 9, 1007 20 of 21
References
1. Medrano, M.; Yilmaz, M.O.; Nogués, M.; Martorell, I.; Roca, J.; Cabeza, L.F. Experimental evaluation ofcommercial heat exchangers for use as PCM thermal storage systems. Appl. Energy 2009, 86, 2047–2055.[CrossRef]
2. Paris, J.; Falardeau, M.; Villeneuve, C. Thermal storage by latent heat: A viable option for energy conservationin buildings. Energy Sources 1993, 15, 85–93. [CrossRef]
3. Chidambaram, L.A.; Ramana, A.S.; Kamaraj, G.; Velraj, R. Review of solar cooling methods and thermalstorage options. Renew. Sustain. Energy Rev. 2011, 15, 3220–3228. [CrossRef]
4. Oró, E.; Gil, A.; Miró, L.; Peiró, G.; Alvarez, S.; Cabeza, L.F. Thermal energy storage implementation usingphase change materials for solar cooling and refrigeration applications. Energy Procedia 2012, 30, 947–956.[CrossRef]
5. Liu, L.; Su, D.; Tang, Y.; Fang, G. Thermal conductivity enhancement of phase change materials for thermalenergy storage: A review. Renew. Sustain. Energy Rev. 2016, 62, 305–317. [CrossRef]
6. Lin, Y.; Jia, Y.; Alva, G.; Fang, G. Review on thermal conductivity enhancement, thermal properties andapplications of phase change materials in thermal energy storage. Renew. Sustain. Energy Rev. 2018, 82,2730–2742. [CrossRef]
7. Thapa, S.; Chukwu, S.; Khaliq, A.; Weiss, L. Fabrication and analysis of small-scale thermal energy storagewith conductivity enhancement. Energy Convers. Manag. 2014, 79, 161–170. [CrossRef]
8. Mancin, S.; Diani, A.; Doretti, L.; Hooman, K.; Rossetto, L. Experimental analysis of phase changephenomenon of paraffin waxes embedded in copper foams. Int. J. Therm. Sci. 2015, 90, 79–89. [CrossRef]
9. Lazzarin, R.; Mancin, S.; Noro, M.; Righetti, G. Experiment Analysis of Aluminum Foams as heat transfermedium for PCM Thermal Storages, Refrigeration Science and Technology. In Proceedings of the 5th IIRInternational Conference on Thermophysical Properties and Transfer Processes of Refrigerants, Seoul, Korea,23–26 April 2017. paper TP-0024. [CrossRef]
10. Lazzarin, R.; Mancin, S.; Noro, M.; Righetti, G. Porous media for advanced hybrid thermal energy storages,Refrigeration Science and Technology. In Proceedings of the 12th IIR Conference on Phase Change Materialsand Slurries for Refrigeration and Air Conditioning, Orford, QC, Canada, 21–23 May 2018; pp. 379–386,ISBN 978-2-36215-025-8. [CrossRef]
11. Lazzarin, R.; Mancin, S.; Noro, M.; Righetti, G. Hybrid PCM—Aluminium foams’ thermal storages:An experimental study. Int. J. Low Carbon Technol. 2018, 13, 286–291. [CrossRef]
12. Castell, A.; Solé, C. Design of latent heat storage systems using phase change materials (PCMs). In Advances inThermal Energy Storage Systems. Methods and Applications; Woodhead Publishing Series in Energy; WoodheadPublishing: Sawston, UK, 2015; pp. 285–305.
13. Klein, S.A. TRNSYS 17: A Transient System Simulation Program, Solar Energy Laboratory, University of Wisconsin,Madison, USA. 2010. Available online: http://sel.me.wisc.edu/trnsys (accessed on 8 October 2018).
14. Jokisalo, J.; Lamberg, P.; Sirén, K. Thermal simulation of PCM structures with Trnsys. In Proceedingsof the 8th International Conference on Thermal energy storage, Terrastock, Stuttgart, Germany,28 August–1 September 2000.
15. Ibáñez, M.; Lázaro, A.; Zalba, B.; Cabeza, L.F. An approach to the simulation of PCMs in building applicationsusing TRNSYS. Appl. Therm. Eng. 2005, 25, 1796–1807. [CrossRef]
16. Ibáñez, M.; Cabeza, L.F.; Solé, C.; Roca, J.; Nogués, M. Modelization of a water tank including a PCM module.Appl. Therm. Eng. 2006, 26, 1328–1333. [CrossRef]
17. Schranzhofer, H.; Puschnig, P.; Heinz, A.; Streicher, W. Validation of a TRNSYS simulation model forPCM energy storages and PCM wall construction elements. In Proceedings of the ECOSTOCK 2006—10thInternational Conference on Thermal Energy Storage, Pomona, NJ, USA, 31 May–2 June 2006.
18. Bony, J.; Citherlet, S. Extension of a TRNSYS model for latent heat storage with phase change materials usedin solar water tank. In Proceedings of the ECOSTOCK 2006—10th International Conference on ThermalEnergy Storage, Pomona, NJ, USA, 31 May–2 June 2006.
19. Bony, J.; Citherlet, S. Numerical model and experimental validation of heat storage with phase changematerials. Energy Build. 2007, 39, 1065–1072. [CrossRef]

Appl. Sci. 2019, 9, 1007 21 of 21
20. Lazzarin, R.; Mancin, S.; Noro, M. Experiment for the evaluation of Aluminum foams for improvingheat transfer in PCM thermal storages, Refrigeration Science and Technology. In Proceedings of the11th IIR Conference on Phase Change Materials and Slurries for Refrigeration and Air Conditioning,Karlsruhe, Germany, 18–20 May 2016; pp. 122–131, ISBN 978-2-36215-015-9. [CrossRef]
21. Lazzarin, R.; Mancin, S.; Noro, M.; Righetti, G.; Zamboni, L. Simulation of the phase change processof paraffin waxes with and without Aluminum foams for advanced hybrid thermal energy storages,Refrigeration Science and Technology. In Proceedings of the 12th IIR Conference on Phase Change Materialsand Slurries for Refrigeration and Air Conditioning, Orford, QC, Canada, 21–23 May 2018; pp. 256–264,ISBN 978-2-36215-025-8. [CrossRef]
22. Noro, M.; Lazzarin, R.; Busato, F. Solar cooling and heating plants: An energy and economic analysis ofliquid sensible vs phase change material (PCM) heat storage. Int. J. Refrig. 2014, 39, 104–116. [CrossRef]
23. Lazzarin, R.; Mancin, S.; Noro, M.; Righetti, G. Phase Change Materials embedded in porous matrices forhybrid thermal energy storages: Experimental results and modelling. Int. J. Refrig. 2019; under review.
24. Wang, Z.; Zhang, Z.; Jia, L.; Yang, L. Paraffin and paraffin/Al foam composite phase change material heatstorage experimental study based on thermal management of Li-ion battery. Appl. Therm. Eng. 2015, 78,428–436. [CrossRef]
25. Cheng, W.L.; Wei, W.J. Theoretical analysis of phase change material storage with high porosity metal foams.Acta Energiae Solaris Sin. 2007, 28, 739–744. [CrossRef]
26. Busato, F.; Lazzarin, R.; Noro, M. Two years of recorded data for a multisource heat pump system:A performance analysis. Appl. Therm. Eng. 2013, 57, 39–47. [CrossRef]
27. Busato, F.; Lazzarin, R.; Noro, M. Multisource heat pump system from design to operation: The case studyof a new school building. Int. J. Low Carbon Technol. 2013, 8, 88–94. [CrossRef]
28. Busato, F.; Lazzarin, R.; Noro, M. Ground or solar source heat pump systems for space heating: Which isbetter? Energetic assessment based on a case history. Energy Build. 2015, 102, 347–356. [CrossRef]
29. Kloben Industries S.r.l. Priced Catalogue 2017, Italy. 2017. Available online: http://www.kloben.it (accessedon 12 August 2018).
30. Infante Ferreira, C.A.; Kim, D.S. Techno-economic review of solar cooling technologies based onlocation-specific data. Int. J. Refrig. 2014, 39, 23–37. [CrossRef]
31. Lazzarin, R. Solar cooling: PV or thermal? A thermodynamic and economical analysis. Int. J. Refrig. 2014, 39,38–47. [CrossRef]
32. Robur S.p.A. Design manual 2017, Italy. 2017. Available online: http://www.robur.it (accessed on 12 August 2018).33. Weiss, W.; Spörk-Dür, M.; Mauthner, F. Solar Heat Worldwide. Detailed Market Figures 2015. Global Market Development
and Trends in 2016; AEE—Institute for Sustainable Technologies: Gleisdorf, Austria; IEA—International EnergyAgency: Paris, France, 2017.
34. MISE (Italian Ministry of Economic Development). DM 16/02/2016—Conto Termico 2.0 (Thermal incentive2.0), Italy. 2016. Available online: http://www.gse.it/servizi-per-te/efficienza-energetica/conto-termico(accessed on 7 January 2019).
© 2019 by the authors. Licensee MDPI, Basel, Switzerland. This article is an open accessarticle distributed under the terms and conditions of the Creative Commons Attribution(CC BY) license (http://creativecommons.org/licenses/by/4.0/).