Application of Geophysical and Remote Sensing Techniques ...
21
Application of Geophysical and Remote Sensing Techniques to Delineate Lateritic Bauxite Deposit Zone in Orin Ekiti, Nigeria Application of Geophysical and Remote Sensing Techniques to Delineate Lateritic Bauxite Deposit Zone in Orin Ekiti, Nigeria *Alagbe Olufemi Adigun 1 and Amosun Joel Olayide 2 1 Department of Applied Geophysics, Federal University of Technology, Akure-Nigeria 2 Department of Geophysics, Federal University, Oye Ekiti-Nigeria Application of geophysical and remote sensing techniques was used to delineate lateritic bauxite zone in Orin Ekiti, Southwestern Nigeria. Three basic methods were employed to qualitatively define and identify plausible areas or zones of bauxite ore deposit within the study area. The remote sensing data utilized for the study were the Landsat (ETM) image and Shuttle Radar Topography Mission (SRTM) data in Digital Elevation Model (DEM) image. From the processed remote sensing data, features like topography, vegetation, settlements, and rocks which are all favourable features for bauxite formation were all observed and delineated. The use of magnetic method through the use of high resolution aeromagnetic data (HRAD) of sheet 224, enables different enhancement magnetic maps to be generated. These maps were used to define boundaries, contacts and edges of different rock types within the study area, and the production of a mineralization potential map for the study area. Three major rock types were identified and mapped, these are magmatite, granite gneiss and charnockite rocks. Charnockite rocks which are considered as parent rock for bauxite have low magnetic susceptibility values; therefore, zones of low magnetic susceptibility are mapped, with values ranged between -92.4 nT to -56.9nT, observed at central part trending in the east to west, and also in the northwestern and southwestern parts of the study area. Five traverses were established for electrical resistivity imaging (ERI). Bauxite being a weathered product of charnockite rock, zones of its existence is expected to have high resistivity values. So, along the five traverses, zones of high resistivity values were mapped as bauxite zones, having value ranged between 600 Ωm to 101404Ωm, and occurred within the depth ranged between 0 (surface) to maximum depth probed (15m). All the techniques adopted in the investigation showed the bauxite deposits within the study area are surficial or near-surface occurrence. Keywords: Orin Ekiti, Remote sensing, Lateritic bauxite, weathered zone, supergene mineral, Electrical resistivity imaging INTRODUCTION Mineral resource mapping is considered an important aspect of geologic and geophysical activity and usually covers a major part of many studies, focused on spectralanalysis (Longhiet al., 2001; Sabins,1999; Neville et al., 2003), geological mapping ( Harris, 1991; Liu and Gopinath, 2000), structural mapping ( Liu et al., 2000; Sunmonu and Alagbe, 2014; Alagbe and Sunmonu, 2014;Alagbe,2020), identification of hydrothermal alteration zones (Brown et al., 1980;Podwysocki et al., 1983; Ohioma et al., 2017), mineral alteration mapping (Tangestani and Moore, 2002), ferric oxide and oxyhydroxide mineral mapping (Farrand and Harsanyi, 1997), gold exploration ( Neville et al., 2003,Akinlalu etal., 2017; Ohioma et al., 2017), integration with geographic information systems (GIS) ( Akhayi et al. 2001; Rajesh, 2004). *Corresponding Author: Alagbe Olufemi Adigun; Department of Applied Geophysics, Federal University of Technology, Akure-Nigeria. Email: [email protected] Research Article Vol. 7(1), pp. 337-357, March, 2021. © www.premierpublishers.org. ISSN: 3019-8261 International Journal of Geology and Mining
Transcript of Application of Geophysical and Remote Sensing Techniques ...

Application of Geophysical and Remote Sensing Techniques to Delineate Lateritic Bauxite Deposit Zone in Orin Ekiti, Nigeria
Application of Geophysical and Remote Sensing Techniques to Delineate Lateritic Bauxite Deposit Zone in Orin Ekiti, Nigeria
*Alagbe Olufemi Adigun1 and Amosun Joel Olayide2 1Department of Applied Geophysics, Federal University of Technology, Akure-Nigeria
2Department of Geophysics, Federal University, Oye Ekiti-Nigeria
Application of geophysical and remote sensing techniques was used to delineate lateritic bauxite zone in Orin Ekiti, Southwestern Nigeria. Three basic methods were employed to qualitatively define and identify plausible areas or zones of bauxite ore deposit within the study area. The remote sensing data utilized for the study were the Landsat (ETM) image and Shuttle Radar Topography Mission (SRTM) data in Digital Elevation Model (DEM) image. From the processed remote sensing data, features like topography, vegetation, settlements, and rocks which are all favourable features for bauxite formation were all observed and delineated. The use of magnetic method through the use of high resolution aeromagnetic data (HRAD) of sheet 224, enables different enhancement magnetic maps to be generated. These maps were used to define boundaries, contacts and edges of different rock types within the study area, and the production of a mineralization potential map for the study area. Three major rock types were identified and mapped, these are magmatite, granite gneiss and charnockite rocks. Charnockite rocks which are considered as parent rock for bauxite have low magnetic susceptibility values; therefore, zones of low magnetic susceptibility are mapped, with values ranged between -92.4 nT to -56.9nT, observed at central part trending in the east to west, and also in the northwestern and southwestern parts of the study area. Five traverses were established for electrical resistivity imaging (ERI). Bauxite being a weathered product of charnockite rock, zones of its existence is expected to have high resistivity values. So, along the five traverses, zones of high resistivity values were mapped as bauxite zones, having value ranged between 600 Ωm to 101404Ωm, and occurred within the depth ranged between 0 (surface) to maximum depth probed (15m). All the techniques adopted in the investigation showed the bauxite deposits within the study area are surficial or near-surface occurrence.
Keywords: Orin Ekiti, Remote sensing, Lateritic bauxite, weathered zone, supergene mineral, Electrical resistivity imaging INTRODUCTION Mineral resource mapping is considered an important aspect of geologic and geophysical activity and usually covers a major part of many studies, focused on spectralanalysis (Longhiet al., 2001; Sabins,1999; Neville et al., 2003), geological mapping ( Harris, 1991; Liu and Gopinath, 2000), structural mapping ( Liu et al., 2000; Sunmonu and Alagbe, 2014; Alagbe and Sunmonu, 2014;Alagbe,2020), identification of hydrothermal alteration zones (Brown et al., 1980;Podwysocki et al., 1983; Ohioma et al., 2017), mineral alteration mapping (Tangestani and Moore, 2002), ferric oxide and
oxyhydroxide mineral mapping (Farrand and Harsanyi, 1997), gold exploration ( Neville et al., 2003,Akinlalu etal., 2017; Ohioma et al., 2017), integration with geographic information systems (GIS) ( Akhayi et al. 2001; Rajesh, 2004).
*Corresponding Author: Alagbe Olufemi Adigun; Department of Applied Geophysics, Federal University of Technology, Akure-Nigeria. Email: [email protected]
Research Article
Vol. 7(1), pp. 337-357, March, 2021. © www.premierpublishers.org. ISSN: 3019-8261
International Journal of Geology and Mining

Application of Geophysical and Remote Sensing Techniques to Delineate Lateritic Bauxite Deposit Zone in Orin Ekiti, Nigeria
Alagbe and Amosun 338 Studies have shown that most of the surface and near-surface mineral deposits in accessible parts of the earth have been found and current emphasis is now shifted on the location of deposits far below the earth’s surface or in inaccessible parts. Geophysical methods that provide deep penetration into the earth are now generally required to locate potential deposits. However, much needed information about potential areas for mineral exploration can be provided through the processing and interpretation of surface features on aerial photographs, satellite images and related data acquired from aircraft and satellites. (Sabins, 1999; Sunmonu and Alagbe, 2014; Alagbe and Sunmonu, 2014). Meanwhile, the use of remotely sensed images cannot replace direct ground observation and data derived from field and laboratory studies, but they can form valuable supplements to more traditional methods and provide information and a new perspective otherwise not available. Minerals are the foundation for economic and industrial development of any nation. Raw materials and chemicals for items uses at home and industries are gotten mainly from mining operation (Vogley, 1985; Hill and Sehnka, 2006). Mineral exploration is capable of sustaining economic growth and industrial development of any nation. Mineral resources are seen as the major sources of raw material in many manufacturing industries such as iron and steel, tin smelting, glass, chalk, fertilizer, cosmetic and construction, to mention but a few. The degree of industrialization of a nation is directly depended and related to the level of utilization of its mineral resources. Minerals are important for economic growth and development of any nation but unfortunately, knowledge about occurrence, mineralogical composition and reserves of many minerals are not fully known and understood (Ajaka and oyathelemi, 2010). Nigeria is richly endowed with a variety of solid minerals of various categories ranging from precious mineral to various stones and also industrial minerals such as barites, gypsum, kaolin and marble but statistically, the level of exploitation of these minerals is very low in relation to the extent of deposit found in the country, probably due to the reason stated above. Nigeria as a nation has been battling with dwindling revenue due to the fall in oil price in the international market. This situation is retarding the rate of development and consequently making it difficult for government to perform her social responsibilities. With this development there is the need to intensify research in mineral exploration and exploitation, for it is assumed that a well-developed and sustainable solid mineral sector will be of immense benefit in quickening the diversification of the nation’s economy which has been so dependent on crude oil for a very long time in Nigeria. This has necessitated this research work at Orin- Ekiti where occurrence of mineralization with high economic potential is visible. Though little geological and geophysical mapping has
been carried out to probe mineralization potential in the area (Talabi et al, 2013; 2017; 2018), however, no detailed geophysical study has focused on mode of occurrence of mineralization in the area especially the geological structure controlling/hosting mineralization and form of occurrence. There is also the need to derive detailed information on the extent, the trend and depth to the structures (e.g. fracture/fault zones) that might be controlling emplacement of mineral deposits in the area. In this work, applications of GIS (remote sensing technique), airborne magnetic (High Resolution Aeromagnetic Data), and electrical resistivity methods were employed to evaluate mineralization potential of the study area and the production of a new mineralization potential map of the area. Remote sensing data and aeromagnetic data are primarily used to delineate different rock types and geological structures in mineral exploration (Folami, 1992; Alagbe and Sunmonu, 2014; Sunmonu et al, 2013). Minerals are the constituent of rocks, ores, and meteorites, and with a few exceptions they are the most stable chemical elements known to man. Among several mineral deposits in Nigeria, bauxite deposits are found majorly in four states of the federation and these are Plateau, Ondo, Ekiti, and Adamawa states (Ajaka and Oyathelami, 2010). Bauxite is a heterogeneous and naturally occurring material of different composition that is relatively rich in aluminium. Therefore bauxite is adjudged to be a product of lateritic weathering that is riched in alumina. Bauxite contains 40-60 percent Al2O3
(Aluminium Oxide), 9-18 percent Fe2O3 (Iron Oxide), 2-9 percent TiO2 (Titanium Oxide) and 1.5-4.5 percent SiO2
(Silicon Oxide). The major minerals in bauxite are gibbsite (Al2O3.3H2O), boehmite (Al2O3.H2O) and diaspora which has the same composition as boehmite but is denser and harder (Plunkert, 2000; Le Maitre et al., 2005; Talabi et al, 2017; 2018). Bauxite is the most important raw material of aluminum, it is used for soft drinks cans, aircraft manufacturing, for the manufacture of refractories, abrasives, alumina chemicals and cement industry, chemicals, soda cans, dishwashers, catalyst, and many more. Bauxite is the major raw material used in the commercial production of alumina (Al2O3) and aluminum metal, although some clays and other materials can be utilized to produce alumina. Bauxite is an aggregate of supergene minerals rich in hydrated aluminium oxides [Gibbsite Al(OH)3, boehmite γ-AlO(OH) and diaspore α-AlO(OH)], plus minor quantity of iron oxides [goethite (FeO(OH)) and haematite (Fe2O3)] with trace amounts of silica (SiO2) and anatase (TiO2). Therefore, in view of the huge economic importance of bauxite as enumerated above, this research work is embarked upon and is targeted at imaging the subsurface settings of lateritic bauxite deposit in Orin Ekiti, Southwestern Nigeria and also to delineate other potential zones in the area and produce a reliable mineralization potential map for further studies in the area

Application of Geophysical and Remote Sensing Techniques to Delineate Lateritic Bauxite Deposit Zone in Orin Ekiti, Nigeria
Int. J. Geol. Min. 339 CLASSIFICATION OF BAUXITE Based on their genesis, bauxites can be broadly classified into 3 types: Lateritic bauxites: Intense and heavy chemical weathering of rocks (igneous, sedimentary or metamorphic) leads to accumulation of aluminous or aluminoferrugenous formations (Patterson 1967) forming lateritic bauxites. Lateritic bauxite of residual origin occurs as capping over plateaus and occurs in tropical countries. The formation of bauxites depends more on weathering conditions with good drainage, geomorphology, hot and humid climate, stable tectonic region, peneplanation and time. Formation of bauxite from parent rock involves dissolution of silicate minerals, alkalis, silica and enrichment of Al, Fe, Ti, aluminium hydroxides at pH values ranging from 5.5 to 8. The aluminium hydroxide in the lateritic bauxite deposits is rich in gibbsite with small amount of boehmite or diaspore. Karst bauxites: Karst bauxites occurrence is predominantly associated with carbonate rocks (limestone and dolomite). The processes involved in formation of karst bauxites and lateritic bauxites are much similar except the karstified topography. Sediments play a major role in the formation of karst bauxites by supplying alumina rich materials. The karst bauxites formed by accumulation of intercalated clay and aluminosilicates derived from nearby source rock. At times, the carbonate rock themselves may provide alumina for the formation of karst bauxite or Alumina for the formation of bauxite was derived from a distant source (Nicolas, 1974; Patterson 1967). Sedimentary bauxites: Sedimentary bauxites are transported deposits, primarily formed due to the physical weathering of pre-existing bauxite deposits and accumulation of locally transported clastic material (detrital, colluvial or alluvial) on the slopes and foothills of plateaus (Nicolas, 1974; Patterson, 1967). Transported type deposits most of the time bears no relationship with the parent rock due to long distance of transportation. In addition to the mechanical mixing of bauxite material, the chemical form of Al, Fe, and Ti transfer also plays an important role in their formation. Elements are transported from the upper parts of lateritic bauxite bodies by the surficial weathering and groundwater fluctuation. The metals are subsequently deposited both
on the surface (as crust and rim on bauxite fragments) and in pores or cavities. The sedimentary group also includes bauxites formed by post-sedimentary processes of secondary lateritization; the post-sedimentary process represents an essential component of processes of sub-aerial diagenesis (exo-diagenesis) that concerns with the formation of bauxites from kaolin clays or the refinement of primary clastic ores. It is estimated that about 88 % of the world bauxite reserve is of the lateritic type, 11.5 % as karst type and about 0.5 % represent the sedimentary type (Talabi et al., 2018). For the purpose of this study, the focus shall be on lateritic bauxites. LOCATION, CLIMATE AND GEOLOGY OF THE STUDY AREA Orin-Ekiti is about 38.8 km from Ado-Ekiti, the Ekiti State Capital (Fig. 1) and lies on latitude 7
045’.00’’ to 7
055’.00
N and longitude 5010’.00’’E to 5
020’.00” E with terrain that
is gently undulating. The topographic elevation of the area ranges between 535 and 644 m above sea level. Its climate is characterized by dry and wet season in a year. The dry season occurs between November and March, while the driest is in the month of December and January. The wet season is between April and October, while the highest rainfall is recorded in July and September. The average annual rainfall is 1333.2 mm, the annual temperature is 33
0C while the minimum is 18
0C. The
geology of the study area consists of precambrian that are typical of the basement complex rocks of South-western Nigeria (Jones and Hockey, 1964; Rahaman, 1976; Alagbe et al., 2019). The local geologic units identified in the study area are the charnokite, granite gneiss and magmatite (Fig. 2), with the principal rock outcrops which are granite gneiss, banded gneiss, granite and charnockite especially the coarse grained type. Generally, the terrain is rugged with boulders of charnockite outcropping in few locations. The study area is fairly accessible as it is connected with network of tarred and unpaved roads. However, some settlements are only connected by footpaths. The area is sparsely populated and farming activities in the area have made accessibility of some outcrops possible. Charnokite with low SiO2 , high Al2O3 and TiO2 compared with other rocks in the study area is considered more favourable to form bauxite (Talabi, et al., 2017, 2018; Eluwole et al, 2019), hence the major reason for chosen the charnokite dominated area for the research work.

Application of Geophysical and Remote Sensing Techniques to Delineate Lateritic Bauxite Deposit Zone in Orin Ekiti, Nigeria
Alagbe and Amosun 340
Figure 1: Map of the study area as depicted from map of Nigeria
Figure 2: Geologic Map of Orin Ekiti depicted the Rock Types (Modified after Talabi et al, 2013) MATERIALS AND METHOD In this research work, a combination of remote sensing and geophysical techniques were employed.
REMOTE SENSING
Remote sensing techniques involved satellite image analysis, digital image processing, visual interpretation and preparation of different thematic maps containing

Application of Geophysical and Remote Sensing Techniques to Delineate Lateritic Bauxite Deposit Zone in Orin Ekiti, Nigeria
Int. J. Geol. Min. 341
information on geology, physiography and Multispectral image bands. The remote sensing technique was applied as a reconnaissance tool to delineate areas where bauxite is concentrated using DEM and Landsat data adopting Principal Component Analysis (PCA). Also, area with topographic features and weathered zones were delineated. The remote sensing data utilized for the study were the Landsat ETM , image and Shuttle Radar Topography Mission (SRTM) data in Digital Elevation Model (DEM) image. The Landsat (TM) image data in digital format were preferred data due to the availability of three (3) bands ranging from visible to mid-infrared with 30m spatial resolution, and one thermal band with 60 m spatial resolution, this permitted a large spectrum of band combinations. Density slicing using Shuttle Radar Topographic Mission Digital Elevation Model (SRTM DEM) was adopted to delineate Orin Ekiti physiological variation. The lower part of the study area is marked by the plateau associated with denudation hills, valley fill and streams. The extraction of lineament, drainage and slope from both LANDSAT ETM and DEM was based on the decision of the most appropriate aerial photograph for surface characterization which gives the best result that are not delineated by human eyes on topographical maps. The remote sensing data were processed using ArcGis 9.1 and Envi 2.0. The lineaments were identified by visual interpretation of both LANDSAT ETM and SRTM DEM processed images. The LANDSAT data were processed in order to clearly identify the lineaments from LANDSAT data. To extract the area of interest (AOI), a false color composite band combination of 4,3,2 (RGB) was used which was preceded with principal component analysis (PCA), band rationing, directional filtering and edge enhancement was applied using line algorithm on Envi 2.0. MAGNETIC METHOD High-resolution aeromagnetic data (HRAD) used for this study was acquired from Nigeria Geological Survey Agency (NGSA). The aeromagnetic data sheet number 244 (Ado-Ekiti) acquired in 1970, was used. The aeromagnetic data were acquired along NW-SE flight lines and spaced 0.5km apart with tie lines spacing of 2km and a nominal flight altitude of 80m. The regional
correction was based on International Geomagnetic Reference field model (IGRF) 1984. This correction computed the magnetic field from the outer core which was removed from the observed data. The gridding of the magnetic data sets was done using cell sizes of 1000 m. The HRAD were processed using Geosoft Oasis Montaj. US Geological Survey Geosoft executables (USGS Gxs), Golden Software Surfer12 (Alagbe and Sunmonu, 2014; Akinlalu, et al., 2017; Ogungbemi, et al., 2018). The HRAD was used to produce the total magnetic intensity (MTI) map of the study area. The TMI map is presented as 2D map (Fig. 6). The reduction-to-equator (RTE) of the HRAD was carried out prior for further processing and analysis for accurate positioning of the anomalies. RTE operates in low latitude areas (like Nigeria) and helps to simplify interpretation by transforming magnetic data recorded at various magnetic field inclination to what they would be with zero inducing field inclination and enhance the data interpretation without losing any geophysical meaning. The RTE data was upward continued to 1000m to attenuate the high-frequency responses (which are usually cultural noise) from sources on or near the ground surface. Several filtered maps (Reduction to the equator RTE, Residual map, Total horizontal derivative THDR, and Euler deconvolution) were generated with the aim of enhancing the signature of the subsurface structural and lithologic boundaries associated with faults, contact, and fractures that eventually assisted in mapping charnockite rock dominated area or zone. ELECTRICAL RESISTIVITY METHOD The zone demarcated from HRAD as charnockite rock dominated zones (Fig. 11) was subjected to subsurface investigation using Electrical Resistivity Imaging (ERI) involving Wenner array technique. The field equipment for the resistivity survey consists of an ABEM SAS1000, four electrodes, connection cable, measuring tapes. The coordinates of measurement station were taken using Garmin GPS. Five (5) traverses were established at 45 m inter-traverse separation (Fig. 3), and 100 m traverse length in the NE-SE direction. The Electrical Resistivity Imaging (ERI) data using Wenner array technique were processed using Dippro software to produce pseudosections used for interpretation.

Application of Geophysical and Remote Sensing Techniques to Delineate Lateritic Bauxite Deposit Zone in Orin Ekiti, Nigeria
Alagbe and Amosun 342
Figure 3: Base map depicted traverse lines RESULTS AND DISCUSSION Results The interpretation results are presented in the form of maps, table and 2D resistivity structures. Discussions REMOTE SENSING Shuttle Radar Topographic Mission Digital Elevation Model (SRTM-DEM) has been used in the study and the results was qualitatively interpreted by considering the presence of features favourable to bauxite occurrence in the study area (Gow, 1993; Talabi et al., 2018). It is observed that Bauxite occurrences are governed by slope, altitude, vegetation, settlement and rocks and generally occurs at low slope region around 710 meter height (Talabi et al., 2018).
The deep red colour coded zones (Fig. 4) with a high elevation of 710metre suggest the zones to be possible areas or favourable zones for bauxite occurrence. The northeastern part appears to have the highest concentration, hence the choice of the area for the study or area of interest. To further demarcate the study area or area of interest into various physiological occurrence, a combination of bands was used to produce such demarcations which includes regions with vegetation (green colour coded), settlements (red colou coded) and rocks (black colour coded) (Fig. 5), which are all important features for lateritic bauxite occurrence. Topographic features mostly control the bauxitization process. Geomorphic expression with favourable slope, which facilitate free drainage of the leachates, is very important in the formation of bauxite deposits. If there is no favorable slope to facilitate free drainage, there can be a stagnation of water promoting ‘Saprolitic weathering’ resulting in the formation of residual clay.
Application of Geophysical and Remote Sensing Techniques to Delineate Lateritic Bauxite Deposit Zone in Orin Ekiti, Nigeria
Int. J. Geol. Min. 343
Figure 4: Digital Elevation Map (DEM) of Orin Ekiti

Application of Geophysical and Remote Sensing Techniques to Delineate Lateritic Bauxite Deposit Zone in Orin Ekiti, Nigeria
Alagbe and Amosun 344
Figure 5: Image Classification map MAGNETIC METHOD Total Magnetic Intensity (TMI) Map The TMI is presented as 2D map (Fig. 6). The aeromagnetic map revealed the variations in the magnetic field intensity over the study area, and this is probably attributed to the differences in the magnetic mineral content within various or different lithologies and within different depths to the magnetic minerals or rocks. Over the study area the magnetic field intensity values ranged from -938.1 nT to 460.7nT. The study area is divided into three major magnetic zones; the low
magnetic zone (ranging between -938.1 nT to 48.0nT), the medium magnetic zone (ranging between 48.0 nT to 99.2nT) and high magnetic zone (ranging between 99.2 nT to 460.7nT). The low to medium magnetic zones dominated the study area especially in the northern to the central part of the study area. The suspected charnockitic rock (low magnetic zones with deep-blue and light-blue colour coded) is well observed conspicuously at the central part trending east to west direction and also sparsely observed at the northwestern part of the study area.

Application of Geophysical and Remote Sensing Techniques to Delineate Lateritic Bauxite Deposit Zone in Orin Ekiti, Nigeria
Int. J. Geol. Min. 345
Figure 6: Total Magnetic Intensity Map (TMI) of the Study Area Reduction to Equator (RTE) Map The RTE of HRAD was carried out prior for further processing and analysis for accurate positioning of the anomalies. RTE operates in low latitude areas and helps to simplify interpretation by transforming magnetic data recorded at various magnetic field inclinations to what they would be with zero inducing field inclination. The TMI map was observed to contain some cultural noise or some near-surface irregularities. So the reduction-to- equator (RTE) was carried out on HRAD, to enhance the data by removing the asymmetry and cultural noise. The RTE map (Fig.7) appears smoother when compared with TMI map (Fig. 6). The RTE magnetic field intensity values ranged between -908.7 nT
to 689.5nT. The three major magnetic zones still appear on the RTE map but sharper, smoother and clearer than that of TMI. The low magnetic zones ranged from -908.7 nT to 26.5nT, the medium magnetic zones ranged from 26.5 nT to 105.2nT, while the high magnetic zones ranged from 105.2 nT to 689.5nT. The central part trending east to west with values ranged from -908.7 nT to -40.5 nT (deep and light blue colour coded) and also appearing in the northwestern part still reflect the dominance of low magnetic zones attributed to the presence of charnockitic rocks, which actually is the interest of this research work. The other high magnetic field intensity zones may have been as a result or may have occurred and observed over magmatite gneiss and granite gneiss, which dominated the southern part of the study area (red and pink colour coded)

Application of Geophysical and Remote Sensing Techniques to Delineate Lateritic Bauxite Deposit Zone in Orin Ekiti, Nigeria
Alagbe and Amosun 346
Figure 7: Reduction- to- Equator Map of the Study Area Residual Magnetic Anomaly Map The residual magnetic anomaly map (Fig. 8) showed the variation in the magnetic field intensity over the study area, which equally reflect the magnetic susceptibility of different rocks across the study area. The residualization was achieved by removing the effect of deep-seated magnetic sources (Regional) through the upward continuation of the maps to a height of 1000m and subsequently subtracting the results from the observed values to leave the shallower magnetic effects which are the main targets of mineral exploration and of course this research work. The residual magnetic anomaly map
ranged in value between -921.4 nT to 655.1nT. The low magnetic anomaly zones are still occupying the central part, trending in the east to west direction. It is also observed, though not conspicuous, in the northwestern and southwestern parts of the study area with values ranging between -921.4 nT to -56.9nT. The magnetic lows are suspected to be an indicative of rocks of low magnetic susceptibilities (weathered material, e.g. laterite)), which still confirms the presence and dominance of charnockitic rocks within the zone in the study area.

Application of Geophysical and Remote Sensing Techniques to Delineate Lateritic Bauxite Deposit Zone in Orin Ekiti, Nigeria
Int. J. Geol. Min. 347
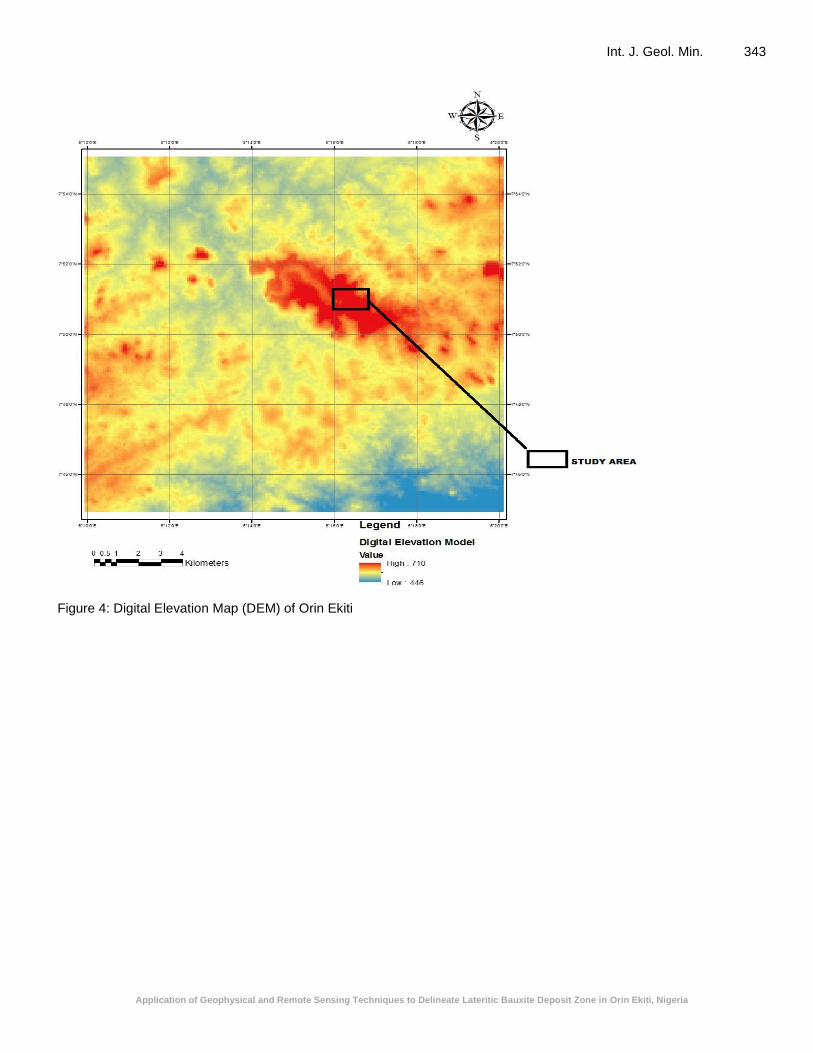
Figure 8: Residual Map of the Study Area Total Horizontal Derivative (THD) Map The THD method requires a transform of the magnetic anomaly map to a map with data reduced to the equator. Maxima in mapped enhancement indicate source edges and were used to reveal the horizontal boundaries of the sources. THD method is a simple approach to locate linear structures such as contacts and faults from potential field data. Depth estimates from RTE magnetic field (excluding dipolar effects) represent minimum source depths, and are accurate only for contacts of large extent. Figure 9, showed the 2D map of THD, the linear structures are indicative of faults, edges and contacts that majorly trend in the NE-SW direction. Because THD reduced to equator measures minimum depth, the near-surface structures are well revealed. The THD values or
gradients ranged from 0.000213 nT/m to 1.842315nT/m. The maxima (indicative of edges, contacts and faults) were observed to be concentrated at the central trending east.(pink colour coded), and also observed at the northwestern, western and southern parts of the study area. These maxima zones were previously mapped as low magnetic zones and so are considered as potential areas or zones for low magnetic susceptibility rocks. Majorly the THD map has helped to map the boundaries, edges and contacts of low magnetic susceptibility rocks which are in this case charnockite rocks. Other zones with different colour coded (blue, green, yellow, red) are also boundaries, edges and contacts of other rocks (magmatite, granite gneiss) present in the study area.
Application of Geophysical and Remote Sensing Techniques to Delineate Lateritic Bauxite Deposit Zone in Orin Ekiti, Nigeria
Alagbe and Amosun 348
Figure 9: Total Horizontal Derivative (THD) Map
Euler Deconvolution Map
The Euler deconvolution of the HRAD was carried out to determine the locations and depth to the sources of magnetic anomaly and other sources in the area. The Euler deconvolution process was carried out on the aeromagnetic data of the study area using structural index (SI) of 0 window 5. Figure 10, shows a standard
Euler index of 0 (SI= 0), which applies to simple model of a magnetic field caused by the presence of rock contact as potential source for the magnetic anomaly observed in the study area. This showed tight clusters of solution characteristic of features diagnostic of contacts between two rock units and values ranging from <150m to > 300 m were estimated as depth to these features.

Application of Geophysical and Remote Sensing Techniques to Delineate Lateritic Bauxite Deposit Zone in Orin Ekiti, Nigeria
Int. J. Geol. Min. 349
Figure 10: Euler Deconvolution Map (SI = 0, WIN 5) BAUXITE MINERALIZATION POTENTIAL MAP The analysis of aeromagnetic study of the area showed the demarcation of the study area into three distinct rock types, the chanockite, migmatite and granite gneiss. Since the interest of the study is to delineate zones of charnockite rocks which are parent rock for bauxite formation. Magnetically, such zones revealed themselves as low magnetic susceptibility zones. Therefore various maps especially, the residual map, THD map and the Euler map (generated from HRAD) were overlaid on the geologic map of the study area where zones of low magnetic susceptibility, high gradient or maxima zones were mapped and used to produce bauxite mineralized potential zone map of the study area (Fig. 11). Three major zones were demarcated (yellow colour coded) as charnockite rock zones and hence bauxite deposit potential zones. Other two zones, magmatite (orange
colour coded) and granite gneiss (metallic color coded) were also demarcated. The new map produced (mineralization potential map, Fig. 11) showed that charnockite rocks occurs at three areas or zones within the study area, the northwestern, southwestern and the north eastern parts. To further study the subsurface setting of lateritic bauxite deposit at the study area and for detailed information on the geometry of the weathered zone which bauxite formation is associated with, the north eastern part of the mineralization potential map was subjected to electrical resistivity method, using 2D imaging technique involving dipole-dipole arrays. Five traverses were established for this purpose (Fig. 3) and the results was generalized for the two other charnockite rock zones at the northwestern and the southwestern part of the study area (yellow colour coded zones).

Application of Geophysical and Remote Sensing Techniques to Delineate Lateritic Bauxite Deposit Zone in Orin Ekiti, Nigeria
Alagbe and Amosun 350
Figure 11: New Mineralization potential Map 2D ELECTRICAL RESISTIVITY IMAGING (ERI) Interpretation of the inverse model resistivity section is done using information obtained from the resistivity values over the study area and it is presented as pseudosections (Fig. 12 to 16). The complete set of geoelectrical images, measured apparent resistivity pseudosection (field data pseudosection), calculated apparent resistivity pseudosection (Theoretical pseudosection), and the inverse model section (2D resistivity structure) are also shown in the figures. The reliability of the inverse model resistivity section is highly reflected in the degree of agreement between the measured and the calculated resistivity pseudosection. The dipole-dipole array was utilized for the 2D electrical resistivity imaging over the survey area to determine both lateral and vertical variation in apparent resistivity of the subsurface materials. Qualitative interpretations were made by visual observation of pseudosections. The geoelectric layers delineated varies in resistivity and it is denoted by different colours with resistivity rating as shown in Table 1, for easy interpretation. Table 1: Colour Ratings
Color Resistivity Rating
Blue Low
Green Medium
Yellow High
Red Very High
Source: Author Traverse 1
Along traverse 1 (fig.12 ) electrode spacing of 5m was used with a total length of 100m and the apparent resistivity plotted against the pseudo-depth in the northwest-southeast (NW-SE) direction. The 2D electrical resistivity section (pseudosection) along the traverse is a reflective of the subsurface resistivity along the traverse. A low resistive zone with resistivity values ranged between 110 Ωm and 164Ωm (blue clour coded) is observed at two zone along the traverse. The first zone appears between stations 3 and 5, occurring at depths ranging between 0m and 2.5m in the northwestern part, while the second zone occurs at the southeastern part of the traverse between stations 11 to 16 and at depths ranging between 5m and extends downwards. A medium resistive zone (green colour coded) was observed along the traverse line. This zone appears to be dominant and with resistivity values ranging between 202 Ωm to 259 Ωm. This zone extends to the surface at stations between 1to 3 and between stations 9 to19. It occurs from the surface and extends down to the maximum depth probed in most areas along the travers especially at the central and southeastern parts. A high resistive zone (yellow colour coded) was observed appearing as a cap or band covering a very high resistive zone, it occurs between stations 4 to 10, 12 to 13 and 17 to 19, with resistivity values ranging between 4452 Ωm to 544 Ωm and occurring at depths bwtween 2.5m with downward extension. This zone is suspected to be granular bauxites believed to have emanated from the friable/stippled bauxite ore. A very high resistive zone (red colour coded) was observed at the northwestern portion of the traverse with resistivity values ranging between 557 Ωm to 2222 Ωm. It occurred between stations 4 to 10 and at depths

Application of Geophysical and Remote Sensing Techniques to Delineate Lateritic Bauxite Deposit Zone in Orin Ekiti, Nigeria
Int. J. Geol. Min. 351
between 2.5m and extends downwards to the maximum depth probed (15m). Along this traverse, the red colour band zone was taken as the region with concentration of bauxite deposit (BZ). This very high resistive zone suggested the presence of weathered material (laterite) hosting bauxite deposit. Other resistivity zones (blue, green, yellow) are indicative of presence of other rocks
like magmatite gneiss and granitic rocks which are of lower resistivity values than the weathered chanockitic rock (bauxitic ore). The occurrence of bauxitic ore at depth of 2.5m with an extension downwards also confirmed the surficial manifestation of bauxite occurrence.
Figure 12: 2-D Pseudo-section along traverse 1 Traverse 2: The pseudosection for traverse 2 (Fig 13) also showed four distinct resistivity zones. The first is the low resistive zone (blue colour coded) with resistivity values ranging between 100 Ωm to 143Ωm, which occurred at two isolated places along the traverse. One at stations 3 to 5 at depth of 5m and extends downwards, the other is at stations between13 to 14 at depth of 1m. The second zone which is classified as medium zone (green colour coded) appeared to be uniformly distributed along the surface with a little discontinuity between stations 6 to 8 and 12 to 14. This zone has resistivity values ranging between 141 Ωm to 290Ωm, and majorly occurred between the surface to the depth of about 5m, with the exception of the western flank where it extended
downward to a depth of about 15m. The third zone is the high resistive zone (yellow colour coded) with resistivity values ranging between 264 Ωm to 473Ωm, occurring as a thin cap over the red colour coded zone between stations 6 to 18 at the depth of 2.5m between stations 6 to 12 and 5m between stations 13 to 18. The fourth zone (red colour coded) appeared to be very prominent, dominant and occupied the largest part along the traverse. It has resistivity values ranged between 600 Ωm to 2343Ωm, occurring between stations 6 to 18 at depth of 2.5 to 15m. Here, again the red colour coded zone is suggested to be the bauxite deposit zone because of its very high resistivity values compared with other zones, which are suggesting presence of weathered materials (literite).

Application of Geophysical and Remote Sensing Techniques to Delineate Lateritic Bauxite Deposit Zone in Orin Ekiti, Nigeria
Alagbe and Amosun 352
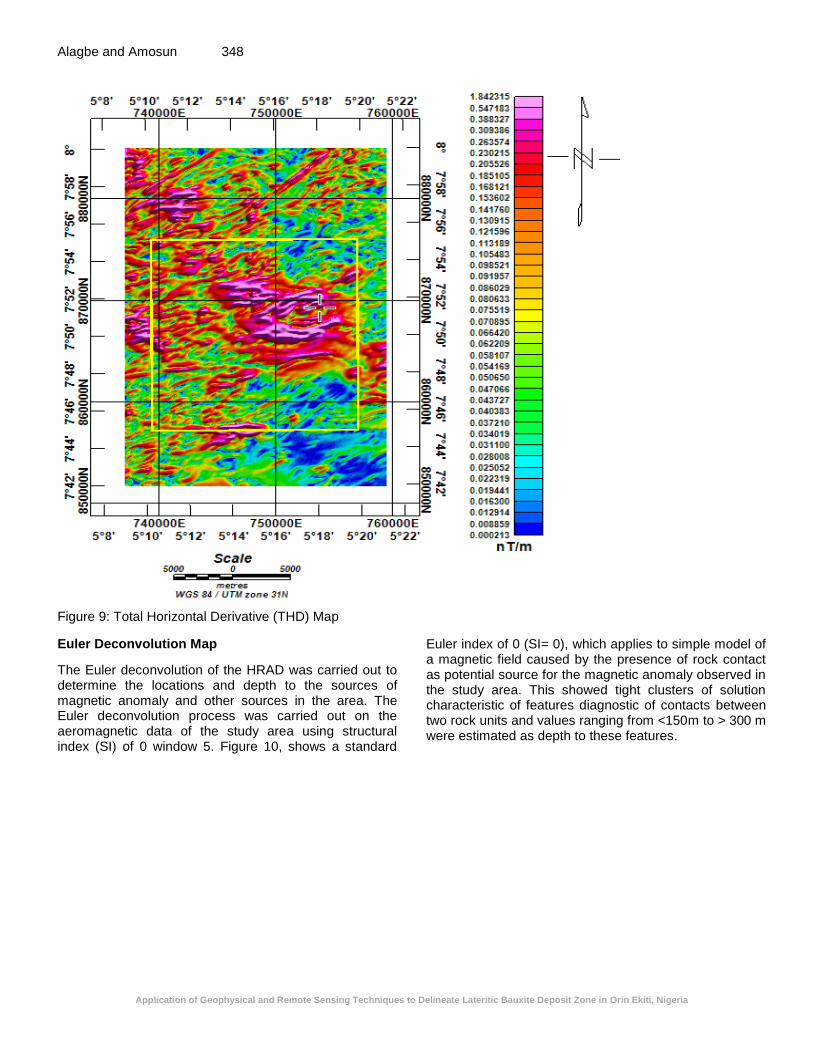
Figure 13: 2-D Pseudo-section along traverse 2 Traverse 3: Traverse 3 (Fig. 14) also showed four distinct resistive zones from its pseudo-section. The first zone, i.e. low resistive zone (blue colour coded), occurring at two isolated places along the traverse, one occurring faintly at the surface between stations 4 to 5 on the western side of the traverse and the other occurring at the central part between stations 7 to 12 at the depth of 11m and extends downwards. This zone has resistivity values ranging between 6.32 Ωm to 11.8 Ωm. The extremely low resistivity values at these zones suggest it to be composed of clay formation. The second zone is the medium resistive zone (green colour coded) has resistivity values ranged between 35.1 Ωm to 86.3 Ωm and occurred at two places along the traverse. It occurred at western part between stations 1to 5 at depth from the surface down to 3m and at the central part at stations 6 to
14 occurring at the depth of 7.5m down to the 15m. This zone is suspected to be clay/clayey zone. The third zone (yellow colour coded) has resistivity values ranging between 272 Ωm to 293 Ωm, and occurred as dyke or an intrusion at stations 6, 10 to11 and 14 to 15, extending from the surface downwards. The last which is the fourth zone (red colour coded) occurred at four isolated zones along the traverse, at the western flank between stations 1 to 5 at depth of 4m to 15m, also at the central part occurring at the surface between stations 6 to 9 and 11 to 13 at the depth from the surface to 5m with a discontinuity between stations 10 to 11 and 14 to 15. There is another observed occurrence of this zone at the eastern flank of the traverse occurring to the surface and extends downwards to the maximum depth probed (15m). This fourth zone has resistivity values ranged between 1137 Ωm to 3579 Ωm and it is regarded as bauxite deposit zone (BZ).
Application of Geophysical and Remote Sensing Techniques to Delineate Lateritic Bauxite Deposit Zone in Orin Ekiti, Nigeria
Int. J. Geol. Min. 353
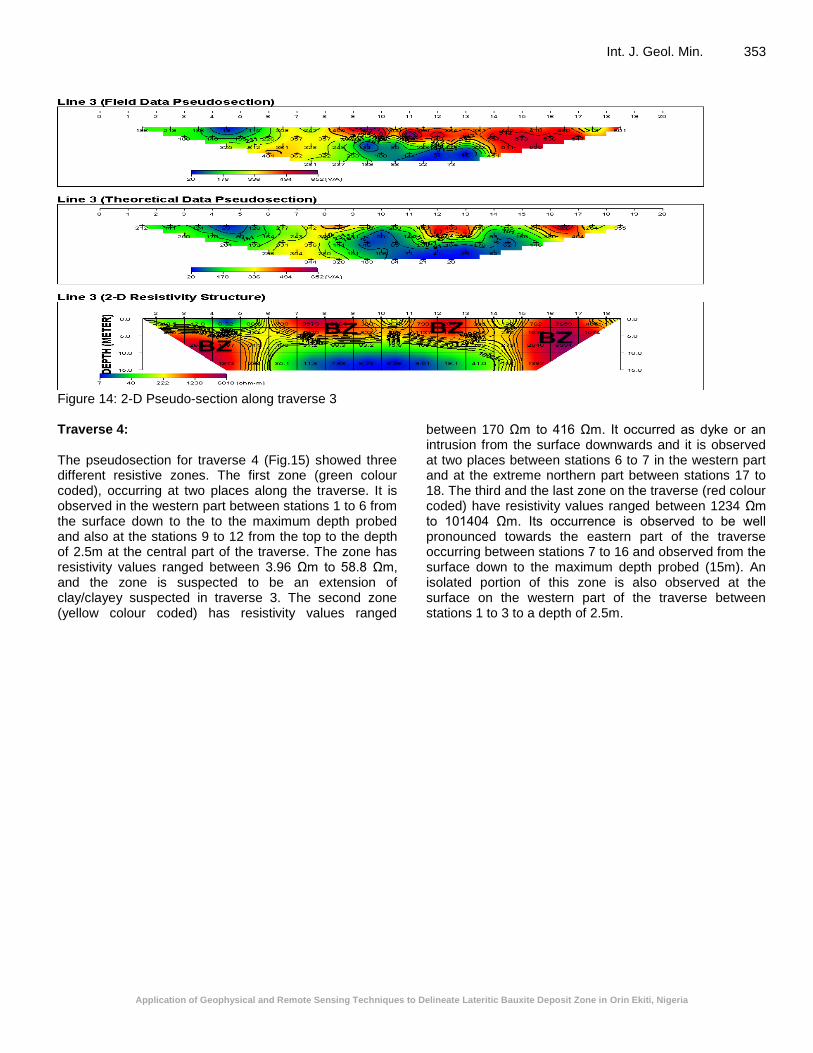
Figure 14: 2-D Pseudo-section along traverse 3 Traverse 4: The pseudosection for traverse 4 (Fig.15) showed three different resistive zones. The first zone (green colour coded), occurring at two places along the traverse. It is observed in the western part between stations 1 to 6 from the surface down to the to the maximum depth probed and also at the stations 9 to 12 from the top to the depth of 2.5m at the central part of the traverse. The zone has resistivity values ranged between 3.96 Ωm to 58.8 Ωm, and the zone is suspected to be an extension of clay/clayey suspected in traverse 3. The second zone (yellow colour coded) has resistivity values ranged
between 170 Ωm to 416 Ωm. It occurred as dyke or an intrusion from the surface downwards and it is observed at two places between stations 6 to 7 in the western part and at the extreme northern part between stations 17 to 18. The third and the last zone on the traverse (red colour coded) have resistivity values ranged between 1234 Ωm to 101404 Ωm. Its occurrence is observed to be well pronounced towards the eastern part of the traverse occurring between stations 7 to 16 and observed from the surface down to the maximum depth probed (15m). An isolated portion of this zone is also observed at the surface on the western part of the traverse between stations 1 to 3 to a depth of 2.5m.

Application of Geophysical and Remote Sensing Techniques to Delineate Lateritic Bauxite Deposit Zone in Orin Ekiti, Nigeria
Alagbe and Amosun 354 Figure 15: 2-D Pseudo-section along traverse 4
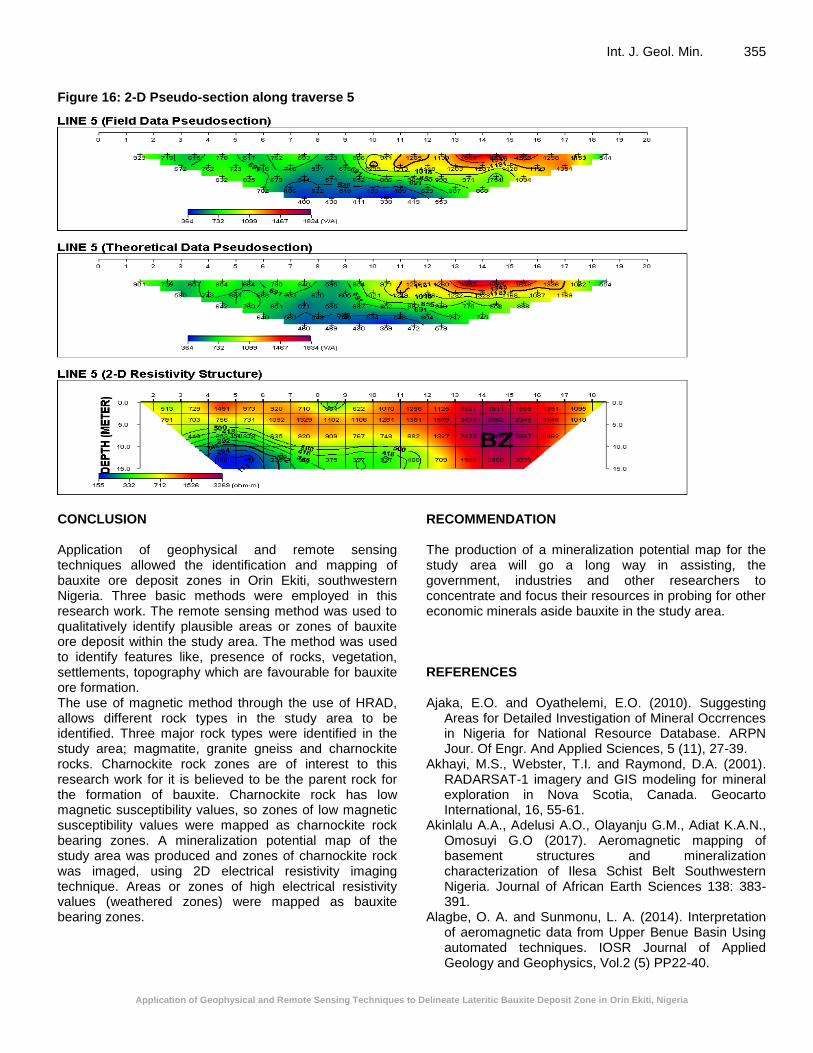
Traverse 5: The pseudosection for traverse 5 (Fig. 16) revealed four distinct resistive zones. The first zone which is low resistivity zone (blue colour coded), occurred as an isolated body at the western portion of the traverse with resistivity values ranged between 144 to 204 Ωm. It occurred at the depth of 10m and extends to 15m at stations between 4 to 6. The second zone (green colour coded) is observed at stations between 3 to 12 with resistivity values ranged between 292 to 500 Ωm at depth between 5 to 10m at stations between 3 to 7 and 10 to 15m at stations between stations 7 to 12. This zone is observed majorly on the western flank of the study area
and trnds towards the central part. The third zone (yellow colour coded) occurred just above the green colour coded zone and trends in the west-east direction in the form of a band separating the green colour coded and red colour coded zone. . This zone has resistivity values that ranged between 622 Ωm to 882 Ωm and occurred at depth varied between 5m to 15m along its trending path. The fourth zone (red colour coded) occurred and heavily concentrated at the eastern portion of the traverse. Its occurrence is observed from the surface down to the depth of 15m between stations 12 to 17, and at 2m to7.5m at stations between 4 to 11 with a little discontinuity at stations 8 to 9.
Application of Geophysical and Remote Sensing Techniques to Delineate Lateritic Bauxite Deposit Zone in Orin Ekiti, Nigeria
Int. J. Geol. Min. 355 Figure 16: 2-D Pseudo-section along traverse 5
CONCLUSION Application of geophysical and remote sensing techniques allowed the identification and mapping of bauxite ore deposit zones in Orin Ekiti, southwestern Nigeria. Three basic methods were employed in this research work. The remote sensing method was used to qualitatively identify plausible areas or zones of bauxite ore deposit within the study area. The method was used to identify features like, presence of rocks, vegetation, settlements, topography which are favourable for bauxite ore formation. The use of magnetic method through the use of HRAD, allows different rock types in the study area to be identified. Three major rock types were identified in the study area; magmatite, granite gneiss and charnockite rocks. Charnockite rock zones are of interest to this research work for it is believed to be the parent rock for the formation of bauxite. Charnockite rock has low magnetic susceptibility values, so zones of low magnetic susceptibility values were mapped as charnockite rock bearing zones. A mineralization potential map of the study area was produced and zones of charnockite rock was imaged, using 2D electrical resistivity imaging technique. Areas or zones of high electrical resistivity values (weathered zones) were mapped as bauxite bearing zones.
RECOMMENDATION The production of a mineralization potential map for the study area will go a long way in assisting, the government, industries and other researchers to concentrate and focus their resources in probing for other economic minerals aside bauxite in the study area. REFERENCES Ajaka, E.O. and Oyathelemi, E.O. (2010). Suggesting
Areas for Detailed Investigation of Mineral Occrrences in Nigeria for National Resource Database. ARPN Jour. Of Engr. And Applied Sciences, 5 (11), 27-39.
Akhayi, M.S., Webster, T.I. and Raymond, D.A. (2001). RADARSAT-1 imagery and GIS modeling for mineral exploration in Nova Scotia, Canada. Geocarto International, 16, 55-61.
Akinlalu A.A., Adelusi A.O., Olayanju G.M., Adiat K.A.N., Omosuyi G.O (2017). Aeromagnetic mapping of basement structures and mineralization characterization of Ilesa Schist Belt Southwestern Nigeria. Journal of African Earth Sciences 138: 383-391.
Alagbe, O. A. and Sunmonu, L. A. (2014). Interpretation of aeromagnetic data from Upper Benue Basin Using automated techniques. IOSR Journal of Applied Geology and Geophysics, Vol.2 (5) PP22-40.

Application of Geophysical and Remote Sensing Techniques to Delineate Lateritic Bauxite Deposit Zone in Orin Ekiti, Nigeria
Alagbe and Amosun 356 Alagbe, O.A. (2018). 2D Geoelectrical Resistivity Imaging
for the Assessment of Subsurface Soil Corrosivity Zones at a Proposed Filling Station Site in Akure Southwestern Nigeria. International Advanced Research Journal in Science, Engineering and Technology, Vol.5, Issue 11, PP 58-73.
Alagbe, O.A., Sanusi, S.O. and Bamigboye, A.A. (2019). 2D Electrical Resistivity Prospecting For Groundwater At The Premises Of The Staff Quarters Of Elizade University, Ilara Mokin, Ondo State, Nigeria. World Journal of Innovative Research,Vol. 6, Issue 2, PP 100-108.
Alagbe, O.A. (2020). Delineation of Bitumen Saturated Zones in Agbabu, Southwestern Nigeria, Using an Integrated Geophysical Methods.Journal of Energy and Natural Resources, Vol.9, No. 3, Pp 88-97.
Bell, R.W. and Ho, G.E. (1996). Workshop on the restoration and management of mined lands: Principles and Practice: 8-13 December, Guang Zhou, China.
Brown, G.C.; Cassidy, J.o.; Plant, E.R.; Sabine, P.A. and Watson, J.V. (1980). Basement heatflow and metalliferous mineralization in England and wales. Nature, v.288, P 657-659.
Eluwole Akinola Bolaji; Ademilua Oladimeji Lawrence; Oyinloye Akindele; Adebayo Olajide Femi; Obasi Romanus Ayoola; Talabi Abel Ojo and Olaolorun Olusola Amos (2019). Geoelectric Assessments of the Bauxite Ore Deposit at Orin-Ekiti, Southwestern Nigeria. International Journal of Applied Environmental Sciences ISSN 0973-6077 Volume 14, Number 2 (2019), pp. 197-210.
Farrand, W.H. and Harsanyi, J.C. (1997). Mapping the distribution of mine tailings in the Coeur d’ Alene River valley, Idaho, through the use of a Constrained Energy Minimization Technique. Remote Sensing of Environment, 59, 64-76.
Folami, S.L., (1992). Interpretation of Aeromagnetic Anomalies in Iwaraja Area, Southwestern Nigeria. J. of Mining and Geol., vol.28 No.2 P 391-396.
Geosoft, (2005). Quick Start Tutorial and User Guide Applications (Electronic Version); Oasis Montaj Data Processing and Analysis (DPA) System for Earth Science Applications. Euro Technologies, p. 63.
Harris, J.R. (1991). Mapping of regional structures of eastern Nova Scotial using remotely sensed images: Implications for regional tectonic and gold exploration. Canadian Journal of Remote sensing. 17, 122-135.
Jones, H. and Hockey, R. (1964). The Geology of Southwestern Nigeria. Geol. Surv. Of Nig. Bull, vol.31 pp 101.
Le Maitre, R.W; Streckeisen, A.; Zanettin, B.; Le Bas, M.J.; Bonin, B.; Bateman, P. (2005): Igneous Rocks: A classification and Glossary of Terms: Recommendations of the international Union of Geological Sciences Subcommission on the systematics of Igneous Rocks (https://books.google.com/?id=u2tVu6Sbc4kC&pg=PA
20&dq=le+maitre+classification+igneous+charnockite#v=onepage&q=le%20maitre%20classification%20igneous%20charnockite&f=false) (2 ed.). Cambridge University Press. P.20. ISBN 9781139439398.
Liu, C.C.; Sousa Jr M.A. and Gopinath, T.R. (2000). Regional structural analysis by remote sensing for mineral exploration. Paraiba state. Northeast Brazil. Geocarto International. 15, 69-75.
Longhi, I.; Sgavetti,M.; Chiari, R. and Mazzoli, C. (2001). Spectral analysis and classification of metamorphic rocks from laboratory reflectance spectra in the 0.4-2.5µm interval: a tool for hyperspectral data integration. International Journal of Remote Sensing. 22,3763-3782
Neville, R.A.; Levesque, J.; Staenz, K.,; Nadeau, C.; Hauff, P. and Borstad, G.A. (2003). Spectral unmixing of hyperspectral imagery for mineral exploration: comparison of results from SFSI and AVIRIS. Canadian Journal of Remote sensing, 29, 99-110.
Nicolas, S.M. (1974). Mineral exploration with ERTS imagery: Third ERTS-1 symposium. NASA SP-351, vol. 1, pp785-796.
Ogungbemi, O.S.; Amigun, J.O. and Olayanju, G.M. (2018). Geophysical Characterization of Mineralization Potential of Eastern Parts of Ife-Ijesha Schist-Belt, southwestern Nigeria. International Journal of Scientific and Technology Research, 7(3), 21-27.
Ohioma, J.O.; Adegbite, J.T. and Ehilenboadiaye, J.I. (2017). Geophysical Identification of Hydrothermally Altered Structures That Favour Gold Mineralization. J. Appl. Sci. Environ. Manage. Vol. 21 (16) 1047-1050
Patterson, S.H. (1967). Bauxite reserves and potential aluminum resource of the world: Geologica survey, Library of Congress Catalog-card No. GB67-156.
Plunkert P.A (2000). Bauxite and alumina: U.S. Geological Survey Mineral Commodity Summaries 2000. P. 32-33.
Podwysocki, M.H; Segal, D.B. and Abrams, M.J. (1983). Use of Multi scanner images for assessment of hydrothermal alteration in the Marysvale, Utah, Mining area. Economic Geology. 78, 675-687.
Rajesh, H.M. (2004). Application of remote sensing and GIS in mineral resource mapping – An Overview. Journal of mineralogical and petrological Sciences, volume 99,pp83-103
Rahman, M.A. (1976). Review of the basement geology of southwestern Nigeria. Geology of Nigeria, pp. 41-58
Rahaman, M.A. and Ocan, O. (1978). On the relationship in the Precambrian migmatite Gneiss of Nigeria. J. Min. Geo., 15:23-32.
Sabins, F.F.(1999). Remote Sensing for mineral exploration. Ore Geology Reviews 14, 157-183.
Sadleir, S.B. and Gilkes, R.J. (1976). Development of bauxite in relation to parent material near Jarahdal, Western Australia. Journal of the Geological Society of Australia, v.23, P. 334-344.
Sunmonu, L.A, Olasunkanmi, N.K and Alagbe, O.A. (2013). Aeromagnetic Data Interpretation for

Application of Geophysical and Remote Sensing Techniques to Delineate Lateritic Bauxite Deposit Zone in Orin Ekiti, Nigeria
Int. J. Geol. Min. 357
Geostructural Analysis of Ibadan, southwestern Nigeria.International Journal of Engineering Research & Technology, Vol.2 Issue 10 pp3058-3065.
Sunmonu,L.A. and Alagbe, O.A. (2014). Interpretation of Aeromagnetic Data of Kam, Using Semi- Automated Techniques. International Research Journal of Earth Sciences, Vol.2 (2) PP1-18.
Talabi, O.A.; Ademilua, O.L.; Ajayi, O.Z and Ougunniyi, S.O. (2013). Preliminary Geophysical Evaluation of Orin
Bauxite Deposit Southwestern Nigeria. Journal of Emerging Trends in Engineering and Applied Sciences (JETEAS), 4(3); 432-437
Talabi, A.O., Oyinloye A.O., Olaolorun O.A., Obasi R.A., Eluwole A.B., Adebayo O.F., Ademilua O.L (2017).
Petrography and Geochemistry of Orin-Ekiti Basement Rocks, Southwestern Nigeria: Implications on
Bauxitization. American Journal of Applied Sciences, pp. 230-239.
Talabi, A.O., Obasi R.O., Oyinloye A.O., Ademilua O.L., Adebayo O.F., Olaolorun O.A and Eluwole A.B (2018). Evaluation of Major and Trace Elements of Orin Ekiti Bauxite Clay.Research Journal of Applied Sciences 13 (5): 306-312.
Tangestani, M.H. and Moore, F. (2002). Porphyry copper alteration mapping at the Meiduk area, Iran.
International Journal of Remote Sensing. 23, 4815-4825.
Thompson, D.T (1982). EULDPH – A New Technique for making Computer-assisted Depth Estimates from Magnetic Data. Geophysics, 47, 31-37
Vogley, A W. (1985). Economics of the Mineral Industries, American Institute of Mining, Metallurgical and Petroleum Engineers, Inc., New York, USA.
Accepted 29 October 2020 Citation: Alagbe OA and Amosun JO (2021). Application of Geophysical and Remote Sensing Techniques to Delineate Lateritic Bauxite Deposit Zone in Orin Ekiti, Nigeria. International Journal of Geology and Mining 7(1): 337-357.
Copyright: © 2021: Alagbe and Amosun. This is an open-access article distributed under the terms of the Creative Commons Attribution License, which permits unrestricted use, distribution, and reproduction in any medium, provided the original author and source are cited.