Application of FRC constitutive models to modelling of slabs · In this context, the main objective...
22
•
Transcript of Application of FRC constitutive models to modelling of slabs · In this context, the main objective...
Loughborough UniversityInstitutional Repository
Application of FRCconstitutive models tomodelling of slabs
This item was submitted to Loughborough University's Institutional Repositoryby the/an author.
Citation: BLANCO, A. ... et al, 2014. Application of FRC constitutive modelsto modelling of slabs. Materials and Structures, 48 (9), pp.2943-2959.
Additional Information:
• This is a post-peer-review, pre-copyedit version of an article publishedin Materials and Structures. The final authenticated version is availableonline at: http://dx.doi.org/10.1617/s11527-014-0369-5.
Metadata Record: https://dspace.lboro.ac.uk/2134/32309
Version: Accepted for publication
Publisher: Springer c© RILEM
Rights: This work is made available according to the conditions of the Cre-ative Commons Attribution-NonCommercial-NoDerivatives 4.0 International(CC BY-NC-ND 4.0) licence. Full details of this licence are available at:https://creativecommons.org/licenses/by-nc-nd/4.0/
Please cite the published version.
ApplicationofFRCconstitutivemodelstothemodellingofslabs
A.Blancoa*,S.Cavalaroa,A.delaFuentea,S.Grünewaldb,C.B.MBlomb,J.C.WalravenbaDepartmentofConstructionEngineering,UniversitatPolitècnicadeCatalunya,UPC,JordiGirona1-3,08034Barcelona,Spain.bDepartmentofStructuralandBuildingEngineering,ConcreteStructuresGroup,TUDelft,Stevinweg1,2628CNDelft,TheNetherlands.
*Correspondingauthor.Tel.:+34-93-401-7347;fax:+34-93-401-1036;e-mail:[email protected] reinforcement technology has advanced significantly in the past years and, as a result,expanded to different applications. In particular, steel fibre reinforcedconcrete (SFRC) hasbeensuccessfully employed in flat slabs of several buildings in Europe with the fibres as the onlyreinforcement.However,thedesignmethodsforfibrereinforcedconcrete(FRC)structuresdonotconsiderthedifferencesthatmaycausetheuseoftestsforthecharacterizationofthematerialthatarenotrepresentativeofthestructuralbehaviourandthefibreorientationofthereal-scaleelement.Inthisregard,thepresentpapershowsanumericalstudyinwhichtwoconstitutivemodelsforFRCbased on the bending test areapplied to estimate the flexural behaviour of full-scale slabswithdifferentdimensions.Likewise,aparametricstudyisconductedtoanalysehowtheparametersofthese constitutive models affect the flexural response of the slabs and a numerical fit of theexperimental data is performed. The finite element simulations with the constitutive modelsoverestimate the experimental results. The parametric study also reveals that theparameterσ2(stress after cracking) is particularly influent in the response. Furthermore, anenhancedsectionalbehaviouroftheslabswasobservedasthewidthoftheslabsincreased.Keywords:SFRC;slab;design;fibre;modelling1.IntroductionSteel fibre reinforced concrete (SFRC) is used in a wide range of structures such aspavements(SorelliandPlizzari2006),tunnelliningsegments(PlizzariandTiberti2006;delaFuenteetal.2012)andflatslabs(DestréeandMandl2008).Evidently,alltheseelementspresent shapes and casting procedures different from the ones used in the standardspecimens employed to characterize the material (small beams subjected to bendingaccordingtoEN14651:2005(CEN2005b)orNBNB15-238(IBN1992)).Therefore,evenifthesametypeofconcreteisused,itisreasonabletoassumethatthefibreorientationandthe sectional structural responsemightbedifferent in the real-scale elementand in thebeamtestspecimen.Inlinewiththat,astudyonthemechanicalperformanceofSFRCflatslabs(Michelsetal.2012)concludedthatthefibreswerelessorientedandtheresidualstrengthdecreasedasthethicknessoftheelementincreased.Thestudyrevealedtheneedtointroducerealisticgeometryfactorsinthedesigntoaccountforthesedifferences.Nevertheless,manycodesandguidelinesforthedesignofSFRCstilldonotincludeparametersrelatedwithpossiblevariationsinthestructuralresponseduetospecialgeometries,whichshouldbeparticularlynoticeableinslab-likeelements.Instead,theresultsfromthebeamtestaredirectlyappliedtoobtain theconstitutiveequationsfromthematerial,entailingtheassumption that thesectional response from the beam test is maintained in the real-scale element. Suchhypothesismightleadtoeitherunsafeorconservativedesigninsomecases.
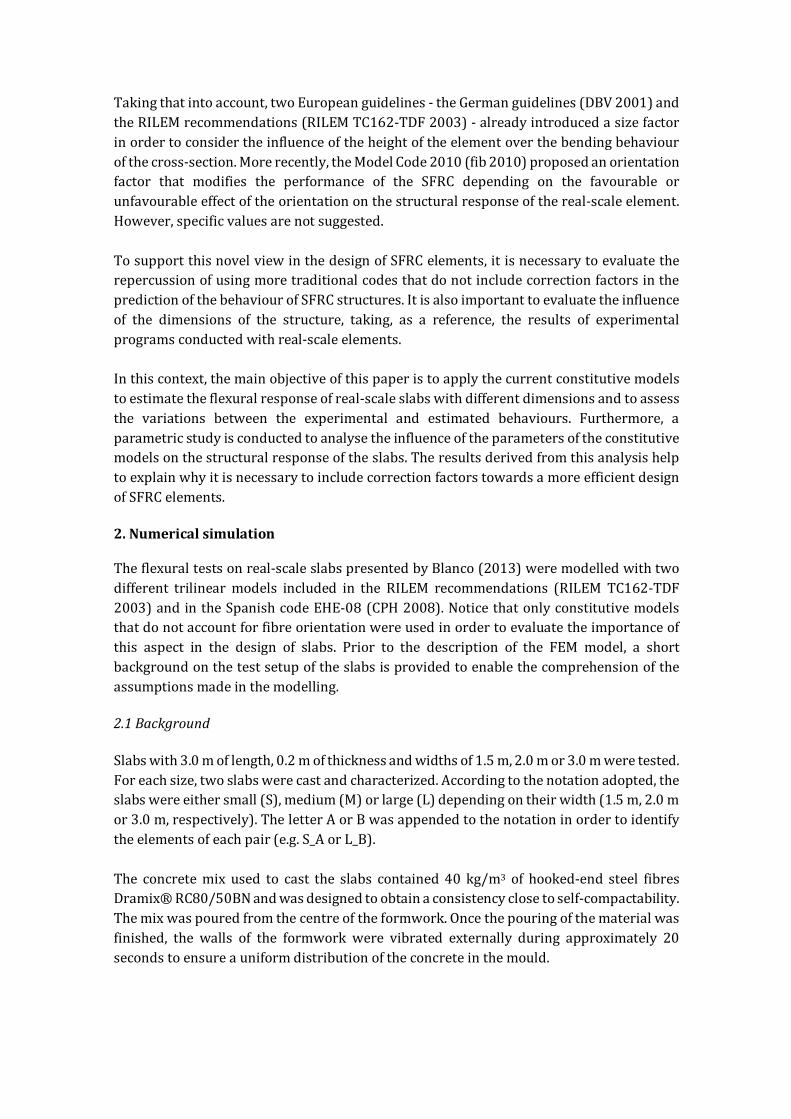
Takingthatintoaccount,twoEuropeanguidelines-theGermanguidelines(DBV2001)andtheRILEMrecommendations(RILEMTC162-TDF2003)-alreadyintroducedasizefactorinordertoconsidertheinfluenceoftheheightoftheelementoverthebendingbehaviourofthecross-section.Morerecently,theModelCode2010(fib2010)proposedanorientationfactor that modifies the performance of the SFRC depending on the favourable orunfavourableeffectoftheorientationonthestructuralresponseofthereal-scaleelement.However,specificvaluesarenotsuggested.TosupportthisnovelviewinthedesignofSFRCelements,itisnecessarytoevaluatetherepercussionofusingmoretraditionalcodesthatdonotincludecorrectionfactorsinthepredictionofthebehaviourofSFRCstructures.Itisalsoimportanttoevaluatetheinfluenceof the dimensions of the structure, taking, as a reference, the results of experimentalprogramsconductedwithreal-scaleelements.Inthiscontext,themainobjectiveofthispaperistoapplythecurrentconstitutivemodelstoestimatetheflexuralresponseofreal-scaleslabswithdifferentdimensionsandtoassessthe variations between the experimental and estimated behaviours. Furthermore, aparametricstudyisconductedtoanalysetheinfluenceoftheparametersoftheconstitutivemodelsonthestructuralresponseoftheslabs.TheresultsderivedfromthisanalysishelptoexplainwhyitisnecessarytoincludecorrectionfactorstowardsamoreefficientdesignofSFRCelements.2.NumericalsimulationTheflexuraltestsonreal-scaleslabspresentedbyBlanco(2013)weremodelledwithtwodifferent trilinearmodels included in the RILEM recommendations (RILEM TC162-TDF2003)andintheSpanishcodeEHE-08(CPH2008).Noticethatonlyconstitutivemodelsthatdonotaccountforfibreorientationwereusedinordertoevaluatetheimportanceofthis aspect in the design of slabs. Prior to the description of the FEM model, a shortbackgroundonthetestsetupoftheslabsisprovidedtoenablethecomprehensionoftheassumptionsmadeinthemodelling.2.1BackgroundSlabswith3.0moflength,0.2mofthicknessandwidthsof1.5m,2.0mor3.0mweretested.Foreachsize,twoslabswerecastandcharacterized.Accordingtothenotationadopted,theslabswereeithersmall(S),medium(M)orlarge(L)dependingontheirwidth(1.5m,2.0mor3.0m,respectively).TheletterAorBwasappendedtothenotationinordertoidentifytheelementsofeachpair(e.g.S_AorL_B).The concretemix used to cast the slabs contained 40 kg/m3 of hooked-end steel fibresDramix®RC80/50BNandwasdesignedtoobtainaconsistencyclosetoself-compactability.Themixwaspouredfromthecentreoftheformwork.Oncethepouringofthematerialwasfinished, the walls of the formwork were vibrated externally during approximately 20secondstoensureauniformdistributionoftheconcreteinthemould.
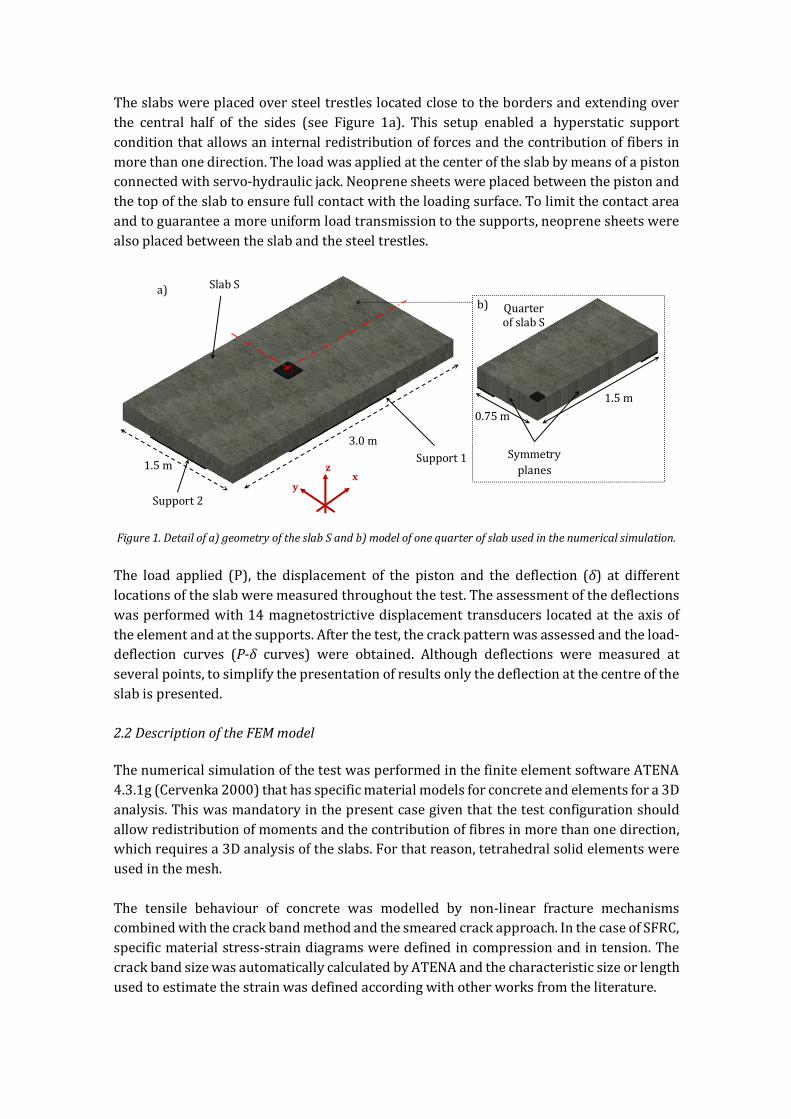
Theslabswereplacedoversteeltrestleslocatedclosetothebordersandextendingoverthe central half of the sides (see Figure 1a). This setup enabled a hyperstatic supportconditionthatallowsaninternalredistributionofforcesandthecontributionoffibersinmorethanonedirection.Theloadwasappliedatthecenteroftheslabbymeansofapistonconnectedwithservo-hydraulicjack.Neoprenesheetswereplacedbetweenthepistonandthetopoftheslabtoensurefullcontactwiththeloadingsurface.Tolimitthecontactareaandtoguaranteeamoreuniformloadtransmissiontothesupports,neoprenesheetswerealsoplacedbetweentheslabandthesteeltrestles.
Figure1.Detailofa)geometryoftheslabSandb)modelofonequarterofslabusedinthenumericalsimulation.The load applied (P), the displacement of the piston and the deflection (δ) at differentlocationsoftheslabweremeasuredthroughoutthetest.Theassessmentofthedeflectionswasperformedwith14magnetostrictivedisplacementtransducerslocatedattheaxisoftheelementandatthesupports.Afterthetest,thecrackpatternwasassessedandtheload-deflection curves (P-δ curves) were obtained. Although deflections were measured atseveralpoints,tosimplifythepresentationofresultsonlythedeflectionatthecentreoftheslabispresented.2.2DescriptionoftheFEMmodelThenumericalsimulationofthetestwasperformedinthefiniteelementsoftwareATENA4.3.1g(Cervenka2000)thathasspecificmaterialmodelsforconcreteandelementsfora3Danalysis.Thiswasmandatoryinthepresentcasegiventhatthetestconfigurationshouldallowredistributionofmomentsandthecontributionoffibresinmorethanonedirection,whichrequiresa3Danalysisoftheslabs.Forthatreason,tetrahedralsolidelementswereusedinthemesh.The tensile behaviour of concrete was modelled by non-linear fracture mechanismscombinedwiththecrackbandmethodandthesmearedcrackapproach.InthecaseofSFRC,specificmaterialstress-straindiagramsweredefinedincompressionandintension.ThecrackbandsizewasautomaticallycalculatedbyATENAandthecharacteristicsizeorlengthusedtoestimatethestrainwasdefinedaccordingwithotherworksfromtheliterature.
xy
zSupport1
3.0m
1.5m
1.5m0.75m
QuarterofslabS
SlabS
Support2
a)b)
Symmetryplanes
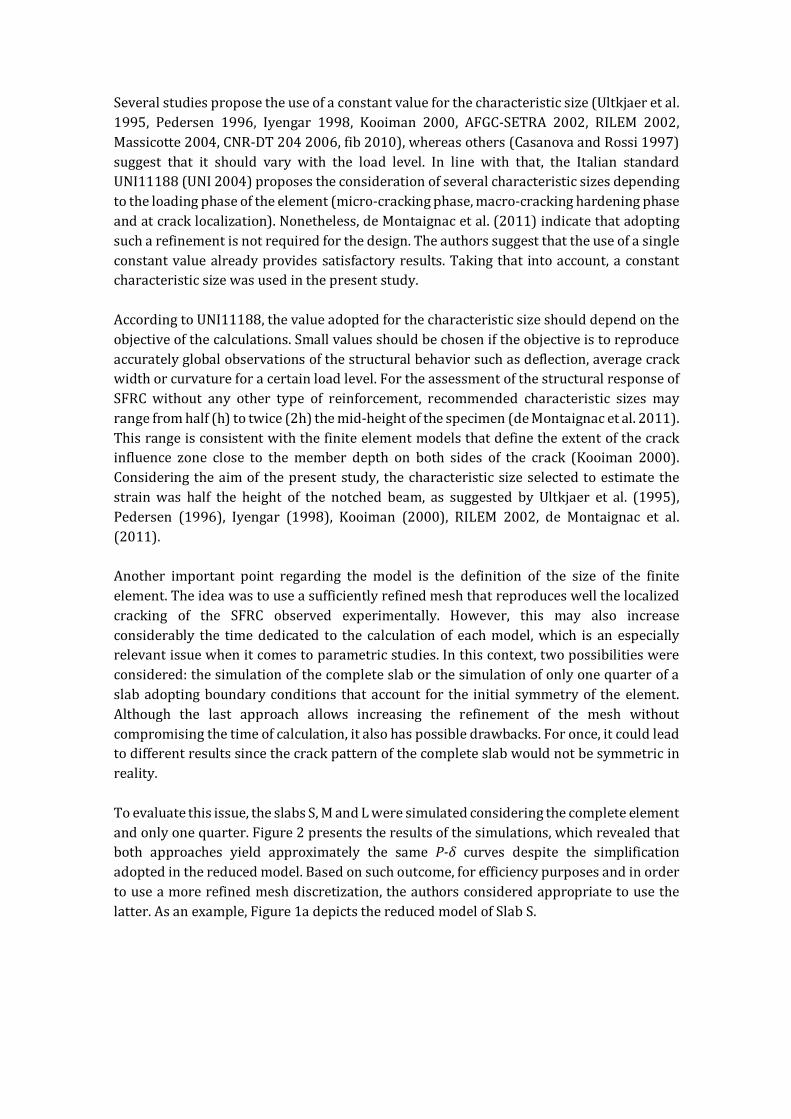
Severalstudiesproposetheuseofaconstantvalueforthecharacteristicsize(Ultkjaeretal.1995, Pedersen 1996, Iyengar 1998, Kooiman 2000, AFGC-SETRA 2002, RILEM 2002,Massicotte2004,CNR-DT2042006,fib2010),whereasothers(CasanovaandRossi1997)suggest that it should vary with the load level. In line with that, the Italian standardUNI11188(UNI2004)proposestheconsiderationofseveralcharacteristicsizesdependingtotheloadingphaseoftheelement(micro-crackingphase,macro-crackinghardeningphaseandatcracklocalization).Nonetheless,deMontaignacetal.(2011)indicatethatadoptingsucharefinementisnotrequiredforthedesign.Theauthorssuggestthattheuseofasingleconstantvaluealreadyprovidessatisfactoryresults.Takingthat intoaccount,aconstantcharacteristicsizewasusedinthepresentstudy.AccordingtoUNI11188,thevalueadoptedforthecharacteristicsizeshoulddependontheobjectiveofthecalculations.Smallvaluesshouldbechoseniftheobjectiveistoreproduceaccuratelyglobalobservationsofthestructuralbehaviorsuchasdeflection,averagecrackwidthorcurvatureforacertainloadlevel.FortheassessmentofthestructuralresponseofSFRCwithout any other type of reinforcement, recommended characteristic sizes mayrangefromhalf(h)totwice(2h)themid-heightofthespecimen(deMontaignacetal.2011).Thisrangeisconsistentwiththefiniteelementmodelsthatdefinetheextentofthecrackinfluence zone close to themember depth on both sides of the crack (Kooiman 2000).Consideringtheaimof thepresentstudy, thecharacteristicsizeselected toestimate thestrainwas half the height of the notched beam, as suggested by Ultkjaer et al. (1995),Pedersen (1996), Iyengar (1998), Kooiman (2000), RILEM 2002, de Montaignac et al.(2011).Another important point regarding the model is the definition of the size of the finiteelement.Theideawastouseasufficientlyrefinedmeshthatreproduceswellthelocalizedcracking of the SFRC observed experimentally. However, this may also increaseconsiderably the timededicated to the calculationof eachmodel,which is an especiallyrelevantissuewhenitcomestoparametricstudies.Inthiscontext,twopossibilitieswereconsidered:thesimulationofthecompleteslaborthesimulationofonlyonequarterofaslabadoptingboundaryconditions thataccount for the initial symmetryof theelement.Although the last approach allows increasing the refinement of the mesh withoutcompromisingthetimeofcalculation,italsohaspossibledrawbacks.Foronce,itcouldleadtodifferentresultssincethecrackpatternofthecompleteslabwouldnotbesymmetricinreality.Toevaluatethisissue,theslabsS,MandLweresimulatedconsideringthecompleteelementandonlyonequarter.Figure2presentstheresultsofthesimulations,whichrevealedthatboth approaches yield approximately the same P-δ curves despite the simplificationadoptedinthereducedmodel.Basedonsuchoutcome,forefficiencypurposesandinordertouseamorerefinedmeshdiscretization,theauthorsconsideredappropriatetousethelatter.Asanexample,Figure1adepictsthereducedmodelofSlabS.
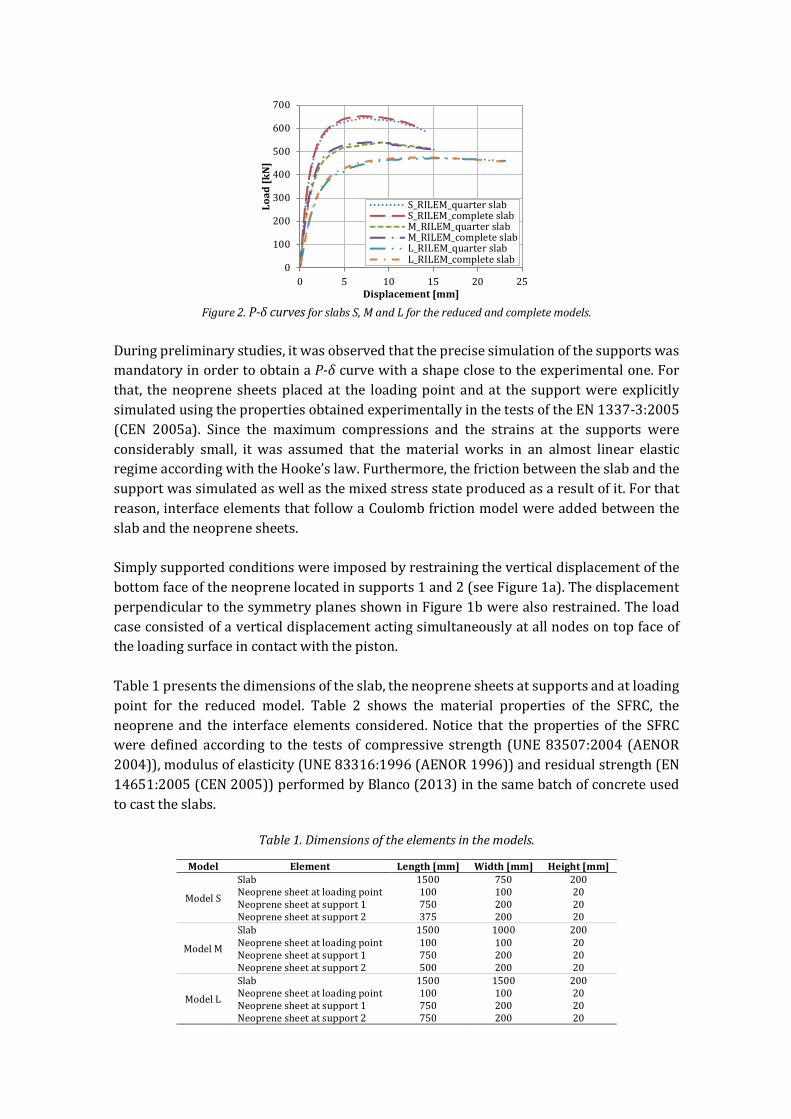
Figure2.P-δcurvesforslabsS,MandLforthereducedandcompletemodels.
Duringpreliminarystudies,itwasobservedthattheprecisesimulationofthesupportswasmandatoryinordertoobtainaP-δcurvewithashapeclosetotheexperimentalone.Forthat, theneoprene sheetsplacedat the loadingpointandat the supportwereexplicitlysimulatedusingthepropertiesobtainedexperimentallyinthetestsoftheEN1337-3:2005(CEN 2005a). Since the maximum compressions and the strains at the supports wereconsiderably small, itwas assumed that thematerialworks in an almost linear elasticregimeaccordingwiththeHooke’slaw.Furthermore,thefrictionbetweentheslabandthesupportwassimulatedaswellasthemixedstressstateproducedasaresultofit.Forthatreason,interfaceelementsthatfollowaCoulombfrictionmodelwereaddedbetweentheslabandtheneoprenesheets.Simplysupportedconditionswereimposedbyrestrainingtheverticaldisplacementofthebottomfaceoftheneoprenelocatedinsupports1and2(seeFigure1a).ThedisplacementperpendiculartothesymmetryplanesshowninFigure1bwerealsorestrained. Theloadcaseconsistedofaverticaldisplacementactingsimultaneouslyatallnodesontopfaceoftheloadingsurfaceincontactwiththepiston.Table1presentsthedimensionsoftheslab,theneoprenesheetsatsupportsandatloadingpoint for the reduced model. Table 2 shows the material properties of the SFRC, theneoprene and the interface elements considered.Notice that thepropertiesof the SFRCweredefinedaccording to the tests of compressive strength (UNE83507:2004(AENOR2004)),modulusofelasticity(UNE83316:1996(AENOR1996))andresidualstrength(EN14651:2005(CEN2005))performedbyBlanco(2013)inthesamebatchofconcreteusedtocasttheslabs.
Table1.Dimensionsoftheelementsinthemodels.
Model Element Length[mm] Width[mm] Height[mm]
ModelS
Slab 1500 750 200Neoprenesheetatloadingpoint 100 100 20Neoprenesheetatsupport1 750 200 20Neoprenesheetatsupport2 375 200 20
ModelM
Slab 1500 1000 200Neoprenesheetatloadingpoint 100 100 20Neoprenesheetatsupport1 750 200 20Neoprenesheetatsupport2 500 200 20
ModelL
Slab 1500 1500 200Neoprenesheetatloadingpoint 100 100 20Neoprenesheetatsupport1 750 200 20Neoprenesheetatsupport2 750 200 20
0
100
200
300
400
500
600
700
0 5 10 15 20 25Load[kN]
Displacement[mm]
S_RILEM_quarterslabS_RILEM_completeslabM_RILEM_quarterslabM_RILEM_completeslabL_RILEM_quarterslabL_RILEM_completeslab
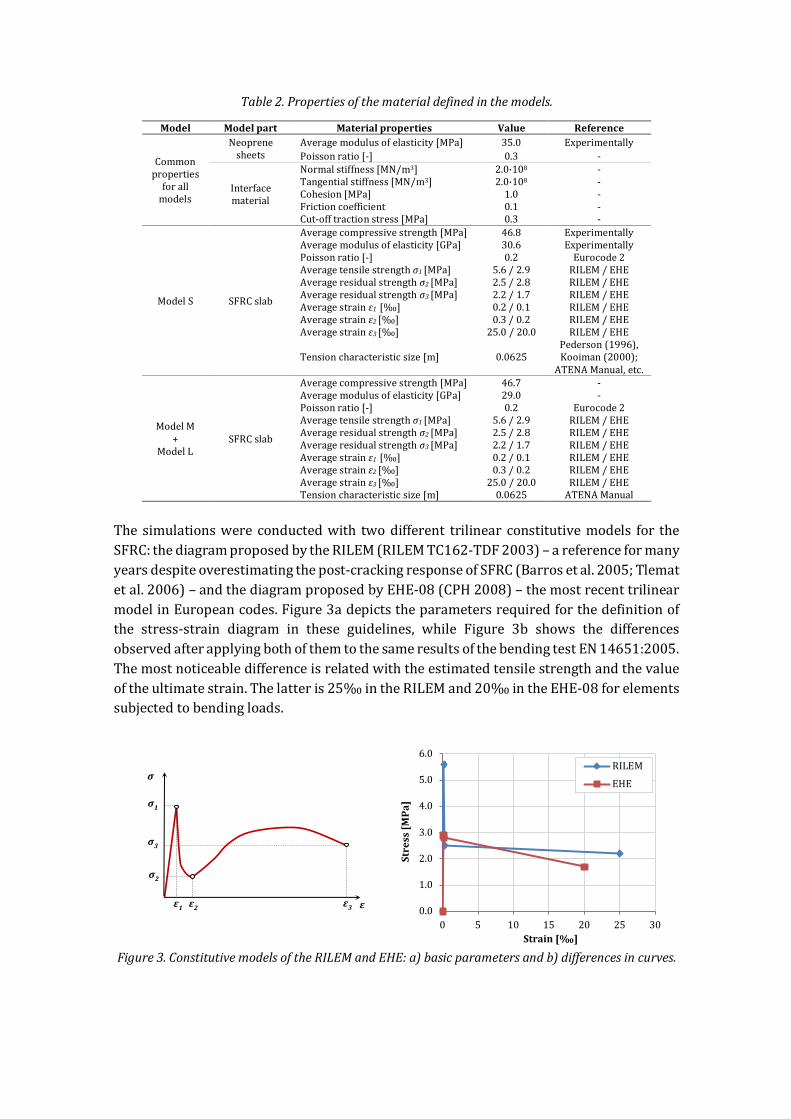
Table2.Propertiesofthematerialdefinedinthemodels.
Model Modelpart Materialproperties Value Reference
Commonpropertiesforallmodels
Neoprenesheets
Averagemodulusofelasticity[MPa] 35.0 ExperimentallyPoissonratio[-] 0.3 -
Interfacematerial
Normalstiffness[MN/m3] 2.0·108 -Tangentialstiffness[MN/m3] 2.0·108 -Cohesion[MPa] 1.0 -Frictioncoefficient 0.1 -Cut-offtractionstress[MPa] 0.3 -
ModelS SFRCslab
Averagecompressivestrength[MPa] 46.8 ExperimentallyAveragemodulusofelasticity[GPa] 30.6 ExperimentallyPoissonratio[-] 0.2 Eurocode2Averagetensilestrengthσ1[MPa] 5.6/2.9 RILEM/EHEAverageresidualstrengthσ2[MPa] 2.5/2.8 RILEM/EHEAverageresidualstrengthσ3[MPa] 2.2/1.7 RILEM/EHEAveragestrainε1[‰] 0.2/0.1 RILEM/EHEAveragestrainε2[‰] 0.3/0.2 RILEM/EHEAveragestrainε3[‰] 25.0/20.0 RILEM/EHE
Tensioncharacteristicsize[m] 0.0625Pederson(1996),Kooiman(2000);ATENAManual,etc.
ModelM+
ModelLSFRCslab
Averagecompressivestrength[MPa] 46.7 -Averagemodulusofelasticity[GPa] 29.0 -Poissonratio[-] 0.2 Eurocode2Averagetensilestrengthσ1[MPa] 5.6/2.9 RILEM/EHEAverageresidualstrengthσ2[MPa] 2.5/2.8 RILEM/EHEAverageresidualstrengthσ3[MPa] 2.2/1.7 RILEM/EHEAveragestrainε1[‰] 0.2/0.1 RILEM/EHEAveragestrainε2[‰] 0.3/0.2 RILEM/EHEAveragestrainε3[‰] 25.0/20.0 RILEM/EHETensioncharacteristicsize[m] 0.0625 ATENAManual
The simulationswere conductedwith twodifferent trilinear constitutivemodels for theSFRC:thediagramproposedbytheRILEM(RILEMTC162-TDF2003)–areferenceformanyyearsdespiteoverestimatingthepost-crackingresponseofSFRC(Barrosetal.2005;Tlematetal.2006)–andthediagramproposedbyEHE-08(CPH2008)–themostrecenttrilinearmodelinEuropeancodes.Figure3adepictstheparametersrequiredforthedefinitionofthe stress-strain diagram in these guidelines, while Figure 3b shows the differencesobservedafterapplyingbothofthemtothesameresultsofthebendingtestEN14651:2005.Themostnoticeabledifferenceisrelatedwiththeestimatedtensilestrengthandthevalueoftheultimatestrain.Thelatteris25‰intheRILEMand20‰intheEHE-08forelementssubjectedtobendingloads.
Figure3.ConstitutivemodelsoftheRILEMandEHE:a)basicparametersandb)differencesincurves.
0.0
1.0
2.0
3.0
4.0
5.0
6.0
0 5 10 15 20 25 30
Stress[M
Pa]
Strain[‰]
RILEM
EHE
σ
ε
σ1
σ2
σ3
ε1ε2 ε3
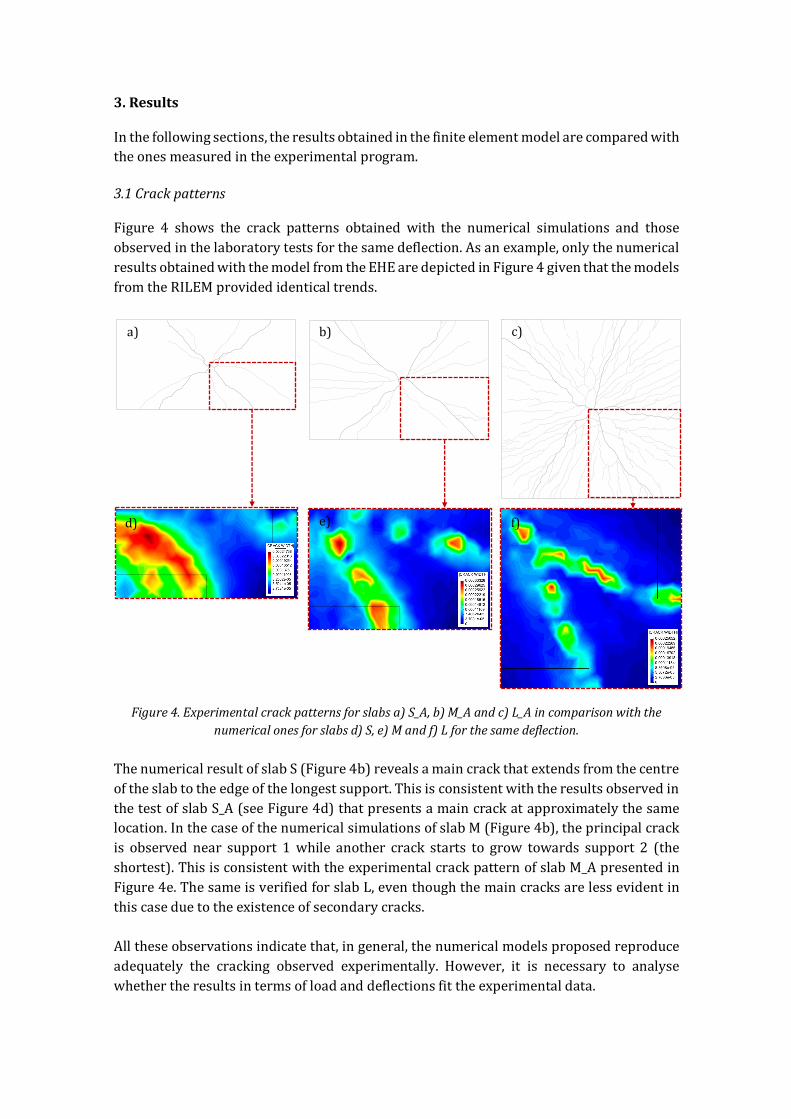
3.ResultsInthefollowingsections,theresultsobtainedinthefiniteelementmodelarecomparedwiththeonesmeasuredintheexperimentalprogram.3.1CrackpatternsFigure 4 shows the crack patterns obtained with the numerical simulations and thoseobservedinthelaboratorytestsforthesamedeflection.Asanexample,onlythenumericalresultsobtainedwiththemodelfromtheEHEaredepictedinFigure4giventhatthemodelsfromtheRILEMprovidedidenticaltrends.
Figure4.Experimentalcrackpatternsforslabsa)S_A,b)M_Aandc)L_Aincomparisonwiththenumericalonesforslabsd)S,e)Mandf)Lforthesamedeflection.
ThenumericalresultofslabS(Figure4b)revealsamaincrackthatextendsfromthecentreoftheslabtotheedgeofthelongestsupport.ThisisconsistentwiththeresultsobservedinthetestofslabS_A(seeFigure4d)thatpresentsamaincrackatapproximatelythesamelocation.InthecaseofthenumericalsimulationsofslabM(Figure4b),theprincipalcrackis observed near support 1while another crack starts to grow towards support2 (theshortest).ThisisconsistentwiththeexperimentalcrackpatternofslabM_ApresentedinFigure4e.ThesameisverifiedforslabL,eventhoughthemaincracksarelessevidentinthiscaseduetotheexistenceofsecondarycracks.Alltheseobservationsindicatethat,ingeneral,thenumericalmodelsproposedreproduceadequately the cracking observed experimentally. However, it is necessary to analysewhethertheresultsintermsofloadanddeflectionsfittheexperimentaldata.
b)a)
d) e) f)
c)
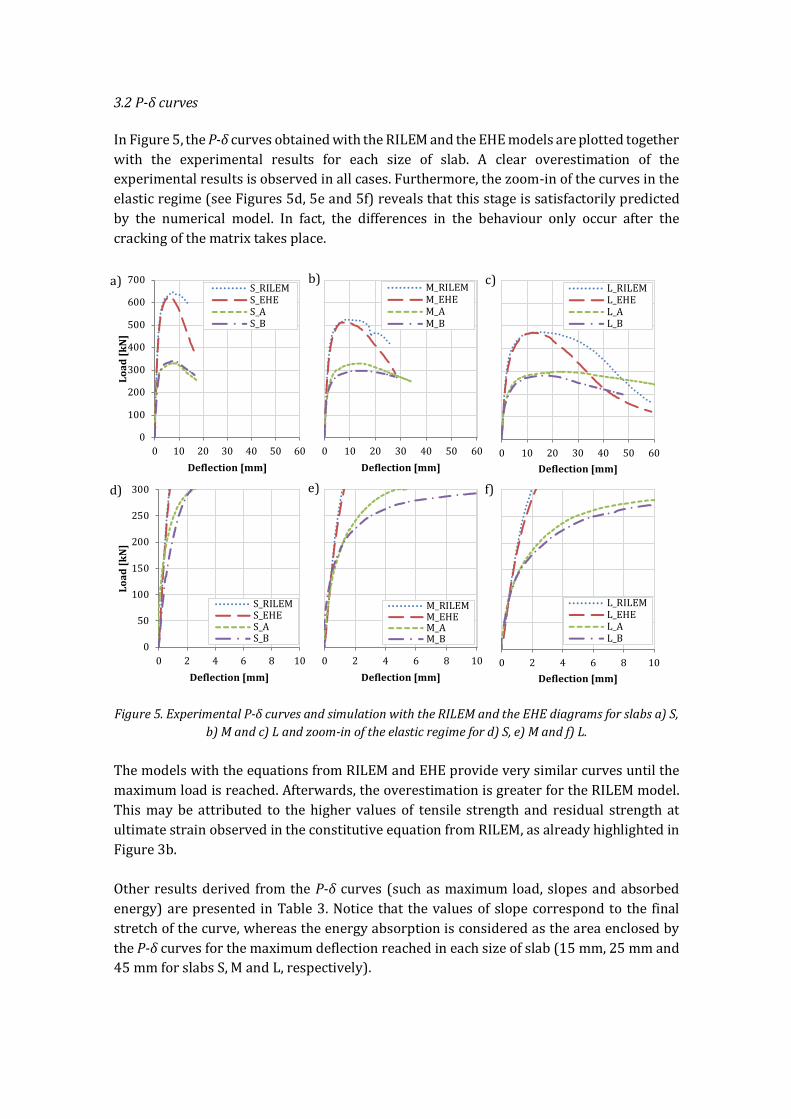
3.2P-δcurvesInFigure5,theP-δcurvesobtainedwiththeRILEMandtheEHEmodelsareplottedtogetherwith the experimental results for each size of slab. A clear overestimation of theexperimentalresultsisobservedinallcases.Furthermore,thezoom-inofthecurvesintheelasticregime(seeFigures5d,5eand5f)revealsthatthisstageissatisfactorilypredictedby the numerical model. In fact, the differences in the behaviour only occur after thecrackingofthematrixtakesplace.
Figure5.ExperimentalP-δcurvesandsimulationwiththeRILEMandtheEHEdiagramsforslabsa)S,
b)Mandc)Landzoom-inoftheelasticregimeford)S,e)Mandf)L.ThemodelswiththeequationsfromRILEMandEHEprovideverysimilarcurvesuntilthemaximumloadisreached.Afterwards,theoverestimationisgreaterfortheRILEMmodel.Thismaybe attributed to thehigher valuesof tensile strength and residual strength atultimatestrainobservedintheconstitutiveequationfromRILEM,asalreadyhighlightedinFigure3b.Otherresultsderived fromtheP-δcurves(suchasmaximumload,slopesandabsorbedenergy)arepresentedinTable3.Notice thatthevaluesofslopecorrespondto the finalstretchofthecurve,whereastheenergyabsorptionisconsideredastheareaenclosedbytheP-δcurvesforthemaximumdeflectionreachedineachsizeofslab(15mm,25mmand45mmforslabsS,MandL,respectively).
0
100
200
300
400
500
600
700
0 10 20 30 40 50 60
Load[kN]
Deflection[mm]
S_RILEMS_EHES_AS_B
0 10 20 30 40 50 60Deflection[mm]
M_RILEMM_EHEM_AM_B
0 10 20 30 40 50 60Deflection[mm]
L_RILEML_EHEL_AL_B
0
50
100
150
200
250
300
0 2 4 6 8 10
Load[kN]
Deflection[mm]
S_RILEMS_EHES_AS_B
0 2 4 6 8 10Deflection[mm]
M_RILEMM_EHEM_AM_B
0 2 4 6 8 10Deflection[mm]
L_RILEML_EHEL_AL_B
a) b) c)
d) e) f)
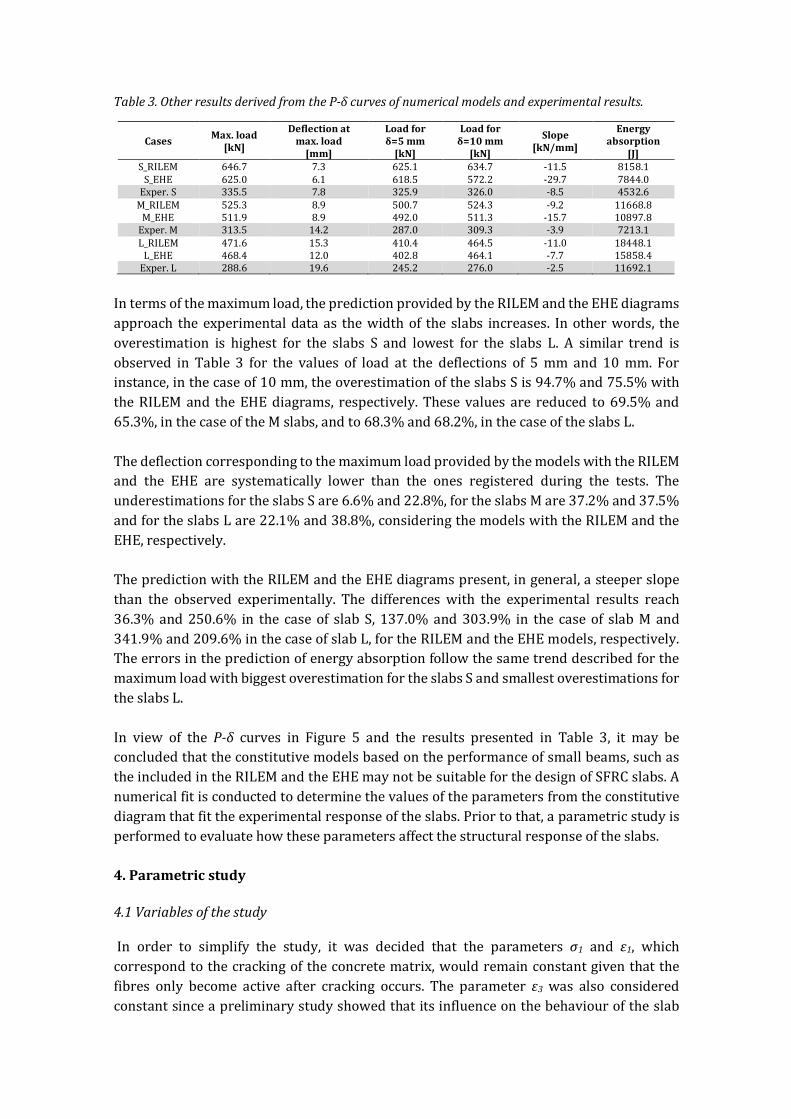
Table3.OtherresultsderivedfromtheP-δcurvesofnumericalmodelsandexperimentalresults.
Intermsofthemaximumload,thepredictionprovidedbytheRILEMandtheEHEdiagramsapproach the experimental dataas thewidthof the slabs increases. Inotherwords, theoverestimation is highest for the slabs S and lowest for the slabs L. A similar trend isobserved in Table 3 for the values of load at the deflections of 5mm and 10mm. Forinstance,inthecaseof10mm,theoverestimationoftheslabsSis94.7%and75.5%withtheRILEMandtheEHEdiagrams, respectively.These values are reduced to69.5%and65.3%,inthecaseoftheMslabs,andto68.3%and68.2%,inthecaseoftheslabsL.
ThedeflectioncorrespondingtothemaximumloadprovidedbythemodelswiththeRILEMand the EHE are systematically lower than the ones registered during the tests. TheunderestimationsfortheslabsSare6.6%and22.8%,fortheslabsMare37.2%and37.5%andfortheslabsLare22.1%and38.8%,consideringthemodelswiththeRILEMandtheEHE,respectively.ThepredictionwiththeRILEMandtheEHEdiagramspresent,ingeneral,asteeperslopethan the observed experimentally. The differences with the experimental results reach36.3%and250.6% in the caseof slab S, 137.0%and303.9% in the caseof slabMand341.9%and209.6%inthecaseofslabL,fortheRILEMandtheEHEmodels,respectively.TheerrorsinthepredictionofenergyabsorptionfollowthesametrenddescribedforthemaximumloadwithbiggestoverestimationfortheslabsSandsmallestoverestimationsfortheslabsL.
In view of the P-δ curves in Figure 5 and the results presented in Table 3, it may beconcludedthattheconstitutivemodelsbasedontheperformanceofsmallbeams,suchastheincludedintheRILEMandtheEHEmaynotbesuitableforthedesignofSFRCslabs.Anumericalfitisconductedtodeterminethevaluesoftheparametersfromtheconstitutivediagramthatfittheexperimentalresponseoftheslabs.Priortothat,aparametricstudyisperformedtoevaluatehowtheseparametersaffectthestructuralresponseoftheslabs.4.Parametricstudy4.1VariablesofthestudyIn order to simplify the study, it was decided that the parameters σ1 and ε1, whichcorrespondtothecrackingoftheconcretematrix,wouldremainconstantgiventhatthefibres only become active after cracking occurs. The parameter ε3 was also consideredconstantsinceapreliminarystudyshowedthatitsinfluenceonthebehaviouroftheslab
Cases Max.load[kN]
Deflectionatmax.load[mm]
Loadforδ=5mm[kN]
Loadforδ=10mm[kN]
Slope[kN/mm]
Energyabsorption
[J]S_RILEM 646.7 7.3 625.1 634.7 -11.5 8158.1S_EHE 625.0 6.1 618.5 572.2 -29.7 7844.0Exper.S 335.5 7.8 325.9 326.0 -8.5 4532.6M_RILEM 525.3 8.9 500.7 524.3 -9.2 11668.8M_EHE 511.9 8.9 492.0 511.3 -15.7 10897.8Exper.M 313.5 14.2 287.0 309.3 -3.9 7213.1L_RILEM 471.6 15.3 410.4 464.5 -11.0 18448.1L_EHE 468.4 12.0 402.8 464.1 -7.7 15858.4Exper.L 288.6 19.6 245.2 276.0 -2.5 11692.1
wasminimal.BasedontheresultspresentedbyBlanco(2013)andthephilosophyofthedesignfromtheEHE,theparametersσ1,ε1andε3weresetto2.879MPa,0.099‰and20.0‰,respectively.Thesevaluesdonotdiffersignificantlyfromtheobtainedwithotherrecentconstitutivemodels,suchastheItalianguidelines(CNR-DT2042006)ortheModelCode2010orMC2010(fib2010),asreportedinpreviousstudies(Blancoetal.2013).Table4showsthevariablesanalysed in theparametricstudy(σ2,σ3andε2). Inorder toobtain comparable results, the same values were considered for the three slabs. Thecombinationofthemledto150casesforeachtypeofslab(450intotal).Noticethatoneofthe values selected for ε2 is 0.099‰, which corresponds to ε1. However, for notationpurposesitispresentedas0.1‰.
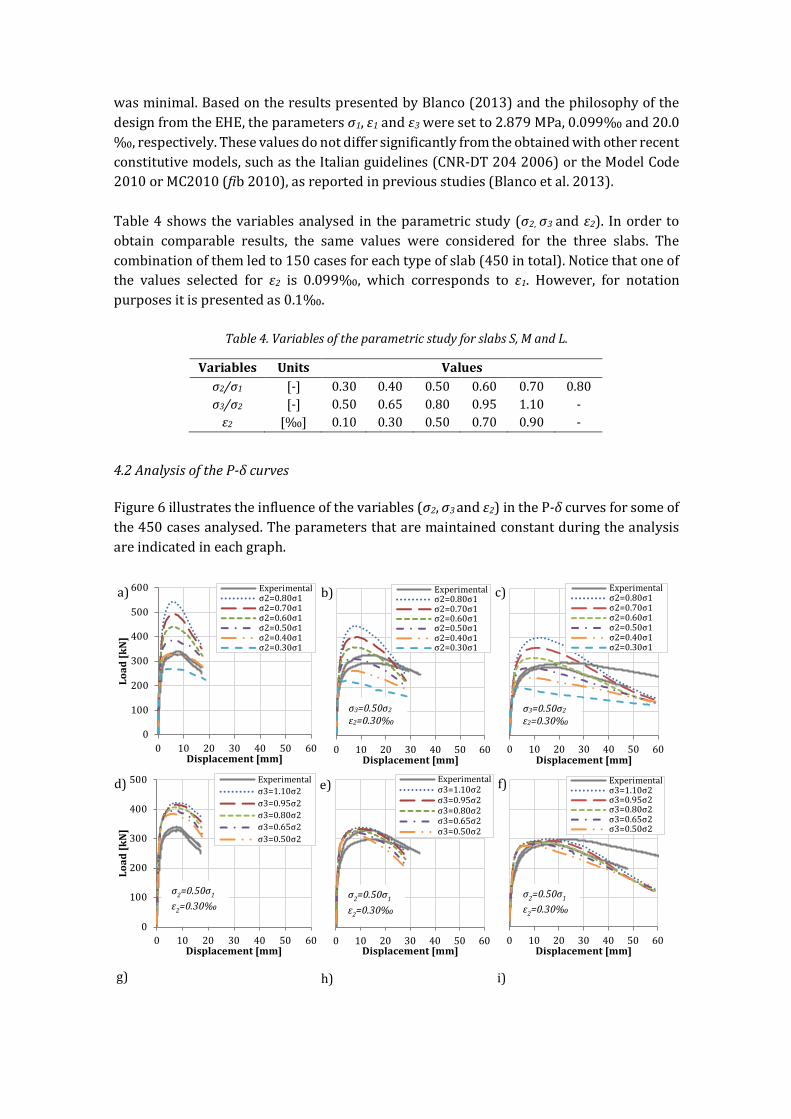
Table4.VariablesoftheparametricstudyforslabsS,MandL.4.2AnalysisoftheP-δcurvesFigure6illustratestheinfluenceofthevariables(σ2,σ3andε2)intheP-δcurvesforsomeofthe450casesanalysed.Theparametersthataremaintainedconstantduringtheanalysisareindicatedineachgraph.
0
100
200
300
400
500
600
0 10 20 30 40 50 60
Load[kN]
Displacement[mm]
Experimentalσ2=0.80σ1σ2=0.70σ1σ2=0.60σ1σ2=0.50σ1σ2=0.40σ1σ2=0.30σ1
0 10 20 30 40 50 60Displacement[mm]
Experimentalσ2=0.80σ1σ2=0.70σ1σ2=0.60σ1σ2=0.50σ1σ2=0.40σ1σ2=0.30σ1
0 10 20 30 40 50 60Displacement[mm]
Experimentalσ2=0.80σ1σ2=0.70σ1σ2=0.60σ1σ2=0.50σ1σ2=0.40σ1σ2=0.30σ1
0
100
200
300
400
500
0 10 20 30 40 50 60
Load[kN]
Displacement[mm]
Experimentalσ3=1.10σ2σ3=0.95σ2σ3=0.80σ2σ3=0.65σ2σ3=0.50σ2
0 10 20 30 40 50 60Displacement[mm]
Experimentalσ3=1.10σ2σ3=0.95σ2σ3=0.80σ2σ3=0.65σ2σ3=0.50σ2
0 10 20 30 40 50 60Displacement[mm]
Experimentalσ3=1.10σ2σ3=0.95σ2σ3=0.80σ2σ3=0.65σ2σ3=0.50σ2
Variables Units Valuesσ2/σ1 [-] 0.30 0.40 0.50 0.60 0.70 0.80σ3/σ2 [-] 0.50 0.65 0.80 0.95 1.10 -ε2 [‰] 0.10 0.30 0.50 0.70 0.90 -
a) b) c)
g) h) i)
d) e) f)
σ2=0.50σ1ε2=0.30‰
σ2=0.50σ1ε2=0.30‰
σ2=0.50σ1ε2=0.30‰
σ3=0.50σ2ε2=0.30‰
σ3=0.50σ2ε2=0.30‰
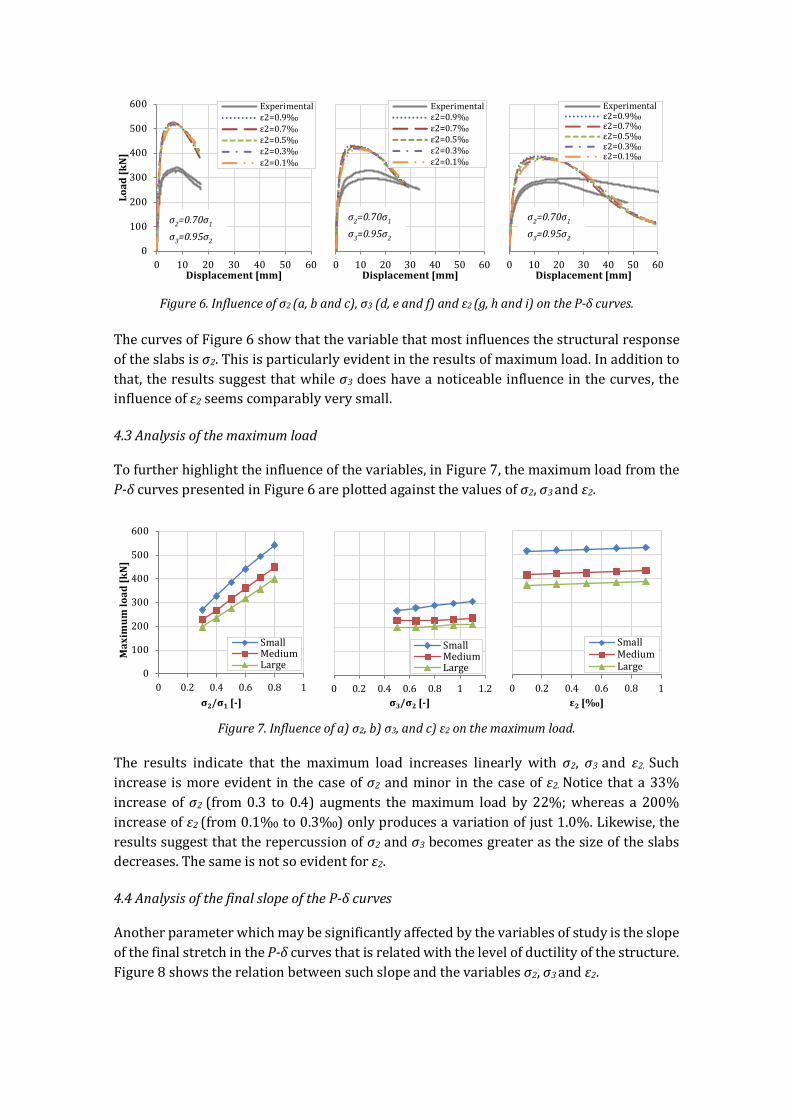
Figure6.Influenceofσ2(a,bandc),σ3(d,eandf)andε2(g,handi)ontheP-δcurves.ThecurvesofFigure6showthatthevariablethatmostinfluencesthestructuralresponseoftheslabsisσ2.Thisisparticularlyevidentintheresultsofmaximumload.Inadditiontothat,theresultssuggestthatwhileσ3doeshaveanoticeableinfluenceinthecurves,theinfluenceofε2seemscomparablyverysmall.4.3AnalysisofthemaximumloadTofurtherhighlighttheinfluenceofthevariables,inFigure7,themaximumloadfromtheP-δcurvespresentedinFigure6areplottedagainstthevaluesofσ2,σ3andε2.
Figure7.Influenceofa)σ2,b)σ3,andc)ε2onthemaximumload.The results indicate that the maximum load increases linearly with σ2, σ3and ε2.Suchincrease ismoreevident in thecaseofσ2andminor in thecaseofε2.Notice thata33%increase ofσ2 (from0.3 to 0.4) augments themaximum load by22%;whereas a 200%increaseofε2(from0.1‰to0.3‰)onlyproducesavariationofjust1.0%.Likewise,theresultssuggestthattherepercussionofσ2andσ3becomesgreaterasthesizeoftheslabsdecreases.Thesameisnotsoevidentforε2.4.4AnalysisofthefinalslopeoftheP-δcurvesAnotherparameterwhichmaybesignificantlyaffectedbythevariablesofstudyistheslopeofthefinalstretchintheP-δcurvesthatisrelatedwiththelevelofductilityofthestructure.Figure8showstherelationbetweensuchslopeandthevariablesσ2,σ3andε2.
0
100
200
300
400
500
600
0 10 20 30 40 50 60
Load[kN]
Displacement[mm]
Experimentalε2=0.9‰ε2=0.7‰ε2=0.5‰ε2=0.3‰ε2=0.1‰
0 10 20 30 40 50 60Displacement[mm]
Experimentalε2=0.9‰ε2=0.7‰ε2=0.5‰ε2=0.3‰ε2=0.1‰
0 10 20 30 40 50 60Displacement[mm]
Experimentalε2=0.9‰ε2=0.7‰ε2=0.5‰ε2=0.3‰ε2=0.1‰
0
100
200
300
400
500
600
0 0.2 0.4 0.6 0.8 1
Maximum
load[kN]
σ2/σ1 [-]
SmallMediumLarge
0 0.2 0.4 0.6 0.8 1 1.2σ3/σ2 [-]
SmallMediumLarge
0 0.2 0.4 0.6 0.8 1ε2 [‰]
SmallMediumLarge
σ2=0.70σ1σ3=0.95σ2
σ2=0.70σ1σ3=0.95σ2
σ2=0.70σ1σ3=0.95σ2
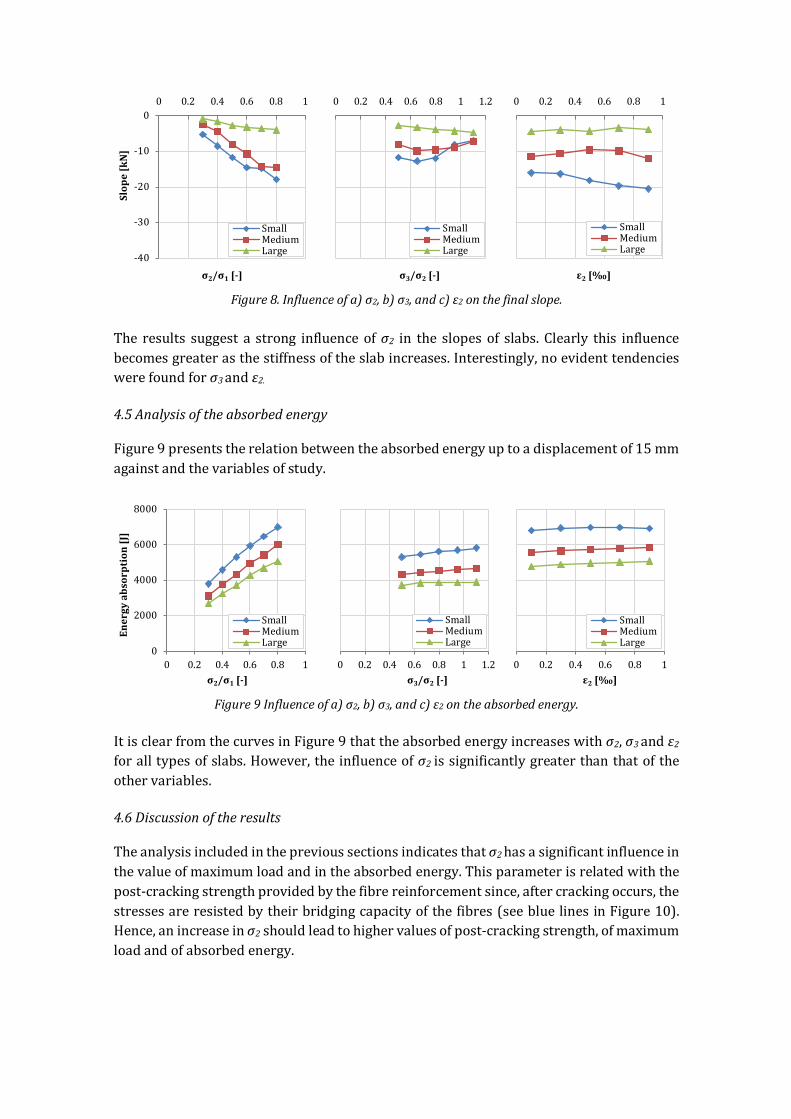
Figure8.Influenceofa)σ2,b)σ3,andc)ε2onthefinalslope.The results suggest astrong influenceofσ2 in the slopesof slabs. Clearly this influencebecomesgreaterasthestiffnessoftheslabincreases.Interestingly,noevidenttendencieswerefoundforσ3andε2.4.5AnalysisoftheabsorbedenergyFigure9presentstherelationbetweentheabsorbedenergyuptoadisplacementof15mmagainstandthevariablesofstudy.
Figure9Influenceofa)σ2,b)σ3,andc)ε2ontheabsorbedenergy.
ItisclearfromthecurvesinFigure9thattheabsorbedenergyincreaseswithσ2,σ3andε2foralltypesofslabs.However,theinfluenceofσ2issignificantlygreaterthanthatoftheothervariables.4.6DiscussionoftheresultsTheanalysisincludedintheprevioussectionsindicatesthatσ2hasasignificantinfluenceinthevalueofmaximumloadandintheabsorbedenergy.Thisparameterisrelatedwiththepost-crackingstrengthprovidedbythefibrereinforcementsince,aftercrackingoccurs,thestressesareresistedbytheirbridgingcapacityofthefibres(seebluelinesinFigure10).Hence,anincreaseinσ2shouldleadtohighervaluesofpost-crackingstrength,ofmaximumloadandofabsorbedenergy.
-40
-30
-20
-10
00 0.2 0.4 0.6 0.8 1
Slope[kN]
σ2/σ1 [-]
SmallMediumLarge
0 0.2 0.4 0.6 0.8 1 1.2
σ3/σ2 [-]
SmallMediumLarge
0 0.2 0.4 0.6 0.8 1
ε2 [‰]
SmallMediumLarge
0
2000
4000
6000
8000
0 0.2 0.4 0.6 0.8 1
Energyabsorption[J]
σ2/σ1 [-]
SmallMediumLarge
0 0.2 0.4 0.6 0.8 1 1.2σ3/σ2 [-]
SmallMediumLarge
0 0.2 0.4 0.6 0.8 1ε2 [‰]
SmallMediumLarge
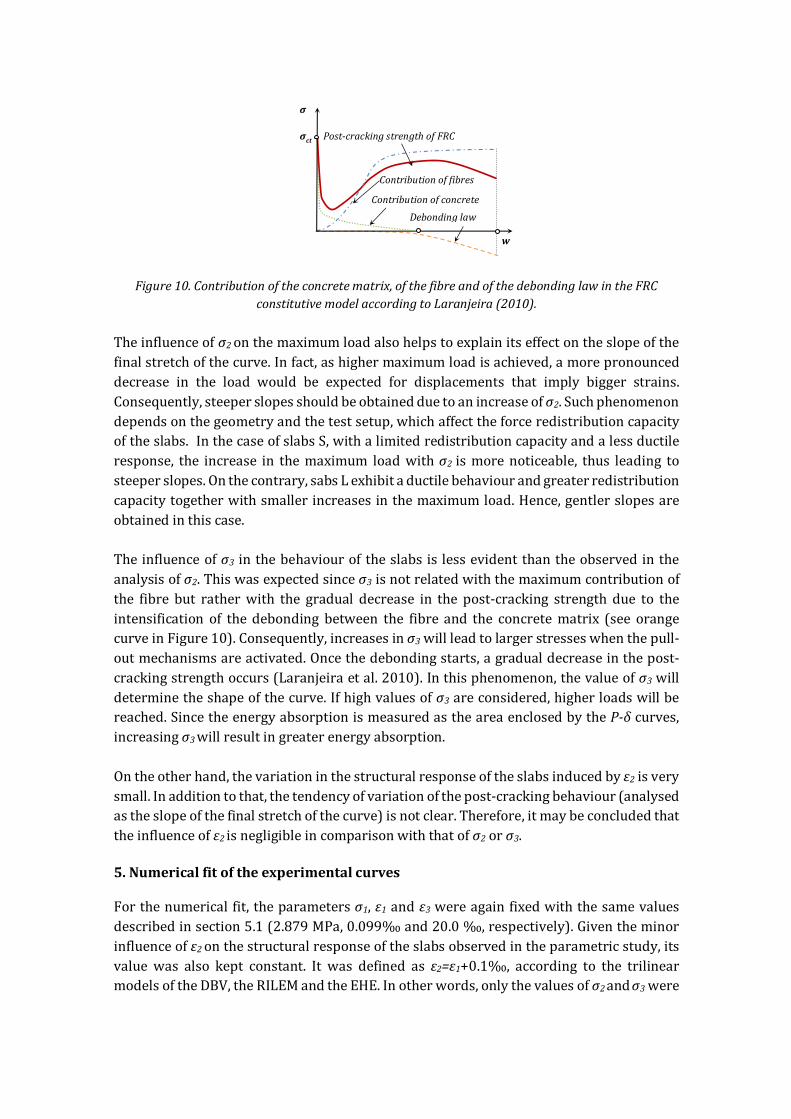
Figure10.Contributionoftheconcretematrix,ofthefibreandofthedebondinglawintheFRCconstitutivemodelaccordingtoLaranjeira(2010).
Theinfluenceofσ2onthemaximumloadalsohelpstoexplainitseffectontheslopeofthefinalstretchofthecurve.Infact,ashighermaximumloadisachieved,amorepronounceddecrease in the load would be expected for displacements that imply bigger strains.Consequently,steeperslopesshouldbeobtainedduetoanincreaseofσ2.Suchphenomenondependsonthegeometryandthetestsetup,whichaffecttheforceredistributioncapacityoftheslabs.InthecaseofslabsS,withalimitedredistributioncapacityandalessductileresponse, the increase in themaximum loadwithσ2 ismorenoticeable, thus leading tosteeperslopes.Onthecontrary,sabsLexhibitaductilebehaviourandgreaterredistributioncapacitytogetherwithsmallerincreasesinthemaximumload.Hence,gentlerslopesareobtainedinthiscase.Theinfluenceofσ3 inthebehaviouroftheslabsislessevidentthantheobservedintheanalysisofσ2.Thiswasexpectedsinceσ3isnotrelatedwiththemaximumcontributionofthe fibre but ratherwith the gradual decrease in the post-cracking strength due to theintensification of thedebonding between the fibre and the concretematrix (see orangecurveinFigure10).Consequently,increasesinσ3willleadtolargerstresseswhenthepull-outmechanismsareactivated.Oncethedebondingstarts,agradualdecreaseinthepost-crackingstrengthoccurs(Laranjeiraetal.2010).Inthisphenomenon,thevalueofσ3willdeterminetheshapeofthecurve.Ifhighvaluesofσ3areconsidered,higherloadswillbereached.SincetheenergyabsorptionismeasuredastheareaenclosedbytheP-δcurves,increasingσ3willresultingreaterenergyabsorption.Ontheotherhand,thevariationinthestructuralresponseoftheslabsinducedbyε2isverysmall.Inadditiontothat,thetendencyofvariationofthepost-crackingbehaviour(analysedastheslopeofthefinalstretchofthecurve)isnotclear.Therefore,itmaybeconcludedthattheinfluenceofε2isnegligibleincomparisonwiththatofσ2orσ3.5.NumericalfitoftheexperimentalcurvesForthenumericalfit,theparametersσ1,ε1andε3wereagainfixedwiththesamevaluesdescribedinsection5.1(2.879MPa,0.099‰and20.0‰,respectively).Giventheminorinfluenceofε2onthestructuralresponseoftheslabsobservedintheparametricstudy,itsvalue was also kept constant. It was defined as ε2=ε1+0.1‰, according to the trilinearmodelsoftheDBV,theRILEMandtheEHE.Inotherwords,onlythevaluesofσ2andσ3were
σ
w
σct
Debondinglaw
ContributionoffibresContributionofconcrete
Post-crackingstrengthofFRC
variedinaninteractiveproceduretoadjusttheresultsfromthemodeltotheobtainedintheexperimentalprogram.ThevaluesfinallyobtainedarepresentedinTable6.
Table6.Valuesoftheparametersσ2,σ3andε2forslabsS,MandL.
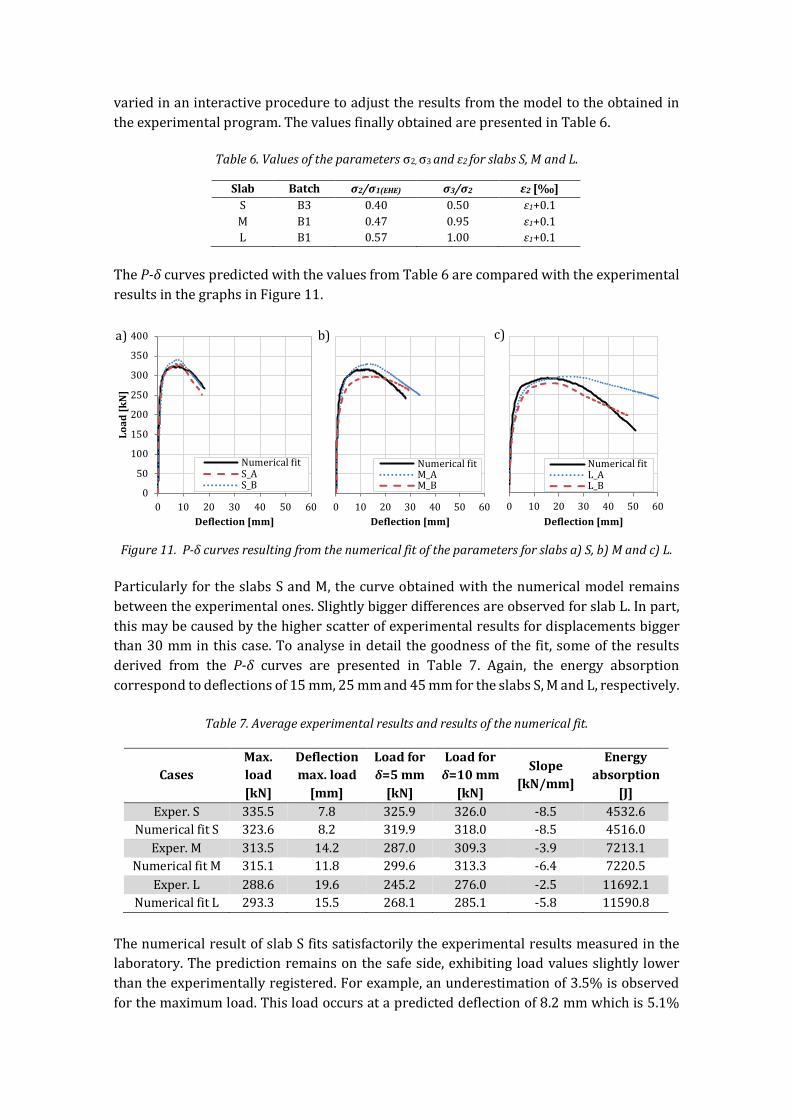
TheP-δcurvespredictedwiththevaluesfromTable6arecomparedwiththeexperimentalresultsinthegraphsinFigure11.
Figure11.P-δcurvesresultingfromthenumericalfitoftheparametersforslabsa)S,b)Mandc)L.
ParticularlyfortheslabsSandM,thecurveobtainedwiththenumericalmodelremainsbetweentheexperimentalones.SlightlybiggerdifferencesareobservedforslabL.Inpart,thismaybecausedbythehigherscatterofexperimentalresultsfordisplacementsbiggerthan30mminthiscase.Toanalyseindetailthegoodnessofthefit,someoftheresultsderived from the P-δ curves are presented in Table 7. Again, the energy absorptioncorrespondtodeflectionsof15mm,25mmand45mmfortheslabsS,MandL,respectively.
Table7.Averageexperimentalresultsandresultsofthenumericalfit.
ThenumericalresultofslabSfitssatisfactorilytheexperimentalresultsmeasuredinthelaboratory.Thepredictionremainsonthesafeside,exhibitingloadvaluesslightlylowerthantheexperimentallyregistered.Forexample,anunderestimationof3.5%isobservedforthemaximumload.Thisloadoccursatapredicteddeflectionof8.2mmwhichis5.1%
0
50
100
150
200
250
300
350
400
0 10 20 30 40 50 60
Load[kN]
Deflection[mm]
NumericalfitS_AS_B
0 10 20 30 40 50 60Deflection[mm]
NumericalfitM_AM_B
0 10 20 30 40 50 60Deflection[mm]
NumericalfitL_AL_B
Slab Batch σ2/σ1(EHE) σ3/σ2 ε2[‰]S B3 0.40 0.50 ε1+0.1M B1 0.47 0.95 ε1+0.1L B1 0.57 1.00 ε1+0.1
CasesMax.load[kN]
Deflectionmax.load[mm]
Loadforδ=5mm[kN]
Loadforδ=10mm[kN]
Slope[kN/mm]
Energyabsorption
[J]Exper.S 335.5 7.8 325.9 326.0 -8.5 4532.6
NumericalfitS 323.6 8.2 319.9 318.0 -8.5 4516.0Exper.M 313.5 14.2 287.0 309.3 -3.9 7213.1
NumericalfitM 315.1 11.8 299.6 313.3 -6.4 7220.5Exper.L 288.6 19.6 245.2 276.0 -2.5 11692.1
NumericalfitL 293.3 15.5 268.1 285.1 -5.8 11590.8
a) b) c)
higherthantheaveragemeasuredfortheslabsS.Thenumericalfitwiththeexperimentalresultsisalsosatisfactoryfortheslopeandtheenergyabsorption.Infact,thesamevalueofslopeandanunderestimationofonly1.3%oftheabsorbedenergyareobserved.InthecaseoftheslabM,thenumericalcurveobtainedwiththeparametersproposedinTable6fitthecurvesofslabM_AandM_Bremarkablywell,asobservedinFigure11.Themaximumloadpredictedisalmostidenticaltotheaverageexperimentalresult,whichisoverestimatedby0.5%.Theoverestimationsoftheloadsfordeflectionsof5mmand10mmare4.4%and1.3%,respectively.Biggerdifferencesofthevaluesofthedeflectionareobservedforthemaximumloadandtheslope.Theformerisunderestimatedby16.9%andthelatterisoverestimatedby64.1%.Despitethat,theenergyabsorptionisunderestimatedonlyby0.6%,thusindicatingasatisfactoryfitbetweenexperimentalandnumericalresults.Regarding the numerical fit of slabs L, it must be pointed out that slabs L_A and L_BpresentedthegreatestdifferencesintheexperimentalP-δcurves.Hence,thedeterminationof the parameters of the constitutive diagrams that fit well both slabs is not asstraightforwardasinslabsS_AandS_B,whichareverysimilar.Despitethat,itisconsideredthattheP-δcurveobtainedwiththenumericalfitapproacheswelltheexperimentalcurvessince the maximum load is overestimated by only 1.6%. The overestimation of loadsincreasesslightlyfordeflectionsof5mmand10mm,reaching9.3%and3.3%,respectively.NoticethatoneoftheresultsoftheP-δcurvesmostdifficulttoreproducewasthevalueofslopeofthefinalstretchduetothesignificantscatterobservedinthispartofthecurve(asshown in Figure 5). This was particularly problematic as the dimensions of the slabincreased.
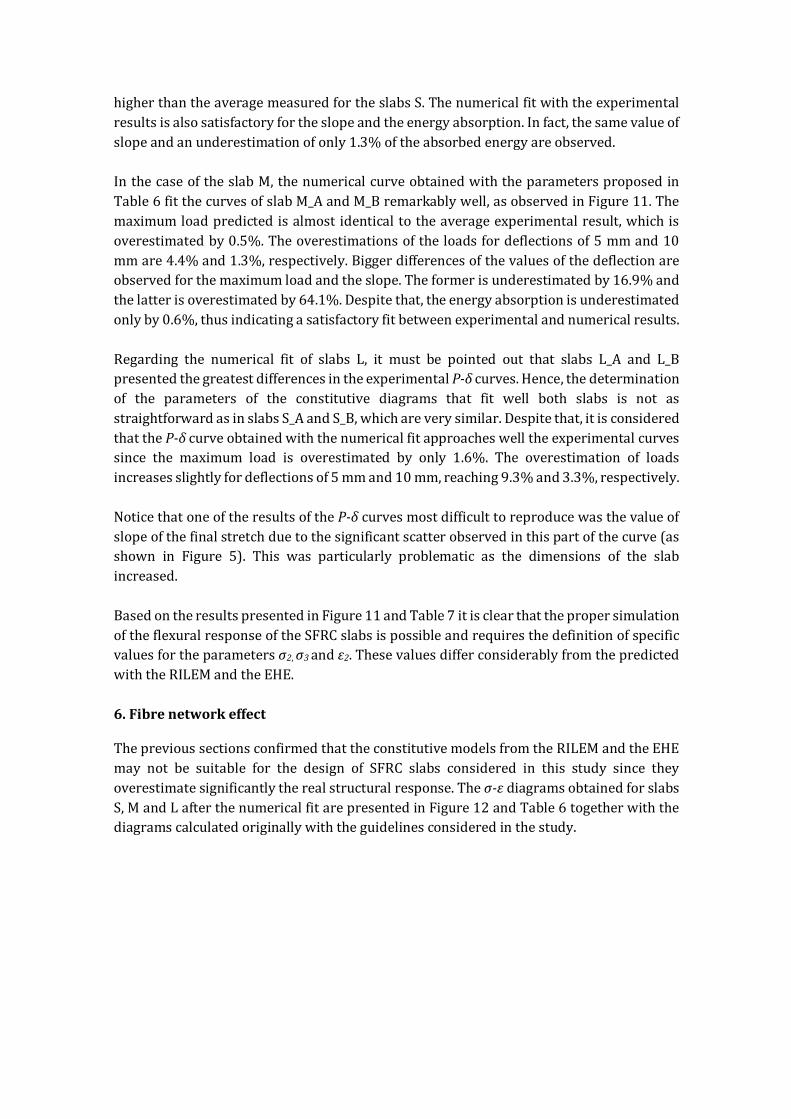
BasedontheresultspresentedinFigure11andTable7itisclearthatthepropersimulationoftheflexuralresponseoftheSFRCslabsispossibleandrequiresthedefinitionofspecificvaluesfortheparametersσ2,σ3andε2.ThesevaluesdifferconsiderablyfromthepredictedwiththeRILEMandtheEHE.6.FibrenetworkeffectTheprevioussectionsconfirmedthattheconstitutivemodelsfromtheRILEMandtheEHEmay not be suitable for the design of SFRC slabs considered in this study since theyoverestimatesignificantlytherealstructuralresponse.Theσ-εdiagramsobtainedforslabsS,MandLafterthenumericalfitarepresentedinFigure12andTable6togetherwiththediagramscalculatedoriginallywiththeguidelinesconsideredinthestudy.
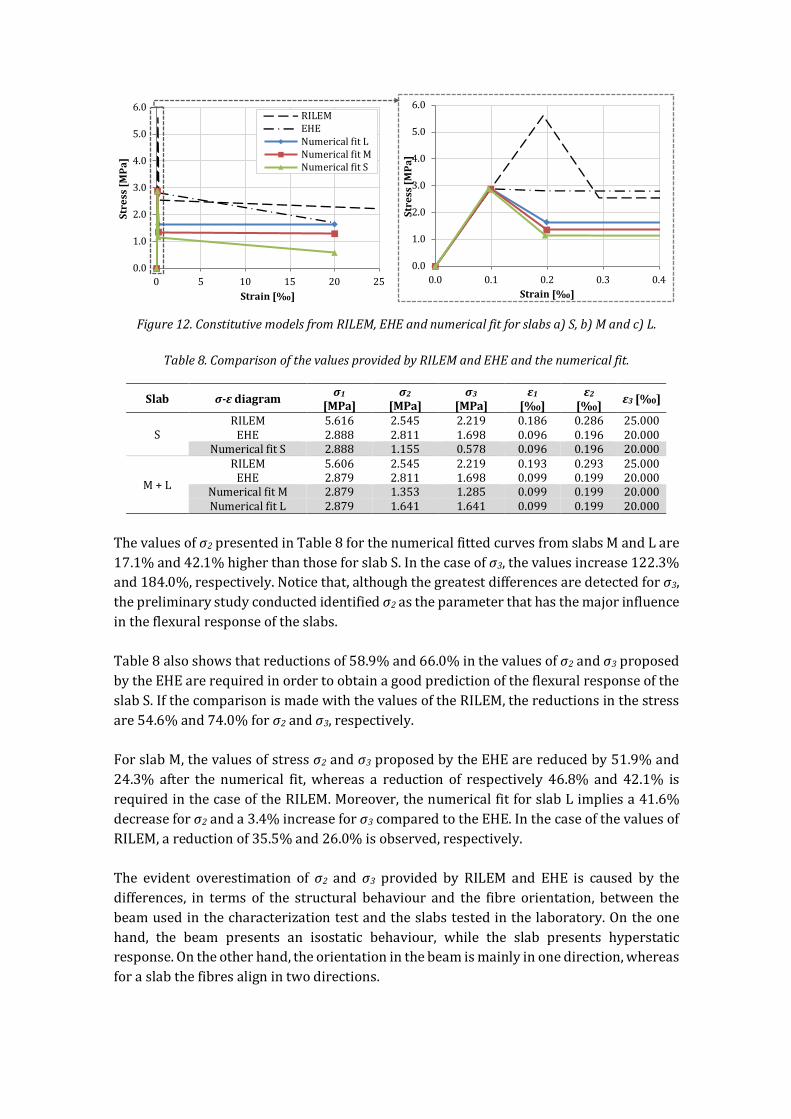
Figure12.ConstitutivemodelsfromRILEM,EHEandnumericalfitforslabsa)S,b)Mandc)L.
Table8.ComparisonofthevaluesprovidedbyRILEMandEHEandthenumericalfit.
Thevaluesofσ2presentedinTable8forthenumericalfittedcurvesfromslabsMandLare17.1%and42.1%higherthanthoseforslabS.Inthecaseofσ3,thevaluesincrease122.3%and184.0%,respectively.Noticethat,althoughthegreatestdifferencesaredetectedforσ3,thepreliminarystudyconductedidentifiedσ2astheparameterthathasthemajorinfluenceintheflexuralresponseoftheslabs.Table8alsoshowsthatreductionsof58.9%and66.0%inthevaluesofσ2andσ3proposedbytheEHEarerequiredinordertoobtainagoodpredictionoftheflexuralresponseoftheslabS.IfthecomparisonismadewiththevaluesoftheRILEM,thereductionsinthestressare54.6%and74.0%forσ2andσ3,respectively.
ForslabM,thevaluesofstressσ2andσ3proposedbytheEHEarereducedby51.9%and24.3% after the numerical fit,whereas a reduction of respectively 46.8% and 42.1% isrequiredinthecaseoftheRILEM.Moreover,thenumericalfitforslabLimpliesa41.6%decreaseforσ2anda3.4%increaseforσ3comparedtotheEHE.InthecaseofthevaluesofRILEM,areductionof35.5%and26.0%isobserved,respectively.The evident overestimation of σ2 andσ3 provided by RILEM and EHE is caused by thedifferences, in terms of the structural behaviour and the fibre orientation, between thebeamusedinthecharacterizationtestandtheslabstestedinthelaboratory.Ontheonehand, the beam presents an isostatic behaviour, while the slab presents hyperstaticresponse.Ontheotherhand,theorientationinthebeamismainlyinonedirection,whereasforaslabthefibresalignintwodirections.
0.0
1.0
2.0
3.0
4.0
5.0
6.0
0 5 10 15 20 25
Stress[M
Pa]
Strain[‰]
RILEMEHENumericalfitLNumericalfitMNumericalfitS
0.0
1.0
2.0
3.0
4.0
5.0
6.0
0.0 0.1 0.2 0.3 0.4
Stress[M
Pa]
Strain[‰]
Slab σ-εdiagram σ1[MPa]
σ2[MPa]
σ3[MPa]
ε1[‰]
ε2[‰] ε3[‰]
SRILEM 5.616 2.545 2.219 0.186 0.286 25.000EHE 2.888 2.811 1.698 0.096 0.196 20.000
NumericalfitS 2.888 1.155 0.578 0.096 0.196 20.000
M+L
RILEM 5.606 2.545 2.219 0.193 0.293 25.000EHE 2.879 2.811 1.698 0.099 0.199 20.000
NumericalfitM 2.879 1.353 1.285 0.099 0.199 20.000NumericalfitL 2.879 1.641 1.641 0.099 0.199 20.000
Inviewof that,thequestionthatmayberaisedat thispointiswhy largerslabspresenthigher values of stress in the σ-ε diagram compared to smaller slabs?According to theliterature(Kooiman2000;Laranjeira2010),differentresponsesofFRCmaybecausedbythe properties of the concrete matrix affecting the fibre-matrix interface, the fibreorientationandthefibretypeandcontent.SincethepropertiesoftheSFRCarepracticallythesameforallslabs,theonlydifferencedetectedistheorientationofthefibresduetothedimensionsof the slabs.Thiswas evidenced in the experimental program fromBlanco(2013),whichassessedtheactualorientationofthefibresintheconcretematrixbydrillingcoresfromtheslabsandusinganon-destructivemagneticmethod(Torrentsetal.2012,Cavalaroetal.2014)tomeasuretheiraverageorientation.Thestudysuggeststhatfibrestendtoalignparalleltotheformworksurfaceduetothewall-effect. Fibres also tend to rotate andalignperpendicular to the flow of concrete as thematerialmovesfromthepouringpositiontotheedgesoftheformwork.Itisimportanttoremark that this finding is linewithotherworks from the literature that focusonSFRCsubjectedtoradialflow(Grünewald2004;Boulekbacheetal.2010;MartinieandRoussel2011).Figure13illustratesschematicallytheconcreteradialflowinasmallerrectangularslab(seeFigure13a),suchasslabS,andinalargersquareslab(seeFigure13b),suchasslabL.Inthe latter case, the concrete tend to flow regularly in all directions and the fibres alignperpendicularlytothedirectionoftheflow.Onthecontrary,inthesmallerslabthewaytheconcrete flows is not regular since it is affected by the shorter size. Consequently thematerialflowpathshouldbelargerforthelongestdimension,meaningthatrelativemorefibresareaffectedbythewall-effect(inthecaseofFigure13a).
Figure13.Fibreorientationina)asmallerrectangularslabandb)alargersquareslab.
Considernowthecrackpatterndescribedinsection4.1.AsdepictedinFigure13,thewayfibresalign(perpendicularlytotheflow)shouldbemoreadvantageousinthecaseofthelargest slab from Figure 13b. In this situation, fibres are more likely to be positionedperpendiculartothecracks,assumingamoreefficientorientationregardingthecrackingplane. Therefore, higher stress bearing capacity of FRC at a sectional level should be
Formwork
Formwork
Radialflow
Crack Radialflow
Crack
Fibre
Fibre
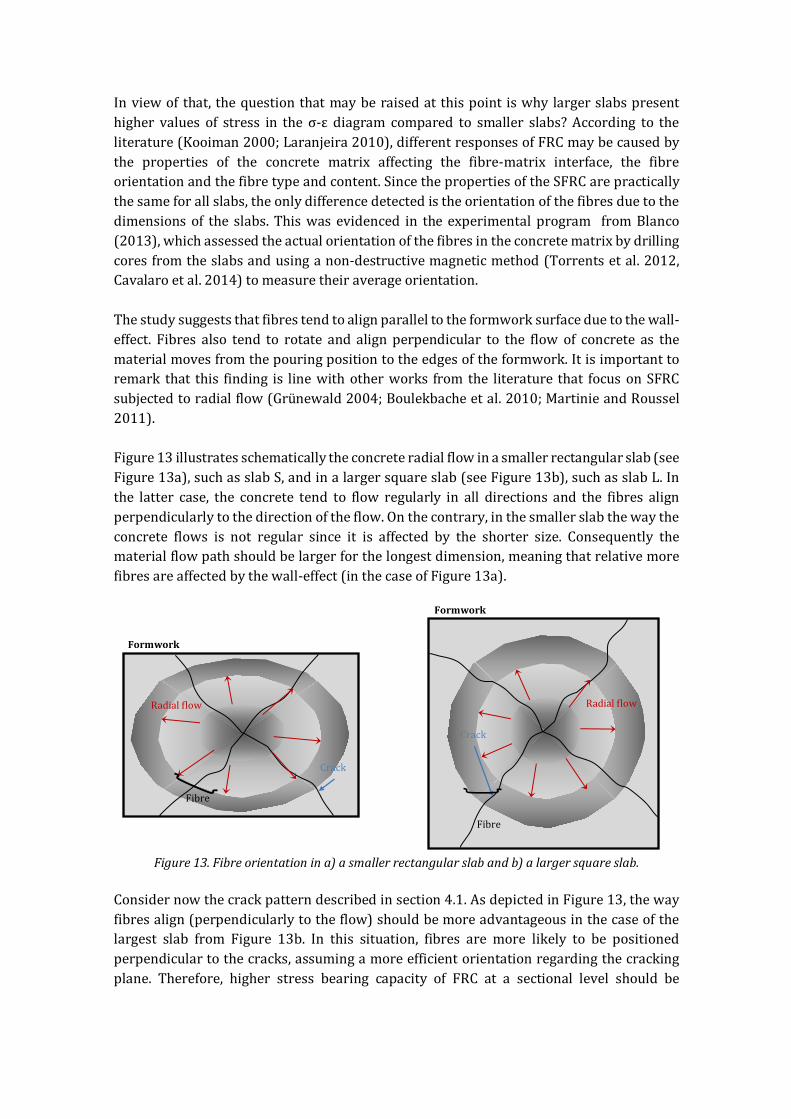
expectedduetoamorefavourableorientationofthefibreswithregardstothefailureplaneincomparisonwiththeobservedinthesmallrectangularslab.Thisphenomenon-referredhereinafterasfibrenetworkeffect-wouldbeofgreatinterestifquantifiedandconsideredinthedesign.Eventhoughthenumberoftestsperformedinthisstudyisnotenoughtoproposeanintegratedmethodologyforthedesignofslabstakingintoaccountfibreorientation,asimplifiedapproachmaybesuggestedforfutureresearch.Given that themaindifferencesamongthenumerical fitsofeachslabcorrespondto thevaluesofσ2andσ3,thefibrenetworkeffectshouldbeassessedthroughtheseparameters.Forthat,thevaluesofσ2andσ3fromthenumericalfitofslabsMandLarecomparedwiththevaluesofσ2andσ3forslabSintermsoftheirratio,asindicatedby(Eq.1)and(Eq.2).
In this context, the ratios ηfσ2 and ηfσ3 represent the increase on load bearing capacityobservedatthesectionallevelasaresultoftheslabgeometry,thusindicatingtheamountfibrenetworkeffectgeneratedrelativelytoslabS.ThevaluesofthesefactorsarepresentedinTable9.
Table9.FibrenetworkeffectfactorsfortheslabsS,MandL.Eventhoughtheoreticallyattributedtoacertainfibreorientation, itshouldberemarkedthatthedegreeofhyperstaticityofthestructureorthesizeoftheelementcouldinfluencethefibrenetworkeffect.Theultimategoalwouldbetoderiveageneralexpressionabletoquantifythiseffectinasimplifiedway.Nevertheless,manymoreexperimentalprogramswith real-scale SFRC elements are yet required for that purpose. In particular, therepercussionofthefibrecontentorthesupportconditiononthefibrenetworkeffectshouldbeverified.Likewise,furthertestsshouldbeperformedwithslabswithdifferentdimensioninordertodeterminethelimitsofthefibrenetworkeffectandderivegeneralequations.7.ConclusionsThestudyconductedinthispaperrevealedthatthedirectapplicationoftheconstitutivemodelsbasedonbendingtestsmaynotbethemostsuitablealternativeforthedesignofSFRCslabs.Infact,theresultsofthenumericalsimulationsperformedwiththesemodelsoverestimatethestructuralresponsemeasuredintheexperimentalprogram.Intermsofthemaximumload,suchoverestimationmayreachvaluesover60%.Thismaybeattributedtothelowrepresentativenessofthebeamtestasamethodforthecharacterizationofthe
𝜂"#$ =𝜎'(𝜎')
𝑓𝑜𝑟𝑖 = 𝑀, 𝐿 (Eq.1)
𝜂"#2 =𝜎3(𝜎3)
𝑓𝑜𝑟𝑖 = 𝑀, 𝐿 (Eq.2)
Slab Width[m]
Width/Length[-]
ηfσ2[-]
ηfσ3[-]
S 1.5 0.50 1.00 1.00M 2.0 0.67 1.17 2.23L 3.0 1.00 1.42 2.84
flexuralbehaviouroftheslabs,aswellastotheabsenceofcorrectionsfactorsappliedtotheSFRC constitutive models that account for the special characteristics of the real-scaleelement.Suchresultssuggesttheneedtousegeometryfactorsforelementswithshapesdifferentfromthebendingtest.
Theparametricstudyperformedwith the trilinear constitutivediagram(definedby theparametersσ1,σ2,σ3,ε1,ε2andε3)showedthatthestressσ2istheparameterwiththebiggestinfluence over the structural response of the slabs (notice that σ1, ε1and ε3 were keptconstantinthestudy).Thisparameteraffectsparticularlythemaximumloadandtheenergyabsorptioncapacity.Onthecontrary,thestrainε2leadstominorchangesintheresponseifcomparedtotherepercussionofσ2orσ3.
Thestudyalsoshowstheinfluenceofacertainfibreorientationinthestructuralresponseoftheslabs.Inthisregard,themostsignificantcontributionistheobservationofafibrenetworkeffectthatleadstoanenhancedsectionalresponseastheratiowidth/lengthoftheslabs increases.Thisphenomenon, attributed to the favourableorientationof the fibresregarding the cracking plane,may be of great interest for an optimizeddesign of SFRCstructures.Eventhoughasimplifiedapproachwassuggestedtoquantifythiseffect,furtherresearchshouldbeconductedinordertoimplementitindesigncodesandguidelines.
AcknowledgementsThe authors of this document wish to show their gratitude for the economic support receivedthrough theResearchProjectBIA2010-17478:Constructionprocessesbymeansof fibre reinforcedconcretes.ThefirstauthoracknowledgethegrantFIprovidedbytheComissionatperaUniversitatsdelDIUEdelaGeneralitatdeCatalunyaidelFonsSocialEuropeuandthesupportoftheCol·legid’EnginyersdeCamins,CanalsiPortsdeCatalunya. References AENOR. UNE 83507:2004 (2004) Hormigones con fibras. Rotura por compresión. AsociaciónEspañoladeNormalizaciónyCertificación,Madrid(InSpanish).
AENOR.UNE83316:1996(1996)Ensayosdehormigón.Determinacióndelmódulodeelasticidadencompresión.,AsociaciónEspañoladeNormalizaciónyCertificación,Madrid(InSpanish).AFGC-SETRA.Ultrahighperformancefibre-reinforcedconcretes, interimrecommendations.AFGCPublication,France,2002.
BarnettS,Lataste J-F,ParryT,MillardS,SoutsosM.Assessmentof fibreorientationinultrahighperformance fibre reinforced concrete and its effect on flexural strength. Mater Struct 2010;43(7):1009-1023.BarrosJAO,CunhaV,RibeiroA,AntunesJ.Post-crackingbehaviourofsteelfibrereinforcedconcrete.MaterStruct2005;38(1):47-56.
BlancoA.CharacterisationandmodellingofSFRCelements,DoctoralThesis,UniversitatPolitècnicadeCatalunya,Barcelona,2013.
BlancoA, Pujadas P, de la FuenteA, Cavalaro S, AguadoA. Application of constitutivemodels inEuropeancodestoRC–FRC.ConstrBuildMater2013;40:246-59.
BoulekbacheB,HamratM,ChemroukM,AmzianeS.Flowabilityoffibre-reinforcedconcreteanditseffectonthemechanicalpropertiesofthematerial.ConstrBuildMater2010;24(9):1664-71.CasanovaP,RossiP.AnalysisanddesignofSFRCbeams.ACIStructJ1997;94(5):595–624.

CENa.EN1337-3:2005Structuralbearings-Part3:Elastomericbearings,EuropeanCommitteeforStandarization,Brussels,2005.
CENb.EN14651:2005Testmethodformetallicfibreredconcrete-Measuringtheflexuraltensilestrength (limit of proportionality (LOP), residual), European Committee for Standardization,Brussels,2005.
Cervenka,V.Simulatingaresponse.ConcrEngInt2000;4(4):45-9.
CNR. CNR-DT 204 /2006 Guide for the Design and Construction of Fiber-Reinforced ConcreteStructures,ItalianNationalResearchCouncil,Rome,2006.
CPH.InstruccióndelHormigónEstructuralEHE-08,MinisteriodeFomento,Madrid,2008.
DBV.GuidetoGoodPractice"SteelFibreConcrete",GermanSocietyforConcreteandConstructionTechnology,Berlin,2001.
delaFuenteA,PujadasP,BlancoA,AguadoA.ExperiencesinBarcelonawiththeuseoffibresinsegmentallinings.TunnellingUndergroundSpaceTechnol2012;27(1):60-71.deMontaignacR,MassicotteB,CharronJ-P,NourA. DesignofSFRCstructuralelements: flexuralbehaviorprediction.MaterStruct2012;45(4):623-636.
Destrée,X.andMandl,J.Steelfibreonlyreinforcedconcreteinfreesuspendedelevatedslabs:Casestudies, design assisted by testing route, comparison to the latest SFRC standard documents. InProceedings of the fib Symposium "TailorMade ConcreteStructures", Amsterdam, 2008,WalravenStoelhostEds.Taylor&FrancisGroup.
fib.ModelCode2010,InternationalFederationforStructuralConcrete,Lausanne,2010.
Grünewald S. Performance-based design of self-compacting fibre reinforced concrete. DoctoralThesis,DelftUniversityofTechnology,Delft,2004.
HabelK.StructuralbehaviourofelementscombiningUHPFRCandreinforced,DoctoralThesis,ÉcolePolytechniqueFédéraledeLausanne,Laussanne,2004.
IBN. NBN B 15-238 Essais des bétons renforcés de fibres - Essai de flexion sur éprouvettesprismatiques,InstitutBelgedeNormalisationBrussels,1992.
Iyengar SRKT,Raviraj S, RavikumarP. Analysis study of fictitious crack propagation in concretebeams using a bi-linear r–w relation. In: 3th International conference on fracture mechanics ofconcreteandstructure(FRAMCOSIII),Japan,1998,315–324.
KooimanAG.ModellingSteelFibreReinforcedConcreteforStructuralDesign.DoctoralThesis,DelftUniversityofTechnology,Delft,2000.
LaranjeiraF,AguadoA,MolinsC.Predicting thepullout responseof inclinedstraight steel fibers,MaterStruct2010;43:875-895.
LaranjeiraF.Design-orientedconstitutivemodelforsteelfiberreinforcedconcrete,DoctoralThesis,UniversitatPolitècnicadeCatalunya,Barcelona,2010.
MartinieL,RousselN.Simpletoolsforfiberorientationpredictioninindustrialpractice,CemConcrRes2011,41(10):993-1000.
MassicotteB.ImplementingSFRCdesignintoNorthAmericancodes:applicationtoabuildingfloor.InvitedpapertotheInternationalworkshopontheadvancedinfibrereinforcedconcrete,Bergamo,Italia,2004,September24–25,pp73–80.
MichelsJ,WaldmannD,MaasS,ZürbesA.Steelfibersasonlyreinforcementforflatslabconstruction–Experimentalinvestigationanddesign.ConstrBuildMater2012;26(1):145-55.
PedersonC.Newproductionprocesses,MaterialsandCalculationTechniquesforFibreReinforcedPipes.DoctoralThesis,TechnicalUniversityofDenmark,KongensLyngby,1996.

Plizzari GA, Tiberti G. Steel fibres as reinforcement for precast tunnel segments.TunnellingUndergroundSpaceTechnol2006;21(3-4):438-9.RILEMTC162-TDF—testsanddesignmethodsforsteelfibrereinforcedconcrete:designofsteelfibrereinforcedconcreteusingtheσ–wmethod:principlesandapplications.MaterStruct2002;35:262–278.
RILEMTC162-TDF.Testanddesignmethodsforsteelfibrereinforcedconcrete-σ-εDesignMethod-FinalRecommendation.MaterStruct2003;36(8):560-7.
CavalaroS,LópezR,TorrentsJM,AguadoA.ImprovedassessmentofFibreContentandOrientationwithInductiveMethodinSFRC.MinorrevisionsinMaterStruct.
SorelliLG,MedaA,PlizzariGA.SteelFiberConcreteSlabsonGround:AStructuralMatter.ACIStructJ2006;103(4):551-8.
StähliP,CusterR,vanMierJGM(2008)Onflowproperties,fibredistribution,fibreorientationandflexuralbehaviourofFRC.MaterStruct41:189-196.StrackM.ModellingofcrackopeningofSFRCundertensionandbending.In:7thInternationalRilemSymposiumonFRC:designandapplication,India,2008,GettuEd.,323–332.
TlematH,PilakoutasK,NeocleousK.ModellingofSFRCusinginversefiniteelementanalysis.MaterStruct2006;39(2):221-233.
UNI11188.Design,productionandcontrolofsteelfibrereinforcedstructuralelements.ItalianBoardofStandardization,Milan,2004.
UltkjaerJP,KrenkS,BrinckerR.Analyticalmodelforfictitiouscrackpropagationinconcretebeams.ASCEJ.EngMech1995;121(1):7–15