Application of Energy Balances the Development of the Iea Energy Efficiency Template
50
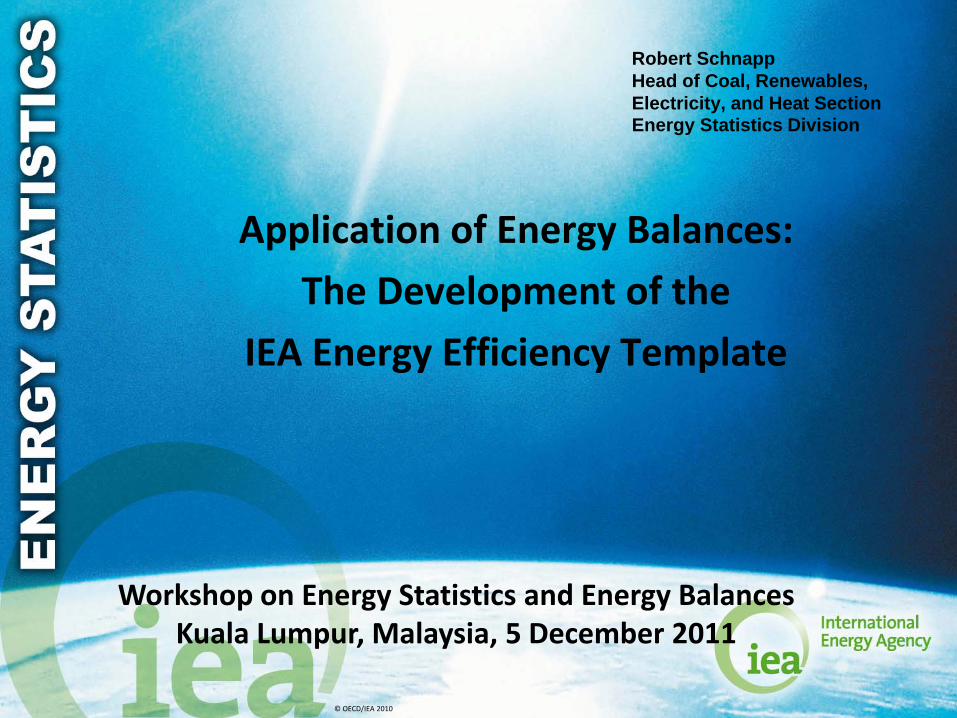
© OECD/IEA 2010 Robert Schnapp Head of Coal, Renewables, Electricity, and Heat Section Energy Statistics Division Application of Energy Balances: The Development of the IEA Energy Efficiency Template Workshop on Energy Statistics and Energy Balances Kuala Lumpur, Malaysia, 5 December 2011
-
Upload
juzaili-js -
Category
Documents
-
view
215 -
download
1
Transcript of Application of Energy Balances the Development of the Iea Energy Efficiency Template
© OECD/IEA 2010
Robert SchnappHead of Coal, Renewables,Electricity, and Heat SectionEnergy Statistics Division
Application of Energy Balances:
The Development of the
IEA Energy Efficiency Template
Workshop on Energy Statistics and Energy BalancesKuala Lumpur, Malaysia, 5 December 2011
© OECD/IEA 2010 © OECD/IEA, 2010
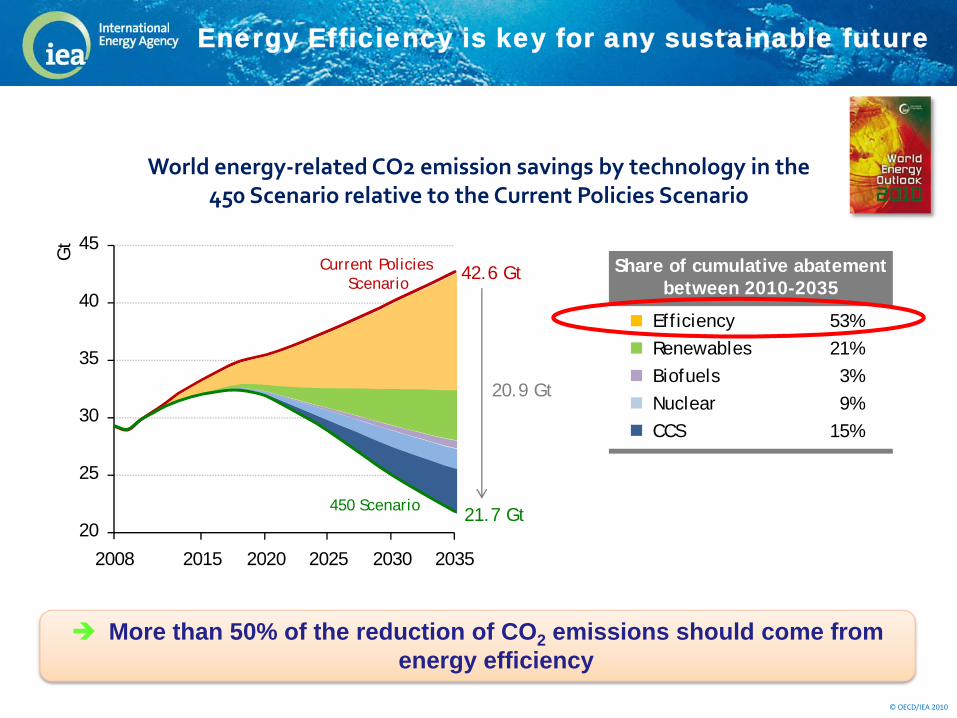
World energy‐related CO2 emission savings by technology in the 450 Scenario relative to the Current Policies Scenario
20
25
30
35
40
45
2008 2015 2020 2025 2030 2035
Gt
Efficiency 53%Renewables 21%Biofuels 3%Nuclear 9%CCS 15%
Share of cumulative abatement between 2010-2035
42.6 Gt
21.7 Gt450 Scenario
20.9 Gt
Current Policies Scenario
More than 50% of the reduction of CO2 emissions should come from energy efficiency
Energy Efficiency is key for any sustainable future
© OECD/IEA 2010 © OECD/IEA, 2010
Benefits of energy efficiency
Environmental benefits by reducing greenhouse gas emissions and local pollution
Increased energy security
Reduced investments in energy infrastructure
Increased competitiveness
Improved consumer welfare
Job creation
© OECD/IEA 2010 © OECD/IEA, 2010
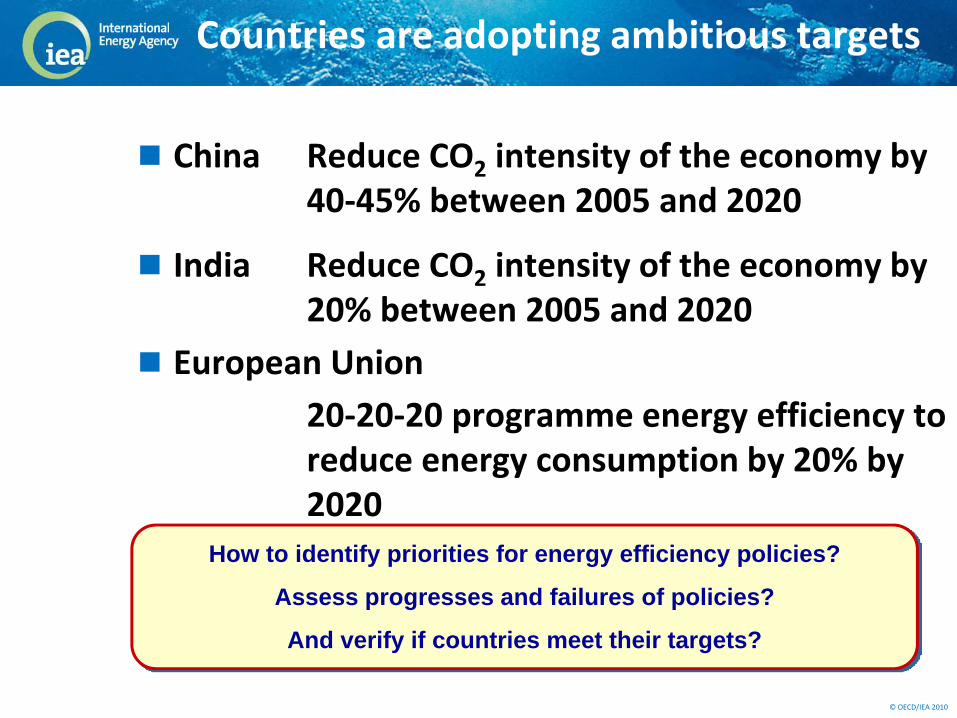
China Reduce CO2 intensity of the economy by 40‐45% between 2005 and 2020
India Reduce CO2 intensity of the economy by 20% between 2005 and 2020
European Union20‐20‐20 programme energy efficiency to reduce energy consumption by 20% by 2020
Russia: Reduce the energy intensity of GDP by 40% compared to 2007
How to identify priorities for energy efficiency policies?
Assess progresses and failures of policies?
And verify if countries meet their targets?
Countries are adopting ambitious targets
© OECD/IEA 2010 © OECD/IEA, 2010
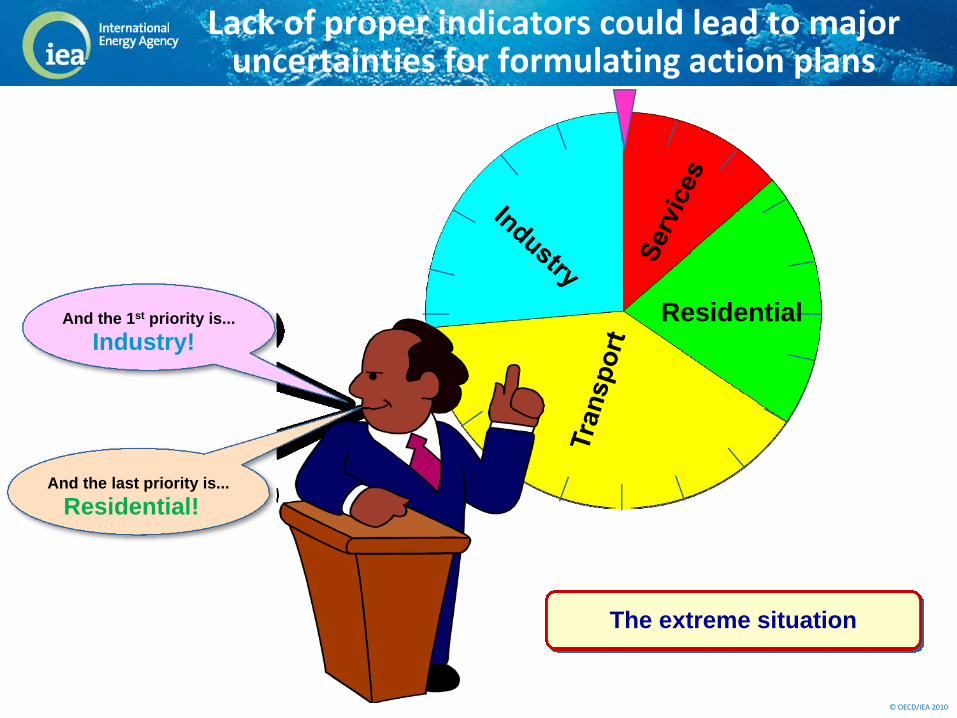
Lack of proper indicators could lead to major uncertainties for formulating action plans
ResidentialAnd the 1st priority is...Industry!
And the last priority is...Residential!
The extreme situation
© OECD/IEA 2010 © OECD/IEA, 2010
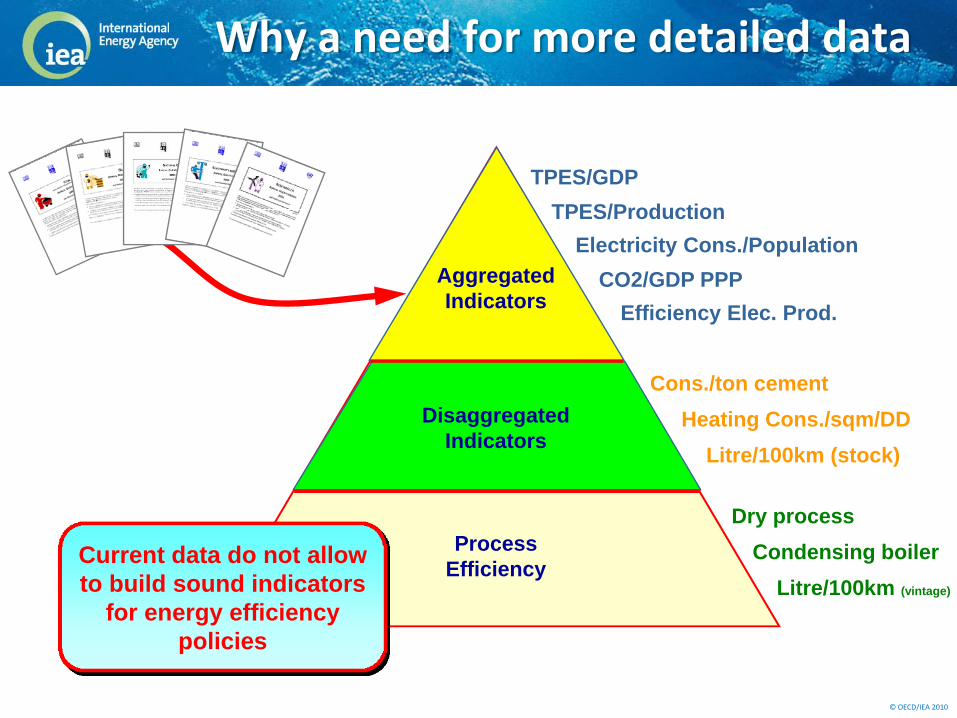
AggregatedIndicators
TPES/GDPTPES/Production
Electricity Cons./PopulationCO2/GDP PPP
Efficiency Elec. Prod.
Cons./ton cementHeating Cons./sqm/DD
Litre/100km (stock)
Current data do not allow to build sound indicators
for energy efficiency policies
Dry processCondensing boiler
Litre/100km (vintage)
Why a need for more detailed data
ProcessEfficiency
DisaggregatedIndicators
© OECD/IEA 2010 © OECD/IEA, 2010
70%
80%
90%
100%
110%
120%
130%
140%
150%
160%
1973
19
74
1975
19
76
1977
19
78
1979
19
80
1981
19
82
1983
19
84
1985
19
86
1987
19
88
1989
19
90
1991
19
92
1993
19
94
1995
19
96
1997
19
73 =
100
%
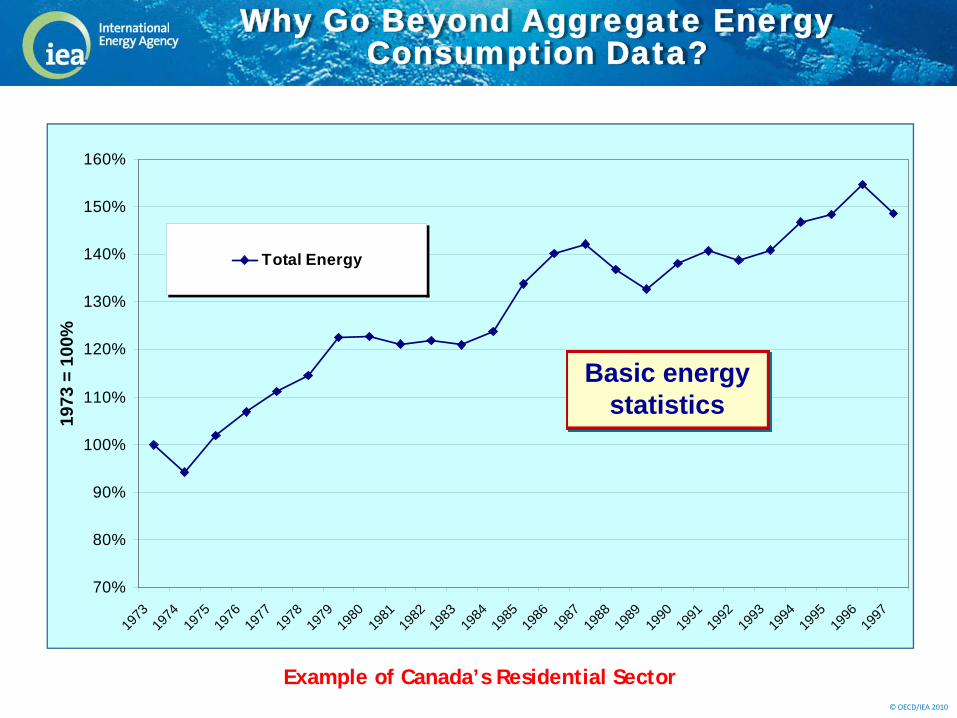
Total Energy
Basic energy statistics
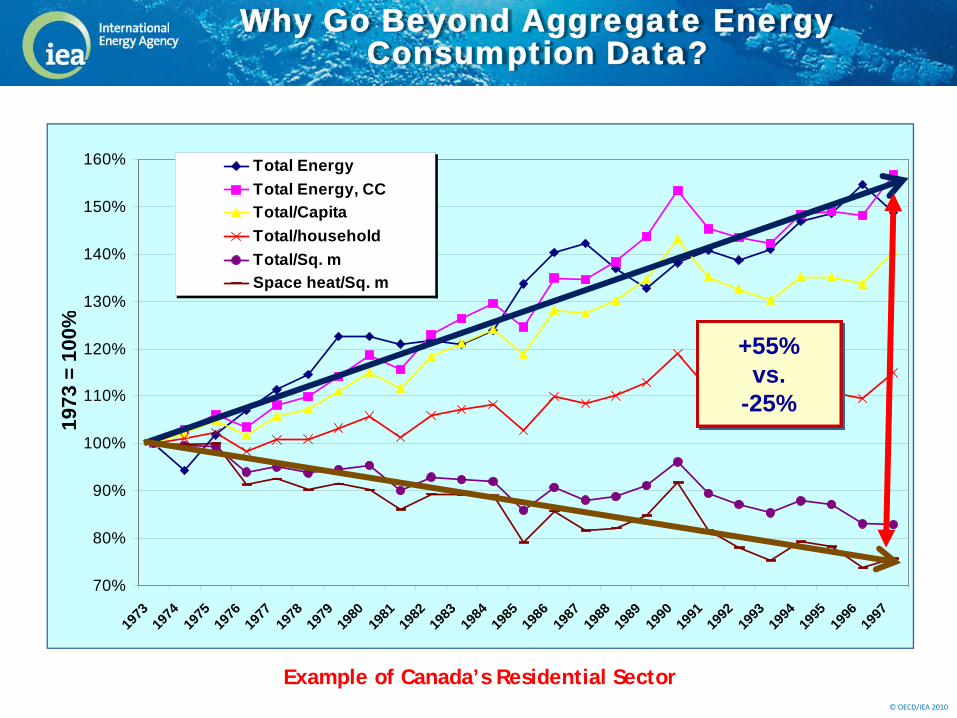
Example of Canada’s Residential Sector
Why Go Beyond Aggregate Energy Consumption Data?
© OECD/IEA 2010 © OECD/IEA, 2010
70%
80%
90%
100%
110%
120%
130%
140%
150%
160%
1973
19
74
1975
19
76
1977
19
78
1979
19
80
1981
19
82
1983
19
84
1985
19
86
1987
19
88
1989
19
90
1991
19
92
1993
19
94
1995
19
96
1997
19
73 =
100
%
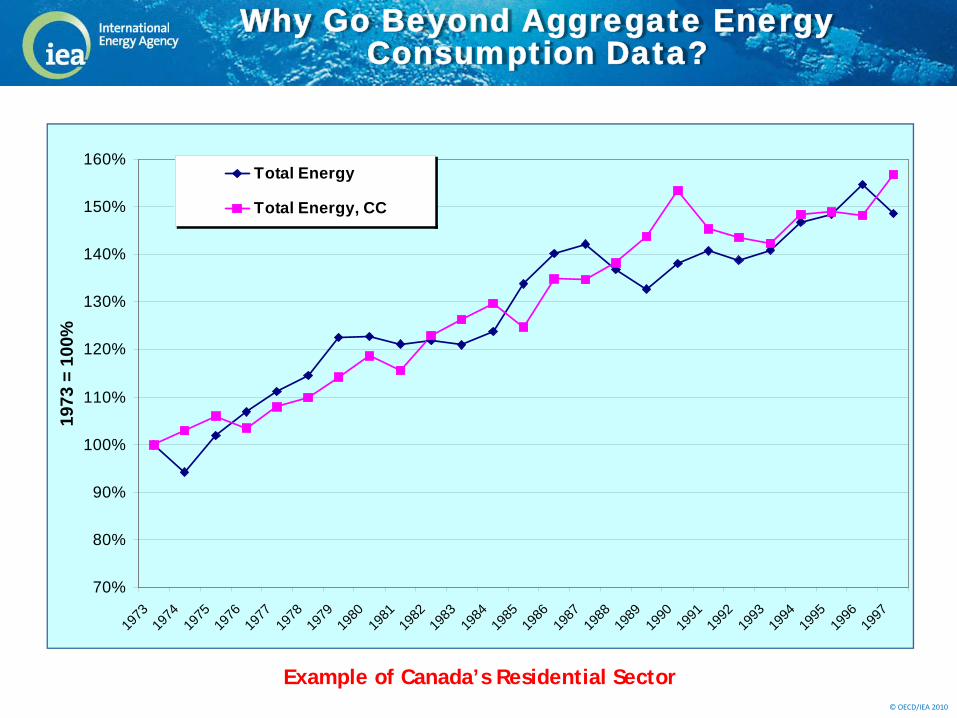
Total Energy
Total Energy, CC
Why Go Beyond Aggregate Energy Consumption Data?
Example of Canada’s Residential Sector
© OECD/IEA 2010 © OECD/IEA, 2010
70%
80%
90%
100%
110%
120%
130%
140%
150%
160%
1973
19
74
1975
19
76
1977
19
78
1979
19
80
1981
19
82
1983
19
84
1985
19
86
1987
19
88
1989
19
90
1991
19
92
1993
19
94
1995
19
96
1997
19
73 =
100
%
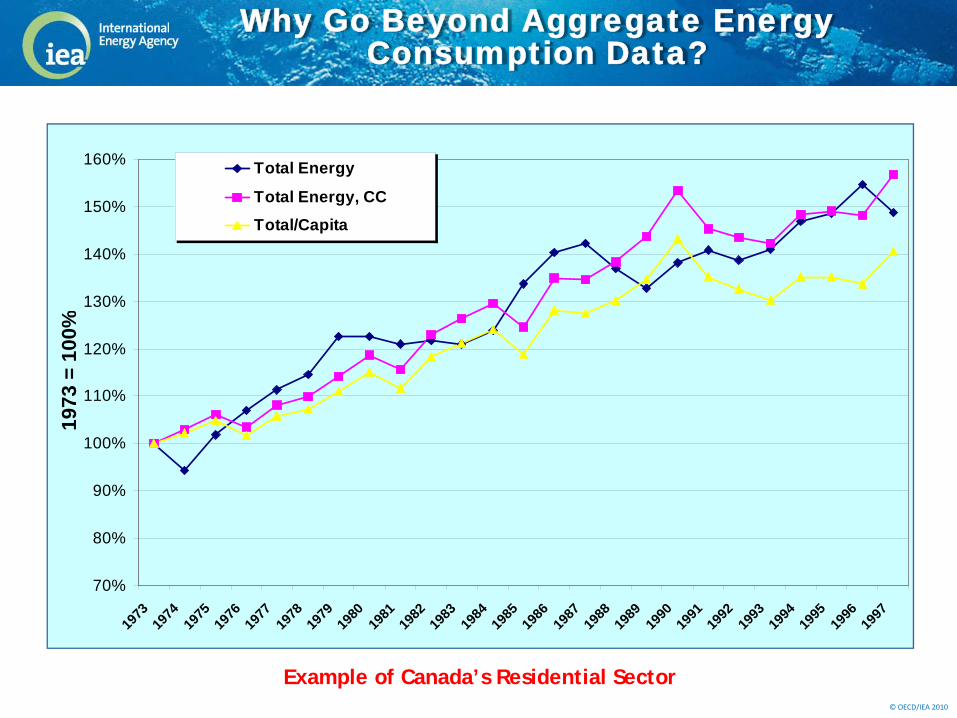
Total Energy
Total Energy, CC
Total/Capita
Why Go Beyond Aggregate Energy Consumption Data?
Example of Canada’s Residential Sector

© OECD/IEA 2010 © OECD/IEA, 2010
70%
80%
90%
100%
110%
120%
130%
140%
150%
160%
1973
19
74
1975
19
76
1977
19
78
1979
19
80
1981
19
82
1983
19
84
1985
19
86
1987
19
88
1989
19
90
1991
19
92
1993
19
94
1995
19
96
1997
19
73 =
100
%
Total Energy
Total Energy, CC
Total/Capita
Total/household
Why Go Beyond Aggregate Energy Consumption Data?
Example of Canada’s Residential Sector
© OECD/IEA 2010 © OECD/IEA, 2010
70%
80%
90%
100%
110%
120%
130%
140%
150%
160%
1973
19
74
1975
19
76
1977
19
78
1979
19
80
1981
19
82
1983
19
84
1985
19
86
1987
19
88
1989
19
90
1991
19
92
1993
19
94
1995
19
96
1997
19
73 =
100
%
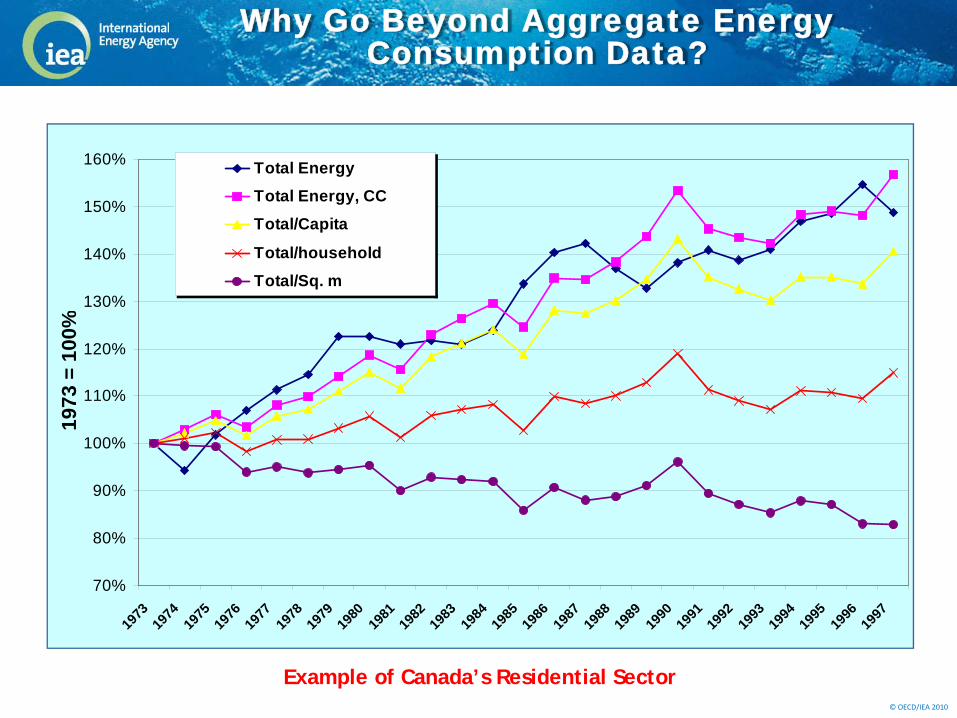
Total Energy
Total Energy, CC
Total/Capita
Total/household
Total/Sq. m
Why Go Beyond Aggregate Energy Consumption Data?
Example of Canada’s Residential Sector
© OECD/IEA 2010 © OECD/IEA, 2010
70%
80%
90%
100%
110%
120%
130%
140%
150%
160%
1973
19
74
1975
19
76
1977
19
78
1979
19
80
1981
19
82
1983
19
84
1985
19
86
1987
19
88
1989
19
90
1991
19
92
1993
19
94
1995
19
96
1997
19
73 =
100
%
Total EnergyTotal Energy, CCTotal/CapitaTotal/householdTotal/Sq. mSpace heat/Sq. m
Why Go Beyond Aggregate Energy Consumption Data?
Example of Canada’s Residential Sector
+55%vs.
-25%
© OECD/IEA 2010 © OECD/IEA, 2010
Modeling
Commercial/public
Industry
Socio-economic
Process
ResidentialEnergy data
Transport
End uses
ISIC: 2, 3, or 4 digits
Surveys
Census
AppliancesData quality / timeliness
Monetary data
Fleet of vehicles
Frequency
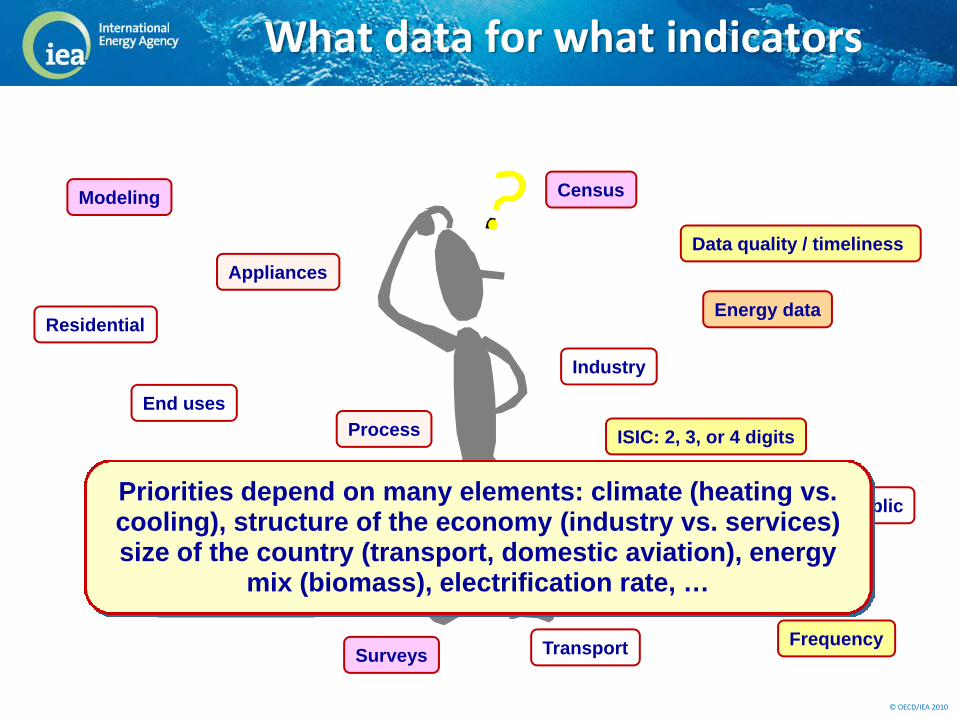
Priorities depend on many elements: climate (heating vs. cooling), structure of the economy (industry vs. services) size of the country (transport, domestic aviation), energy
mix (biomass), electrification rate, …
What data for what indicators

© OECD/IEA 2010 © OECD/IEA, 2010
320
350370
floorarea
Other indicators include energy/energy ratio (efficiency of a furnace) or activity/activity ratio (electrification rate)
What data for what indicators (cont.)

© OECD/IEA 2010 © OECD/IEA, 2010
Please Help Me…
… too many data do not necessarily help…
Do not over collect…

© OECD/IEA 2010 © OECD/IEA, 2010
How to unlock the potential of energy efficiency?
Understand trends in energy
consumption
Assess the potential to
improve energy efficiency
Design policies and measures to unlock the
potential
Understand trends in energy consumption
Check policy effectiveness
Assess the potential to improve energy
efficiency
Design policies and measures to unlock
the potential
© OECD/IEA 2010 © OECD/IEA, 2010
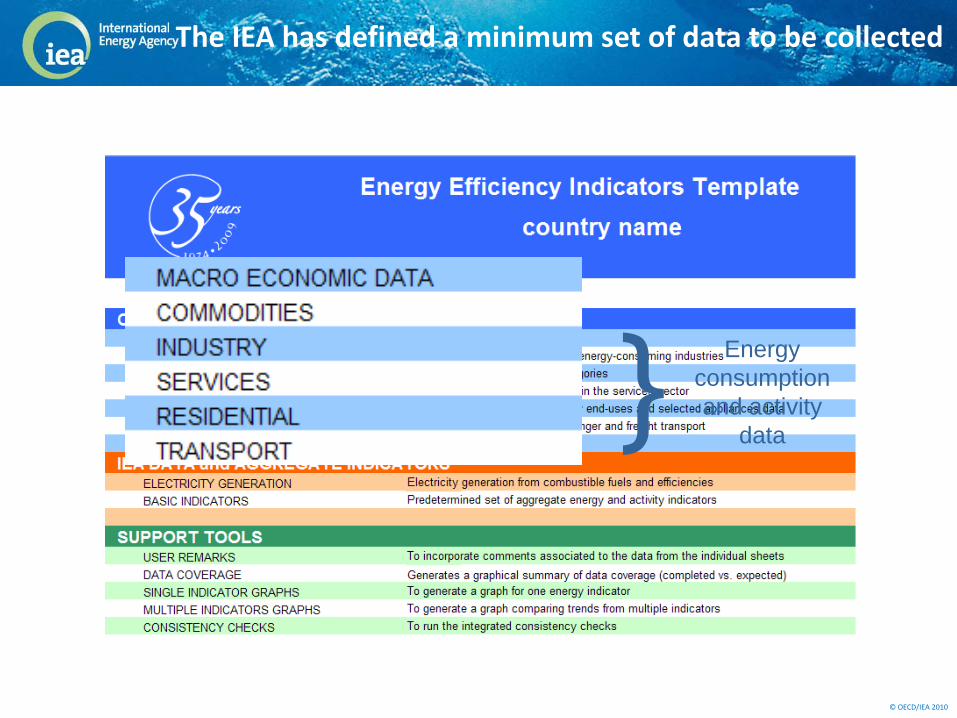
The IEA has defined a minimum set of data to be collected
} Energy consumption and activity
data
© OECD/IEA 2010 © OECD/IEA, 2010
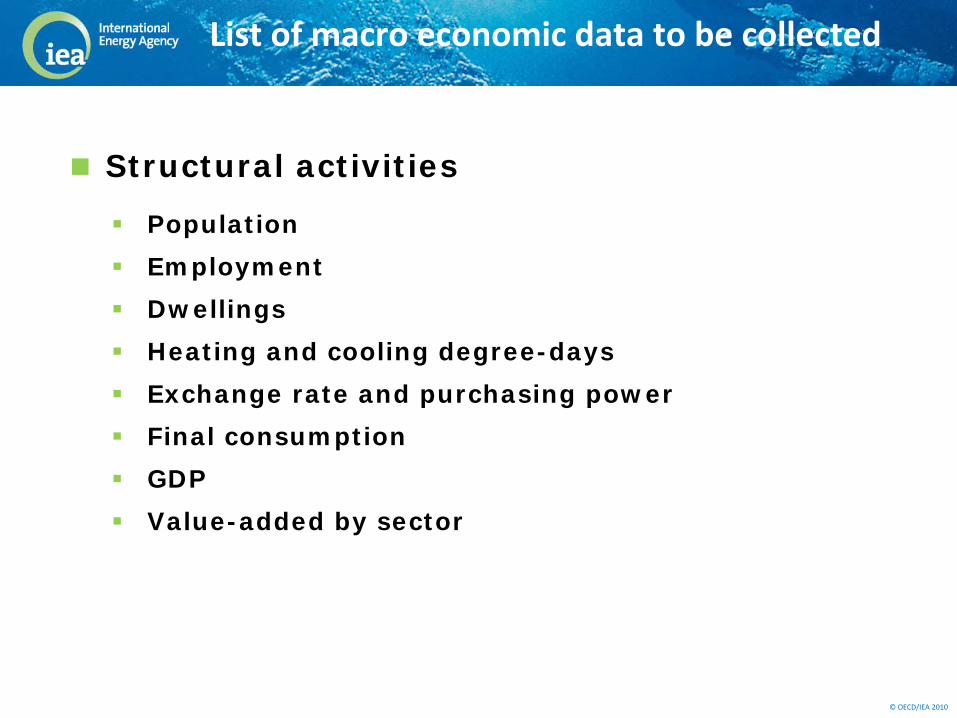
Structural activities
Population
Employment
Dwellings
Heating and cooling degree-days
Exchange rate and purchasing power
Final consumption
GDP
Value-added by sector
List of macro economic data to be collected
© OECD/IEA 2010 © OECD/IEA, 2010
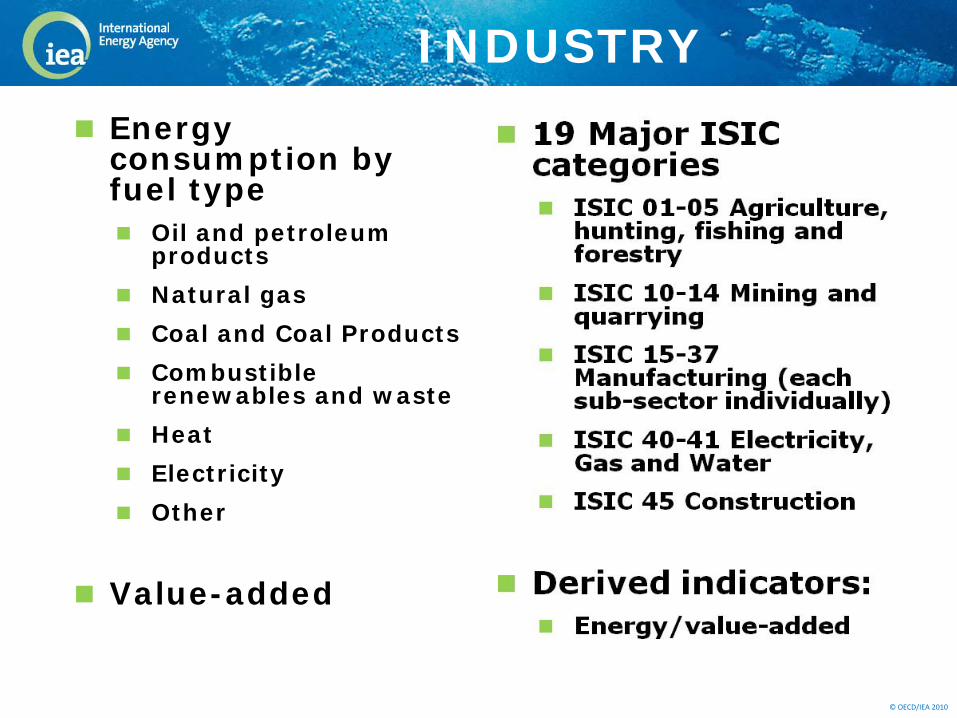
INDUSTRY
Energy consumption by fuel type
Oil and petroleum products
Natural gas
Coal and Coal Products
Combustible renewables and waste
Heat
Electricity
Other
Value-added
© OECD/IEA 2010 © OECD/IEA, 2010
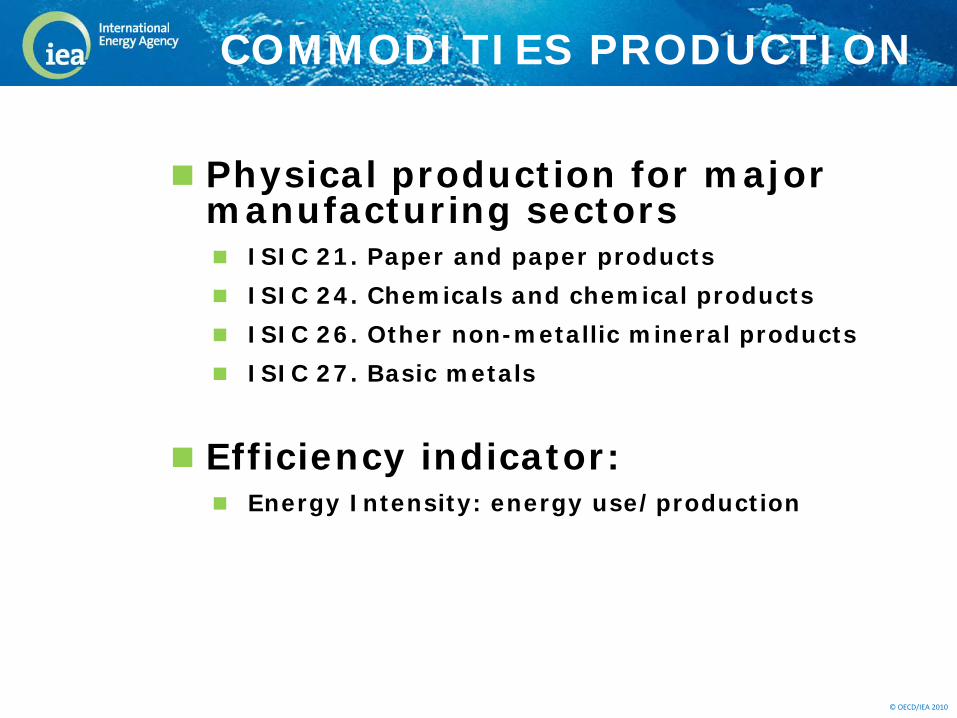
COMMODITIES PRODUCTION
Physical production for major manufacturing sectors
ISIC 21. Paper and paper products
ISIC 24. Chemicals and chemical products
ISIC 26. Other non-metallic mineral products
ISIC 27. Basic metals
Efficiency indicator:Energy Intensity: energy use/production
© OECD/IEA 2010 © OECD/IEA, 2010
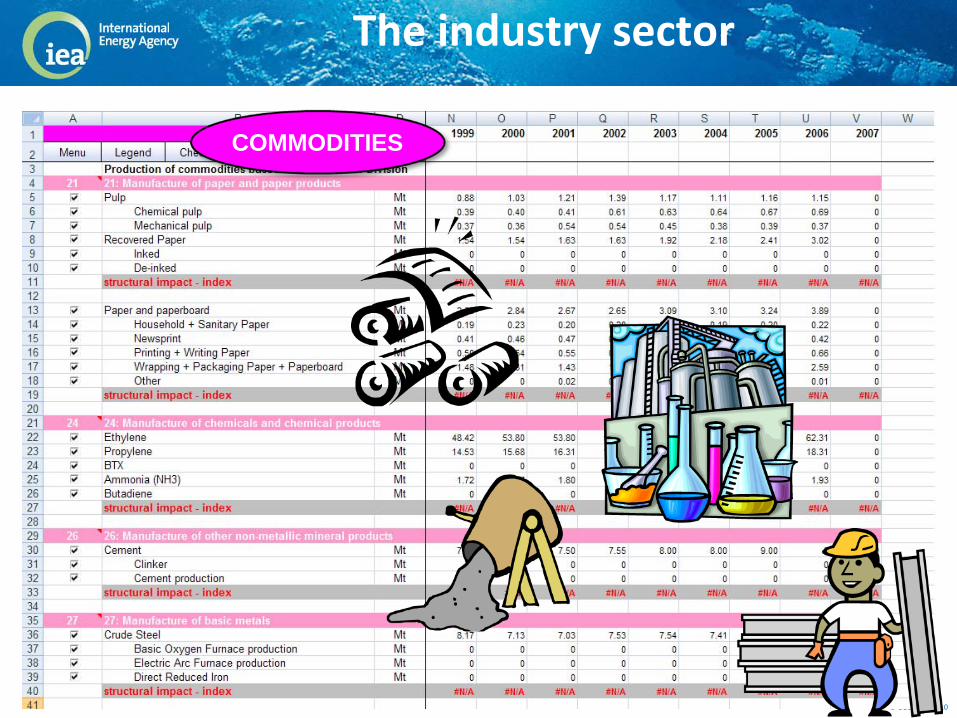
COMMODITIES
The industry sector

© OECD/IEA 2010 © OECD/IEA, 2010
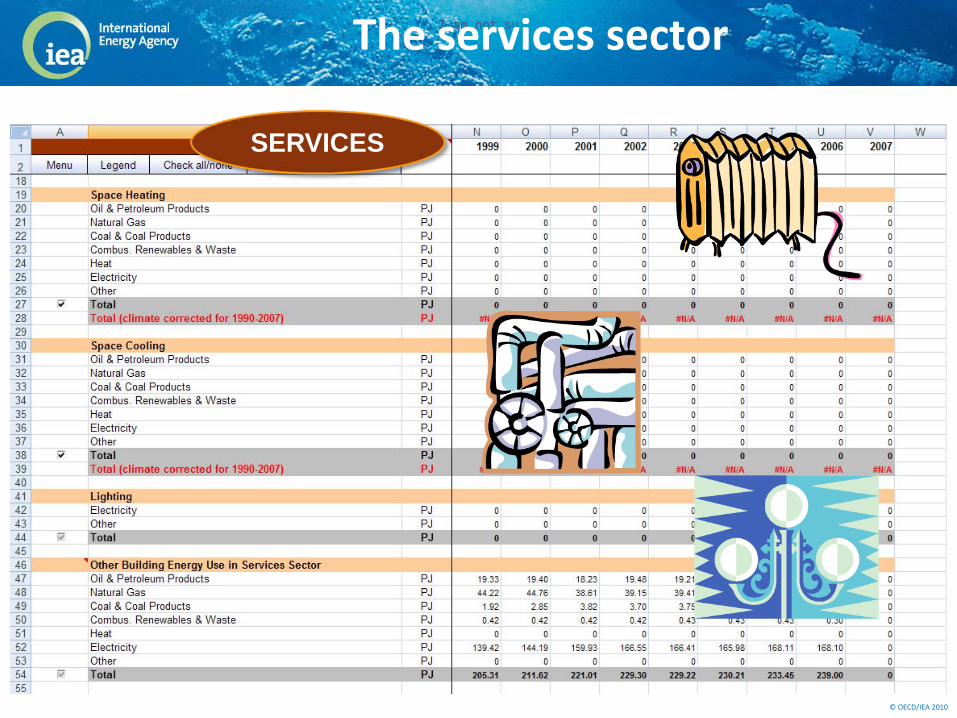
SERVICES
Energy consumption by fuel typeClimate corrected
End-usesSpace heating
Space cooling
Lighting
Other building energy use
Non-building energy use (e.g. street lighting)
Floor space
Derived indicators:Energy consumption/floor space
Energy consumption/value-added
© OECD/IEA 2010 © OECD/IEA, 2010
I am not suI am not su
SERVICES
The services sector

© OECD/IEA 2010 © OECD/IEA, 2010
RESIDENTIAL
End-usesSpace heating
Space cooling
Water heating
Cooking
Lighting
AppliancesRefrigerator
Freezer
Dishwasher
Clothes washer
Clothes dryer
TV
Computers

© OECD/IEA 2010 © OECD/IEA, 2010
RESIDENTIAL
%
106
kWh/unit
The residential sector

© OECD/IEA 2010 © OECD/IEA, 2010
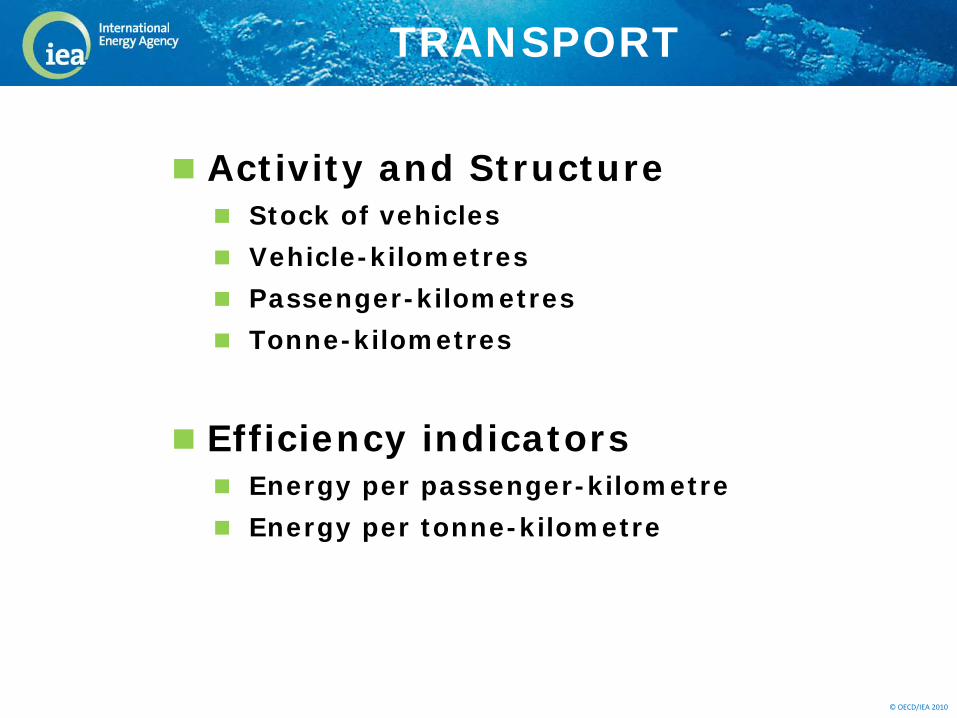
TRANSPORT
Transport modesRoad
Rail
Water
Air
Type of transportPassenger
Freight
Type of road vehiclesCars, SUVs and personal light trucks
Two and three-wheel motorcycles
Buses
Freight & Commercial road transport
© OECD/IEA 2010 © OECD/IEA, 2010
Activity and StructureStock of vehicles
Vehicle-kilometres
Passenger-kilometres
Tonne-kilometres
Efficiency indicatorsEnergy per passenger-kilometre
Energy per tonne-kilometre
TRANSPORT

© OECD/IEA 2010 © OECD/IEA, 2010
TRANSPORT
pass-km
tonnes
Tonnes-km
Veh-km
106
The transport sector

© OECD/IEA 2010 © OECD/IEA, 2010
End-Use Coverage
Residential
Space heating
Water heating
Cooking
Lighting
Appliances
Services
Total services
Passenger Travel
Car &light duty vehicles
Motorcycles
Buses
Passenger rail
Passenger ships
Domestic planes
Freight Transport
Trucks
Freight rail
Domestic shipping
Domestic air freight
Manufacturing
Food, beverages & tobacco
Paper, pulp & printing
Industrial chemicals
Non-metallic minerals
Primary metals
Metal products & equipment
Other
Other Industry
Agriculture, forestry &fishing
Mining
Construction
Electricity, gas & water
© OECD/IEA 2010 © OECD/IEA, 2010
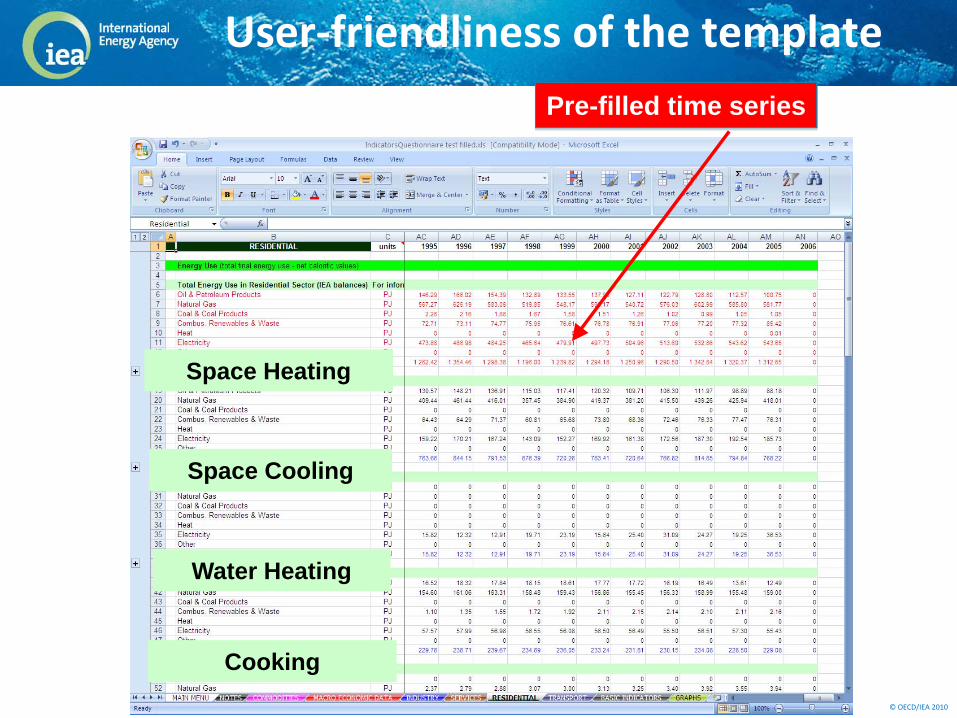
Space Heating
Space Cooling
Water Heating
Cooking
Pre-filled time series
User‐friendliness of the template
© OECD/IEA 2010 © OECD/IEA, 2010
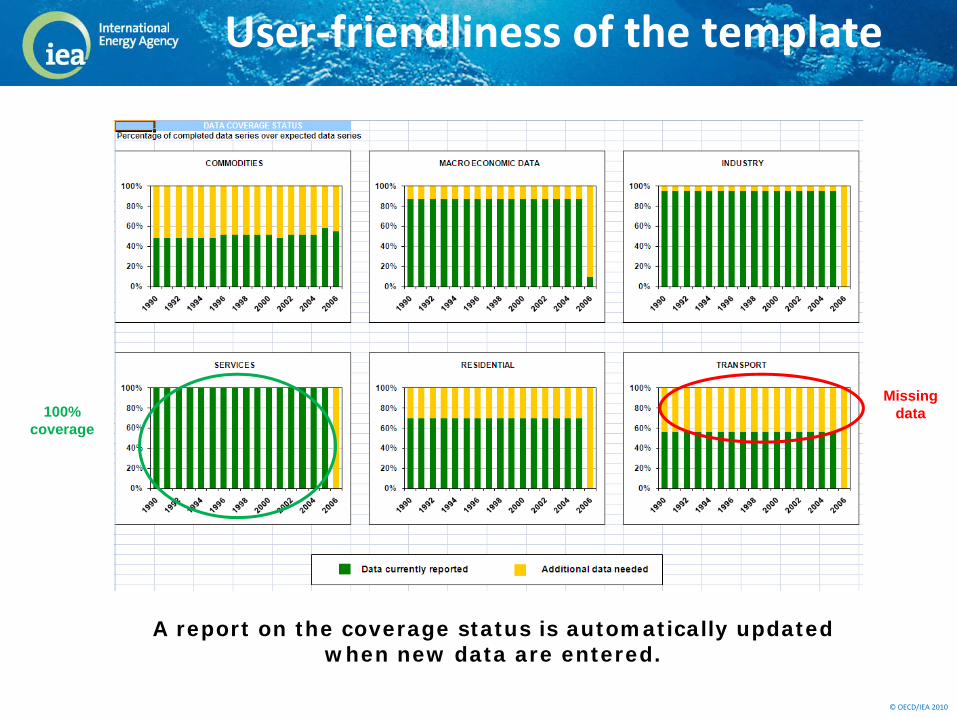
A report on the coverage status is automatically updated when new data are entered.
User‐friendliness of the template
Missing data100%
coverage
© OECD/IEA 2010 © OECD/IEA, 2010
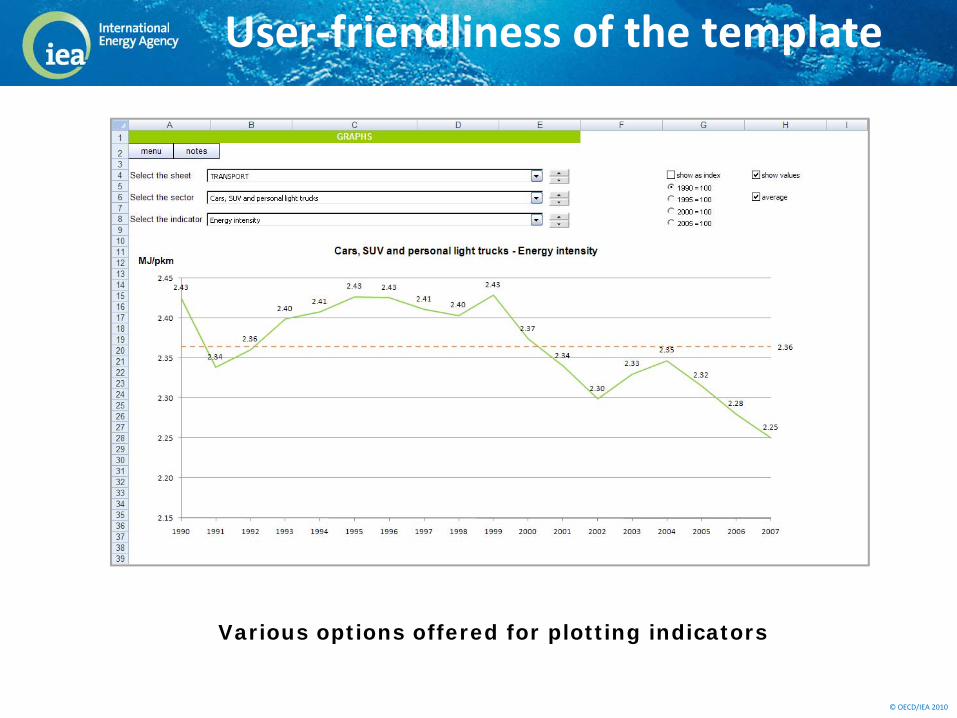
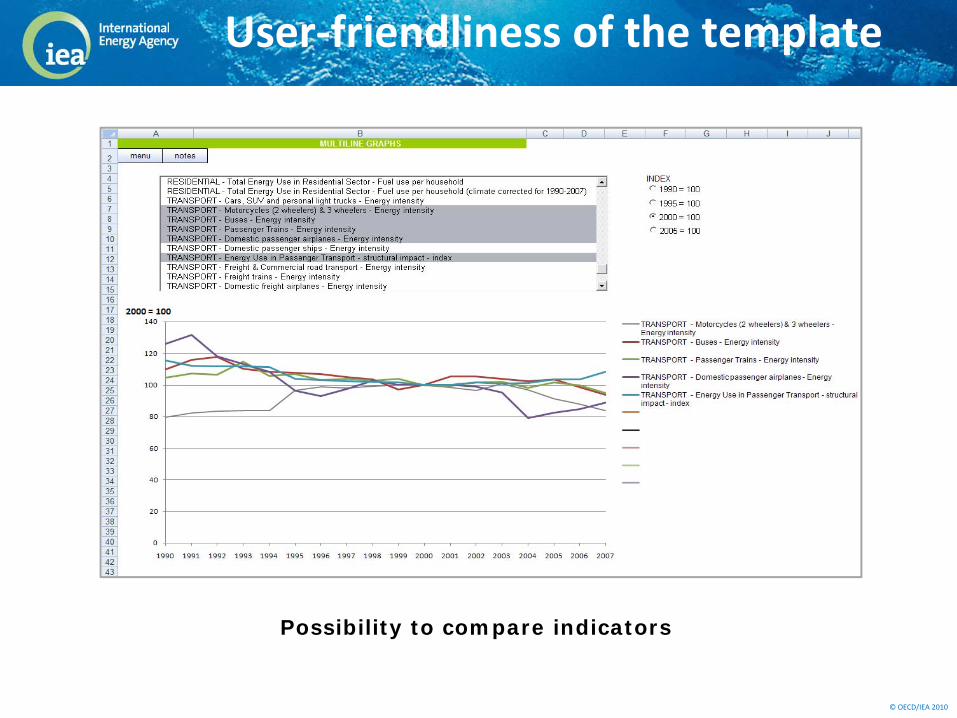
Various options offered for plotting indicators
User‐friendliness of the template
© OECD/IEA 2010 © OECD/IEA, 2010
Possibility to compare indicators
User‐friendliness of the template

© OECD/IEA 2010 © OECD/IEA, 2010
An electronic manual to help
© OECD/IEA 2010 © OECD/IEA, 2010
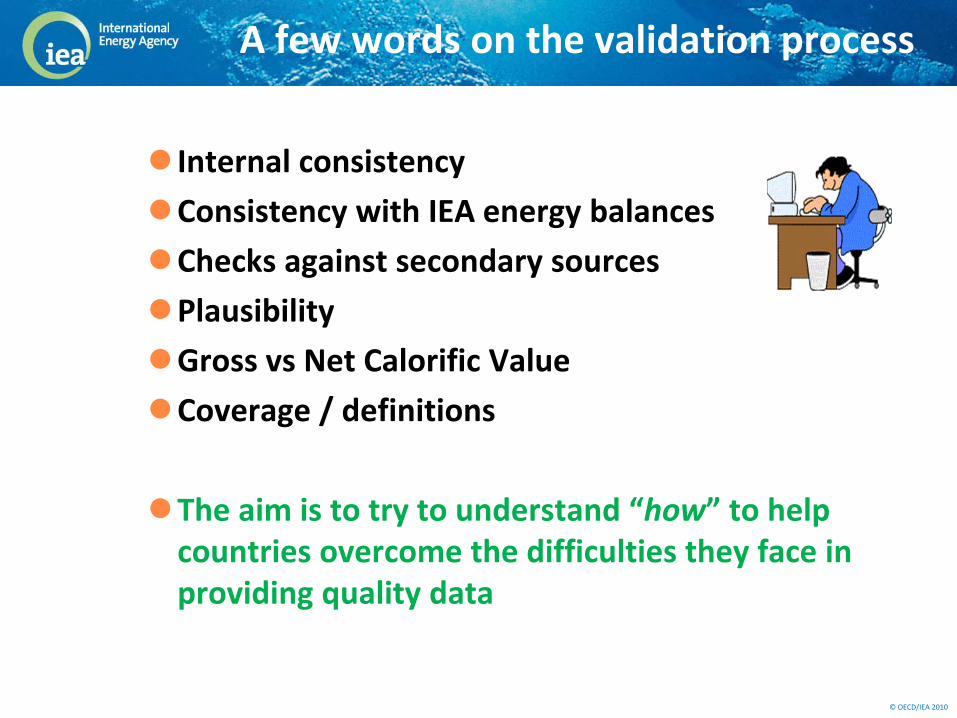
A few words on the validation process
Internal consistency
Consistency with IEA energy balances
Checks against secondary sources
Plausibility
Gross vs Net Calorific Value
Coverage / definitions
The aim is to try to understand “how” to help countries overcome the difficulties they face in providing quality data
© OECD/IEA 2010 © OECD/IEA, 2010
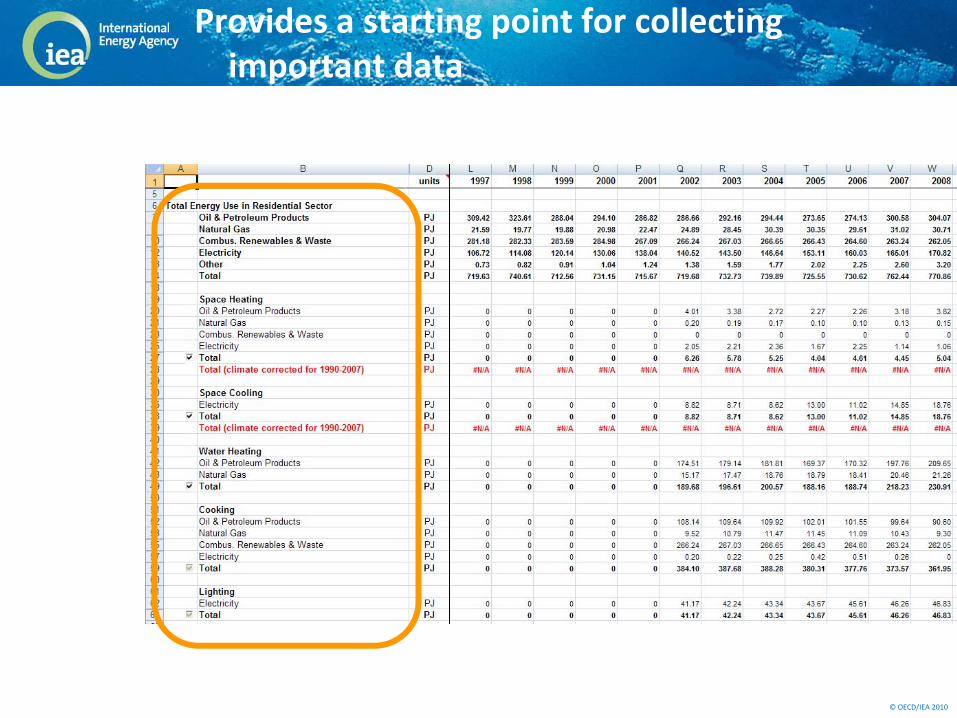
Provides a starting point for collectingimportant data
© OECD/IEA 2010 © OECD/IEA, 2010
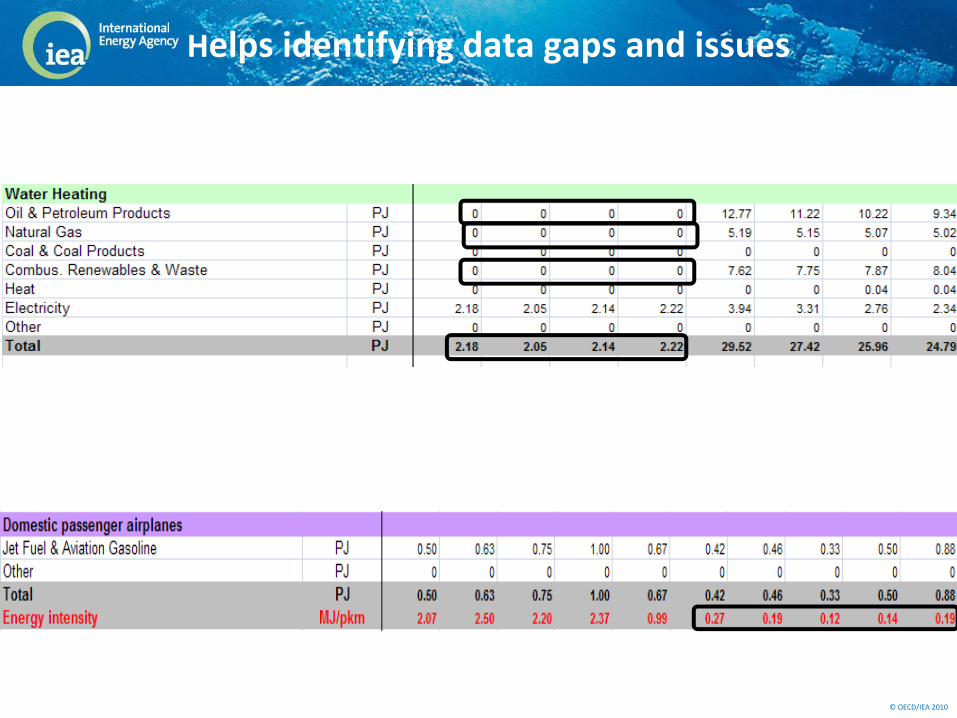
Helps identifying data gaps and issues

© OECD/IEA 2010 © OECD/IEA, 2010
Energy Use in a New Millennium
Worldwide Trends in Energy Use and
Efficiency
Tracking Industrial Energy Efficiency and
CO2 Emissions
Towards a More Energy Efficient Future
Dissemination is essential
The IEA Scoreboard 2011

© OECD/IEA 2010 © OECD/IEA, 2010
Without the savings from improved energy efficiency since 1974 in 11 IEA countries, energy use would now be 63% higher.
0
20
40
60
80
100
120
140
160
180
1974 1976 1978 1980 1982 1984 1986 1988 1990 1992 1994 1996 1998 2000 2002 2004 2006 2008
EJ
Electricity Other Coal Gas Oil Savings
Actual energy use
Hypothetical energy use without energy efficiency improvements Savings
Support to decision makers
63%
© OECD/IEA 2010 © OECD/IEA, 2010
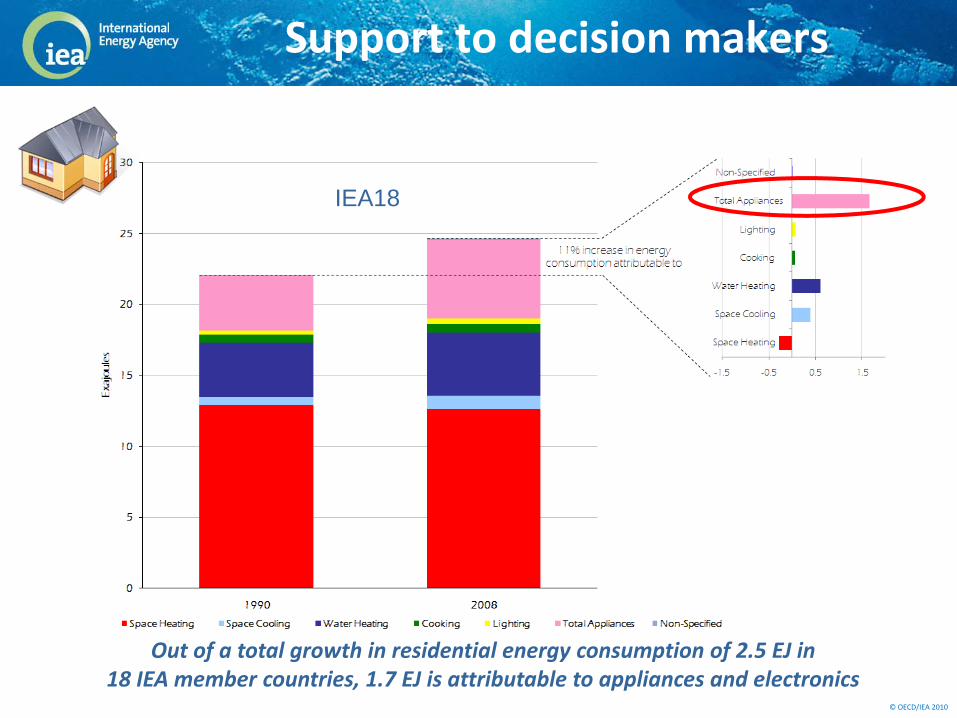
Out of a total growth in residential energy consumption of 2.5 EJ in 18 IEA member countries, 1.7 EJ is attributable to appliances and electronics
IEA18
Support to decision makers
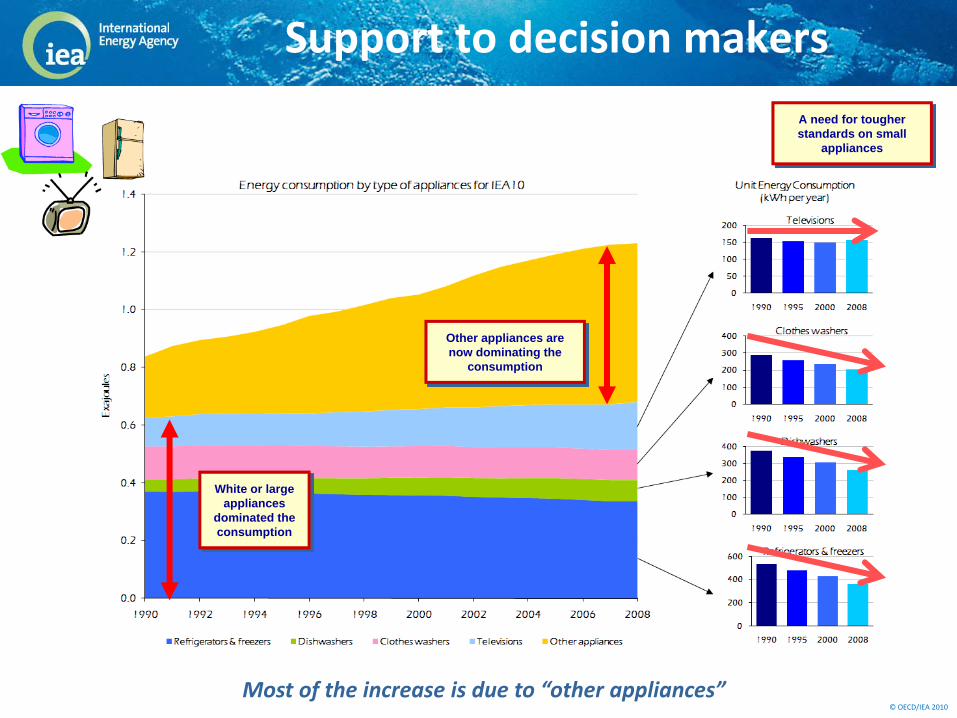
© OECD/IEA 2010 © OECD/IEA, 2010Most of the increase is due to “other appliances”
Support to decision makers
White or large appliances
dominated the consumption
Other appliances are now dominating the
consumption
A need for tougher standards on small
appliances
© OECD/IEA 2010 © OECD/IEA, 2010
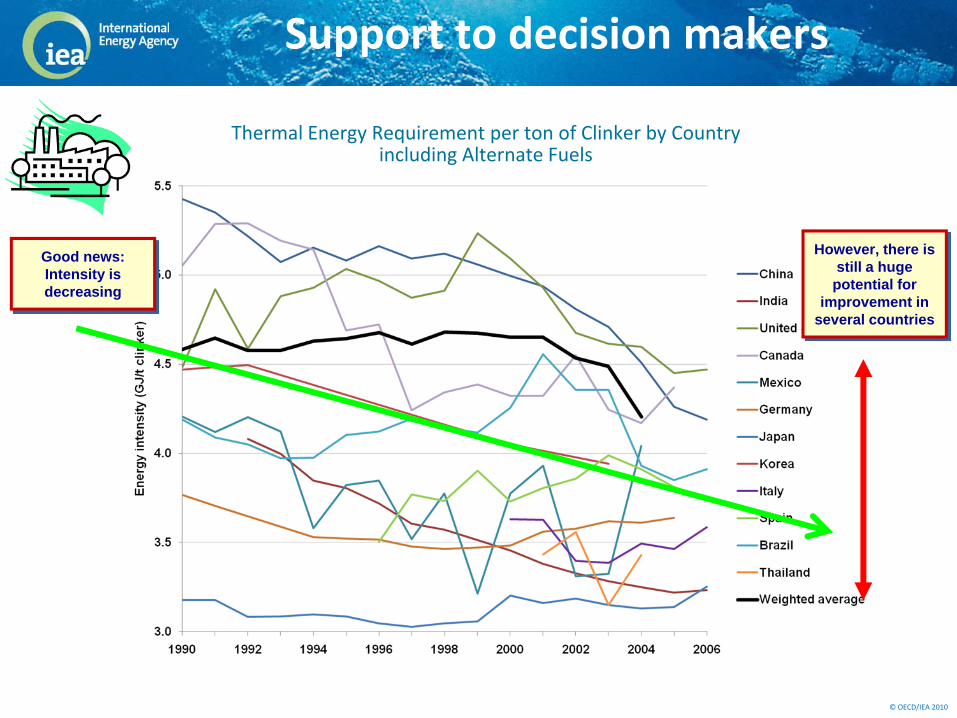
Thermal Energy Requirement per ton of Clinker by Country including Alternate Fuels
Support to decision makers
Good news:Intensity is decreasing
However, there is still a huge
potential for improvement in
several countries

© OECD/IEA 2010 © OECD/IEA, 2010
1.0
1.5
2.0
2.5
3.0
3.5
4.0
4.5
5.0
5.5
6.0
1990 1992 1994 1996 1998 2000 2002 2004 2006 2008
MJ
per t
km
Truck freight energy intensity Norway
Greece
United Kingdom
Japan
New Zealand
United States
Italy
Canada
France
IEA18
Netherlands
Denmark
Switzerland
Sweden
Spain
Finland
Australia
Austria
Germany
Support to decision makers
© OECD/IEA 2010 © OECD/IEA, 2010
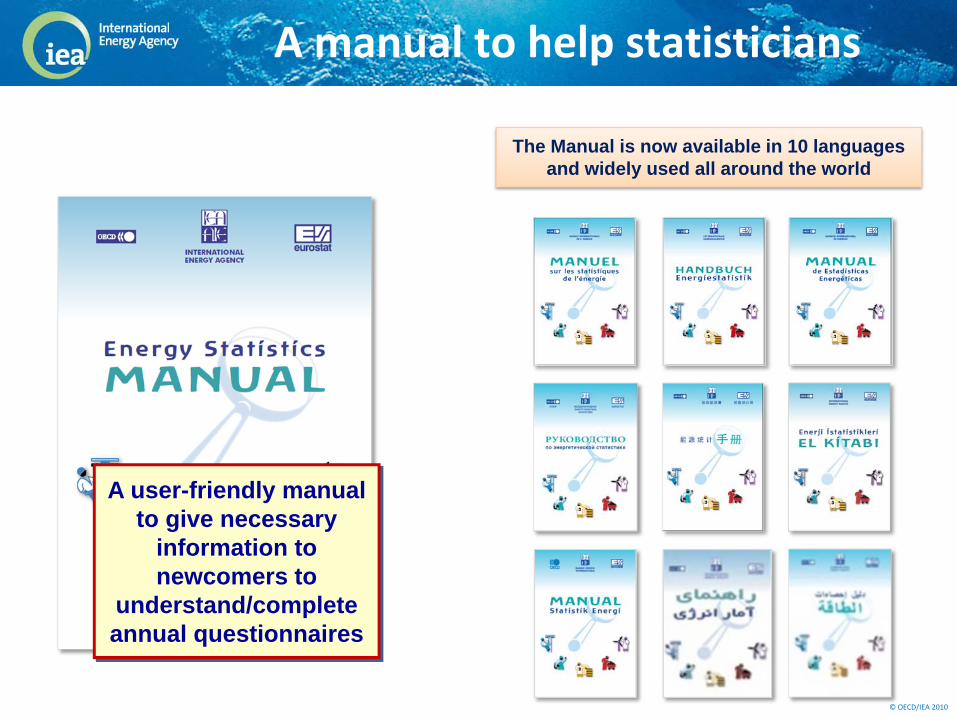
The Manual is now available in 10 languages and widely used all around the world
A manual to help statisticians
A user-friendly manual to give necessary
information to newcomers to
understand/complete annual questionnaires
© OECD/IEA 2010 © OECD/IEA, 2010
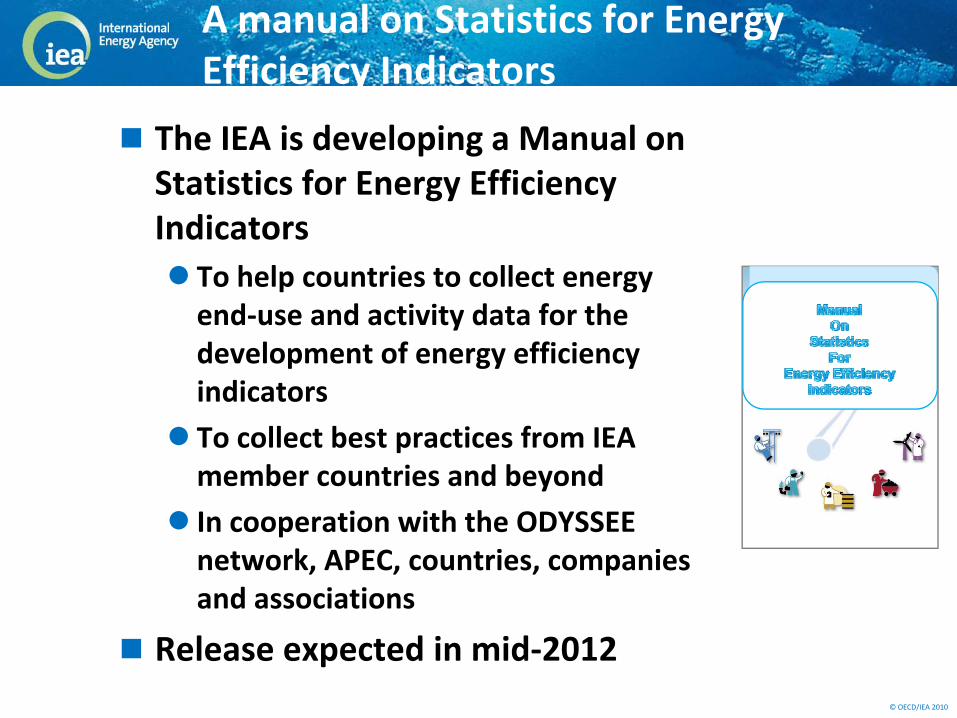
A manual on Statistics for Energy Efficiency Indicators
The IEA is developing a Manual on Statistics for Energy Efficiency Indicators
To help countries to collect energy end‐use and activity data for the development of energy efficiency indicators
To collect best practices from IEA member countries and beyond
In cooperation with the ODYSSEE network, APEC, countries, companies and associations
Release expected in mid‐2012
© OECD/IEA 2010 © OECD/IEA, 2010
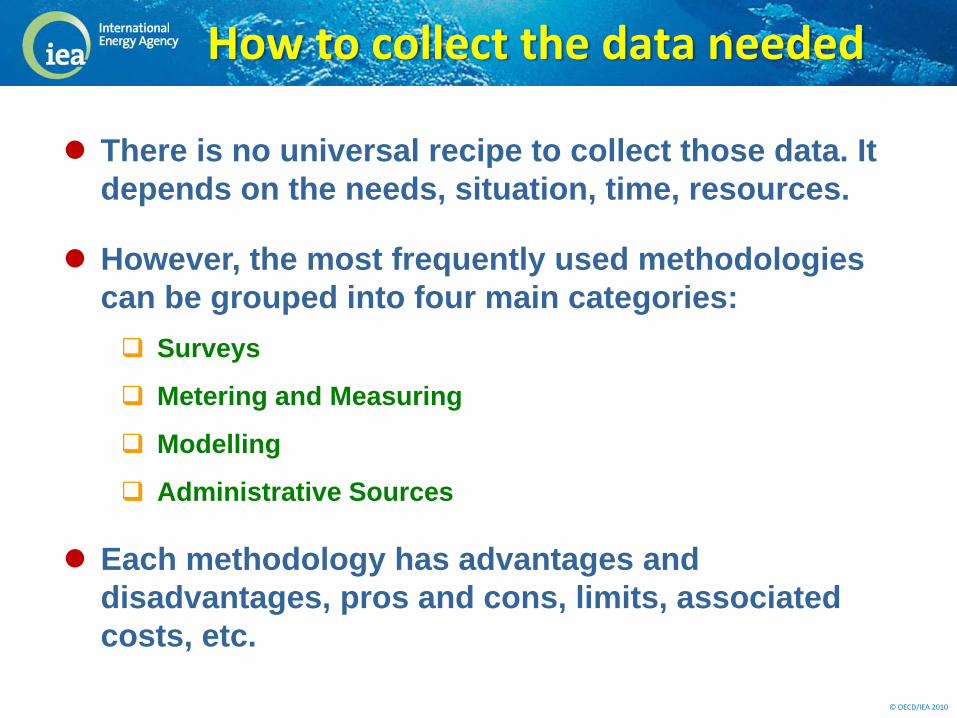
How to collect the data needed
There is no universal recipe to collect those data. It depends on the needs, situation, time, resources.
However, the most frequently used methodologies can be grouped into four main categories:
Surveys
Metering and Measuring
Modelling
Administrative Sources
Each methodology has advantages and disadvantages, pros and cons, limits, associated costs, etc.
© OECD/IEA 2010 © OECD/IEA, 2010
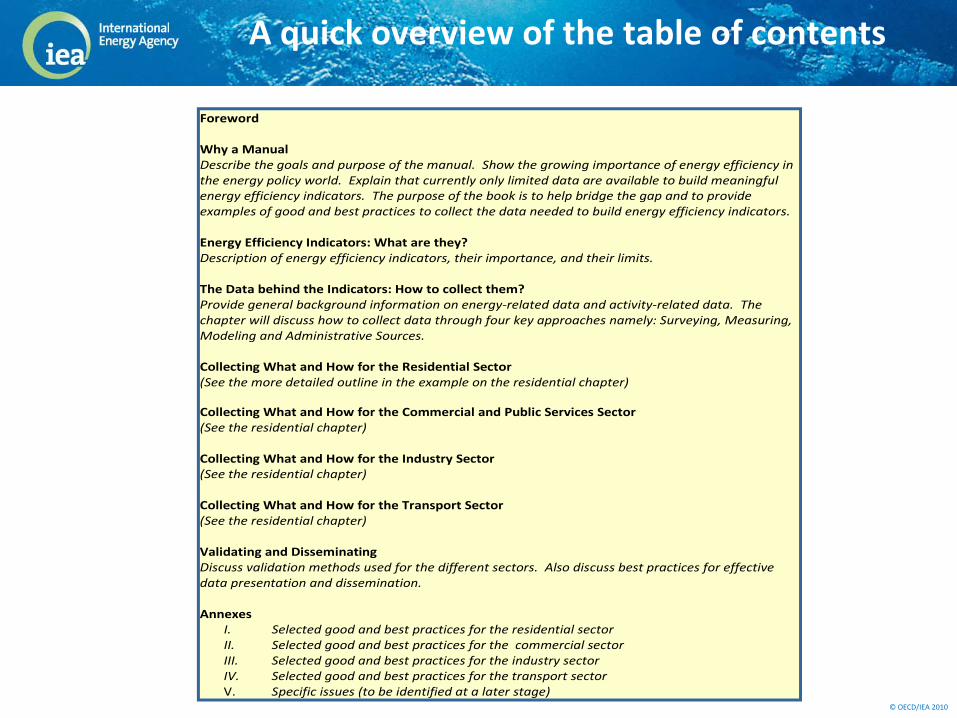
Foreword Why a Manual Describe the goals and purpose of the manual. Show the growing importance of energy efficiency in the energy policy world. Explain that currently only limited data are available to build meaningful energy efficiency indicators. The purpose of the book is to help bridge the gap and to provide examples of good and best practices to collect the data needed to build energy efficiency indicators. Energy Efficiency Indicators: What are they? Description of energy efficiency indicators, their importance, and their limits. The Data behind the Indicators: How to collect them? Provide general background information on energy‐related data and activity‐related data. The chapter will discuss how to collect data through four key approaches namely: Surveying, Measuring, Modeling and Administrative Sources. Collecting What and How for the Residential Sector (See the more detailed outline in the example on the residential chapter)
Collecting What and How for the Commercial and Public Services Sector (See the residential chapter) Collecting What and How for the Industry Sector (See the residential chapter) Collecting What and How for the Transport Sector (See the residential chapter) Validating and Disseminating Discuss validation methods used for the different sectors. Also discuss best practices for effective data presentation and dissemination. Annexes
I. Selected good and best practices for the residential sector II. Selected good and best practices for the commercial sector III. Selected good and best practices for the industry sector IV. Selected good and best practices for the transport sector V. Specific issues (to be identified at a later stage)
A quick overview of the table of contents

© OECD/IEA 2010 © OECD/IEA, 2010
Residential
A chapter at a glance
© OECD/IEA 2010 © OECD/IEA, 2010
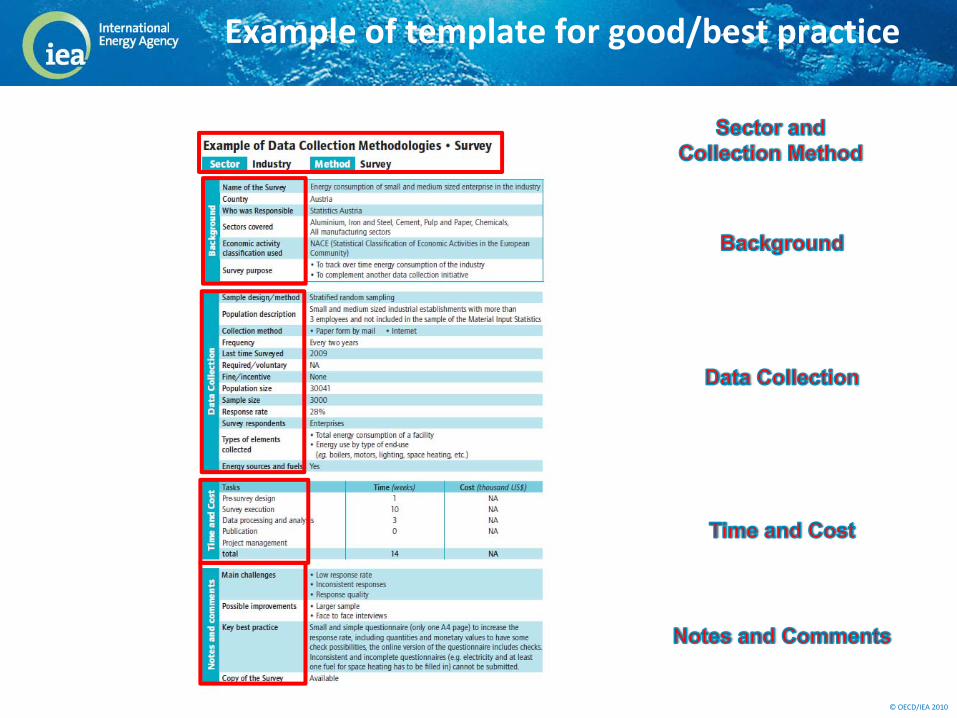
Example of template for good/best practice
© OECD/IEA 2010 © OECD/IEA, 2010
A few words to conclude
Thank you
The plan is to have the Manual complemented by a CD with survey forms, also available on Internet.
The IEA is now collecting statistics for energy efficiency indicators for the year 2009, and is actively working with countries, ODYSSEE, others to improve quality and coverage
The IEA will organise a 2-day workshop on energy efficiency indicators on 14-15 March 2012. Statisticians, Analysts, Policy Makers: The three faces of the same coin.
Cooperation is key to boost energy efficiencies world wide.