Application of defecation lime in paddy field: effects on ... · Application of defecation lime in...
135
Ph.D. in Agricultural Ecology XXV Cycle Application of defecation lime in paddy field: effects on rice (Oryza sativa L.) plants and soil characteristics Ph.D. Thesis Marcello Ermido Chiodini N° R08684 Supervisor Prof. Marco Acutis Academic Year 2011-2012 Coordinator Prof. Graziano Zocchi SCUOLA DI DOTTORATO TERRA, AMBIENTE E BIODIVERSITÀ
-
Upload
hoangnguyet -
Category
Documents
-
view
217 -
download
0
Transcript of Application of defecation lime in paddy field: effects on ... · Application of defecation lime in...

Ph.D. in Agricultural Ecology
XXV Cycle
Application of defecation lime in paddy
field: effects on rice (Oryza sativa L.) plants
and soil characteristics
Ph.D. Thesis
Marcello Ermido Chiodini N° R08684
Supervisor
Prof. Marco Acutis
Academic Year 2011-2012
Coordinator
Prof. Graziano Zocchi
SCUOLA DI DOTTORATO
TERRA, AMBIENTE E BIODIVERSITÀ


Marcello Ermido CHIODINI
Application of defecation lime in paddy
field: effects on rice (Oryza sativa L.) plants
and soil characteristics
Ph. D. Thesis
Department of Agricultural and Environmental Sciences -
Production, Landscape, Agroenergy – University of Milan
Via Celoria 2, 20133 Milan – Italy
Titolo in Italiano: “Applicazione dei gessi di defecazione in
risaia: effetti sulla coltura del riso (Oryza sativa L.) e sulle
caratteristiche del suolo”
Tesi di Dottorato in Ecologia Agraria
XXV Ciclo, Anno Accademico 2011-2012


to my family


Ph.D. in Agricultural Ecology - XXVI Cycle
Marcello Ermido Chiodini
Chiodini, M. E., 2012. Application of defecation lime in paddy field: effects on rice (Oryza sativa L.) plants and soil characteristics. Ph.D. Thesis, University of Milano, 134 pp. This work aimed to evaluate the effects of the defecation lime (DL) at the paddy rice field scale. According to the prescriptions of the Italian D.Lgs (Legislative Decree) no. 75/2010 defecation lime is defined as a “product obtained by the chemical hydrolysis (or enzymatic attack) of biological materials by lime and/or sulphuric acid and subsequent calcium sulphate precipitation.” This product is classified as "lime and magnesia soil conditioner". They must contain at least 20% of calcium oxide (CaO) and 15% of sulphuric anhydride (SO3) both related on a dry basis. According by law origin of the hydrolysed biological material must be reported on the label. Raw biological material for the DL used in this experiment was sewage slugde deriving from municipal and industrial wastewater treatment plant. DL effects were evaluated both during and at the end of growing season, on rice (Oryza sativa L.) plants and soil chemical characteristics. The analysis of the effects was conducted over two year – two growing season – in the same paddy field in order to know also the effects of repeated application of the product. After spreading, incorporation of DL and soil tillage, rice, Volano variety, was immediately seeded by a row seeder. In order to evaluate the effects of depth of incorporation, for the first year DL was placed into soil by plowing instead for the second year by harrowing using a disc harrow.

For the rice plants the analysis were conducted over different variables i.e. number of emerged plants, development stage, aboveground biomass at the harvesting, yield, milling yield and trace metals concentration in grains while for the soil pH, TOC, CEC and trace metals concentration were evaluated.
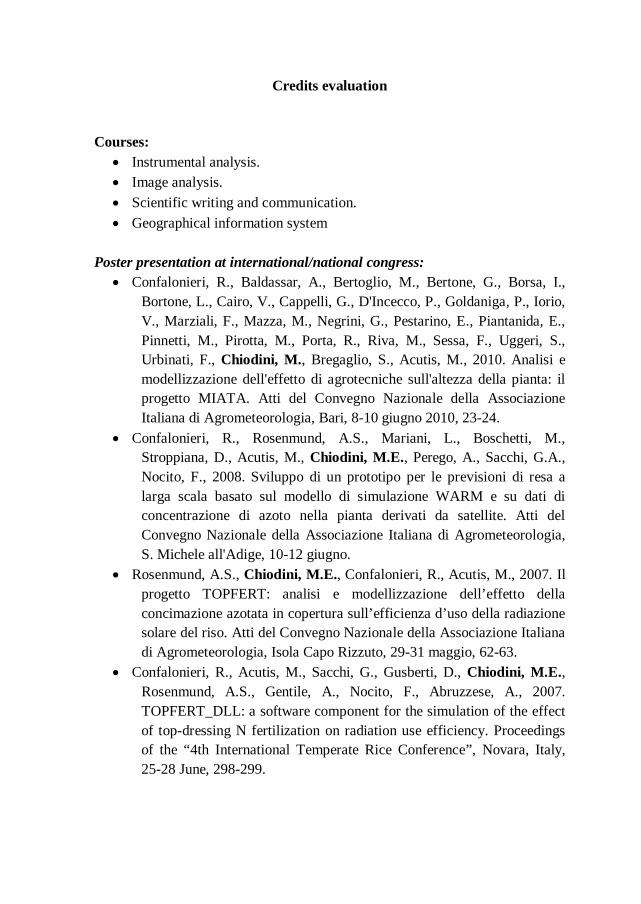
Credits evaluation Courses:
Instrumental analysis. Image analysis. Scientific writing and communication. Geographical information system
Poster presentation at international/national congress:
Confalonieri, R., Baldassar, A., Bertoglio, M., Bertone, G., Borsa, I., Bortone, L., Cairo, V., Cappelli, G., D'Incecco, P., Goldaniga, P., Iorio, V., Marziali, F., Mazza, M., Negrini, G., Pestarino, E., Piantanida, E., Pinnetti, M., Pirotta, M., Porta, R., Riva, M., Sessa, F., Uggeri, S., Urbinati, F., Chiodini, M., Bregaglio, S., Acutis, M., 2010. Analisi e modellizzazione dell'effetto di agrotecniche sull'altezza della pianta: il progetto MIATA. Atti del Convegno Nazionale della Associazione Italiana di Agrometeorologia, Bari, 8-10 giugno 2010, 23-24.
Confalonieri, R., Rosenmund, A.S., Mariani, L., Boschetti, M., Stroppiana, D., Acutis, M., Chiodini, M.E., Perego, A., Sacchi, G.A., Nocito, F., 2008. Sviluppo di un prototipo per le previsioni di resa a larga scala basato sul modello di simulazione WARM e su dati di concentrazione di azoto nella pianta derivati da satellite. Atti del Convegno Nazionale della Associazione Italiana di Agrometeorologia, S. Michele all'Adige, 10-12 giugno.
Rosenmund, A.S., Chiodini, M.E., Confalonieri, R., Acutis, M., 2007. Il progetto TOPFERT: analisi e modellizzazione dell’effetto della concimazione azotata in copertura sull’efficienza d’uso della radiazione solare del riso. Atti del Convegno Nazionale della Associazione Italiana di Agrometeorologia, Isola Capo Rizzuto, 29-31 maggio, 62-63.
Confalonieri, R., Acutis, M., Sacchi, G., Gusberti, D., Chiodini, M.E., Rosenmund, A.S., Gentile, A., Nocito, F., Abruzzese, A., 2007. TOPFERT_DLL: a software component for the simulation of the effect of top-dressing N fertilization on radiation use efficiency. Proceedings of the “4th International Temperate Rice Conference”, Novara, Italy, 25-28 June, 298-299.
Publication: Carozzi M., Ferrara R.M., Fumagalli M., Sanna M., Chiodini M., Perego A.,
Chierichetti A., Brenna S., Rana G., Acutis M., 2012. “Field-scale ammonia emissions from surface spreading of dairy slurry in Po Valley”, Italian Journal of Agrometeorology, 2/2012, 21 pp. (Scopus journal)
Confalonieri, R., Debellini, C., Pirondini, M., Possenti, P., Bergamini, L., Barlassina, G., Bartoli, A., Agostoni, E.G., Appiani, M., Babazadeh, L., Bedin, E., Bignotti, A., Bouca, M., Bulgari, R., Cantore, A., Degradi, D., Facchinetti, D., Fiacchino, D., Frialdi, M., Galuppini, L., Gorrini, C., Gritti, A., Gritti, P., Lonati, S., Martinazzi, D., Messa, C., Minardi, A., Nascimbene, L., Oldani, D., Pasqualini, E., Perazzolo, F., Pirovano, L., Pozzi, L., Rocchetti, G., Rossi, S., Rota, L., Rubaga, N., Russo, G., Sala, J., Seregni, S., Sessa, F., Silvestri, S., Simoncelli, P., Soresi, D., Stemberger, C., Tagliabue, P., Tettamanti, K., Vinci, M., Vittadini, G., Zanimacchia, M., Zenato, O., Zetta, A., Bregaglio, S., Chiodini, M.E., Perego, A., Acutis, M., 2011. “A new approach for determining rice critical nitrogen concentration.” Journal of Agricultural Science, 149, 633-638. (ISI Journal)
Confalonieri, R., Perego, A., Chiodini, M.E., Scaglia, B., Rosenmund, A.S., Acutis, M., 2009. “Analysis of sample size for variables related to plant, soil, and soil microbial respiration in a paddy rice field.” Field Crops Research, 113, 125-130. (ISI Journal)
Rosenmund, A.S., Chiodini, M.E., Acutis, M., Perego, A., Sacchi, G.A., Confalonieri, R., 2009. “Analysis and modelling of the combined effect of plant nitrogen concentration after fertilization and development stage on rice radiation use efficiency”. Italian Journal of Agrometeorology, 3, 5-12. (Scopus journal)

Supervisor:
Prof. Marco ACUTIS University of Milan ,Department of Agricultural and Environmental Sciences - Production, Landscape, Agroenergy, Milan, Italy
Prof. Graziano ZOCCHI University of Milan, Department of Agricultural and Environmental Sciences - Production, Landscape, Agroenergy, Milan, Italy


I wish to thank Prof. Marco Acutis for valuable professional assistance.
I wish to express my gratitude to all my dear colleagues Alessia Perego, Andrea Giussani, Marco Carozzi, Ettore Bernardoni, Mattia Sanna, Mattia Fumagalli, and Lodovico Alfieri for their friendship, help and support.
I’m grateful to Dr. Roberto Confalonieri for giving me the opportunity to help his unit CASSANDRA (Centre for Advanced Simulation Studies AND Researches on Agroecological modelling) and all his researchers for their friendship and support.
I am grateful to my family for their big support in all situations.


CONTENTS:
INTRODUCTION ............................................................................. 19
1.1 DEFECATION LIME ...................................................................................... 20
1.2 DEFECATION LIME PRODUCING PROCESS................................................ 21
1.3 KNOWLEDGE ABOUT DEFECATION LIME UTILIZATION IN
AGRICULTURAL LAND .......................................................................................... 27
1.4 SEWAGE SLUDGE AS DEFECATION LIME RAW MATERIAL ....................... 29
1.5 AIM OF THE PHD THESIS ............................................................................ 36
ANALYSIS OF SAMPLE SIZE FOR VARIABLES RELATED TO PLANT, SOIL, AND SOIL MICROBIAL RESPIRATION IN A PADDY RICE FIELD ....................................................................... 38
ABSTRACT ............................................................................................................. 39
2.1 INTRODUCTION ........................................................................................... 41
2.2 MATERIAL AND METHODS ......................................................................... 44
2.2.1 Experimental data ............................................................................... 44
2.2.2 The visual jackknife ............................................................................. 45
2.2.3 Sample size determination ................................................................. 47
2.2.3.1 Plant-related variables....................................................................... 47
2.2.3.2 Soil variables ..................................................................................... 47
2.2.3.3 Data pre-processing .......................................................................... 51
2.3 RESULTS AND DISCUSSION ......................................................................... 53
2.3.1 Preliminary analysis ............................................................................. 53
2.3.2 Plant-related variables ......................................................................... 53
2.3.3 Soil variables ......................................................................................... 55
2.4 CONCLUSIONS .............................................................................................. 56
APPLICATION OF DEFECATION LIME IN PADDY FIELD: EFFECTS ON SOIL CHEMICAL PROPERTIES .......................... 59

ABSTRACT .............................................................................................................. 60
3.1 INTRODUCTION ............................................................................................ 61
3.2 MATERIALS AND METHOD ......................................................................... 64
3.2.1 Experimental field and design ........................................................... 64
3.2.2 Defecation lime used in the experiment ........................................... 68
3.2.3 Soil sampling and characterization .................................................... 70
3.2.4 Statistical analysis ................................................................................. 72
3.3 RESULTS......................................................................................................... 73
3.3.1 First year ................................................................................................ 73
3.3.2 Second year ........................................................................................... 77
3.4 DISCUSSION .................................................................................................. 80
3.5 CONCLUSIONS .............................................................................................. 87
APPLICATION OF DEFECATION LIME IN PADDY FIELD: EFFECTS ON RICE (ORYZA SATIVA L.) PLANTS ................... 89
ABSTRACT .............................................................................................................. 90
4.1 INTRODUCTION ............................................................................................ 91
4.2 MATERIAL AND METHODS .......................................................................... 94
4.2.1 Paddy field and experimental design................................................. 94
4.2.2 Rice variety............................................................................................ 98
4.2.3 Defecation lime used in the experiment ........................................... 98
4.2.4 Variables under analysis .................................................................... 101
4.2.5 Statistical analysis ............................................................................... 103
4.3 RESULTS....................................................................................................... 104
4.3.1 First year .............................................................................................. 104
4.3.2 Second year ......................................................................................... 108
4.4 DISCUSSIONS ............................................................................................... 111
4.5 CONCLUSIONS ............................................................................................ 114
CONCLUSIONS ............................................................................. 117

REFERENCES ................................................................................ 121


19
Chapter 1
INTRODUCTION

GENERAL INTRODUCTION
20
1.1 Defecation lime
Defecation lime, known also as defecation gypsum, is a material used
as agricultural soil conditioner and obtained from liquid and solid
biomass, such as the by-products of industrial processes i.e. wastes from
paper making plants, sugar factories, and slaughterhouses (European
Patent Office).
According to the prescriptions of the Italian D.Lgs (Legislative
Decree) no. 75/2010 defecation lime is defined as a “product obtained by
the chemical hydrolysis (or enzymatic attack) of biological materials by
lime and/or sulphuric acid and subsequent calcium sulphate
precipitation.” This product is classified as "lime and magnesia soil
conditioner". They must contain at least 20% of calcium oxide (CaO) and
15% of sulphuric anhydride (SO3) both related on a dry basis. According
by law origin of the hydrolysed biological material must be reported on
the label.
Chemical hydrolysis reactions leads to a break-up of the peptide bonds
of the protein, with the result of the formation of fragments
corresponding to peptides. If the reaction is driven on further, a break-up
of all the peptide bonds and a release of amino-acids will ensue
(European Patent Office).

Chapter 1
21
1.2 Defecation lime producing process
European Patent Application - EP 2 135 854 A2 – define the “process
for the production of defecation lime, named here defecation gypsum, for
agricultural use”. This patent application refers to a process for the
production of the agricultural soil conditioner registered as defecation
gypsum, in various possible formulations, by alkaline hydrolysis with a
calcium chemical selected form from calcium oxide and calcium
hydroxide, of showable biological sludges and other proteic non
dangerous, nontoxic and non noxious organic wastes to obtaining amino-
acids and partly peptides. Hydrolysis reactions is stopped at a given time
and pH value in order to avoid the degradation of the amino acids and is
followed by the precipitation, through addition of sulphuric acid, of the
calcium sulphate dihydrate intimately bound with particles of hydrolysed
organic matter. During this process pathogenic organisms and
microorganisms are killed. Trace metals concentration into defecation
gypsum must be lower than stated by law or regulation limits (Bobbiesi,
2009).
The process essentially consists of two stages: a first stage with an
alkaline hydrolysis of the raw sludge, and a second stage with a
precipitation of calcium sulphate dihydrate, intimately linked to particles
of organic matter, which actually constitutes the defecation gypsum.
The first stage starts from a selected biological sludge or
organic wastes. The hydrolysis reaction of the proteic material
occurs over to 12 - 24 hours and the temperature is checked and
maintained in a range from 40 to 60°C. The selected form of

GENERAL INTRODUCTION
22
calcium is added in a sufficient quantity to ensure 20 - 22%
concentration of CaO at the end of the process. Hydrolysis
reaction started into the mixer but is completed on the storage
pad, so is not necessary provide a mixers having extremely
large size respect to the volumes of gypsum produced.
Arranging the material on a pad also allows a better chance of
monitoring the temperature and maintaining it within limits, if
necessary, by simply turning the material over with a
mechanical shovel. The first reaction that occurs is the
following:
CaO + H2O → Ca(OH)2 + heat
The relatively high pH value uphold for a period of 12 - 24
hours involves eliminating pathogenic organisms and
microorganisms and preconditioning the product, to become an
excellent nutritional basis for a useful microflora, which is also
well suited for an enriching, if any, with a microflora
specialized for agronomic useful activities.
In the second stage occurs a fast kinetic reaction having an
exothermic nature. The addition of the acid is done on the
hydrolysed mass, obtained as above, by mixing it in a mixer.
The temperature of the process is checked and maintained
around 40 - 50°C in order to avoid the degradation of the
organic matter. The sulphuric acid is used in diluted form,

Chapter 1
23
about 33%, to avoid an excessively rapid kinetic and allow the
reaction to be more easily controlled. Also in this case, the
reaction started in the mixer is completed on a pad where, if
needed, the mass could be turned over with a mechanical
shovel. The main reaction occurring is:
Ca(OH)2+ H2SO4 → CaSO4*2H2O + heat
In the second stage, concerning the water content, there is a
slight addition due to the diluted sulphuric acid used. However
this addition cannot compensate the water removed in the
foregoing stage, so the final result of the process is a reduction
of the initial content respect to the original raw materials.
(Bobbiesi, 2009)
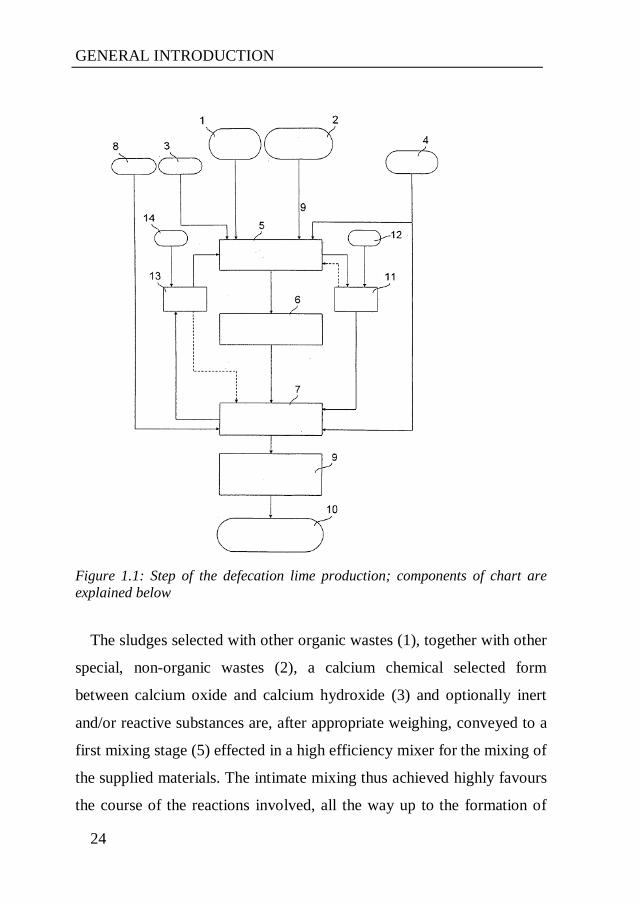
Figure 1.1 reported the diagram of the production process of the
defecation lime, according the European Patent application defined
above:
GENERAL INTRODUCTION
24
Figure 1.1: Step of the defecation lime production; components of chart are explained below
The sludges selected with other organic wastes (1), together with other
special, non-organic wastes (2), a calcium chemical selected form
between calcium oxide and calcium hydroxide (3) and optionally inert
and/or reactive substances are, after appropriate weighing, conveyed to a
first mixing stage (5) effected in a high efficiency mixer for the mixing of
the supplied materials. The intimate mixing thus achieved highly favours
the course of the reactions involved, all the way up to the formation of
Chapter 1
25
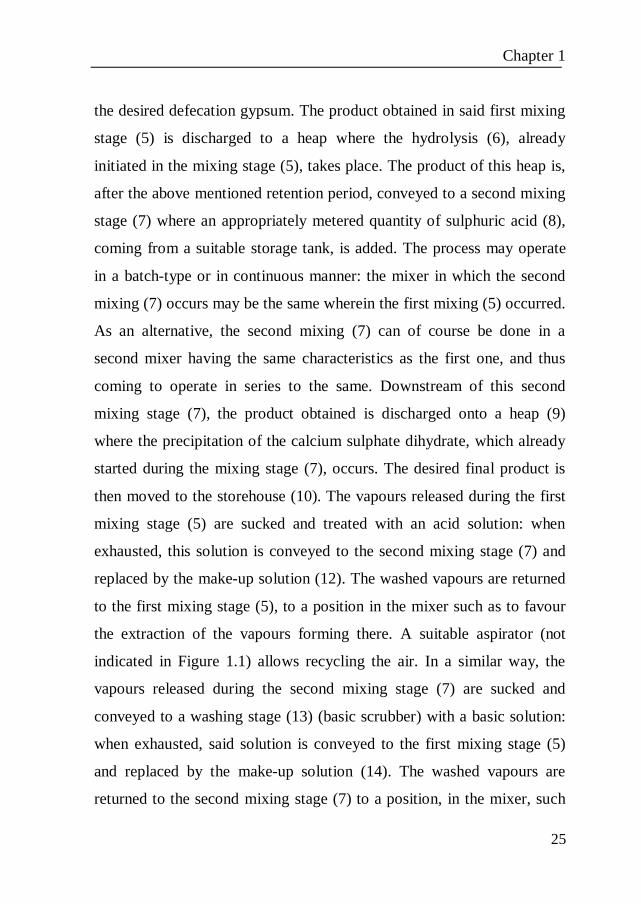
the desired defecation gypsum. The product obtained in said first mixing
stage (5) is discharged to a heap where the hydrolysis (6), already
initiated in the mixing stage (5), takes place. The product of this heap is,
after the above mentioned retention period, conveyed to a second mixing
stage (7) where an appropriately metered quantity of sulphuric acid (8),
coming from a suitable storage tank, is added. The process may operate
in a batch-type or in continuous manner: the mixer in which the second
mixing (7) occurs may be the same wherein the first mixing (5) occurred.
As an alternative, the second mixing (7) can of course be done in a
second mixer having the same characteristics as the first one, and thus
coming to operate in series to the same. Downstream of this second
mixing stage (7), the product obtained is discharged onto a heap (9)
where the precipitation of the calcium sulphate dihydrate, which already
started during the mixing stage (7), occurs. The desired final product is
then moved to the storehouse (10). The vapours released during the first
mixing stage (5) are sucked and treated with an acid solution: when
exhausted, this solution is conveyed to the second mixing stage (7) and
replaced by the make-up solution (12). The washed vapours are returned
to the first mixing stage (5), to a position in the mixer such as to favour
the extraction of the vapours forming there. A suitable aspirator (not
indicated in Figure 1.1) allows recycling the air. In a similar way, the
vapours released during the second mixing stage (7) are sucked and
conveyed to a washing stage (13) (basic scrubber) with a basic solution:
when exhausted, said solution is conveyed to the first mixing stage (5)
and replaced by the make-up solution (14). The washed vapours are
returned to the second mixing stage (7) to a position, in the mixer, such

GENERAL INTRODUCTION
26
as to favour the extraction of the vapours forming there. A suitable
aspirator (not shown in Figure 1.1) allows recycling the air. If the two
mixing stages (5) and (7) occur in the same mixer at different times, the
aspirator is a single unit. If the two mixing stages are on the other hand
occurring in two different mixers, the aspirators are two, one for each
mixer. According to the plant capacity the mixers of the mixing stages
(5) and (7) may also be more than two, also operating in parallel.
A comparable method to obtained defecation lime is included into the
patent registered in the United States Patent and Trademark Office. This
invention relates to methods for treating wastewater sludge cake with
acid and calcium carbonate under acidic, low heat conditions, to produce
a stable, soil-like or granular, finished product containing calcium
carbonate, useful as a nitrogen fertilizer, synthetic soil component or soil
conditioner for pH control (Burnham 1992).
Finally, is possible to find that defecation lime are also produced from
sugar industry plant at the purification stage of raw juice by milk of lime
and CO2 (Baraldi et al., 2006; González-Fernándezet al., 2004;
Paleckienė, et al., 2007).

Chapter 1
27
1.3 Knowledge about defecation lime utilization in
agricultural land
Little information was found about the effects following the defecation
lime disposal.
Most of them are relate to the utilization of the defecation lime derived
from sugar industry, named sugar factory lime (SFL).
González-Fernández et al. (2004) carried out a study to assay the SFL
behaviour as an amendment material for an acid soil. Sugar factory
refuse lime (SFRL) result from the purification-flocculation of colloid
matter from the liquor extracted from sugar beet. In the process, slaked
lime and carbon dioxide are used to purify the liquors. The composition
varies in accordance with that of the limestone used in the manufacture
of slaked lime. SFRL is the residue of these materials together with
notable amounts of organic matter and micronutrients. In that work a
finely pulverized dolomitic lime was used as a reference. Throughout six
years and six crops it was observed how, in the plots amended with lime
refuse, a slightly higher pH was maintained than that measured in the
plots without lime, and with fewer fluctuations. At the end of their work
they reported as SFRL had an effective correction effect, whose
beneficial effects last for at least 9 years. They reported as the persistence
of the effects of SFRL is greater than that shown by traditional liming
materials such as dolomitic lime and its physical and chemical properties
make it a valuable and efficient substitute for those other liming
materials.

GENERAL INTRODUCTION
28
Data on sugar factory lime used for liming the soils are found also in
other works: Moore et al., 2000; Lutin et al., 2002, Timmer, 2003;
Wargo, 2002.
Paleckienė et al. (2007) also remember in their work that calcium is
one of the main secondary nutrients necessary for healthy plant growth.
Due to the presence of calcium, SFL is interesting as a calcium
compound for fertilizer production or liming soils. Unfortunately, data
concerning the use of SFL as calcium compound for production of
compound fertilizers are lacking. Nitrogen, phosphorus, sodium,
magnesium and other elements used for plant fertilization are an
advantage of SFL chemical composition. Also into the European Patent
Application EP 2 135 854 A2, is reported that a process for the
preparation of defecation gypsum having high agronomic interest due to
its high content of calcium and organic substances, such as amino acids
and peptides, practically free from pathogenic substances and its different
formulations from biological sludges and/or from other waste materials
(European Patent Office).
In their study Paleckienė et al. (2007) analysed the usability for
manufacturing granulated fertilizers containing calcium by using SFL.
The results of investigations show, that waste from the beet sugar
industry may be used in production of compound fertilizers as a calcium
source. The results obtained are notable for environmental protection and
plant fertilization.
Chapter 1
29
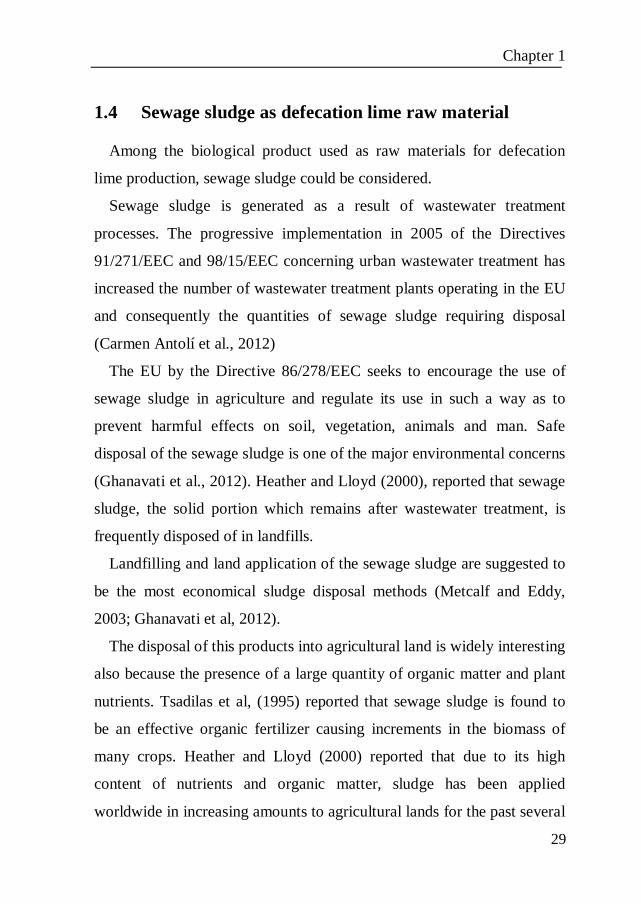
1.4 Sewage sludge as defecation lime raw material
Among the biological product used as raw materials for defecation
lime production, sewage sludge could be considered.
Sewage sludge is generated as a result of wastewater treatment
processes. The progressive implementation in 2005 of the Directives
91/271/EEC and 98/15/EEC concerning urban wastewater treatment has
increased the number of wastewater treatment plants operating in the EU
and consequently the quantities of sewage sludge requiring disposal
(Carmen Antolí et al., 2012)
The EU by the Directive 86/278/EEC seeks to encourage the use of
sewage sludge in agriculture and regulate its use in such a way as to
prevent harmful effects on soil, vegetation, animals and man. Safe
disposal of the sewage sludge is one of the major environmental concerns
(Ghanavati et al., 2012). Heather and Lloyd (2000), reported that sewage
sludge, the solid portion which remains after wastewater treatment, is
frequently disposed of in landfills.
Landfilling and land application of the sewage sludge are suggested to
be the most economical sludge disposal methods (Metcalf and Eddy,
2003; Ghanavati et al, 2012).
The disposal of this products into agricultural land is widely interesting
also because the presence of a large quantity of organic matter and plant
nutrients. Tsadilas et al, (1995) reported that sewage sludge is found to
be an effective organic fertilizer causing increments in the biomass of
many crops. Heather and Lloyd (2000) reported that due to its high
content of nutrients and organic matter, sludge has been applied
worldwide in increasing amounts to agricultural lands for the past several

GENERAL INTRODUCTION
30
decades. Even, according to different works (García et al., 2000; García-
Gil et al., 2004; Fernández et al., 2009, Martinez et al., 2003) sewage
sludge are defined as organic C-rich materials produced during
wastewater treatment and represent a source of organic matter, nitrogen,
phosphorus and other nutrients, which, if properly managed, can be used
to improve organic fertility in intensively cropped degraded soils of
Mediterranean climate zone.
About the effects of sewage sludge on soil biological characteristics
Baneriee et al. (1997) reported that the analysis of the size and functional
diversity of the soil microbial population indicate that sludge application
resulted in a microbial population of reduced diversity but of equal or
greater total biomass. The increased size of the soil microbial biomass
was accompanied with unchanged or increased potential enzyme activity.
Thus, although the sludge application affected the biology of the soil,
there appeared to be little or no negative effects on the biochemical
pathways related to nutrient cycling (N, P and S mineralization).
According to Gibbs et al. (2006), the sludge cake applications generally
increased soil microbial biomass C and soil respiration rates, whilst most
probable numbers of clover Rhizobium were generally unchanged.
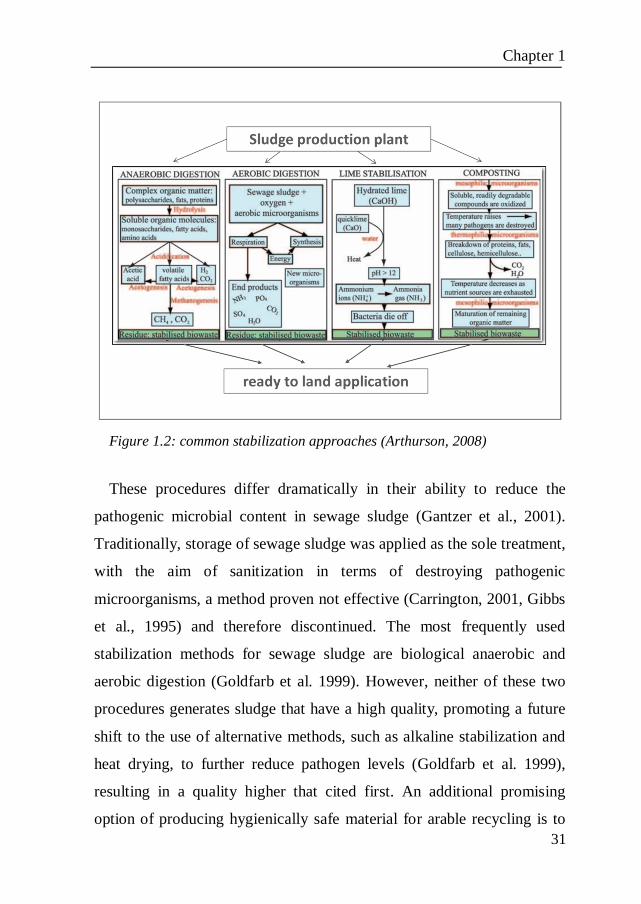
Prior to land application, sewage sludge needs to be stabilized (Figure
1.2). The stabilization procedure commonly reduces organic matter and
water content, emission of unpleasant odors, and concentrations of
pathogenic microorganisms (Straub et al., 1993). Common stabilization
approaches include anaerobic (mesophilic or thermophilic) and aerobic
digestion, lime stabilization, composting, and heat drying (Goldfarb et al.
1999).
Chapter 1
31
Figure 1.2: common stabilization approaches (Arthurson, 2008)
These procedures differ dramatically in their ability to reduce the
pathogenic microbial content in sewage sludge (Gantzer et al., 2001).
Traditionally, storage of sewage sludge was applied as the sole treatment,
with the aim of sanitization in terms of destroying pathogenic
microorganisms, a method proven not effective (Carrington, 2001, Gibbs
et al., 1995) and therefore discontinued. The most frequently used
stabilization methods for sewage sludge are biological anaerobic and
aerobic digestion (Goldfarb et al. 1999). However, neither of these two
procedures generates sludge that have a high quality, promoting a future
shift to the use of alternative methods, such as alkaline stabilization and
heat drying, to further reduce pathogen levels (Goldfarb et al. 1999),
resulting in a quality higher that cited first. An additional promising
option of producing hygienically safe material for arable recycling is to
GENERAL INTRODUCTION
32
combine stabilization procedures, such as digestion, with pasteurization
or liquid composting.
As well as the emission of unpleasant odors and concentrations of
pathogenic microorganisms the presence of trace metals is another
problem related to the sewage sludge disposal into agricultural land.
Characteristics of sewage sludge depend upon the quality of sewage and
type of treatment processes followed (Singh and Agrawal, 2008). Sewage
sludge may contain high levels of toxic metals such as Pb, Cd, Ni, Cr,
Hg, etc. due to the mixing of industrial wastewater with sewage (Mc
Grath et al., 2000; Przewrocki et al, 2004; Dai et al, 2006; Singh and
Agrawal, 2007, Stephen, 2009). Besides heavy metals, other harmful
toxics such as pharmaceuticals, detergents, various salts, pesticides, toxic
organics, flame retardants and hormone disruptorscan also be present in
the sewage sludge (Antonious et al., 2003; Aparicio et al., 2007; Singh
and Agrawal, 2008; Sánchez-Brunete et al., 2008).
The numerous trace metal contaminants in sewage sludge are either
non-essential in plant metabolism such as Cd, Cr, Hg, Ni, Pb or essential
in only trace quantities such as Cu, Fe, and Zn . These trace metals,
which are difficult to remove, are the most significant restraint relative to
land application of sludges and can often negate the benefits of land
application (Heather and Lloyd, 2000).
There are social and legal concerns of uncontrolled use of sewage
sludge for agriculture due to potential problems of elevated transfer of
heavy metals to the food chain (Page et al., 1987), causing threat to
human health (Wang et al., 2003). Heavy metal contamination in soil and
groundwater may represent a long term threat for the environment and
Chapter 1
33
man (Ross, 1994; Baveye et al., 1999). Absorption, accumulation and
tolerance to heavy metals may vary between different crops and at
different levels of sewage sludge amendments (Bhogal et al., 2003;
Garrido et al., 2005; Lavado, 2006; Singh and Agrawal, 2008). Crop
plants may develop adaptive response to tolerate the heavy metal stress.
According to these problems is important to find a way to reduce the
uptake of trace metals by plants.
Various methods have been developed for the remediation of heavy
metal contaminated sites (e.g. Davis et al., 1999; Yoshizaki and Tomida,
2000). Therefore, the study of effective methods for heavy metal removal
from sludge is very important to minimize the prospective health risk
during application (Lasheen et al., 2000). The solubility or bioavailability
of trace and toxic metals from sewage sludge is based on soil pH, soil
cation exchange capacity, soil organic material, and soil water-holding
capacity (Jamali et al, 2008). One approach to reduce the availability of
heavy metals to plants is to decrease the concentrations of the available
chemical species through increasing pH of compost (Petruzzelli, 1989;
Ciavatta et al., 1993). Co-composting of solid waste with alkaline
materials, such as bauxite residue, clay, and coal fly ash, has been carried
out with the purpose of reducing the availability of heavy metals in
compost and to supplement certain trace elements for plant growth (Qiao
and Ho, 1997; Wong et al., 1997). Peles et al. (1998) found that Zn, Cu,
Cd, and Pb contents in various species of crop are significantly lower in
plants collected from the limed sludge compared to the unlimed sludge
treated plots. An increase in Cu mobility caused by lime treatment of
sewage sludge has been reported (Hsiau and Lo, 1998).

GENERAL INTRODUCTION
34
Jamali et al, (2008) reported that sludge amendment enhanced the dry
weight yield of maize and the increase was more obvious for the soil with
lime treatment. Liming the sewage sludge reduced the trace and toxic
metal contents in the grain tissues, except Cu and Cd, which were below
the permissible limits of these metals. This experiment demonstrates that
liming was an important factor in facilitating the growth of maize in
sludge-amended soil.
Also liming the soil reduces the bioavailability of metal for the plants
uptake (Brallier S. et al., 1996; Fang and Wong, 1999; Krebs et al.,
1998). Liming is a common practice in agriculture to maintain optimal
soil pH, and has also been used to reduce the solubility of trace and toxic
metals (Jamali et al, 2008). Speir.et al 2003 experiment results show that
an intensive liming programme substantially raised soil pH values and
resulted in much lower concentrations of metals in soil solution, in plant
material and in groundwater.
The production of defecation lime from sewage sludge has acquired
more importance after the D.G.R (regional decree) 9953/09 with which
was limited the use of sewage sludge in agriculture.
Starting from 2011 for nitrate vulnerable zone (NVZ) and from 2013
for non nitrate vulnerable zone (nNVZ), the regional decree banned the
industrial and municipal sewage sludge disposal; no restriction about
sewage sludge originated from waste of food processing industries were
defined. In order to remove this restrictions, the most important
association, society and plants involved in sewage sludge management
Chapter 1
35
did an appeal to the Lombardy Regional Administrative Court (TAR of
Lombardy).
At the end of legal dispute by the verdict n° 02822/2009 the restriction
was repeal.
Despite is still possible to dispose this product, the defecation lime
production starting from sewage sludge have a primarily importance. As
reported above (chapter 1.2), the production of defecation lime is based,
beside of sulphuric acid, to the addition to the raw material of lime.
Based on the knowledge reported, the addition of lime is able to stabilize
and hygienize the product and represent a valuable option to reduce the
amount of plant available trace metals. Furthermore they could also be
used to regulate the soil pH.
Unfortunately, no references are found on defecation lime made from
sewage sludge and their effects following the agricultural land disposal.
Due to lack of knowledge about defecation lime application and
positive effects presented above of the lime addition to sewage sludge,
carrying out some study seem to be a valuable aspect.

GENERAL INTRODUCTION
36
1.5 Aim of the PhD thesis
According to the information reported in the previous chapters this
PhD thesis was done to evaluate the effects of the defecation lime applied
to agricultural land.
The experiment was carried out over two years in a paddy field located
not far from the defecation lime production plant.
In this work were analysed both soil and plant variables at the start, at
the end and during the growing seasons.
In order to collect the different samples of soil and plants a specific
research works (Confalonieri et al 2007, Confalonieri et al. 2009) were
previously done and the knowledge collected were then used.

38
Chapter 2
Analysis of sample size for variables related to
plant, soil, and soil microbial respiration in a paddy
rice field
Keywords. Visual jackknife, Resampling, Pre-sampling, Oryza sativa L.,
SISSI
39
Abstract
Pre-samplings for sample size determination are strongly
recommended to assure the reliability of collected data. However, there is
a certain dearth of references about sample size determination in field
experiments. Seldom if ever, differences in sample size were identified
under different management conditions, plant traits, varieties grown and
crop age. In order to analyse any differences in sample size for some of
the variables measurable in rice field experiments, the visual jackknife
method was applied to pre-samples collected in a paddy rice field in
Northern Italy, where a management typical for European rice was
conducted. Sample sizes for 14 variables describing plant features (plant
density, spikelet sterility, biomass, carbon and nitrogen concentration for
the different plant organs and for the whole plant) and for 12 variables
describing physical and chemical soil features (texture, pH, water holding
capacity, soil organic matter, total carbon and nitrogen concentration,
mineral nitrogen concentration) and soil microbial activity were
estimated. The elementary units of observation were a 3-plant sample and
an aggregate sample of four 125 cm 3 sub-samples respectively for plant-
and soil-related variables. Sample sizes ranged between 15 and 27 for
plant-related variables and between 5 and 6 for soil variables. Relating to
plant features, remarkable differences in sample size were observed in
carbon concentration values of different plant organs, probably due to
maintenance respiration. Homogeneity among sample sizes for soil
variables could be explained by the capability of aggregate samples in
capturing a big part of the total variance. This study underlines

40
importance of carrying out pre-samplings aiming at sample size
determination for different variables describing the cropping system.

Chapter 5
41
2.1 Introduction
Preliminary samplings aiming at determining sample size should be
carried out before performing measurements to avoid the collectionof
data characterized by low reliability (Lapitanet al., 1979; Nath and Singh,
1989; Tsegaye and Hill, 1998; Ambrosio et al., 2004). However, sample
size is often arbitrarily determined (Confalonieri et al., 2006), increasing
the probability of Type II errors if the sample size is smaller than needed
or expending critical resources or funds if the sample size is larger than
necessary (James-Pirri et al., 2007).
Although references about description of experiments where sample
size was determined are not common, the effort invested in carrying out,
describing and discussing results in the rare available examples
demonstrates the importance of this practice.
According to the different situations, sample size determination is a
process characterized by different degrees of complexity. Madhumita
Das (2007) estimated sample size for saturated hydraulic conductivity of
129 topsoil samples (0.00–0.20 m depth) in India, founding values from
2 to 8 according to different levels of confidence and error percentage.
Analyzing severity of Septoria leaf spot (caused by Septoria
albopunctata) on blueberry plants, Ojiambo and Scherm (2006) identified
75 leaves (selected from 3 shoots per bush on 25 bushes) as the optimal
sample size to determine disease severity as number of spots per leaf. A
sample of 144 leaves (2 each sampled from 3 shoots per bush on 24
bushes) was required to detect disease severity as percent of necrotic leaf
area. Araujo et al. (2004)identified 15% of total root mass of common
bean plants as adequate to provide reliable root traits estimates. Lima e
ANALYSIS OF SAMPLE SIZE
42
Silva et al. (2005)calculated sample size for 4 sorghum traits: plant
height, dry matter without panicle, panicle length, and panicle dry matter,
finding sample sizes of, respectively, 14, 11, 14, and 24 plants per plot
concerning the 4 variables were adequate. A single sample size of 25
plants was found by the same authors for all the variables using the
experimental coefficient of variation alone instead of a formula for
sample size derived by Thompson (1992). The estimation of different
sample sizes for different traits was carried out also byStorck et al.
(2007), who estimated sample size for the following maize traits: ear
length, ear and cob diameter, ear weight, weight of grains per ear, cob
weight and the weight of 100 grains, the number of grain rows per ear,
the number of grain per ear and the length of grains. Results showed that
the weight-related ear features needed 21 ears for a precise (5%)
determination; 8 and 13 ears were needed respectively for size- and
number-related features. Confalonieri et al. (2006), analysing paddy rice
fields, estimated samples size values ranging from 15 to 33 plants under
different management conditions (nitrogen fertilization, sowing
techniques, sown variety) and development stages.
In these examples, different techniques to determine sample size were
used and specific solutions were applied in the different conditions.
Ojiambo and Scherm (2006)sampled plants at 3 hierarchical levels (leaf,
shoot, bush) and related the sample size to the total time required for the
determination (respectively 36 and 22 min in the two cases), thus taking
into account the effort required in each case. Time required to determine
a variable was taken in account in sample size determination also by
Araujo et al. (2004). Storck et al. (2007)estimated sample size according

Chapter 2
43
to the formula 푛 = 푡 / 퐶푉 /퐷 , following the approach proposed by
Martin et al. (2005), where CV is the percent coefficient of variation of
the sampling error, D is the percent half-amplitude of the confidence
interval for the average and this the critical value of the distribution. The
same authors estimated sample size for different variables/parameters by
clustering them into classes (weight-, size-, and number-related traits).
Confalonieri et al. (2006) demonstrated how the sample size for rice
aboveground biomass (AGB) determinations could vary according to
management conditions using a resampling-based method, even when
different managements affect plants growing in the same biophysical
context.
The objective of this paper was to analyse the variability of different
aspects of a paddy rice fields through sample size determinations for
some of the plant and soil features of interest in agronomic field
experiments. In Confalonieri et al. (2006), differences in variability and
in sample size were analysed for aboveground biomass under different
management conditions; in this study, the same objective was pursued in
a standard rice field but concerning different variables related to soil,
plant, and soil microbial activity.

ANALYSIS OF SAMPLE SIZE
44
2.2 Material and methods
2.2.1 Experimental data
Data were collected in a field located in the southern part of Milano
(Northern Italy, 45.478N, 9.188E, 120 m a.s.l.) during 2006. The soil was
loam, acid, with soil organic matter content next to 2.5%. Rice (Oryza
sativaL., cv Libero, Indica type)was row seeded on April 12 and flooded
at the third leaf stage (May 10; code 13 of the BBCH scale for rice;
Lancashire et al., 1991). Rice received 140 kg N ha-1 split in 2 events:
pre-sowing and top-dressed at the panicle initiation stage (June 29; code
34 of the BBCH scale for rice). 33.6 kg P2O5 ha-1 and 92.4 kg K2O ha-1
were distributed in pre-sowing. Field management allowed prevention of
water and nutrient stresses and kept the field weed and pest free.
Plant-related measured variables were aboveground biomass at
physiological maturity (AGB; September 19; code 99 of the BBCH scale
for rice), plant nitrogen concentration (PNC) and plant carbon
concentration (PCC) at physiological maturity, spikelet sterility, and
plant density. AGB, PNC and PCC were determined for leaves, stems
and panicles separately. Measured soil variables were texture, mineral
nitrogen concentration (N-NO3- and N-NH4
+), total carbon and nitrogen
concentrations (SCC and SNC), soil organic matter (SOM), water
holding capacity (WHC), pH (KCl), and pH (H2O) in the soil layer 0.0–
0.2 m. Microbial activity in the soil (SMA) was estimated using a
respirometric approach.

Chapter 2
45
2.2.2 The visual jackknife
The visual jackknife method (Confalonieri, 2004; Confalonieri et al.,
2006) was used in sample size determination. The standard jackknife
(Tukey, 1958) is a resampling method based on the division of the
original sample of N elements into groups of k elements, with k equal to
1 in case N is low. 푁!/(푁 − 푘)!푘! virtual samples (combinations without
repetitions) of 푁 − 푘 elements are generated by eliminating N!/(N – k)!k!
times k different values from the original sample. In our case, the original
sample is represented by the data coming from the pre-sampling. In the
visual jackknife, different values of k are used. The process of generation
of the 푁!/(푁 − 푘)!푘! virtual samples is repeated N – 1times with k
assuming values from 1 to 푁 − 2, for a total of ∑ 푁!/(푁 − 푘)!푘!
different virtual samples. Mean and standard deviation are computed for
all the generated samples and plotted on two charts, with the values of
푁 − 푘 on the X-axis and the means (or standard deviations) on the Y-
axis, in order to get a visual representation of how the means and the
standard deviations of the generated samples vary with increasing
푁 − 푘values. Conceptually, the optimal sample size is considered equal
to the 푁 − 푘value for which the variability among the means does not
really decrease anymore with increasing sample size. The algorithm used
for the determination of the optimal sample size consists of selecting
(푁 − 푘)′ out of those 푁 − 푘 higher than 2 and lower than 푁 − 2. Four
weighted linear regressions are performed over the generated means as
follows: the first and the second run, respectively, over the highest and
lowest values of the 푁 − 푘 ≤ (푁 − 푘)′; the third and the fourth run over
the highest and lowest values of the 푁 − 푘 > (푁 − 푘)′. A global index

ANALYSIS OF SAMPLE SIZE
46
(SR2) is computed by summing the coefficients of determination (R2) of
the four regressions. The reiteration of this procedure for all the possible
(푁 − 푘)′ allows the identification of the optimum sample size, that is the
(푁 − 푘)′with the highest SR2. The process stops when the next sample
size does not produce SR2 larger than 5% than the previous. A trimming
process allows leaving extreme samples out of computation (for instance,
the 5% most external means). This visual jackknife method overcomes
the typical limitations of conventional methods (parametric statistics),
requiring data-matching the statistical assumptions of normality and
homoscedasticity.
The software SISSI 1.00 (Shortcut In Sample Size Identification;
Confalonieri et al., 2007) was used to apply the visual jackknife. SISSI
provides an easy access to the resampling-based computational
procedures the visual jackknife is based on, and allows the user to easily
customize the resampling settings. Numeric and visual outputs are
displayed in the graphical user’s interface, together with the sample size
calculated with classical procedures based on Student’s t. After the
software has automatically applied the regression-based procedure to
calculate the optimal sample size, the user is allowed to adjust manually
the resampling estimated sample size. This is meant to further reduce
sample size if the variability achieved (expressed as % coefficient of
variation) is expected to be low enough to fall within what is considered
by the researcher to be acceptable.
The SISSI’s installation package is available free of charge for non-
commercial purposes at http://www.robertoconfalonieri.it/
software_download.htm. The program is fully documented by the

Chapter 2
47
accompanying user’s manual, which provides a detailed description of
the scientific background and principles of usage.
2.2.3 Sample size determination
2.2.3.1 Plant-related variables
AGB, PNC, PCC and spikelet sterility were determined considering a
randomly chosen 3-plant aggregate sample as basic unit of observation
(Confalonieri et al., 2006), with N equal to 27 (see Section 2.2.2). AGB
(kg ha-1) was determined by drying the plant samples in oven at 1058C
until constant weight to express them as dry matter. PNC (%) and PCC
(%) were measured using an Elementary Analyser (model NA 1500,
series 2, Carlo Erba, Italy), after milling the plant samples at 0.5 mm.
Plant density (plants m-2) was determined adopting a value of N equal to
20 and as basic unit of observation the value 퐿/푛 ∙ 푅, where L is a
segment of row measuring 100 cm, n is the number of emerged plants in
L, and R is the number of rows in a 100 cm segment crossing the rows.
2.2.3.2 Soil variables
SMA (mg CO2 g DM-1 25 day-1), texture, N-NO3-and N-NH4+
(respectively kg N-NO3-ha-1and kg N-NH4+ha-1), total carbon and
nitrogen (%), SOM (%), WHC (%), pH (H2O), and pH (KCl) (-) were
determined assuming an aggregate sample (four 125 cm3 sub-samples) as
basic unit of observation, with N equal to 9. WHC was determined using
the Stackman box method (Klute, 1986). SMA was measured as CO2
release in a static system (ISO, 2002). Soil weights of 25 g (40% of the
WHC) were incubated at 20°C in a closed vessel and the released CO2
was adsorbed in a solution of sodium hydroxide (0.05 mol l-1). The

ANALYSIS OF SAMPLE SIZE
48
CO2absorbed was precipitated by adding BaCl2. The unused NaOH was
then titrated with HCl (0.1 mol l-1). The respiration test was carried out
for 25 days.
Chapter 2
49
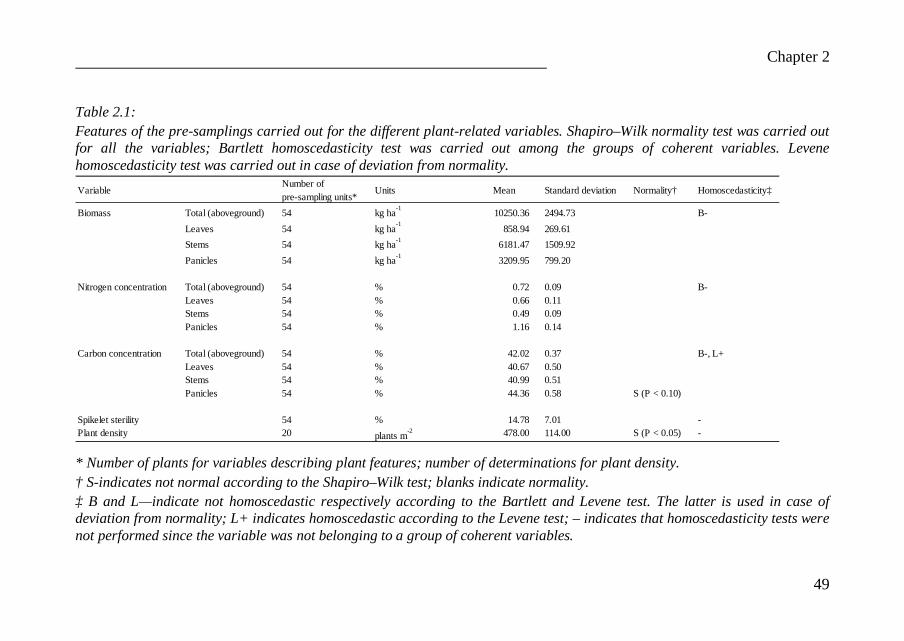
Table 2.1: Features of the pre-samplings carried out for the different plant-related variables. Shapiro–Wilk normality test was carried out for all the variables; Bartlett homoscedasticity test was carried out among the groups of coherent variables. Levene homoscedasticity test was carried out in case of deviation from normality.
* Number of plants for variables describing plant features; number of determinations for plant density. † S-indicates not normal according to the Shapiro–Wilk test; blanks indicate normality. ‡ B and L—indicate not homoscedastic respectively according to the Bartlett and Levene test. The latter is used in case of deviation from normality; L+ indicates homoscedastic according to the Levene test; – indicates that homoscedasticity tests were not performed since the variable was not belonging to a group of coherent variables.
VariableNumber of pre-sampling units*
Units Mean Standard deviation Normality† Homoscedasticity‡
Biomass Total (aboveground) 54 kg ha-1 10250.36 2494.73 B-Leaves 54 kg ha-1 858.94 269.61Stems 54 kg ha-1 6181.47 1509.92Panicles 54 kg ha-1 3209.95 799.20
Nitrogen concentration Total (aboveground) 54 % 0.72 0.09 B-Leaves 54 % 0.66 0.11Stems 54 % 0.49 0.09Panicles 54 % 1.16 0.14
Carbon concentration Total (aboveground) 54 % 42.02 0.37 B-, L+Leaves 54 % 40.67 0.50Stems 54 % 40.99 0.51Panicles 54 % 44.36 0.58 S (P < 0.10)
Spikelet sterility 54 % 14.78 7.01 -Plant density 20 plants m-2 478.00 114.00 S (P < 0.05) -
ANALYSIS OF SAMPLE SIZE
50
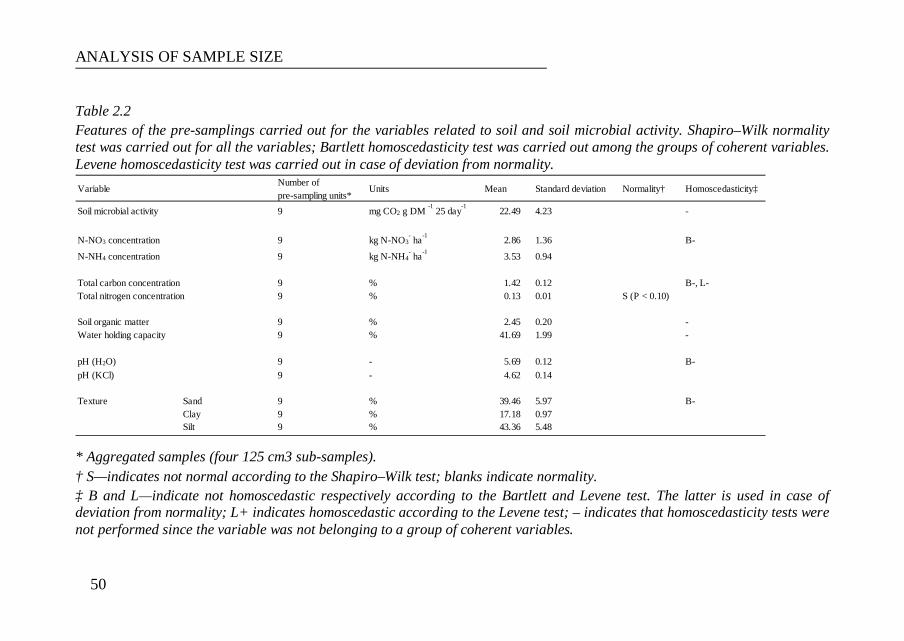
Table 2.2 Features of the pre-samplings carried out for the variables related to soil and soil microbial activity. Shapiro–Wilk normality test was carried out for all the variables; Bartlett homoscedasticity test was carried out among the groups of coherent variables. Levene homoscedasticity test was carried out in case of deviation from normality.
* Aggregated samples (four 125 cm3 sub-samples). † S—indicates not normal according to the Shapiro–Wilk test; blanks indicate normality. ‡ B and L—indicate not homoscedastic respectively according to the Bartlett and Levene test. The latter is used in case of deviation from normality; L+ indicates homoscedastic according to the Levene test; – indicates that homoscedasticity tests were not performed since the variable was not belonging to a group of coherent variables.
Variable Number of pre-sampling units*
Units Mean Standard deviation Normality† Homoscedasticity‡
Soil microbial activity 9 mg CO2 g DM -1 25 day-1 22.49 4.23 -
N-NO3 concentration 9 kg N-NO3- ha-1 2.86 1.36 B-
N-NH4 concentration 9 kg N-NH4- ha-1 3.53 0.94
Total carbon concentration 9 % 1.42 0.12 B-, L-Total nitrogen concentration 9 % 0.13 0.01 S (P < 0.10)
Soil organic matter 9 % 2.45 0.20 -Water holding capacity 9 % 41.69 1.99 -
pH (H2O) 9 - 5.69 0.12 B-pH (KCl) 9 - 4.62 0.14
Texture Sand 9 % 39.46 5.97 B-Clay 9 % 17.18 0.97Silt 9 % 43.36 5.48
Chapter 2
51
Texture was evaluated using the gravimetric method according to
USDA. N-NO3- and N-NH4+ are measured with a continuous-flow
analyzer (Flow Comp 1500, Carlo Erba, Italy). Total carbon and nitrogen
concentration were determined using an Elementary Analyzer (model
NA 1500, series 2, Carlo Erba, Italy).
2.2.3.3 Data pre-processing
Shapiro–Wilk (Shapiro and Wilk, 1965) and D’Agostino– Pearson
(D’Agostino, 1970, 1986; D’Agostino et al., 1990) statistical tests were
applied to test the assumption of the normality of the distributions of the
data from the original N-element samples. Homoscedasticity for coherent
variables (e.g., carbon concentration in the different plant organs) was
verified with the Bartlett’s test (Bartlett, 1937)and, in case of departures
from normality, with the Levene test (Levene, 1960) which is less
sensitive than Bartlett’s to normality despite Bartlett’s better performance
(Snedecor and Cochran, 1967).

ANALYSIS OF SAMPLE SIZE
52
Fig. 2.1 Sample sizes obtained for the different variables. (a) Plant-related variables; (b) Soil-related variables.

Chapter 2
53
2.3 Results and discussion
2.3.1 Preliminary analysis
Panicles carbon concentration, plant density and SNC showed
deviation from normality, whereas homoscedasticity was not verified for
practically all the variables with a coherent meaning (e.g., total, leaves,
stems, panicle biomass) (Tables 2.1 and 2.2). Variances of total plant,
leaves, stems and panicles carbon concentrations were considered
homogeneous according to the Levene test.
2.3.2 Plant-related variables
Higher sample sizes tended to be associated with carbon concentration
variables; whereas, lower sample sizes were associated with plant
density, spikelet sterility, and biomass variables. Among biomass-related
variables, leaves presented the highest variability, probably due to
senescence phenomena and loss of the oldest leaves in the last part of the
crop cycle and during sampling procedures (Fig. 1a). This effect
disappears when considering the variability of total biomass because of
the low relative weight of leaves compared to the other plant organs (see
Table 1a). Lower sample size values for panicles nitrogen concentration
with respect to the other plant organs is probably due to translocation
during the grain filling and ripening phases. Nitrogen translocation
processes are characterized by a single sink (grains) and by multiple
sources, with leaf blades playing a major role, followed by stems and leaf
sheaths (Mae and Ohira, 1981).Differences in nitrogen translocation
efficiencies from different plant organs could be modulated according to
nitrogen availability and uptake rates (driven by microscale phenomena)
ANALYSIS OF SAMPLE SIZE
54
before anthesis, when most of the nitrogen uptake in rice plants occurs
(Ntanos and Koutroubas, 2002), and to conditions experienced during the
grain filling. According to this hypothesis, the variability in the sink
nitrogen concentration at maturity would be lower than that of the
sources.
The highest differences were observed in the sample sizes for the
carbon concentration in the different plant organs. A possible explanation
is related to their maintenance respiration rates. According to Van Diepen
et al. (1988), relative maintenance respiration rates (kg CH2O kg-1day-1)
in leaves are about 30% higher than in stems and almost 7 times that of
grains. For all these plant organs, respiration rate is strongly dependent
on temperature. According to the morphology of the canopy and to the
non-homogeneity of the plant density, leaves belonging to different
plants can be exposed to different micrometeorological conditions
(Uchijima, 1976). Even small differences in temperature exposure among
plants can have an impact in modulating the high leaves’ maintenance
respiration rates, affecting the final variability in leaves carbon
concentration. This effect can be even clearer when the field is not
perfectly levelled, when water pools persist during drying events. Even a
few centimetres of water can affect the vertical thermal profile
(Confalonieri et al., 2005), generating variability between the plants
growing in pools and those growing where the field is already dried.

Chapter 2
55
2.3.3 Soil variables
The variability in sample size for soil-related variables is lower than
the one discussed for plant variables (Fig. 1b). Sample size is 5 in 60% of
the cases and 6 in the other ones. The definition of a sampling unit
consisting in an aggregate sample of four sub-samples allowed surely
capturing a significant amount of the total variance in the aggregate
sample. The resulting low variability among aggregated soil samples is
able to explain the low and homogeneous sample sizes obtained for soil
variables. Moreover thepresence of floodwater formost of the crop
cycle’s days represents a kind of buffer for the physical and biochemical
environment, thus reducing the spatial variability (e.g., the elements
transformation rates).
ANALYSIS OF SAMPLE SIZE
56
2.4 Conclusions
Following a study where rice aboveground biomass sample size
variability was discussed under different management conditions and
different development stages (Confalonieri et al., 2006), we analysed
here the sample size variability for different variables describing plant,
soil and microbial activity under a standard rice management for
European conditions.
In many cases, the statistical assumptions (normality and
homoscedasticity) required by classic procedures in sample size
determination based on t-distribution were not met. Moreover, the t-
distribution methods require as input the maximum acceptable error
(difference between sample and population means), which in many cases
cannot be easily identified, since it varies according (i) to biophysical
factors which could change from an experimental field (or situation) to
another and (ii) to the resources for carrying out the experimentation
(Confalonieri, 2004). Consequently, a resampling-based method was
used for sample size determination. In general, sample size values of
plant features were higher than those estimated for soil-related variables.
Among plant variables, whose sample size ranges between 15 and 27
plants, sample size for carbon concentration in the different plant organs
presented the highest variability. For soil, sample sizes are similar for
variables describing biochemical and physical aspects and microbial
activity.
This work confirmed the need of carrying out pre-samplings aiming at
sample size determination to guarantee the representativeness of the
measurements. In a previous study, Confalonieri et al. (2006)underlined

Chapter 2
57
the importance of sample size determination for aboveground biomass
under different management conditions, sown varieties, and development
stages. Here, the importance of determining specific sample sizes also for
the different variables describing a rice-based cropping system has been
demonstrated. Besides these theoretical considerations, this paper could
be used as support for identifying suitable sample sizes for the variables
analysed in case of lack of resources for extensive pre-sampling
investigations.

59
Chapter 3
Application of defecation lime in paddy field:
effects on soil chemical properties
Keywords. Defecation lime, rice (Oryza sativa L.), soil, pH, trace metals.
60
Abstract
Defecation lime is the product obtained by the hydrolysis of biological
materials by lime and/or sulphuric acid and subsequent calcium sulphate
precipitation”. This product is defined by the Italian L.D 75/2010 “as
“calcium and magnesium corrective products”. Among biological
material also sewage sludge can be used being an alternative option to
give a value and to dispose them in a most economical and useful way.
Despite there are some knowledge and work about the effects of
defecation lime application into agricultural land, no reference are found
about defecation lime made from sewage sludge.
The aim of this paper is to evaluate the effect of defecation lime on
paddy soil chemical characteristics over two years of experiments.
Results of their application suggest that, according to the acquired
knowledge, there is no contraindication for their disposal in paddy field.
It seem that after two year they are able to determine a little variation of
the soil pH. At the end of second year results of Anova test (α = 0.1)
showed that plots treated only with defecation lime had a upper pH value
compared with other treatments. Over two years, started from 5.80, they
reached a value of 6.11. Instead at the end of each year not significant
differences (P(F) > 0.05) was recorded for soil total trace metals
concentration.
Chapter 3
61
3.1 Introduction
According to Legislative Decree 75/2010 “defecation lime is the
product obtained by the hydrolysis of biological materials by lime and/or
sulphuric acid and subsequent calcium sulphate precipitation”. This
product is defined as “calcium and magnesium corrective products”.
They must contain at least 20% of calcium oxide (CaO) and 15% of
sulphuric anhydride (SO3). The origin of the hydrolyzed biological
material must be reported on the label.
Several biological materials could be used to produce defecation lime.
Masharipova (2006), reported the production by sugar industry waste.
Among biological material also sewage sludge can be used being an
alternative option to give a value and to dispose them in a most
economical and useful way.
The EU by the Directive 86/278/EEC seeks to encourage the
application of sewage sludge in agriculture and regulate its use in such a
way as to prevent harmful effects on soil, vegetation, animals and man.
Safe disposal of sewage sludge is one of the major environmental
concerns (Ghanavati et al., 2012). Sewage sludge, being organic waste, is
a good source of plant nutrients such as N, P, K, Ca, Mg, Fe, etc. as well
as other organic constituents (Martinez et al., 2003). As recommended,
sewage sludge should be applied with caution in accordance with the
plant nutrient needs without impairing the quality of the soil, surface and
ground water. Sewage sludge intended for arable land use needs to be
previously evaluated for quality regarding content of heavy metals,
persistent organic pollutants and pathogenic microorganism (Arthurson,
2008). Prior to land application stabilization is needed. The stabilization
EFFECTS ON SOIL CHEMICAL PROPERTIES
62
procedure commonly reduces organic matter and water content, emission
of unpleasant odors, and concentrations of pathogenic microorganisms
(Straub et al, 1993). Common stabilization approaches include anaerobic
(mesophilic or thermophilic) and aerobic digestion, lime stabilization,
composting, and heat drying (Goldfarb et al, 1999). The most frequently
used stabilization methods for sewage sludge are biological anaerobic
and aerobic digestion (Goldfarb et al, 1999). A stabilization process
similar to liming one is used in the defecation lime producing process.
Attention on defecation lime increased in Italy in the last years as a
consequence of DGR 9953/09. According to this regional decree there
was a limitation for the industrial and municipal sewage sludge arable
crop land application. It banned their use into NVZ (nitrate vulnerable
zone) starting from 2011 while starting from 2013 into nNVZ (non-
nitrate vulnerable zone). No restriction about sewage sludge originated
from waste of food processing industries were defined. This restriction
was repealed in 17 May 2011 as a consequence of Lombardy court
sentence.
Furthermore it should be remembered that from years a few number of
livestock are bred in paddy field area. In northern Italy (Lombardy,
Piedmont), according to sixth agricultural census return, there are 27952
head of cattle and 854543 hectares of cereal cultivated area. Paddy field
area is 227608 hectares (ISTAT, 2011). As a result there is little quantity
of organic matter available to maintain paddy soil fertility. In this way
the chance of defecation lime application is important to preserve this
valuable production factor. Despite there are few papers about the effects
of defecation lime originated from sugar industry waste no reference are
Chapter 3
63
found about defecation lime made from sewage sludge. In the other side
there are much work about sewage sludge and their effect into different
arable crop land.
The aim of this paper is to evaluate the effect of defecation lime on
paddy soil chemical characteristics over two years of experiments.
EFFECTS ON SOIL CHEMICAL PROPERTIES
64
3.2 Materials and Method
3.2.1 Experimental field and design
A two years experiment was done in order to evaluate the effects of
defecation lime on soil chemical characteristics. The experiment was
performed in a paddy field having 1.27 hectares area and located in Cava
Manara (Pavia, Lombardy, 45.151 N, 9.084 E, 80 m a.s.l.), a
municipality sited in an area where rice is widely cultivated.
Four blocks and four plots for each block were done.
Four level were tested:
0. CONTROL: never defecation lime nor fertilizer are applied,
1. USUAL MANAGEMENT: management according to the usual
agricultural technique,
2. DEFECATION LIME + CHEMICAL FERTILIZER: pre-sowing
defecation lime and top-dressing chemical fertilizer application,
3. DEFECATION LIME: pre-sowing defecation lime application.
“Zero” level represented the background of the field; it is the natural
evolution of the soil without any fertilizer input. Level “one” was the
typical managing situation. Level “two” was done in order to verify the
ability of the defecation lime to provide to a part – about half – of plant N
nutrition, while left amount was supplied by chemical fertilizer by two
different applications: tillering and panicle initiation development stage.
Level “three” wanted to test the corrective ability of the product and, at
the same time, its capacity to ensure the N needed for rice growth. Paddy
field management of the experiment is reported in table 3.1.

Chapter 3
65
Table 3.1 Paddy field management
org. fert. (organic fertilizer): was represented to the hoof and horn fertilizer (12-2-0; 40% of TOC); chem. fert. (chemical fertilizer: at the tillering was applied ENTEC 24:0:29 while at the panicle initiation a 20:20:20 fertilizer was applied); def. lime (defecation lime)
Year Level Before tillage Tillering Panicle initiation Total N applied (kg ha-1)0 - - - 01 org. fert. chem. fert. chem. fert. 1602 def. lime chem. fert. chem. fert. 1843 def. lime - - 1950 - - - 01 org. fert. chem. fert. chem. fert. 1602 def. lime chem. fert. chem. fert. 1623 def. lime - - 317
Second year
Application timing
First year

EFFECTS ON SOIL CHEMICAL PROPERTIES
66
The amounts of defecation lime applied are reported below (table 3.2).
Table 3.2 Amounts of defecation lime applied in the experiment
Amounts as reported on dry matter
Tillage operations done during the two years are reported in table 3.3.
Table 3.3 Tillage operation
Plowing was conducted at 25 cm while disc harrowing at 15 cm depth.
As shown in table above except for the main tillage operation needed
to bury the defecation lime into the soil, the same works were done over
two years. The different main tillage techniques were chosen in order to
Year Treatment Amount (t ha-1)0 -1 -2 2.43 7.00 -1 -2 3.33 13.9
First year
Second year
First year Second year1. defecation lime speading 1. defecation lime speading2. plowing 2. disc harrowing3. harrowing by rotary harrow 3. harrowing by rotary harrow4. sowing by row seeder 4. sowing by row seeder5. herbicide treatments 5. herbicide treatments6. tillering fertilization (where needed)
6. tillering fertilization (where needed)
7. fungicide treatment 7. fungicide treatment8. harvesting 8. harvesting

Chapter 3
67
verify the effect of defecation lime on the plant germination depending
on the burying depth.

EFFECTS ON SOIL CHEMICAL PROPERTIES
68
3.2.2 Defecation lime used in the experiment
Defecation lime used was produced in the Alan s.r.l. specific plant
located in Bascapè (Pavia, Lombardy).
The production process is based on the patent presented at the chapter
1.2 and specifically is reported below (figure 3.1):
Figure 3.1: process for defecation lime production adopted by Alan s.r.l
Raw materials used for the defecation lime production derived from
industrial and municipal wastewater plants from Lombardy region.
Chapter 3
69
Defecation lime was applied on paddy soil using Franzosi FVR 110
muck spreader while chemical fertilizer was applied by a centrifugal
fertilizer spreader.
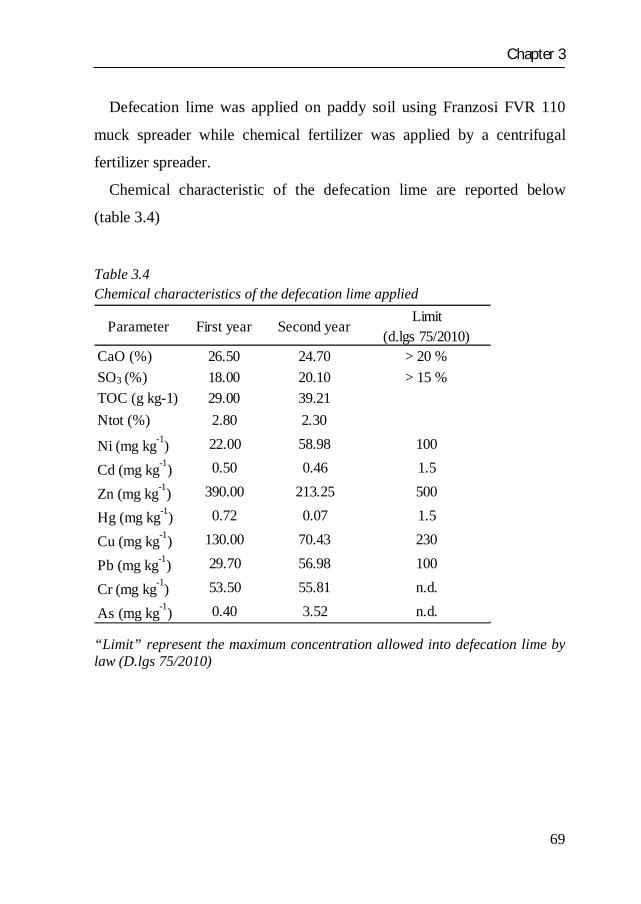
Chemical characteristic of the defecation lime are reported below
(table 3.4)
Table 3.4 Chemical characteristics of the defecation lime applied
“Limit” represent the maximum concentration allowed into defecation lime by law (D.lgs 75/2010)
Parameter First year Second yearLimit
(d.lgs 75/2010) CaO (%) 26.50 24.70 > 20 %SO3 (%) 18.00 20.10 > 15 %TOC (g kg-1) 29.00 39.21Ntot (%) 2.80 2.30
Ni (mg kg-1) 22.00 58.98 100
Cd (mg kg-1) 0.50 0.46 1.5
Zn (mg kg-1) 390.00 213.25 500
Hg (mg kg-1) 0.72 0.07 1.5
Cu (mg kg-1) 130.00 70.43 230
Pb (mg kg-1) 29.70 56.98 100
Cr (mg kg-1) 53.50 55.81 n.d.
As (mg kg-1) 0.40 3.52 n.d.

EFFECTS ON SOIL CHEMICAL PROPERTIES
70
3.2.3 Soil sampling and characterization
Soil was sampled both before the experiment and at the end of the two
rice-growing seasons.
In the first case samples were required to know the initial situation
while in the second case to evaluate the effect of the different treatments.
Each sample was taken from the surface of soil - cleaned from straw of
cultivation - to 25 cm deep.
In the first case fifteen samples were collected randomly into the
experimental area while, in the second case one sample – merging
different subsamples taken randomly – for each plot was collected.
The samples were air-dried, sieved to 2 mm mesh size and stored for
further chemical analysis.
In order to define the soil characteristics the variables reported below
were analysed:
pH (H2O)
CEC (cmol(+) kg-1)
TOC (g kg-1)
Cr (mg kg-1)
Cu (mg kg-1)
Ni (mg kg-1)
Pb (mg kg-1)
Zn (mg kg-1)
Cd (mg kg-1)
Hg (mg kg-1)
As (mg kg-1)
Soil total concentration of trace metals reported were determined while
just for five of them – Copper (Cu), Nickel (Ni), Lead (Pb), Zinc (Zn)
and Cadmium (Cd) – also the plants bioavailable amount were analysed.
Moreover the texture of the soil was established.
Chapter 3
71
Soil common chemical parameters were defined according to standard
soil science procedures (Faithfull, 2002).
Total trace metals concentrations were defined as follows: a
representative sample of up to 0.5 g is digested in 10 mL of concentrated
nitric acid using microwave heating with a suitable laboratory microwave
unit. The sample and acid are placed in a fluorocarbon (PFA) microwave
vessel. The vessel is capped and heated in the microwave unit. After
cooling, the vessel contents are diluted to volume of 50 mL, filtered and
then analyzed. Elements contents were determined by inductively
coupled plasma mass spectrometry (ICP-MS, Varian. Fort Collins, USA).
A certified standard reference material (GBW 07405, soil) from the
National Centre for Standard Materials (Beijing, China) was used in the
digestion and analysis. Average recovery was 92 ± 4% for all the metals
determined. To ensure the accuracy and precision in the analyses, reagent
blanks were run with samples.
In order to define bioavailable amount of trace metal specific
extraction method (ISO/DIS 14870, ISO 14876, ISO 11047) was applied.
After the extraction, the analysis was performed with inductively coupled
plasma mass spectrometry (ICP-MS, Varian. Fort Collins, USA) as the
same way reported for the total trace metals concentrations.
Soil physical and chemical characteristics before the experiment are
defined in table 3.5.
EFFECTS ON SOIL CHEMICAL PROPERTIES
72
3.2.4 Statistical analysis
Statistical analysis was performed using analysis of variance
(ANOVA) with F test used to compare means (SPSS statistical software,
SPSS Chicago IL). In order to separate statistically different means,
Ryan-Einot-Gabriel-Welsch F post hoc test were performed. P value was
set at α = 0.05. According to Acutis et al (2012) data where checked for
homogeneity of variances and normality, and experimentwise test are
used for multiple comparison of means
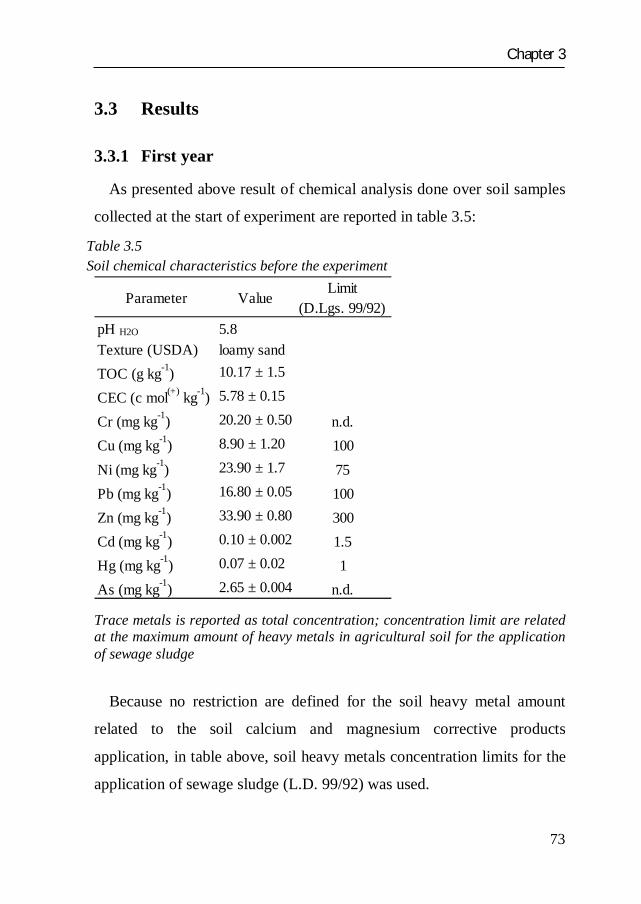
Chapter 3
73
3.3 Results
3.3.1 First year
As presented above result of chemical analysis done over soil samples
collected at the start of experiment are reported in table 3.5:
Table 3.5 Soil chemical characteristics before the experiment
Trace metals is reported as total concentration; concentration limit are related at the maximum amount of heavy metals in agricultural soil for the application of sewage sludge
Because no restriction are defined for the soil heavy metal amount
related to the soil calcium and magnesium corrective products
application, in table above, soil heavy metals concentration limits for the
application of sewage sludge (L.D. 99/92) was used.
Parameter ValueLimit
(D.Lgs. 99/92)pH H2O 5.8Texture (USDA) loamy sandTOC (g kg-1) 10.17 ± 1.5
CEC (c mol(+) kg-1) 5.78 ± 0.15
Cr (mg kg-1) 20.20 ± 0.50 n.d.Cu (mg kg-1) 8.90 ± 1.20 100Ni (mg kg-1) 23.90 ± 1.7 75Pb (mg kg-1) 16.80 ± 0.05 100Zn (mg kg-1) 33.90 ± 0.80 300Cd (mg kg-1) 0.10 ± 0.002 1.5Hg (mg kg-1) 0.07 ± 0.02 1As (mg kg-1) 2.65 ± 0.004 n.d.
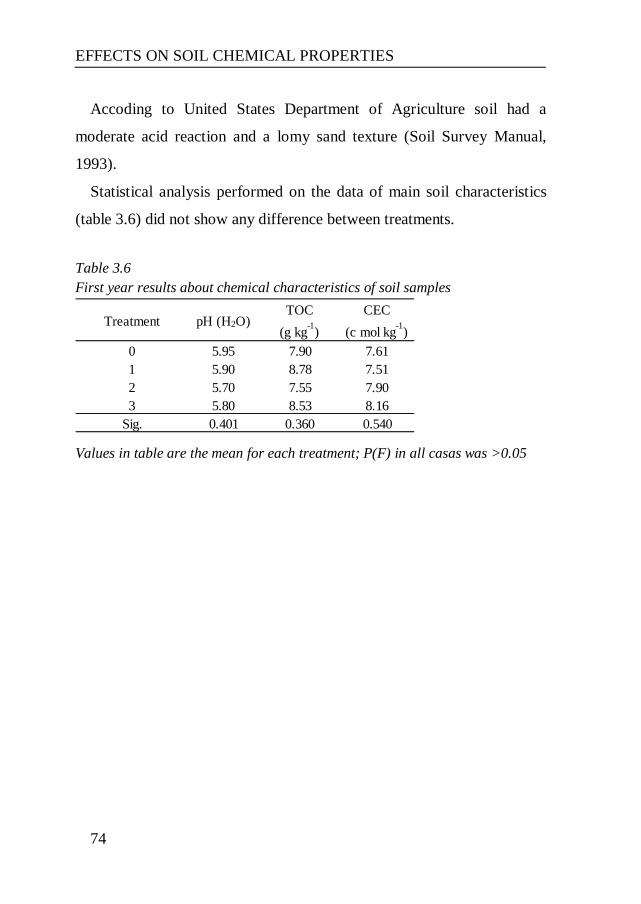
EFFECTS ON SOIL CHEMICAL PROPERTIES
74
Accoding to United States Department of Agriculture soil had a
moderate acid reaction and a lomy sand texture (Soil Survey Manual,
1993).
Statistical analysis performed on the data of main soil characteristics
(table 3.6) did not show any difference between treatments.
Table 3.6 First year results about chemical characteristics of soil samples
Values in table are the mean for each treatment; P(F) in all casas was >0.05
Treatment pH (H2O)TOC
(g kg-1)CEC
(c mol kg-1)0 5.95 7.90 7.611 5.90 8.78 7.512 5.70 7.55 7.903 5.80 8.53 8.16
Sig. 0.401 0.360 0.540
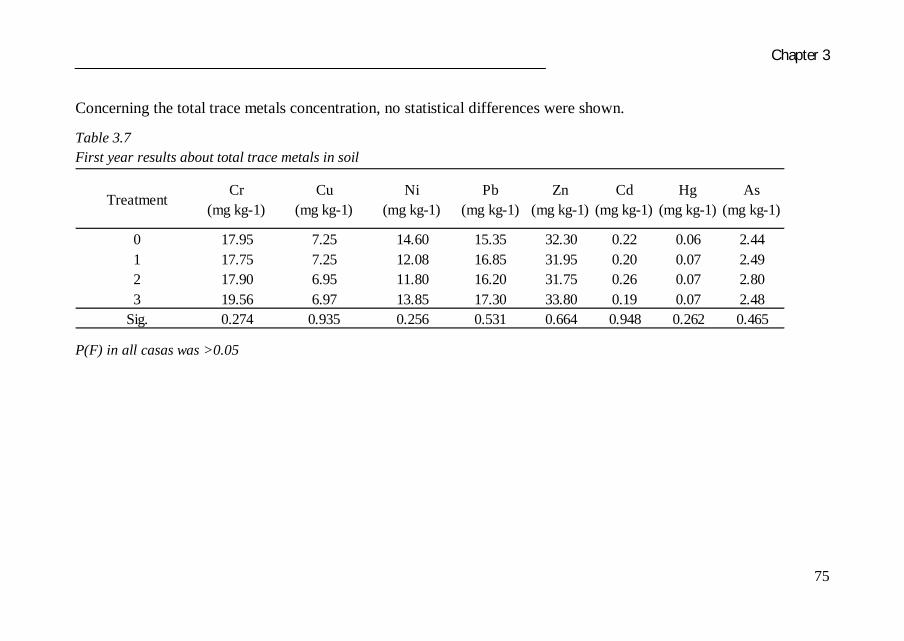
Chapter 3
75
Concerning the total trace metals concentration, no statistical differences were shown.
Table 3.7 First year results about total trace metals in soil
P(F) in all casas was >0.05
TreatmentCr
(mg kg-1)Cu
(mg kg-1)Ni
(mg kg-1)Pb
(mg kg-1)Zn
(mg kg-1)Cd
(mg kg-1)Hg
(mg kg-1)As
(mg kg-1)
0 17.95 7.25 14.60 15.35 32.30 0.22 0.06 2.441 17.75 7.25 12.08 16.85 31.95 0.20 0.07 2.492 17.90 6.95 11.80 16.20 31.75 0.26 0.07 2.803 19.56 6.97 13.85 17.30 33.80 0.19 0.07 2.48
Sig. 0.274 0.935 0.256 0.531 0.664 0.948 0.262 0.465

EFFECTS ON SOIL CHEMICAL PROPERTIES
76
Also concerning the plants bioavailable trace metals, no difference were found.
Table 3.8 First year results about plants bioavailable trace metals in soil
P(F) in all casas was >0.05
Treatment Ni (mg/kg) Cd (mg/kg) Cu (mg/kg) Zn (mg/kg) Pb (mg/kg)0 0.111 0.012 0.367 0.058 0.0021 0.192 0.012 0.395 0.047 0.0032 0.115 0.013 0.402 0.049 0.0033 0.124 0.013 0.420 0.048 0.003
Sig. 0.581 0.455 0.511 0.687 0.819

Chapter 3
77
3.3.2 Second year
Also for the second year, no difference over all soil characteristics and
trace metals concentrations were show.
Table 3.9 First year results about chemical characteristics of soil samples
Values in table are the mean for each treatment; P(F) in all casas was >0.05
Treatment pH (H2O)TOC
(g kg-1)CEC
(c mol kg-1)0 5.63 6.53 5.971 5.65 8.56 6.582 5.78 7.34 5.993 6.11 9.65 6.89
Sig. 0.053 0.053 0.529
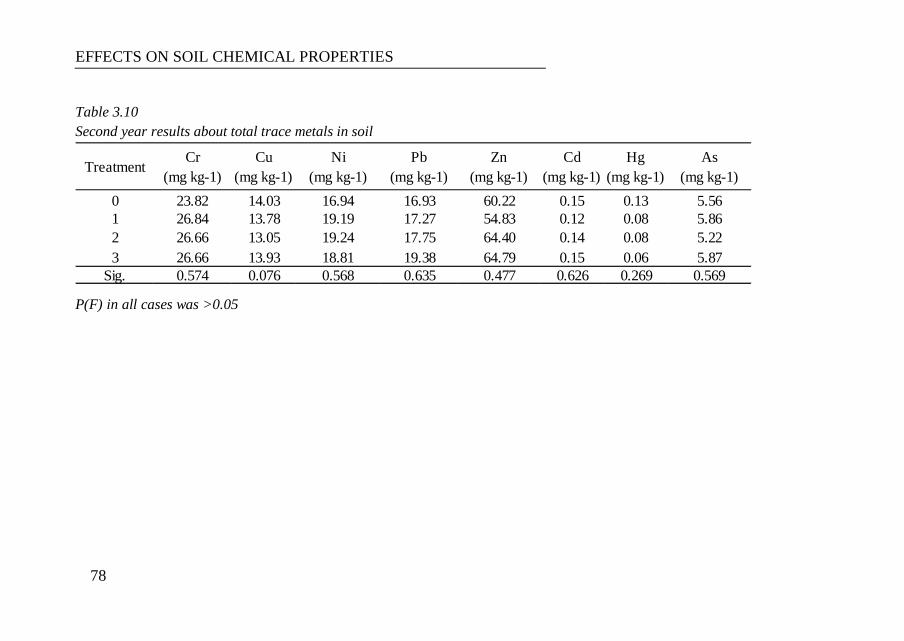
EFFECTS ON SOIL CHEMICAL PROPERTIES
78
Table 3.10 Second year results about total trace metals in soil
P(F) in all cases was >0.05
TreatmentCr
(mg kg-1)Cu
(mg kg-1)Ni
(mg kg-1)Pb
(mg kg-1)Zn
(mg kg-1)Cd
(mg kg-1)Hg
(mg kg-1)As
(mg kg-1)0 23.82 14.03 16.94 16.93 60.22 0.15 0.13 5.561 26.84 13.78 19.19 17.27 54.83 0.12 0.08 5.862 26.66 13.05 19.24 17.75 64.40 0.14 0.08 5.223 26.66 13.93 18.81 19.38 64.79 0.15 0.06 5.87
Sig. 0.574 0.076 0.568 0.635 0.477 0.626 0.269 0.569

Chapter 3
79
Even bioavailable plant metals concentration did not show statistical difference.
Table 3.11 Second year results about plants bioavailable trace metals in soil
P(F) in all casas was >0.05
Treatment Ni (mg/kg) Cd (mg/kg) Cu (mg/kg) Zn (mg/kg) Pb (mg/kg)0 0.126 0.015 1.103 0.641 3.1211 0.135 0.018 1.212 0.796 3.6302 0.132 0.017 1.286 0.685 2.0933 0.130 0.019 1.231 0.765 2.264
Sig. 0.887 0.366 0.462 0.474 0.601
EFFECTS ON SOIL CHEMICAL PROPERTIES
80
3.4 Discussion
As reported above no statistical difference were evaluated for the main
soil characteristics even if for some variables – treatment three year 2009
CEC; treatment three year 2010 all variable – a upper values were
observed.
Concerning pH results and known that defecation lime is defined as
calcium and magnesium corrective product, hypothesis is that the
specific amounts of defecation lime dispose for the two year were not
enough to determine a significant variation of the soil pH. This
assumption is in agreement as required according to the tables of lime
requirements for soil correction. Through the analysis of that table and
the required elaborations, in order to rise pH from 5.8, started value of
paddy soil, to 6.11, last and upper value for the treatment three, would
have been necessary 4.49 t ha-1 of CaO while by defecation lime, in the
second year, only 2.74 t ha-1 were applied.
Results presented above were obtained by processing the data as define
in the chapter above: P value set to 0.05 and R-E-G-W F test that is a true
experimentwise test.
Moreover if the analysis was conducted by setting P value to 0.1, the
same test are able to define homogeneous subset: 3a, 2a,b, 1b, 0b (table
3.12), so the mean separation indicates at least a tendency in the data.
Comparing this new observation with those presented just above, we
could hypothesize that defecation lime was more efficient that CaO only
for the soil reaction correction.
In order to be sure of this hypothesize specifically experiment to test
defecation lime versus CaO effects in paddy field should be done.

Chapter 3
81
Chart 3.1 Soil pH values at the end of second year for each treatments Table 3.12 Results of the Anova post hoc for the pH values at the end of second year. P value set to 0.1
Treatment0 b1 b2 a,b a,b3 a
Sig. 0.390 0.106
Homogeneous subset
Ryan-Einot-Gabriel-Welsch F
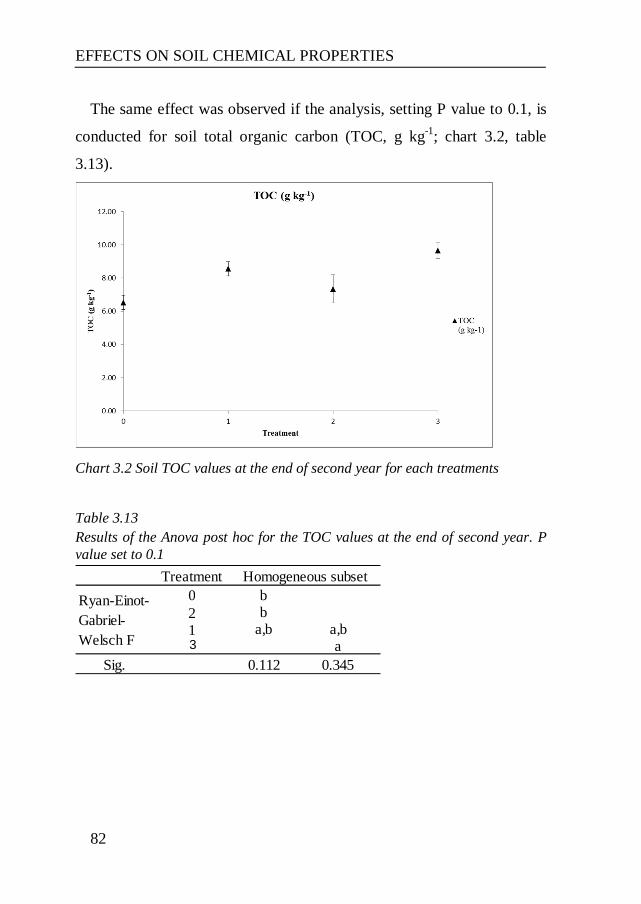
EFFECTS ON SOIL CHEMICAL PROPERTIES
82
The same effect was observed if the analysis, setting P value to 0.1, is
conducted for soil total organic carbon (TOC, g kg-1; chart 3.2, table
3.13).
Chart 3.2 Soil TOC values at the end of second year for each treatments
Table 3.13 Results of the Anova post hoc for the TOC values at the end of second year. P value set to 0.1
Treatment0 b2 b1 a,b a,b3 a
Sig. 0.112 0.345
Ryan-Einot-Gabriel-Welsch F
Homogeneous subset
Chapter 3
83
Regarding the value shown for treatment three the hypothesis is that
the effect is due to the organic matter added by defecation lime
application (TOC applied was 0.54 t ha-1) while, for the treatment one is
probably due to the organic fertilizer – hoof and horn – applied (TOC
applied was 0.06 t ha-1).
For the first year, concerning total trace metals concentration in soil no
difference between treatments were show. This lack of significant effects
could be due to (i) low trace metals concentration introduced by
defecation lime (table 3.13), (ii) leaching phenomena occurred by field
flooding and weekly repeated flooding-dry rounds, (iii) amount of plants
bioavailable trace metals uptaken from soil.
About the variations observed from first to second year both in total
and in bioavailable trace elements was possible to note that also Garrison
et al. (1983) for elements as Ni, Cu, Zn, Cd, and Pb, observed changes of
similar magnitude over the years.

EFFECTS ON SOIL CHEMICAL PROPERTIES
84
Table 3.14 First year trace metals amounts added with the defecation lime and percentage of increasing respect initial soil concentration
First two lines reported the amount of trace metals applied by defecation lime. Initial soil trace metals concentration are reported in table 3.4
Treatment D.L. dry weight (t ha-1) Ni (mg kg-1) Cd (mg kg-1) Zn (mg kg-1) Hg (mg kg-1) Cu (mg kg-1) Pb (mg kg-1) Cr (mg kg-1) As (mg kg-1)2 2.40 0.0151 0.0003 0.2675 0.0005 0.0892 0.0204 0.0367 0.00033 6.98 0.0439 0.0010 0.7782 0.0014 0.2594 0.0593 0.1068 0.0008
2 0.06% 0.34% 0.79% 0.71% 1.00% 0.12% 0.18% 0.01%
3 0.18% 1.00% 2.30% 2.05% 2.91% 0.35% 0.53% 0.03%
% respect initial concentration
Chapter 3
85
Even for plants bioavailable trace metals no difference were identified.
These effects could be determined from many variables. Violante et al
(2010) reported that bioavailability and mobility of trace metals in soil
are determined by different variables as pH, sorbent nature, presence and
concentration of organic and inorganic ligands, root exudates and
nutrients, biotic and abiotic red-ox reaction.
Furthermore Sauve et al. (2000) confirming this knowledge, by
evaluating that the amount of bioavailable trace metals in soil are not
directly linked to the total trace metal concentration.
The same effects we hypothesize be at the basis of the absence of
difference shown in the second year: table 3.15 reported the part of trace
metals added through defecation lime application and their weight on the
total soil concentration before the product disposal. As shown the
percentage respect to the total amount seems to be very little (table 3.15)
so as justify the results observe.

EFFECTS ON SOIL CHEMICAL PROPERTIES
86
Table 3.15 Second year trace metals amounts added with the defecation lime and percentage of increasing respect initial soil concentration
First two lines reported the amount of trace metals applied by defecation lime.
Treatment D.L. weight (t ha-1) Ni (mg kg-1) Cd (mg kg-1) Zn (mg kg-1) Hg (mg kg-1) Cu (mg kg-1) Pb (mg kg-1) Cr (mg kg-1) As (mg kg-1)2 3.33 0.06 0.00 0.20 0.00 0.07 0.05 0.05 0.003 13.89 0.23 0.00 0.85 0.00 0.28 0.23 0.22 0.012 0.29% 0.33% 0.43% 0.11% 0.59% 0.30% 0.19% 0.06%
3 1.21% 1.35% 1.73% 0.61% 2.40% 1.21% 0.79% 0.26%
% respect initial concentration
Chapter 3
87
3.5 Conclusions
Analysed results suggest that are not contraindication for the
application of defecation lime in paddy fields.
Also if other evaluation should be needed, these products seem could
be potentially used to control soil pH. According to González-Fernández
(2004) it would be interesting to evaluate the soil pH following some –
eight to ten – years of the defecation lime application. In fact they
reported that defecation lime are able to have a beneficial correction
effects from year – at least nine – respect others commonly used
correction products.
No restriction could be reported respect the variation in heavy metals
concentration occurred over the experiment.
Analysis of the soil chemical characteristics have to be done before the
defecation lime spreading and, as suggested by the good management
practices, these analysis should be carried out every five years in order to
evaluated the evolution of the soil.

89
Chapter 4
Application of defecation lime in paddy field: effects on
rice (Oryza sativa L.) plants
Keywords. Defecation lime, rice (Oryza sativa L.), plants growing variables,
trace metals in rice grain.
90
Abstract
The effects of application of a defecation lime - defined as a “product
obtained by the chemical hydrolysis (or enzymatic attack) of biological
materials by lime and/or sulphuric acid and subsequent calcium sulphate
precipitation (Italian D.Lgs 75/2010”) - derived from sewage sludge on
rice plants development, yield and trace elements content in the grain
were assessed in a 2-years experiment. At the end of two year no
difference over crop development related variables was observed.
Concerning concentration of trace metals in rice grains some difference
were showed on cadmium (Cd) for the first year: plots treated just with
defecation lime showed the lower value. For the same element at the end
of experiment upper concentration (on average 0.36 mg kg-1) than
admitted by law (0.2 mg kg-1) was highlighted in rice grains. According
to the result observed, seem that defection lime could be considered an
useful way to furnish nitrogen to rice plant, without risk of cumulating
heavy metals
Chapter 4
91
4.1 Introduction
According to the prescriptions of the Italian D.Lgs (Legislative
Decree) no. 75/2010 defecation lime is defined as a “product obtained by
the chemical hydrolysis (or enzymatic attack) of biological materials by
lime and/or sulphuric acid and subsequent calcium sulphate
precipitation.” This product is classified as "lime and magnesia soil
conditioner". They must contain at least 20% of calcium oxide (CaO) and
15% of sulphuric anhydride (SO3) both related on a dry basis. According
by law origin of the hydrolysed biological material must be reported on
the label.
There is little knowledge about defecation lime. Masharipova, 2006,
reported different methods to produce defecation lime and also different
ways of utilization. Defecation lime analysed in the work of Masharipova
derived from waste of sugar industries but other biological material i.e.
sewage sludge as base product could be used. As largely know sewage
sludge is generated as a result of wastewater treatment processes. The
quantity of sludge produced has been, for several years, increasing
greatly in Europe because of the implementation of Council Directive
91/271/EEC of 21 May 1991 concerning urban waste water treatment.
The Sewage Sludge Directive 86/278/EEC seeks to encourage the use of
sewage sludge in agriculture and to regulate its use in such a way as to
prevent harmful effects on soil, vegetation, animals and man. Safe
disposal of sewage sludge is one of the major environmental concerns.
Sludge is rich in nutrients such as nitrogen and phosphorous and contains
valuable organic matter that is useful when soils are depleted or subject
to erosion.

EFFECTS ON RICE (Oryza sativa L.) PLANTS
92
Sewage sludge is found to be an effective organic fertilizer causing
increments in the biomass of many crops (Tsadilas et al., 1995).
However, its long-term use can cause heavy metal accumulation in the
soil (Dai et al., 2006).
Wheat (Triticum aestivumL. var. holly) grown in sewage sludge (2 and
10 kg m-2) amended Hartsells sandy loam and Decatur silty clay loam
soils of USA showed significantly higher concentrations of Zn, Cd and
Ni in wheat grains at increasing sewage sludge amendment rates in both
the soils (Tadesse et al., 1991), but absorption, accumulation and
tolerance to heavy metals may vary among different crops and at
different levels of sewage sludge amendments (SSA) (Bhogal et al.,
2003; Garrido et al., 2005; Lavado, 2006; Singh and Agrawal, 2008).
Crop plants may develop adaptive response to tolerate the heavy metal
stress. Positive effects on yield components, such as shoot height and
surface area of leaves, of dwarf bean (Theodorates et al., 2000) and
growth and productivity of flax (Tsakou et al., 2002) have been reported
at different rates of sewage sludge amendments in the soil. Also
according to Singh and Agrawal (2010) shoot length, number of leaves,
leaf area and total biomass of rice plants increased significantly when
grown under various sewage sludge amendment rates; yield of rice
increased by 60%, 111%, 125%, 134% and 137% at 3, 4.5, 6, 9 and 12
kg m-2 sewage sludge amendment rates, respectively, as compared to
those grown in un-amended soil.
Prior to land application, sewage sludge needs to be stabilized and
evaluated for quality regarding content of heavy metals, persistent
organic pollutants and pathogenic microorganism (Arthurson, 2008).
Chapter 4
93
The stabilization procedure commonly reduces organic matter and
water content, emission of unpleasant odors, and concentrations of
pathogenic microorganisms (Straub et al, 1993).
Common stabilization approaches include anaerobic and aerobic
digestion, lime stabilization, composting, and heat drying (Goldfarb et al,
1999). A stabilization process, similar to the liming one, which can be
applied to sewage sludge as raw material is used for defecation lime
producing process. After this process defecation lime can be disposed on
agricultural crop land.
Baraldi et al. (2006) reported the positive effects following the
application of defecation lime on sugar beet production. In our
knowledge no references are available about the effects of defecation
lime in paddy soil and on rice plants. Furthermore no studies about
defecation lime produced starting from sewage sludge were identified.
The aim of this work is to evaluate the effects of defecation lime on
rice plants in order to define if they could be used to support plants
production.

EFFECTS ON RICE (Oryza sativa L.) PLANTS
94
4.2 Material and methods
4.2.1 Paddy field and experimental design
A two years experiment was done in order to evaluate the effects of
defecation lime on soil chemical characteristics. The experiment was
performed in a paddy field having 1.27 hectares area and located in Cava
Manara (Pavia, Lombardy, 45.151 N, 9.084 E, 80 m a.s.l.), a
municipality sited in an area where rice is widely cultivated.
Four blocks and four plots for each block were done.
Four level were tested:
0. CONTROL: never defecation lime nor fertilizer are applied,
1. USUAL MANAGEMENT: management according to the usual
agricultural technique,
2. DEFECATION LIME + CHEMICAL FERTILIZER: pre-sowing
defecation lime and top-dressing chemical fertilizer application,
3. DEFECATION LIME: pre-sowing defecation lime application.
“Zero” level represented the background of the field; it is the natural
evolution of the soil without any fertilizer input. Level “one” was the
typical managing situation. Level “two” was done in order to verify the
ability of the defecation lime to provide to a part – about half – of plant N
nutrition, while left amount was supplied by chemical fertilizer by two
different applications: tillering and panicle initiation development stage.
Level “three” wanted to test the corrective ability of the product and, at
the same time, its capacity to ensure the N needed for rice growth. Paddy
field management of the experiment is reported in table 4.1.
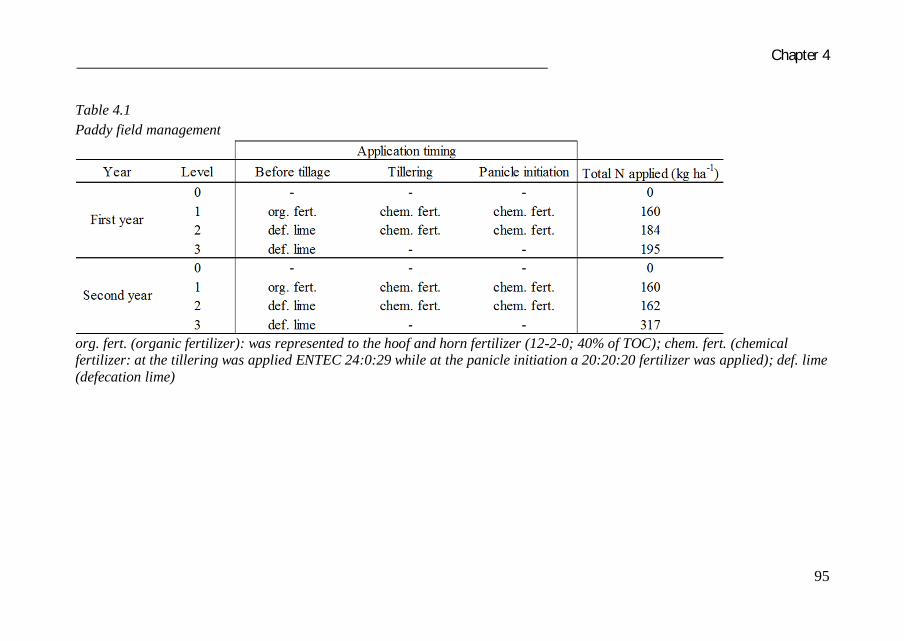
Chapter 4
95
Table 4.1 Paddy field management
org. fert. (organic fertilizer): was represented to the hoof and horn fertilizer (12-2-0; 40% of TOC); chem. fert. (chemical fertilizer: at the tillering was applied ENTEC 24:0:29 while at the panicle initiation a 20:20:20 fertilizer was applied); def. lime (defecation lime)
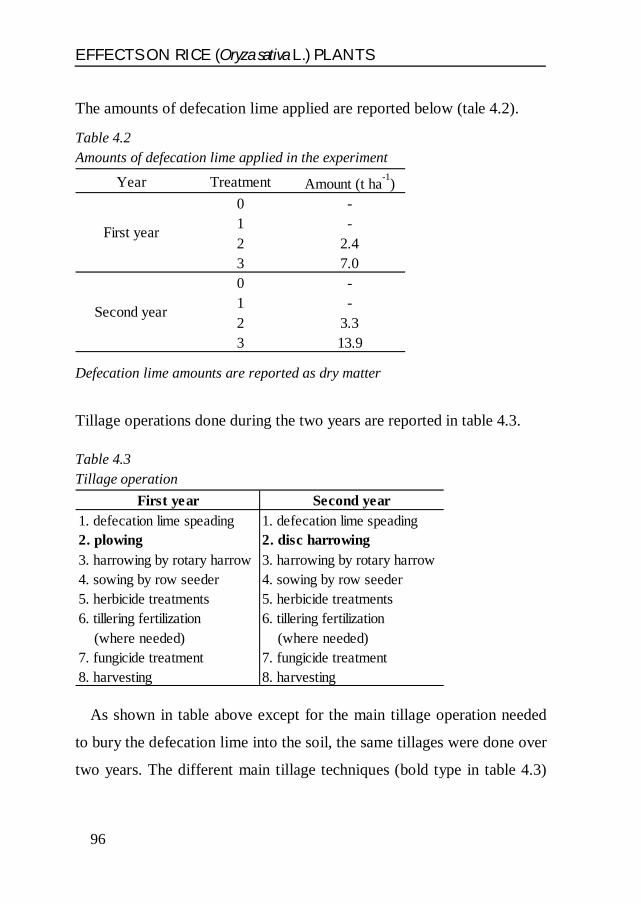
EFFECTS ON RICE (Oryza sativa L.) PLANTS
96
The amounts of defecation lime applied are reported below (tale 4.2).
Table 4.2 Amounts of defecation lime applied in the experiment
Defecation lime amounts are reported as dry matter
Tillage operations done during the two years are reported in table 4.3. Table 4.3 Tillage operation
As shown in table above except for the main tillage operation needed
to bury the defecation lime into the soil, the same tillages were done over
two years. The different main tillage techniques (bold type in table 4.3)
Year Treatment Amount (t ha-1)0 -1 -2 2.43 7.00 -1 -2 3.33 13.9
First year
Second year
First year Second year1. defecation lime speading 1. defecation lime speading2. plowing 2. disc harrowing3. harrowing by rotary harrow 3. harrowing by rotary harrow4. sowing by row seeder 4. sowing by row seeder5. herbicide treatments 5. herbicide treatments6. tillering fertilization (where needed)
6. tillering fertilization (where needed)
7. fungicide treatment 7. fungicide treatment8. harvesting 8. harvesting

Chapter 4
97
were chosen in order to verify the effect of defecation lime on the plant
germination depending on the burying depth.
Concerning the water management paddy field was flooded the first
time when rice plants were at three unfolded leaves (code 13 BBCH).
Then paddy field was subjected to flooded and unflooded stages that
occurred every week.

EFFECTS ON RICE (Oryza sativa L.) PLANTS
98
4.2.2 Rice variety
The rice variety sown into paddy field was Volano, a Japonica medium
cycle variety. Volano was in 2012 cultivated on 19550.45 hectares equal
to 8.32% of total Italian paddy field area (ENR, 2012). According to the
results of SIQURISO (2009) project, Volano was named as high
cadmium (Cd) exclusion capacity variety.
Rice was row seeded by a specific cereal seeder in May both for the
first and second year. The sowing was done, after the soil tillage, on
unflooded soil. Rice plants were then flooded at three unfolded leaves
according to the traditional management technique.
4.2.3 Defecation lime used in the experiment
Defecation lime used was produced in the Alan s.r.l. specific plant
located in Bascapè (Pavia, Lombardy).
The production process is based on the patent presented at the chapter
1.2 and specifically is reported in figure 4.1.
Raw materials used for the defecation lime production derived from
industrial and municipal wastewater plants from Lombardy region.
Defecation lime was applied on paddy soil using Franzosi FVR 110
muck spreader while chemical fertilizers were applied by a centrifugal
fertilizer spreader.

Chapter 4
99
Figure 4.1: process for defecation lime production adopted by Alan s.r.l

EFFECTS ON RICE (Oryza sativa L.) PLANTS
100
Chemical characteristic of the defecation lime are reported below
(table 4.4)
Table 4.4 Chemical characteristics of the defecation lime applied
Elements amounts are reported on dry matter. Limit represent the maximum concentration allowed into defecation lime from law (D.lgs 75/2010)
Parameter First year Second yearLimit
(d.lgs 75/2010) CaO (%) 26.50 24.70 > 20 %SO3 (%) 18.00 20.10 > 15 %TOC (g kg-1) 29.00 39.21Ntot (%) 2.80 2.30
Ni (mg kg-1) 22.00 58.98 100
Cd (mg kg-1) 0.50 0.46 1.5
Zn (mg kg-1) 390.00 213.25 500
Hg (mg kg-1) 0.72 0.07 1.5
Cu (mg kg-1) 130.00 70.43 230
Pb (mg kg-1) 29.70 56.98 100
Cr (mg kg-1) 53.50 55.81 n.d.
As (mg kg-1) 0.40 3.52 n.d.

Chapter 4
101
4.2.4 Variables under analysis
Different variables were analysed in order to evaluate the effect of
defecation lime (table 4.5)
Table 4.5 Variable analysed during the experiment
The number of plants at three unfolded leaves was determined
counting them into one linear meter along the row. Measure was
repeatedly four times and randomly for each plot. This sample size was
determined by SISSI software (Confalonieri et al., 2007).
Development stage of rice was evaluate by a BBCH rice development
code stage according to Lancashire et al., 1991. Time step among two
observations was around fifteen days.
Type of variable Name of variable Measure unitNumber of plants at three unfolded leaves n° of plants m-2
Plant development stage BBCH
Number of steam n° of stem m-2
Aboveground biomass (AGB) t ha-1
Rice yield t ha-1
Rice milling yield %
Chromium (Cr) (mg kg-1)Copper (Cu) (mg kg-1)Nichel (Ni) (mg kg-1)Lead (Pb) (mg kg-1)Zinc (Zn) (mg kg-1)Cadmium (Cd) (mg kg-1)Mercury (Hg) (mg kg-1)Arsenic (As) (mg kg-1)
Growing and production
Trace metals concentration in rice grains

EFFECTS ON RICE (Oryza sativa L.) PLANTS
102
Number of stem was determined counting the stem before rice harvest
in 0.25 m2 area. As above, measure was repeatedly four times according
to the result of SISSI software (Confalonieri et al., 2007). The four
measures was take randomly into each plot. The number of stem was
later reported in one square meter.
After drying at 105° C till constant weight, rice aboveground biomass
(t ha-1) was determined. The aboveground material was collected by
cutting rice plants at the root collar into one square meter. Samples were
collected randomly. Sampling was repeatedly four times for each plot.
Yield (t ha-1) of plants was determined by weighing paddy grains after
drying at 105° C till constant weight. Paddy grain were collected reaping
the ears of plants harvested to the aboveground biomass determination.
Rice milling yield (%) was determined by processing paddy grains
with a specific husking machines. In order to do this operation about two
hundred grams of paddy grain were sent to Italian National Rice institute
(ENR).
Finally trace metals concentration in grains was establish as follow: an
amount of rice grains, taken randomly from the total quantity collected
for the yield determination, was milled to 0.2 mm size, then a
representative sample of up to 0.3 g is digested in 10 mL of concentrated
nitric acid using microwave heating with a suitable laboratory microwave
unit. The sample and acid are placed in a fluorocarbon (PFA) microwave
vessel. The vessel is capped and heated in the microwave unit. After
cooling, the vessel contents are diluted to volume of 50 mL, filtered and
then analyzed. Elements contents were determined by inductively
coupled plasma mass spectrometry (ICP-MS, Varian. Fort Collins, USA).
Chapter 4
103
A certified standard reference material (GBW 07405, soil) from the
National Centre for Standard Materials (Beijing, China) was used in the
digestion and analysis. Average recovery was 92 ± 4% for all the metals
determined. To ensure the accuracy and precision in the analyses, reagent
blanks were run with samples.
4.2.5 Statistical analysis
Statistical analysis were performed using analysis of variance
(ANOVA) with F test used to compare means (SPSS statistical software,
SPSS Chicago IL). In order to separate statistically different means,
Ryan-Einot-Gabriel-Welsch F post hoc test were performed. P value was
set at α = 0.05. According to Acutis et al. (2012) data where checked for
homogeneity of variances and normality, and experimentwise test are
used for multiple comparison of means. Due to the differences in the
amount of defecation lime used, the two years was analyzed separately.
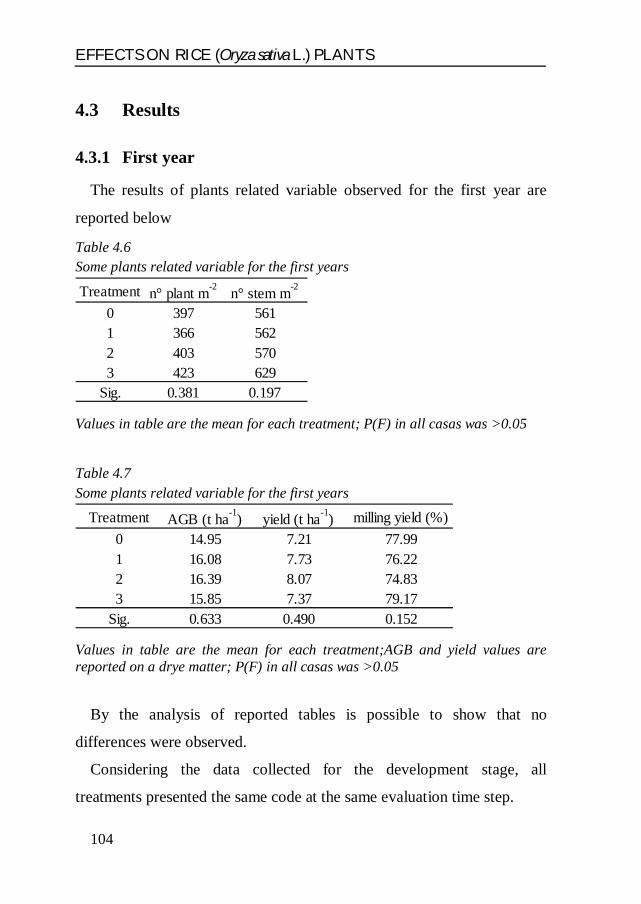
EFFECTS ON RICE (Oryza sativa L.) PLANTS
104
4.3 Results
4.3.1 First year
The results of plants related variable observed for the first year are
reported below
Table 4.6 Some plants related variable for the first years
Values in table are the mean for each treatment; P(F) in all casas was >0.05
Table 4.7 Some plants related variable for the first years
Values in table are the mean for each treatment;AGB and yield values are reported on a drye matter; P(F) in all casas was >0.05
By the analysis of reported tables is possible to show that no
differences were observed.
Considering the data collected for the development stage, all
treatments presented the same code at the same evaluation time step.
Treatment n° plant m-2 n° stem m-2
0 397 5611 366 5622 403 5703 423 629
Sig. 0.381 0.197
Treatment AGB (t ha-1) yield (t ha-1) milling yield (%)0 14.95 7.21 77.991 16.08 7.73 76.222 16.39 8.07 74.833 15.85 7.37 79.17
Sig. 0.633 0.490 0.152

Chapter 4
105
Results of the trace metals concentration into rice grain are following reported:
Table 4.8 Trace metals concentration in rice grains for the first year of experiment reported on dry matter
Values in table are the mean for each treatment; P(F) was >0.05 for each trace metals with the exception of Cadmium; S.E. = standard error
About cadmium result and analysing them by Ryan-Einot-Gabriel-Welsch F test, the homogeneous subset
identified were: 3a, 2a,b, 1b,c, 0c
TreatmentCu
(mg kg-1)Cr
(mg kg-1)Ni
(mg kg-1)Pb
(mg kg-1)Zn
(mg kg-1)Cd
(mg kg-1)Hg
(mg kg-1)As
(mg kg-1)0 3.29 19.59 9.40 0.17 27.80 0.13 0.06 0.211 3.54 20.03 9.49 0.17 25.97 0.13 0.06 0.232 3.30 14.72 6.72 0.19 26.85 0.06 0.05 0.243 4.05 19.24 9.04 0.18 32.59 0.05 0.04 0.26
Sig. 0.451 0.447 0.309 0.975 0.082 0.016* 0.274 0.973S.E. 0.511 3.538 1.578 0.062 2.376 0.026 0.011 0.109
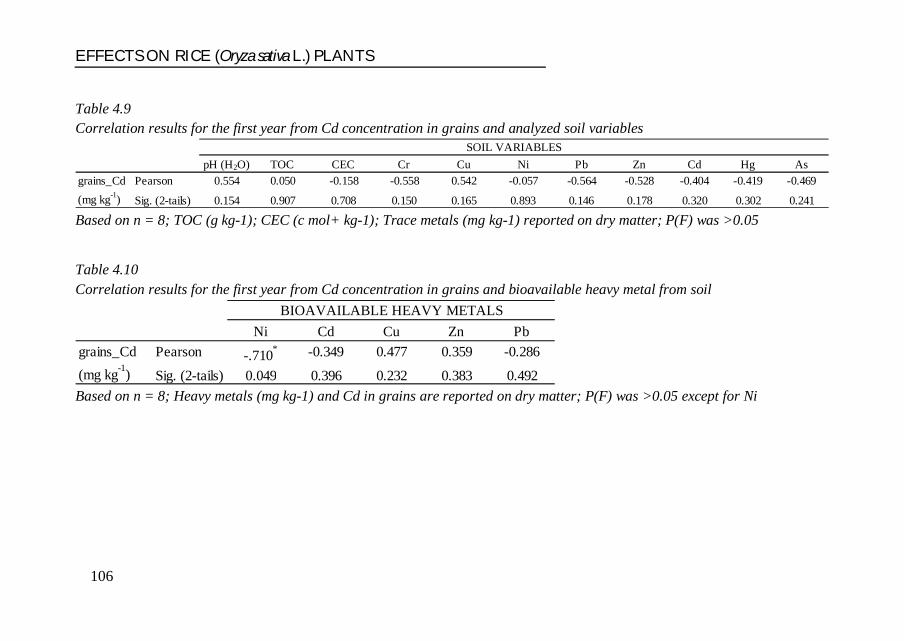
EFFECTS ON RICE (Oryza sativa L.) PLANTS
106
Table 4.9 Correlation results for the first year from Cd concentration in grains and analyzed soil variables
Based on n = 8; TOC (g kg-1); CEC (c mol+ kg-1); Trace metals (mg kg-1) reported on dry matter; P(F) was >0.05
Table 4.10 Correlation results for the first year from Cd concentration in grains and bioavailable heavy metal from soil
Based on n = 8; Heavy metals (mg kg-1) and Cd in grains are reported on dry matter; P(F) was >0.05 except for Ni
pH (H2O) TOC CEC Cr Cu Ni Pb Zn Cd Hg AsPearson 0.554 0.050 -0.158 -0.558 0.542 -0.057 -0.564 -0.528 -0.404 -0.419 -0.469
Sig. (2-tails) 0.154 0.907 0.708 0.150 0.165 0.893 0.146 0.178 0.320 0.302 0.241
grains_Cd (mg kg-1)
SOIL VARIABLES
Ni Cd Cu Zn PbPearson -.710* -0.349 0.477 0.359 -0.286
Sig. (2-tails) 0.049 0.396 0.232 0.383 0.492
grains_Cd (mg kg-1)
BIOAVAILABLE HEAVY METALS

Chapter 4
107
Below, is reported the Ni bioavailable vs. Cd in grains correlation chart:
Chart 4.1: correlation between bioavailable Ni from soil and grains Cd concentration for the first year

EFFECTS ON RICE (Oryza sativa L.) PLANTS
108
4.3.2 Second year
In the second year plant relate variables showed the following results: Table 4.11 Some plants related variable for the second years
Values in table are the mean for each treatment; P(F) in all casas was >0.05 Table 4.12 Some plants related variable for the second years
Values in table are the mean for each treatment;AGB and yield values are reported on a drye matter; P(F) in all casas was >0.05
As shown in tables above, is possible to note that no difference were
observed over the considered variables.
About development stage, all treatments presented the same code at the
same evaluation time step.
Treatment n° plant m-2 n° stem m-2
0 426 5371 384 5992 417 5593 392 563
Sig. 0.907 0.643
Treatment AGB (t ha-1) yield (t ha-1) milling yield (%)0 18.20 6.45 87.261 18.31 6.45 89.412 18.20 6.31 89.573 18.00 6.03 88.73
Sig. 0.954 0.657 0.729

Chapter 4
109
Results of the trace metals concentration in rice grain are reported below: Table 4.13 Trace metals concentration in rice grains for the second year of experiment reported on dry matter
Values in table are the mean for each treatment; P(F) was >0.05 for each trace metals. S.E. = standard error
TreatmentCu
(mg kg-1)Cr
(mg kg-1)Ni
(mg kg-1)Pb
(mg kg-1)Zn
(mg kg-1)Cd
(mg kg-1)Hg
(mg kg-1)As
(mg kg-1)
0 4.44 39.59 18.94 0.18 33.51 0.42 0.03 1.471 4.15 34.26 16.38 0.10 32.12 0.30 0.05 1.232 4.85 36.25 17.49 0.20 38.98 0.39 0.03 1.223 4.78 40.75 18.69 0.12 36.96 0.34 0.02 0.91
Sig. 0.600 0.625 0.759 0.083 0.449 0.317 0.406 0.529S.E. 0.567 5.411 0.445 0.038 4.512 0.062 0.016 0.364

EFFECTS ON RICE (Oryza sativa L.) PLANTS
110
Table 4.14 Correlation results for the second year from Cd concentration in grains and analyzed soil variables
TOC (g kg-1); CEC (c mol+ kg-1); Trace metals (mg kg-1) reported on dry matter; P(F) was >0.05
Table 4.15 Correlation results for the second year from Cd concentration in grains and bioavailable heavy metal from soil
Heavy metals (mg kg-1) and Cd in grains are reported on dry matter; P(F) was >0.05
pH (H2O) TOC CEC Cr Cu Ni Pb Zn Cd Hg AsPearson 0.039 0.024 0.021 0.098 -0.577 0.049 0.009 0.417 -0.035 -0.182 -0.374Sig. (2-tails) 0.926 0.955 0.960 0.817 0.135 0.908 0.984 0.305 0.935 0.665 0.361
SOIL VARIABLES
grains_Cd mg kg-1
Ni Cd Cu Zn PbPearson 0.618 -0.503 -0.250 0.062 0.188
Sig. (2-tails) 0.102 0.204 0.550 0.884 0.656grains_Cd
mg kg-1
BIOAVAILABLE HEAVY METALS
Chapter 4
4.4 Discussions
Observing and analysing plants related variables results, we can
hypothesize that over two years of experiment paddy field was quite
stable: no statistical difference was shown among treatments, especially
between control versus other treatments, where different input, both in
terms of quantity and quality, were applied.
Differently from the result of Sabey and Hart (1975) work’s, where the
application of sewage sludge near the crop seeding determined a
reduction in plants emergence, no negative effects were showed
following the application of defecation lime, deriving from sewage
sludge, at the same day of rice seeding (tables 4.6 and 4.12: n° plants
m2).
Results of trace metals concentration in rice grains showed that, for the
first year, for cadmium (Cd), statistical difference was observed (tables
4.8 and 4.9). This effect do not seem to be directly related to the
bioavailable amount of cadmium in soil because, as reported in the table
3.8, no difference were observed.
However is also important to note that soil bioavailable concentrations
are referred to the samples collected at the end of the year but not reflect
the dynamism of the process occurred during the growing season.
The hypothesys is that bioavailability of cadmium was different and
was changed during the growing season due to the flooded and unflooded
stages that occurred every week.
Some author reported that, when paddy field is flooded and the soil is
in a reducing condition, any Cd in the soil combines with sulphur (S) to
form CdS, which has a low solubility in water. However, when the field
EFFECTS ON RICE (Oryza sativa L.) PLANTS
112
is drained and the soil is in an oxidative condition, CdS is converted into
CdSO4, which is soluble in water. This means that the solubility of Cd
changes depending on the redox potential of the soil. (Arao et al., 2009;
Iimura,, 1978; Ito, 1976) This effect could have been enhanced to the soil
– acid in this experiment – pH which promote the heavy metals mobility
and bioavailability (Tlustoš et al., 2006; King, 1988; Heckman et al.,
1987; Kuo and McNeal, 1984; Harter, 1983; Dijkshoorn et al., 1981;
Street et al., 1978; Chaney et al., 1977)
Finally, for the first year, and according to the Commission regulation
(EC) n° 1881/2006 and its modification, where is reported the maximum
level allowed for some contaminant elements in foodstuffs, we observed
that for cadmium the concentration determined were less than the
maximum – 0.2 mg kg-1 –admitted.
At the end of second year, for each analysed variables, no statistical
difference were observed. Cadmium concentrations were over to the law
maximum concentration admitted. On the contrary and over two years
lead (Pb) – a Cd competitor in plants uptake (Tingqiang et al., 2012) –
concentrations in grains were under the maximum limit established by
law equal to 0.2 mg kg-1 as cadmium.
Analysing the tables 4.8 and 4.14, is possible to show that for the first
year Cd concentration in grain were lower than Pb while, for the second
year, opposite situation was observed.
This situation was not reflected for the soil total concentration where
Pb was more present than Cd overall years. We hypothesize that the
competition effects are not just between Cd to Pb but also from the other

Chapter 4
elements and also soil variable as pH, sorption site, redox potential plays
an important role in metal uptake. No correlation from Cd in grains to
other trace metals in soil – total and bioavailable – pH, CEC and TOC,
for the second years were observed while fir the first year Cd was slightly
and inversely correlated with bioavailable Ni (table 4.11; Sig. 0.049;
chart 4.1). Bing L. et al. (2012) observed a strong correlation (p <
0.0001) between brown rice concentration of Cd and micronutrients
elements as Ni (p < 0.0001) but, according to their result was observed a
direct correlation (r = 0.41). No results were collected about redox
potential evolution during the years so additional studies should be done
in order to define its effects on trace metals behaviour. Further study
could be also helpful to observe if the correlation show from bioavailable
Ni and Cd in grains will change over the year.

EFFECTS ON RICE (Oryza sativa L.) PLANTS
114
4.5 Conclusions
Defecation lime application, according to the management applied and
result collected, did not show negative effects over all plants related
variables.
Due to the behaviour of the system analysed, where no difference were
observed from treatments, especially from the control to the others, we
suggest that, to evaluate its evolutions, further years of studies should be
done.
Concerning trace metals concentration and especially for Cd, attention
must be carrying out to its concentration in grains because at the end of
second years its values were upper than the maximum level imposed by
law.
Also to this results and due to the high variation from Cd concentration
from first year to second year and the correlation between bioavailable Ni
and Cd in grains, further analysis are required in order to well establish
which are the process involved.


116
Chapter 5

Chapter 5
117
Conclusions
Reusing of bio-processing waste and biological by-products has risen
of importance over last years. By anthropogenic activity in fact high
quantity of those products are generated daily.
If managed and controlled properly they could be used for agricultural
purposes. Depending of the process by which they were produced and by
which they were stabilized they could be used as fertilizer, soil
conditioner, corrective or growing media.
Stabilization is required in order to reduce organic matter and water
content, emission of unpleasant odors, and concentrations of pathogenic
microorganisms (Straub et al., 1993).
Among biological processing waste obtained from industrial and
municipal wastewater plans, sewage sludge have great importance.
Sewage sludge, after proper stabilization are largely disposed in
agricultural soil as fertilizer thanks to their value in terms of organic
matter, nitrogen, phosphorus and other nutrients contents.
Different process can be used to stabilize these products such as
alkaline stabilization, composting, aerobic and anaerobic digestion. A
process similar to the alkaline stabilization is the one used for defecation
lime producing process. In this process biological products is processed
with calcium oxide (CaO) and then with sulphuric acid (H2SO4).
Specifically and according to Legislative Decree 75/2010, defecation
lime is “the product obtained by the hydrolysis of biological materials by
lime and/or sulphuric acid and subsequent calcium sulphate
precipitation”. Defined by law as “calcium and magnesium corrective

CONCLUSIONS
118
products”, they must contain at least 20% of calcium oxide (CaO) and
15% of sulphuric anhydride (SO3).
Unfortunately no references about the application of defecation lime,
from sewage sludge, were found.
The aim of this PhD thesis was to evaluate the effects of defecation
lime in agricultural land, following their disposal, on soil chemical
characteristics and plants.
In order to evaluate their effects a two years experiments were done.
Field area was selected not far from defecation lime producing plants,
specifically a paddy field located in Cava Manara (Pavia, Lombardy) was
used.
At the end of experiment and by the result collected over the soil
chemical characteristics, no restriction or contraindication can be
established related to the application of defecation lime in paddy fields.
Also if other evaluation should be needed, these products seem could be
potentially used to control soil pH. This conclusion is not ultimate
because the two years period of the study could be not sufficient for asses
the evolution of this soil characteristics: in fact according to the good
management practices, soil analysis should be carried out every five
years in order to evaluated the evolution of the soil and in any case
before the defecation lime spreading.
Concerning plants related variables, no statistical difference were
observed so, also in this case, no contraindication can be established. It is
important that there is not depressive effects on plan emergence, as
highlighted for sewage sludge.
Chapter 5
119
Regarding trace metals concentration in grains and especially for Cd,
attention must be carrying out due to the values, upper than the limit
fixed by law, observed at the end of second years.
According to these results, we suggest that further years of studies
would be required to well establish what are the process involve in the
observed phenomena and to know the evolution of the system.
It would be interesting to consider all the input that could be affect
trace metals concentration as: fertilizer applied, irrigation water,
fungicide by which seeds are coated, and eventually all the plant
protection products used.
Furthermore is needed to evaluate the rexod potential of the soil and its
variation induced by soil flooding. Eventually the behaviour of different
rice variety could be assessed.
In conclusion we reported that to establish the effects of defecation
lime over different crops and different soils, thanks to the partnership of
the defecation lime production plant and a farm located in a different area
(Broni, Pavia, 45.087 N, 9.266 E, 70 m a.s.l.), compared to paddy field, a
new study is doing on winter wheat since 2012.
The first result about the effects on winter wheat about the last
growing season are still under analysis so are not reported here.


121
References
Acutis, M., Scaglia, B., Confalonieri, R., 2012. Perfunctory analysis of variance in agronomy, and its consequences in experimental results interpretation. European. Journal of Agronomy 43, pp 129–135
Acutis, M., Scaglia, B., Confalonieri, R., 2012. Perfunctory analysis of variance in agronomy, and its consequences in experimental results interpretation. European. Journal of Agronomy 43, pp 129–135
Ambrosio, L., Iglesias, L., Marin, C., del Monte, J.P., 2004. Evaluation of sampling methods and assessment of the sample size to estimate the weed seedbank in soil, taking into account spatial variability. Weed Res. 44, 224–236.
Antonious, G.F., Patterson, M.A., Snyder, J.C., 2003. Pesticide residues in soil and
quality of potato grown with sewage sludge. Bull. Environ. Contam. Toxicol. 71,
315–322.
Aparicio, J., Santos, L., Alonso, E., 2007. Simultaneous sonication-assisted extraction,
and determination by gas chromatography-mass spectrometry, of di-
(2ethylhexyl)phthalate, nonylphenol, nonylphenol ethoxylates and polychlori-
nated biphenyls in sludge from wastewater treatment plants, Anal. Chim. Acta.
584, 455–461
Arao, T., Kawasaki, A., Baba, K., Mori, S., Matsumoto, S., 2009. Effects of Water Management on Cadmium and Arsenic Accumulation and Dimethylarsinic Acid Concentrations in Japanese Rice. Environmental Science Technology 43, p.p. 9361–9367
Araujo, A.P., Fernandes, A.M., Kubota, F.Y., Brasil, F.C., Teixeira, M.G., 2004. Sample size for measurement of root traits on common bean by image analysis. Pesquisa Agropecuaria Brasileira 39, 313–318.
Arthurson, V., 2008. Proper Sanitization of Sewage Sludge: a Critical Issue for a Sustainable Society. Appl Environ Microbiol. 74(17): 5267–5275.
Arthurson, V., 2008. Proper Sanitization of Sewage Sludge: a Critical Issue for a Sustainable Society. Appl Environ Microbiol. 74(17): 5267–5275.
Arthurson, V.Proper sanitization of sewage sludge: a critical issue for a sustainable
society. Applied Environment Microbiology. 74 (17): 5267-527
122
Baneriee, M.R., Burton, D.L, Depoe, S., 1997. Impact of sewage sludge application
on soil biological characteristics. Agriculture, Ecosystems and Eneironment 66.
241-249
Baraldi, G., Bertuzzi, S., Bovolenta, S., Campagna, G., 2006. First results of carbonatation lime application in alkaline soil. Proceedings 0f the 69th IIRB Congress – Brussels. February 15th & 16th 2006, 319.
Bartlett, M.S., 1937. Some examples of statistical methods of research in agriculture and applied biology. J. Roy. Stat. Soc. B (Suppl. IV), 137–170.
Baveye, P., McBridge, M. B., Bouldin, D., Hinesly, T. D., Dahdoh, M. S. A. and
Abdel-Sabour, M. F. 1999. Mass balance and distribution of sludge-borne trace
elements in a silt loam following long-term application of sewage sludge. Sci.
Total Environ. 227(1): 13{28.
Bhogal, A., Nicholson, F.A., Chambers, B.J., 2003. Effects of past sewage sludge
additions on heavy metal availability in light textured soils: implications for crop
yields and metal uptake. Environ. Pollut. 121, 413–423
Bhogal, A., Nicholson, F.A., Chambers, B.J., 2003. Effects of past sewage sludge additions on heavy metal availability in light textured soils: implications for crop yields and metal uptake. Environ. Pollut. 121, 413–423
Bing, L., Xun, W., Xiaoli, Q., Lu, H., Zhihong, Y. 2012. Identification of rice cultivars with low brown rice mixed cadmium and lead contents and their interactions with the micronutrients iron, zinc, nickel and manganese. Journal of Environmental Sciences 2012, 24(10). p.p. 1790–1798
Bobbiesi, G., Fratoni, F., Beneduce, G., 2009 EUROPEAN PATENT
APPLICATION. Bulletin 2009/52
Brallier, S., Harrison, R. B., Henry, C. L., Dongsen, X., 1996. Liming effects on
availability of Cd, Cu, Ni and Zn in a soil amended with sewage sludge 16 years
previously. Water, Air and Soil Pollution. 86, 195-206
Burnham, J. C., 1992: Methods for treating wastewater sludge. Unified Environmental
Services Group: US005135664A
Carmen Antolí, M., Iara, M., Sánchez-Díaz, M., 2012. Sewage sludge application can
induce changes in antioxidant status of nodulated alfalfa plants. Ecotoxicology
and Environmental Safety 73 (2010) 436–442

123
Carrington, E. G., 2001. Evaluation of sludge treatments for pathogen re-duction—
final report. European Commission report no. CO 5026/1. Office for Official
Publications of the European Community, Luxembourg
Chaney, W.R., Strickland, R.C., Lamoreaux, R.J. (1977): Phytotoxicity of cadmium inhibited by lime. Plant and Soil 47, 275-278.
Commission of the European Communities, 1998. Commission Directive of 27
February 1998 amending Council Directive 91/271/EEC with respect to certain
requirements established in Annex I (98/15/EEC)
Commission regulation (EC) n° 1881/2006 of 19 December 2006 setting maximum levels for certain contaminants in foodstuffs
Confalonieri, R., 2004. A jackknife-derived visual approach for sample size deter mination. Ital. J. Agrometeorol. 9, 9–13.
Confalonieri, R., Acutis, M., Bellocchi, G., Genovese, G., 2007. Resampling-based
software for estimating optimal sample size. Environmental Modelling &
Software 22, 1796-1800
Confalonieri, R., Acutis, M., Bellocchi, G., Genovese, G., 2007. Resampling-based
Confalonieri, R., Acutis, M., Bellocchi, G., Genovese, G., 2007. Resampling-based software for estimating optimal sample size. Environmental Modelling & Software, 22, 1796-1800.
Confalonieri, R., Mariani, L., Bocchi, S., 2005. Analysis and modelling of water and near water temperatures in flooded rice (Oryza sativaL.). Ecological Model. 183, 269–280.
Confalonieri, R., Perego, A., Chiodini, M.E., Scaglia, B., Rosenmund, A.S., Acutis,
M., 2009. “Analysis of sample size for variables related to plant, soil, and soil
microbial respiration in a paddy rice field.” Field Crops Research, 113, 125-130.
Confalonieri, R., Stroppiana, D., Boschetti, M., Gusberti, D., Bocchi, S., Acutis, M., 2006. Analysis of rice sample size variabilitydue todevelopment stage, nitrogen fertilization, sowing technique and variety using the visual jackknife. Field Crops Res. 97, 135–141.
Council Directive 86/278/EEC of 12 June 1986 on the protection of the environment, and in particular of the soil, when sewage sludge is used in agriculture
Council Directive 91/271/EEC of 21 May 1991 concerning urban waste water treatment.

124
Council of the European Communities, 1986. Council Directive of 12 June 1986 on
the protection of the environment, and in particular of the soil, when sewage
sludge is used in agriculture (86/278/EEC). Off. J. EC L181, 6–12
Council of the European Communities, 1991. Council Directive of 21 May 1991
concerning urban waste-water treatment (91/271/EEC). Off. J. EC, L135.
D.G.R 9953/09: Regional Decree of 29 July 2009 concerning the suspension of the
wastewater sludge disposal into agricultural land.
D.G.R 9953/09: Regional Decree of 29 July 2009 concerning the suspension of the
wastewater sludge disposal into agricultural land.
D.Lgs 75/2010: Legislative Decree of 29 April 2010 concerning fertilizers
reorganization and revision pursuant to article 13, law 88 of 7 July 2009.
D.Lgs 75/2010: Legislative Decree of 29 April 2010 concerning fertilizers
reorganization and revision pursuant to article 13, law 88 of 7 July 2009.
D.Lgs 75/2010: Legislative Decree of 29 April 2010 concerning fertilizers reorganization and revision pursuant to article 13, law 88 of 7 July 2009.
D.Lgs 99/92: Legislative Decree of 27 Jannuary 1992 concerning the environmental
protection related to the sewage sludge agricultural application
D’Agostino, R.B., 1970. Transformation to normality of the null distribution of g1. Biometrika 57, 679–681.
D’Agostino, R.B., 1986. Tests for the normal distribution. In: D’Agostino, R.B., Ste-phens, M.A. (Eds.), Goodness-of-Fit Techniques. Marcel Dekker, New York, NY, USA, pp. 367–419.
D’Agostino, R.B., Belanger, A., D’Agostino Jr., R.B., 1990. A suggestion for using powerful and informative tests of normality. Am. Stat. 44, 316–321.
Dai, J.Y., Chen, Ling, Zhao, Jian-fu, MA, Na, 2006. Characteristics of sewage sludge
and distribution of heavy metal in plants with amendment of sewage sludge. J.
Environ. Sci. 18, 1094–1100
Davis, A., Eary, L. E. and Helgen, S. 1999. Assessing the e±cacy of lime amendment
to geochemically stabilize mine tailings. Environ. Sci. Technol. 33: 2 626{2 632
Dijkshoorn, W. J. E. M., Broekhoven, L. W., 1981. Influence of soil pH on heavy
metals in ryegrass from sludge-amended soil. Plant and Soil 61, p.p 277-284.
Ente Nazionale Risi (ENR): http://www.enterisi.it/servizi/bilanci/bilanci_fase01.aspx?Campo_15868=10
125
EPA, 2007. Method EPA 3051A. Microwave assisted acid digestion of sediments,
sludges, soils and oils.
EPA, 2007. method EPA 6020A. Elements determination by inductively coupled plasma-mass spectrometry (ICP-MS)
Faithfull, N.T., 2002. In: CABI Publishing (Ed.), Methods in Agricultural Chemical Analysis: a Practical Handbook. CAB International, Wallingford, Oxon OX10 8DE, UK.
Fang, M. and Wong, J. W. C. 1999. Effects of lime amendment on availability of
heavy metals and maturation in sewage sludge composition. Environmental
Pollution. 106: 83{89
Fernández, J.M., Plaza, C., Garcı´a-Gil, J.C., Polo, A., 2009. Biochemical properties
and barley yield in a semiarid Mediterranean soil amended with two kinds of
sewage sludge. Appl. Soil Ecol. 42, 18–24.
Gantzer, C., Gaspard, P., Galvez, L., Huyard, A., Dumouthier, N., Schwartzbrod, J.,
2001. Monitoring of bacterial and parasitological contamination during various
treatment of sludge. Water Res. 35:3763–3770
García, C., Hernández, T., Pascual, J.A., Moreno, J.L., Ros, M., 2000. Microbial
activity in soils of SE Spain exposed to degradation and desertification
processes: strategies for their rehabilitation. In: Garcı´a, C., Herna´ndez, T.
(Eds.), Research and Perspectives of Soil Enzymology in Spain, CEBAS. CSIC,
Murcia, pp. 93–143.
García-Gil, J.C., Plaza, C., Senesi, N., Brunetti, G., Polo, A., 2004. Effects of sewage
sludge amendment of humic acids and microbiological properties of a semiarid
Mediterranean soil. Biol. Fertil. Soils 39, 320–328.
Garrido, S., Del Campo, G.M., Esteller, M.V., Vaca, R., Lugo, J., 2005. Heavy metals
in soil treated with sewage sludge composting, their effect on yield and uptake of
broad bean seeds (Vicia fabaL.). Water Air Soil Pollut. 166, 303–319
Garrido, S., Del Campo, G.M., Esteller, M.V., Vaca, R., Lugo, J., 2005. Heavy metals
in soil treated with sewage sludge composting, their effect on yield and uptake of
broad bean seeds (Vicia fabaL.). Water Air Soil Pollut. 166, 303–319
Garrison, S., Levesque, C.S, Leclaire, J., Chang, A.C., 1983. Trace metal chemistry in arid-zone field soils amended with sewage sludge: III. Effect of time on the

126
extraction of trace metals. Soil Science Society of America Journal. Vol. 47, 5, p. 898-902
Ghanavati, N., Nadian, H.A., Moezy, A.A., Rejali, F., 2012. Effects of sewage sludge
on growth and nutrients uptake by Hordum vulgare as affected by two species of
arbuscular-mycorrhizal fungi. Advances in Environmental Biology
Ghanavati, N., Nadian, H.A., Moezy, A.A., Rejali, F., 2012. Effects of sewage sludge on growth and nutrients uptake by Hordum vulgare as affected by two species of arbuscular-mycorrhizal fungi. Advances in Environmental Biology
Gibbs, P. A., Chambers, B. J, Chaudri, A.M. McGrath, S. P., Carlton-Smith, C. H.,
Bacon, J.R., Campbell, C. D., Aitken, M.N.,2006 .Initial results from a long-
term, multi-site field study of the effects on soil fertility and microbial activity of
sludge cakes containing heavy metals. Soil Use and Management, 22,11–21
Gibbs, R. A., Hu, C. J., Ho, G. E., Philips, P. A., Unkovich, I.,1995. Pathogen die-off
in stored wastewater sludge. Water Sci. Technol.31:91–95
Goldfarb, W., Krogmann, U., Hopkins, C., 1999. Unsafe sewage sludge or beneficial
biosolids? Liability, planning, and management issues regardingthe land
application of sewage treatment residuals. Boston Coll. Environ. Affairs Law
Rev.26:687–768.
Goldfarb, W., U. Krogmann, and C. Hopkins. 1999. Unsafe sewage sludge or beneficial biosolids? Liability, planning, and management issues regarding the land application of sewage treatment residuals. Boston Coll. Environ. Affairs Law Rev. 26:687–768.
Goldfarb, W., U. Krogmann, and C. Hopkins.1999. Unsafe sewage sludge or
beneficial biosolids? Liability, planning, and management issues regarding the
land application of sewage treatment residuals. Boston Coll. Environ. Affairs
Law Rev.26:687–768
González-Fernández, P., Espejo-serrano, R., Ordóñez-Fernández, R., Peregrina-
Alonso, F., 2004. Comparative studies of the efficiency of lime refuse from
sugar beet factories as an agricultural liming material. FAO European
Cooperative Research. Material Nutrient and Carbon Cycling in Sustainable
Plant-Soil System, 157.
González-Fernández, P., Espejo-serrano, R., Ordóñez-Fernández, R., Peregrina Alonso, F., 2004. Comparative studies of the efficiency of lime refuse from

127
sugar beet factories as an agricultural liming material. FAO European Cooperative Research. Material Nutrient and Carbon Cycling in Sustainable Plant-Soil System, 157.
Harter, R.D., 1983. Effect of Soil pH on Adsorption of Lead, Copper, Zinc, and Nickel. Soil Sci. Soc.Am. J. Vol. 47, (1), p. 47-51
Heather, L. F., Lloyd, H. K. Jr, 2000. Trace metal concentration in durum wheat from
application of sewage sludge and commercial fertilizer. Advances in
Environmental Research 4, 347-355
Heckman, J.R, Angle, J. S., Chaney, R. L., 1987. Residual Effects of Sewage Sludge on Soybean: I. Accumulation of Heavy Metals. Journal of Environmental Quality 16: 2: 113-117
Hsiau, P. C, Lo, S. L. 1998. Fractionation and leachability of Cu in lime-treated
sewage sludge. Water Res. 32: 1103{1 108
Iimura, K.; Ito, H. Behavior and balance of contaminant heavy metals in paddy soils: Studies on heavy metal pollution of soils (Part 2).Bull. Hokuriku Natl. Agric. Exp. Stn.1978,21, 95–145 (in Japanese)
ISO 16072, 2002. Soil quality: laboratory methods for determination of microbial soil respiration.
ISO/DIS 14870, ISO 14876, ISO 11046 method of bioavailable heavy metals extraction from acid soil
ISTAT catalog: http://www.istat.it/it/
Ito, H.; Iimura, K. The absorption and translocation of cadmium in rice plants and its influence on their growth, in comparison with zinc: Studies on heavy metal pollution of soils (Part 1).Bull.Hokuriku Natl. Agric. Exp. Stn.1976, 19, 71–139, in Japanese.
Jamali, M. K., Kazi, T. G., Arain, M. B., Afridi, H. I., Memon, A. R., Jalbani, N.,
Shah, A., 2008. Use of sewage sludge after liming as fertilizer for maize growth.
Pedosphere 18(2): 203{213
James-Pirri, M.J., Roman, C.T., Heltshe, J.F., 2007. Power analysis to determine sample size for monitoring vegetation change in salt marsh habitats. Wetlands Ecol. Manage. 15, 335–345.
King, L.D., 1988. Retention of cadmium by several soils of the southeast-ern United States, J. Environ. Qual. 17, 246–250.

128
Klute, A., 1986. Water retention: labortory methods. In: Klute, A. (Ed.), Methods of Soil Analysis, (Part 1), Agronomy Monograph. No. 9. 2nd Ed. ASA and SSSA, Madison, WI.
Krebs, R., Gupta, S. K., Furrer, G. and Schulin, R. 1998. Solubility and plant uptake
of metals with and without liming of sludge amended soils. J. Environ. Qual. 27:
18{23
Kuo, S., McNeal, B.L., 1984. Effect on pH and phosphate on cadmium sorpyion by hydrous ferric oxide. Soil Sci. Soc. Am. J. 48: 1040-1044
Lancashire, P.D., Bleiholder, H., Langelu¨ddecke, P., Stauss, R., Van den Boom, T., Weber, E.,Witzenberger, A., 1991. Anuniformdecimal code for growth stages of crops and weeds. Ann. Appl. Biol. 119, 561–601.
Lancashire, P.D., Bleiholder, H., Langelu¨ddecke, P., Stauss, R., Van den Boom, T., Weber, E.,Witzenberger, A., 1991. Anuniformdecimal code for growth stages of crops and weeds. Ann. Appl. Biol. 119, 561–601.
Lapitan, R.L., Dabu, J.M., Rosario, E.L., 1979. Optimumsample size and best sampling design for maximum accuracy in measuring yield components of sugarcane. Philippine J. Crop Sci. 4, 78–82.
Lavado, R.S., 2006. Effects of sewage sludge application on soils and sunflower yield:
quality and toxic element accumulation. J. Plant Nutr. 29, 975–984.
Lavado, R.S., 2006. Effects of sewage sludge application on soils and sunflower yield: quality and toxic element accumulation. J. Plant Nutr. 29, 975–984
Levene, H., 1960. Robust tests for equality of variances. In: Olkin, I. (Ed.), Contributions to Probability and Statistics: Essay in Honor of Harold Hotelling. Stanford University Press, Stanford, CA, pp. 278–292.
Lima e Silva, P.S., Barbosa, Z., Goncalves, R.J., de, S., Barbosa e Silva, P.I., Nunes, G.H., de, S., 2005. Sample size for the estimation of some sorghum traits. Revista Brasileira de Milho e Sorgo 4, 149–160.
Lutin, F., Bailly, M., Bar, D., 2002. Process improvements with innovative
technologies in the starch and sugar industrines. Desalination, 148 (1-3), 121.
Madhumita Das, 2007. Spatial variability of soil hydraulic conductivity in an irrigation command. J. Indian Soc. Soil Sci. 55, 10–13.
Mae, T., Ohira, K., 1981. The remobilization of nitrogen related to leaf growth and senescence in rice plants (Oryza sativaL.). Plant Cell Physiol. 22, 1067–1074.

129
Martin, T.N., Storck, L., Lu´cio, A.D., Lorentz, L.H., 2005. Plano amostral em parcelas de milho para avaliação de atributos de espigas. Ciência Rural 35, 1257–1262.
Martinez, F., G. Cuevas, R. Calvo, I. Walter, 2003. Biowaste effects on soil and native
plants in a semiarid ecosystem. J. Environ. Qual., 32: 472-479.
Martinez, F., G. Cuevas, R. Calvo, I. Walter, 2003. Biowaste effects on soil and native plants in a semiarid ecosystem. J. Environ. Qual., 32: 472-479
Masharipova, S., Olsson, M., KTH, Industriell ekolog Application of defecation lime
from sugar industry in Uzbekistan, 2006. KTH Chemical Engineering and
Technology. Master of Science Thesis
Masharipova, S., Olsson, M., KTH, Industriell ekolog Application of defecation lime
from sugar industry in Uzbekistan, 2006. KTH Chemical Engineering and
Technology. Master of Science Thesis
Masharipova, S., Olsson, M., KTH, Industriell ekolog Application of defecation lime
from sugar industry in Uzbekistan, 2006. KTH Chemical Engineering and
Technology. Master of Science Thesis
Mc Grath, S., Postma, L., McCormack, R.J., Dowdall, C., 2000. Analysis of Irish
sewage sludges: suitability of sludge for use in agriculture. Ir. J. Agric. Food
Res. 39, 73–78
Metcalf, Eddy, Inc. (2003), Wastewater engineering treatment and reuse, Fourth
Edition, McGrawHill, New York.
Moore, J.D., Camire, C., Ouimet, R. 2000 Effects of liming on the nutrition, vigour,
and growth of sugar maple at the lake clair watershed, Quebec, Canada.
Canadian Journal of Forest Research, 30 (5), 725.
Nath, N., Singh, S.P.N., 1989. Determination of sample size and sample number for armyworm populations studies. Oryza 26, 285–287.
Ntanos, D.A., Koutroubas, S.D., 2002. Dry matter N accumulation and translocation for Indica and Japonica rice under Mediterranean conditions. Field Crops Res. 74, 93–101.
Ojiambo, P.S., Scherm, H., 2006. Optimum sample size for determining disease severity and defoliation associated with Septoria leaf spot of blueberry. Plant Dis. 90, 1209–1213.
Page, A.L., Logan, T.J., Ryan, J.A. (Eds.), 1987. Land Application of Sludge.. Lewis
Publishers, Chelsea, MI

130
Paleckienė, R., Sviklas, A. M., Šlinkšienė, R., 2007. The Role of Sugar Factory Lime
on Compound Fertilizer Properties. Polish J. of Environ. Stud. Vol. 16, No. 3.
Peles, J. D., Brewer, S. R. and Barret, G. W. 1998. Heavy metal accumulation by old field plant species during recovery of sludge treated ecosystems. Am. Midl. Nat. 140: 245{251
Przewrocki, P., Kulczycka, J., Wzorek, Z., Kowalski, Z., Gorazda, K., Jodko, M., 2004. Risk analysis of sewage sludge—Poland and EU comparative approach. Pol. J.Environ. Stud. 13, 237–244.
Ross, S. M. 1994. Retention, transformation and mobility of toxic metals in soils. In Ross, S. M. (ed.) Toxic Metals in Soil-Plant Systems. John Wiley and Sons Ltd., Chichester. pp. 63{152.
Sabey B.R., Hart W.E., 1975. Land application of sewage sludge: I. Effect on growth
and chemical composition of plant. Journal of Environ Quality 4:252-256.
Sánchez-Brunete,C., Miguel, E., Tadeo, J.L., 2008. Determination of organochlorine
pesticides in sewage sludge by matrix solid-phase dispersion and gas
chromatography-mass spectrometry. Talanta 74 (5), 1211–1217
Sauve, S., Hendershot, W., Allen, H., 2000. Solid-Solution Partitioning of Metals in
Contaminated Soils: Dependence on pH, Total Metal Burden, and Organic
Matter. Environmental Science & Technology. 34 (7): 1125–1131
Scientific report of SIQURISO: Sicurezza e qualità del riso italiano per una
produzione più competitiva, 2009.
Scientific report of SIQURISO: Sicurezza e qualità del riso italiano per una
produzione più competitiva, 2009.
Shapiro, S.S., Wilk, M.B., 1965. An analysis of variance test for normality (complete samples). Biometrika 52, 591–611.
Singh, R.P., Agrawal, M., 2007. Effects of sewage sludge amendment on heavy metal
accumulation and consequent responses ofBeta vulgaris plants. Chemosphere 67,
2229–2240
Singh, R.P., Agrawal, M., 2008. Potential benefits and risks of land application of
sewage sludge. Waste Manage. 28, 347–358
Singh, R.P., Agrawal, M., 2008. Potential benefits and risks of land application of
sewage sludge. Waste Manage. 28, 347–358

131
Singh, RP, Agrawal, M., 2010. Variations in heavy metal accumulation, growth and
yield of rice plants grown at different sewage sludge amendment rates.
Ecotoxicology and Environmental Safety 73, pp 632–641
Snedecor, G.W., Cochran, W.G., 1967. Statistical Methods, 6th Ed. Iowa State
software for estimating optimal sample size. Environ. Model. Software 22, 1796–1800.
Speir, T.W., Van Schaik, A.P., Percival, H. J., Close, M. E., Pang, L., 2003. Heavy
metals in soil, plants and groundwater following high-rate sewage
sludgeapplication to land. Water, Air, and Soil Pollution150: 319–358
Stephen, R. S., 2009. A critical review of the bioavailability and impacts of heavy
metals in municipal solid waste composts compared to sewage sludge.
Environment International 35, 142–156
Storck, L., Lopes, S.J., Cargnelutti Filho, A., Martini, L.F.D., Carvalho, M.P.de., 2007. Sample size for single, double and triple hybrid corn ear traits. Scientia Agricola 64, 30–35.
Straub, T. M., I. L. Pepper, and C. P. Gerba. 1993. Hazards from pathogenic
microorganisms in land-disposed sewage sludge. Rev. Environ. Contam.
Toxicol.132:55–91
Straub, T. M., I. L. Pepper, and C. P. Gerba.1993. Hazards from pathogenic
microorganisms in land-disposed sewage sludge. Rev. Environ. Contam.
Toxicol.132:55–91
Straub, T. M., Pepper, I. L., Gerba, C. P., 1993. Hazards from pathogenic
microorganisms in land-disposed sewage sludge. Rev. Environ. Contam.
Toxicol.132:55–91
Street, J. J., Sabey, B., Lindsay, W. L., 1978. Influence of pH, phosphorus, cadmium,
sewage sludge and incubation time on the solubility and plant uptake of
cadmium. J. Environ. Qual. 7, 286-290.
Tadesse, W., Shuford, J.W., Taylor, R.W., Adriano, D.C., Sajwan, K.S., 1991.
Comparative availability to wheat of metals from sewage-sludge and inorganic
salts. Water Air Soil Pollut. 55, 397–408
Theodorates, P., Moirou, A., Xenidis, A., Paspaliaris, I., 2000. The use of municipal
sewage sludge for the stabilization of soil contaminated by mining activities.
J.Hazard. Mater. B77, 177–191
132
Thompson, S.K., 1992. Sampling. Wiley, New York, US, p. 343.
Timmer, V. R., Teng, Y., Pedlar, J., 2003. Soil and leaf analysis of fertilized sugar
maple stands after ice storm damage. Forestry Chronicle, 79(1), 99.
Tingqiang, L, Hong, J,Xiaoe, Y., Zhenli, H., 2012. Competitive sorption and
desorption of cadmium and lead in paddy soils of eastern China. Environmental
Earth Science.
Tlustoš, P., Száková, J., Kořínek, K., Pavlíková, D., Hanč, A., Balík, J., 2006. The
effect of liming on cadmium, lead, and zinc uptake reduction by spring wheat
grown in contaminated soil. Plant Soil Environ. 52, (1): 16–24
Tsadilas, C.D., Matsi, T., Barbayiannis, N., Dimoyiannis, D., 1995. Influence of
sewage sludge application on soil properties and on the distribution and
availability of heavy metal fractions. Commun. Soil Sci. Plant Anal. 26, 2603–
2619.
Tsadilas, C.D., Matsi, T., Barbayiannis, N., Dimoyiannis, D., 1995. Influence of
sewage sludge application on soil properties and on the distribution and
availability of heavy metal fractions. Commun. Soil Sci. Plant Anal. 26, 2603–
2619
Tsakou, A., Roulia, M., Christodoulakis, N.S., 2002. Growth of flax plants (Linum
usitatissimum) as affected by water and sludge from a sewage treatment plant.
Bull. Environ. Contam. Toxicol. 68, 56–63.
Tsegaye, T., Hill, R.L., 1998. Intensive tillage effects on spatial variability of soil physical properties. Soil Sci. 163, 143–154.
Tukey, J.W., 1958. Bias and confidence in not quite large samples. Ann. Math. Stat. 29, 614 (Abstract).
Uchijima, Z., 1976. Microclimate of the rice crop. In: Proceedings of the Symposium on Climate and Rice, IRRI.
United Stated Department of Agriculture, Soil Survey Division Staff. 1993.
Examination and Description of Soils. Soil survey manual. Chapter 3, pp 2-110.
University Press, Ames, IA.
VanDiepen, C.A., Rappoldt, C.,Wolf, J., VanKeulen, H., 1988. Cropgrowth simulation model WOFOST. In: Documentation Version 4.1, Centre for world food studies, Wageningen, p. 299.
133
Violante, A., Cozzolino, A., Perelomov, L., Caporale, A.G., Pigna, M., 2010. Mobility
and bioavailability of heavy metals and metalloids in soil environments. J. Soil.
Sci. Plant Nutr. 10 (3): 268 - 292
Wang, Q.R., Cui, Y.S., Liu, X.M., Dong, Y.T., Christrie, P., 2003. Soil contamination
and plant uptake of heavy metals at polluted sites in China. J. Environ. Sci.
Health (A) 38, 823–838
Wargo, P. M., Minocha, R., Wong B. L., Long, R. P., Horsley, S. B., Hall, T. J., 2002
Measuring changes in stress and vitality indicators in limed sugar maple on the
allegheny plateau in north-central Pennsylvania. Canadian Journal of Forest
Research, 32(4), 629.
Yoshizaki, S. and Tomida, T. 2000. Principle and process of heavy metal removal
from sewage sludge. Environ. Sci. Technol. 34: 1 572{1 575.
134
Curriculum vitae
Marcello Ermido Chiodini was born in Magenta (MI) on December 30,
1983. He achieved a first level graduation in Plants Production Science,
from the University of the Study of Milan, on 22th February 2006 (mark
110/110 cum laude). On 6th December 2008 he achieved a secondary
graduation in Plant Production and Protection Science (mark 110/110
cum laude), from the same University. Since the graduation he worked
continuously from the Department of Plant Production of the University
of Milan, working on rice cultivation issue. From December 2010 he was
admitted in a PhD in Agricultural Ecology from the University of the
Study of Milan, obtaining a scholarship.


![Defecation Reflex [Compatibility Mode]](https://static.fdocuments.us/doc/165x107/5451cb86af795908308b4af3/defecation-reflex-compatibility-mode.jpg)