Application Note...Verification of Automated 8 Sample HyCEAD Processing on VERSA 1100 Gene Method...
8
Application Note
Transcript of Application Note...Verification of Automated 8 Sample HyCEAD Processing on VERSA 1100 Gene Method...

Application Note
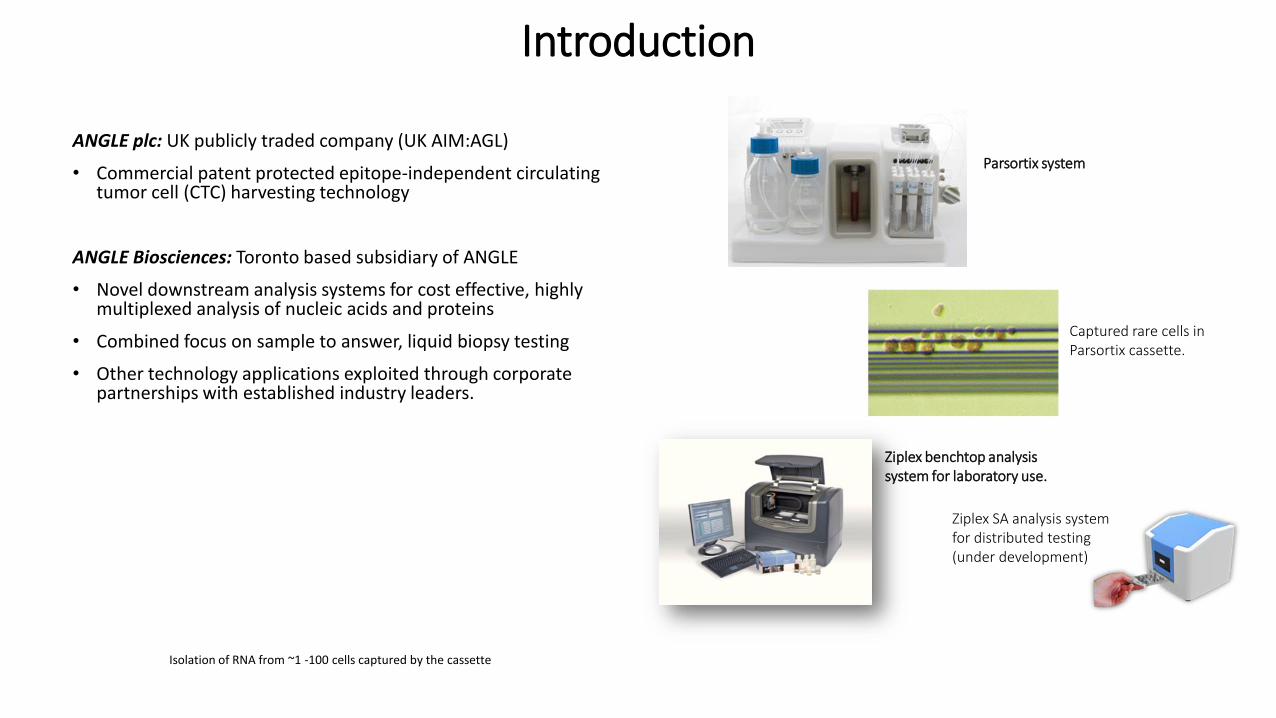
ANGLE plc: UK publicly traded company (UK AIM:AGL)
• Commercial patent protected epitope-independent circulating tumor cell (CTC) harvesting technology
ANGLE Biosciences: Toronto based subsidiary of ANGLE
• Novel downstream analysis systems for cost effective, highly multiplexed analysis of nucleic acids and proteins
• Combined focus on sample to answer, liquid biopsy testing
• Other technology applications exploited through corporate partnerships with established industry leaders.
Parsortix system
Captured rare cells in Parsortix cassette.
Ziplex benchtop analysis system for laboratory use.
Ziplex SA analysis system for distributed testing (under development)
Introduction
Isolation of RNA from ~1 -100 cells captured by the cassette

Parsortix Technology: • Capture and harvest of CTCs and other cells of interest from 100 µL to
30 mL of blood sample • Addresses the needs for:
• Highly enriched cell populations • Epitope independence • Viable cells • Research flexibility • Simple and easy process
• Several health conditions investigated using captured cancer cells including breast, ovarian, lung, prostate, colorectal, pancreatic, melanoma and others
Downstream applications include in-vitro staining or harvesting of cells for molecular analyses on the Ziplex platform • Highly multiplexed target detection from a few CTC cells • High specificity to avoid spurious amplification and false positives • Rapidly adaptable to new gene targets and disease applications • Low complexity and affordable
Downstream Applications

Parsortix/HyCEAD/Ziplex Workflow
Draw blood
Parsortix processing
Recover harvest enriched for CTCs
Lyse cells
Multiplex HyCEAD processing
De-multiplexing on array of probes
CTC expression profiles
• Whole blood processed through Parsortix to yield a cell suspension enriched in circulating tumour cells (CTCs).
• Cells are lysed and amplicons from multiple mRNA targest are amplified from the lysate (no RNA/DNA detection); RNA yield from ~ 1 -100 cells
• Mixture of amplicons (100+ targets) are de-multiplexed on a flow-through microarray of target-specific probes.
• Amplicons from eight HyCEAD amplifications (CTC samples) are automatically hybridized on individual flow-through arrays to produce quantitative expression data for all targeted genes of interest.
CTCs become trapped in narrow gaps within the Parsortix cassette while most blood cells pass through the gap to waste
Target specific oligonucleotide probes are spotted on flow-through microarrays (TipChips). TipChips are immersed in solutions that are repeatedly passed through the microarray using pressure and vacuum. Images of chemiluminescent light emission are automated analysed to generate expression profiles.

VERSA 1100 Gene by Aurora Biomed
Automation of the sample preparation procedure for hybrid capture, extension and detection (HyCEAD) by
a VERSA 1100 Gene instrument
Operator sample processing time (12 samples) ~ 4 hours
VERSA 1100A sample processing time (24 samples) ~3.5 hours
Double the efficiency of manual operation
1. Reservoir 2. Tips (200 µL) 3. Tips (200 µL) 4. Tips (50 µL) 5. Tips (50 µL) 6. PCR Plate Adaptor (Ambient) 7. PCR Plate Adaptor (0-100°C) 8. PCR Plate Adaptor (0-100°C) 9. Reagent Cooler (6x4) 10. Tips (20 µL) 11. Magnetic Deck 12. Plate Shaker (RT-100°C) 13. Bead Shaker 14. Reagent Cooler B 15. Single Tip Box 16. Liquid Waste Station 17. Reagent Drop Priming Station 18. Tip Disposal Chute 19. Reagent Drop Lines
Deck Layout in Software (VERSAware)
Deck Layout
aurorabiomed.com

Verification of Automated 8 Sample HyCEAD Processing on VERSA 1100 Gene
Method • Single sample was repeatedly run on the VERSA using
automated HyCEAD protocol and manually by operator. • Each sample was probed for 68 genes of interest on a single
microarray (TipChip); multiplexed targeting.
Results • Results from individual HyCEAD runs were compared to the
geometric means of all probes with intensities > 20 AU. • Excellent correlation between each run and the geometric
mean with R2 values > 0.99
• Probe signal intensities in each of the 8 chips across the 5 automated HyCEAD runs showed no apparent positional bias which can occur due to temperature edge effects in heating blocks or small misalignments on the robot deck

Verification of Automated 24 Sample HyCEAD Processing on VERSA 1100 Gene
Inter-sample Variance
Method
• Single sample was run on the VERSA using automated HyCEAD protocol for simultaneous processing of 24-samples.
• Each sample was probed for 68 genes of interest on a single microarray (TipChip); multiplexed targeting.
Results
• Assessing inter-sample variance that may be increased due to longer processing time for 24 samples (measure indication of positional bias)
• Excellent correlation between geomean SI of each set of 8 samples with R2 values > 0.99; minimal inter-sample variance
• Probe signal intensities in each of the 24 chips across the single HyCEAD run showed no apparent positional bias which can occur due to temperature edge effects in heating blocks, small misalignments on the robot deck, or longer-processing time for 24-sample analysis
• Comparison of automated and manual HyCEAD runs showed good correlation of geomean SI of 24-sample automated HyCEAD with manual HyCEAD with R2 values > 0.98.
y = 0.9795x + 0.2255 R² = 0.9925
0.0
2.0
4.0
6.0
8.0
10.0
12.0
14.0
0.0 5.0 10.0 15.0
Log2
SI (
Co
lum
n 1
)
Log2 SI (Column 2)
y = 0.9757x + 0.228 R² = 0.9941
0.0
2.0
4.0
6.0
8.0
10.0
12.0
14.0
0.0 5.0 10.0 15.0
Log2
SI (
Co
lum
n 1
)
Log2 SI (Column 3)
y = 1.0023x + 0.0114 R² = 0.9951
0.0
2.0
4.0
6.0
8.0
10.0
12.0
14.0
0.0 5.0 10.0 15.0
Log2
SI (
Co
lum
n 3
)
Log2 SI (Column 2)
y = 1.0335x - 0.491 R² = 0.9877
0
2
4
6
8
10
12
14
0 5 10 15
Log2
SI (
Man
ual
HyC
EAD
)
Log2 SI (24 Sample Automated HyCEAD)
y = 1.0332x - 0.4212 R² = 0.9935
0
2
4
6
8
10
12
14
0 5 10 15
Log2
SI (
8 S
amp
le A
uto
mat
ed H
yCEA
D)
Log2 SI (24 Sample Automated HyCEAD)
y = 0.98x + 0.3733 R² = 0.9922
0
2
4
6
8
10
12
14
0 5 10 15
Log2
SI (
8 S
amp
le A
uto
mat
ed H
yCEA
D
2)
Log2 SI (24 Sample Automated HyCEAD)
Figure: Correlation plots of probe geomean signal intensities for 24-sample automated HyCEAD. Means calculated from 8 individual measurements for each probe.
Figure: Comparison of automated and manual HyCEAD. Means calculated from 8 individual measurements for each probe.

Page 8
For Research Use Only: Not for Use in In-vitro diagnostics
CELLS AND ANALYSIS FOR PRECISION MEDICINE
ANGLE Europe Ltd 10 Nugent Road The Surrey Research Park Guildford GU2 7AF
United Kingdom
www.ANGLEplc.com
ANGLE Biosciences 50 Ronson Drive Suite 105 Toronto, ON M9W 1B3
Canada
ANGLE North America Inc. 3711 Market Street University Science Center 8th floor Philadelphia PA 19104
USA