Application London City Airport 13/01228/FUL and associated 13/01373/OUT
123
Chris Gascoigne / Sunil Sahadevan Senior Development Manager Development Control Strategic Commissioning & Community London Borough of Newham Newham Dockside 1000 Dockside Road London E16 2QU Alan Haughton 07909 907 395 [email protected] @stopcityairport 18th December 2013 Application London City Airport 13/01228/FUL and associated 13/01373/OUT Dear Sirs, I wish to object to the above applications. This application will have disastrous consequences for Newhams Vision for the Royal Docks. The whole consultation has been problematic, with many incidences of it being offline and unable for viewing. It was again offline this weekend the 14th and 15th of December. You will also be aware pre-action letters have been sent in light of key documents presumed to be missing from the consultation and unable to be viewed. We await that response. The “With” and “Without” Development scenarios are disingenuous. The aircraft mix has already change and this is not reflected in the application. The application does not state what the current mix is now and if there are changes to be made pre application. In addition to this and other unavailable key documents, requests from other key stakeholders like the GLA, Newham Council and English Heritage for further information regarding the application, I would request that I can submit further responses when this key information is available. I myself need clarification on some issues,I would ask that further submissions and responses from myself be accepted and considered. Thank you. In 2009, London City Airport applied to increase the number of flights to 120,000 per annum. It claimed it would create 1000 new jobs in doing so. Four years later not a single
-
Upload
stop-city-airport-masterplan -
Category
Documents
-
view
1.671 -
download
2
description
Application London City Airport 13/01228/FUL and associated 13/01373/OUT
Transcript of Application London City Airport 13/01228/FUL and associated 13/01373/OUT
Chris Gascoigne / Sunil SahadevanSenior Development ManagerDevelopment ControlStrategic Commissioning & CommunityLondon Borough of NewhamNewham Dockside 1000 Dockside Road London E16 2QU
Alan Haughton07909 907 [email protected]@stopcityairport
18th December 2013
Application London City Airport 13/01228/FUL and associated 13/01373/OUT
Dear Sirs,
I wish to object to the above applications.
This application will have disastrous consequences for Newhams Vision for the Royal Docks.
The whole consultation has been problematic, with many incidences of it being offline and unable for viewing. It was again offline this weekend the 14th and 15th of December.You will also be aware pre-action letters have been sent in light of key documents presumed to be missing from the consultation and unable to be viewed. We await that response.
The “With” and “Without” Development scenarios are disingenuous. The aircraft mix has already change and this is not reflected in the application. The application does not state what the current mix is now and if there are changes to be made pre application.
In addition to this and other unavailable key documents, requests from other key stakeholders like the GLA, Newham Council and English Heritage for further information regarding the application, I would request that I can submit further responses when this key information is available. I myself need clarification on some issues,I would ask that further submissions and responses from myself be accepted and considered. Thank you.
In 2009, London City Airport applied to increase the number of flights to 120,000 per annum. It claimed it would create 1000 new jobs in doing so. Four years later not a single

job has been created. Now they are double counting the jobs they would create in 2009 in this application.
This is nothing more than a hedge fund bottom feeding on a poverty stricken borough with the prospect of jobs that never come. There are now less jobs at London City Airport than 2009, and less in Newham than 2009. I am currently awaiting information from the CAA and NATS on net jobs losses due to the increased Public Safety Zone. When I have this information I will submit further information on job impacts.
London City Airport has operated over 60,510 flights breaching legally binding noise limits with Newham Council since 2009 - a shocking 21.44% of all flights over the period.
Research compiled from the Airports own Performance reports between 2009 - 2012 show a means averaged 60,510 of the total 282,151 flights have operated above the very maximum noise level of 94.5 PNdB allowed at the airport.This is unacceptable. No penalties have been inflicted on the airport. It continues unabated with Newham Council in the full knowledge that it is happening. Because of this submitted noise contours cannot be trusted. Air Traffic Movement contours and projects are wrong due to these breaches.One aircraft, the RJ100, has operated 43,264 flights breaching the noise factors every year since 2009, yet remains operating at the airport. Newham Council have taken no action against the Airport. I would ask that you look at this with urgency and halt these flights. They are outside the noise category yet used to justify expansion and compared to future aircraft on noise.
Other clarifications are also need and when received I will submit further evidence.
I also understand that this application may allow for 10 million passengers and in which case the Secretary of State must hear the application, not Newham Council.
If you have any questions please feel free to contact me.
I would also request that I would like to speak in front of the planning committee and give notice that I would also like to film the proceedings of the planning meeting or meetings.
Regards
Alan Haughton

APF states Government will treat 57db LEeq 16 hour contour as the average level of daytime aircraft noise. (significant community annoyance).
The Government’s Aviation Policy Framework states in paragraph 17 that “Our overall objective on noise is to limit and where possible reduce the number of people in the UK significantly affected by aircraft noise.” This application increases the number of people affected across at least three London boroughs.
It repeats the Government’s February 2011 definition of sustainable development: “....stimulating economic growth and tackling the deficit, maximising wellbeing and protecting our environment, without negatively impacting on the ability of future generations to do the same.” Airport expansion is for economic growth, whereas the loss of water space is detrimental for future generations.
The Framework states in paragraph 3.28: “The Government expects airports to make particular efforts to mitigate noise where changes are planned which will adversely impact the noise environment. This would be particularly relevant in the case of proposals for new airport capacity, changes to operational procedures or where an increase in movements is expected which will have a noticeable impact on local communities. In these cases, it would be appropriate to consider new and innovative approaches such as noise envelopes or provision of respite for communities already affected.
At least another 13,300 homes will enter a LEeq 16 hour contour. Governments Aviation Policy Framework on overall aviation noise is to “limit and, where possible reduce the number of people in the UK significantly affected by aircraft noise” (para 3.12)
Two other paragraphs are important:-“3.53 As large sites which consume resources and emit waste, airports also have an impact on other aspects of the local environment such as water, waste management and habitat, through for example, de-icing of aircraft and runways, fuel handling and storage or the production of on-site heat or power. In England and Wales, where these activities produce waste, lead to discharges to local watercourses or groundwater, or are carried out using activities specified in the Environmental Permitting Regulations 2010, airports may require a permit from the Environment Agency or local authority. The permits contain conditions to protect the environment and human health, implement appropriate EU Directives and, where necessary, require the site operator to carry out monitoring.
3.54 Before taking decisions on any future new airport capacity, the Government will want to have a thorough understanding of the local environmental impacts of any proposals. As set out in its terms of reference, the Airports Commission’s interim report will be informed by an initial high-level assessment of the credible long-term options which merit further detailed development. This will take into account local environmental factors, which are one of the broad categories which the Commission has identified in its recently published guidance document which scheme promoters should consider. The Commission’s final report will include an environmental assessment for each option, as well as consideration of their operational, commercial and technical viability.”
Government’s Aviation Policy Framework

That implies that any proposal such as that for London City Airport, which will be materially impacted by the decision, will need Government approval of the environmental impact, including discharges to watercourses. The airport extension is pre-empting the Airport Commission’s report and should not be considered until their final report is published.
Paragraph 3.55 also has to be applied to consideration of the CADP proposals: “Loss of protected habitats, protected species, protected landscape and built heritage, and significant impacts on water resources and ecosystems would only be advocated if there were no feasible alternatives and the benefits of proposals clearly outweighed thoseimpacts. Any unavoidable impacts would be mitigated or compensated for. Our policy will be to ensure there is full consideration of the environmental impacts of the most credible options for maintaining our international connectivity.” King George V Dock is ‘protected’ and of ‘heritage’ value, also the impact on ecosystems of the submerged ‘layered wire mesh’ has to be understood.
Paragraph 5.6 states: “ The Aviation Policy Framework may also be a material consideration in planning decisions depending on the circumstances of a particular application.”
Paragraph 5.9 states “Land outside existing airports that may be required for airport development in the future needs to be protected against incompatible development until the Government has established any relevant policies and proposals in response to the findings of the Airports Commission, which is due to report in summer 2015.”While the main trust of its report does not focus on smaller airports as London City Airport is in the South East it raises a number of issues. A Thames Estuary Airport would mean the closure of London City Airport (Source, NATS) and an enlarged Heathrow would mean increased aircraft movements of East London.
Government’s Aviation Policy Framework
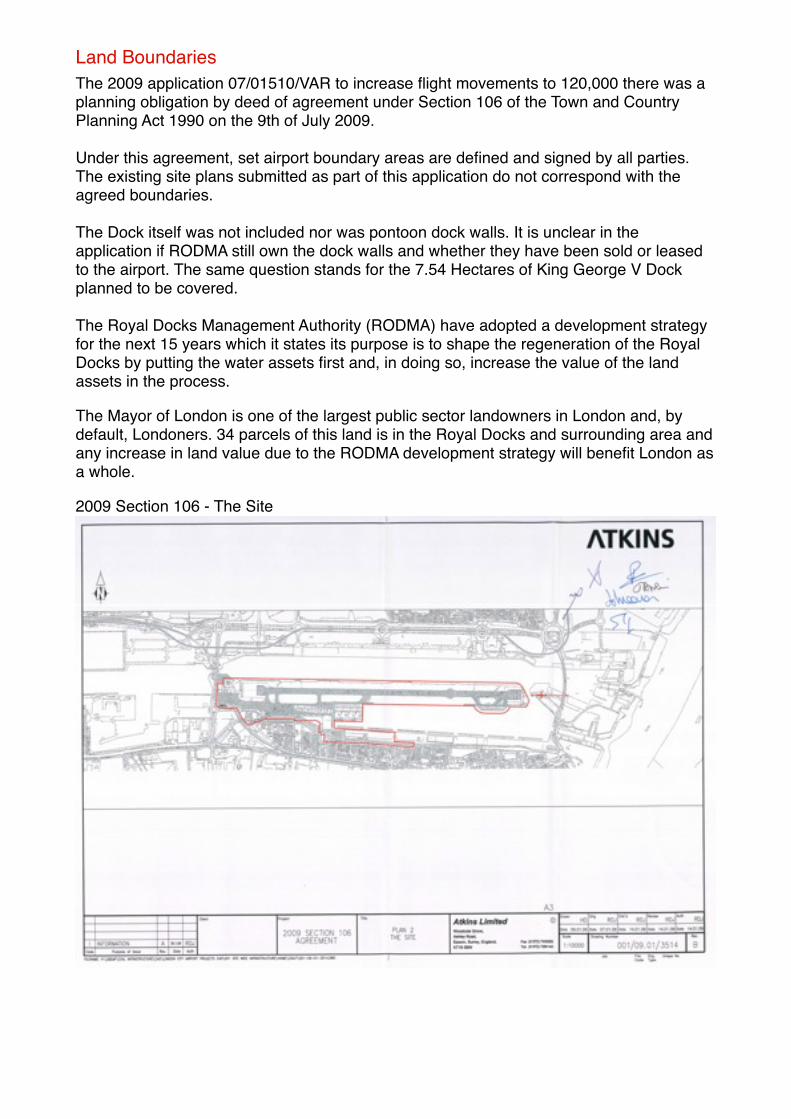
The 2009 application 07/01510/VAR to increase flight movements to 120,000 there was a planning obligation by deed of agreement under Section 106 of the Town and Country Planning Act 1990 on the 9th of July 2009.
Under this agreement, set airport boundary areas are defined and signed by all parties. The existing site plans submitted as part of this application do not correspond with the agreed boundaries.
The Dock itself was not included nor was pontoon dock walls. It is unclear in the application if RODMA still own the dock walls and whether they have been sold or leased to the airport. The same question stands for the 7.54 Hectares of King George V Dock planned to be covered.
The Royal Docks Management Authority (RODMA) have adopted a development strategy for the next 15 years which it states its purpose is to shape the regeneration of the Royal Docks by putting the water assets first and, in doing so, increase the value of the land assets in the process.
The Mayor of London is one of the largest public sector landowners in London and, by default, Londoners. 34 parcels of this land is in the Royal Docks and surrounding area and any increase in land value due to the RODMA development strategy will benefit London as a whole.
2009 Section 106 - The Site
Land Boundaries

2009 Section 106 - Land at South Dock
2013 Application
Land Boundaries

It is unclear where the Airports land boundaries are and what they own and are responsible for. Further clarification is urgently needed.
The planning application includes covering the docks which are not owned or leased by the applicant. It is unclear who owns them and if an agreement has been reached on the development.
Land Boundaries

The Committee on Climate Change (CCC) set out, in their section on aviation, the UK's Climate change emissions target - "the previous Government set a UK aviation target in January 2009, to reduce UK aviation CO2 emissions back to 2005 levels in 2050. Together with deep cuts in other sectors, this would achieve the UK's legislated economy-wide greenhouse gas (GHG) target to reduce emissions by 80% in 2050 relative to 1990." The CCC then looked at how this target could be met and showed that severe demand constraint would be needed to achieve the target - restricting passenger growth to a 60% increase on the 2005 level, instead of the unfettered level of more than 200%. Lord Turner at the resulting Press Conference said that would only be possible if there was an increase in fuel efficiency by 37% and ALL OTHER SECTORS of the economy cut CO2 by 90% by 2050 (not 80%). The CCC also pointed out that decisions on specific airport capacity need to reflect a wide range of other factors, including local environmental impact. The current London plan also sets out how Local Authorities need to produce plans and policies consistent with the target. The Government's Committee on Climate Change (CCC) declared in May 2012 that local authorities have a 'crucial role' in tackling climate change. The London Assembly Environment Committee Report " Flights of Fancy - Can an expanded Heathrow meet its environmental targets? "- January 2010, said "CO2 emissions from UK aviation doubled in the ten-year period between 1990 and 2000. A review of various forecasts of UK air travel growth indicates that aviation emissions are set to more than double between 2000 and 2030 and could increase to between four and 10 times their 1990 level by 2050.". Newham has further obligations to cut emissions. The Mayor of London has set a target of 60 per cent reduction in London's CO2 by 2025, from a 1990 base. The 60% CO2 reduction target is in the CCM& ES also has interim targets. Included in the range of measures to meet the target is one to minimise CO2 emissions from ground-based aviation. Needless to say any increased capacity, bigger car parking spaces and taxi ranks will impact on the London-wide target as well as the national one. The application should therefore be rejected. The GLA Environment Committee who in "Flights of Fancy" were "unconvinced that prolonged use of the EU Emissions Trading Scheme (ETS) will have a significant effect. Research suggests that including aviation in the EU ETS is a less than sufficient solution. The Commission's assessment, suggests that integration of aviation into the EU ETS policy will reduce emissions by just three per cent. Meeting the target to limit aviation emissions to below 2005 levels by 2050 is crucial to achieving the UK's overall emissions target.". Last year's report by the Committee on Climate Change (May 2012) "How local authorities can reduce emissions and manage climate risk" , contained Key Messages for Local Authorities which both the government and the CCC expect Local Authorities to implement.
Environment

Indeed they say in the Executive Summary "there is a crucial role for local authorities in reducing emissions to meet national carbon budgets". Specific relevant Key Messages for Local Authorities were:
- Local authorities play an important role in delivering national carbon targets. They can drive and influence emissions reductions in their wider areas through the services they deliver, their role as social landlords, community leaders and major employers, and their regulatory and strategic functions.
- Action on climate change has many local benefits. As well as contributing to national carbon budgets, carbon reduction programmes can bring a range of benefits such as lower energy bills, economic regeneration and creation of local jobs, and improved health. Increasing resilience to climate change risks can result in avoided costs from flood damage to buildings, infrastructure and services, enhanced green spaces and improved health.
- Planning. Local authorities' planning functions are a key lever in reducing emissions and adapting localities to a changing climate. It is particularly important that local authorities use their plan making and development management/building control functions to...... reduce transport emissions.
- Low-carbon plans. All local authority areas should develop a low-carbon plan that includes a high level of ambition for emissions reductions and focuses on emissions drivers over which local authorities have influence in buildings, transport, waste, renewable power generation and their own estates. Local Authority have a control over emissions reduction. This is a Major Infrastructure Project and the planning department of Newham should exert control and reject this application. Expansion at City Airport presents a risk to us not meeting our Climate Targets as aviation is one of the fastest growing sources of emissions. Newham has an obligation to share in the challenge of our generation and prevent further emissions growth by rejecting this and any future plans for expansion.
Environment

Public Safety Zone DfT circular 01/2010
Development at the airport is currently controlled by the Public Safety Zone (Crash Zone) contours published by the DfT in 2010 based on the figures submitted by London City Airport.
PSZs are based upon airport operators’ projections of air traffic approximately 15 years ahead and they are updated on an approximately 7-year cycle. The CADP contours are larger than the published 2010 baseline.The change is due to the overall number of aircraft movements and type - particularly the split between scheduled and jet centrre movements.
The airport based their 2009 expansion plans and received planning permission on the central assumption of 95,000 flights / 25,000 corporate jets. The CADP will change this to 107,119 scheduled flights by 2023 with 3920 corporate flights.
No noise categorisation for the 2023 fleet have been included. As required under the terms of the current Section 106 Agreement, a review of the current noise categorisation system is currently being undertaken with LBN to reassess the methodology, categories, noise reference levels, noise factors and procedures for categorisation with the objective of providing further incentives for aircraft using the Airport to emit less noise. This planning application should not have been consulted on until the environmental statement could include the findings of this review.
Public Safety Zone

11 potential sites have been identified as falling within the western PSZ and 10 potentially in the Eastern PSZ.
While the revised PSZ references a with or without development scenario, this is disingenuous. The ‘without development’ PSZ changes only because the airport are not honoring the central assumption of 95,000 flights used to get the 2009 planning permission, nor they figures submitted to the DfT for the 2010 PSZ.
Sites that will fall inside the PSZ include Thames Wharf, The Floating Village, Silvertown Quays, Connaught Bridge, Tripcock point, Albert Basin and a future ferry / bridge at Thames Gateway.
Thames Wharf (West 09) show that the with and without development PSZ’s encrouch this site any redevelopment would need to take into account the PSZ contour. The CADP application says there is no relevant planning history but this is incorrect.
The scheme proposal for a new Thames tunnel at Silvertown was designated as a Nationally Significant Infrastructure Project and Thames Wharf is safeguarded for its development. Also at the Thames Wharf site is a DLR station that cannot be constructed due to the Silvertown Tunnel safeguarding.
Any diversion from the original central assumption of 95,000 scheduled flights in the 2009 planning permission will see the Thames Wharf safeguarded site encompassed in the PSZ.
Current PSZ
No CBT analysis has been carried out of the potential costs, land devaluation and loss of jobs on these sites due to an enlarged PSZ.
Previous PSZ calculation and projections have been way below estimates.
The projected PSZ below was the submission for the 50,000 flight expansion. To put it into context you can see on the West it does not reach the site of the Cable Car. After the application approval, based on the figures submitted to the NATS and the DfT the crash zone got much larger and cut through where the Cable Car would be developed. We are told one thing pre-application but in reality when it is too late, it is very different.
Public Safety Zone

Public Safety Zone

The 2009 application 07/01510/VAR to increase flight movements to 120,000 there was a planning obligation by deed of agreement under Section 106 of the Town and Country Planning Act 1990 on the 9th of July 2009.
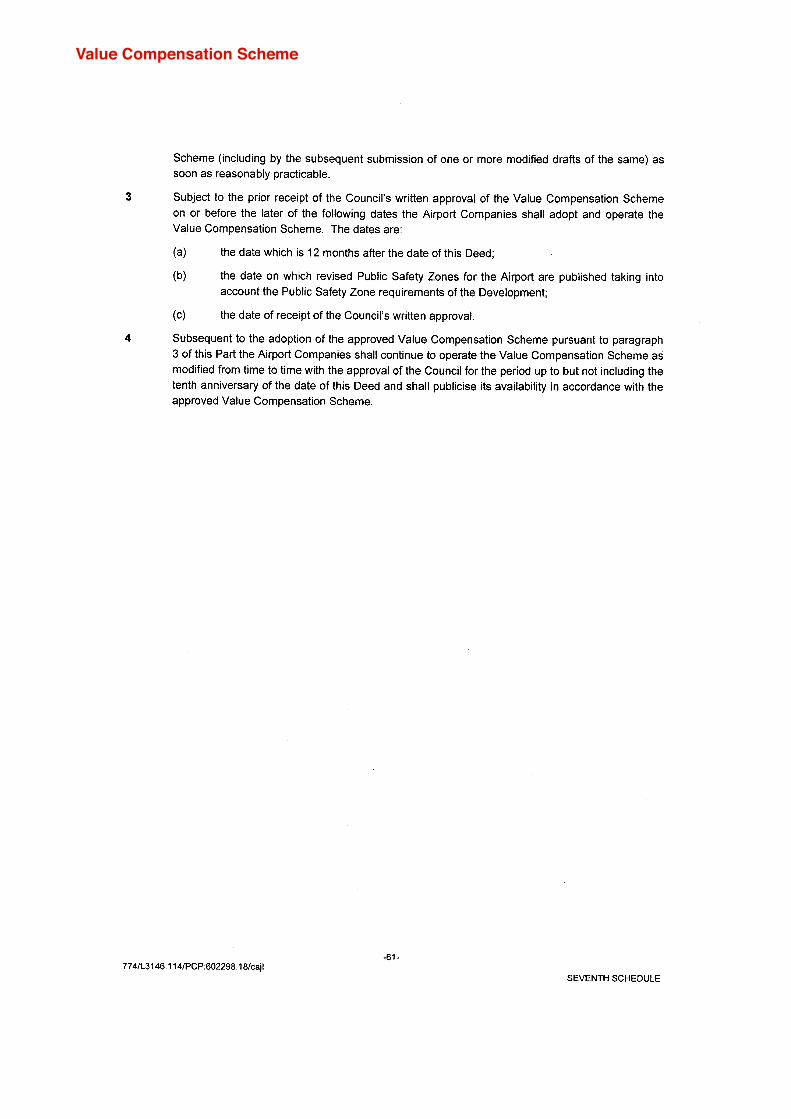
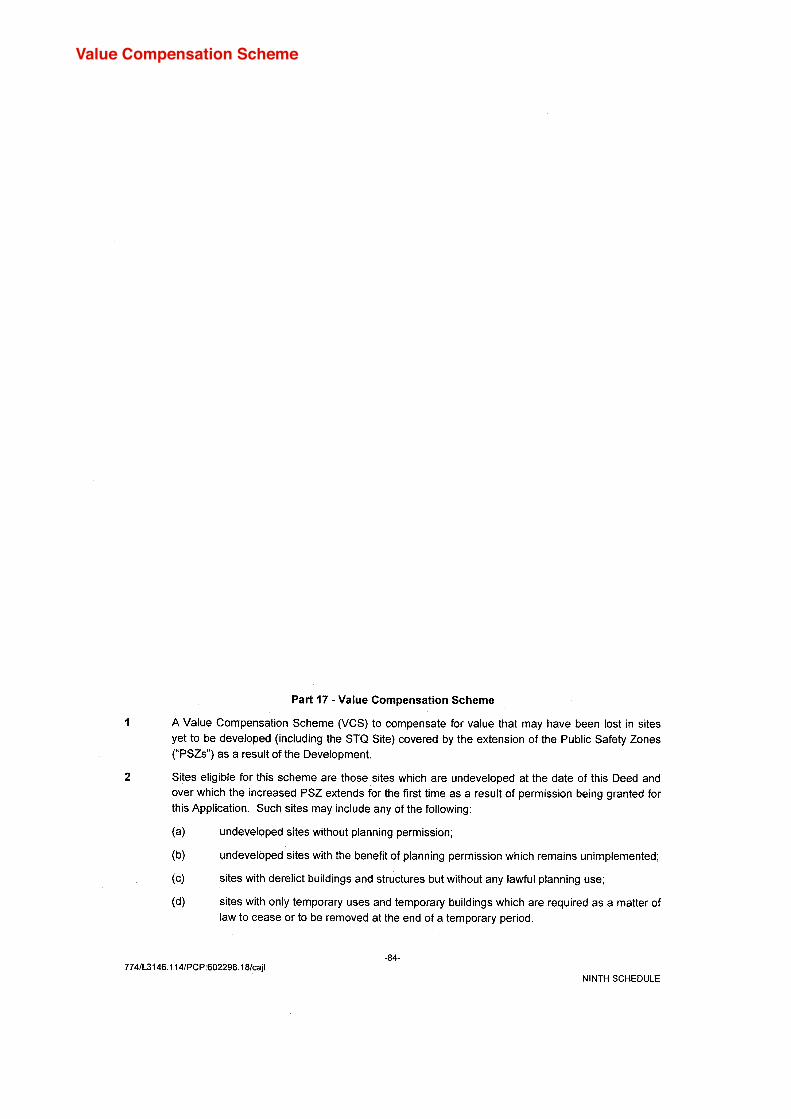
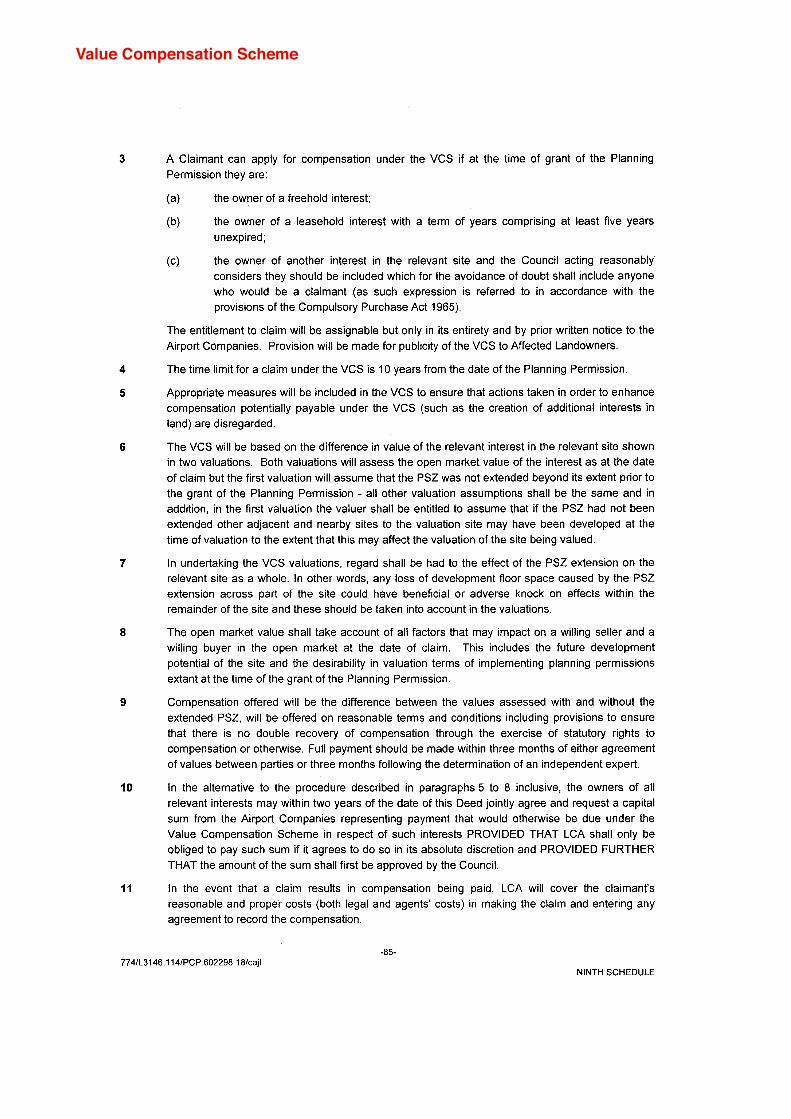
The Value Compensation Scheme time limit for a claim is 10 years from the date of the 2009 Planning permission with four years already been lost for potential claimants.
Critically the PSZ Value Compensation Scheme S106 2009 is still not agreed.VCS is to compensate for value lost in sites yet to be developed covered by the extension of the Public Safety Zone.
Economic and social impact cannot be properly assessed until a financial value is put on the impact of the PSZ through the VCS invalidating the environmental statement.
We need a cost benefit analysis (CBT) on the
This obligation has not yet been finalised, breaking a number of conditions in the deed and hence until resolution not further permissions should be granted. I would go further and say that the 2009 application 07/01510/VAR deed has been contractually breached and flight numbers should return to agreed figures pre 2009.
Value Compensation Scheme

Value Compensation Scheme
Value Compensation Scheme
Value Compensation Scheme
Value Compensation Scheme

Value Compensation Scheme
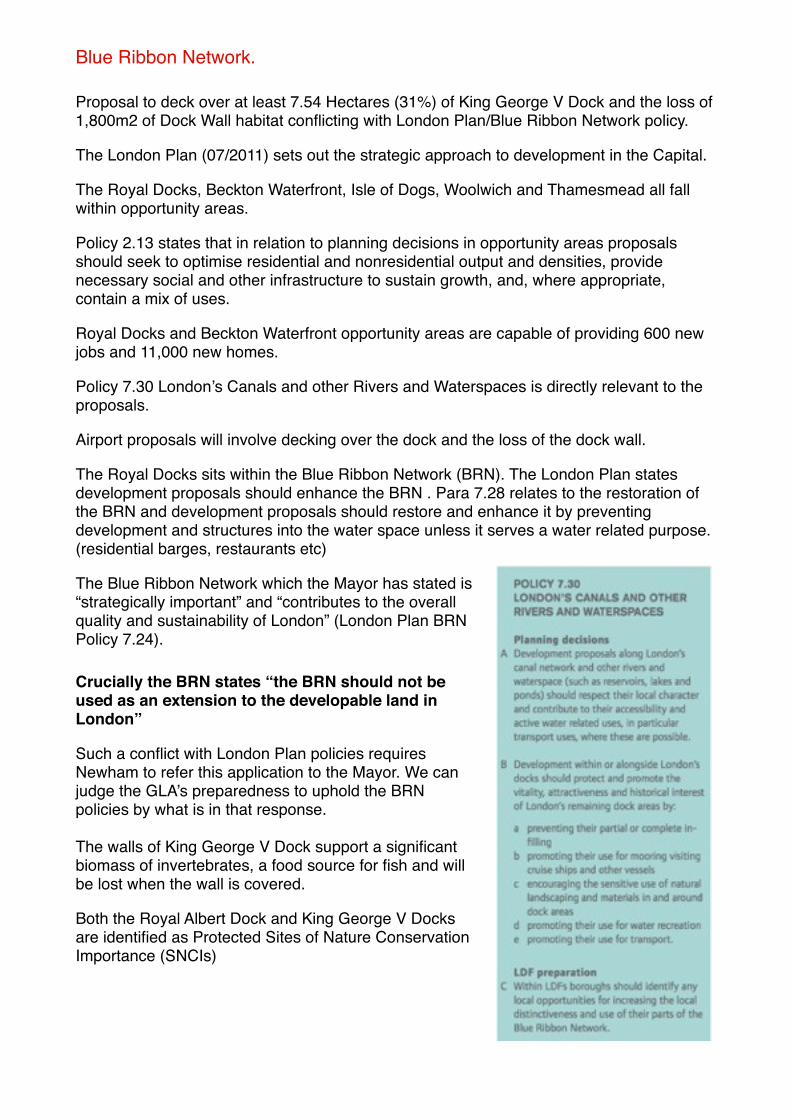
Proposal to deck over at least 7.54 Hectares (31%) of King George V Dock and the loss of 1,800m2 of Dock Wall habitat conflicting with London Plan/Blue Ribbon Network policy.
The London Plan (07/2011) sets out the strategic approach to development in the Capital.
The Royal Docks, Beckton Waterfront, Isle of Dogs, Woolwich and Thamesmead all fall within opportunity areas.
Policy 2.13 states that in relation to planning decisions in opportunity areas proposals should seek to optimise residential and nonresidential output and densities, provide necessary social and other infrastructure to sustain growth, and, where appropriate, contain a mix of uses.
Royal Docks and Beckton Waterfront opportunity areas are capable of providing 600 new jobs and 11,000 new homes.
Policy 7.30 London’s Canals and other Rivers and Waterspaces is directly relevant to the proposals.
Airport proposals will involve decking over the dock and the loss of the dock wall.
The Royal Docks sits within the Blue Ribbon Network (BRN). The London Plan states development proposals should enhance the BRN . Para 7.28 relates to the restoration of the BRN and development proposals should restore and enhance it by preventing development and structures into the water space unless it serves a water related purpose. (residential barges, restaurants etc)
The Blue Ribbon Network which the Mayor has stated is “strategically important” and “contributes to the overall quality and sustainability of London” (London Plan BRN Policy 7.24).
Crucially the BRN states “the BRN should not be used as an extension to the developable land in London”
Such a conflict with London Plan policies requires Newham to refer this application to the Mayor. We can judge the GLA’s preparedness to uphold the BRN policies by what is in that response.
The walls of King George V Dock support a significant biomass of invertebrates, a food source for fish and will be lost when the wall is covered.
Both the Royal Albert Dock and King George V Docks are identified as Protected Sites of Nature Conservation Importance (SNCIs)
Blue Ribbon Network.

125 hectares of development land around the airport awarded Enterprise Zone status which the airports sits outside of.
The zone is in 3 key areas - Silvertown Quays, Royal Albert Dock and Royal Albert Basin. All rates from newly established businesses will be retained by London’s Local Enterprise Partnership.
The Royal Docks Management Authority (RODMA) have adopted a development strategy for the next 15 years which it states its purpose is to shape the regeneration of the Royal Docks by putting the water assets first and, in doing so, increase the value of the land assets in the process.
The Mayor of London is one of the largest public sector landowners in London and, by default, Londoners. 34 parcels of this land is in the Royal Docks and surrounding area and any increase in land value due to the RODMA development strategy will benefit London as a whole.
The CADP proposal will support 910 direct onsite FTE jobs in 2023 overall.For every Hectare of the Royal Dock it covers, 70 jobs will be created be created. By comparison the Chinese Business Hub opposite is of similar at 14 Hectares and it is estimated will created 20,000 jobs (1,428 jobs per hectare) Overall with development the airport will support approximately 48 jobs per ha vs 43 without
The vast majority of proposed regeneration sites are over 57db. Aviation Policy Framework states Government will treat 57db LEeq 16 hour contour as the average level of daytime aircraft noise. (significant community annoyance) You cannot build communities from scratch, if from the offset, they will suffer significant community annoyance.
Enterprise Zone

The Royal Docks needs to be understood afresh.
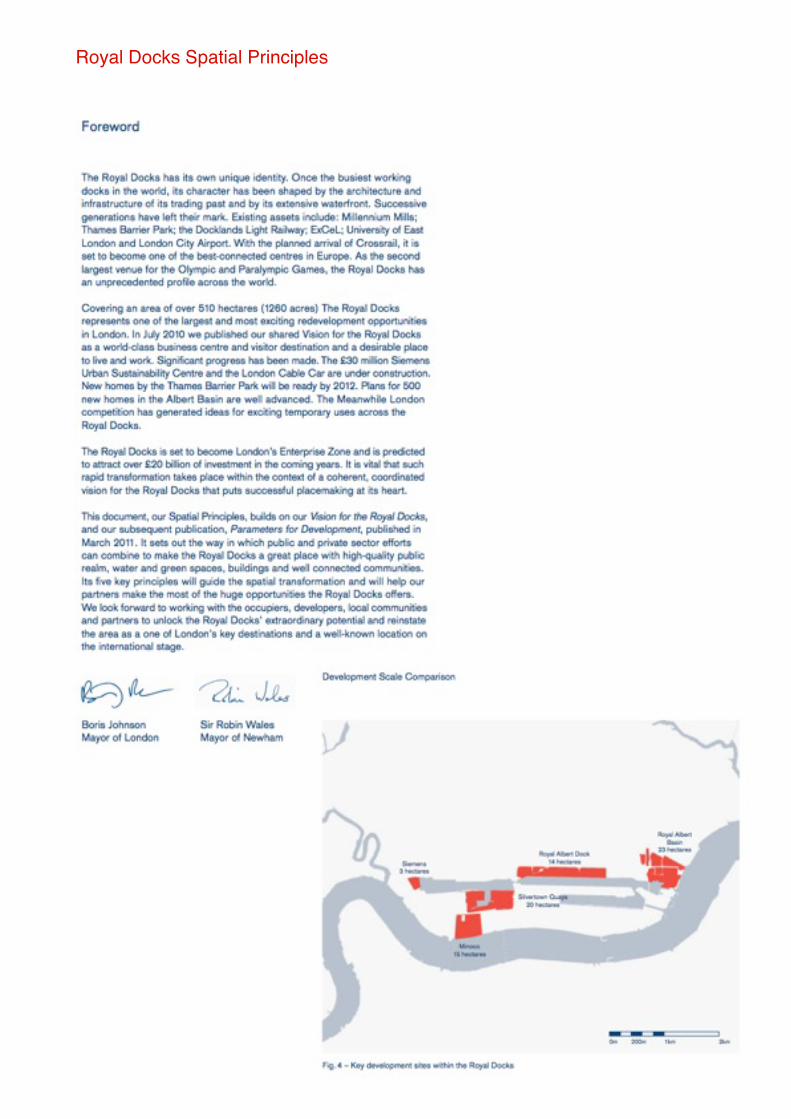
The Royal Docks has massive development potential and can become a major new centre for business and living in east London. The vision document gives an overview of the project’s benefits. This includes: developing the Royal Docks as a world-class business destination encouraging inward investment in the Royal Docks area, building on opportunities presented by the 2012 Games ensuring that local people have access to the opportunities created making the Royals Docks a great place to live with improved local connections and a revitalised waterfront making the Royal Docks a model of green enterprise and environmental sustainability developing attractions that will create a thriving visitor and tourist economyOn 10 June 2013, the Mayor confirmed a £1.5bn deal with The Silvertown Partnership to transform Silvertown Quays in London’s Royal Docks into a new innovation quarter and destination for global brands and create over 9,000 jobs.On 29 May 2013, the Mayor announced details of a £1bn deal to transform the 35-acre Royal Albert Dock site into the capital’s next business district, forging new trade links with China and other economies in the Asia-Pacific region and securing billions of pounds of inward investment in the UK economy. The site will be transformed by ABP Chinese (Holding), a successful commercial developer, into a gateway for Asian and Chinese business seeking to establish headquarters in Europe as well as other businesses wanting to set up in the capital.It will provide 20,000 full-time jobs and boost local employment in Newham by 30 per cent.
Development of both these sites will be affected by London City Airport.
Nowhere else in London has access to 250 acres of non-tidal water space. The Thames, with its industrial heritage and beach front, offers enormous potential to reinvigorate the area. The task is to improve access to the water with footpaths, bridges and active waterfront; to maximise the potential for the water to enrich and inform new developments whilst maintaining those waterside uses which need to remain in the area.
One of the strongest assets of the Royal Docks is its water. Once full of boats and people, the emptiness and vast expanses of the dock waters today convey the scale of the place, and at the same depersonalise it. The time has come to rediscover the water. By providing dedicated routes, spaces, bridges and uses into the dock space itself, the water will become accessible and inhabited, and a key part of the experience of the place as a destination and social thoroughfare.
Core policy also requires the provision of efficient use of employment land.
Royal Docks Spatial Principles
Royal Docks Spatial Principles

The Public Safety Zone and Noise Contours impact the following Spatial developments
Royal Docks Spatial Principles

Royal Docks Spatial Principles

Royal Docks Spatial Principles
RODMA
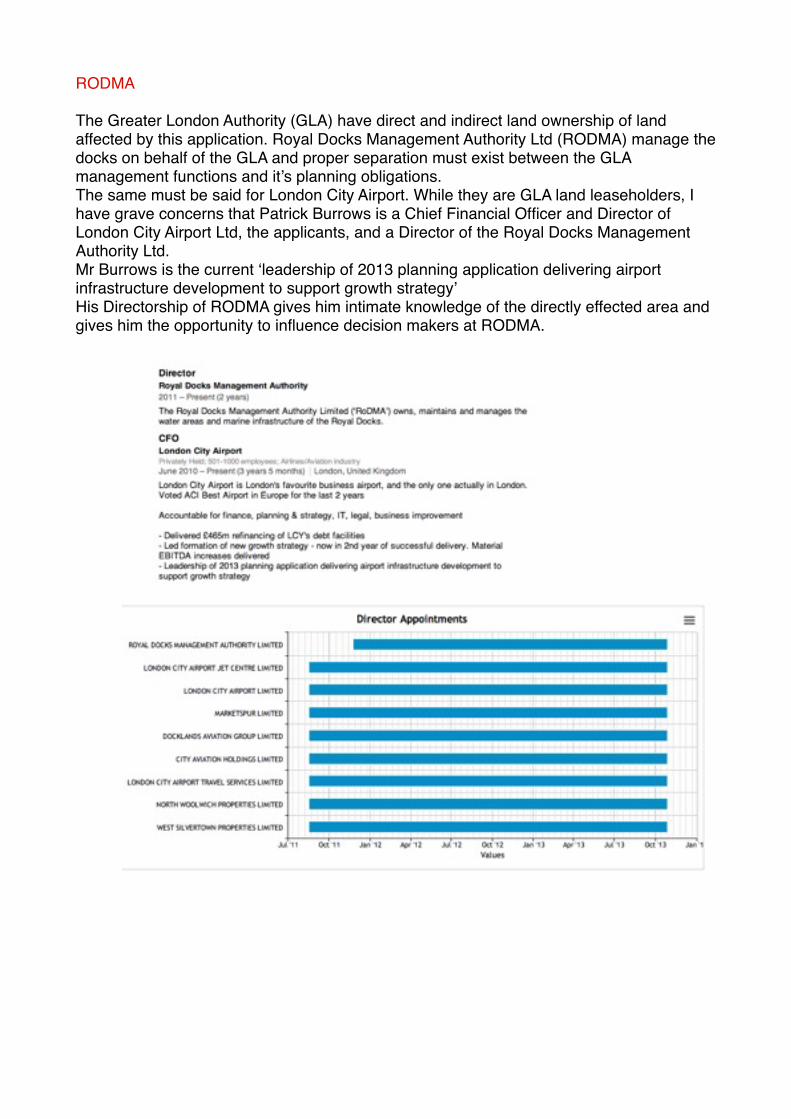
The Greater London Authority (GLA) have direct and indirect land ownership of land affected by this application. Royal Docks Management Authority Ltd (RODMA) manage the docks on behalf of the GLA and proper separation must exist between the GLA management functions and it’s planning obligations.The same must be said for London City Airport. While they are GLA land leaseholders, I have grave concerns that Patrick Burrows is a Chief Financial Officer and Director of London City Airport Ltd, the applicants, and a Director of the Royal Docks Management Authority Ltd. Mr Burrows is the current ‘leadership of 2013 planning application delivering airport infrastructure development to support growth strategy’His Directorship of RODMA gives him intimate knowledge of the directly effected area and gives him the opportunity to influence decision makers at RODMA.

Silvertown Fire Station is earmarked to be closed.
There has been no impact analysis on this closure and the London City Airport Public Safety Zone (Crash Zone) and one must be done.
The application will result in an enlarged crash zone. Figure release by GLA Labour show the Royal Docks (including London City Airport and its crash zone) having the longest response time in London.
The closure of Silvertown Fire Station will see response times in the Royal Docks increase from 5.27 minutes to 8.39 minutes. A 3.12 minute increase.
The map shows the London City Airport Public Safety Zone. About 80% of aircraft accidents happen at take off and landing.
People on the ground near or in the Crash Zone are at a heightened Third Party Risk of death or serious injury as well as those pople on the aircraft.
Silvertown Fire Station borders London’s only airport Crash Zone.
There have been a number of incidents at London City Airport. Magnetic anomalies unique to the airport play havoc with aircraft navigation systems resulting in two serious near misses. While AAIB safety recommendations have been carried out, this problem remains relevant with at least one near miss with a Heathrow Jet since introduction.
The footprint of any London City Airport jet crash would be wide encompassing a large amount of the area around the Crash Zone. At least one of the three Silvertown road access points could become impassable.
Silvertown Fire Stations location means it is the closest fire service in an area dominated by London’s only airport Crash Zone. Arguably on an Island which could see restricted access to other Emergency Services in the event of a jet coming down.
Silvertown Fire Station

London City Airport, unlike other London Airports does not cover it’s full policing costs. It only contributes 48% of costs, for example, the Metropolitan Police financial year runs from April to March. The forecast cost of policing London City Airport this financial year (12/13) is £4.0m. The contribution from the airport operator is expected to be £1.9m.
Policy 6.6 of the London Plan, (Aviation) is of particular relevance to this.The policy confirms that the aviation industry should meet its full environmental and external costs. Policing is an ‘external’ cost.
No submission has been included on the projected increase in policing numbers, the costs, who would cover them and the impact on police numbers and budgets across London.
Ends
Policing

Policy INF1 of Newham Core Strategy (01/2012) relates directly to London City Airport. It states that any proposals for future growth ant the airport above the approved 120,000 flight movements per annum will have to be carefully considered. The airport is acknowledged as a (current) key economic driver within the Royal Docks.
Policy S3 allocates the docks as a unique and high quality waterfront urban quarter.
Policy INF7 relates to the Blue Ribbon Network and states that the Royal Docks will be protected and enhanced via the following measures; developments located adjacent to the BRN should enhance the waterside environment and provide access and improved amenity to the waterfront; natural habitats will be protected and enhanced; landscape character, heritage, views and linear nature of the network will be protected and enhanced; access to the BRN will be improved.
Newham Core Strategy
Navigation problems
London City Airport is subject to unique magnetic interference which has not been investigated in this application nor have the impacts of it/to it been considered in the building process.
Numerous near misses have occurred with two major near misses happening over Hackney and Greenwich.
In October 2006 a Hawker 800XP aircraft experienced significant navigation problems after taking off from London City Airport. An AAIB Field Investigation (report reference EW/C2006/10/10) revealed that several similar incidents had occurred previously. It was established that local magnetic anomalies in the area of the runway holding point could adversely affect cockpit heading indications and, in some cases lead to heading system failure indications. Six Safety Recommendations were made, concerning airport standards in respect of magnetic anomalies, published aeronautical information regarding the anomaly at London City Airport, and advice to aircraft operators using the Airport.
Even with the six safety recommendations, further navigational failures have followed, most notably on the 26th of April 2012.
Magnetic interference has not been considered on newer jets now has changing the infrastructure and building work been considered on current jets.
(Reports below)
49© Crown copyright 2010
AAIB Bulletin: 9/2010 D-ITAN and TC-JJA EW/C2009/07/07
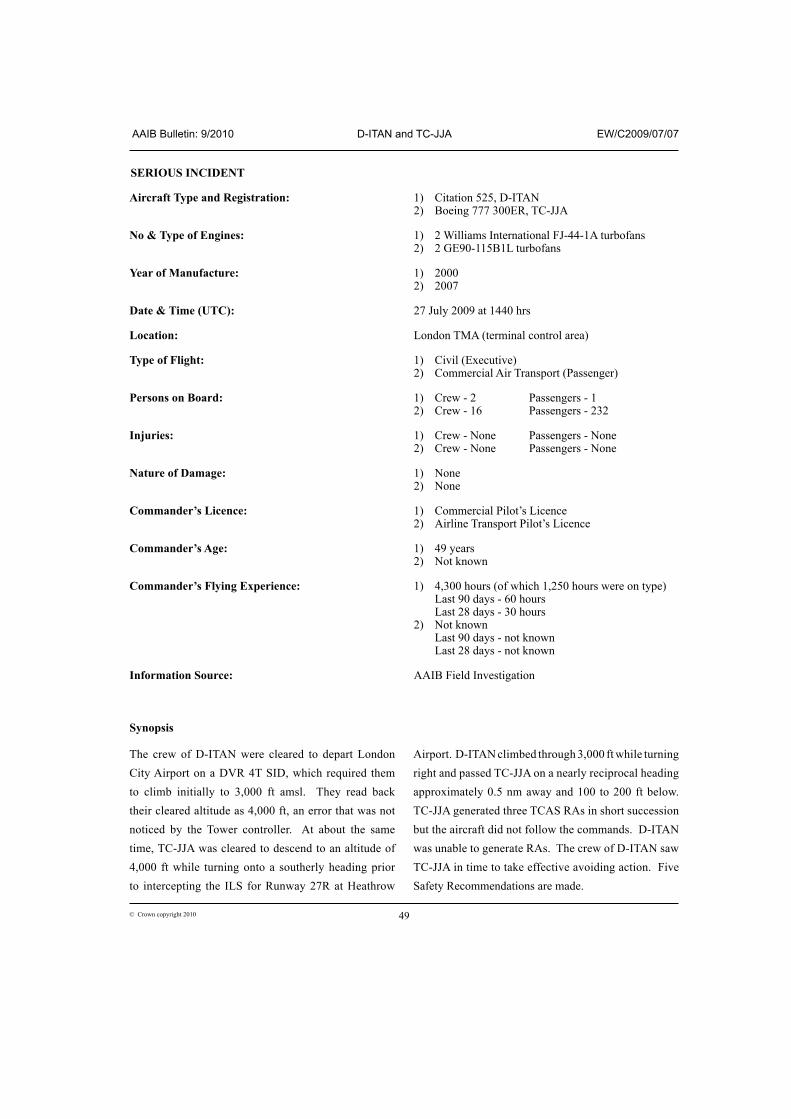
SERIOUS INCIDENT
Aircraft Type and Registration: 1) Citation 525, D-ITAN 2) Boeing 777 300ER, TC-JJA
No & Type of Engines: 1) 2 Williams International FJ-44-1A turbofans 2) 2 GE90-115B1L turbofans
Year of Manufacture: 1) 2000 2) 2007
Date & Time (UTC): 27 July 2009 at 1440 hrs
Location: London TMA (terminal control area)
Type of Flight: 1) Civil (Executive) 2) Commercial Air Transport (Passenger)
Persons on Board: 1) Crew - 2 Passengers - 1 2) Crew - 16 Passengers - 232
Injuries: 1) Crew - None Passengers - None 2) Crew - None Passengers - None
Nature of Damage: 1) None 2) None
Commander’s Licence: 1) Commercial Pilot’s Licence 2) Airline Transport Pilot’s Licence
Commander’s Age: 1) 49 years 2) Not known
Commander’s Flying Experience: 1) 4,300 hours (of which 1,250 hours were on type) Last 90 days - 60 hours Last 28 days - 30 hours 2) Not known Last 90 days - not known Last 28 days - not known
Information Source: AAIB Field Investigation
Synopsis
The crew of D-ITAN were cleared to depart London
City Airport on a DVR 4T SID, which required them to climb initially to 3,000 ft amsl. They read back
their cleared altitude as 4,000 ft, an error that was not
noticed by the Tower controller. At about the same
time, TC-JJA was cleared to descend to an altitude of
4,000 ft while turning onto a southerly heading prior
to intercepting the ILS for Runway 27R at Heathrow
Airport. D-ITAN climbed through 3,000 ft while turning
right and passed TC-JJA on a nearly reciprocal heading
approximately 0.5 nm away and 100 to 200 ft below.
TC-JJA generated three TCAS RAs in short succession but the aircraft did not follow the commands. D-ITAN
was unable to generate RAs. The crew of D-ITAN saw
TC-JJA in time to take effective avoiding action. Five
Safety Recommendations are made.

50© Crown copyright 2010
AAIB Bulletin: 9/2010 D-ITAN and TC-JJA EW/C2009/07/07
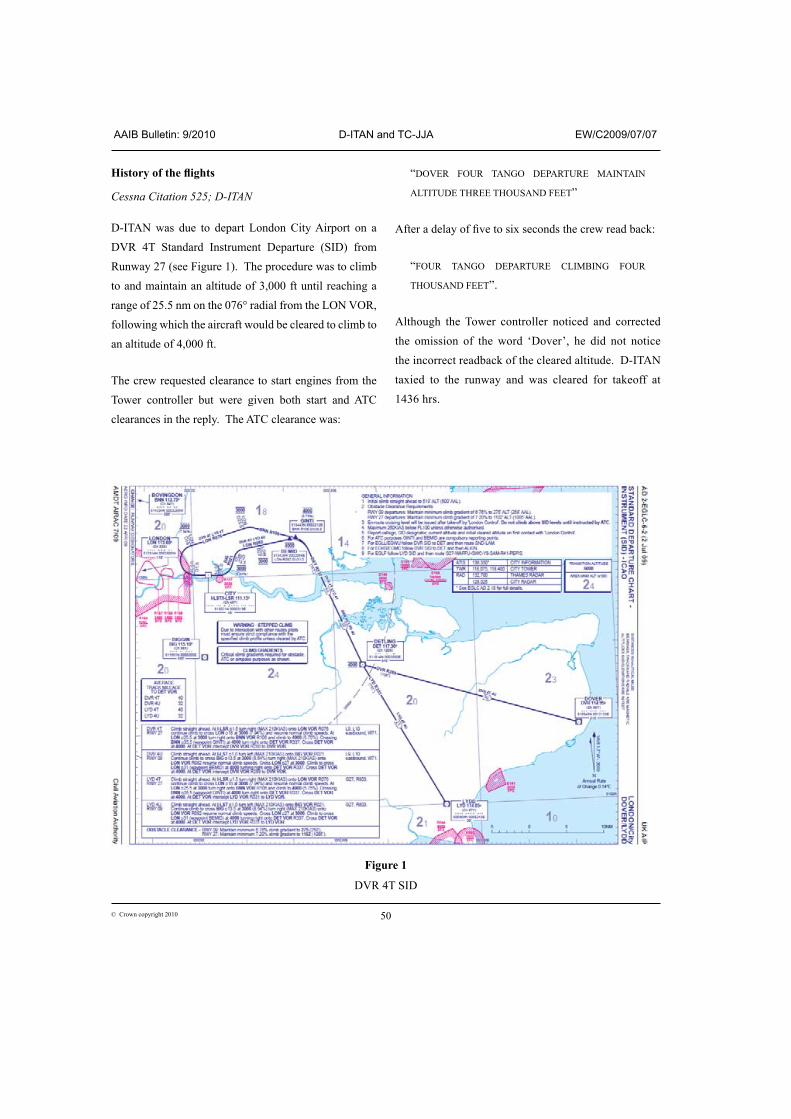
History of the flights
Cessna Citation 525;; D-ITAN
D-ITAN was due to depart London City Airport on a DVR 4T Standard Instrument Departure (SID) from Runway 27 (see Figure 1). The procedure was to climb to and maintain an altitude of 3,000 ft until reaching a range of 25.5 nm on the 076° radial from the LON VOR, following which the aircraft would be cleared to climb to an altitude of 4,000 ft.
The crew requested clearance to start engines from the Tower controller but were given both start and ATC clearances in the reply. The ATC clearance was:
“DOVER FOUR TANGO DEPARTURE MAINTAIN
ALTITUDE THREE THOUSAND FEET”
After a delay of five to six seconds the crew read back:
“FOUR TANGO DEPARTURE CLIMBING FOUR
THOUSAND FEET”.
Although the Tower controller noticed and corrected the omission of the word ‘Dover’, he did not notice the incorrect readback of the cleared altitude. D-ITAN taxied to the runway and was cleared for takeoff at 1436 hrs.
Figure 1
DVR 4T SID

51© Crown copyright 2010
AAIB Bulletin: 9/2010 D-ITAN and TC-JJA EW/C2009/07/07
After takeoff, the aircraft maintained a heading of 270° until 1437:27 hrs when it began to turn right (Figure 2). As it passed an altitude of 1,300 ft, the aircraft was climbing at a rate of just under 3,000 ft/min and as it passed 3,000 ft, the rate was 3,300 ft/min. At 1437:28 hrs, the crew was instructed to contact Thames radar, which they did at 1438:16 hrs. During the intervening period, there were two gaps in radio transmissions, one of four seconds and one of two seconds. At 1438:19, D-ITAN was heading north at an altitude of between 3,800 and 3,900 ft when it passed TC-JJA on a nearly reciprocal heading. D-ITAN was approximately 0.5 nm to the west of TC-JJA and 100 to 200 ft below it. At 1438:32, the radar controller transmitted:
“DELTA ALPHA NOVEMBER REPORT YOUR
ALTITUDE. DELTA ALPHA NOVEMBER DESCEND
IMMEDIATEDLY DESCEND TO ALTITUDE THREE
THOUSAND FEET”.
The crew of D-ITAN acknowledged and complied with the instruction although by then their aircraft was clear of TC-JJA. At 1439:40, the radar controller instructed D-ITAN to:
“CLIMB TO ALTITUDE FOUR THOUSAND FEET”
which was acknowledged by the crew.
Boeing 777-300ER;; TC-JJA
TC-JJA, callsign Turkish Airlines 1991, was being vectored for an ILS approach to Runway 27R at London Heathrow Airport. The commander was the Pilot Not Flying (PNF) and the co-pilot, who was under training, was the Pilot Flying (PF). They were flying in VMC at 180 kt IAS and were cleared to descend to an altitude of 4,000 ft. At 1437:38 the aircraft was at an altitude of 4,900 ft and was instructed to turn right onto a heading of 185°. As the pilot transmitted his acknowledgement,
a TCAS Traffic Alert (TA) was generated. At 1438:05, he transmitted:
“WE HAVE A TRAFFIC ALERT”
but during the transmission a TCAS ‘crossing descend’ Resolution Advisory (RA)1 was generated. The Heathrow controller replied:
“AFFIRM. HE’S BUST HIS LEVEL. CAN YOU CLIMB
CLIMB2 TO MAINTAIN FIVE THOUSAND FEET?”
During this transmission, a TCAS ‘increase descent’ RA was generated. Following this, a TCAS ‘reversal climb’ RA was generated between 1438:11 and 1438:15. TC-JJA levelled briefly at an altitude of 4,000 ft before starting to climb and it was while the aircraft was at 4,000 ft that it passed D-ITAN at 1438:19.
During a conversation with the controller at 1438:50, the pilot of TC-JJA transmitted:
“WE HAD TO DO A RESOLUTION HERE”
which was acknowledged by the controller.
London City Tower controller
The London City Tower controller reported to the internal National Air Traffic Services (NATS) enquiry that he recalled D-ITAN requesting both start and ATC clearance at the same time, which was usual for private aircraft. The controller was not sure whether he mis-heard the pilot’s readback of the altitude restriction or whether he did not hear it at all due to his attention being focussed on correcting the omission of the word “Dover”.
Footnote
1 An RA which takes the aircraft through the threat aircraft’s altitude.2 Intentional repeat of the word ‘climb’.

Policy INF1 of Newham Core Strategy (01/2012) relates directly to London City Airport. It states that any proposals for future growth ant the airport above the approved 120,000 flight movements per annum will have to be carefully considered. The airport is acknowledged as a (current) key economic driver within the Royal Docks.
Policy S3 allocates the docks as a unique and high quality waterfront urban quarter.
Policy INF7 relates to the Blue Ribbon Network and states that the Royal Docks will be protected and enhanced via the following measures; developments located adjacent to the BRN should enhance the waterside environment and provide access and improved amenity to the waterfront; natural habitats will be protected and enhanced; landscape character, heritage, views and linear nature of the network will be protected and enhanced; access to the BRN will be improved.
Newham Core Strategy
National Planning Policy Framework (03/2102) (NPPF) is a material consideration in this planning application.
It states that local planning authorities should approach decision making in a positive way to foster the delivery of sustainable development and decision makers should approve applications for sustainable development where possible and local planning authorities should work proactively to secure developments that improve the economic, social and environmental conditions of an area (para 187)
Paragraph 109 also states that “The planning system should contribute to and enhance the natural and local environment by protecting and enhancing valued landscapes, geological conservation interests and soils.
It expects local planning policies and decisions to ensure that new development is appropriate for its location and the effects of pollution – including noise – on health, the natural environment or general amenity are taken into account. In paragraph 17 it states that: “planning should conserve heritage assets in a manner appropriate to their significance, so that they can be enjoyed for their contribution to the quality of life of this and future generations.” Also in paragraph 128: “In determining applications, local planning authorities should require an applicant to describe the significance of any heritage assets affected, including any contribution made by their setting.”
Airport expansion is for economic growth, whereas the loss of water space is detrimental for future generations.
National Planning Policy Framework
52© Crown copyright 2010
AAIB Bulletin: 9/2010 D-ITAN and TC-JJA EW/C2009/07/07
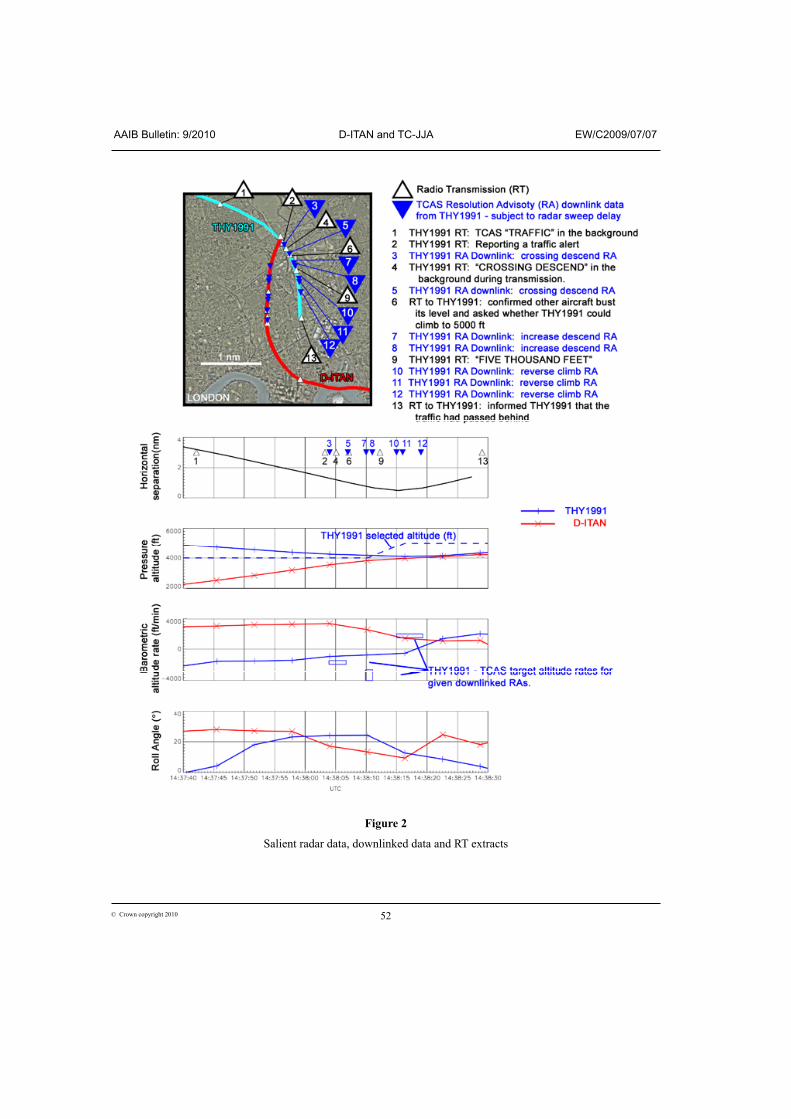
Figure 2
Salient radar data, downlinked data and RT extracts
53© Crown copyright 2010
AAIB Bulletin: 9/2010 D-ITAN and TC-JJA EW/C2009/07/07
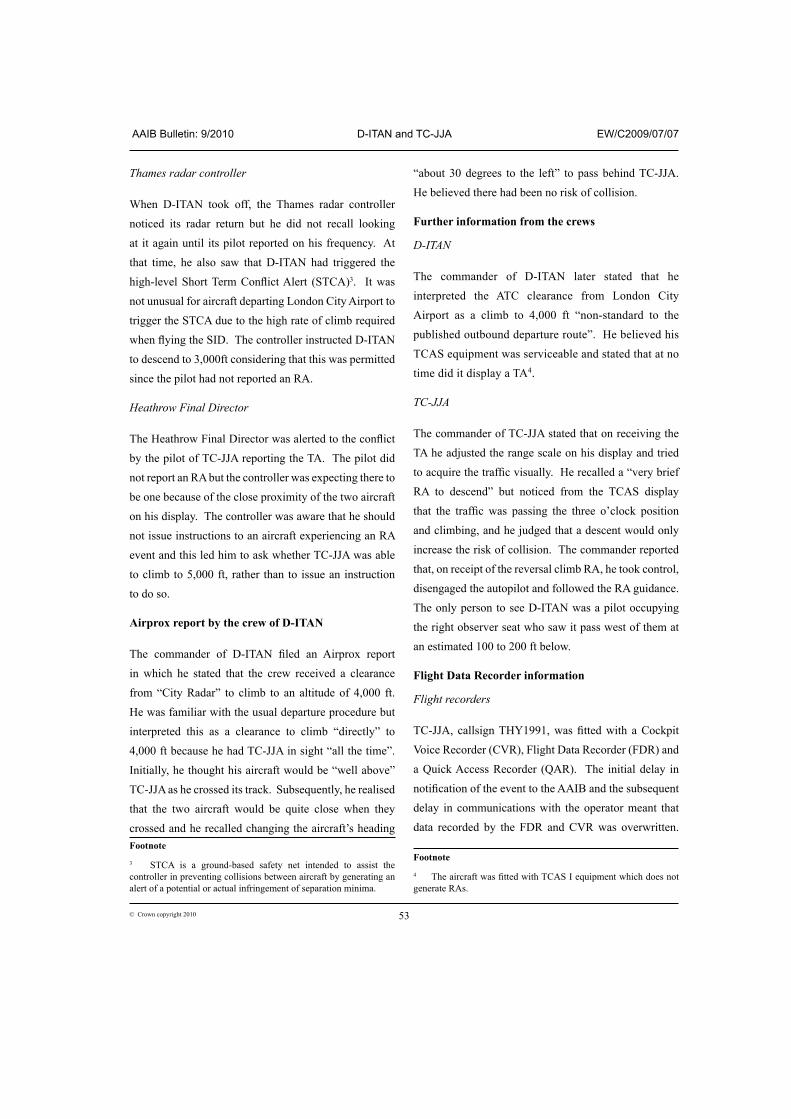
Thames radar controller
When D-ITAN took off, the Thames radar controller
noticed its radar return but he did not recall looking
at it again until its pilot reported on his frequency. At
that time, he also saw that D-ITAN had triggered the
high-level Short Term Conflict Alert (STCA)3. It was
not unusual for aircraft departing London City Airport to
trigger the STCA due to the high rate of climb required when flying the SID. The controller instructed D-ITAN to descend to 3,000ft considering that this was permitted
since the pilot had not reported an RA.
Heathrow Final Director
The Heathrow Final Director was alerted to the conflict by the pilot of TC-JJA reporting the TA. The pilot did
not report an RA but the controller was expecting there to
be one because of the close proximity of the two aircraft
on his display. The controller was aware that he should
not issue instructions to an aircraft experiencing an RA
event and this led him to ask whether TC-JJA was able
to climb to 5,000 ft, rather than to issue an instruction
to do so.
Airprox report by the crew of D-ITAN
The commander of D-ITAN filed an Airprox report in which he stated that the crew received a clearance
from “City Radar” to climb to an altitude of 4,000 ft.
He was familiar with the usual departure procedure but
interpreted this as a clearance to climb “directly” to
4,000 ft because he had TC-JJA in sight “all the time”.
Initially, he thought his aircraft would be “well above”
TC-JJA as he crossed its track. Subsequently, he realised that the two aircraft would be quite close when they
crossed and he recalled changing the aircraft’s heading Footnote
3 STCA is a ground-based safety net intended to assist the controller in preventing collisions between aircraft by generating an alert of a potential or actual infringement of separation minima.
“about 30 degrees to the left” to pass behind TC-JJA.
He believed there had been no risk of collision.
Further information from the crews
D-ITAN
The commander of D-ITAN later stated that he
interpreted the ATC clearance from London City
Airport as a climb to 4,000 ft “non-standard to the
published outbound departure route”. He believed his
TCAS equipment was serviceable and stated that at no time did it display a TA4.
TC-JJA
The commander of TC-JJA stated that on receiving the
TA he adjusted the range scale on his display and tried
to acquire the traffic visually. He recalled a “very brief RA to descend” but noticed from the TCAS display that the traffic was passing the three o’clock position and climbing, and he judged that a descent would only
increase the risk of collision. The commander reported
that, on receipt of the reversal climb RA, he took control,
disengaged the autopilot and followed the RA guidance.
The only person to see D-ITAN was a pilot occupying
the right observer seat who saw it pass west of them at
an estimated 100 to 200 ft below.
Flight Data Recorder information
Flight recorders
TC-JJA, callsign THY1991, was fitted with a Cockpit Voice Recorder (CVR), Flight Data Recorder (FDR) and
a Quick Access Recorder (QAR). The initial delay in notification of the event to the AAIB and the subsequent delay in communications with the operator meant that
data recorded by the FDR and CVR was overwritten.
Footnote
4 The aircraft was fitted with TCAS I equipment which does not generate RAs.

54© Crown copyright 2010
AAIB Bulletin: 9/2010 D-ITAN and TC-JJA EW/C2009/07/07
The QAR should have had sufficient storage not to have been overwritten but the data was lost due to system
failure.
D-ITAN was not fitted with, or required to be fitted with, crash-protected recorders or flight data monitoring recorders. Neither TCAS unit fitted to the aircraft involved had capability to record event data.
Primary and secondary radar tracks for both aircraft
were recorded by the Debden and Heathrow radar
installations. Mode S datalink recordings of both aircraft were also recorded by Debden radar. This provided the
following parameters with a refresh rate corresponding
to the 6-second rotation rate of the radar antenna:
Altitude with a 25ft resolution Roll angle True track angle Ground Speed True Airspeed Heading Indicated airspeed Mach Barometric altitude rate Selected altitude (TC-JJA only)
THY1991 also transmitted TCAS-related messages via Mode S. These messages were also subject to a delay due to the rotation rate of the radar antenna but were
received by a number of radar heads. The content of
the messages indicated that the TCAS fitted to THY1991 had incorrectly identified D-ITAN as not being Mode S equipped, whereas NATS radar had received Mode S data direct from D-ITAN. The cause of this discrepancy
was not found but it would have had little effect on the
outcome of these particular events.
ATC voice communications were also made available to
the investigation.
Figure 2 is an amalgamation of these data sources. The
recordings showed that TCAS was fully operational on THY1991. A traffic alert was issued to the crew whilst descending to a selected altitude of 4,000 ft and the
crew passed this information to the controller. Shortly after this, TCAS issued a “CROSSING DESCEND” RA.
This was evident in the background of a transmission
by THY1991, though may not have been noticeable to
the controller, and was also downlinked via Mode S but this was not available to the controller. The RA
required an increased descent rate;; the descent rate was reduced. The controller asked whether THY1991 could
climb to 5,000 ft. This was followed by a downlink of
an ‘increase descent RA’, requiring a descent rate of
greater than 2,500 ft/min. The crew read back “FIVE
THOUSAND FEET”. The next RA downlinks indicated a
reversal to a climb RA. This was followed by an increase
in the selected altitude of the aircraft. The aircraft then
passed abeam each other with a lateral separation of
0.5 nm and a vertical separation of 164 ft.
Simulations carried out by NATS and Eurocontrol confirmed that the TCAS of THY1991 provided the expected commands.
Standard Instrument Departures (SIDs)
DVR 4T SID
The DVR 4T SID is a ‘step-climb’ SID with an initial climb to an altitude of 3,000 ft. The departure is in
close proximity to obstacles and requires an initial
minimum climb gradient of 7.94%;; no maximum gradient is stipulated. The departure track of the
SID crosses the tracks of aircraft being vectored for approach to Runways 27L or 27R at Heathrow airport.
Traffic inbound to Heathrow Airport is not cleared
55© Crown copyright 2010
AAIB Bulletin: 9/2010 D-ITAN and TC-JJA EW/C2009/07/07
below an altitude of 4,000 ft in this region to ensure
vertical separation from traffic on the SID. A warning on the SID states:
‘Due to interaction with other routes pilots must ensure strict compliance with the specified climb profile unless cleared by ATC.’
NATS reported that, since January 2004, there have been 21 occasions when aircraft departing London City
Airport have climbed above the step altitude of 3,000 ft
published in the SID. A third of the incidents led to a loss of ATC separation. Evidence from London Stansted Airport showed that removing the step-climb element
of the CPT/BUZ SIDs led to a reduction in the number of aircraft that climbed through the first cleared altitude after takeoff. There were 12 ‘level busts’ reported on
the SIDs in the 24 months before the end of 2005 when the step-climb was removed. There were 5 level busts
in the following three years and seven months.
It was standard practice when issuing DVR 4T departure
clearances for controllers to instruct crews to maintain
3,000 ft after takeoff. Since the incident, the instruction to maintain 3,000 ft is given separately from the remainder
of the clearance and requires a separate readback from
the crew. Operators flying from the airport have also been asked to reiterate to their crews the importance of
levelling off at 3,000 ft.
SID procedures and phraseology
A change to ‘International Civil Aviation Organisation (ICAO) Doc 4444 (PANS-ATM)’ in November 2007
introduced revised procedures and phraseology
associated with climb instructions issued to aircraft
following a SID. The document stated that:
‘When a departing aircraft on a SID is cleared to climb to a level higher than the initially cleared level or the level(s) specified in a SID, the aircraft shall follow the published vertical profile of a SID, unless such restrictions are explicitly cancelled by ATC.’
An example of the phraseology is: ‘climb to FL120 level
restrictions (SID designator) cancelled’.
As a result of concerns raised by member States and industry, ICAO acknowledged that States had encountered difficulties implementing the new procedures and undertook to consult further. The UK did
not implement the revised procedures and phraseology
for reasons explained in the CAA’s ‘Flight Operations Division Communication (FODCOM) 16/2009’. In the
UK, for all stages of flight, an instruction to climb or descend cancels any previous restrictions unless they
are reiterated as part of that instruction. For aircraft
on a SID, the word ‘now’ is added to climb clearances above the SID profile eg ‘climb now FL120’ is an instruction for an aircraft to climb directly to FL120
ignoring the vertical profile of the SID.
The CAA issued a Supplementary Instruction (SI) to ‘CAP 493 Manual of Air Traffic Services (MATS) Part 1’ on 24 April 2009. The SI clarified UK SID procedures and phraseology and gave guidance to controllers on the
recent developments. It stated:
‘Controllers must remain alert to the potential for incorrect or unexpected interpretation of ATC instructions by non-UK aircraft operators and take appropriate action to ensure any required separation.’
Germany, the State of Registry of D-ITAN and the State of its operator, implemented the revised ICAO
56© Crown copyright 2010
AAIB Bulletin: 9/2010 D-ITAN and TC-JJA EW/C2009/07/07
procedures and phraseology on 18 December 2008 through amendment to its ‘Manual of Operations Air Traffic Control Services’.
On 31 March 2010, the CAA issued ‘FODCOM 09/2010’, which referred to the results of the ICAO consultation on the revised procedures. The FODCOM stated:
‘From the State responses, ICAO has identified that their current provisions have not provided the intended simplicity, efficiency, and global standardisation to ensure flight safety.’
Consequently, ICAO recommended that States promulgate, as a matter of urgency, any difference from the PANS-ATM SID/STAR provisions in the national AIP. ICAO reported that it would work expeditiously to determine the optimum solution to the current situation.
Airborne Collision Avoidance System (ACAS)
Rules for the carriage of ACAS
ACAS is a set of standards for aircraft-based equipment. ACAS I issues TAs, which alert crews to the presence of potential threat aircraft. ACAS II also issues RAs, which instruct crews to manoeuvre the aircraft in the vertical plane in order to resolve a conflict. The only equipment currently able to meet the requirements of ACAS II is TCAS II. Turbine jet aircraft flying in the UK are required to carry ACAS II if they have a maximum takeoff weight exceeding 5,700 kg, or a maximum approved passenger seating configuration of more than 19. The Boeing 777 was fitted with TCAS II. The Cessna Citation 525 was not required to carry ACAS although it was fitted with TCAS I.
ACAS II RAs
The procedures to be followed by pilots in the event of an RA are detailed in ‘ICAO PANS-OPS (Doc 8168)’. When an ACAS II RA is generated, pilots are expected to:
‘Respond immediately by following the RA as indicated, unless doing so would jeopardize the safety of the aeroplane.’
For RAs requiring a change in vertical speed, the pilot is expected to respond correctly within five seconds of the RA being displayed. Compliance with the RA will generally require a vertical speed of approximately 1,500 ft/min, corresponding to an initial vertical acceleration of 0.25g, but this may vary according to the event. The RAs of two TCAS II equipped aircraft will generate a miss distance in the vertical sense that is coordinated through a Mode S data link. An RA can be generated by TCAS II against a threat aircraft not fitted with TCAS II, providing such an aircraft is equipped with an altitude-reporting transponder. The safety benefit will be reduced, however, because there will be no coordination between the aircraft and the threat aircraft will be incapable of generating its own RA. During a TCAS alert, the RA may require an increase or decrease in vertical speed or may reverse its sense. In such cases a response is required from the pilot within two and a half seconds. Doc 8168 notes that:
‘Visually acquired traffic may not be the same traffic causing an RA. Visual perception of an encounter may be misleading, particularly at night.’
Consequently, pilots are discouraged from making their own judgements about resolving a conflict once an RA has been triggered. Apart from possibly considering the wrong threat aircraft, their action might invalidate any
57© Crown copyright 2010
AAIB Bulletin: 9/2010 D-ITAN and TC-JJA EW/C2009/07/07
coordination that is taking place, thereby making the situation worse. The document also notes that:
‘The ability of ACAS to fulfil its role of assisting pilots in the avoidance of potential collisions is
dependent on the correct and timely response by pilots to ACAS indications. Operational experience has shown that correct response by pilots is dependent on the effectiveness of the initial
and recurrent training in ACAS procedures.’
The effect of TCAS II on ATC operations
‘CAP 493 MATS Part 1’ includes instructions for ATC controllers on dealing with aircraft responding to TCAS RAs. When a pilot reports an RA:
‘Controllers shall not attempt to modify the aircraft flight path until the pilot reports “clear of conflict”.’
Once an aircraft departs from an ATC clearance in compliance with an RA, or a pilot reports an RA, the controller ceases to be responsible for providing separation between that aircraft and any other aircraft affected by the manoeuvre induced by the RA. The controller resumes responsibility for providing separation when the aircraft has resumed the current clearance, or the crew reports they are resuming the current clearance and the controller issues an alternative clearance.
ACAS phraseology
Specific ACAS phraseology, contained in ‘ICAO PANS-ATM (Doc 4444)’, has been adopted to provide the means to ensure that pilots and controllers have a clear understanding of the progression of an RA manoeuvre, and the means to delineate the point at which responsibility for the separation of aircraft transfers from controller to pilot and back to controller. The crew should notify the
appropriate ATC unit as soon as possible, as permitted by workload, of any RA which requires a deviation from the current ATC clearance by transmitting:
“TCAS RA”.
After the RA response is completed and a return to the ATC clearance is initiated, the pilot should transmit:
“CLEAR OF CONFLICT RETURNING TO (assigned clearance)”.
When the ATC clearance has been resumed, the pilot should transmit:
“CLEAR OF CONFLICT (ASSIGNED CLEARANCE) RESUMED”.
Automatic notification of TCAS RAs
Eurocontrol estimates that 25% of RAs are never reported to the controller and 25% are notified ‘very late’. Pilot reports (when they happen) are often ‘lengthy, unstructured, incorrect or incomplete, requiring repetition or clarification from the controller’. If controllers do not know that the aircraft is responding to an RA, they might issue an instruction in an attempt to resolve the conflict and that instruction could contradict the RA.
Automatic notification of RAs to controllers’ screens (RA downlink) has been contemplated for some time. Eurocontrol carried out a ‘Feasibility of ACAS RA Downlink’ Study (FARADS project), which found that currently an en-route controller would on average be aware of an RA 30 seconds after it was presented to the pilot. Controllers would be aware of RAs within 10 seconds in 95% of cases where aircraft were using Mode S transponders to downlink the RA information. The potential benefits of RA downlink would be: the reduced likelihood of contradictory clearances;;

58© Crown copyright 2010
AAIB Bulletin: 9/2010 D-ITAN and TC-JJA EW/C2009/07/07
improved situational awareness;; more up-to-date traffic information, especially to other aircraft in the vicinity;; and better post-conflict traffic planning.
The International Federation of Air Traffic Controllers Associations (IFATCA) is opposed to RA downlink.
However, should it be implemented, IFATCA is
concerned that there must be clear and unambiguous
legal responsibilities for controllers with no delay in
the downlink (for example due to antenna rotation) and
nuisance and false alerts being kept to a minimum. The
International Federation of Airline Pilots’ Associations
(IFALPA) supports the concept in principle but requires
the data update rate to be not less that one report per
second.5
Increasing the update rate of information within
the system is technically feasible although not yet
implemented. However, the functionality to display
RAs to the controller using Mode S transponders already exists in commercial ATC systems;; some states have implemented the functionality and some others are
considering doing so. Eurocontrol is concerned that a
Europe-wide concept of operations should be developed
to avoid a proliferation of national concepts.
NATS investigation report
An assessment of the performance of TCAS was provided by NATS’s ACAS ‘Interactive Collision Avoidance Simulator’ (InCAS) team. The pilot of D-ITAN reported that his TCAS equipment did not generate any TAs, which was unexpected given the alerts known to have been
generated in TC-JJA. No technical explanation for this
was established due to a lack of recorded data. TC-JJA
did not treat D-ITAN as being Mode-S equipped.
Footnote
5 Report on the Eurocontrol ‘RA Downlink Workshop’ dated 20 November 2009.
The pilot was aware that a clearance to climb to 4,000 ft
was non-standard but did not query the clearance. Radar
data indicated that D-ITAN complied with the rate of
climb stipulated in the SID but the high rate of climb reduced the time available for the error to be detected.
There was no downlink from D-ITAN of the flight level selected on the autopilot and so the level-bust could
not be anticipated by the controller. D-ITAN did not
report on the Thames radar frequency until so close
to the point of minimum separation that the controller
did not have time to take effective action to resolve the
situation. The report concluded that the event was not
resolved by ATC.
The pilot of TC-JJA did not use the correct phraseology
to inform the Heathrow Final Director that he had
received an RA. The aircraft flightpath did not appear to change in compliance with the first two RAs to descend. The flightpath did change after the climb RA was triggered but this was not apparent from the radar
data until after the two aircraft were passing each other.
The report concluded that the event was not resolved
by TCAS.
Both aircraft were in VMC but D-ITAN was not seen by
either operating pilot in TC-JJA and so no action was
taken on this aircraft to resolve the situation. The crew
of D-ITAN reported that they were in visual contact
with TC-JJA and adjusted their aircraft’s flightpath in order to avoid it. The report concluded that the conflict was resolved by the crew of D-ITAN.
The report noted that departures from London City
Airport require crews to make full power takeoffs
before levelling off less than one minute after leaving
the ground, which is unusual. It is critical that aircraft
comply with the level-off because there is a high
probability that the departing traffic will cross the track
59© Crown copyright 2010
AAIB Bulletin: 9/2010 D-ITAN and TC-JJA EW/C2009/07/07
of an aircraft inbound to Heathrow Airport, which might be only 1,000 ft above.
The NATS investigation report recommended that:
1) all SIDs from London City Airport should terminate at an altitude of 3,000 ft, and
2) lateral interaction should be eliminated between the SIDs and the base leg turn for aircraft positioning to land at Heathrow Airport.
Subsequent comments by NATS
Following further assessment, managers within NATS concluded that the recommendation (2, above) regarding the London City Airport SID track could not be accepted. The track could not be moved effectively as the interaction with aircraft positioning to land at Heathrow Airport occurs almost immediately after departure. Moving the Heathrow Airport arrival track significantly to the west would result in aircraft joining the approach from above the glideslope, which would increase the risk of aircraft making unstable approaches. Descending aircraft early, so that they joined the approach from beneath the glideslope, would increase noise and fuel burn. NATS also reported that there would be increased difficulty in applying wake turbulence procedures. However, NATS stated that new procedures had been trialled that would mitigate the risk resulting from a level bust in the area concerned.
Analysis
Communication
The initial event in this incident was the miscommunication between the crew of D-ITAN and the aerodrome controller. The delay in their reply suggested the crew were probably not expecting to receive their
departure clearance when they called for start clearance, and this might have contributed to them writing down the incorrect altitude. Subsequently, although they were aware that a climb to 4,000 ft was unusual, they did not query the clearance. The controller missed the incorrect readback of the cleared altitude, which meant that the crew took off prepared to climb through the step altitude on the SID. The new communication procedures implemented at London City Airport since this incident are designed to ensure that crews understand and comply with the requirement to level off at 3,000 ft.
The commander of TC-JJA notified ATC that his aircraft had generated a TA, which he was not required to do. His transmission and the subsequent reply from ATC were made at the same time as the first two RAs, which might have made the warnings more difficult to hear than otherwise. The commander took control from the co-pilot to respond to the reversal climb RA and it was unclear whether or not responsibility for communication had moved to the co-pilot. The “TCAS RA” call to ATC was omitted, which resulted in the controller being unsure whether a TCAS event had occurred. The “CLEAR OF CONFLICT” transmission was also omitted and the phraseology used subsequently to inform ATC about the RA was incorrect.
Airspace management
On the DVR 4T SID, although the departure track crosses the base leg turn of traffic inbound to Heathrow Airport, aircraft in the same position laterally should still be separated vertically by a minimum of 1,000 ft. Because of the overlapping tracks, one third of aircraft which climb through their cleared altitude are likely to cause a loss of ATC separation but it is not practicable to remove the lateral interaction. NATS has trialled new procedures which, it believes, will mitigate the risk resulting from a level bust in this area. Therefore:

60© Crown copyright 2010
AAIB Bulletin: 9/2010 D-ITAN and TC-JJA EW/C2009/07/07
Safety Recommendation 2010-056
It is recommended that NATS demonstrates to the Civil Aviation Authority (CAA) that appropriate mitigation
has been put in place to reduce significantly the risk of an accident resulting from a level bust by an aircraft
departing London City Airport or on the base leg turn
positioning to land at Heathrow Airport.
Prior to the incident, the DVR 4T SID was issued along with an instruction to maintain 3,000 ft but, despite
this, some aircraft still failed to level off at the step
altitude. The high rate of climb associated with the
SID, while necessary to provide clearance from nearby obstacles, reduces the time for corrective action should
an aircraft climb through the step altitude. Evidence
from Stansted Airport suggests that removing the step-climb from the SID, and terminating the SID at 3,000 ft, is likely to result in fewer incidents of aircraft
climbing through 3,000 ft. However, it would probably
be unwise to have one SID terminating at 3,000 ft while the others terminated at 4,000 ft. Therefore this AAIB
investigation endorses the NATS investigation, and makes the following two Safety Recommendations:
Safety Recommendation 2010-057
It is recommended that London City Airport amends
all Standard Instrument Departures (SIDs) so that they terminate at an altitude of 3,000 ft.
Safety Recommendation 2010-058
It is recommended that London City Airport removes
Step Climb procedures from its Standard Instrument Departures (SIDs).
TCAS
Because there was no Mode S downlink of D-ITAN’s selected flight level, there was no opportunity for the radar controllers to anticipate the conflict and take appropriate action. D-ITAN did not generate any
TAs, which was unexpected given the geometry of the
encounter. The lack of a TA could not be explained
because no recorded data from either aircraft was
available to the investigation, and the serviceability of
D-ITAN’s TCAS equipment could not be confirmed after the flight.
TC-JJA’s flightpath during the two descent RAs was consistent with it levelling off at the cleared altitude of
4,000 ft rather than it following the RAs. The aircraft
then climbed towards 5,000 ft, which was consistent
both with the climb RA and the controller’s suggestion
that a climb would be appropriate. The commander
faced a rapidly changing TCAS encounter with two RAs generated within six seconds and three in less
than 10 seconds. Pilots are expected to react to a
first RA within five seconds and it is likely that the second, increase descent, RA was generated because
of a lack of response to the first RA. The commander was only briefly aware of the requirement to descend but judged that a climb would be better. In this case,
his judgement was based on the correct threat aircraft
and was in the same sense as, and coincident with, the
climb RA.
The Heathrow Final Director was unsure whether an RA
had been triggered within TC-JJA because of the use of
incorrect and late TCAS phraseology by its crew. The controller asked whether TC-JJA was able to climb, a
transmission which, although not an instruction, was in
the opposite sense to the ‘increase descent’ RA that was
generated at the same time.
61© Crown copyright 2010
AAIB Bulletin: 9/2010 D-ITAN and TC-JJA EW/C2009/07/07
It was 45 seconds from the first RA, and 35 seconds from the last, before the controller was told that there had
been an RA event. ATC systems utilising RA downlink
based on Mode S would be expected to reduce this delay to within 10 seconds. Had the delay been 10 seconds
in this incident, the controller would still not have
known there was an RA event until just after the ‘climb
RA’ was generated and so the sequence of events was
unlikely to have changed substantially. Both IFATCA
and IFALPA require delays that are significantly shorter than 10 seconds before they will support the concept
in practice. Eurocontrol is therefore attempting to
develop a European concept of operations in the
knowledge that RA downlink systems are already being
implemented, even though the professional bodies of
the system operators have reservations about their use.
The arguments for and against implementation are not
clear cut and, as Euroctontrol is already considering the
issue, no recommendations are made in this regard.
During this incident, the crew of D-ITAN saw TC-JJA in
time to take effective avoiding action. Had the aircraft
been in IMC, this would not have been the case and
TCAS would have been the only barrier to a potential mid-air collision. The incident was not resolved by
TCAS for two reasons, the first being that the crew of TC-JJA did not respond to the RAs in time to affect
the geometry of the incident. It has been shown that
correct crew response to ACAS is dependent on the effectiveness of initial and recurrent training and
therefore:
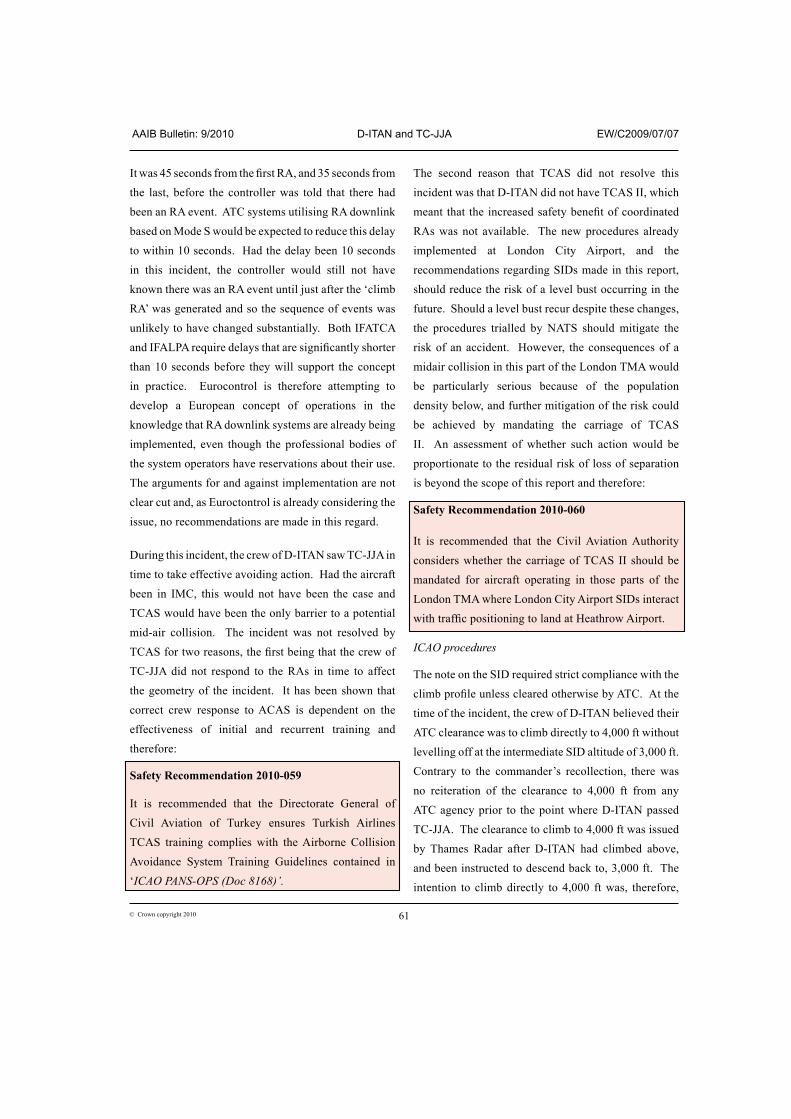
Safety Recommendation 2010-059
It is recommended that the Directorate General of
Civil Aviation of Turkey ensures Turkish Airlines
TCAS training complies with the Airborne Collision Avoidance System Training Guidelines contained in ‘ICAO PANS-OPS (Doc 8168)’.
The second reason that TCAS did not resolve this incident was that D-ITAN did not have TCAS II, which meant that the increased safety benefit of coordinated RAs was not available. The new procedures already
implemented at London City Airport, and the
recommendations regarding SIDs made in this report, should reduce the risk of a level bust occurring in the
future. Should a level bust recur despite these changes, the procedures trialled by NATS should mitigate the risk of an accident. However, the consequences of a
midair collision in this part of the London TMA would
be particularly serious because of the population
density below, and further mitigation of the risk could
be achieved by mandating the carriage of TCAS II. An assessment of whether such action would be
proportionate to the residual risk of loss of separation
is beyond the scope of this report and therefore:
Safety Recommendation 2010-060
It is recommended that the Civil Aviation Authority
considers whether the carriage of TCAS II should be mandated for aircraft operating in those parts of the
London TMA where London City Airport SIDs interact with traffic positioning to land at Heathrow Airport.
ICAO procedures
The note on the SID required strict compliance with the climb profile unless cleared otherwise by ATC. At the time of the incident, the crew of D-ITAN believed their
ATC clearance was to climb directly to 4,000 ft without
levelling off at the intermediate SID altitude of 3,000 ft. Contrary to the commander’s recollection, there was
no reiteration of the clearance to 4,000 ft from any
ATC agency prior to the point where D-ITAN passed
TC-JJA. The clearance to climb to 4,000 ft was issued
by Thames Radar after D-ITAN had climbed above,
and been instructed to descend back to, 3,000 ft. The
intention to climb directly to 4,000 ft was, therefore,

62© Crown copyright 2010
AAIB Bulletin: 9/2010 D-ITAN and TC-JJA EW/C2009/07/07
based solely on the crew’s (incorrect) understanding of their ATC clearance. Had the revised ICAO procedures been adopted by the UK, it is likely that this incident would have been prevented because D-ITAN would have levelled off at 3,000 ft regardless of its cleared altitude.
The arguments for and against implementation of the revised procedures are beyond the scope of this report and, since ICAO is already working to resolve the situation, no recommendations are made on this topic, as a result of this incident, beyond endorsing the need for urgency in reaching a resolution.
101© Crown copyright 2012
10/2012 AAIB Bulletin: PH-DLN and EI-RJW EW/G2012/04/16
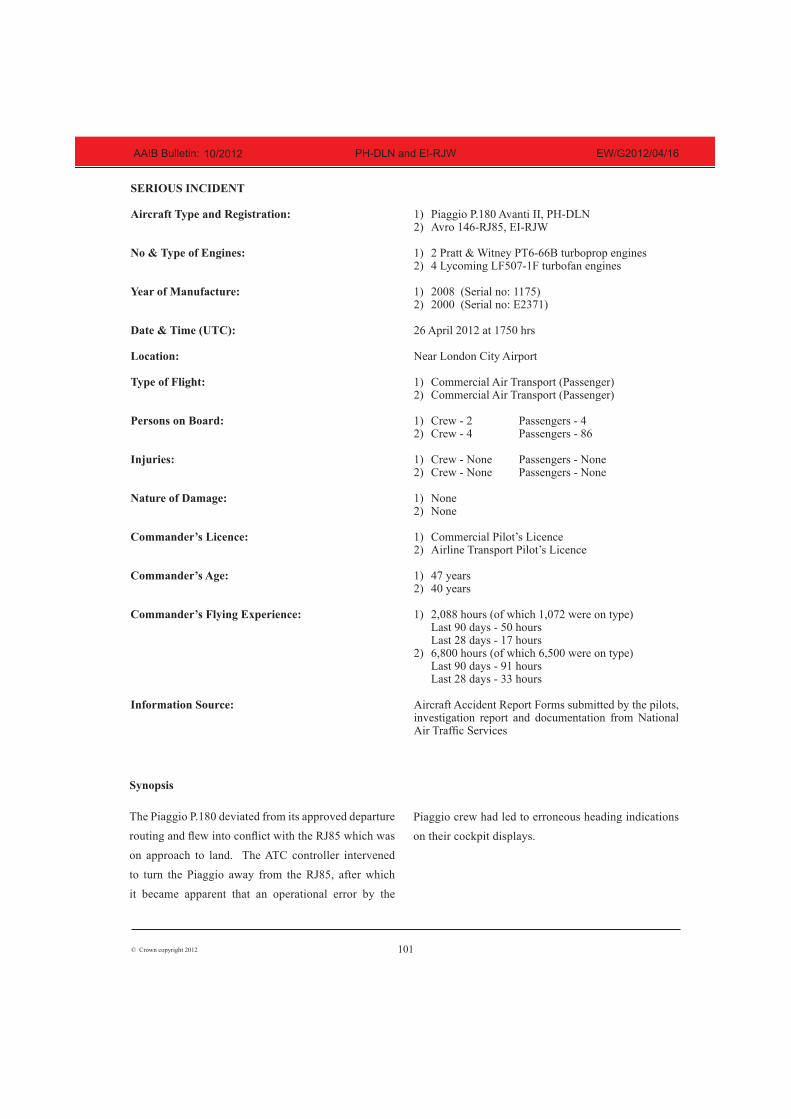
SERIOUS INCIDENT
Aircraft Type and Registration: 1) Piaggio P.180 Avanti II, PH-DLN 2) Avro 146-RJ85, EI-RJW
No & Type of Engines: 1) 2 Pratt & Witney PT6-66B turboprop engines 2) 4 Lycoming LF507-1F turbofan engines
Year of Manufacture: 1) 2008 (Serial no: 1175) 2) 2000 (Serial no: E2371)
Date & Time (UTC): 26 April 2012 at 1750 hrs
Location: Near London City Airport
Type of Flight: 1) Commercial Air Transport (Passenger) 2) Commercial Air Transport (Passenger)
Persons on Board: 1) Crew - 2 Passengers - 4 2) Crew - 4 Passengers - 86
Injuries: 1) Crew - None Passengers - None 2) Crew - None Passengers - None
Nature of Damage: 1) None 2) None
Commander’s Licence: 1) Commercial Pilot’s Licence 2) Airline Transport Pilot’s Licence
Commander’s Age: 1) 47 years 2) 40 years
Commander’s Flying Experience: 1) 2,088 hours (of which 1,072 were on type) Last 90 days - 50 hours Last 28 days - 17 hours 2) 6,800 hours (of which 6,500 were on type) Last 90 days - 91 hours Last 28 days - 33 hours
Information Source: Aircraft Accident Report Forms submitted by the pilots, investigation report and documentation from National Air Traffic Services
Synopsis
The Piaggio P.180 deviated from its approved departure
routing and flew into conflict with the RJ85 which was on approach to land. The ATC controller intervened
to turn the Piaggio away from the RJ85, after which
it became apparent that an operational error by the
Piaggio crew had led to erroneous heading indications
on their cockpit displays.

102© Crown copyright 2012
10/2012 AAIB Bulletin: PH-DLN and EI-RJW EW/G2012/04/16
History of the flights
Runway 27 was in use at London City Airport. There was a strong south-westerly wind, with good visibility and scattered cloud at about 3,000 ft. The Piaggio P.180 (PH-DLN) had just taken off and had turned right in accordance with its clearance when it flew into conflict with the RJ85 (EI-RJW) which was on final approach, following a flight from Dublin. Both aircraft were under a Radar Control Service.
The crew of PH-DLN reported on the Thames Radar frequency that they were climbing to 3,000 ft, about half a minute before the crew of EI-RJW reported established on the Runway 27 localiser. The crew of EI-RJW were instructed to establish on the glideslope and were transferred to the Tower controller. PH-DLN appeared to establish on an easterly track at 3,000 ft before the controller noticed it had turned onto a south-easterly track, towards the final approach path for Runway 27.
The controller instructed the crew of PH-DLN to turn left onto 030°. This was acknowledged but was apparently not complied with, so a further instruction to turn left was made using the phrase “AVOIDING
ACTION” and with details of the conflicting traffic. At this point, EI-RJW was 3 miles ahead of PH-DLN, descending through 2,800 ft. The aircraft did not respond immediately so the avoiding action was reiterated. As PH-DLN began a left turn, the controller instructed its crew to climb to 4,000 ft.
The controller suspected that PH-DLN had suffered a failure affecting navigation, so instructed the crew to turn left until advised. The crew complied with this instruction, together with the subsequent instruction to stop the turn, although the crew then reported their heading as northerly when in fact it was seen on radar
to be approximately 060°. The crew were informed of the discrepancy and advised to cross-check their instrumentation. After a short while the crew reported that their instrumentation had been reset. The aircraft was subsequently transferred to the next controlling sector. The crew of EI-RJW had heard ATC instructions being given to another aircraft, but were unaware of the situation as it had developed. No TCAS warnings were received by the crew of either aircraft.
The minimum separation between the aircraft was recorded on radar as 2.7 nm lateral and 700 ft vertical.
PH-DLN heading indications
Whilst at the holding point, the crew had selected Directional Gyro (DG)1 mode for heading indications on their Horizontal Situation Indicator, and adjusted the indicated heading to match the runway QDM once lined up for takeoff. After takeoff, slaved mode was selected. The crew were occupied with flying the aircraft in turbulent conditions and did not recognise that a navigational error had occurred. After complying with the ATC instruction to turn left, the crew realised the indicated heading was in error by about 60°.
The pilot’s report noted that the heading reference system should normally be kept in its slaved mode for normal operations, and DG mode only used in case of failure of the slaved system. The report identified an operational error and the distraction posed by turbulence as causal factors.
Previous occurrences
In October 2006 a Hawker 800XP aircraft experienced significant navigation problems after taking off from
Footnote
1 The horizontal situation indicator (HSI) is normally slaved to the output of a magnetic flux valve. The directional gyro mode disconnects the HSI from the flux valve output.

103© Crown copyright 2012
10/2012 AAIB Bulletin: PH-DLN and EI-RJW EW/G2012/04/16
London City Airport. An AAIB Field Investigation
(report reference EW/C2006/10/10) revealed that
several similar incidents had occurred previously. It
was established that local magnetic anomalies in the
area of the runway holding point could adversely
affect cockpit heading indications and, in some cases,
lead to heading system failure indications. Six Safety
Recommendations were made, concerning airport
standards in respect of magnetic anomalies, published
aeronautical information regarding the anomaly at
London City Airport, and advice to aircraft operators
using the Airport.
Ends

National Planning Policy Framework (03/2102) (NPPF) is a material consideration in this planning application.
It states that local planning authorities should approach decision making in a positive way to foster the delivery of sustainable development and decision makers should approve applications for sustainable development where possible and local planning authorities should work proactively to secure developments that improve the economic, social and environmental conditions of an area (para 187)
Paragraph 109 also states that “The planning system should contribute to and enhance the natural and local environment by protecting and enhancing valued landscapes, geological conservation interests and soils.
It expects local planning policies and decisions to ensure that new development is appropriate for its location and the effects of pollution – including noise – on health, the natural environment or general amenity are taken into account. In paragraph 17 it states that: “planning should conserve heritage assets in a manner appropriate to their significance, so that they can be enjoyed for their contribution to the quality of life of this and future generations.” Also in paragraph 128: “In determining applications, local planning authorities should require an applicant to describe the significance of any heritage assets affected, including any contribution made by their setting.”
Airport expansion is for economic growth, whereas the loss of water space is detrimental for future generations.
National Planning Policy Framework

The Aircraft Noise Index Study (ANIS) in 1982 which led to the view that 57dBA was the noise level identifying the onset of community annoyance.
Aviation Policy Framework states Government will treat 57db LEeq 16 hour contour as the average level of daytime aircraft noise. (significant community annoyance)
Number of dwellings in noise contours will increase. 57db increases 8,300 to 13,700 to 15,100 (2012 /2017 /2023) 63db increases 400 to 1,100 to 1,300 (2012 /2017 /2023). This does not include future development.
Noise Contours will increase around the airport 57 db 6.3km squared to 57 db 9.1km squared (2012/2021) 63db 1.6km squared to 63db 2.4km squared (2012/2021)
Population in the 57db contour will increase from 8,300 to 15,100 (2012/2021) Population in 63db will increase from 1000 to 2,800 (2012/2021) This does not include future development.
Approx. population in contours including permitted but not yet built residential could increase from 17, 900 to 75,900 in 57db, 1,000 to 17,500 in 63db (2012/2021)
Noise

Noise levels of 57db up to 70db at 28 areas of land proposed for development across 3 boroughs by 2021.
Noise
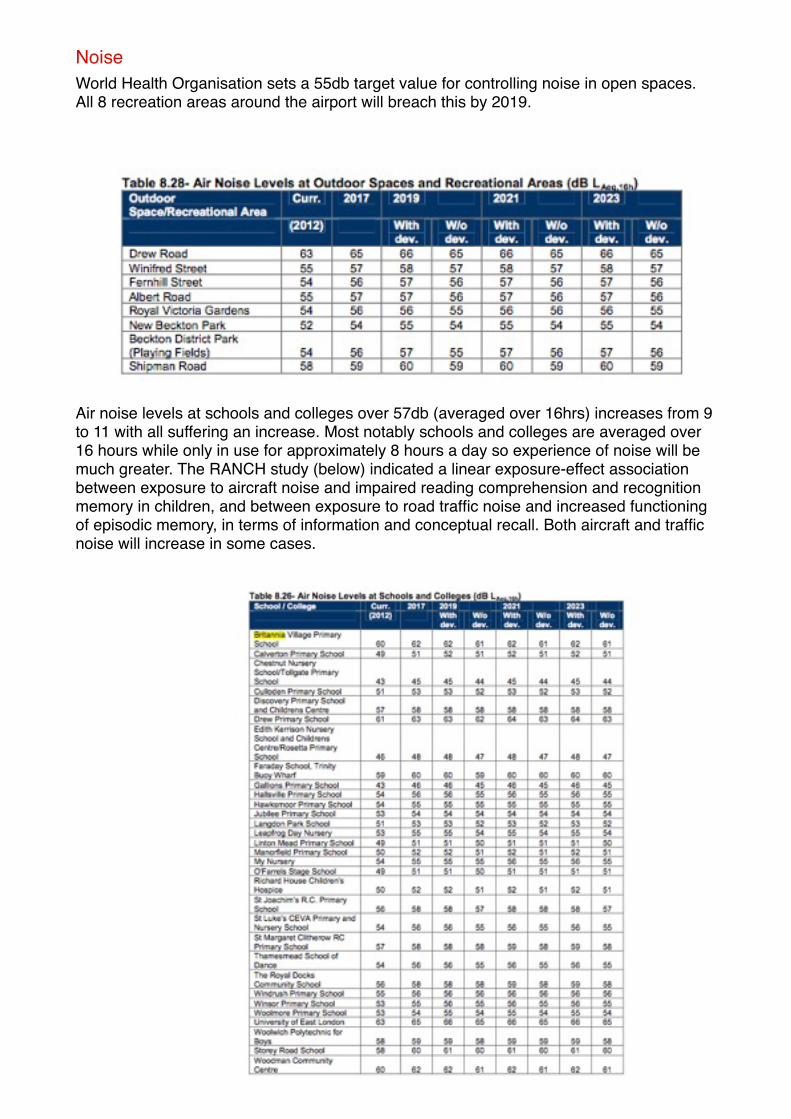
World Health Organisation sets a 55db target value for controlling noise in open spaces. All 8 recreation areas around the airport will breach this by 2019.
Air noise levels at schools and colleges over 57db (averaged over 16hrs) increases from 9 to 11 with all suffering an increase. Most notably schools and colleges are averaged over 16 hours while only in use for approximately 8 hours a day so experience of noise will be much greater. The RANCH study (below) indicated a linear exposure-effect association between exposure to aircraft noise and impaired reading comprehension and recognition memory in children, and between exposure to road traffic noise and increased functioning of episodic memory, in terms of information and conceptual recall. Both aircraft and traffic noise will increase in some cases.
Noise

An over view of key locations in shows all suffering from significant community annoyance.
We should also be seeing commutative noise readings for the area that includes Heathrow Airport. The area is overflown by aircraft from both airports and this should be included in the Environmental statement.
3.3 2002 Environmental Noise Directive (END)
One of the requirements of the Environmental Noise (England) Regulations 2006 (as amended) is that ‘quiet areas’ should be protected. Further guidance on quiet areas is to be published by Defra including the areas in each agglomeration that are defined as quiet areas. At time of writing, Defra has yet to advise local authorities within LCA’s NAP consultation area of any AONBs: no local authority has confirmed the existence of formally identified ‘quiet areas’ within their boroughs.
Noise
Articles
1942 www.thelancet.com Vol 365 June 4, 2005
IntroductionAn understanding of the way the environment affectschildren’s health and development is central tosustainable living and to the prevention of illness.1 Theeffects of air pollution and lead are well known, but lessattention has been paid to environmental noise.2,3
Noise, an ubiquitous environmental pollutant, is apublic-health issue because it leads to annoyance,reduces environmental quality, and might affect healthand cognition.4 Children could be particularlyvulnerable to the effects of noise because of itspotential to interfere with learning at a criticaldevelopmental stage, and because they have lesscapacity than adults do to anticipate, understand, andcope with stressors.5
Attention, memory, and reading are all involved incognitive development at primary school age(5–11 years). Children attend to information that isthen encoded in memory through processes ofrehearsal, organisation, and elaboration.6 Strategies forretrieval of information from memory developgradually. Reading depends on perception and memoryand, at an early stage, awareness of speech sounds,which could be distorted by ambient noise.7
Environmental stressors can have a great effect on thedegree to which information is processed, retained,and recalled.8
We set up the RANCH project (road traffic andaircraft noise exposure and children’s cognition andhealth: exposure-effect relationships and combinedeffects) to investigate the relation between exposure toaircraft and road traffic noise and cognitive and healthoutcomes. We postulated that exposure to these typesof noise would be associated with impaired cognitivefunction and health, including annoyance in children.
Methods ParticipantsBetween April and October, 2002, we enrolled childrenaged 9–10 years from primary schools near Schiphol,Barajas, and Heathrow—airports in the Netherlands,Spain, and the UK—to a cross-sectional study. Weselected schools on the basis of increasing levels ofexposure to aircraft and road traffic noise with the samesystematic method in every country so as to examineexposure-effect relations. We classified schools in afour-by-four grid of noise exposure in every country. Werandomly selected two schools within every cell so as to
Lancet 2005; 365: 1942–49
See Comment page 1908
*Study team listed at end of article
Barts and the London, QueenMary’s School of Medicine and
Dentistry, University ofLondon, London E1 4NS, UK
(Prof S A Stansfeld PhD,C Clark PhD, M M Haines PhD,
J Head MSc); KarolinskaInstitute, Stockholm, Sweden(Prof B Berglund PhD); Consejo
Superior De InvestigacionesCientíficas (CSIC), Madrid,Spain (I Lopez-Barrio PhD);
National Institute for PublicHealth and Environment
(RIVM), Bilthoven, Netherlands(P Fischer MSc, I van Kamp PhD);
Göteborg University, Göteborg,Sweden (Prof E Öhrström PhD);
University of Gavle, Gavle,Sweden (Prof S Hygge PhD); and
Berry Environmental, London,UK (B F Berry MSc)
Correspondence to:Prof Stephen Stansfeld
Aircraft and road traffic noise and children’s cognition andhealth: a cross-national studyS A Stansfeld, B Berglund, C Clark, I Lopez-Barrio, P Fischer, E Öhrström, M M Haines, J Head, S Hygge, I van Kamp, B F Berry,on behalf of theRANCH study team*
SummaryBackground Exposure to environmental stressors can impair children’s health and their cognitive development.The effects of air pollution, lead, and chemicals have been studied, but there has been less emphasis on the effectsof noise. Our aim, therefore, was to assess the effect of exposure to aircraft and road traffic noise on cognitiveperformance and health in children.
Methods We did a cross-national, cross-sectional study in which we assessed 2844 of 3207 children aged9–10 years who were attending 89 schools of 77 approached in the Netherlands, 27 in Spain, and 30 in the UKlocated in local authority areas around three major airports. We selected children by extent of exposure to externalaircraft and road traffic noise at school as predicted from noise contour maps, modelling, and on-sitemeasurements, and matched schools within countries for socioeconomic status. We measured cognitive andhealth outcomes with standardised tests and questionnaires administered in the classroom. We also used aquestionnaire to obtain information from parents about socioeconomic status, their education, and ethnic origin.
Findings We identified linear exposure-effect associations between exposure to chronic aircraft noise andimpairment of reading comprehension (p=0·0097) and recognition memory (p=0·0141), and a non-linearassociation with annoyance (p!0·0001) maintained after adjustment for mother’s education, socioeconomicstatus, longstanding illness, and extent of classroom insulation against noise. Exposure to road traffic noise waslinearly associated with increases in episodic memory (conceptual recall: p=0·0066; information recall:p=0·0489), but also with annoyance (p=0·0047). Neither aircraft noise nor traffic noise affected sustainedattention, self-reported health, or overall mental health.
Interpretation Our findings indicate that a chronic environmental stressor—aircraft noise—could impair cognitivedevelopment in children, specifically reading comprehension. Schools exposed to high levels of aircraft noise arenot healthy educational environments.
Noise
Articles
www.thelancet.com Vol 365 June 4, 2005 1943
examine the effects of increasing aircraft noise withinlow road traffic noise, increasing road traffic noisewithin low aircraft noise, and the effects ofcombinations of aircraft noise and road traffic noise. Wematched chosen schools by the socioeconomic status ofthe pupils, which we measured by eligibility for freeschool meals, and by main language spoken at home.We selected those schools exposed to the highestamounts of aircraft noise first. In the Netherlands, weused a neighbourhood-level indicator of property valueand the proportion of non-Europeans living in the areaand attending the school to match schools.
We excluded from our study non-state schools in theUK and Spain, but included them in the Netherlandswhere degrees of achievement do not differ appreciablybetween school type. We also excluded schools at whichnoise surveys indicated either the presence of adominant noise other than aircraft or road traffic noise,or at which insulation against noise was above a certainthreshold (double or triple-glazed classroom windows)as identified with a predefined protocol with categoriesof likely internal-to-external noise level differences forevery classroom, although some highly insulatedschools were included in the Netherlands. In everynoise exposure cell, in every country, we selected twoschools according to a protocol. In the UK and Spain,we selected two classes of children of mixed sex fromeach school, and in the Netherlands one class (mostDutch schools only had one class in this age group). Ifthere were more than two classes in the year, then werandomly selected two or one, dependent on thecountry. We did not exclude any children from theselected classes.
We obtained written consent from the children andtheir parents. In the UK, ethical approval for the studywas provided by the East London and the City LocalResearch Ethics Committee, East Berkshire LocalResearch Ethics Committee, Hillingdon Local ResearchEthics Committee, and Hounslow District ResearchEthics Committee. In the Netherlands, ethical approvalwas given by the Medical Ethics Committee of TheNetherlands Organisation for Applied ScientificResearch, Leiden. In Spain, ethical approval was givenby the Consejo Superior De Investigaciones Cientificas(CSIC) Bioethical Commission, Madrid.
ProceduresTo assess exposure to noise, we used external noisemeasurements (dB[A]) as the independent variable(dB[A] is the unit of A-weighted sound pressure level,where A-weighted means that the sound pressure levelsin various frequency bands across the audible rangehave been weighted in accordance with differences inhearing sensitivity at different frequencies). In the UK,we based aircraft noise assessments external to theschools on the 16-h outdoor LAeq contours provided bythe Civil Aviation Authority. These contours give the
average continuous equivalent sound level of aircraftnoise within an area from 0700 h to 2300 h within aspecified period. We initially defined road traffic noiseby use of a simplified form of the UK standardcalculation of road traffic noise (CRTN) predictionmethod, using a combination of information includingproximity to motorways, major roads, minor roads, andtraffic flow data.9 We confirmed external traffic noiselevels by visits and noise measurements. In theNetherlands, noise assessments were provided bymodelled data on road and aircraft noise exposurelinked to school locations with geographicalinformation systems. In Spain, we visited all 96preselected schools and made direct externalmeasurements of road traffic noise. Aircraft noiseassessment in Spain was based on predicted contours.In all three countries, we also took acute measurementsof noise exposure in the classroom and outdoors at thetime of testing of cognitive function, to identify anyunexpected sources of noise apart from aircraft or roadtraffic noise that might interfere in the test situationand to assess exposure to acute aircraft and road trafficnoise. The measures of acute noise exposure, usingmicrophones, provided level differences. For aircraftnoise events this measurement could be taken, in someschools, using the highest intensity points in the noiseevents, where interior aircraft noise levels weredetectable against ambient interior noise levels.
With respect to cognitive outcomes, we measuredreading comprehension with nationally standardisedand normed tests—Suffolk reading scale,10 CITO(Centraal Instituute Toets Ontwikkeling) readabilityindex for elementary and special education,11 and theECL-2 (Evaluación de la Compresión Lectora, nivel 2).12
We assessed episodic memory (recognition and recall)by a task adapted from the child memory scale.13 Thistask assessed time delayed cued recall and delayedrecognition of two stories presented on compact disc.Sustained attention was measured by adapting theToulouse Pieron test for classroom use.14 We used amodified version of the search and memory task15,16 tomeasure working memory, and assessed prospectivememory by asking children to write their initials in themargin when they reached two predefined points in twoof the tests.
To assess health outcomes, we gave children aquestionnaire that included questions on perceivedhealth, and perceptions of noise and annoyance basedon standard adult questions.17 We also sent aquestionnaire home for the parents to complete, whichincluded questions on the perceived health of theirchild, and which we used to ascertain their children’smental health as measured by the parental version ofthe strengths and difficulties questionnaire18—a wellvalidated measure of child psychological distress,sociodemographic context variables, environmentalattitudes, and noise annoyance.
Noise
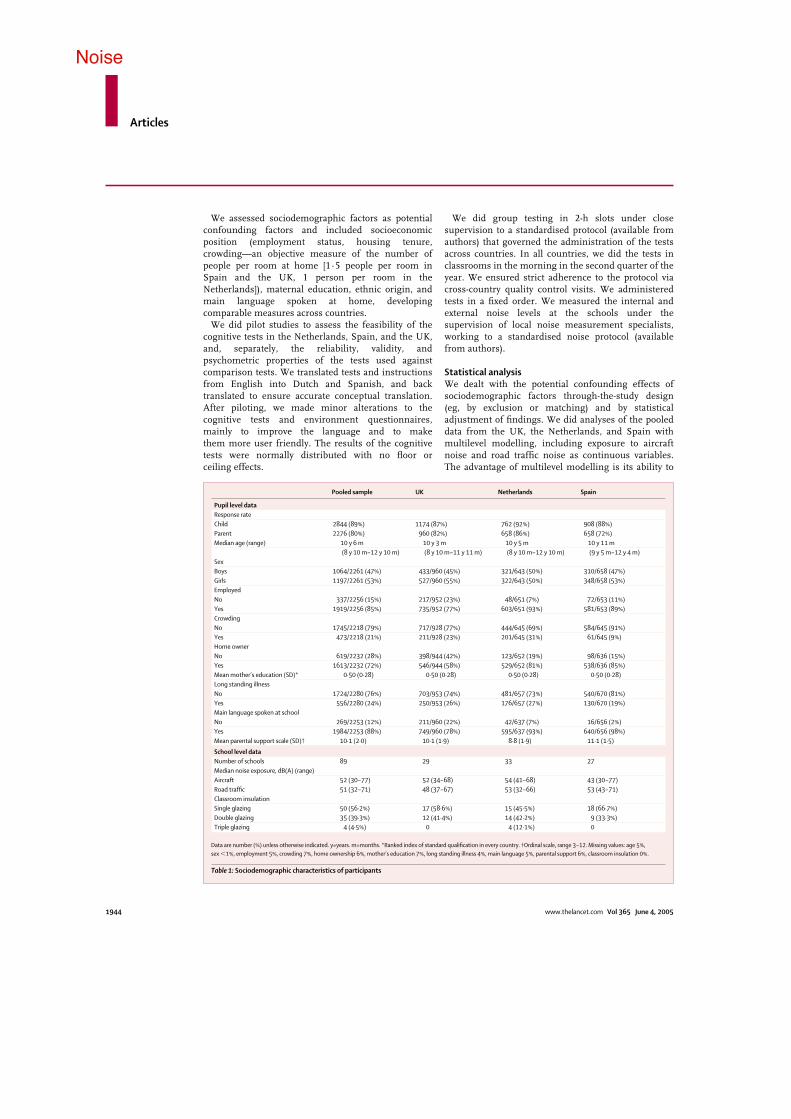
Articles
1944 www.thelancet.com Vol 365 June 4, 2005
We assessed sociodemographic factors as potentialconfounding factors and included socioeconomicposition (employment status, housing tenure,crowding—an objective measure of the number ofpeople per room at home [1·5 people per room inSpain and the UK, 1 person per room in theNetherlands]), maternal education, ethnic origin, andmain language spoken at home, developingcomparable measures across countries.
We did pilot studies to assess the feasibility of thecognitive tests in the Netherlands, Spain, and the UK,and, separately, the reliability, validity, andpsychometric properties of the tests used againstcomparison tests. We translated tests and instructionsfrom English into Dutch and Spanish, and backtranslated to ensure accurate conceptual translation.After piloting, we made minor alterations to thecognitive tests and environment questionnaires,mainly to improve the language and to make them more user friendly. The results of the cognitivetests were normally distributed with no floor or ceiling effects.
We did group testing in 2-h slots under closesupervision to a standardised protocol (available fromauthors) that governed the administration of the testsacross countries. In all countries, we did the tests inclassrooms in the morning in the second quarter of theyear. We ensured strict adherence to the protocol viacross-country quality control visits. We administeredtests in a fixed order. We measured the internal andexternal noise levels at the schools under thesupervision of local noise measurement specialists,working to a standardised noise protocol (availablefrom authors).
Statistical analysisWe dealt with the potential confounding effects ofsociodemographic factors through-the-study design(eg, by exclusion or matching) and by statisticaladjustment of findings. We did analyses of the pooleddata from the UK, the Netherlands, and Spain withmultilevel modelling, including exposure to aircraftnoise and road traffic noise as continuous variables.The advantage of multilevel modelling is its ability to
Pooled sample UK Netherlands Spain
Pupil level dataResponse rate Child 2844 (89%) 1174 (87%) 762 (92%) 908 (88%)Parent 2276 (80%) 960 (82%) 658 (86%) 658 (72%)Median age (range) 10 y 6 m 10 y 3 m 10 y 5 m 10 y 11 m
(8 y 10 m–12 y 10 m) (8 y 10 m–11 y 11 m) (8 y 10 m–12 y 10 m) (9 y 5 m–12 y 4 m)Sex Boys 1064/2261 (47%) 433/960 (45%) 321/643 (50%) 310/658 (47%) Girls 1197/2261 (53%) 527/960 (55%) 322/643 (50%) 348/658 (53%) EmployedNo 337/2256 (15%) 217/952 (23%) 48/651 (7%) 72/653 (11%)Yes 1919/2256 (85%) 735/952 (77%) 603/651 (93%) 581/653 (89%)Crowding No 1745/2218 (79%) 717/928 (77%) 444/645 (69%) 584/645 (91%)Yes 473/2218 (21%) 211/928 (23%) 201/645 (31%) 61/645 (9%)Home owner No 619/2232 (28%) 398/944 (42%) 123/652 (19%) 98/636 (15%)Yes 1613/2232 (72%) 546/944 (58%) 529/652 (81%) 538/636 (85%)Mean mother’s education (SD)* 0·50 (0·28) 0·50 (0·28) 0·50 (0·28) 0·50 (0·28)Long standing illness No 1724/2280 (76%) 703/953 (74%) 481/657 (73%) 540/670 (81%)Yes 556/2280 (24%) 250/953 (26%) 176/657 (27%) 130/670 (19%)Main language spoken at schoolNo 269/2253 (12%) 211/960 (22%) 42/637 (7%) 16/656 (2%)Yes 1984/2253 (88%) 749/960 (78%) 595/637 (93%) 640/656 (98%)Mean parental support scale (SD)† 10·1 (2·0) 10·1 (1·9) 8·8 (1·9) 11·1 (1·5)
School level dataNumber of schools 89 29 33 27Median noise exposure, dB(A) (range)Aircraft 52 (30–77) 52 (34–68) 54 (41–68) 43 (30–77)Road traffic 51 (32–71) 48 (37–67) 53 (32–66) 53 (43–71)Classroom insulationSingle glazing 50 (56·2%) 17 (58·6%) 15 (45·5%) 18 (66·7%)Double glazing 35 (39·3%) 12 (41·4%) 14 (42·2%) 9 (33·3%)Triple glazing 4 (4·5%) 0 4 (12·1%) 0
Data are number (%) unless otherwise indicated. y=years. m=months. *Ranked index of standard qualification in every country. †Ordinal scale, range 3–12. Missing values: age 5%, sex !1%, employment 5%, crowding 7%, home ownership 6%, mother’s education 7%, long standing illness 4%, main language 5%, parental support 6%, classroom insulation 0%.
Table 1: Sociodemographic characteristics of participants
Noise
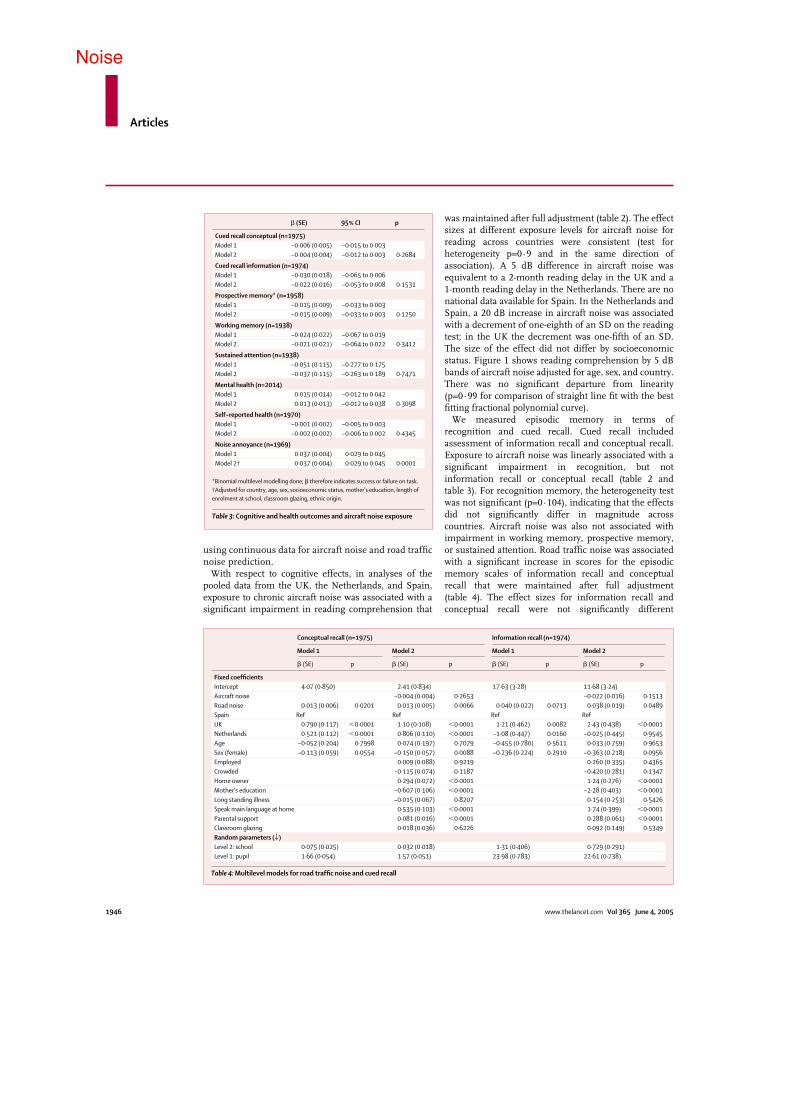
Articles
1946 www.thelancet.com Vol 365 June 4, 2005
using continuous data for aircraft noise and road trafficnoise prediction.
With respect to cognitive effects, in analyses of thepooled data from the UK, the Netherlands, and Spain,exposure to chronic aircraft noise was associated with asignificant impairment in reading comprehension that
was maintained after full adjustment (table 2). The effectsizes at different exposure levels for aircraft noise forreading across countries were consistent (test forheterogeneity p=0·9 and in the same direction ofassociation). A 5 dB difference in aircraft noise wasequivalent to a 2-month reading delay in the UK and a1-month reading delay in the Netherlands. There are nonational data available for Spain. In the Netherlands andSpain, a 20 dB increase in aircraft noise was associatedwith a decrement of one-eighth of an SD on the readingtest; in the UK the decrement was one-fifth of an SD.The size of the effect did not differ by socioeconomicstatus. Figure 1 shows reading comprehension by 5 dBbands of aircraft noise adjusted for age, sex, and country.There was no significant departure from linearity(p=0·99 for comparison of straight line fit with the bestfitting fractional polynomial curve).
We measured episodic memory in terms ofrecognition and cued recall. Cued recall includedassessment of information recall and conceptual recall.Exposure to aircraft noise was linearly associated with asignificant impairment in recognition, but notinformation recall or conceptual recall (table 2 andtable 3). For recognition memory, the heterogeneity testwas not significant (p=0·104), indicating that the effectsdid not significantly differ in magnitude acrosscountries. Aircraft noise was also not associated withimpairment in working memory, prospective memory,or sustained attention. Road traffic noise was associatedwith a significant increase in scores for the episodicmemory scales of information recall and conceptualrecall that were maintained after full adjustment(table 4). The effect sizes for information recall andconceptual recall were not significantly different
Conceptual recall (n=1975) Information recall (n=1974)
Model 1 Model 2 Model 1 Model 2
! (SE) p ! (SE) p ! (SE) p ! (SE) p
Fixed coefficientsIntercept 4·07 (0·850) 2·41 (0·834) 17·63 (3·28) 11·68 (3·24)Aircraft noise –0·004 (0·004) 0·2653 –0·022 (0·016) 0·1513Road noise 0·013 (0·006) 0·0201 0·013 (0·005) 0·0066 0·040 (0·022) 0·0713 0·038 (0·019) 0·0489Spain Ref Ref Ref RefUK 0·790 (0·117) "0·0001 1·10 (0·108) "0·0001 1·21 (0·462) 0·0082 2·43 (0·438) "0·0001Netherlands 0·521 (0·112) "0·0001 0·806 (0·110) "0·0001 –1·08 (0·447) 0·0160 –0·025 (0·445) 0·9545Age –0·052 (0·204) 0·7998 0·074 (0·197) 0·7079 –0·455 (0·780) 0·5611 0·033 (0·759) 0·9653Sex (female) –0·113 (0·059) 0·0554 –0·150 (0·057) 0·0088 –0·236 (0·224) 0·2910 –0·363 (0·218) 0·0956Employed 0·009 (0·088) 0·9219 0·260 (0·335) 0·4365Crowded –0·115 (0·074) 0·1187 –0·420 (0·281) 0·1347Home owner 0·294 (0·072) "0·0001 1·24 (0·276) "0·0001Mother’s education –0·607 (0·106) "0·0001 –2·28 (0·403) "0·0001Long standing illness –0·015 (0·067) 0·8207 0·154 (0·253) 0·5426Speak main language at home 0·535 (0·103) "0·0001 1·74 (0·399) "0·0001Parental support 0·081 (0·016) "0·0001 0·288 (0·061) "0·0001Classroom glazing 0·018 (0·036) 0·6226 0·092 (0·149) 0·5349Random parameters (!)Level 2: school 0·075 (0·025) 0·032 (0·018) 1·31 (0·406) 0·729 (0·291)Level 1: pupil 1·66 (0·054) 1·57 (0·051) 23·98 (0·783) 22·61 (0·738)
Table 4: Multilevel models for road traffic noise and cued recall
! (SE) 95% CI p
Cued recall conceptual (n=1975)Model 1 –0·006 (0·005) –0·015 to 0·003Model 2 –0·004 (0·004) –0·012 to 0·003 0·2684
Cued recall information (n=1974)Model 1 –0·030 (0·018) –0·065 to 0·006Model 2 –0·022 (0·016) –0·053 to 0·008 0·1531
Prospective memory* (n=1958)Model 1 –0·015 (0·009) –0·033 to 0·003Model 2 –0·015 (0·009) –0·033 to 0·003 0·1250
Working memory (n=1938)Model 1 –0·024 (0·022) –0·067 to 0·019Model 2 –0·021 (0·021) –0·064 to 0·022 0·3412
Sustained attention (n=1938)Model 1 –0·051 (0·115) –0·277 to 0·175Model 2 –0·037 (0·115) –0·263 to 0·189 0·7471
Mental health (n=2014)Model 1 0·015 (0·014) –0·012 to 0·042Model 2 0·013 (0·013) –0·012 to 0·038 0·3098
Self–reported health (n=1970)Model 1 –0·001 (0·002) –0·005 to 0·003Model 2 –0·002 (0·002) –0·006 to 0·002 0·4345
Noise annoyance (n=1969)Model 1 0·037 (0·004) 0·029 to 0·045Model 2† 0·037 (0·004) 0·029 to 0·045 0·0001
*Binomial multilevel modelling done; ! therefore indicates success or failure on task.†Adjusted for country, age, sex, socioeconomic status, mother’s education, length ofenrolment at school, classroom glazing, ethnic origin.
Table 3: Cognitive and health outcomes and aircraft noise exposure
Noise

Articles
www.thelancet.com Vol 365 June 4, 2005 1947
between countries (p=0·9 for information recall, p=0·7for conceptual recall) and were consistent in thedirection of the association with exposure to road trafficnoise. There was no significant departure from linearityfor information recall or conceptual recall (p=0·67 andp=0·99 for comparison of straight line fit with the bestfitting fractional polynomial curve, respectively). Theseeffects were stronger for children from crowded homesthan for those whose homes were not crowded(interaction p=0·01 for both information and conceptualrecall). We noted no effects of road traffic noise onreading comprehension, recognition, working memory,prospective memory, and sustained attention (table 5).
With respect to health effects, increasing exposure toboth aircraft noise and road traffic noise was associatedwith increasing annoyance responses in children. Thisfinding was maintained after full adjustment (table 2and table 5). Figure 2 shows annoyance from aircraftnoise by 5 dB bands adjusted for age, sex, and country.The best fitting fractional polynomial curve was non-linear and showed a steeper dose-response gradient athigher levels of aircraft noise (p=0·018, test fordeparture from straight line fit).
There was a linear association between road trafficnoise and annoyance adjusted for age, sex, and country(p=0·11 for comparison of straight line fit with bestfitting fractional polynomial curve). We noted noeffects of either aircraft noise or road traffic noise onself-reported health or mental health.
DiscussionOur findings indicate a linear exposure-effect associationbetween exposure to aircraft noise and impaired readingcomprehension and recognition memory in children, andbetween exposure to road traffic noise and increasedfunctioning of episodic memory, in terms of informationand conceptual recall. Our results also show non-linearand linear exposure-response associations betweenaircraft and road traffic noise, respectively, and annoyance.Neither aircraft noise nor road traffic noise affectedsustained attention, self-reported health, or mental health.
By comparison with previous studies,20–23 our results arerobust because we used data from three countries withdifferent sociodemographic profiles, our questionnaireresponse rates were high, we made careful and detailednoise assessments and measured the effect ofconfounding factors, we adjusted for acute noiseexposure, and we used standardised outcome measures.Results for aircraft noise and reading comprehensionacross the three countries were largely similar—ie, wenoted cross-cultural replication of findings. The advantageof multilevel modelling is that it can also adjust forvariance in cognitive function between schools andbetween countries. The limitations of our study are: that itwas cross-sectional rather than longitudinal; we studied asmall age range; we focused largely on exposure to noisein schools, though noise at home might also affect healthoutcomes; and we used different noise assessmenttechniques in the three countries. However, using thepooled sample, we were able to combine exposure siteswith different associations between noise exposure and
Airc
raft
noi
se—
1–5
ordi
nal s
cale
of a
nnoy
ance
3·5
3·0
2·0
1·5
2·5
30 35 4540 5550Aircraft noise dB(A)
60 7065
1·0
0·5
0
Figure 2: Adjusted mean annoyance (95% CI) for 5 dB bands of aircraft noise(adjusted for age, sex, and country) and fitted curve**Fractional polynomial curve fitted to continuous aircraft noise of form–0·188!2+0·107!2*log(x) (where x=aircraft noise/10).
" (SE) 95% CI p
Reading comprehension (n=2010)Model 1 0·003 (0·004) –0·005 to 0·012Model 2 0·002 (0·004) –0·005 to 0·009 0·5417Recognition (n=1998)Model 1 0·006 (0·010) –0·014 to 0·026Model 2 0·005 (0·009) –0·013 to 0·023 0·6240Prospective memory* (n=1958)Model 1 0·007 (0·012) –0·017 to 0·031Model 2 0·007 (0·012) –0·017 to 0·031 0·1360Working memory (n=1938)Model 1 0·033 (0·027) –0·020 to 0·087Model 2 0·030 (0·027) –0·023 to 0·083 0·2742Sustained attention (n=1938)Model 1 –0·020 (0·143) –0·300 to 0·261Model 2 –0·046 (0·144) –0·328 to 0·237 0·7499Mental health (n=2014)Model 1 –0·012 (0·017) –0·045 to 0·021Model 2 –0·018 (0·016) –0·049 to 0·013 0·2747Self–reported health (n=1970)Model 1 0·005 (0·003) –0·001 to 0·011Model 2 0·005 (0·003) –0·0004 to 0·010 0·0725Noise annoyance (n=1969)Model 1 0·017 (0·004) 0·009 to 0·025Model 2† 0·016 (0·004) 0·008 to 0·024 0·0047
*Binomial multilevel modelling done; " therefore indicates success or failure on task.†Adjusted for country, age, sex, socioeconomic status, mother’s education, length ofenrolment at school, classroom glazing, ethnic origin.
Table 5: Cognitive and health outcomes and exposure to road trafficnoise
Noise

Articles
1948 www.thelancet.com Vol 365 June 4, 2005
socioeconomic position and thus adjust, to some extent,and more so than in previous studies,20,22,23 forsocioeconomic status as a potential confounding factor.Contrary to previous work done in the UK,20
socioeconomic status did not explain the associationbetween noise and cognitive function in children.
An effect of aircraft noise on reading is consistent withprevious findings.21–25 Exposure to aircraft noise has beenrelated to impairments of children’s cognition in terms ofreading comprehension, long-term memory, andmotivation.21–26 Tasks that involve central processing andlanguage comprehension, such as reading, attention,problem solving, and memory seem most affected byexposure to noise. With a few exceptions,20,27 most studieshave compared groups exposed to high levels and lowlevels of noise, and have not examined exposure-effectrelations. Moreover, most studies in children havefocused on aircraft noise rather than road traffic noise.These exposure-effect associations, in combination withresults from earlier studies,21–25 suggest a causal effect ofexposure to aircraft noise on children’s readingcomprehension. This effect is significant though small inmagnitude, but does show a linear exposure-effectrelation. In practical terms, aircraft noise might have onlya small effect on the development of reading, but theeffect of long-term exposure remains unknown.
Aircraft noise, because of its intensity, the location ofthe source, and its variability and unpredictability, is likelyto have a greater effect on children’s reading than roadtraffic noise, which might be of a more constantintensity.28,29 In adults, sound that shows appreciablevariation over time (changing state) impairs cognitivefunction whereas sound that does not vary (steady state)has little effect.29,30 The noise of aircraft flyovers has anunpredictable rise time that might attract attention anddistract children from learning tasks.
This notion does not explain why exposure to road trafficnoise was related to improved episodic memory scores.Road traffic noise is unlikely to increase arousalsufficiently to improve performance on the memory taskswe used, which are difficult and might be impaired byincreased arousal. Another explanation is confounding,but the only significant interaction between road trafficnoise, sociodemographic status, and episodic memorywas for crowding, in which the effects were stronger forthose from crowded households. This unexplainedfinding needs further study. The absence of an associationbetween road traffic noise and reading is inconsistent withprevious studies, but the highest noise levels we recordedwere 71 dB LAeq, which is lower than in previous work.31
Noise exposure is associated with annoyance andimpairment of quality of life in children. This associationis stronger for aircraft than for road traffic noise, as inadults. We noted no association between aircraft or roadtraffic noise and self-reported health or mental health,though other studies have shown effects of aircraft noiseon blood pressure.26,32
Further research is needed to understand thepsychological mechanisms of these cognitive effects.Children might adapt to noise interference during activitiesby filtering out the unwanted noise stimuli. This tuning outstrategy might overgeneralise to situations where noise isnot present, such that children tune out stimuliindiscriminately.21,33 This tuning out response is supportedby the findings that children exposed to noise have deficitsin attention, auditory discrimination,33 and speechperception.25 However, our findings indicate that sustainedattention is not impaired by aircraft noise, and others15,24
have shown that noise impairs both attention and recall15,24
without attention mediating the effect on cued recall.Teacher frustration and interruptions in communicationbetween teachers and children could also be a mechanismfor cognitive effects.33 Similarly, learned helplessness hasbeen proposed as a mechanism to account for deficits inmotivation in children exposed to noise.34
The effects of exposure to noise at home, as well as atschool, the interaction with classroom acoustics, thepotential protective effect of classroom insulation againstnoise, and what children and teachers can do to overcomethese effects deserve further inquiry. Our results arerelevant to the design and placement of schools in relationto airports, to the formulation of policy on noise and childhealth, and to a wider consideration of the effect ofenvironmental stressors on children’s cognitivedevelopment. Greater specification of exposure-effectrelations is an important step in confirming a causal rolefor exposure to environmental noise in impairments ofchildren’s cognition. Contributors S A Stansfeld, M M Haines, J Head, and B Berglund formulated the studydesign and interpreted the results. S A Stansfeld wrote the original draft ofthe manuscript. C Clark did the analyses, interpreted the results, andcommented on the manuscript. J Head advised on analyses. B F Berrydesigned the noise measurements and interpreted noise effects. S Hyggehelped on the choice of instruments and interpretation of the cognitiveeffects. I Lopez-Barrio, P Fischer, and I van Kamp led on data collection inSpain and the Netherlands, and commented on drafts and interpretedresults. E Öhrström commented on the instruments, on drafts, andinterpreted results.
RANCH study teamEldar Aarsten, Tamuno Alfred, Rebecca Asker, Östen Axelsson,Sarah Brentnall, Rachel Cameron, Hugh Davies,Anita Gidlöf Gunnarsson, Emina Hadzibajramovic, Maria Holmes,Rocio Martin, Mark Matheson, Mats E Nilsson, Britth Sandin,Rebecca Stellato, Helena Svensson, and Elise van Kempen.
Conflict of interest statementWe declare that we have no conflict of interest.
AcknowledgmentsWe thank all of the pupils, parents, and teachers who participated.
The RANCH study was funded by the European Community (QLRT-2000–00197) in the Vth framework programme under Key Action1999: /C 361/06 Quality of life and management of living resources. Inthe UK, cofunding was provided by the Department of Environment,Food and Rural Affairs. In the Netherlands, cofunding was provided bythe Dutch Ministry of Public Health, Welfare and Sports, Dutch Ministryof Spatial Planning, Housing and Environment, and the Dutch Ministryof Transport, Public Works and Water Management. In Sweden,cofunding was provided by the Swedish Foundation for InternationalCooperation in Research and Higher Education.
Noise
Articles
www.thelancet.com Vol 365 June 4, 2005 1949
References1 The Lancet. Europe’s legacy to its children: a healthier
environment? Lancet 2004; 363: 1409.2 Schwartz J. Air pollution and children’s health. Pediatrics 2004;
113 (suppl): 1037–43.3 Bellinger DC. Lead. Pediatrics 2004; 113 (suppl): 1016–22.4 Kryter K. The effects of noise on man (2nd edn). New York:
Academic Press, 1985.5 Ben-Shlomo Y, Kuh D. A life course approach to chronic disease
epidemiology: conceptual models, empirical challenges, andinterdisciplinary perspectives. Int J Epidemiol 2002; 3: 285–93.
6 Smith PK, Cowie H, Blades M. Understanding children’sdevelopment (4th edn). Oxford: Blackwell, 2003.
7 Bryant P, Bradley L. Children’s reading problems. Oxford:Blackwell, 1985.
8 Cohen S, Evans GW, Stokols D, Krantz DS. Behavior, health, andenvironmental stress. New York: Plenum Press, 1986.
9 Calculation of road traffic noise (CRTN). London: HMSO, 1998.10 Hagley F. The Suffolk reading scale 2. Windsor: NFER-NELSON,
2002.11 Staphorsius G. Leesbaarheid en leesvaardigheid: de ontwikkeling
van een domeingericht meetinstrument [dissertation]. Arnhem:Cito, 1994.
12 De La Cruz V. ECL-2. Madrid: TEA Ediciones SA, 1999.13 Cohen MJ. Children’s memory scale manual. San Antonio: The
Psychological Corporation Harcourt Brace and Company, 1997.14 Toulouse E, Pieron H. Prueba perceptiva y de atencion. Madrid:
TEA Ediciones SA, 1986.15 Smith AP, Miles C. The combined effects of occupational health
hazards: an experimental investigation of the effects of noise,nightwork and meals. Int Arch Occup Environ Health 1987;59: 83–89.
16 Hygge S, Boman E, Enmarker I. The effects of road traffic noiseand meaningful irrelevant speech on different memory systems.Scand J Psychol. 2003; 44: 13–21.
17 Fields JM, de Jong RG, Brown AL, et al. Guidelines for reportingcore information from community noise reaction surveys.J Sound Vibration 1997; 206: 685–95.
18 Goodman RJ. The strengths and difficulties questionnaire:a research note. Child Psychol Psychiat 1997; 38: 581–86.
19 Royston P, Altman DG. Regression using fractional polynomials ofcontinuous covariates: parsimonious parametric modelling.Applied Statistics 1994; 43: 429–67.
20 Haines MM, Stansfeld SA, Head J, Job RFS. Multilevel modellingof aircraft noise on performance tests in schools around HeathrowAirport, London. JECH 2002; 56: 139–44.
21 Evans GW, Hygge S, Bullinger M. Chronic noise and psychologicalstress. Psychol Sci 1995; 6: 333–38.
22 Haines MM, Stansfeld SA, Job RFS, Berglund B, Head J.Chronic aircraft noise exposure stress responses, mental healthand cognitive performance in school children. Psychol Med 2001;31: 265–77.
23 Haines MM, Stansfeld SA, Brentnall S, et al. The West LondonSchools Study: the effects of chronic aircraft noise exposure onchild health. Psychol Med 2001; 31: 1385–96.
24 Hygge S, Evans GW, Bullinger M. A prospective study of someeffects of aircraft noise on cognitive performance inschoolchildren. Psychol Sci 2002; 13: 469–74.
25 Evans GW, Maxwell L. Chronic noise exposure and readingdeficits: the mediating effects of language acquisition.Environ Behav 1997; 29: 638–56.
26 Cohen S, Evans GW, Krantz DS, Stokols S. Physiological,motivational and cognitive effects of aircraft noise on children:moving from the laboratory to the field. Am Psychol 1980;35: 231–43.
27 Green KB, Pasternack BS, Shore RE. Effects of aircraft noise onreading ability of school-age children. Arch Environ Health 1982;37: 24–31.
28 Hygge S. Classroom experiments on the effects of different noisesources and sound levels on long-term recall and recognition inchildren. Applied Cog Psychol 2003; 17: 895–914.
29 Banbury SP, Macken WJ, Tremblay S, Jones DM. Auditorydistraction and short-term memory: phenomena and practicalimplications. Human Factors 2001; 43: 19–29.
30 Tremblay S, Jones DM. Change of intensity fails to produce anirrelevant sound effect: implications for the representation ofunattended sound. J Exp Psychol 1999; 25: 1005–15.
31 Cohen S, Glass DC, Singer JE. Apartment noise, auditorydiscrimination and reading ability in children. J Exp Soc Psychol1973; 9: 407–22.
32 Evans GW, Bullinger M, Hygge S. Chronic noise exposure andphysiological response: a prospective study of children living underenvironmental stress. Psych Science 1998; 9: 75–77.
33 Evans GW, Lepore SJ. Non-auditory effects of noise on children: acritical review. Child Environ 1993; 10: 31–51.
34 Evans GW, Stecker R. Motivational consequences of environmentalstress. J Environ Psychol 2004; 24: 143–65.
Noise

In accordance with London City Airport’s planning obligations, aircraft operating at LondonCity Airport are required to be categorised by their departure noise levels into one of five noise categories. This aircraft categorisation process is set out in detail in Condition 7 of the planning permission dated 9th July 2009. (07/01510/VAR)
Noise CategoriesCondition 7(2) to the planning permission of 9th July 2009 states that:“Aircraft types using the airport shall be placed in categories and allocated noise factors as set out below:
Category Noise Reference Level (PNdB) Noise FactorA 91.6 – 94.5 1.26B 88.6 – 91.5 0.63C 85.6 – 88.5 0.31D 82.6 – 85.5 0.16E less than 82.6 0.08
Over 20% of all Mean annual noise departures since 2009 to the end of 2012 have breached the noise limits under S106. (60,510/282,151)
The RJ-100 should not be operating from London City Airport yet is continually allowed to do so without penalty or recourse. It has breached the 94.5 PNdB every year since 2009. All 43,262 RJ100 flights have all been above the Mean Annual Noise.Airport claims that the RJ 100 has successfully operated within Category A in the past remain unfounded.
Source - London City Airport performance reports.
Aircraft Noise Breaching 2009 Section 106 Agreement report
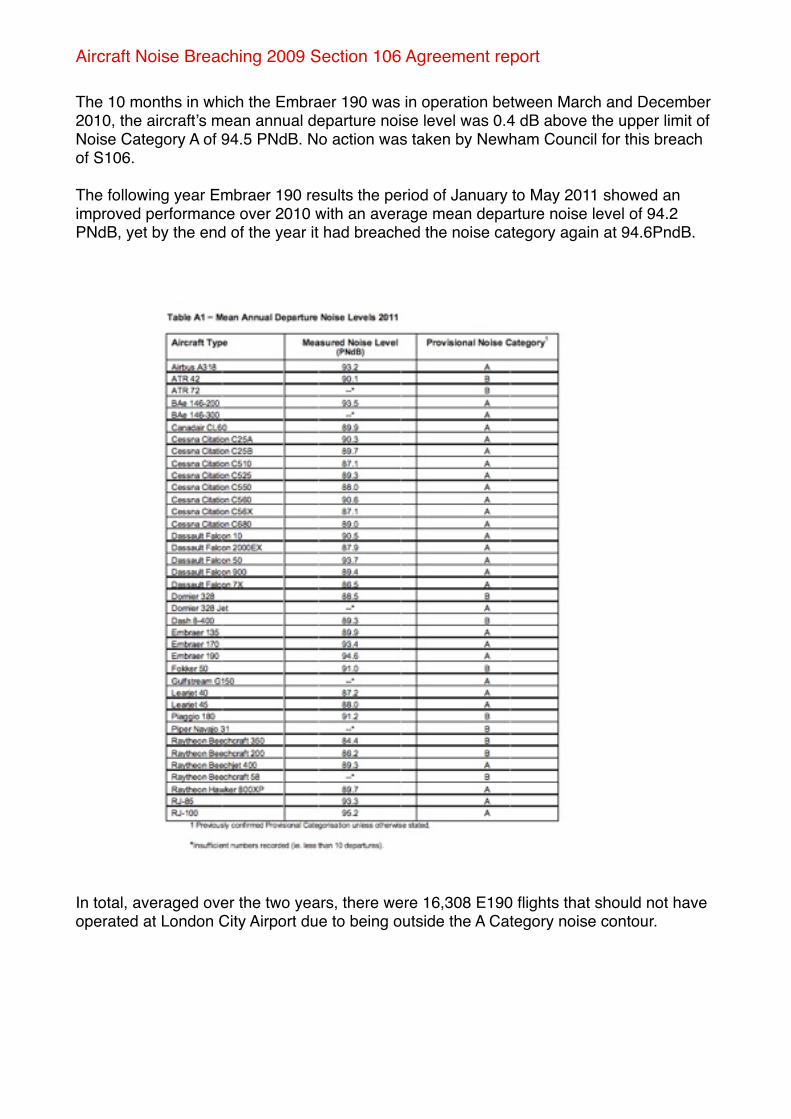
The 10 months in which the Embraer 190 was in operation between March and December 2010, the aircraft’s mean annual departure noise level was 0.4 dB above the upper limit of Noise Category A of 94.5 PNdB. No action was taken by Newham Council for this breach of S106.
The following year Embraer 190 results the period of January to May 2011 showed an improved performance over 2010 with an average mean departure noise level of 94.2 PNdB, yet by the end of the year it had breached the noise category again at 94.6PndB.
In total, averaged over the two years, there were 16,308 E190 flights that should not have operated at London City Airport due to being outside the A Category noise contour.
Aircraft Noise Breaching 2009 Section 106 Agreement report

Aircraft Noise Breaching 2009 Section 106 Agreement report

In 2012 the airport, after 20 years, decided to move two of the noise monitors NM1 and NM3 to “ensure more accurate noise readings due to development in the area” though there was no development recorded near either monitor.
This resulted in the E190 recording a lower noise reading, though modifications to the fleet are being claimed, resulting in a Category A lower reading.
It is inconceivable that the airport was allowed to continue operating the RJ100 and E190 aircraft after the 2009/2010 findings, yet they were not only allowed to do so, they were allowed to triple their use, without penalty, in clear breach of the S106 agreement. They were also given time to reduce and mitigate the E190 noise factor movements.
Aircraft Noise Breaching 2009 Section 106 Agreement report

As required under the terms of the current Section 106 Agreement, a review of the current noise categorisation system is currently being undertaken with LBN to reassess the methodology, categories, noise reference levels, noise factors and procedures for categorisation with the objective of providing further incentives for aircraft using the Airport to emit less noise.
Four years after the covenant this still has not been finalised. The Noise Monitoring and Mitigation Strategy (NOMMS) is still not operational. (07/01510/VAR)
The draft NOMMS was submitted to Newham on 8 October 2009 and a letter was subsequently received by the airport on 26 February 2010 confirming the draft NOMMS was acceptable. The NOMMS Implementation Guidelines were submitted to Newham on 6 July 2010 for approval. Discussions on the NOMMS Implementation Guidelines have continued with Newham and their consultants during 2012.
None of the aircraft in the current application have catorgisation noise references. It is completely indecipherable.
There is no breakdown of current categories in relation to aircraft even currently being used within the current expansion application.
Aircraft Noise Breaching 2009 Section 106 Agreement report

The new CS100 the airport wants to introduce, is claimed to be quieter but without proof or category.
The current expansion application uses the RJ100 to compare the new estimations for CS100 for noise certification.
Alan Haughton @stopcityairport 07909 907 395
Ends
Aircraft Noise Breaching 2009 Section 106 Agreement report

The current Section 106 agreement (07/01510/VAR) sets out a number of environmental control measures which are existing planning controls at the airport.
Since the 2009 approval London City Airport operated the E190 aircraft for two years, illegally, breaching the legally binding noise categorisations agreed with Newham Council without penalty.
This application should not be considered until we have one full year of baseline noise readings under the full Noise Monitoring and Mitigation Strategy (NOMMS) and Noise Catorgisation.
Aircraft operating at London City Airport are required to be categorised by their departure noise levels which should fall into one of five noise categories. Since the first year of operation with the extended runway (1992) when the aircraft were provisionally categorised on the basis of manufacturers’ data, categorisation has been made with respect to measured data from the Airport’s noise monitoring system.
As required under the terms of the current Section 106 Agreement, a review of the current noise categorisation system is currently being undertaken with LBN to reassess the methodology, categories, noise reference levels, noise factors and procedures for categorisation with the objective of providing further incentives for aircraft using the Airport to emit less noise.
Four years after the covenant this still has not been finalised. The Noise Monitoring and Mitigation Strategy (NOMMS) is still not operational.
The draft NOMMS was submitted to Newham on 8 October 2009 and a letter was subsequently received by the airport on 26 February 2010 confirming the draft NOMMS was acceptable. The NOMMS Implementation Guidelines were submitted to Newham on 6 July 2010 for approval. Discussions on the NOMMS Implementation Guidelines have continued with Newham and their consultants during 2012.
Noise Categorisation and NOMMS
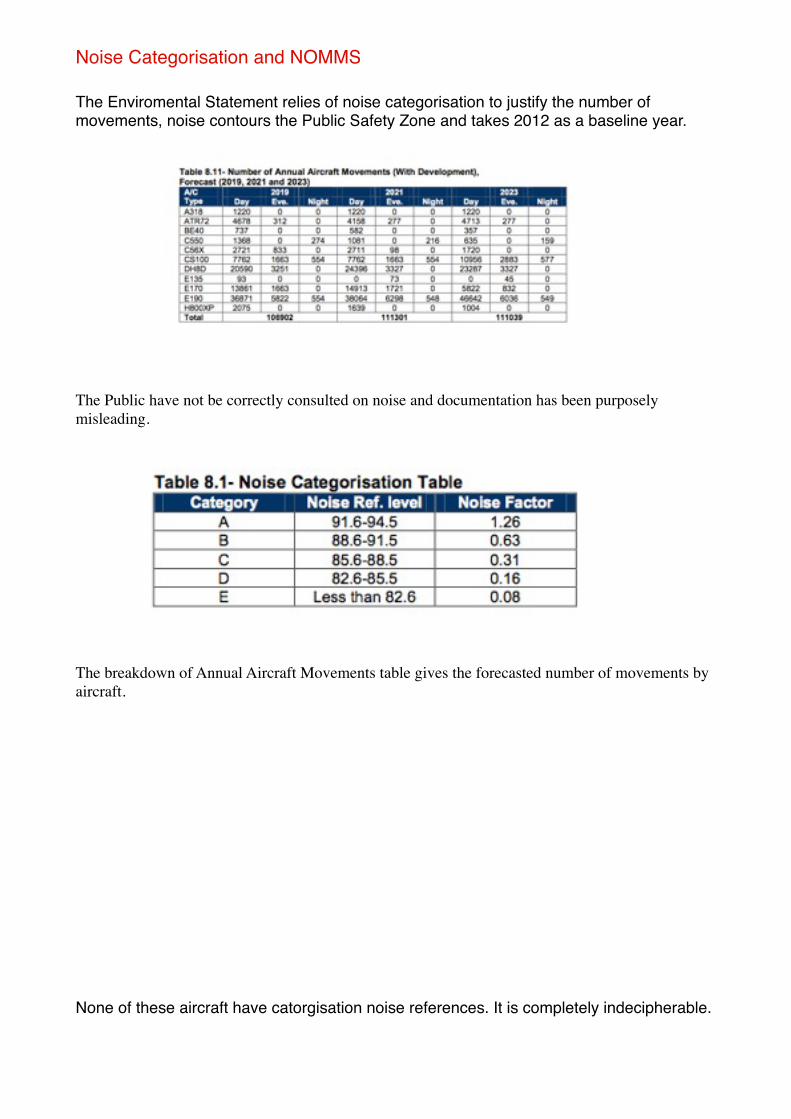
The Enviromental Statement relies of noise categorisation to justify the number of movements, noise contours the Public Safety Zone and takes 2012 as a baseline year.
The Public have not be correctly consulted on noise and documentation has been purposely misleading.
The breakdown of Annual Aircraft Movements table gives the forecasted number of movements by aircraft.
None of these aircraft have catorgisation noise references. It is completely indecipherable.
Noise Categorisation and NOMMS

There is no breakdown of current categories in relation to aircraft even currently being used. The new CS100 is claimed to be quieter but without proof or category. Technically if the CS100 was given a Cat B rating they could 190,476 total flights with just that aircraft. An extreme example, acceptable under 120,000 ATM’s but not acceptable under other enviromental categories.
The review of the current noise categorisation system being undertaken with Newham to reassess the methodology, categories, noise reference levels, noise factors and procedures for categorisation could see a massive change in flight mix and flight numbers though not ATM’s.
This application should not be considered until we have one full year of baseline noise readings under the full Noise Monitoring and Mitigation Strategy (NOMMS) and Noise Catorgisation.
Noise Categorisation and NOMMS

Noise Categorisation and NOMMS
Critically GIP Gatwick, the owners of London City Airport, have submitted strong evidence to the Davies Airports Commission suggesting that Heathrows use of the FAA INM model can produce a very different size and shape of noise contours from the CAA required model. London City Airport uses the Heathrow INM Model to assess noise.
London City Airport has not used the model required by the CAA if an airport is to make an airspace change in the UK and as is also required in the current DfT Air Navigation Guidance document, which is the ANCON 2.3 model.
The models can produce very different results on an absolute basis, and potentially on a relative basis as well. This is because, whilst they use the same base algorithm, the assumptions built into the CAA model are based on actual data of flight profiles and noise impacts for an airport, whilst the FAA use theoretical assumptions.
GIP Gatwick owners (who are also London City Airports owners) claims to have followed the usual CAA practice employing ANCON 2.3 whereas Heathrow used the American FAA INM model as does London city Airport. Gatwick notes that the American approach uses theoretical assumptions for flight profiles and noise impacts whereas the CAA model deals with actual flight and noise data.
If they are to demonstrate they are worthy of a Second Runway at Gatwick they must show honest, integrity and garner trust. They should remove this London City Airport application and measure the local impact of noise using the CAA model with actual flight and noise data. If not they should withdraw their submission to the Davies Commission as they have invalidated their own argument.
NATS have just launched the London Airspace Consultation, the outcome of which will determine the flight corridors over the South East of England and whether they are a variety of paths or single routes. Once again, the outcome of this should be awaited and looked at in conjunction with this application. It is likely that bigger jets will need variations on, or a larger turning circle on take-off, which would affect different and/or more people. No mention of changes inflight paths are mention nor are projected trajectory maps included for the bigger jets which may need a wider arc to turn. We can only know those new routes once the consultation has reported and decided.
The submission is below.
Noise Model - GIP
1
RESPONSE TO DISCUSSION PAPER 05 ON AVIATION NOISE
SUBMISSION BY GATWICK AIRPORT LTD REFERENCE: AIRPORTS COMMISSION: LONDON GATWICK 014 DATE: 6 SEPTEMBER 2013
Noise Model - GIP

2
1. Summary
x The impact of noise on local communities is an important and controversial issue for the Commission’s assessment of options for increasing airport capacity. It is important as noise can significantly affect the quality of life for communities living close to airports, and it will be a major factor in determining whether or not there is community and political support for particular airport developments. It is, and will remain, a controversial issue, because of the impact on communities and because, despite long debate, there is no firm consensus on how to approach issues around aircraft noise or even on how best to measure noise.
x The Commission's paper provides an extremely useful summary of the complexities of assessing noise impacts and we agree with the conclusion that no single noise metric can fully describe noise exposure at a given location. However, in Gatwick’s view, it is essential that the Commission’s noise assessment is made on absolute noise levels (rather than on changes relative to the existing environment), as this will provide answers which are much more meaningful in relation to Government policy guidelines, and will permit valid comparisons between different options.
x Significant progress has been made by the aviation industry, and by Gatwick, in reducing and mitigating noise, and this trend is expected to continue. However, we also recognise that people’s sensitivity to, and perception of, noise has increased.
x We believe that, as an industry, aviation can meet UK passenger demand towards 2050 whilst reducing noise impacts. However, we also believe that at Heathrow, where more people already live inside its noise footprint than the combined population of all the major EU hub airports put together1 (see figure 2), it will be difficult for the Commission to justify further expansion there. Given its position to the west of London, development at Heathrow will always impose disproportionately more noise nuisance on a much larger number of people than could ever be the case at Gatwick.
x Gatwick’s current noise footprint, in terms of the 57dBA Leq, is 30502 people. With an additional runway, this footprint could increase to 11,800. To put this in context, we are less than 2% of the noise footprint of Heathrow today, and would be less than 5% with an additional runway (at our widest option using mixed mode).
x We strive to act as good neighbours, and take the impact of noise on our local communities extremely seriously. Gatwick’s ‘Fly Quiet and Clean’ initiative, launched in 2012, looks to research and implement global best practice in the management and mitigation of noise, as well as in community engagement.
x Overall, we welcome the Commission's focus on noise as a central issue, we agree that noise should be a key consideration when assessing options for meeting the future aviation capacity needs of the UK, and we support the Commission's proposals for further study and research.
1 European Commission, CAA. Figures based on the populations affected by noise using the standard measure of 55 LDen 2006 figures 2 Department for Transport R&D Report 9903 ERCD report 1202 (actual modal split)
Noise Model - GIP

Noise Model - GIP
3
x However, we are also conscious that Phase 2 of the Commission's work will require substantially increased effort and expenditure from early next year by the promoters of the shortlisted schemes. In order to minimise the risk of nugatory work and expense, and the risk of promoters progressing options which the Commission later finds unsuitable on grounds of noise, we ask that the Commission provides clarity no later than their Phase 2 appraisal framework in December 2013 on a number of key issues: We need details of the noise assessment framework that the Commission
will use in its appraisal of options, especially the measures to be used. It is clearly essential that all proposals are presented on a uniform basis of measurement, as accurate comparisons will otherwise be impossible.
The Government’s policy principles on noise, as laid down in the recent Aviation Policy Framework (APF), are inevitably expressed in general terms, but they will need to be developed with much more precise definition if they are to be used transparently by the Commission in assessing the noise impacts of competing proposals. To guide promoters, it is important that the Commission outlines soon how it proposes to interpret Government policy in its appraisal of options, particularly as regards:
o Government’s primary objective to limit and where possible reduce the number of people significantly affected by aircraft noise.
o Government’s desire to strike a balance between the negative impacts of noise and the positive economic impacts of flights.
o Government’s intention that, as a general principle, any benefits from future improvements in aircraft noise performance should be shared between the aviation industry and local communities.
And we need clarity as to the Commission’s approach to:
o the weighting of the different appraisal criteria (e.g. the relative weightings as between traffic generated and noise impacts);
o the baseline on which noise assessment should be based; and o how to address the inter-dependency between noise and carbon
impact.
We also urge the Commission that, if it identifies a need to expand capacity in the longer term, it is explicit on how to make Government’s noise policies more precise and more operationally relevant for the purpose of the Commission’s work. We believe that doing so, with proper justifications, would greatly increase the likelihood of the Government accepting the Commission's overall recommendations.
2. Introduction 2.1 Discussion paper 05 emphasises, rightly, that noise will be a central issue for the Commission, and it is clear that the impact of noise on local communities will be an important and controversial issue for the assessment of options for increasing airport capacity. It is an important issue as noise can significantly affect the quality of life for communities living close to airports, and will inevitably be a major factor in determining whether or not there is community and political support for particular airport developments.
Noise Model - GIP

4
2.2 Noise is, and will remain, a controversial issue, because of the impact on communities and also because, despite long debate, there is no firm consensus on how to approach issues around aircraft noise or even on how to best measure noise. 2.3 The Commission’s discussion paper is an important and helpful contribution to the debate, particularly in:
x Accepting that assessment of noise impacts is inherently complex; x Providing clear explanations of measurement methods and of the pros and
cons of each method; x Accepting that no single indicator can fully describe noise exposure at a given
location; x Recognition of the progress made by the aviation industry in reducing aircraft
noise, and of ICAO’s Balanced Approach to Noise Management; x Bringing forward the important idea of measuring the noise efficiency of
airports. 2.4 Significant progress has been made by the aviation industry in reducing the impact of noise. The noise produced by current aircraft in the UK has reduced by 97% on departure and 94% on arrival compared with the first passenger jet aircraft. Putting this in context a 97% reduction in noise energy means that 33 modern jet aircraft departing simultaneously today would produce in aggregate the same level of noise as one jet aircraft of the same size departing in the 1960’s. 2.5 The Sustainable Aviation noise road map, published in 2012, projects that UK aviation will be able to accommodate significant growth in air transport movements to 2050 and, at the same time, achieve a reduction in UK aviation’s total noise output compared to 2010. Figure 1 shows how the introduction of imminent and future aircraft and engine technology offers the potential to reduce UK aviation noise by 2050 compared to 2010. Without this technology, given the forecast growth in demand for air transport, UK aviation’s noise output would almost double. Figure 1: Sustainable Aviation Noise Road Map
Source: Sustainable Aviation
Noise Model - GIP
5
2.6 Gatwick follows the approach outlined in the Sustainable Aviation noise road map and applies the ICAO Balanced Approach in our own noise management strategy. This is also reflected in our Environmental Noise Directive (2002/49/EC) noise action plan (END plan). The ICAO Balanced Approach to noise management has four principal elements:
x Reduction of noise at source x Noise abatement operational procedures x Operating restrictions on aircraft x Land-use planning and management
2.7 There is still much to do in aircraft airframe and engine design, but current day aircraft are now breaking new ground with the Dreamliner 787 aircraft that has a 60% smaller noise footprint than its closest equivalent, and the Airbus A380 that is quieter than the existing 747 jumbo jet. There are also cleaner and quieter aircraft to come. Although aircraft are becoming quieter, airports are getting busier and so the challenge now is to look at how aircraft are flown, and where and also how frequently they are flown in relation to populated areas. 3.0 Progress at Gatwick 3.1 Gatwick is committed to reducing the noise impact of aircraft operations. Between 1997 and 2011 the number of people within the airport’s 57 dBA noise contour has reduced by 75% and its area by 53%3 despite an increase in air traffic movements of 9.3%4. The number of people affected by noise levels of greater than 57dBA at Gatwick is currently less than 2% of those at Heathrow5. 3.2 Gatwick is one of the three regulated airports in the south east and as a result the Environment Research and Consultancy Division (ERCD) of the Civil Aviation Authority (CAA) produces every year noise contours based on the previous year’s operations. These contours are very useful for benchmarking performance, however we do agree with the Airports Commission’s paper which states that no one measure provides the whole picture. 3.3 Under our Fly Quiet and Clean initiative, underpinned by our END plan and the ICAO balanced approach, we have several schemes in place to manage noise, starting from aircraft on the ground and continuing up to and beyond seven thousand feet for both arriving and departing aircraft. These initiatives include the following: 4.0 Airport Collaborative Decision Making (ACDM) 4.1 Airport Collaborative Decision Making (ACDM) is focused at reducing noise at source. Gatwick is already the busiest single runway in the world but we are striving to become ever more efficient and quieter. We have introduced a more proactive and integrated approach to liaising with our air traffic controllers, airlines and ground handlers in order to optimise aircraft movement on the ground and in the air. 3Directors Report and Financial Statements year ended 31st March 2013 4Department for Transport R&D Report 9903 and ERCD Report 1202 (actual modal split) / CAA archive
documentation 5 ERCD Reports 1201 & 1202 – Noise Contours for Heathrow & Gatwick Airports (actual modal split)
Noise Model - GIP
6
4.2 What this means in practice is that the airport now utilises a new integrated planning tool which is used by all the organisations that influence the arrival and departure timings of aircraft. Traditionally it has been difficult to ensure that all these organisations (NATS, airlines, airports, handling agents) worked in concert with each other. As a result, a degree of inefficiency was ‘inbuilt’ into the performance of the airfield. The new planning tool is unique to Gatwick and drives the overall capacity and efficiency of the single runway, while at the same time reducing noise as well as fuel burn. The benefit is that aircraft spend much less time taxiing onto the runway and being held on the taxiways. All of which reduces Gatwick’s ground noise impacts on local communities. 5.0 Future Airspace design – P-RNAV & Rotating Respite for Communities 5.1 We are leaders in the use of new technology to ensure that the design and use of our airspace and operational procedures are as efficient as possible. One such technology is Precise Route Navigation (P-RNAV), a method that uses satellite navigation, ground based aids, and on-board electronic systems to allow aircraft to self- navigate on any desired path. Amongst other benefits, P-RNAV allows aircraft to follow much more accurate tracks and, over a 24 hour period, the currently broad swathe of aircraft tracks is reduced to a much narrower spread. In practice, this allows aircraft to fly routes that impact the fewest people, and allows the option of rotating respite to be introduced. P-RNAV also enables aircraft to climb at steeper gradients as they depart the airport thus reducing noise impacts further. 5.2 Gatwick has been running a P-RNAV trial, and consulted on full implementation last year. The Safety & Airspace Regulation Group (SARG) of the CAA has recently granted us permission to roll this technology out across all nine of our departure routes - a first for a UK airport. We will also be running a night-time arrivals noise respite trial for 90 days commencing in August 2013 to assess whether, and how, community respite can be introduced more broadly. 6.0 Community engagement 6.1 Community engagement is also critical to managing Gatwick’s noise impacts. Key to delivering this is proactive communication by airport noise management teams with noise-affected communities. We already have a comprehensive noise management and governance structure supported by our consultative committee, GATCOM. With the help of these groups we have been able to deliver noise improvements and this approach will be vital to the development of new noise solutions in the future. 6.2 As well as working with GATCOM, we are also working with NATS and our airlines to communicate regularly with communities about noise management strategies and developments. Last year we held a noise seminar with a wide range of stakeholders, including Local Authorities, our airlines, the CAA and environmental groups. The purpose of the event was to outline our approach to noise management in detail, highlight what is already being done, what communities should expect from us in the future, and to get direct feedback. To the best of our knowledge, Gatwick was the only UK airport to hold such an event in 2012 and we will be holding another such seminar later this year. We have also redesigned our aircraft noise website, which enables members of the public to make enquires and complaints, making it much more user friendly with more useful information. In addition we have also launched a
Noise Model - GIP

7
new flight tracking system, which allows people to track aircraft with only a 20 minute delay, down from the previous 24 hours delay. 7.0 Land use planning 7.1 Land use planning is a very important issue for noise impact management at airports. Under the old Planning Policy Guidance 24, the noise threshold for allowing the development of new homes was the 57dBA contour. It is important for a clear threshold to be set in order to prevent the encroachment of noise sensitive developments around airports. However over several years this guidance has not been strictly adhered to and developments have been allowed to progress in noise sensitive areas. 7.2 The most recent of these at Gatwick is the well documented North East Sector development, where the original decision not to allow development was over ruled by the Secretary of State after a Judicial review. Homes in this development will now be built exposing inhabitants to noise in excess of 60dBA. If airports are to be effective in reducing noise impacts and reducing the number of people living within noise sensitive areas, we recommend that the Commission takes a strong position around this issue and recommends that clear national guidance is issued and followed. 8.0 What is next for Gatwick – further airspace design initiatives 8.1 Members of the local community have asked the airport to investigate the possibility of increasing the angle of descent for aircraft, thereby keeping them higher for longer and reducing noise impacts. Currently the global standard for the angle of descent following an Instrument Landing System (ILS) is three degrees. Aircraft join the ILS at varying distances from the airport but once established will follow a three degree descent until touch down. Gatwick is currently exploring with our airlines, the CAA and NATS how and when airspace and aircraft design issues can be overcome to achieve a higher angle of descent. 8.2 As a result of implementing P-RNAV, fewer people will be impacted by noise from arriving and departing aircraft at Gatwick. P-RNAV also opens up several new airspace design options which will provide further opportunities over the next few years to reduce the number of people impacted by aircraft noise to the lowest number possible. In doing so, we are working closely with NATS, who are managing the roll out of the London Airspace Management Program (LAMP), which is seeking to redesign London’s airspace over the next few years. 9.0 Recommendations for the Airports Commission 9.1 Although the Commission’s intention to pursue various lines of research and study is commendable, we wish to stress the urgency of defining the appraisal framework. In order to minimise the risk of nugatory work, or the risk of promoters selecting options which later turn out to be unsuitable, we need clarity from the Commission as soon as possible and in any case no later than their Phase 2 appraisals framework in December 2013, on a number of key points:
Noise Model - GIP
8
x We need details of the noise assessment framework that the Commission will use in its appraisal of options, especially the measures to be used. It is clearly essential that all proposals are presented on a uniform basis of measurement, as accurate comparisons will otherwise be impossible. A good example of the problem is the presentation of the Initial Proposals from Heathrow and Gatwick that have used two very different models to measure the noise impacts of runway expansion. Gatwick has used the model required by the CAA if an airport is to make an airspace change in the UK, and as is also required in the current DfT Air Navigation Guidance document, which is the ANCON 2.3 model. Heathrow has chosen the INM model developed by the FAA, the American aviation regulator. The models can produce very different results on an absolute basis, and potentially on a relative basis as well. This is because, whilst they use the same base algorithm, the assumptions built into the CAA model are based on actual data of flight profiles and noise impacts for an airport, whilst the FAA use theoretical assumptions. A consequence is that the INM model can produce a very different size and shape of noise contour from the CAA required model. This situation cannot be allowed to recur in Phase 2.
x The Government’s policy principles on noise, as laid down in the recent Aviation Policy Framework (APF), are inevitably expressed in general terms, but they will need to be developed with much more precise definition if they are to be used transparently by the Commission in assessing the noise impacts of competing proposals. As a result, it is important that the Commission outlines soon how it proposes to interpret Government policy in its appraisal of options, particularly as regards:
o Government’s primary objective to limit and where possible reduce the number of people significantly affected by aircraft noise.
o Government’s desire to strike a balance between the negative impacts of noise and the positive economic impacts of flights.
o Government’s intention that, as a general principle, any benefits from future improvements in aircraft noise performance should be shared between the aviation industry and local communities.
x And we need clarity as to the Commission’s approach to:
o the weighting of the different appraisal criteria (e.g. the relative weightings as between traffic generated and noise impacts).
o the baseline on which noise assessment should be based. o how to address the inter-dependency between noise and carbon
impacts. 9.2 To highlight the importance of understanding how these policy principles will be interpreted, the Commission needs only to consider the baseline figures of the population who live inside the 57dBA Leq today at Heathrow and Gatwick – which are 258,500 and 3,050 respectively6. Gatwick’s noise footprint, on this basis, is less than 2% of Heathrow’s, and it is clear that, given its position to the west of London, development at Heathrow will always impose disproportionately more noise nuisance on a much larger number of people than ever could be the case at Gatwick. 9.3 We find it extremely difficult to understand on what basis could allowing Heathrow to grow by one or two additional runways ever be consistent with the Government’s primary policy objective of “limiting and where possible reducing the number of people
6 Department for Transport R&D Report 9903 and ERCD Report (actual modal split)
Noise Model - GIP
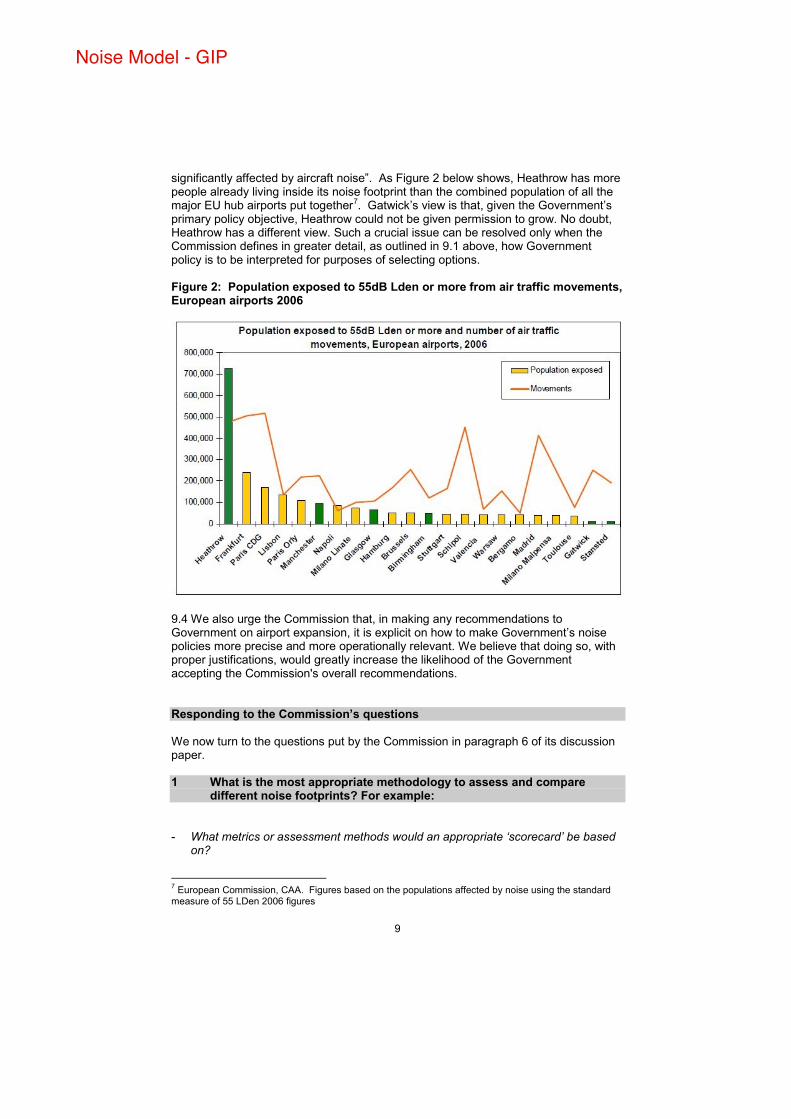
9
significantly affected by aircraft noise”. As Figure 2 below shows, Heathrow has more people already living inside its noise footprint than the combined population of all the major EU hub airports put together7. Gatwick’s view is that, given the Government’s primary policy objective, Heathrow could not be given permission to grow. No doubt, Heathrow has a different view. Such a crucial issue can be resolved only when the Commission defines in greater detail, as outlined in 9.1 above, how Government policy is to be interpreted for purposes of selecting options.
Figure 2: Population exposed to 55dB Lden or more from air traffic movements, European airports 2006
9.4 We also urge the Commission that, in making any recommendations to Government on airport expansion, it is explicit on how to make Government’s noise policies more precise and more operationally relevant. We believe that doing so, with proper justifications, would greatly increase the likelihood of the Government accepting the Commission's overall recommendations. Responding to the Commission’s questions We now turn to the questions put by the Commission in paragraph 6 of its discussion paper. 1 What is the most appropriate methodology to assess and compare
different noise footprints? For example: - What metrics or assessment methods would an appropriate ‘scorecard’ be based
on?
7 European Commission, CAA. Figures based on the populations affected by noise using the standard measure of 55 LDen 2006 figures
Noise Model - GIP

10
As highlighted by the Airports Commission’s Noise paper, no one measure can fully describe noise exposure at any given location. In the UK, the standard measure prescribed by the CAA and used by all the major airports is the Leq method using a 96 day summer time average. Whilst not a perfect measure, it does have the significant benefit that there is consistent historical noise data on all the major airports. In the case of Stansted, Heathrow and Gatwick, this data is produced independently by the CAA. As the Commission paper has highlighted, there are a number of other noise assessment methods available across the world e.g. (N) Method
x The number above (N) or frequency contours that are used at Canberra Airport in Australia, for example, do reflect aircraft over flight frequency more accurately, which the Leq method does not. However the (N) method gives the number of noise events above a certain level in a day. It does not show, for those noise events, the extent to which the noise level has been breached or for how long.
N70 Method
x In theory, the assessment methods used by Sydney Airport, which are a combination of N70, Average Individual Exposure (AIE) and Person Events Index (PEI), would provide communities with a more comprehensive picture of noise impacts and their frequency. However, minimizing AIE and increasing PEI potentially results in spreading noise impacts across more people, which would be in direct conflict with current UK Government policy which favours the concentration of aircraft noise over the lowest number of people. This possible conflict is illustrated further by the fact that the UK Future Airspace Strategy is dependent on P-RNAV for success. As mentioned earlier, P-RNAV will concentrate aircraft noise impacts over fewer people, although with the opportunity of rotating respite being introduced to offset this concentration. In principle, we support the Government’s policy of reducing the total number of people affected by noise, providing the resulting concentration can be offset through rotating respite.
- To what extent is it appropriate to use multiple metrics, and would there be
any issues of contradiction if this were to occur? As the discussion paper outlines very well, in some countries around the world more than one metric is being used and these metrics differ from country to country. The two main issues which need to be taken into account are: 1. It is essential that the principal metrics used for assessment can be related
to Government policy. In the UK, any metric that cannot show how an airport is delivering against the Government’s primary policy objective of limiting, and where possible reducing, the number of people significantly affected by aircraft noise, would risk creating a policy conflict.
Noise Model - GIP
11
2. If multiple metrics are used then there must be consistency across the main UK airports. It becomes difficult or impossible to benchmark noise impacts and performance between different airports if multiple different metrics are used. The Regulator and Government would surely find this totally unsatisfactory as it would make it impossible to arrive at clear and transparent policy choices affecting airports.
- Are there additional relevant metrics to those discussed in Chapter 3 which
the commission should be aware of?
The Commission’s paper does an excellent job of identifying current noise metrics used across the world, whilst acknowledging that there is no one-size-fits-all metric. The Sustainable Aviation noise road map outlines a general approach and mechanisms for noise management at airports but also, helpfully, recognises that different solutions are required for different airports. At Gatwick, for example, we regularly use our Continuous Descent Approaches and track keeping performance as measures additional to Leq contours as a way of communicating our noise impacts and performance.
- What baseline should any noise assessment be based on? Should an
assessment be based on absolute levels, or on changes relative to the existing noise environment?
In Gatwick’s view, it is essential that the Commission’s noise assessment is based on absolute noise levels, as this will provide answers which are much more meaningful in relation to Government policy guidelines, and will permit valid comparisons between different options.
- How should we characterise a noise environment currently unaffected by
aircraft noise?
Although the Leq metric takes several factors into consideration when calculating impacts such as noise event frequency, the output is still an average noise contour. An additional issue not covered by the Leq metric is the frequency of noise events.
At Gatwick, people living outside our noise contours explain to us that they are not so much concerned by the level of noise but by how often it occurs. Although aircraft will continue to get quieter, the frequency of over flight will increase as traffic grows. As a result, a clearer understanding of the impact of frequency is needed before seeking to characterise noise environments not currently affected by aircraft noise and Gatwick supports this need.
2 How could the assessment methods described in Chapter 4 be improved to better reflect noise impacts and effects?
2.1 Aviation noise assessment methods date back to the Wilson committee in
1961 when a strong correlation between annoyance and level of complaints was found. This work led to the development of the Noise number index (NNI). After this came the Theodore Schultze study in 1978, and then the
Noise Model - GIP
12
Aircraft Noise Index Study (ANIS) in 1982 which led to the view that 57dBA was the noise level identifying the onset of community annoyance. A further study in 1997, Attitudes to Noise from Aviation Sources (ANASE), attempted to take this work further, but not all the findings are supported by commentators. There has been no major step forward in understanding levels of noise annoyance since that time, and the primary focus still remains around the 57dBA contour.
One of the most significant challenges in managing noise is its subjective nature. As history and experience of seeking to manage aircraft noise issues have shown, people’s reactions and perception of aircraft noise are complex. Based purely on 57 Leq noise contour data, the reduction in aircraft noise achieved by the industry over the last half century has resulted in many fewer people being significantly affected by noise. However based on regular stakeholder feedback received by the industry, reinforced in the UK Aviation Policy Framework, it is apparent that noise from aircraft operations remains a real source of controversy between airports and local communities. Many local communities believe that current noise metrics, including the use of average noise contours, do not reflect fully their experience of aircraft noise. As discussed earlier, there is a need for a significant piece of work to be undertaken following on from ANASE to determine better the impacts of aviation noise on local communities. In terms of noise metrics and assessment methods, and considering all the different approaches across the world, it would appear that Leq is the best approach to understanding the levels of noise experienced at certain locations around an airport. However we also believe there is merit in supplementing Leq with the N(70), AEI and PEI methods to help airports understand where best to place aircraft tracks with least effect on communities. In Europe, the Lden method is commonly used, and this has been given some consideration for use in the UK in place of Leq. However, on closer analysis during a recent noise metric discussion chaired by the DfT, some significant issues were identified. While it is clear that the Lden method provides a more accurate assessment of noise impacts over a year, it is a very blunt instrument due to the weighting placed on certain flight types. For example, when an assessment was carried out using the Lden method on the impact of removing all night flights from an airport’s operation, the actual impact on noise was in the order of only one decibel reduction. This means that if Lden was used it would be extremely difficult for an airport operator to effect any positive change in noise impacts through operational means.
3 Is monetising noise impacts and effects a sensible approach? If so, which monetisation methods described here hold the most credibility, or are most pertinent to noise and its various effects?
3.1 Although there are examples of monetisation for the rail and road industry, it
has been difficult historically to monetise aviation noise impacts, due to the types of noise and the fact that it reaches people from many different aircraft and altitudes. This difficulty is recognised in the discussion paper.
Attempts to monetise aviation noise were made before Heathrow’s Runway 3 proposal in 2009. Work undertaken by the Environmental Research and
Noise Model - GIP
13
Consultancy Division (ERCD) of the CAA found that, although it was possible to monetise impacts, the calculated costs escalated rapidly due to the nature of the population spread within noise contours and the large area covered by Leq contours at Heathrow. This work found that for every 3dB change in noise the cost doubled and quickly became unrepresentative of actual impacts. The cost was based on a combination of the lowering of house price values due to daytime annoyance, impact of sleep disturbance and potential negative health effects.
We recognize the potential advantages of making a monetary link to noise impacts but, as the Commission’s paper outlines well, more work is needed in this area to produce a meaningful and accurate assessment. We would support further work in this area through the Government’s Interdepartmental Group on Costs (IGCB).
4 Are there any specific thresholds that significantly alter the nature of any
noise assessment, e.g. a level or intermittency of noise beyond which the impact or effect significantly changes in nature?
4.1 Experience at Gatwick suggests that, in general, people living close to the
airport become de-sensitised to noise over time, having become accustomed to higher average levels of noise. However, annoyance from these areas is more typically registered if there is a change in the noise footprint or type of noise, rather than because of the average noise level itself. Annoyance is increasingly registered from populations outside the current Gatwick noise contours, as a result of the frequency of aircraft over flight rather than the actual noise level, but again stemming from changes in type of noise and where it is heard.
In order for more meaningful noise assessment to be developed, the flight
frequency factor must be explored. It must also not be overlooked that perception is a major factor that can drive trends in noise annoyance. Several times over the last 18 months, noise annoyance has been registered by communities around Gatwick as a result of a perceived change in either operations or noise levels. After extensive investigation on both fronts, it is evident that rumours of a change in operations, or operational change that has no actual noise impact, often create large peaks in registered noise annoyance.
Much work has been done by ERCD into the identification of possible noise
thresholds and trigger points for noise annoyance. This work demonstrates as one might expect, there is often a large peak of annoyance registered at high noise levels and this declines as noise reduces. The problem is that there is no clear cut off in annoyance as level of noise reduces and annoyance was seen to continue to be registered at lower average noise levels outside the 57 Leq noise contours, thus confirming the subjectivity of noise impact.
Again we would support further research into identifying a possible threshold
as this would help inform the selection or development of alternative noise metrics.
Noise Model - GIP

14
5 To what extent does introducing noise at a previously unaffected area represent more or less of an impact than increasing noise in already effected areas?
5.1 At Gatwick we have experience of recent operational change consultations
that provide insights into the way in which people react to aircraft noise. People who are already subjected to noise usually simply want it to go away and certainly do not want it to get worse. People currently unaffected by aircraft noise often remain silent when we consult locally and discuss the implications of the impacts on others. Any suggestion of aircraft noise impacting new areas always brings about a very strong negative reaction, but is naturally supported by those already exposed to such noise. People already exposed to significant noise feel that the noise should be spread and the burden shared by all who live near the airport. This argument leads back into the concentration versus dispersal debate. Current Government policy as published in the recent APF is clear that concentration is the preferred approach, indeed FAS and LAMP are reliant on new forms of air navigation, like P-RNAV, that will result in a concentration of aircraft noise on certain areas of the community.
Gatwick has recently been granted permission to implement P-RNAV on all nine of our departure routes. This now places the airport in a favourable position and ahead of other airports in the UK in terms of alignment with the future requirements of airspace design and operation in the UK. P-RNAV also allows the development of rotating noise respite, thereby creating the option of providing alternating respite for those people in communities subject to a concentration in aircraft noise.
6 To what extent is the use of a noise envelope approach appropriate, and
which metrics could be used effectively in this regard? 6.1 This concept has been widely discussed through several previous Government
consultations and discussion papers, as well as the Government’s ANMAC meetings. We support this concept in principle but careful exploration and discussion needs to take place to understand all the implications, risks and benefits for each airport.
There are examples of this technique in use at other airports, the most recent being at Schiphol Airport. After construction of their latest runway, 35 noise enforcement points were established using the Lden metric, each point being given a weighting for noise levels during the day and night. The position of these points created a noise envelope around the airport and compliance with the limits at each of these points is measured on an annual basis. There are also several caveats in place to take into account wind direction changes, extreme weather and planned maintenance. There is also the uncontrollable aspect that airlines and their aircraft can use departure routes without regard to the existing noise limits, making compliance very difficult for the airport. All of this makes for a very complex noise management environment that has significant implications for runway operation and capacity. The Schiphol example shows great care is needed when setting a noise envelope and striking an appropriate balance between capacity benefits and noise constraints.
Noise Model - GIP

15
7 To what extent should noise concentration and noise dispersal be used
in the UK? Where and how could these techniques be deployed more effectively?
7.1 As mentioned in the discussion paper, current Government policy is to limit
and where possible reduce the number of people significantly affected by aircraft noise. In practice, this policy will result in a concentration of aircraft tracks on arrival and departure. This effect will become more pronounced with the roll out of FAS and LAMP in the coming years. The solution to reducing noise impact, whilst ensuring compliance with policy, is to deliver rotating respite. Aircraft tracks will tend to be concentrated over fewer people but the ability to switch routes provides a workable alleviation to the impact on particular localities. The value placed on the predictability of noise should also not be overlooked - communities rate this highly as it enables them to plan or be prepared for when and where noise will be experienced.
8 What constitutes best practice for noise compensation schemes abroad
and how do these compare to current UK practice? What noise assessments could be effectively utilised when constructing compensation arrangements?
8.1 We believe that current practice at Gatwick, offering several community
schemes ranging from blight compensation to domestic noise insulation, is very strong and we are in the process of considering how to improve this further, so as to be recognised as following best practice in our sector. There is no one-size-fits-all solution for noise management and mitigation at airports, as every airport location, aircraft fleet mix and its communities will have different requirements and be governed by different operational requirements and constraints. We are in the process of updating all our schemes and plan to roll out a new noise insulation scheme later this year aimed at providing noise mitigation in a fairer way to more homes around Gatwick.
Any effective compensation scheme needs to reflect the needs and concerns of communities around the airport balanced against operational requirements and financial constraints of the airport itself. In addition, as a regulated airport, expenditure on such schemes will have to be consulted on with our airlines before any initiative can be launched.
9 Conclusion 9.1 The Commission’s discussion document poses some very important questions
that do not have straight-forward or easy answers. The Commission is right to identify noise impacts as a central issue when considering options for increasing aviation capacity, as any plans for additional capacity will need to be sustainable, and deliverable in terms of community and political support.
The aviation industry, and Gatwick airport itself have made remarkable strides in reducing noise impacts over the last 50 years, through new aircraft and
Noise Model - GIP

16
engine technologies as well as innovative ways of operating aircraft in and out of airports.
Gatwick is a UK leader in noise impact management through its pioneering
implementation of P-RNAV and plans to trial rotating respite. There is still more to do and we welcome the opportunity to work with the Commission, as well as with the Regulator and our airline partners, to maintain our leading position.
We support research into the onset of annoyance and further work into the
effects of aircraft over flight frequency, together with an assessment of possible development of noise envelopes.
We believe that it is extremely important for the Commission to make clear soon how it intends to assess the noise impacts of options for long term capacity growth, and how that noise assessment framework will interpret the policy position of the Government on noise issues.
Noise Model - GIP
17
Glossary ACDM Airport Collaborative Decision making AEI Average Individual Exposure ANASE Attitudes to Noise from Aviation Sources in England ANMAC Aircraft Noise Monitoring Advisory Committee. The committee
is chaired by the Department for Transport and comprises, among others, representatives of the airlines, Heathrow, Gatwick and Stansted airports and airport consultative committees.
ATM Air Traffic Movement APF Aviation Policy Framework CAA Civil Aviation Authority CDA Continuous Descent Approach dBA A unit of sound pressure level, adjusted in accordance with
the A weighting scale, which takes into account the increased sensitivity of the human ear at some frequencies.
DfT Department for Transport (UK Government) ERCD Environmental Research and Consultancy Department of the
Civil Aviation Authority
FAA Federal Aviation Administration FAS Future Airspace Strategy
GATCOM Gatwick Airport Consultative Committee ICAO International Civil Aviation Organization LAMP London Airspace Management Programme Lden The day, evening, night level, Lden is a logarithmic composite
of the Lday, Levening, and Lnight levels but with 5 dB(A) being added to the Levening value and 10 dB(A) being added to the Lnight value
Leq Equivalent sound level of aircraft noise in dB(A), often called equivalent continuous sound level. For conventional historical contours this is based on the daily average movements that take place in the 16 hour period (07:00 - 23:00 LT) during the 92 day period 16 June to 15 September inclusive
N(70) number of noise events with maximum noise level of 70dBA
Noise Model - GIP

18
NATS National Air Traffic Services NPR Noise Preferential Route P-RNAV Precise route navigation PEI Person events Index SA Sustainable Aviation SARG Safety & Airspace Regulation Group of the CAA
Noise Model - GIP
GLA Planning Officers held pre-application advice meetings with the airport on the current scheme on the 17 October 2012 and 22 January 2013, when the following suggestions were made.
The monitoring arrangements established by the 2008 Section 106 planning agreement should be carried forward into any new permission.
These arrangements are failing. The Noise Monitoring and Mitigation Strategy (NOMMS) is still not operational. The 2009 application 07/01510/VAR to increase flight movements to 120,000 there was a planning obligation by deed of agreement under Section 106 of the Town and Country Planning Act 1990 on the 9th of July 2009.
The Value Compensation Scheme time limit for a claim is 10 years from the date of the 2009 Planning permission with four years already been lost for potential claimants.
Critically the PSZ Value Compensation Scheme S106 2009 is still not agreed.VCS is to compensate for value lost in sites yet to be developed covered by the extension of the Public Safety Zone and directly impacts GLA owned lands.
Economic and social impact cannot be properly assessed until a financial value is put on the impact of the PSZ through the VCS invalidating the environmental statement.
We would ask that the GLA insist that this is resolved and agreed before any planning agreement be carried forward.
Very substantial weight should be given to the Mayor of London’s stated views on the acceptability of raising flight movements beyond the current 120,000 cap within the future plans, assumptions and strategies. While the current application does not go beyond the current cap, the flight mix of airport movements changes. The 2009 application was based on a central assumption of 95,000 ATMs. This application changes this to 107,000 having an impact on the noise contours and Public Safety Zone.
Detailed environmental data and analysis should be prepared and submitted so that environmental impacts can be fully assessed and understood as part of the formal application process – in particular in respect of noise and air pollution.
Critically GIP Gatwick, the owners of London City Airport, have submitted strong evidence to the Davies Airports Commission suggesting that Heathrows use of the FAA INM model can produce a very different size and shape of noise contours from the CAA required model. London City Airport uses the Heathrow INM Model to assess noise.
London City Airport has not used the model required by the CAA if an airport is to make an airspace change in the UK and as is also required in the current DfT Air Navigation Guidance document, which is the ANCON 2.3 model. We would ask that the GLA insists on this noise modeling.
The models can produce very different results on an absolute basis, and potentially on a relative basis as well. This is because, whilst they use the same base algorithm, the assumptions built into the CAA model are based on actual data of flight profiles and noise impacts for an airport, whilst the FAA use theoretical assumptions.
GIP Gatwick owners (who are also London City Airports owners) claims to have followed the usual CAA practice employing ANCON 2.3 whereas Heathrow used the American FAA INM model as does London city Airport. Gatwick notes that the American approach uses theoretical assumptions for flight profiles and noise impacts whereas the CAA model deals with actual flight and noise data.
We would ask that the GLA insist that this is resolved and agreed before any planning agreement be carried forward.
Ends
Greater London Authority Response
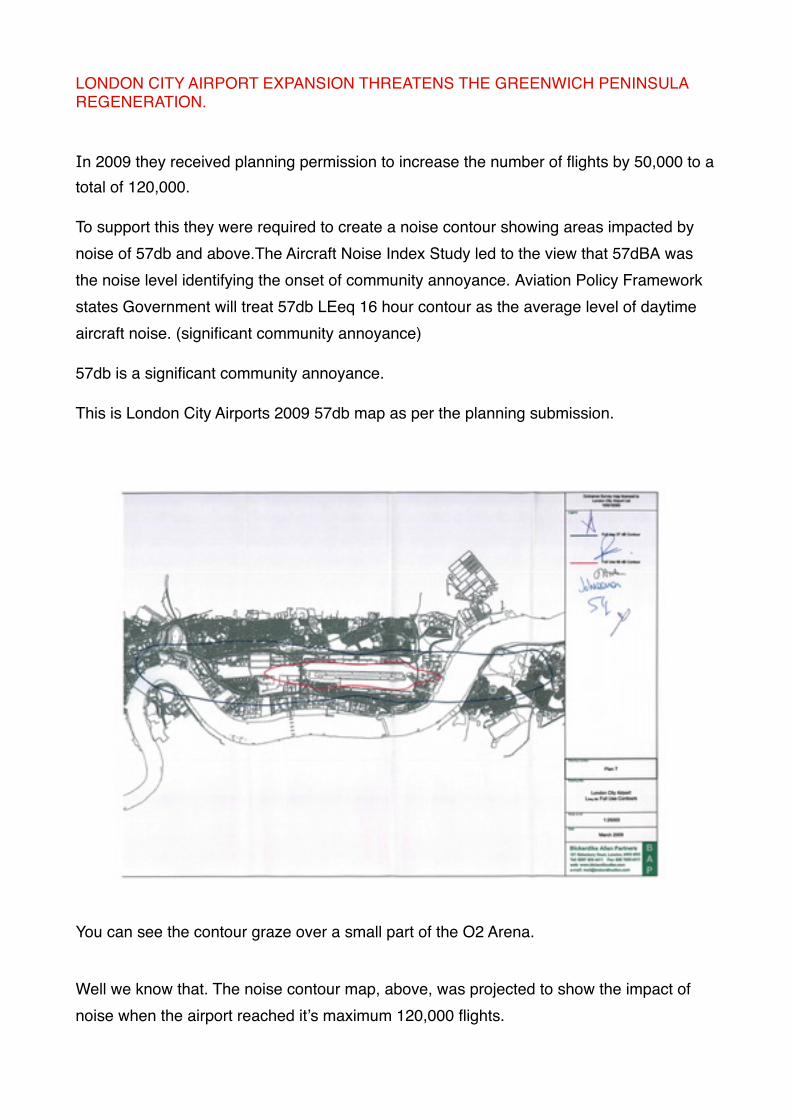
LONDON CITY AIRPORT EXPANSION THREATENS THE GREENWICH PENINSULA REGENERATION.
In 2009 they received planning permission to increase the number of flights by 50,000 to a total of 120,000.
To support this they were required to create a noise contour showing areas impacted by noise of 57db and above.The Aircraft Noise Index Study led to the view that 57dBA was the noise level identifying the onset of community annoyance. Aviation Policy Framework states Government will treat 57db LEeq 16 hour contour as the average level of daytime aircraft noise. (significant community annoyance)
57db is a significant community annoyance.
This is London City Airports 2009 57db map as per the planning submission.
You can see the contour graze over a small part of the O2 Arena.
Well we know that. The noise contour map, above, was projected to show the impact of noise when the airport reached it’s maximum 120,000 flights.

While the airport is saying noise will increase, what they are not saying that the increase “Without Development” will affect far more people than the have previously projected.
The map for the “Without Development” scenario should be the same as the 2009 map.
This is the 2023 “Without Development” contour.
You can see already the 57db contour has changed though not too substantially. It goes further over the O2 arena.
So what happens if the airport actually gets it’s expansion? Technically, even then there should be no change in the noise contours as there are no extra flights.
This is the 2023 “With Development” contour.

You can see now that huge swathes of the Peninsula will be in the 57db noise contour.The O2 Arena is completely engulfed as is it’s outdoor space as is huge future development sits as part of the Peninsula Regeneration.
Not only does the Peninsula suffer a huge impact from the changes, future developments have not even been considered and gone ignored. 57db is based on ground level readings, so those residents above ground level could even be far more exposed.

Not a single Peninsula development site has been included. Thousands of homes and residents that will be affected have been left out of the Airports calculations.
The 55db should also be a material consideration. The World Health Organisation sets a 55db target value for controlling noise in open spaces. Lewisham have done an excellent open space study using these guidelines.
The 55db contour for the Peninsula shows incredibly worrying results.
55db with development 2023

A huge number of open spaces, parks and public realms will be in the WHO 55db target value.
Greenwich Peninsula Ecology Park will be one of those parks affected.
Greenwich Council have fought long and hard to regenerate the Peninsula which will see it blighted by aircraft noise. And these figures are just London City Airport noise. Adding the Heathrow flights and road traffic could see noise reach untenable levels that not only are a significant community annoyance but a severe risk to residents health too.

Greenwich’s Draft Core Strategy with Development Management Policies 2011 has a policy C(e) - London City Airport which fails to completely take into account and understand all impacts of the airport and hence it fails.
London City Airport in it’s current form and it’s future expansion is a material consideration in the Core Strategy. The Airport Masterplan and current expansion planning submission shows growth and expansion up to 2030 which will effect housing and open spaces across Greenwich.
In 2009 they received planning permission to increase the number of flights by 50,000 to a total of 120,000.
PSZControl of development in airport public safety zones Ref: DfT circular 01/2010
Public Safety Zones are areas of land at the end of runways established at the busiest airports in the UK, within which certain planning restrictions apply. These aim to control the number of people on the ground at risk in the unlikely event of an aircraft accident on take-off or landing.
The basic policy objective governing the restriction of development near civil airports is that there should be no increase in the number of people living, working or congregating in PSZs and that over time the number should be reduced as circumstances allow (e.g. when any redevelopment takes place).
The proposals will allow a mix of different types of planes at LCA. By implication this could affect the current PSZ, and will therefore have a positive or negative impact on how this will impact upon future surrounding development sites in terms of socio-economics. Whilst it is accepted the precise nature of the future PSZ may be difficult to predict, consideration of possibilities will still need to be given regard.
The Public Safety Zone will also affect land safeguarded for the Silvertown Tunnel which is a Nationally Significant Infrastructure Project which is ignored in the application and directly affects Greenwich.
Critically the PSZ Value Compensation Scheme S106 2009 is still not agreed.VCS is to compensate for value lost in sites yet to be developed covered by the extension of the Public Safety Zone.Economic and social impact cannot be properly assessed until a financial value is put on the impact of the PSZ through the VCS invalidating the environmental statement.
Noise
To support this they were required to create a noise contour showing areas impacted by noise of 57db and above.The Aircraft Noise Index Study led to the view that 57dBA was the noise level identifying the onset of community annoyance. Aviation Policy Framework states Government will treat 57db LEeq 16 hour contour as the average level of daytime aircraft noise. (significant community annoyance)
57db is a significant community annoyance.
The future 2023 “With Development” contour shows large areas of Greenwich entering the 57db contour. Huge swathes of the Peninsula will be in the 57db noise contour.The O2 Arena is completely engulfed as is it’s outdoor space as is future development sites as part of the Peninsula Regeneration. These future developments have not even been considered and gone ignored in the Airports application. Developments like Tripcock Point and Gallions Reach are also effected.
The new application changes the baseline number of ATM’s from 95,000 scheduled air traffic movements to 107,319. (+13%) The 2010 PSZ was based on a forecast that assumed that there would be 94,224 scheduled movements and 2,608 jet centre movements (97,092 movements overall)
Overall Newham, Greenwich and Tower Hamlets will see the number of dwellings in noise contours will increase with this new planning application. 57db increases 8,300 to 13,700 to 15,100 (2012 /2017 /2023) 63db increases 400 to 1,100 to 1,300 (2012 /2017 /2023). This does not include future development.Noise Contours will increase around the airport 57 db 6.3km squared to 57 db 9.1km squared (2012/ 2021) 63db 1.6km squared to 63db 2.4km squared (2012/2021)Population in the 57db contour will increase from 8,300 to 15,100 (2012/2021) Population in 63db will increase from 1000 to 2,800 (2012/2021) Air noise levels at schools and colleges over 57db (averaged over 16hrs) increases from 9 to 11 with all suffering a net increase.
This does not include future development.
Sites for Gypsies and Traveller's could not be in these contours as no noise mitigation would be available to them.
Approx. population in contours including permitted but not yet built residential will increase from 17, 900 to 75,900 in 57db, 1,000 to 17,500 in 63db (2012/2021)
World Health Organisation sets a 55db target value for controlling noise in open spaces. A huge number of open spaces, parks and public realms will be in the WHO 55db target value.
London City Airport has not used the model required by the CAA if an airport is to make an airspace change in the UK and as is also required in the current DfT Air Navigation Guidance document, which is the ANCON 2.3 model.

The models can produce very different results on an absolute basis, and potentially on a relative basis as well. This is because, whilst they use the same base algorithm, the assumptions built into the CAA model are based on actual data of flight profiles and noise impacts for an airport, whilst the FAA use theoretical assumptions.
Frameworks / Plans
Governments Aviation Policy Framework on overall aviation noise is to “limit and, where possible reduce the number of people in the UK significantly affected by aircraft noise” (para 3.12)
The Civil Aviation Bill is for making sure UK airports and airlines are safe, secure and competitive while reducing their impacts on the environment and communities
Government will treat 57db LEeq 16 hour contour as the average level of daytime aircraft noise. (significant community annoyance).
The London Plan (07/2011) sets out the strategic approach to development in the Capital.
Policy 2.13 states that in relation to planning decisions in opportunity areas proposals should seek to optimise residential and nonresidential output and densities, provide necessary social and other infrastructure to sustain growth, and, where appropriate, contain a mix of uses. Thamesmead and Woolwich are opportunity areas.
National Planning Policy Framework (03/2102) (NPPF) is a material consideration in planning decisions and replaces most of previous national guidance.
It states that local planning authorities should approach decision making in a positive way to foster the delivery of sustainable development and decision makers should approve applications for sustainable development where possible and local planning authorities should work proactively to secure developments that improve the economic, social and environmental conditions of an area (para 187)
Para 109 also states that “The planning system should contribute to and enhance the natural and local environment by protecting and enhancing valued landscapes, geological conservation interests and soils.
AVP 3.20 to 3.23 refer to land use planning and management and expects local planning policies and decisions to ensure new development is appropriate for its location and the effects of pollution, including nose, on health and natural environment be taken into account.
NPPF Para. 6 and 7 state the purpose of the planning system is to contribute to the achievement of a sustainable development - economic, social, environmental. The presumption is in favour of sustainable development.
For queries or further information contact Alan on 07909907 395 or email [email protected]
IntroductionPlanning permission was granted on 9 July 2009 (reference 07/01510/VAR) by the London Borough of Newham LBN) for variation of conditions attached to previous planning permis-sions for the Airport to allow up to 120,000 total aircraft movements per year (with related modifications to other limits on aircraft movements).
London City Airport have now submitted two inter-related planning applications to Newham on 26 July 2013, to deliver the ‘City Airport Development Programme’ (CADP), these applica-tions are referred to as CADP1 (planning application 13/01228/FUL) and CADP2 (planning application 13/01373/OUT).
The full application can be seen at
13/01228/FUL | Planning Application Link CADP113/01373/OUT | Planning Application Link CADP2
Closing date for responses is Monday 28th of October (Though pre-action letters have been sent to Newham over failures in the consultation)
You can respond through the links above or email an objection to Sunil Sahadevan [email protected]
I have also created a clickable response for those who are time limited.
Please just add your name and address at the bottomPre Written Objection Email Link - London City Airport Application 13/01228/FUL and 13/01228/FUL
The briefing below is in bullet point format for ease of use.
Page 1 - IntroductionPage 2 - BackgroundPage 3 - 4 Suggested Key PointsPage 5 - 6 London briefing points.Page 7 - 8 Local briefing points.Page 9 Newham briefing points.Page 10 National briefing points.Page 11 - 12 Public Safety Zone briefing points.Page 13 - 17 Value Compensation DeedPage 18 - 20 Copy of Pre Action letter
Please note this is a huge application and I have taken what, in my opinion is relevant information. Please do your own research where you can and if you have any information you would like to add please let me know. My formal objection will be submitted on Monday. Thanks Alan
1

BackgroundLondon City Airport is situated in the Royal Docks, a key London regeneration zone.
The Airport and Runway are surrounded by water from the Royal Albert Dock (approx 30 hec-tares) and King George V dock (approx 34 hectares)
The existing Airport site extends to 48.5 hectares. With this CADP increasing to 60.6 hec-tares with the increase coming from the covering of 31% of King George V dock.
In 2012 there were 1,900 full time equivalent jobs. Of those employees 27% resided in LBN and 61% lived in 11 East London boroughs (which includes Newham)
Currently the airport has car parking capacity for 854 vehicles which includes short and long stay and staff parking.
In 2012 there was 70,502 total aircraft movements with 3.03 million terminal passengers.
In July 2009 Newham approved a massive expansion in the number of flights to a total of 120,000 noise factored movements.
It predicted that 3.9 million passengers could be accommodated in existing infrastructure. (2009) At that time it was not considered necessary to provided additional infrastructure.
The Environmental Statement that accompanied the 2009 application 07/01510/VAR adopted a central assumption of 95,000 scheduled movements and 25,000 jet centre movements (pri-vate jets).
Aircraft are categorized A - E by noise levels. Category A (jets) is the highest permissible level with a noise factor movement of 1.26 (example - four jets taking off would be the equivalent of 5 movements)
The new CADP will allow 111,039 annual movements.
The Airport Masterplan identifies three development phases Phase 1 - 3.5m Passengers by 2015 , 6 million by 2025 and 8 million by 2030.
By 2030 it forecasts 143,000 flights and 27,600 corporate movements.
The Governments Aviation Policy Framework March 2013 replaces the 2003 Air Transport White Paper.
The Airports Commission is currently reviewing aviation capacity in the South East.
2
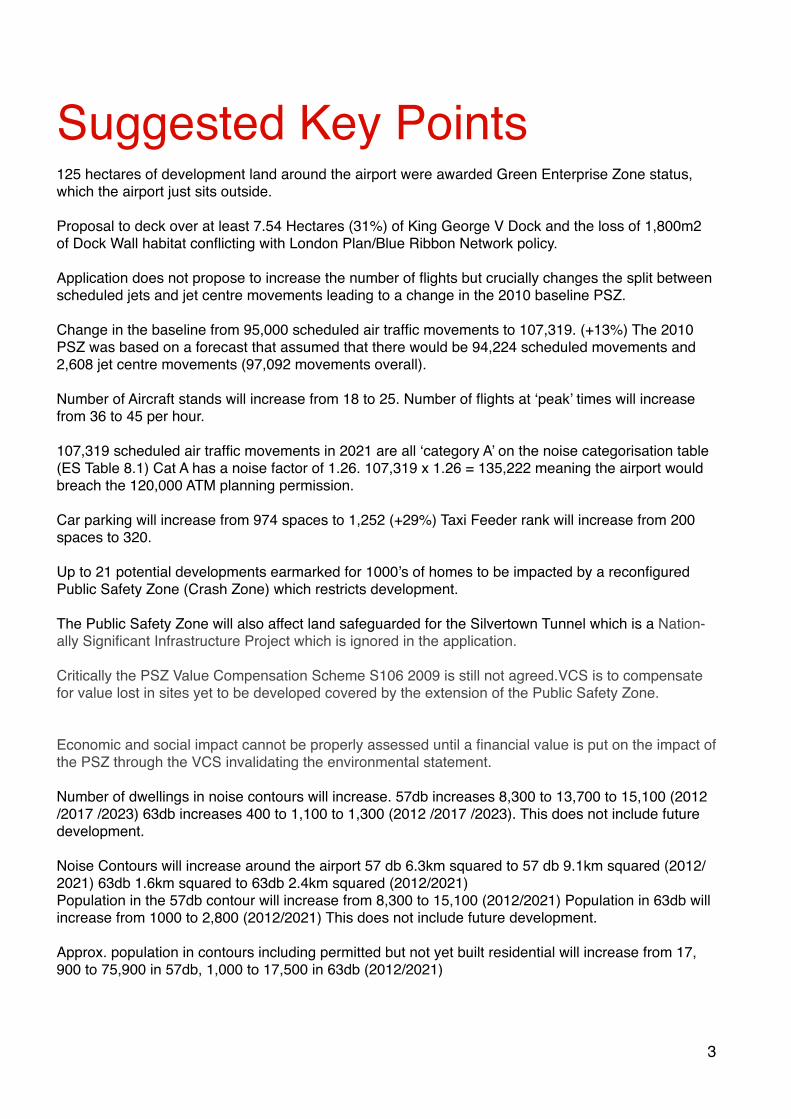
Suggested Key Points125 hectares of development land around the airport were awarded Green Enterprise Zone status, which the airport just sits outside.
Proposal to deck over at least 7.54 Hectares (31%) of King George V Dock and the loss of 1,800m2 of Dock Wall habitat conflicting with London Plan/Blue Ribbon Network policy.
Application does not propose to increase the number of flights but crucially changes the split between scheduled jets and jet centre movements leading to a change in the 2010 baseline PSZ.
Change in the baseline from 95,000 scheduled air traffic movements to 107,319. (+13%) The 2010 PSZ was based on a forecast that assumed that there would be 94,224 scheduled movements and 2,608 jet centre movements (97,092 movements overall).
Number of Aircraft stands will increase from 18 to 25. Number of flights at ‘peak’ times will increase from 36 to 45 per hour.
107,319 scheduled air traffic movements in 2021 are all ‘category A’ on the noise categorisation table (ES Table 8.1) Cat A has a noise factor of 1.26. 107,319 x 1.26 = 135,222 meaning the airport would breach the 120,000 ATM planning permission.
Car parking will increase from 974 spaces to 1,252 (+29%) Taxi Feeder rank will increase from 200 spaces to 320.
Up to 21 potential developments earmarked for 1000’s of homes to be impacted by a reconfigured Public Safety Zone (Crash Zone) which restricts development.
The Public Safety Zone will also affect land safeguarded for the Silvertown Tunnel which is a Nation-ally Significant Infrastructure Project which is ignored in the application.
Critically the PSZ Value Compensation Scheme S106 2009 is still not agreed.VCS is to compensate for value lost in sites yet to be developed covered by the extension of the Public Safety Zone.
Economic and social impact cannot be properly assessed until a financial value is put on the impact of the PSZ through the VCS invalidating the environmental statement.
Number of dwellings in noise contours will increase. 57db increases 8,300 to 13,700 to 15,100 (2012 /2017 /2023) 63db increases 400 to 1,100 to 1,300 (2012 /2017 /2023). This does not include future development.
Noise Contours will increase around the airport 57 db 6.3km squared to 57 db 9.1km squared (2012/2021) 63db 1.6km squared to 63db 2.4km squared (2012/2021)Population in the 57db contour will increase from 8,300 to 15,100 (2012/2021) Population in 63db will increase from 1000 to 2,800 (2012/2021) This does not include future development.
Approx. population in contours including permitted but not yet built residential will increase from 17, 900 to 75,900 in 57db, 1,000 to 17,500 in 63db (2012/2021)
3

Air noise levels at schools and colleges over 57db (averaged over 16hrs) increases from 9 to 11 with all suffering an increase.
Noise levels of 57db up to 70db at 28 areas of land proposed for development across 3 boroughs by 2021.
World Health Organisation sets a 55db target value for controlling noise in open spaces. All 8 recrea-tion areas around the airport will breach this by 2019.
No information has been provided on the potential impact of bigger jets on flight paths.
Forecast cost of policing London City Airport (12/13) is £4.0m.Contribution from airport expected to be £1.9m. No assessment of policing for new expansion and the impact on taxpayer for MET policing.
Royal Docks will have the longest response time for fire services in London at 8.39 minutes. No analysis has been carried out on the closure of Silvertown Fire Station and the PSZ. The Airport did not submit any information to the fire consultation.
The Davies Airports Commission is currently looking at airport capacity in the South East which has a material effect on London City Airport airspace.
Critically GIP Gatwick, the owners of London City Airport, have submitted strong evidence to the Davies Airports Commission suggesting that Heathrows use of the FAA INM model can produce a very different size and shape of noise contours from the CAA required model. London City Airport uses the Heathrow INM Model to assess noise.
London City Airport has not used the model required by the CAA if an airport is to make an airspace change in the UK and as is also required in the current DfT Air Navigation Guidance document, which is the ANCON 2.3 model.
The models can produce very different results on an absolute basis, and potentially on a relative basis as well. This is because, whilst they use the same base algorithm, the assumptions built into the CAA model are based on actual data of flight profiles and noise impacts for an airport, whilst the FAA use theoretical assumptions.
New access road will mean Woodman Street residents exposed to a major increase in road traffic noise.
Air Quality readings at the Waterfront on Newham Dockside 2012 show breaches on annual nitrogen dioxide reading of more than 40ug though have been dismissed due to the area being used as a coach park for the Olympics but had also breached in previous years.
Walls of King George V Dock support a significant biomass of invertebrates, a food source for fish and will be lost when the wall is covered.
Greenhouse Gas Emissions will increase with the proposed development.
Both the Royal Albert Dock and King George V Docks are identified as Protected Sites of Nature Conservation Importance (SNCIs)
4

Objections - London Briefing PointsThe London Plan (07/2011) sets out the strategic approach to development in the Capital.
The Royal Docks, Beckton Waterfront, Isle of Dogs, Woolwich and Thamesmead all fall within opportunity areas.
Policy 2.13 states that in relation to planning decisions in opportunity areas proposals should seek to optimise residential and nonresidential output and densities, provide necessary social and other infrastructure to sustain growth, and, where appropriate, contain a mix of uses.
Royal Docks and Beckton Waterfront opportunity areas are capable of providing 600 new jobs and 11,000 new homes.
Policy 6.6 deals with aviation. Development proposals affecting airport operations or patterns of air traffic (particularly those involving increases in the number of aircraft movements) should have a high priority to sustainability and take full account of environmental impacts (particularly noise and air quality) by promoting access to airports by traveller and staff by sustainable means, particularly public transport.Policy 7.30 London’s Canals and other Riv-ers and Waterspaces is directly relevant to the proposals.Airport proposals will involve decking over the dock and the loss of the dock wall.
The Royal Docks sits within the Blue Ribbon Network (BRN). The London Plan states development proposals should enhance the BRN . Para 7.28 relates to the restoration of the BRN and devel-opment proposals should restore and enhance it by preventing development and structures into the water space unless it serves a water related purpose. (residential barges, restaurants etc)
Crucially the BRN states “the BRN should not be used as an ex-tension to the developable land in London”
Policy 5.3 of the LP says major development proposals should meet sustainable design principles like minimising carbon dioxide emissions across the site.
Policy 7.15 requires development proposals to reduce noise and minimise the existing and potential adverse impacts of noise, on, from, within, or in the vicinity of development proposals. Separate new noise sensitive development from major noise sources wher-ever practical.
125 hectares of development land around the airport awarded En-terprise Zone status which the airports sits outside of.The zone is in 3 key areas - Silvertown Quays, Royal Albert Dock and Royal Albert Basin.All rates from newly established businesses will be retained by
5

London’s Local Enterprise Partnership.
The Royal Docks Management Authority (RODMA) have adopted a development strategy for the next 15 years which it states its purpose is to shape the regeneration of the Royal Docks by putting the water assets first and, in doing so, increase the value of the land assets in the process.
The Mayor of London is one of the largest public sector landowners in London and, by de-fault, Londoners. 34 parcels of this land is in the Royal Docks and surrounding area and any increase in land value due to the RODMA development strategy will benefit London as a whole.
The CADP proposal will support 910 direct onsite FTE jobs in 2023 overall.For every Hectare of the Royal Dock it covers, 70 jobs will be created be created. By com-parison the Chinese Business Hub opposite is of similar at 14 Hectares and it is estimated will created 20,000 jobs (1,428 jobs per hectare) Overall with development the airport will support approximately 48 jobs per ha vs 43 without.
Crossrail will also have an impact on the area. It will improve accessibility to Heathrow, Strat-ford International and Eurostar.
No cumulative noise readings for London City Airport and Heathrow even though the fly over the same areas.
The Public Safety Zone will also impact land safeguarded for the Silvertown Tunnel which is a Nationally Significant Infrastructure Project which is ignored in the application.
Critically the PSZ Value Compensation Scheme S106 2009 is still not agreed.VCS is to com-pensate for value lost in sites yet to be developed covered by the extension of the Public Safety Zone.
The Value Compensation Scheme time limit for a claim is 10 years from the date of the 2009 Planning permission.
6
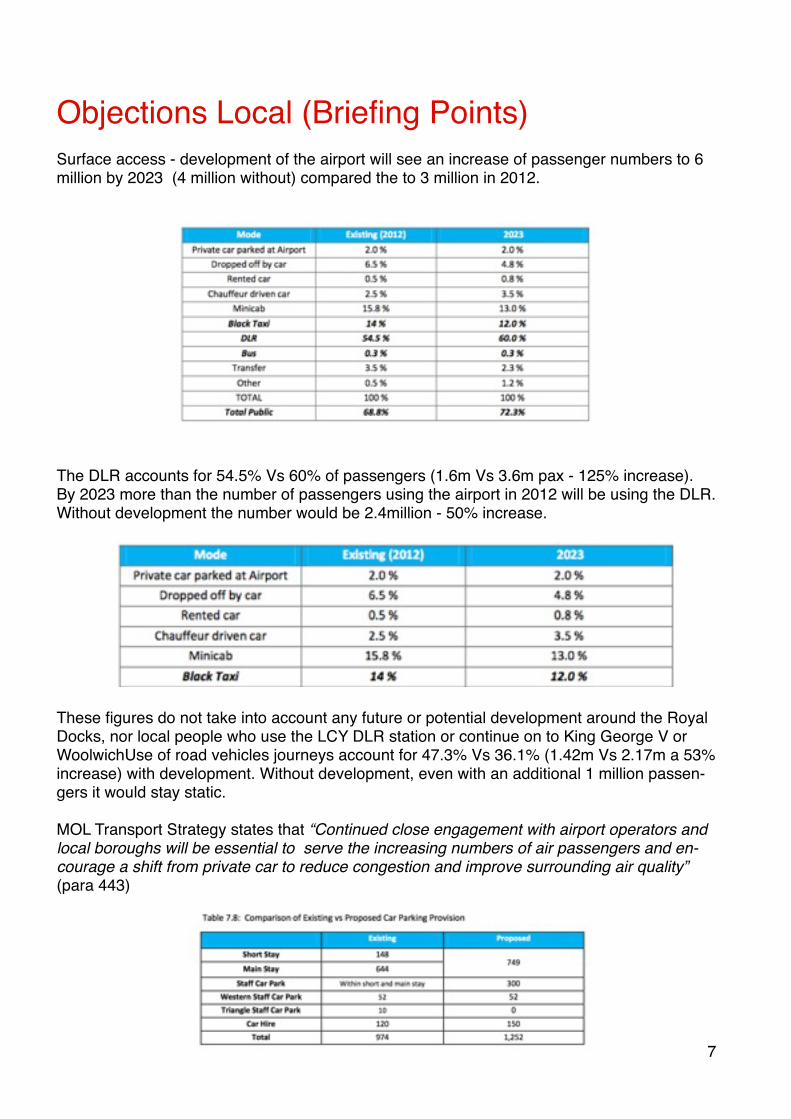
Objections Local (Briefing Points)!Surface access - development of the airport will see an increase of passenger numbers to 6 million by 2023 (4 million without) compared the to 3 million in 2012.
The DLR accounts for 54.5% Vs 60% of passengers (1.6m Vs 3.6m pax - 125% increase). By 2023 more than the number of passengers using the airport in 2012 will be using the DLR. Without development the number would be 2.4million - 50% increase.
These figures do not take into account any future or potential development around the Royal Docks, nor local people who use the LCY DLR station or continue on to King George V or WoolwichUse of road vehicles journeys account for 47.3% Vs 36.1% (1.42m Vs 2.17m a 53% increase) with development. Without development, even with an additional 1 million passen-gers it would stay static.
MOL Transport Strategy states that “Continued close engagement with airport operators and local boroughs will be essential to serve the increasing numbers of air passengers and en-courage a shift from private car to reduce congestion and improve surrounding air quality” (para 443)
7
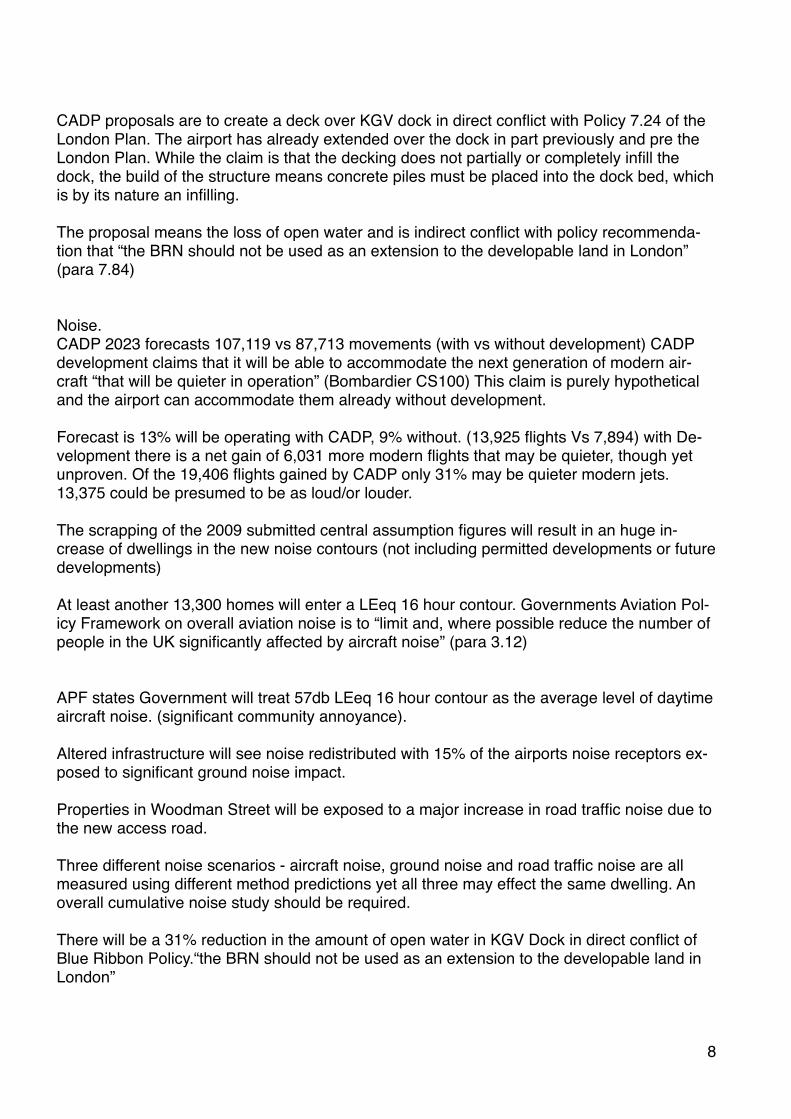
CADP proposals are to create a deck over KGV dock in direct conflict with Policy 7.24 of the London Plan. The airport has already extended over the dock in part previously and pre the London Plan. While the claim is that the decking does not partially or completely infill the dock, the build of the structure means concrete piles must be placed into the dock bed, which is by its nature an infilling.
The proposal means the loss of open water and is indirect conflict with policy recommenda-tion that “the BRN should not be used as an extension to the developable land in London” (para 7.84)
Noise.CADP 2023 forecasts 107,119 vs 87,713 movements (with vs without development) CADP development claims that it will be able to accommodate the next generation of modern air-craft “that will be quieter in operation” (Bombardier CS100) This claim is purely hypothetical and the airport can accommodate them already without development.
Forecast is 13% will be operating with CADP, 9% without. (13,925 flights Vs 7,894) with De-velopment there is a net gain of 6,031 more modern flights that may be quieter, though yet unproven. Of the 19,406 flights gained by CADP only 31% may be quieter modern jets. 13,375 could be presumed to be as loud/or louder.
The scrapping of the 2009 submitted central assumption figures will result in an huge in-crease of dwellings in the new noise contours (not including permitted developments or future developments)
At least another 13,300 homes will enter a LEeq 16 hour contour. Governments Aviation Pol-icy Framework on overall aviation noise is to “limit and, where possible reduce the number of people in the UK significantly affected by aircraft noise” (para 3.12)
APF states Government will treat 57db LEeq 16 hour contour as the average level of daytime aircraft noise. (significant community annoyance).
Altered infrastructure will see noise redistributed with 15% of the airports noise receptors ex-posed to significant ground noise impact.
Properties in Woodman Street will be exposed to a major increase in road traffic noise due to the new access road.
Three different noise scenarios - aircraft noise, ground noise and road traffic noise are all measured using different method predictions yet all three may effect the same dwelling. An overall cumulative noise study should be required.
There will be a 31% reduction in the amount of open water in KGV Dock in direct conflict of Blue Ribbon Policy.“the BRN should not be used as an extension to the developable land in London”
8

Objections Newham Council (Briefing Points)
National Planning Policy Framework (03/2102) (NPPF) is a material consideration in planning decisions and replaces most of previous national guidance.
It states that local planning authorities should approach decision making in a positive way to foster the delivery of sustainable development and decision makers should approve applica-tions for sustainable development where possible and local planning authorities should work proactively to secure developments that improve the economic, social and environmental conditions of an area (para 187)
Para 109 also states that “The planning system should contribute to and enhance the natural and local environment by protecting and enhancing valued landscapes, geological conserva-tion interests and soils.
Policy INF1 of Newham Core Strategy (01/2012) relates directly to London City Airport. It states that any proposals for future growth ant the airport above the approved 120,000 flight movements per annum will have to be carefully considered. The airport is acknowledged as a (current) key economic driver within the Royal Docks.
Policy S3 allocates the docks as a unique and high quality waterfront urban quarter.
Policy INF7 relates to the Blue Ribbon Network and states that the Royal Docks will be pro-tected and enhanced via the following measures; developments located adjacent to the BRN should enhance the waterside environment and provide access and improved amenity to the waterfront; natural habitats will be protected and enhanced; landscape character, heritage, views and linear nature of the network will be protected and enhanced; access to the BRN will be improved.
The Royal Docks Management Authority (RODMA) have adopted a development strategy for the next 15 years which it states its purpose is to shape the regeneration of the Royal Docks by putting the water assets first and, in doing so, increase the value of the land assets in the process.
The Mayor of London is one of the largest public sector landowners in London and, by de-fault, Londoners. 34 parcels of this land is in the Royal Docks and surrounding area and any increase in land value due to the RODMA development strategy will benefit London as a whole.
CADP proposal will support 910 direct onsite FTE jobs in 2023 overall.For every Hectare of the Royal Dock it covers, 70 jobs will be created be created. By com-parison the Chinese Business Hub opposite is of similar at 14 Hectares and it is estimated will created 20,000 jobs (1,428 jobs per hectare) Overall with development the airport will support approximately 48 jobs per ha vs 43 without.
The non statutory Royal Docks Parameters for Development Document that KGV dockside is a major opportunity site for development.
9

Objections National (Briefing Points)
The Airports Commission is currently reviewing aviation capacity in the South East. While the main trust of its report does not focus on smaller airports as London City Airport is in the South East it raises a number of issues. A Thames Estuary Airport would mean the closure of London City Airport (Source, NATS) and an enlarged Heathrow would mean increased air-craft movements of East London.
Governments Aviation Policy Framework on overall aviation noise is to “limit and, where pos-sible reduce the number of people in the UK significantly affected by aircraft noise” (para 3.12)
APF states Government will treat 57db LEeq 16 hour contour as the average level of daytime aircraft noise. (significant community annoyance) It also recommends use of average noise contours.
AVP 3.20 to 3.23 refer to land us planning and management and expects local planning poli-cies and decisions to ensure new development is appropriate for its location and the effects of pollution, including nose, on health and natural environment be taken into account.
National Planning Policy Framework (03/2102) (NPPF) is a material consideration in planning decisions and replaces most of previous national guidance.
NPPF Para. 6 and 7 state the purpose of the planning system is to contribute to the achievement of a sustainable development - economic, social, environmental. The presump-tion is in favour of sustainable development.
10

Objections Public Safety Zone (Briefing Points)Public Safety Zone DfT circular 01/2010
Development at the airport is currently controlled by the Public Safety Zone (Crash Zone) contours published by the DfT in 2010 based on the figures submitted by London City Airport.
PSZs are based upon airport operators’ projections of air traffic approximately 15 years ahead and they are updated on an approximately 7-year cycle. The CADP contours are larger than the published 2010 baseline.The change is due to the overall number of aircraft movements and type - particularly the split between scheduled and jet centre movements.
The airport based their 2009 expansion plans and received planning permission on the cen-tral assumption of 95,000 flights / 25,000 corporate jets. The CADP will change this to 107,119 scheduled flights by 2023 with 3920 corporate flights.
No noise categorisation for the 2023 fleet have been included. As required under the terms of the current Section 106 Agreement, a review of the current noise categorisation system is currently being undertaken with LBN to reassess the methodology, categories, noise refer-ence levels, noise factors and procedures for categorisation with the objective of providing further incentives for aircraft using the Airport to emit less noise. This planning application should not have been consulted on until the environmental statement could include the find-ings of this review.
11
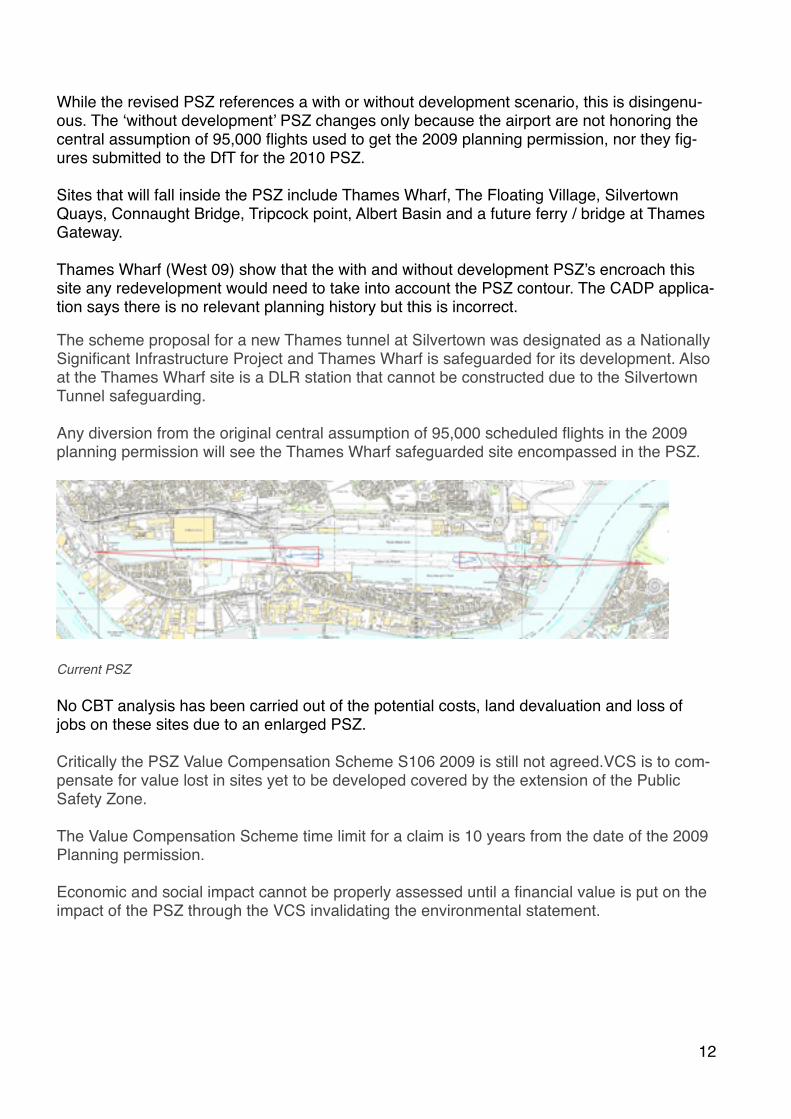
While the revised PSZ references a with or without development scenario, this is disingenu-ous. The ‘without development’ PSZ changes only because the airport are not honoring the central assumption of 95,000 flights used to get the 2009 planning permission, nor they fig-ures submitted to the DfT for the 2010 PSZ.
Sites that will fall inside the PSZ include Thames Wharf, The Floating Village, Silvertown Quays, Connaught Bridge, Tripcock point, Albert Basin and a future ferry / bridge at Thames Gateway.
Thames Wharf (West 09) show that the with and without development PSZ’s encroach this site any redevelopment would need to take into account the PSZ contour. The CADP applica-tion says there is no relevant planning history but this is incorrect.
The scheme proposal for a new Thames tunnel at Silvertown was designated as a Nationally Significant Infrastructure Project and Thames Wharf is safeguarded for its development. Also at the Thames Wharf site is a DLR station that cannot be constructed due to the Silvertown Tunnel safeguarding.
Any diversion from the original central assumption of 95,000 scheduled flights in the 2009 planning permission will see the Thames Wharf safeguarded site encompassed in the PSZ.
Current PSZ
No CBT analysis has been carried out of the potential costs, land devaluation and loss of jobs on these sites due to an enlarged PSZ.
Critically the PSZ Value Compensation Scheme S106 2009 is still not agreed.VCS is to com-pensate for value lost in sites yet to be developed covered by the extension of the Public Safety Zone.
The Value Compensation Scheme time limit for a claim is 10 years from the date of the 2009 Planning permission.
Economic and social impact cannot be properly assessed until a financial value is put on the impact of the PSZ through the VCS invalidating the environmental statement.
12

13

14

15

16

17

Alan Haughton
07909 907 395
22nd October 2013
Letter of Pre- Action in reference to 13/01228/FUL & 13/01373/OUT London City Airport.
Dear Sir/Madam,
cc London City Airportcc Jenny Bates, Friends of the Earthcc Local Government Ombudsmancc Information Commmissionercc Steve Quatermain, Chief Planner, Communities and Local Government
There are grave concerns in the community on how this consultation (13/01228/FUL & 13/01373/OUT London City Airport) has been carried out and the information given to members of the public.
You are no doubt aware, that it is a well established legal principle, that if a public authority has committed to consult, it must do so properly (see R v North East Devon Health Authority ex parte Coughlan (1999) (citing R v Brent LBC ex parte Gunning (1986)).
Confusion on dates
We note the following communications contain conflicting information as to the closing date for the consultation and are of the view that individuals cannot respond effectively to the consultation (because they do not know when their responses are required to be submitted – and in one case have been informed that the consultation has already closed).
Emails sent to consultees on Thursday, 26 September 2013 given 21 days to respond to the application making the closing date for comments 16/10/13.
Letters sent to consultees on 7th of October give a closing date of 28/10/13.
Public notification on lampposts dated the 7th of October give a closing date of 28/10/13.
All notifications direct consultees to the website to respond. It shows that the consultation closing date was the 14/10/13 and site notice expiry date was 16/10/13 not the 28/10/13 as stated on site notices. (Screenshot below dated Friday 18th Octo-ber 2013).
Please could you clarify under which regulations these different dates have been arrived at, and why the dates are inconsis-tent.
The Mayor of London has a statutory 6 week period to respond. The GLA state that the receipt date of notification was the 25th of September making the response closing date 05/11/13.
However the important dates on the application website states that the determination deadline is 25th of October 2013, a date before the Mayors statutory required date of response. Please clarify the legal basis under which the local authority has arrived at this determination date given it comes before the Mayor's response is due.
Extension to the consultation period
Given the conflicting information about the close of the consultation, and the impact this has on interested parties’ capacity to respond effectively to the consultation, I am formally requesting an extension to the consultation period [in order to clarify the confusion in the dates advertised] and allow people a fair opportunity to respond.
Given the confusion surrounding the date for the Mayor’s response, I request that the six week response time begins at this point too.
18
Of course, any responses already made to the consultation must be taken into account by the local authority before it re-sponds to the consultation.
The reasons for this are as follows:
• Any consultee who received the original notification by email has been instructed that the consultation is over and any chance of response expired. This is supported by dates advertised on the website. This is not the case.
• Anyone responding to letters and public notifications with a closing date of 28/10/13 will believe that the consultation ended on the website advertised date of the site notice expiry date on 16/10/13.
• The date of the Mayor of London’s statutory consultation period should have begun on 7th of October and closed 6 weeks thereafter.
• Nowhere on the planning application website or documentation does it actually say that the closing date for responses is the 28th of October 2013. Documentation Up until Monday the 14th of October 2012 “Transport Assessment Volume 1” was not available, instead giving a pop up error message. While it has now been rectified and moved from the first page of documentation to the sec-ond, anyone who responded online before the 14th had no access to this key document and hence could not com-ment on its findings. In addition, I understand a third party contacted you 25/09/13 regarding missing documentation online and specifi-cally asking for a CD Rom copy. A response was not returned until the 21/1013, a month later and after the third party believed the consultation had closed as advised by Newham.(16/10/13) A CD ROM has been offered by post from the 21/10/13 giving them a consultation period of less than seven days. I believe that the omission of a key document is a further reason why the extension to the consultation period must be granted.
Public Notification
Public notification on lamp posts dated the 7th of October give a closing date of 28/10/13.
Members of the public not responding online are invited to inspect copies of the Environmental Statement and other docu-ments are invited to Newham Dockside and asked to book an appointment to do so.
While it is acceptable for Newham residents to attend Dockside, it is not for residents of consultee boroughs like Tower Ham-lets and Waltham Forest. The belief that they have to trek to Newham, in some cases at great financial cost, deters people from viewing the documentation and responding. It also discriminates against those from other boroughs.
I attended Newham Dockside at 2pm on 10th October to view the hard copies. I did not have an appointment but did email the case officer from the site. I was refused viewing of the documents and was told the case officer was not available. I was told that the only hard copy was in Newham Building 1000.
I requested an appointment again on 11th October. I had a response from the case officer directing me to a hardcopy avail-able in Chrisp Street Tower Hamlets and another in Woolwich. I have not yet being given an appointment to view the hard copy in Newham as required on the Notice of Application and as requested by myself.
Documents referenced like the London Plan and Newham Core strategy are not with the application online nor available in hard copy form at the Idea Store Chrisp Street. Having attended on Saturday 19th of October I was informed it was unavail-able.
I have requested a full list of places where the hard copy is available for the public to view but have failed to get a response. I am not aware of any publicly available accurate information about the locations at which the Environmental Statement may be inspected.
19

As a resident of Tower Hamlets, and residents of all consultee boroughs, should not be expected to view an application in another borough. Information about the locations at which the statement may be inspected should be publicly available and accurate.
Emails sent to Tower Hamlets consultees and myself on Thursday, 26 September 2013 did not have access to a local hard-copy.
Again, this underlines the need for an extension to the consultation period, so that that hard copies can be made available in an efficient manner.
I am also requesting that all new Notice of Applications have details of a corresponding hard copy to view in the borough where advertised. All should include times and locations for anyone wishing to view the documents, including Newham resi-dents who should not be required to make an appointment.
Prohibitive costs.
The request for fees of £300 for a hard copy are prohibitive and financially discriminatory especially in Tower Hamlets the poorest borough in London.
EIA regulations require that the developer must make available copies of the ES at a reasonable cost. Environmental Infor-mation Regulations 2004 means that the public can obtain copies of the document at no more than the cost of photocopying which, even at retail prices, amounts to no more than £60 for the 653 page document.
This is another reason for the requested extension to be made - together with revised fees reflecting the true cost of the hard copy and reflecting the poverty of those being asked to respond.
Disability Discrimination Act.
Responding online is prohibitive to those with a disability. It is impossible to register your objection if you were blind or par-tially sighted, had limited motion or learning difficulties.
Libraries and public bodies have the proper resources and utilities to help in these cases which is why hard copies must be available and advertised locally.
I believe that while the Newham Council has committed to consult, it has not done so properly as required in the case cited above.
Yours faithfully,
Alan Haughton
20