APPLIANCE OF GRAPH MODELS TO ASCERTAIN SOCIAL NETWORK IN PRI SYSTEM
10
I.J.E.M.S., VOL.3 (4) 2012:490-499 ISSN 2229-600X 490 APPLIANCE OF GRAPH MODELS TO ASCERTAIN SOCIAL NETWORK IN PRI SYSTEM Pal Sanjay Kumar, Sarkar Krishnendu & Debnath Aditi Department of Computer Applications, NSHM College of Management and Technology, Kolkata, ABSTRACT Graphs have huge contributions towards the performance upgrading aspect of social network. Some major contributors are Regular, Pascal, complete, bipartite etc. They had been studied a lot and different new characteristics were always a part of research outcome. As per requirement of interconnection network it is equivalent that suitable graphs can represent the physical and logical layout very efficiently. In this present study Pascal graph and Regular graph are researched again and have been implemented in creating social network between blocks and grampanchyats in PRI system. A numerous graph models have emerged with potentials to be used for the purpose but the new properties of the mentioned graphs are guaranteed to make an everlasting mark towards the reliability to be used as a substantial contributor for networking topology over others. The review of current research emphasizes three strands on social networks. The first strand composed of endogenous network models formed from both the economics and the computer science is highlighting the sensitive dependence of the topology on parameters of the behavioral models employed. The second strand draws from the recent econophysics literature reviewing the recent interest in the random graph theory and also allowing a mathematical tool to study social networks resulting from uncoordinated random action in setting up connections with others. The third strand focuses on a specific model of social networks where random graphs with different dependent edges are present, if edges are incident to the same node, and independent, otherwise. The experiential study reveals that these exclusive dynamic models keep the networks strongly interconnected without possibility of losing data. Thus the present paper is attempting to analyze the benefits of the network structure models and concludes with an assessment of observable consequences of optimizing behavior in networks for the purpose of estimation. KEYWORDS: Pascal Graph, Regular Graph, Social Network, PRI, Block, Grampanchayats INTRODUCTION The powerful combinational methods of graph theory are used to prove fundamental results in other areas of pure mathematics. While searching for a class of graphs with certain desired properties to be used as computer networks, we have found graphs that come close to being optimal. Let G = (V, E) be a graph without loops where V and E is denoted as vertices and edges respectively. One of the desired properties is that the design be simple and recursive. The inspiration of this study stemmed from consistent urge to contribute substantially in this crescendo of research from the perspective of computer network topology. We have reviewed to its characteristics and established a significant property with adequate theoretical practical support. The technique and algorithms here proposed can be used not only in the design of computer networks, but also in the design of other social network. The current work deals with the dilemma of regional balance, differentness and effectual communication. It is seen in terms of inter-block disparities. The stress has been given to determine the levels of rearwardness in terms of economics performance, social and educational factors. To eliminate this backwardness it is essential to build up appropriate intra-block communication scheme for better communiqué between the backward areas. The administration, the biggest creator of enormous quantity of competent information and records is of paramount importance. Due to the initiation of information and communication technology (ICT), the e-government applications are being executed to progress government functioning by utilizing ICT potential. In order to meet government data needs resourcefully and effectively, the proper networking as well as databases need to be designed conforming to standard database design principles. The accomplishment of e-governance will implement in better and faster communication of data in the blocks and its lower level [2]. This new networking model will help in performing e-governance fruitfully in the greater number of blocks under every Zilla-Parisad. TERMINOLOGY Graph An undirected, simple, connected graph G is an ordered triple (V (G), E (G), f) consist of a non empty set of vertices ∈ of the graph G a set of edges ∈ of graph G A mapping f from the set of edges E to a set of unordered pair of elements of V. Topology Topology is the configuration of network screening the connection of one communicating device to others. It may be static and dynamic. Dynamic topologies are efficient but circuitry is complicated and costlier.
Transcript of APPLIANCE OF GRAPH MODELS TO ASCERTAIN SOCIAL NETWORK IN PRI SYSTEM
I.J.E.M.S., VOL.3 (4) 2012:490-499 ISSN 2229-600X
490
APPLIANCE OF GRAPH MODELS TO ASCERTAIN SOCIAL NETWORKIN PRI SYSTEM
Pal Sanjay Kumar, Sarkar Krishnendu & Debnath AditiDepartment of Computer Applications, NSHM College of Management and Technology, Kolkata,
ABSTRACTGraphs have huge contributions towards the performance upgrading aspect of social network. Some major contributors areRegular, Pascal, complete, bipartite etc. They had been studied a lot and different new characteristics were always a part ofresearch outcome. As per requirement of interconnection network it is equivalent that suitable graphs can represent thephysical and logical layout very efficiently. In this present study Pascal graph and Regular graph are researched again andhave been implemented in creating social network between blocks and grampanchyats in PRI system. A numerous graphmodels have emerged with potentials to be used for the purpose but the new properties of the mentioned graphs areguaranteed to make an everlasting mark towards the reliability to be used as a substantial contributor for networkingtopology over others. The review of current research emphasizes three strands on social networks. The first strandcomposed of endogenous network models formed from both the economics and the computer science is highlighting thesensitive dependence of the topology on parameters of the behavioral models employed. The second strand draws from therecent econophysics literature reviewing the recent interest in the random graph theory and also allowing a mathematicaltool to study social networks resulting from uncoordinated random action in setting up connections with others. The thirdstrand focuses on a specific model of social networks where random graphs with different dependent edges are present, ifedges are incident to the same node, and independent, otherwise. The experiential study reveals that these exclusivedynamic models keep the networks strongly interconnected without possibility of losing data. Thus the present paper isattempting to analyze the benefits of the network structure models and concludes with an assessment of observableconsequences of optimizing behavior in networks for the purpose of estimation.
KEYWORDS: Pascal Graph, Regular Graph, Social Network, PRI, Block, Grampanchayats
INTRODUCTIONThe powerful combinational methods of graph theory areused to prove fundamental results in other areas of puremathematics. While searching for a class of graphs withcertain desired properties to be used as computernetworks, we have found graphs that come close to beingoptimal. Let G = (V, E) be a graph without loops where Vand E is denoted as vertices and edges respectively. One ofthe desired properties is that the design be simple andrecursive. The inspiration of this study stemmed fromconsistent urge to contribute substantially in this crescendoof research from the perspective of computer networktopology. We have reviewed to its characteristics andestablished a significant property with adequate theoreticalpractical support. The technique and algorithms hereproposed can be used not only in the design of computernetworks, but also in the design of other social network.
The current work deals with the dilemma of regionalbalance, differentness and effectual communication. It isseen in terms of inter-block disparities. The stress has beengiven to determine the levels of rearwardness in terms ofeconomics performance, social and educational factors. Toeliminate this backwardness it is essential to build upappropriate intra-block communication scheme for bettercommuniqué between the backward areas. Theadministration, the biggest creator of enormous quantity ofcompetent information and records is of paramount
importance. Due to the initiation of information andcommunication technology (ICT), the e-governmentapplications are being executed to progress governmentfunctioning by utilizing ICT potential. In order to meetgovernment data needs resourcefully and effectively, theproper networking as well as databases need to bedesigned conforming to standard database designprinciples.
The accomplishment of e-governance will implementin better and faster communication of data in the blocksand its lower level [2]. This new networking model willhelp in performing e-governance fruitfully in the greaternumber of blocks under every Zilla-Parisad.
TERMINOLOGYGraphAn undirected, simple, connected graph G is an orderedtriple (V (G), E (G), f) consist of a non empty set of vertices ∈ of the graph G a set of edges ∈ of graph G A mapping f from the set of edges E to a set of
unordered pair of elements of V.TopologyTopology is the configuration of network screening theconnection of one communicating device to others. It maybe static and dynamic. Dynamic topologies are efficientbut circuitry is complicated and costlier.
Graph models to ascertain social network
491
NetworkA network is a group of allied, communicated devicessuch as computers, and switches. An internet is themishmash of two or more networks that arecommunicating with each other. The internet today is nota simple hierarchical structure but it is made up of wideand local area networks joined by connecting devices andswitching stations. Therefore an internet is nothing but“the network of networks i.e. Super-network [12].”Social Network AnalysisSocial network analysis (SNA) is the methodical analysisof social networks. Social network analysis views socialrelationships in terms of network theory, consistingof nodes (representing individual actors within thenetwork) and ties (which represent relationships betweenthe individuals, such as friendship, kinship, organizationalposition, sexual relationships, etc). These networks areoften depicted in a social network diagram, where nodesare represented as points and ties are represented as lines.PRIPRI (Panchayati Raj Institution): It is the grass root unit ofself government. It has been decreed as the medium ofsocio-economic transformation in rural India. With theprologue of three tiers Panchayati Raj System, everyvillage aims to be a democratic system and the powers ofpanchayats has been conveyed into veracity.Levels in PRI:
Zilla Parishad (district Level) Panchayat Samiti (block level) Grampanchayats (village level)
Regular GraphIn graph theory, a regular graph is a graph where eachvertex has the same number of neighbors; i.e. every vertexhas the same degree or valency. A regular directedgraph must also satisfy the stronger condition thatthe indegree and outdegree of each vertex are equal toeach other. A regular graph with vertices of degree k iscalled a k-regular graph or regular graph of degree k. Aregular graph is a graph without loops and multiple edges.A graph is regular if the number of edges incident with avertex is constant. This constant is called the valency, orthe degree of the graph.Pascal GraphAn undirected graph of n vertices analogous to PM (n) asan adjacency matrix is called Pascal Graph (n), where n isthe order of the Pascal graph.RoutingRouting is the procedure of moving packets acrossa network from one host to an. It is usually executed byfanatical devices called routers [12]. Routing [14] is a keyaspect of the Internet and it, together with a great deal ofdeliberate redundancy of high capacity transmission lines(e.g., optical fiber cable and microwave), is a key factor inthe robustness (i.e., resistance to equipment failure) of theInternet.Network RobustnessThe structural robustness of networks is studiedusing percolation theory. When a critical fraction of nodesis removed the network becomes fragmented into smallclusters. This phenomenon is called percolation and itrepresents an order-disorder type of phasetransition with critical exponents.
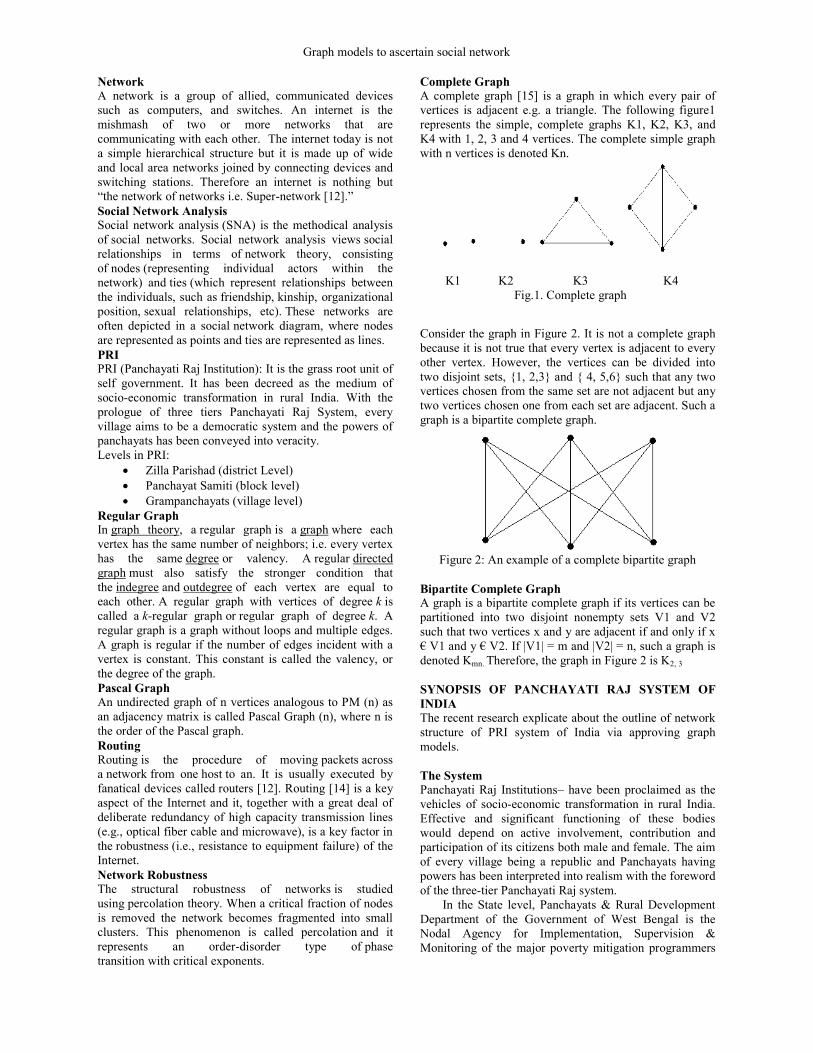
Complete GraphA complete graph [15] is a graph in which every pair ofvertices is adjacent e.g. a triangle. The following figure1represents the simple, complete graphs K1, K2, K3, andK4 with 1, 2, 3 and 4 vertices. The complete simple graphwith n vertices is denoted Kn.
Consider the graph in Figure 2. It is not a complete graphbecause it is not true that every vertex is adjacent to everyother vertex. However, the vertices can be divided intotwo disjoint sets, {1, 2,3} and { 4, 5,6} such that any twovertices chosen from the same set are not adjacent but anytwo vertices chosen one from each set are adjacent. Such agraph is a bipartite complete graph.
Figure 2: An example of a complete bipartite graph
Bipartite Complete GraphA graph is a bipartite complete graph if its vertices can bepartitioned into two disjoint nonempty sets V1 and V2such that two vertices x and y are adjacent if and only if x€ V1 and y € V2. If |V1| = m and |V2| = n, such a graph isdenoted Kmn. Therefore, the graph in Figure 2 is K2, 3
SYNOPSIS OF PANCHAYATI RAJ SYSTEM OFINDIAThe recent research explicate about the outline of networkstructure of PRI system of India via approving graphmodels.
The SystemPanchayati Raj Institutions– have been proclaimed as thevehicles of socio-economic transformation in rural India.Effective and significant functioning of these bodieswould depend on active involvement, contribution andparticipation of its citizens both male and female. The aimof every village being a republic and Panchayats havingpowers has been interpreted into realism with the forewordof the three-tier Panchayati Raj system.
In the State level, Panchayats & Rural DevelopmentDepartment of the Government of West Bengal is theNodal Agency for Implementation, Supervision &Monitoring of the major poverty mitigation programmers
K1 K2 K3 K4Fig.1. Complete graph
I.J.E.M.S., VOL.3 (4) 2012:490-499 ISSN 2229-600X
492
in the rural areas of this State. At the District-level, ZillaParishad is the implementing agency for the same.
Under three-tier system of democratic delegation, ZillaParishad is the zenith body at the district level followed by
Panchayat Samitis at Block level as second-tier andGrampanchayats.
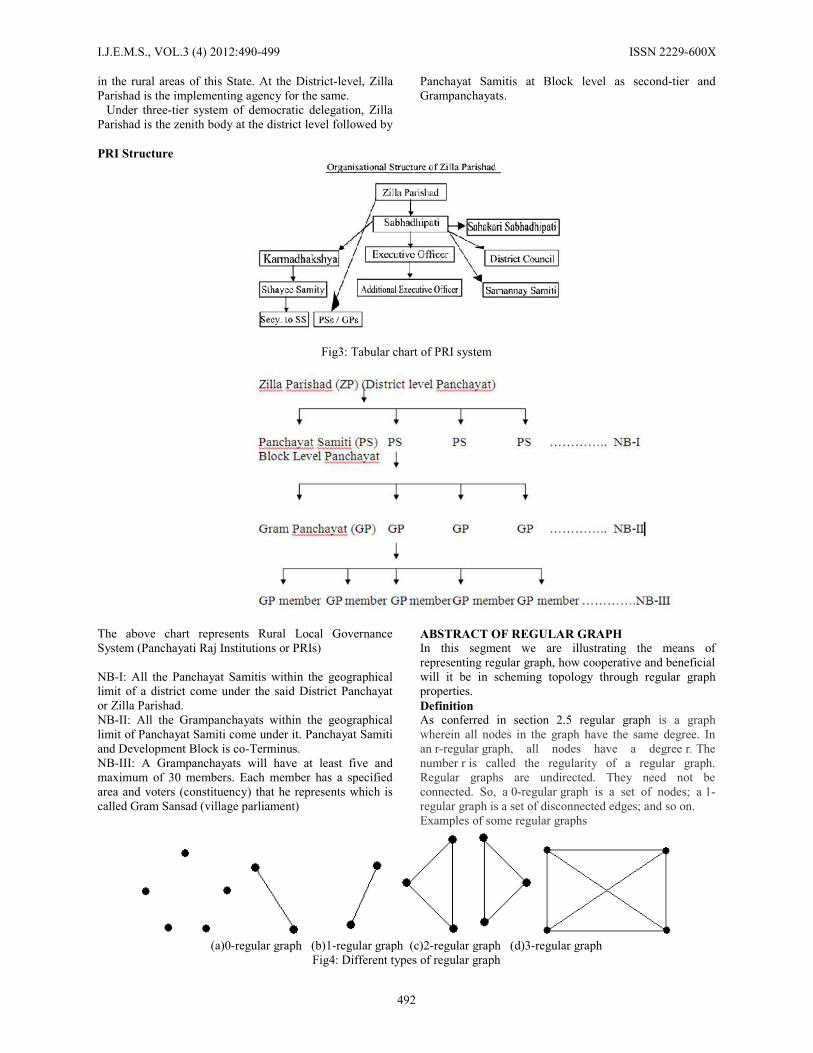
PRI Structure
Fig3: Tabular chart of PRI system
The above chart represents Rural Local GovernanceSystem (Panchayati Raj Institutions or PRIs)
NB-I: All the Panchayat Samitis within the geographicallimit of a district come under the said District Panchayator Zilla Parishad.NB-II: All the Grampanchayats within the geographicallimit of Panchayat Samiti come under it. Panchayat Samitiand Development Block is co-Terminus.NB-III: A Grampanchayats will have at least five andmaximum of 30 members. Each member has a specifiedarea and voters (constituency) that he represents which iscalled Gram Sansad (village parliament)
ABSTRACT OF REGULAR GRAPHIn this segment we are illustrating the means ofrepresenting regular graph, how cooperative and beneficialwill it be in scheming topology through regular graphproperties.DefinitionAs conferred in section 2.5 regular graph is a graphwherein all nodes in the graph have the same degree. Inan r-regular graph, all nodes have a degree r. Thenumber r is called the regularity of a regular graph.Regular graphs are undirected. They need not beconnected. So, a 0-regular graph is a set of nodes; a 1-regular graph is a set of disconnected edges; and so on.Examples of some regular graphs
(a)0-regular graph (b)1-regular graph (c)2-regular graph (d)3-regular graphFig4: Different types of regular graph
Graph models to ascertain social network
493
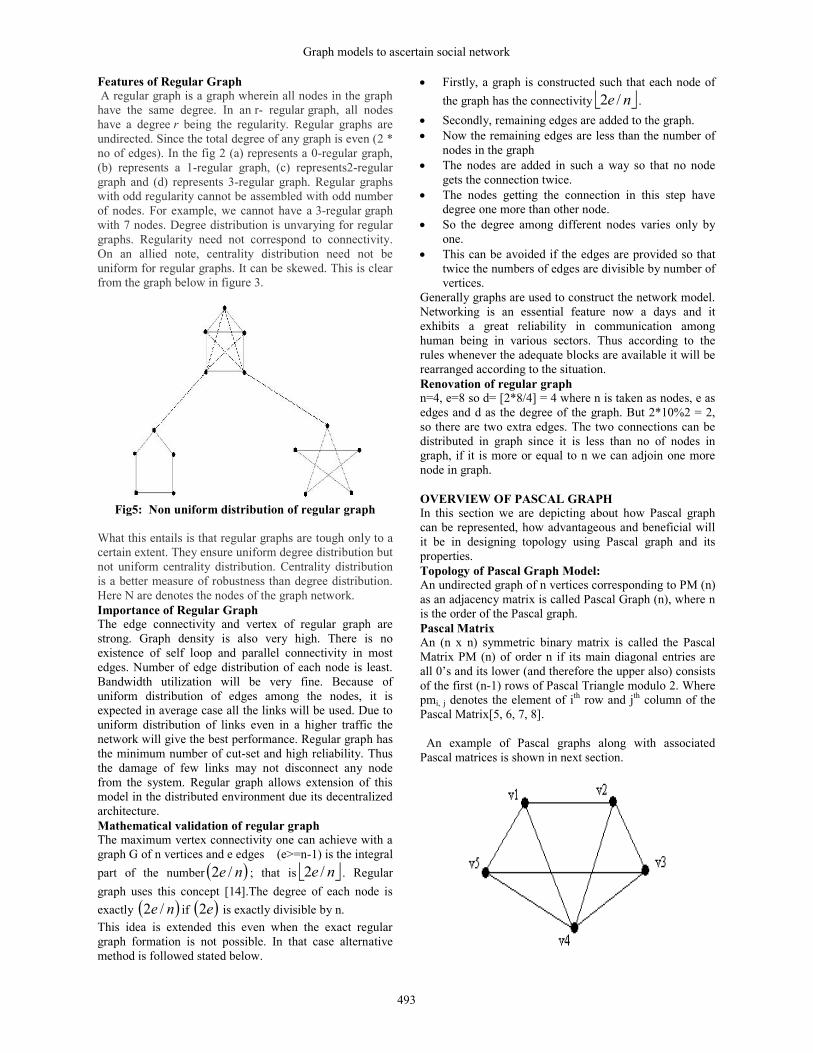
Features of Regular GraphA regular graph is a graph wherein all nodes in the graph
have the same degree. In an r- regular graph, all nodeshave a degree r being the regularity. Regular graphs areundirected. Since the total degree of any graph is even (2 *no of edges). In the fig 2 (a) represents a 0-regular graph,(b) represents a 1-regular graph, (c) represents2-regulargraph and (d) represents 3-regular graph. Regular graphswith odd regularity cannot be assembled with odd numberof nodes. For example, we cannot have a 3-regular graphwith 7 nodes. Degree distribution is unvarying for regulargraphs. Regularity need not correspond to connectivity.On an allied note, centrality distribution need not beuniform for regular graphs. It can be skewed. This is clearfrom the graph below in figure 3.
Fig5: Non uniform distribution of regular graph
What this entails is that regular graphs are tough only to acertain extent. They ensure uniform degree distribution butnot uniform centrality distribution. Centrality distributionis a better measure of robustness than degree distribution.Here N are denotes the nodes of the graph network.Importance of Regular GraphThe edge connectivity and vertex of regular graph arestrong. Graph density is also very high. There is noexistence of self loop and parallel connectivity in mostedges. Number of edge distribution of each node is least.Bandwidth utilization will be very fine. Because ofuniform distribution of edges among the nodes, it isexpected in average case all the links will be used. Due touniform distribution of links even in a higher traffic thenetwork will give the best performance. Regular graph hasthe minimum number of cut-set and high reliability. Thusthe damage of few links may not disconnect any nodefrom the system. Regular graph allows extension of thismodel in the distributed environment due its decentralizedarchitecture.Mathematical validation of regular graphThe maximum vertex connectivity one can achieve with agraph G of n vertices and e edges (e>=n-1) is the integralpart of the number ne /2 ; that is ne /2 . Regulargraph uses this concept [14].The degree of each node isexactly ne /2 if e2 is exactly divisible by n.This idea is extended this even when the exact regulargraph formation is not possible. In that case alternativemethod is followed stated below.
Firstly, a graph is constructed such that each node ofthe graph has the connectivity ne /2 .
Secondly, remaining edges are added to the graph. Now the remaining edges are less than the number of
nodes in the graph The nodes are added in such a way so that no node
gets the connection twice. The nodes getting the connection in this step have
degree one more than other node. So the degree among different nodes varies only by
one. This can be avoided if the edges are provided so that
twice the numbers of edges are divisible by number ofvertices.
Generally graphs are used to construct the network model.Networking is an essential feature now a days and itexhibits a great reliability in communication amonghuman being in various sectors. Thus according to therules whenever the adequate blocks are available it will berearranged according to the situation.Renovation of regular graphn=4, e=8 so d= [2*8/4] = 4 where n is taken as nodes, e asedges and d as the degree of the graph. But 2*10%2 = 2,so there are two extra edges. The two connections can bedistributed in graph since it is less than no of nodes ingraph, if it is more or equal to n we can adjoin one morenode in graph.
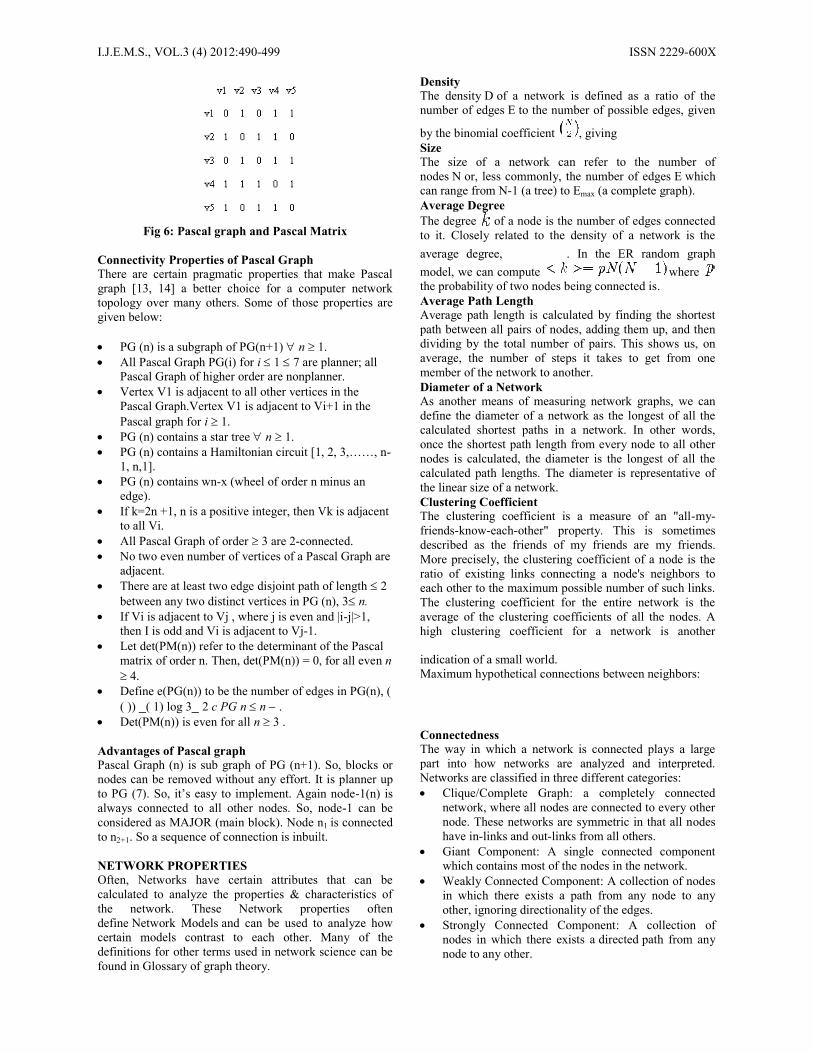
OVERVIEW OF PASCAL GRAPHIn this section we are depicting about how Pascal graphcan be represented, how advantageous and beneficial willit be in designing topology using Pascal graph and itsproperties.Topology of Pascal Graph Model:An undirected graph of n vertices corresponding to PM (n)as an adjacency matrix is called Pascal Graph (n), where nis the order of the Pascal graph.Pascal MatrixAn (n x n) symmetric binary matrix is called the PascalMatrix PM (n) of order n if its main diagonal entries areall 0’s and its lower (and therefore the upper also) consistsof the first (n-1) rows of Pascal Triangle modulo 2. Wherepmi, j denotes the element of ith row and jth column of thePascal Matrix[5, 6, 7, 8].
An example of Pascal graphs along with associatedPascal matrices is shown in next section.
I.J.E.M.S., VOL.3 (4) 2012:490-499 ISSN 2229-600X
494
Fig 6: Pascal graph and Pascal Matrix
Connectivity Properties of Pascal GraphThere are certain pragmatic properties that make Pascalgraph [13, 14] a better choice for a computer networktopology over many others. Some of those properties aregiven below:
PG (n) is a subgraph of PG(n+1) n 1. All Pascal Graph PG(i) for i 1 7 are planner; all
Pascal Graph of higher order are nonplanner. Vertex V1 is adjacent to all other vertices in the
Pascal Graph.Vertex V1 is adjacent to Vi+1 in thePascal graph for i 1.
PG (n) contains a star tree n 1. PG (n) contains a Hamiltonian circuit [1, 2, 3,……, n-
1, n,1]. PG (n) contains wn-x (wheel of order n minus an
edge). If k=2n +1, n is a positive integer, then Vk is adjacent
to all Vi. All Pascal Graph of order 3 are 2-connected. No two even number of vertices of a Pascal Graph are
adjacent. There are at least two edge disjoint path of length 2
between any two distinct vertices in PG (n), 3n. If Vi is adjacent to Vj , where j is even and |i-j|>1,
then I is odd and Vi is adjacent to Vj-1. Let det(PM(n)) refer to the determinant of the Pascal
matrix of order n. Then, det(PM(n)) = 0, for all even n4.
Define e(PG(n)) to be the number of edges in PG(n), (( )) _( 1) log 3_ 2 c PG n n .
Det(PM(n)) is even for all n 3 .
Advantages of Pascal graphPascal Graph (n) is sub graph of PG (n+1). So, blocks ornodes can be removed without any effort. It is planner upto PG (7). So, it’s easy to implement. Again node-1(n) isalways connected to all other nodes. So, node-1 can beconsidered as MAJOR (main block). Node n1 is connectedto n2+1. So a sequence of connection is inbuilt.
NETWORK PROPERTIESOften, Networks have certain attributes that can becalculated to analyze the properties & characteristics ofthe network. These Network properties oftendefine Network Models and can be used to analyze howcertain models contrast to each other. Many of thedefinitions for other terms used in network science can befound in Glossary of graph theory.
DensityThe density D of a network is defined as a ratio of thenumber of edges E to the number of possible edges, given
by the binomial coefficient , givingSizeThe size of a network can refer to the number ofnodes N or, less commonly, the number of edges E whichcan range from N-1 (a tree) to Emax (a complete graph).Average DegreeThe degree of a node is the number of edges connectedto it. Closely related to the density of a network is theaverage degree, . In the ER random graphmodel, we can compute wherethe probability of two nodes being connected is.Average Path LengthAverage path length is calculated by finding the shortestpath between all pairs of nodes, adding them up, and thendividing by the total number of pairs. This shows us, onaverage, the number of steps it takes to get from onemember of the network to another.Diameter of a NetworkAs another means of measuring network graphs, we candefine the diameter of a network as the longest of all thecalculated shortest paths in a network. In other words,once the shortest path length from every node to all othernodes is calculated, the diameter is the longest of all thecalculated path lengths. The diameter is representative ofthe linear size of a network.Clustering CoefficientThe clustering coefficient is a measure of an "all-my-friends-know-each-other" property. This is sometimesdescribed as the friends of my friends are my friends.More precisely, the clustering coefficient of a node is theratio of existing links connecting a node's neighbors toeach other to the maximum possible number of such links.The clustering coefficient for the entire network is theaverage of the clustering coefficients of all the nodes. Ahigh clustering coefficient for a network is another
indication of a small world.Maximum hypothetical connections between neighbors:
ConnectednessThe way in which a network is connected plays a largepart into how networks are analyzed and interpreted.Networks are classified in three different categories: Clique/Complete Graph: a completely connected
network, where all nodes are connected to every othernode. These networks are symmetric in that all nodeshave in-links and out-links from all others.
Giant Component: A single connected componentwhich contains most of the nodes in the network.
Weakly Connected Component: A collection of nodesin which there exists a path from any node to anyother, ignoring directionality of the edges.
Strongly Connected Component: A collection ofnodes in which there exists a directed path from anynode to any other.
Graph models to ascertain social network
495
Node CentralityNode centrality can be viewed as a measure of influenceor importance in a network model. There exist three mainmeasures of Centrality that are studied in NetworkScience. Closeness: represents the average distance that each
node is from all other nodes in the network Betweeness: represents the number of shortest paths
in a network that traverse through that node Degree/Strength: represents the amount links that a
particular node possesses in a network. In a directednetwork, one must differentiate between in-links andout links by calculating in-degree and out-degree. Theanalogue to degree in a weighted network, strength isthe sum of a node's edge weights. In-strength and out-strength are analogously defined for directednetworks.
MODELING AND VISUALIZATION OFNETWORKSVisual representation of social networks is important tounderstand the network data and convey the result of theanalysis. Many of the analytic software have modules fornetwork visualization. Exploration of the data is donethrough displaying nodes and ties in various layouts, andattributing colors, size and other advanced properties tonodes. Visual representations of networks may be apowerful method for conveying complex information, butcare should be taken in interpreting node and graphproperties from visual displays alone, as they maymisrepresent structural properties better captured throughquantitative analyses.Collaboration graphs can be used to illustrate good andbad relationships between humans. A positive edgebetween two nodes denotes a positive relationship(friendship, alliance, dating) and a negative edge betweentwo nodes denotes a negative relationship (hatred, anger).Signed social network graphs can be used to predict thefuture evolution of the graph. In signed social networks,there is the concept of "balanced" and "unbalanced"cycles. A balanced cycle is defined as a cycle where theproduct of all the signs is positive. Balanced graphsrepresent a group of people who are unlikely to changetheir opinions of the other people in the group.Unbalanced graphs represent a group of people who arevery likely to change their opinions of the people in theirgroup. For example, a group of 3 people (A, B, and C)where A and B have a positive relationship, B and C havea positive relationship, but C and A have a negativerelationship is an unbalanced cycle. This group is verylikely to morph into a balanced cycle, such as one where Bonly has a good relationship with A and both A and Bhave a negative relationship with C. By using the conceptof balances and unbalanced cycles, the evolutionof signed social network graphs can be predicted.Especially when using social network analysis as a tool forfacilitating change, different approaches of participatorynetwork mapping have proven useful. Here participants /interviewers provide network data by actually mapping outthe network (with pen and paper or digitally) during thedata collection session. One benefit of this approach is thatit allows researchers to collect qualitative data and ask
clarifying questions while the network data iscollected.[2,4]
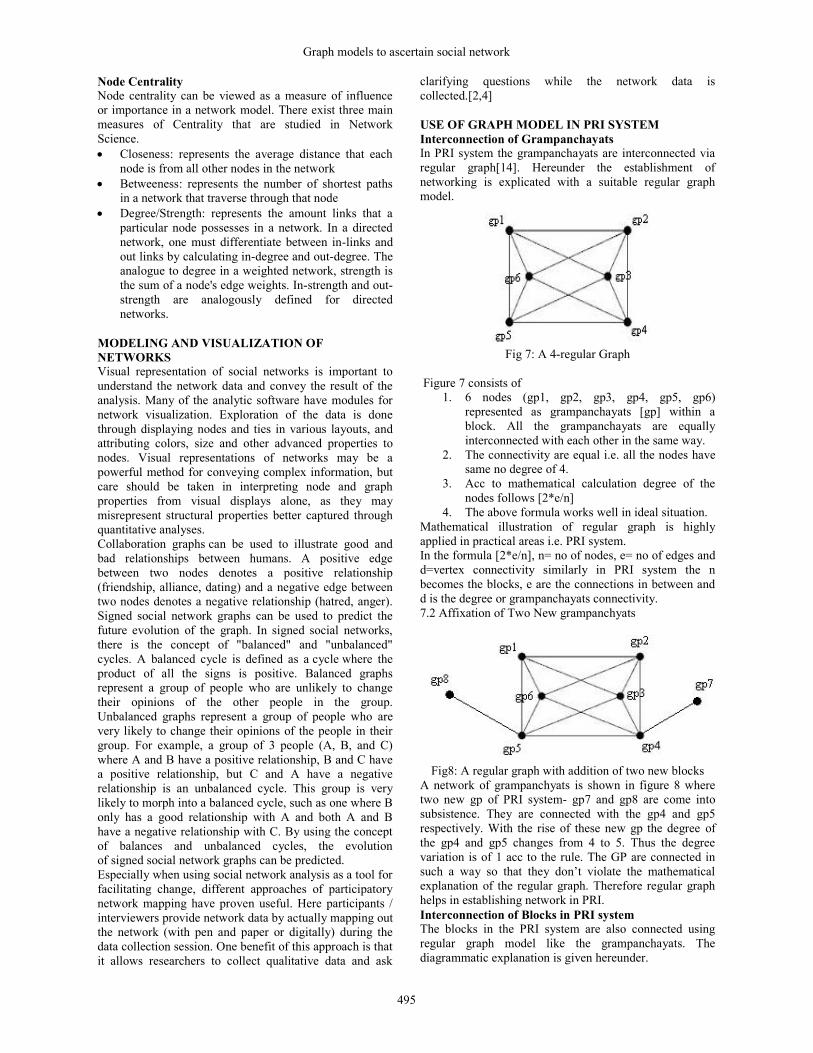
USE OF GRAPH MODEL IN PRI SYSTEMInterconnection of GrampanchayatsIn PRI system the grampanchayats are interconnected viaregular graph[14]. Hereunder the establishment ofnetworking is explicated with a suitable regular graphmodel.
Fig 7: A 4-regular Graph
Figure 7 consists of1. 6 nodes (gp1, gp2, gp3, gp4, gp5, gp6)
represented as grampanchayats [gp] within ablock. All the grampanchayats are equallyinterconnected with each other in the same way.
2. The connectivity are equal i.e. all the nodes havesame no degree of 4.
3. Acc to mathematical calculation degree of thenodes follows [2*e/n]
4. The above formula works well in ideal situation.Mathematical illustration of regular graph is highlyapplied in practical areas i.e. PRI system.In the formula [2*e/n], n= no of nodes, e= no of edges andd=vertex connectivity similarly in PRI system the nbecomes the blocks, e are the connections in between andd is the degree or grampanchayats connectivity.7.2 Affixation of Two New grampanchyats
Fig8: A regular graph with addition of two new blocksA network of grampanchyats is shown in figure 8 wheretwo new gp of PRI system- gp7 and gp8 are come intosubsistence. They are connected with the gp4 and gp5respectively. With the rise of these new gp the degree ofthe gp4 and gp5 changes from 4 to 5. Thus the degreevariation is of 1 acc to the rule. The GP are connected insuch a way so that they don’t violate the mathematicalexplanation of the regular graph. Therefore regular graphhelps in establishing network in PRI.Interconnection of Blocks in PRI systemThe blocks in the PRI system are also connected usingregular graph model like the grampanchayats. Thediagrammatic explanation is given hereunder.
I.J.E.M.S., VOL.3 (4) 2012:490-499 ISSN 2229-600X
496
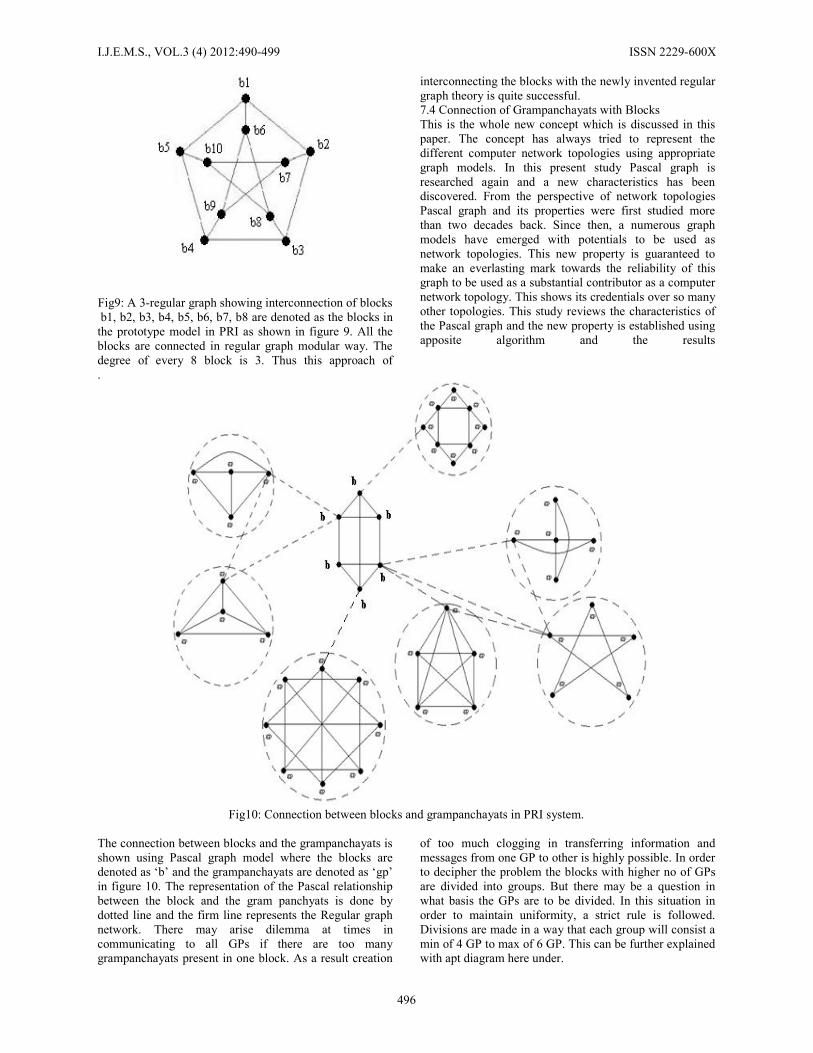
Fig9: A 3-regular graph showing interconnection of blocksb1, b2, b3, b4, b5, b6, b7, b8 are denoted as the blocks in
the prototype model in PRI as shown in figure 9. All theblocks are connected in regular graph modular way. Thedegree of every 8 block is 3. Thus this approach of
interconnecting the blocks with the newly invented regulargraph theory is quite successful.7.4 Connection of Grampanchayats with BlocksThis is the whole new concept which is discussed in thispaper. The concept has always tried to represent thedifferent computer network topologies using appropriategraph models. In this present study Pascal graph isresearched again and a new characteristics has beendiscovered. From the perspective of network topologiesPascal graph and its properties were first studied morethan two decades back. Since then, a numerous graphmodels have emerged with potentials to be used asnetwork topologies. This new property is guaranteed tomake an everlasting mark towards the reliability of thisgraph to be used as a substantial contributor as a computernetwork topology. This shows its credentials over so manyother topologies. This study reviews the characteristics ofthe Pascal graph and the new property is established usingapposite algorithm and the results
.
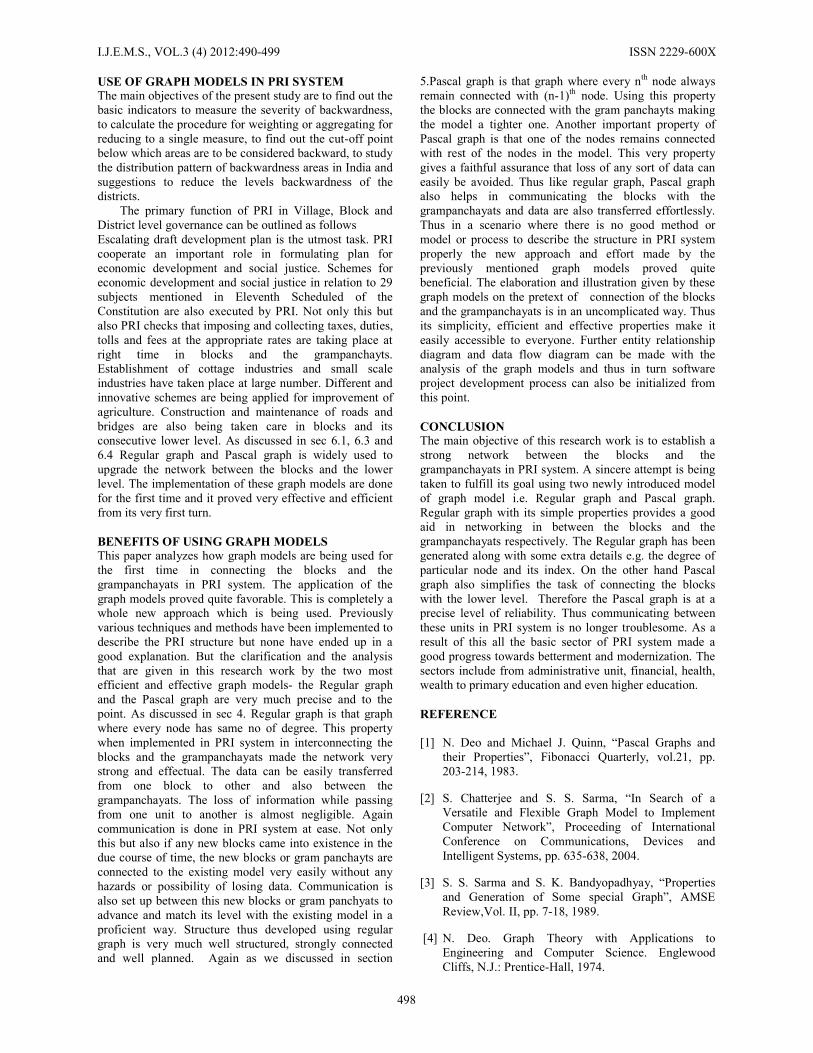
Fig10: Connection between blocks and grampanchayats in PRI system.
The connection between blocks and the grampanchayats isshown using Pascal graph model where the blocks aredenoted as ‘b’ and the grampanchayats are denoted as ‘gp’in figure 10. The representation of the Pascal relationshipbetween the block and the gram panchyats is done bydotted line and the firm line represents the Regular graphnetwork. There may arise dilemma at times incommunicating to all GPs if there are too manygrampanchayats present in one block. As a result creation
of too much clogging in transferring information andmessages from one GP to other is highly possible. In orderto decipher the problem the blocks with higher no of GPsare divided into groups. But there may be a question inwhat basis the GPs are to be divided. In this situation inorder to maintain uniformity, a strict rule is followed.Divisions are made in a way that each group will consist amin of 4 GP to max of 6 GP. This can be further explainedwith apt diagram here under.

Graph models to ascertain social network
497
Fig11: Subgrouping of blocks/GP
A 4-regular graph repesenting a block with 9 gp and 3-regular graph showing blocks and Pascal graph isrepersenting the connetion between blocks andgrampanchyats.There are 9 gp as shown in figure 11 sonetwork establishment and connecting 9 gp together cangenerate a mess. So to overcome the problem the wholediagram will be divided into 2 group, one containing of 4gp and the other one is with 5 gp.. The benefit of doingthis will launch communication between the GPs muchmore easily. Thus the main objective of this paper will bejustified. The above mention scenario is again illustratedwith suitable digram given hereunder.
(A) (B)
Fig12: (A) and (B) are the subgraph of Fig10
There can be also circumstances where two groups ofGPs taken respectively as separate nodes and a block itselfa node may altogether form a prototype unit of PRIstructure. This is further illustrated with a apposite figurein the section below.
Fig 13: A connection of blocks and GPs where A, B and C are taken as separate nodes.
A, B and C are the three elements together forming figure13. B and C are represented as separate nodes which areactually two respective collection of grampanchayats. B
consisting of a bunch of 5 gp s and C is collection of 4 gp.But on the other hand unit A is one of the blocks of a 2-regular graph portrayed as a network of 3 blocks.
I.J.E.M.S., VOL.3 (4) 2012:490-499 ISSN 2229-600X
498
USE OF GRAPH MODELS IN PRI SYSTEMThe main objectives of the present study are to find out thebasic indicators to measure the severity of backwardness,to calculate the procedure for weighting or aggregating forreducing to a single measure, to find out the cut-off pointbelow which areas are to be considered backward, to studythe distribution pattern of backwardness areas in India andsuggestions to reduce the levels backwardness of thedistricts.
The primary function of PRI in Village, Block andDistrict level governance can be outlined as followsEscalating draft development plan is the utmost task. PRIcooperate an important role in formulating plan foreconomic development and social justice. Schemes foreconomic development and social justice in relation to 29subjects mentioned in Eleventh Scheduled of theConstitution are also executed by PRI. Not only this butalso PRI checks that imposing and collecting taxes, duties,tolls and fees at the appropriate rates are taking place atright time in blocks and the grampanchayts.Establishment of cottage industries and small scaleindustries have taken place at large number. Different andinnovative schemes are being applied for improvement ofagriculture. Construction and maintenance of roads andbridges are also being taken care in blocks and itsconsecutive lower level. As discussed in sec 6.1, 6.3 and6.4 Regular graph and Pascal graph is widely used toupgrade the network between the blocks and the lowerlevel. The implementation of these graph models are donefor the first time and it proved very effective and efficientfrom its very first turn.
BENEFITS OF USING GRAPH MODELSThis paper analyzes how graph models are being used forthe first time in connecting the blocks and thegrampanchayats in PRI system. The application of thegraph models proved quite favorable. This is completely awhole new approach which is being used. Previouslyvarious techniques and methods have been implemented todescribe the PRI structure but none have ended up in agood explanation. But the clarification and the analysisthat are given in this research work by the two mostefficient and effective graph models- the Regular graphand the Pascal graph are very much precise and to thepoint. As discussed in sec 4. Regular graph is that graphwhere every node has same no of degree. This propertywhen implemented in PRI system in interconnecting theblocks and the grampanchayats made the network verystrong and effectual. The data can be easily transferredfrom one block to other and also between thegrampanchayats. The loss of information while passingfrom one unit to another is almost negligible. Againcommunication is done in PRI system at ease. Not onlythis but also if any new blocks came into existence in thedue course of time, the new blocks or gram panchayts areconnected to the existing model very easily without anyhazards or possibility of losing data. Communication isalso set up between this new blocks or gram panchyats toadvance and match its level with the existing model in aproficient way. Structure thus developed using regulargraph is very much well structured, strongly connectedand well planned. Again as we discussed in section
5.Pascal graph is that graph where every nth node alwaysremain connected with (n-1)th node. Using this propertythe blocks are connected with the gram panchayts makingthe model a tighter one. Another important property ofPascal graph is that one of the nodes remains connectedwith rest of the nodes in the model. This very propertygives a faithful assurance that loss of any sort of data caneasily be avoided. Thus like regular graph, Pascal graphalso helps in communicating the blocks with thegrampanchayats and data are also transferred effortlessly.Thus in a scenario where there is no good method ormodel or process to describe the structure in PRI systemproperly the new approach and effort made by thepreviously mentioned graph models proved quitebeneficial. The elaboration and illustration given by thesegraph models on the pretext of connection of the blocksand the grampanchayats is in an uncomplicated way. Thusits simplicity, efficient and effective properties make iteasily accessible to everyone. Further entity relationshipdiagram and data flow diagram can be made with theanalysis of the graph models and thus in turn softwareproject development process can also be initialized fromthis point.
CONCLUSIONThe main objective of this research work is to establish astrong network between the blocks and thegrampanchayats in PRI system. A sincere attempt is beingtaken to fulfill its goal using two newly introduced modelof graph model i.e. Regular graph and Pascal graph.Regular graph with its simple properties provides a goodaid in networking in between the blocks and thegrampanchayats respectively. The Regular graph has beengenerated along with some extra details e.g. the degree ofparticular node and its index. On the other hand Pascalgraph also simplifies the task of connecting the blockswith the lower level. Therefore the Pascal graph is at aprecise level of reliability. Thus communicating betweenthese units in PRI system is no longer troublesome. As aresult of this all the basic sector of PRI system made agood progress towards betterment and modernization. Thesectors include from administrative unit, financial, health,wealth to primary education and even higher education.
REFERENCE
[1] N. Deo and Michael J. Quinn, “Pascal Graphs andtheir Properties”, Fibonacci Quarterly, vol.21, pp.203-214, 1983.
[2] S. Chatterjee and S. S. Sarma, “In Search of aVersatile and Flexible Graph Model to ImplementComputer Network”, Proceeding of InternationalConference on Communications, Devices andIntelligent Systems, pp. 635-638, 2004.
[3] S. S. Sarma and S. K. Bandyopadhyay, “Propertiesand Generation of Some special Graph”, AMSEReview,Vol. II, pp. 7-18, 1989.
[4] N. Deo. Graph Theory with Applications toEngineering and Computer Science. EnglewoodCliffs, N.J.: Prentice-Hall, 1974.

Graph models to ascertain social network
499
[5] F. Harary. "The Determinant of the Adjacency Matrixof a Graph." SIAM, Review 4 (1962):202-10.
[6] C. T. Long. "Pascalfs Triangle Modulo p." TheFibonacci Quarterly 19 (1981):458-63.
[7] W. F. Lunno'n. "The Pascal Matrix." The FibonacciQuarterly 15 (1977): 201-04.
[8] V. A. Uspenskii. Pascalfs Triangle. Trans, andadapted from the Russian by D.J. Sookne & T.McLarnan. Chicago: University of Chicago Press,1974.
[9] Yannis M. Ioannides, Random Graphs and SocialNetworks: An Economics Perspective,http://ideas.repec.org/p/tuf/tuftec/0518.html
[10] http://en.wikipedia.org/wiki/Collaboration_graph
[11] http://en.wikipedia.org/wiki/Social_network_analysis
[12] http://en.wikipedia.org/wiki/Network_science
[13] Sanjay Kumar Pal and Samar Sen Sarma, “ComputerNetwork Topology Design in Limelight of PascalGraph Property”, In the International Journal of NextGeneration Network, Vol. 2, No. 1, page: 30 – 35,2010.
[14] An Algorithm of Topology Design and Routing, Inthe International Journal of Applied Research onInformation technology and Computing, Vol: 1, Issue:3, pg: 336-343, December 2010.
[15] J.L. Gersting, Mathematical Structures For ComputerScience. W.H. Freeman and Company, 2007
.