Appliance Industry
93
Transcript of Appliance Industry

Appliance Industry:***** ll*loa*****l**************lll**Ot******
Impact of Trade Policy Reformson Performance, Competitiveness
and Structure*oil* **** loll lQa* *******l ******** **6"**** ** *
Dennis D. Lapid
I_SF.AV.CHPAVF.P.S_.V.IESNO. 94-05
Philippine Institute for Development Studies

Copyright © 1994 by thePhilippine institute for Development Studies
Printed in the Philippines. All rights reserved. The findings, interpretationsand conclusions in this paper are those of the author and do notnecessarily reflect those of PIDS and other institutions associated with, orfunding, the Project.
The publication of this study is made possible by a financial grant from theUnited States Agency for international Development through the TechnicalResources Project of the National Economic and Development Authority.
Please address all inquiries to the:
Philippine institute for Development Studies4th Floor,NEDA sa Makati Building106Amorsolo Street, Legaspi Village1229 Makati, Metro Manila, PhilippinesFaxNo. (632) 816-1091Tel.Nos. 893-5705 and 892-4059
ISBN 971-564-005-2RP- 9 - 94- 500
Table of Contents
I Introduction ................................................................. I
2 The Appliance Industry ................................................. 3Genera]Profile .................................................................... 3Significanceto the Economy................................................ 5Industry Performance and Present Situation ......................... 6Govermnent Policies ............................................................ 9
3 Studies on the Appliance Industry .............................. 15The Effects of Trade Reform ............................................. 15Market Structure ............................................................... 15Other Studies on the Industry ............................................ 16
4 The Effects of Trade Reform on Structure,Performance, and Competitiveness ............................ 17Some Conceptual Distinctions .......................... ................. 17Trade Policy Reform, Market Structure,
Performance, and Competitiveness ................................. 20Influence of Other Factors on Efficiency ............................ 23Hypothesis ......................................................................... 24
$ DataSources and Methodology ................................. 25Data Sources ...................................................................... 25Trade Policy Reform ......................................................... 27Market Structure ............................................................... 31Performance ...................................................................... 34
Competitiveness. ................................................................ 44
6 Analysis of Results ....................................................... 47Protection Policy ............................................................... 47
iv
Market Structure ............................................................... 51Performance ............................ :......................................... 60
Efficiency and Establishment Size ....................................... 67Competitiveness ................................................................. 74
7 Conclusion and Policy Recommendations .................. 77
Bibliography .................................................................... 81
List of Tables
1 Average Tariffs on Finished Goods: 1975_1995 ................... 122 Average Tariffs on Material Inputs: 1975-1995 ................... 123 Central Bank Circulars Removing
Restrictions on Appliances ............................................. 134 Eft_ctive Protection Rates
and h-nplicit Tariff Rates: 1983 and 1988 ........................ 485 Direct Price Comparisons for Selected Appliances:
1.985 to 1991 ................................................................. 50
6 Import Penetration Ratios: 1983 and 1988 ........................ 527 Imports of Finished Goods: 1972 to 1991 .......................... 538 Imports of Material Inputs: 1972 to 1991 .......................... 549 Measures of Seller Concentration
and Market Power: 1983 and 1988 ................................. 5610 Size Distribution of Plants
Based on Employment: 1983 and 1988 .......................... 5811 Exports of the Appliance Industry: 1972 to 1991 ............... 6212 Domestic Resource Cost
in Shadow Prices: 1983 and 1988 ................................... 6313 DRC and EPR Estimates: 1986 and 1991 ......................... 64
14 Distribution of Efficient and Inefficient ApplianceManufacturing Plants by EPR: 1983 and 1988 ............... 65
15 Distribution of Efficient and Inefficient Radio
andTV Parts Manufacturing Plants by EPR:1983 and 1988 ............................................................... 66
16 Size Distribution of Efficient and Inefficient ApplianceManufacturing Plants: 1983 and 1988 ............................ 68
V
17 Size Distribution of Efficient and Inefficient
R.adio-TV Parts Manufacturing Plants:1983 and 1988 ..."............................................................ 69
18 Number and Proportion of TechnicallyEfficient Plants: 1983 and 1988 ...................................... 70
19 Measures of Factor Productivity: 1983 and 1988 ................ 7220 Domestic Resource Cost in Market Prices:
1983 and 1988 ............................................................... 75
Listof Figures1 Growth of the Industry: 1972-1988 ..................................... 72 Trade Reform and Efficiency in the Economy ................... 193 Allocative and Technical Efficiency of the Firm .................. 19
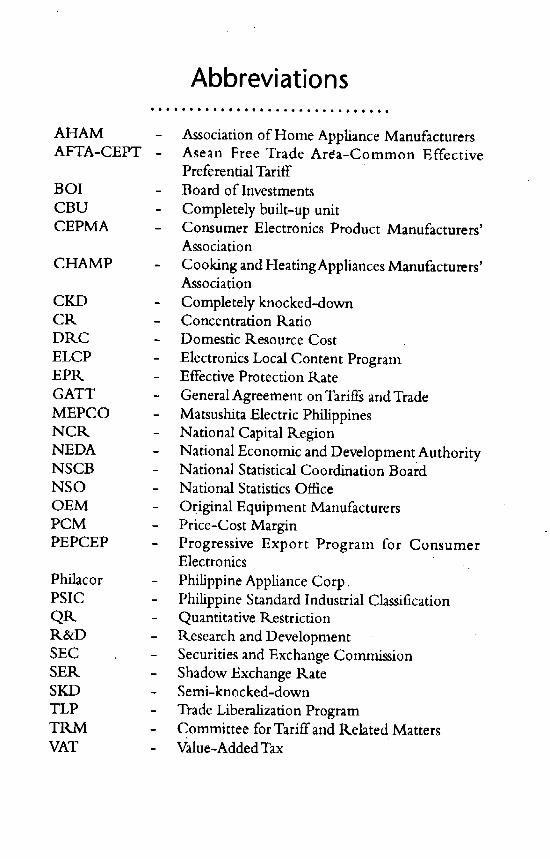
Abbreviations#)o _oomlloooooQm61o_#_laa_##o61
AHAM - Association of Home Appliance ManufacturersAFTA-CEPT = Asean Free Trade Ar_a-Common Effective
Preferential TariffBOI - Board of Investments
CBU - Completely built-up unitCEPMA - Consumer Electronics Product Manufacturers'
Association
CHAMP - Cooking and HeatingAppliances Manufacturers'Association
CKD - Completely knocked-downCR - Concentration RatioDRC - Domestic Resource Cost
ELCP - Electronics Local Content ProgramEPR. - Effective Protection Rate
GATT - GeneralAgreement on Tariffs andTradeMEPCO - Matsushita Electric PhilippinesNCR - National Capital RegionNEDA - National Economic and DevelopmentAuthorityNSCB - National Statistical Coordination BoardNSO = National Statistics Office
OEM - Original Equipment ManufacturersPCM - Price-Cost MarginPEPCEP - Progressive Export Program for Consumer
Electronics ..
Philacor - Philippine Appliance Corp,PSIC - Philippine Standard Industrial ClassificationQR. - Quantitative RestrictionR&D - Research and DevelopmentSEC - Securities and Exchange CommissionSER - Shadow Exchange RateSKD - Semi-knocked-down
TLP - Trade Liberalization ProgramTRM - Committee for Tariff and Rehted MattersVAT - Value-Added Tax
1
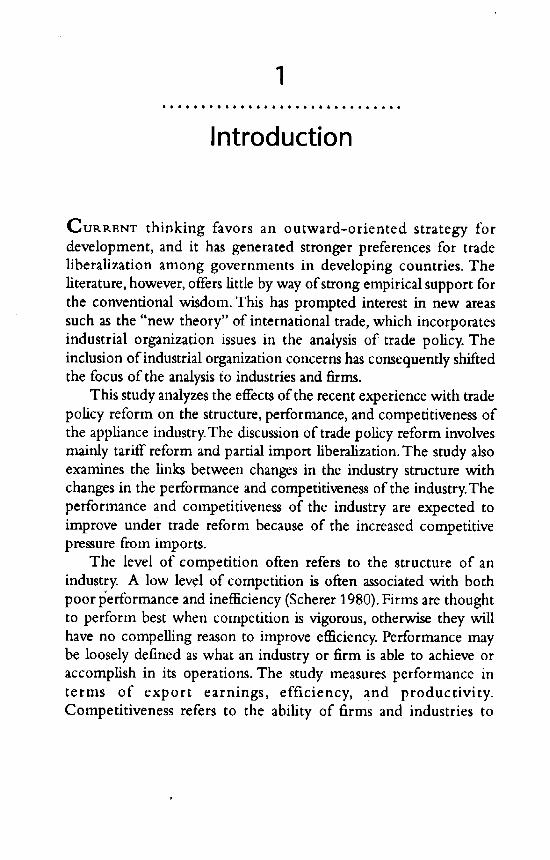
Introduction
CUR.kENT thinking favors an outward-oriented strategy fordevelopment, and it has generated stronger preferences for tradeliberalization among governments in developing countries. Theliterature, however, offers little by way of strong empirical support forthe conventional wisdom. This has prompted interest in new areassuch as the "new theory" of international trade, which incorporatesindustrial organization issues in the analysis of trade policy. Theinclusion of industrial organization concerns has consequently shiftedthe focus of the analysis to industries and firms.
This study analyzes the effects of the recent experience with tradepolicy reform on the structure, performance, and competitiveness ofthe appliance industry. The discussion of trade policy reform involvesmainly tariff reform and partial import liberalization. The study alsoexamines the links between changes in the industry structure withchanges in the performance and competitiveness of the industry.Theperformance and competitiveness of the industry are expected toimprove under trade reform because of the increased competitivepressure from imports.
The level of competition often refers to the structure of anindustry. A low level of competition is often associated with bothpoor l_erformance and inefficiency (Scherer 1980). Firms are thoughtto perform best when competition is vigorous, otherwise they willhave no compelling reason to improve efficiency. Performance maybe loosely defined as what an industry or firm is able to achieve oraccomplish in its operations. The study measures performance interms of export earnings, efficiency, and productivity.Competitiveness refers to the ability of firms and industries to
2 41 DennisD.Lapid
compete in the domestic market with importers and in externalmarkets with other exporters (Tecson 1992).
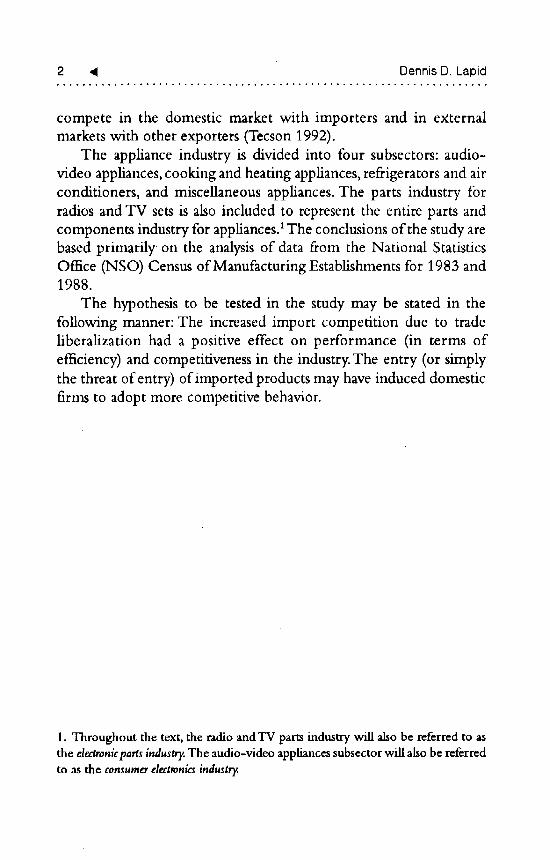
The appliance industry is divided into four subsectors: audio-video appliances, cooking and heating appliances, refrigerators and airconditioners, and miscellaneous appliances. The parts industry forradios and TV sets is also included to represent the entire parts andcomponents industry for appliances.1The conclusions of the study arebased primarily-on the analysis of data from the National StatisticsOffice (NSO) Census of Manufacturing Establishments for 1983 and1988.
The hypothesis to be tested in the study may be stated in thefollowing manner: The increased import competition due to tradeliberalization had a positive effect on performance (in terms ofefficiency) and competitiveness in the industry. The entry (or simplythe threat of entry) of imported products may have induced domesticfirms to adopt more competitive behavior.
1. Throughoutthe text,the radioandTVpartsindustrywillalsobe referredto asthe electronicpartsindustry.Theaudio-videoappliancessubsectorwillalsobe referredto as the consumerelectronicsindustry.
2eo e e t _ # e e o # # ee e e t e#e Q ## # • • • a it t
The Appliance Industry
G_.NER.ALPROFILE
TH,s study focuses on major appliances, which may be broadlyclassified into four subsectors similar to industry association groupings:
• Audio-video applianceswhich consist of products such as TV sets,stereos, radios, cassette recorders,VCRs, and the like;
• Cooking and heating applianceswhich include ovens, stoves, andranges, both gas and electric;
• Refrigeratorsand air conditionerswhich also include freezers (and, inNSO data, cooking ranges); and
• Miscellaneousapplianceswhich include products such as electric fans,vacuum cleaners, washing machines, and dryers.
There are four trade associations -- organized around productlines -- which help promote information exchange and makerepresentations with the government (Tan 1987). These are theConsumer Electronics Products Manufacturers' Association(CEPMA); the Association of Home Appliance Manufacturers(AHAM), composed of refrigerator and air conditionermanufacturers; the Cooking and Heating Appliances Manufacturers'Association of the Philippines (CHAMP); and the Philippine ElectricManufacturers' Association. Some of them, like the AHAM, engage
in lobbying and also monitor smuggling.The local appliance industry is comprised of around 30 firms,
most of which carry foreign brands as licensees or as joint ventureswith foreign manufacturers.The majority primarily assemble products
4 41 DennisD, Lapid
from completely-knocked-down (CKD) and semi-knocked-down
(SKD) parts from the US,Japan,Taiwan, and Hong Kong. Hill (1981)
describes the domestic market as small, because of a predominantly
poor population, and highly fragmented because of the proliferation
of models. Industry sources also say that local firms are about 10 yearsbehind global market leaders in technology.
Technical arrangements with foreign firms (e.g., Japanese andKorean) are often seen as a necessity in the industry,, new entrants are
considered at a disadvantage without some form of a technical tie-up
with foreign counterparts. In such arrangements, the foreign partneror mother company is often the main source of technical information,
and research and developent (R&D) projects involve mostly theadaptation of product designs and the addition of features to suit localconditions and tastes.
Parts and components production is considered unprofitable dueto the small volume of orders, and the supplier industries are
consequently underdeveloped. An industry source says local suppliers
are unable to compete in electronic parts but appear to be competitive
in plastic and metal parts, such as enclosures for audio products.Among the problems cited were the poor quality, high cost, and
erratic delivery of locally-made parts. Although some large firms
produce a portion of their own needs (such as plastic and metal partsand printed circuit boards), most firms prefer to import parts due to
lower costs, better quality, or because the needed parts are not available
locally. As a result, the industry is highly import-dependent.
Despite these problems, there are still opportunities for the partsindustry, particularly in export markets. The Board of Investments
(BOI), for example, is working to promote plastic and metal parts
made with dies and molds because of an apparent comparative
advantage. World demand for metal products is expected to risebecause of weakened casting and forging industries in the US and
Japan The highly-skilled local metalworking industry has a goodchance of becoming a major exporter.
Appliance Industry I_ 5............. 4 t'4**'** .... _'* .................... * ..................
Market Orientation
The appliance industry may be described as inwardly-orientedsince products are aimed mostly at the domestic market. Althoughmost local subsidiaries and joint ventures with foreign firms areexporting, it is often done as part of a complementing scheme withother ASEAN-based subsidiaries. Filipino-owned firms tend to focuson the domestic market, although some have announced plans toexport. This inward orientation may be a result of substantialprotection since the 1960s, which reduced the attractiveness of theexport market by making the domestic market more profitable.
GeographicalLocation
Data from the 1.983and 1988 Census of Establishments show that
the majority of appliance manufacturers are based in NCR, with 80percent of the establishments in both census years located in theregion. For the electronic parts industry, the figure is around 90percent. Several possible reasons may be cited: Better infrastructure;proximity to airports and shipping port facilities; and theconcentration of the country's skilled labor in the National CapitalRegion (NCR). Manih is a natural choice for most firms since accessto material inputs is an important factor in choosing a location.
SIGNIFICANCE TO THE ECONOMY
Contribution to the Economy
Census data also show that the share of the appliance industry intotal value added for the manufacturing sector declined from 0.26percent in 1972 to 0.16 percent in 1988. It has also been modestless than 1 percent throughout that period -- possibly because theindustry is engaged more in assembling than in manufacturingoperations. In addition, the large number and diversity of parts andcomponents will tend to make substantial vertical integration not
6 _1 DennisD,Lapid
feasible, and manufacturers will tend to prefer importing or buyinglocally over in-house production. Data for the radio-TV parts industryare incomplete but they show much larger shares for the industry andnoticeable growth (from 0.07 percent in 1978 to 0.38 percent in1988). The larger shares may be attributed to the inclusion of thesemiconductor industry which is also a major exporter.
Linkageswith otherSectors
The appliance industry has a number of ancillary or supplierindustries. The 1983 Input-Output tables from the NSO showsubstantial backward linkages with three other industries: primary ironand steel, electronics, and fabricated metal products. The 1988 tableshave a more disaggregated but similarly defined list ofanciUary sectors.The industry is also forwardly linked with the appliance retailingindustry.
Both supplier and retailer industries have a substantial impact oncompetitiveness. Supplier industries, for example, are crucial sincemost manufacturers require a reliable network of parts suppliers.Retailers are important since manufacturers often rely on appliancedealers to sell their products. Arrangements with dealers may alsoserve as a barrier to entry: New entrants may find themselves facingestablished firms with close long-standing relations with appliancedealers.
INDUSTRY PERFORMANCE AND PRESENT SITUATION
Growth
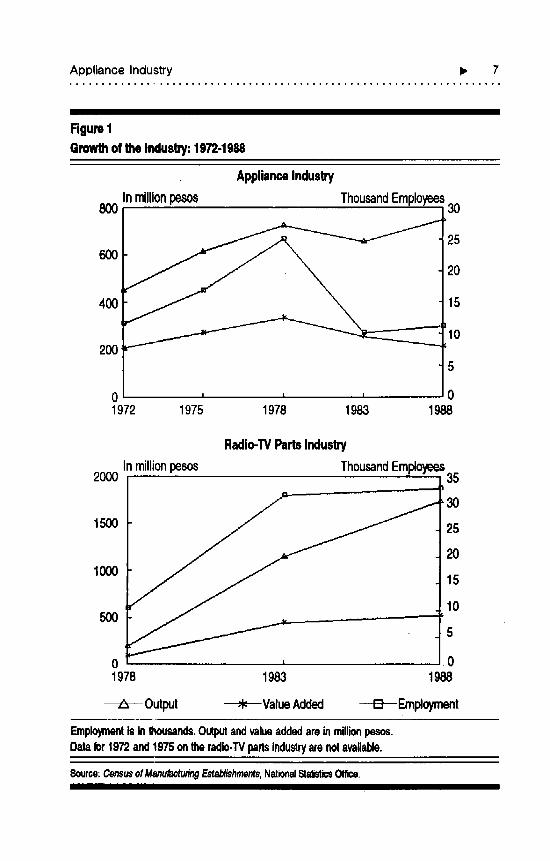
To obtain a general indication of the industry's performance inrecent years, we examine several indicators of growth: output, censusvalue added, employment, and the number of establishments. Datawere collected across five census years, from 1972 to 1988, for boththe appliance industry and the radio-TV parts industry (Figure 1).For
Appliance Industry ), 7.*''4 ...............................................................
Figure1
GrowthoftheIndustry:1972-1988
ApplianceIndusW
800 Inmillionpesos ThousandEmployees30
256OO
20
400 15
10200
5
0 , , ,, .... 01972 1975 1978 1983 1988
Radio-TVPartsIndustry
Inmillionpesos ThousandEmployees2O00 35
1500 25
20
1000 15
105OO
5
0 ' 01978 1983 1988
/k Output -t- ValueAdded _ Employment
Employmentisinthousands.OutputandvalueaddedareinmUlionpesos.Datafor1972and1975ontheradio-TVpartsindustryarenotavailable.
Source:CensusofManufactu#ngEetabli_hrnents,Nalio_ StalJstic$OffiCe,
8 4 Dennis D. Lapid
comparability, figures for output and census value added have beenexpressed in constant 1972 prices.
For the appliance industry, there was an increase in output andemployment between 1972 and 1978 (Figure 1). Census value addedclimbed steadily from 1972 to 1978 and fell afterwards. The number
of establishments fell from 71 in 1972 to 51 in 1983, and rose again to64 in 1988. Thus, the appliance industry appears to be growing interms of output and employment, although value added and thenumber of plants seem to be going down.
Data for the radio and TV parts industry are available only from1978 to 1988, but the figures show steady increases in output, valueadded, and employment. The number of establishments steadilyincreased from 24 in 1978 to 32 in 1983, and to 51 in 1988. Thefigures tend to confirm the industry observation that there has beennoticeable growth in the parts industry.
A modest growth and a smaller number of plants in the applianceindustry is thus observed; similarly, the available data for the radio andTV parts industry indicate steady growth.
Industry Structure
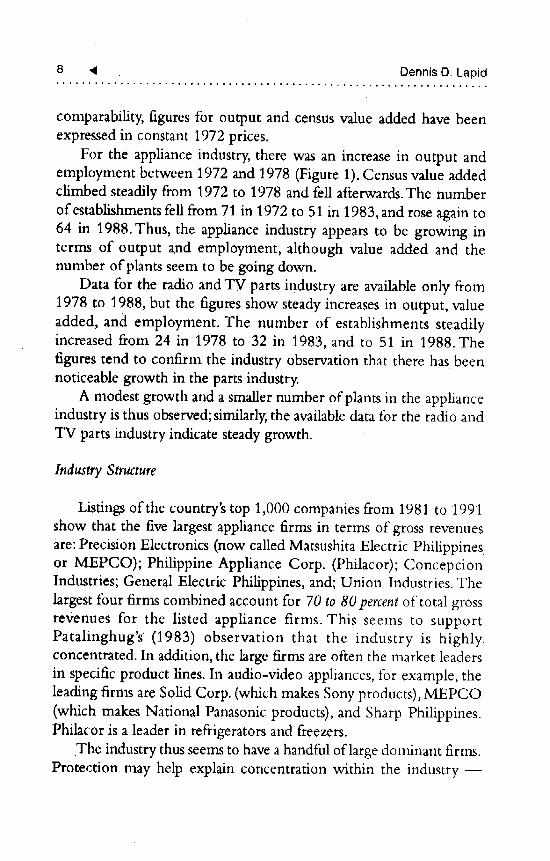
Listings of the country's top 1,000 companies from 1981 to 1991show that the five largest appliance firms in terms of gross revenuesare: Precision Electronics (now called Matsushita Electric Philippinesor MEPCO); Philippine Appliance Corp. (Philacor); ConcepcionIndustries; General Electric Philippines, and; Union Industries. Thelargest four firms combined account for 70 to 80 percentof total grossrevenues for the listed appliance firms. This seems to supportPatalinghug's (1983) observation that the industry is highlyconcentrated. In addition, the large firms are often the market leadersin specific product lines. In audio-video appliances, for example, theleading firms are Solid Corp. (which makes Sony products), MEPCO(which makes National Panasonic products), and Sharp Philippines.Phihcor is a leader in refrigerators and freezers.
The industry thus seems to have a handful of large dominant firtm.Protection may help explain concentration within the industry --
ApplianceIndustry I_ 9............. • ................. o ..... ° ................ ° .............
although it may alsobe due to the observed smallness of the domesticmarket. Other things being equal, a small market is more likely to beconcentrated than a large one which can accommodate morecompeting firms.
Soriano (1991) cites five structural entry barriers in the industry:economies of scale; access to distribution channels; productdifferentiation; capital requirements; and technology acquisition.These barriers pose problems to prospective entrants. However, in thewashing machine industry, he observes two waves of entrants in thewashing machine market: the assembler-manufacturers which camein 1987-1988, and the importers which came in 1989-1991. Theseentrants were able to circumvent the need for scale economies, which
are important in nearly every part of the business,from manufacturingto research and development. The first wave of entrants (theassembler-manufacturers) did this by going into assembly operationsand into joint ventures with foreign original equipmentmanufacturers (OEMs). The second wave (the importers) simplyimported completely built-up units (CBUs).
It also appears that entry seems difficult for rank beginnersin thedomestic market but noc for establishedappliance firms seeking newmarkets. For example, access to distribution channels and productdifferentiation would not be serious problems for established firms,which may enjoy not only strong ties with distributors, but alsoconsumer loyalty.
GOV_E_NMEr,rr POLICIES
This section reviews trade policies pertaining to the industry,beginning with efforts to promote it through protection and thesubsequent development programs.This is followed by a discussion ofthe tariff reductions and the removal of import restrictions under theTrade Liberalization Program (TLP). The policy changes describedbelow become the basis for the next section which analyzes theireffects.
10 _1 DennisD,Lapid
Import Substitution and Protection
The appliance industry received substantial tariffprotection in the1960s when trade policy in general tended to promote importsubstitution. Tariffs were as high as 100 percent on some items.Additional protection came from import restrictions imposedoriginally due to balance-of-payments problems. A severe balance ofpayments crisis in 1970 prompted controls on both foreign exchangeand imports. Central Bank Circular No. 289 banned imports of allnon-essential consumer items, including appliances, withoutgovernment approval. The restrictions were retained after the BOPproblem subsided and were later used to support an export programfor the industry.
In the 1970s, the government, under pressure from parts andcomponents makers, sought to encourage the local manufacture ofparts and components by imposing a lower sales tax on firms that metprescribed local content specifications. That policy later became theElectronics Local Content Program (ELCP) in 1975, which gaveparticipants tax incentives based on local content and accessto importsof parts and components.The regulation of imports was passed on tothe BOI.The ELCP was intended to increase the use of local inputsand parts and improve export capabilities. Rapid obsolescence inelectronics, however, made investment in production equipmentunattractive, and exports consequently remained low (Tan 1987).Theprogram was expanded later to include other appliances and wasreplaced in 1983 by the Progressive Export Program for ConsumerElectronics (PEPCEP). PEPCEP gave participants sole permission toimport parts and completely built-up units (CBUs). In return, itrequired them to export in order to earn dollars for their importneeds. Soriano (1991) argues that the development program may haveserved as an entry barrier, since prospective participants were givenvalue added and foreign exchange earnings targets as the basis forincentives. Based mainly on the import restrictions and foreignexchange controls, the program was effectively stopped with thesubsequent reforms in trade policy.
Appliance industry I_ 11
TradePoli_ Reforms
The ensuing trade policy reforms involved tariff reductions andimport liberalization and were implemented in separate stages.Thefirst stage began with the 1981 TariffKeform Program (TRP) whichbrought down the high tariffs on appliances and was viewed as amodest step toward full-scale reform.Tan (!987) observes that before1981, tariff rates were 100 percent for air conditioners, refrigerators,freezers, and TV sets; 70 percent for non-electric stoves and electricfans; 50 percent for electric stoves; and 10 percent for washingmachines. By 1984, the rates were a uniform 50 percent, except forsome low-tariff items whose rates went unchanged.
For material inputs, parts and components, the rates were moredispersed. There were six rates in 1980: 100, 70, 50, 30, 20, and 10percent. By 1984, there were only four rates: those at 60 were reducedto 30 percent; those at 50, 30, and 20 percent were not changed; andthose at 10 percent were increased to 20.The rates were based on theamount of local production; inputs with substantial Iocalproductionwere given higher tariffs. Thus, tariffs on cabinets and chassis forrefrigerators andTV sets were as high as 100 percent in 1980, whiletariffs on capacitors were as low as 10 percent.
The changes in the protective structure also involved the removalof discriminatory taxes on imports and the adoption of the valueadded tax (VAT) system in 1988. The 1983 tax code imposes anadvance sales tax along with an additional 25 percent markup onimported appliances, thereby raising the effective price of imports.These taxes were replaced by the value added tax in 1988.
Executive Order No. 470, issued in 1991, mandates a more
gradual reduction of tariffs than the earlier EO 413 which waswithdrawn due to pressure from local firms. It annually reduces tariffsby 5 percent from 1991 to 1995. Average tariffs are expected to fall to27 percent for finished goods and 19 percent for parts andcomponents by 1995 (Tables 1 and 2), completing the tariff changesunder the trade reform program.
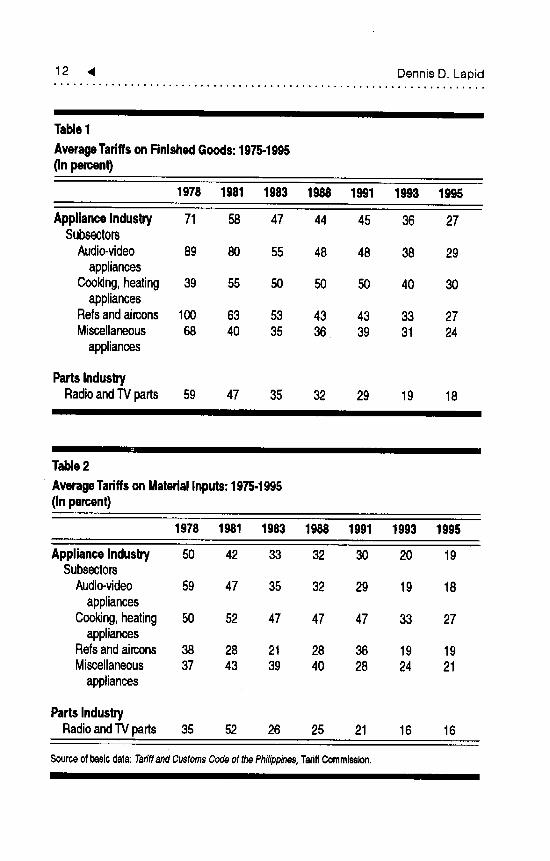
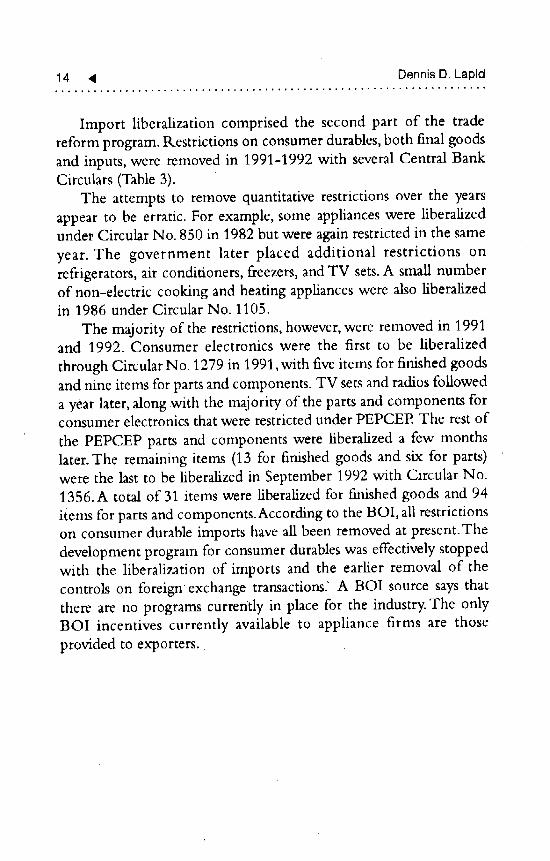
Table 1 shows a general reduction in average nominal tariffs onoutput.Average tariffs on finished goods for the industry went down
12 4 DennisD. Lapid
I III
Table1
AverageTariffsonFinishedGoods:1975-1995(inpercent)
1978 1981 1983 1988 1991 1993 1995
ApplianceIndustp/ 71 58 47 44 45 36 27Subssctors
Audio-video 89 80 55 48 48 38 29appliances
Cooking,heating 39 55 50 50 50 40 30appliances
Refsandaircons 100 63 53 43 43 33 27Miscellaneous 68 40 35 36. 39 31 24
appliances
PartsIndustryRadioandTVparts 59 47 35 32 29 19 18
II mill el II in i
I I II I
Table2
AverageTariffson Matsdalinputs:1976-1995(inpercent)
1978 1981 1983 1988 1991 1993 1995
ApplianceIndustry 50 42 33 32 30 20 19Subsectors
Audio-video 59 47 35 32 29 19 18appliances
Cooking,heating 50 52 47 47 47 33 27appliances
Refsandaircons 38 28 21 28 36 19 19Miscellaneous 37 43 39 40 28 24 21
appliances
PartsIndustryRadioand"IVparts 35 52 26 25 21 16 16
Sourceofbasicdata:TarfffandcustomsCodeofthePhilippines,TariffCommission.
ApplianceIndustry I_, 13..... o ....... , .....................................................
from 71 percent in 1978 to 45 percent in 1991 .The. averages for the
subsectors likewise went down substantially between 1978 and 1991.
The only exception is cooking-heating appliances, where the average
increased from 39 to 50 percent; this may have been due to thereduction in the number oftariffrates under EO 470. Nominal tariffs
also went down between 1983 and 1988; the average tariffon output
went down from 47 to 44 percent in the appliance industry and from
35 to 32 percent in the electronic parts industry.
Similar changes are seen in tariffs on inputs (Table 2).The average
tariffon inputs for the appliance industry went down from 50 percent
in 1978 to 30 percent in 1991.Average tariffs on inputs for most ofthe subsectors also went down between 1978 and 1991, with audio-
video appliances showing the largest reduction from 59 to 29 percent.i • I i
Tal_e3
CentralBankCircularsRemovingResldclionsonAppliances
CircularNo. Date itemsLiberalized No.ofItems
1279 March19,1991 Recordplayers,videocassetteplayers 5andtaperecorders
Partsandcomponentsforrecordplayers 9VCRs,andtaperecorders
1337 April27,1992 TVsets 4Radios 9PartsandcomponentsforradiosandTVsets 76
1347 July27, 1992 Materialinputs,partsandcomponentsforconsumerelectronicsproducts 9
1356 Sept25, 1992 Sewingmachines 1Airconditioners 1Electricfans 2Washingmachines 3Refrigera,torsandfreezers 6
Total 125
Source: CentralBankof the Philippinee.I
14 4 DennisD.Lapid
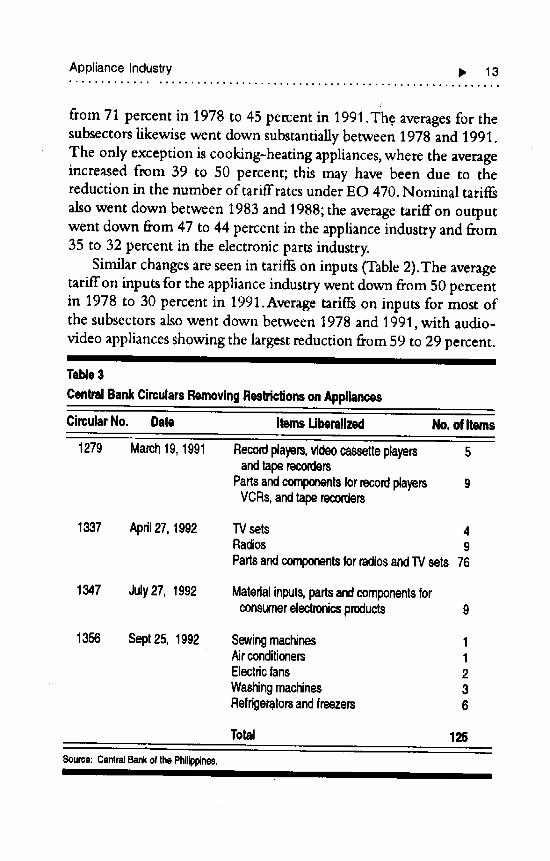
Import liberalization comprised the second part of the tradereform program. Restrictions on consumer durables, both final goodsand inputs, were removed in 1991-1992 with several Central BankCirculars (Table 3).
The attempts to remove quantitative restrictions over the yearsappear to be erratic. For example, some appliances were liberalizedunder Circular No. 850 in 1982 but were again restricted in the sameyear. The government later placed additional restrictions onrefrigerators, air conditioners, freezers, and TV sets. A small numberof non-electric cooking and heating appliances were also liberalizedin 1986 under Circular No. 1105.
The majority of the restrictions, however, were removed in 1991and 1992. Consumer electronics were the first to be liberalized
through Circular No. 1279 in 1991, with five items for finished goodsand nine items for parts and components. TV sets and radios followeda year later, along with the majority of the parts and components forconsumer electronics that were restricted under PEPCEP The rest of
the PEPCEP parts and components were liberalized a few monthslater. The remaining items (13 for finished goods and six for parts)were the last to be liberalized in September 1992 with Circular No.1356.A total of 31 items were liberalized for finished goods and 94items for parts and components.According to the BOI, all restrictionson consumer durable imports have all been removed at present. Thedevelopment program for consumer durables was effectively stoppedwith the liberalization of imports and the earlier removal of thecontrols on foreign exchange transactions. A BOI source says thatthere are no programs currently in place for the industry. The onlyBOI incentives currently available to appliance firms are thoseprovided to exporters.
3ta o6#o • _ #t t Q Q#O'b O #O, _QO# # ##oi_#
Studies on the Appliance Industry
SEWgAL studies have been written on the local appliance industryconcerning various issues such as trade reform and competitiveness,market structure, and inter-firm linkages.
THE EFFECTS OF TRADE REFORM
Perhaps the closest to the present study in terms of framework isTan (1987), which looks at the effects of the 1981 Tariff ReformProgram by measuring protection and competitiveness using EPRsand DRCs from a survey of 12 appliance firms.The industry's initialexperience with trade reform through tariff reductions shows mixedresults.There were modest gains in allocative efficiency,but firms hadvarying responses to the lowering of protection and there was no clearpattern of adjustment. EPRs went down and their range narrowed,and although DILCs went down, firms seemed to remain inefficient.It ispossible that the mixed results were partly caused by the smallnessof the sample. They may also be due to the prevailing importrestrictions on appliances at the time.The study ends by urging furthertariff reform in addition to import liberalization and measures toencourage more research and development.
MARKET STRUCTURE
Patalinghug (1983) looks at industry structure and finds substantialconcentration. Recent studies from the Asian Institute of
16 ,_ Dennis D. Lapid
Management (for example, Soriano 1991 and Chan 1991) also pointout the existence of barriers to entry in the industry.The studies servemore as guides to strategic planning for business enterprises butprovide very useful insights into industry conditions.
OTHER_ STUDIES ON THE INDUSTRY
Hill (1981) analyzes subcontracting arrangements and localcontent policies (policies promoting the use oflocaUy-produced partsand raw materials) for appliances and motorcycles.The importance ofthe parts industry is obvious; given the large number of parts andcomponents needed to produce appliances, makers will normallydecide against in-house production and instead require a reliablenetwork of suppliers. In fact, as Hill observes, the developmentprogram for appliances was originally an attempt to develop the localparts and components industry. He concludes that while governmentpolicy helped increase local content in the 1970s, linkages betweenfirms remain weak. Some fundamental change in both supplier andmanufacturing industries must take place before local production candevelop.
In general, the studies cited above on the appliance industry seemto point out two things: (1)The degree of competition in thedomestic market is low; and (2) The industry appears to haveremained inefficient or uncorripetitive for some time. Except forTan(1987), however, these studies do not focus on the links between tradepohcy, performance, and competitiveness.
4oo • • ¢ ¢ ¢ ¢ ¢¢ ¢ ¢ ¢¢ ¢ ¢ • ¢¢ • ¢oo Q Q o_ • • eQ
The Effectsof Trade Reformon Structure, Performance
and Competitiveness
SOMECONCEPTUALDISTINCTIONS
STRUCTURE generally refers to the degree of competition in an
industry. A low level of competition is often associated with poorperformance and inefficiency (Scherer 1980). In the absence of
effective competition, firms have no compelling reason to improve
efficiency. Conversely, they perform best when competition is
vigorous.
Performance is often measured in terms of productive efficiencywhich is composed of two types: Static efficiency and dynamic
efficiency (Havrylyshyn 1990). Static efficiency denotes the level of
efficiency at a given point in time. It is also composed of two types:
Allocative and technical efficiency. Dynamic efficiency is related to
efficiency over time. Changes in dynamic efficiency, which are moredifficult to measure, are associated with technological progress, since
improvements from innovation span more than a single period oftime.
The concept ofallocative and technical efficiency may be applied
both to the economy and the firm. For example, efficiency
improvements in the economy under trade reform may be described
in the following manner.: Protection (in the form oftarifl_ and taxes,
2.The author is gratefiflto Dr.John H. Powerforsome of the ideaspresentedhere.
18 4 DennisD,Lapid
for example) distorts the relative prices of goods and the allocation ofresources. The prevailing market prices will thus deviate from freetrade or shadow prices.
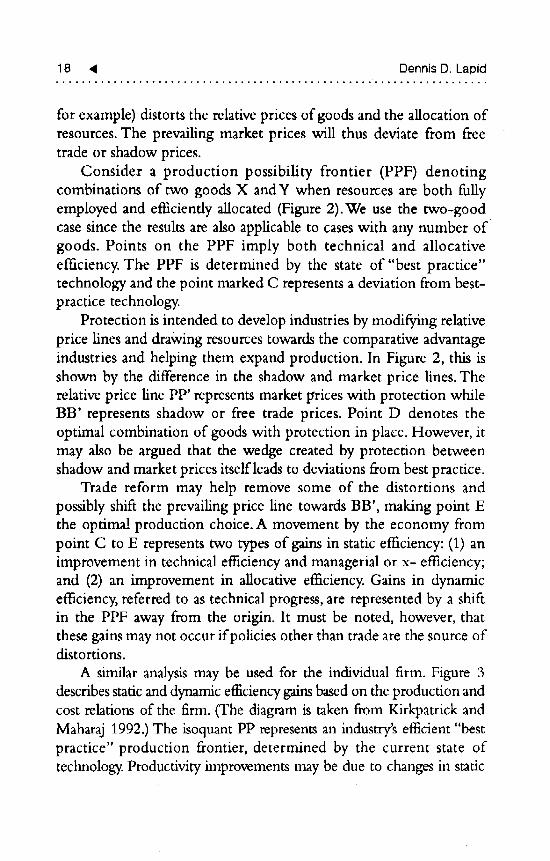
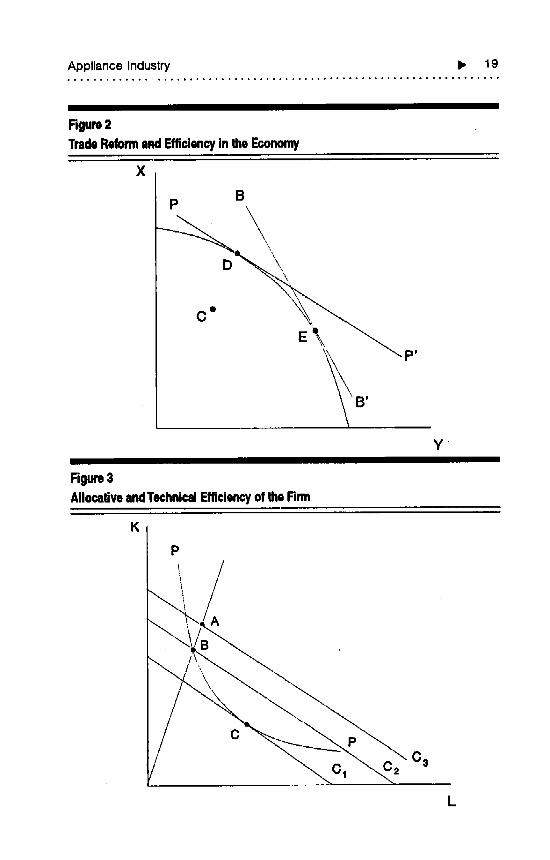
Consider a production possibility frontier (PPF) denotingcombinations of two goods X andY when resources are both fullyemployed and efficiently allocated (Figure 2).We use the two-goodcase since the results are also applicable to cases with any number ofgoods. Points on the PPF imply both technical and allocativeefficiency. The PPF is determined by the state of"best practice"technology and the point marked C represents a deviation from best-practice technology.
Protection is intended to develop industries by modifying relativeprice lines and drawing resources towards the comparative advantageindustries and helping them expand production. In Figure 2, this isshown by the difference in the shadow and market price lines. Therelative price line PP' represents market prices with protection whileBB' represents shadow or free trade prices. Point D denotes theoptimal combination of goods with protection in place. However, itmay also be argued that the wedge created by protection betweenshadow and market prices itself leads to deviations from best practice.
Trade reform may help remove some of the distortions andpossibly shift the prevailing price line towards BB', making point Ethe optimal production choice. A movement by the economy frompoint C to E represents two types of gains in static efficiency: (1) animprovement in technical efficiency and managerial or x- efficiency;and (2) an improvement in allocative efficiency. Gains in dynamicefficiency, referred to as technical progress, are represented by a shiftin the PPF away from the origin. It must be noted, however, thatthese gains may not occur if policies other than trade are the source ofdistortions.
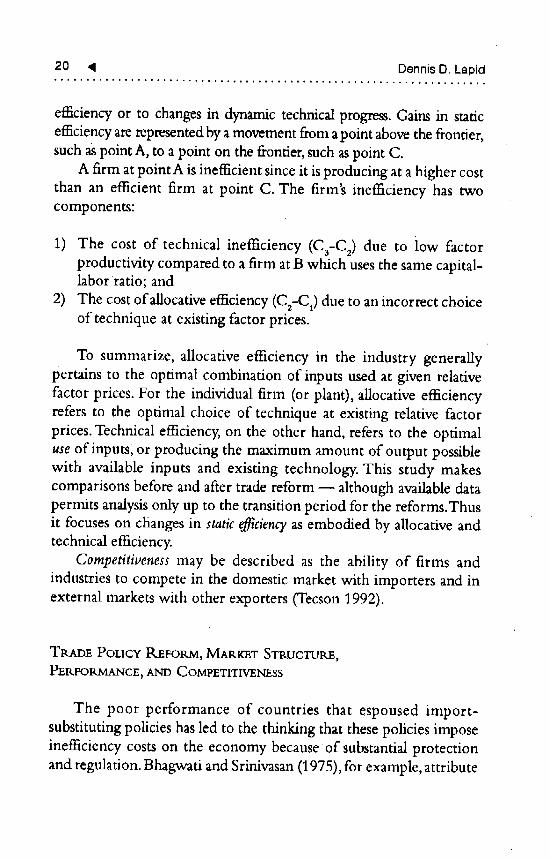
A similar analysis may be used for the individual firm. Figure 3describesstatic and dynamic efficiencygainsbased on the production andcost relations of the firm. (The diagram is taken from Kirkpatrick andMaharaj 1992.) The isoquant PP represents an industry's efficient "bestpractice" production frontier, determined by the current state oftechnology. Productivity improvements may be due to changes in static
ApplianceIndustry i_ 19
II I I
Figure2TradeReformaM EfficiencyinIheEconomy
X
BP
p,
y-i Ili
Figure3AIIocadveandTechnicalEfficiencyoftheFirm
K
V _L
2.0 4 Dennis D. Lapid
efficiency or to changes in dynamic technical progress. Gains in staticefficiencyare represented by a movement from apoint above the frontier,such as point A, to a point on the frontier, such aspoint C.
A firm at point A is inefficient since it is producing at a higher costthan an efficient firm at point C. The firm's inefficiency has twocomponents:
1) The cost of technical inefficiency (C3-C2) due to low factorproductivity compared to a firm at B which uses the same capital-labor ratio; and
2) The cost ofaUocative efficiency (C=-C1)due to an incorrect choiceof technique at existing factor prices.
To summarize, allocative efficiency in the industry generallypertains to the optimal combination of inputs used at given relativefactor prices. For the individual firm (or plant), allocative efficiencyrefers to the optimal choice of technique at existing relative factorprices. Technical efficiency, on the other hand, refers to the optimaluse of inputs, or producing the maximum amount of output possiblewith available inputs and existing technology. This study makescomparisons before and after trade reform -- although available datapermits analysis 0nly up to the transition period for the reforms.Thusit focuses on changes in static£fflciencyas embodied by aUocative andtechnical efficiency.
Competitiveness may be described as the ability of firms andindustries to compete in the domestic market with importers and inexternal markets with other exporters (Tecson 1992).
TP,_ADE POLICY REFORM, MARKET STRUCTURE,
PERFORMANCE, AND COMPETITIVENESS
The poor performance of countries that espoused import-substituting policies has led to the thinking that these policies imposeinefficiency costs on the economy because of substantial protectionand regulation. Bhagwati and Srinivasan (1975), for example, attribute
Appliance Industry I_ 21
resource misallocation and capacity underutilization in Indianmanufacturing to import substitution. Substantial protection often ledto growth in high-cost industries and to specialization that did notreflect comparative advantage (Rodrik, undated). Trade liberalizationis expected to correct the distortions created by import substitution,and the advantages of an outward-oriented economy are widelydiscussed (e.g., Krueger 1980). For example, there is a reduction inthe static inefficiency caused by resource misallocation and waste.Increased openness is also thought to enhance learning, technologicalchange, and economic growth.
However, as R.odrik (1988) observes, doubts still prevail becauseof the apparently weak empirical evidence. The standard theory, usedin earlier literature, assumes perfect competition in domestic markets.Studies assuming competitive markets often have neither strong norconclusive results and fail to establish clear links between trade reform
and improvements in performance (Harrison 1990). This hasprompted interest in other areas,such as issues related to competition.The literature on the "new theory" of international trade (e.g.,Helpman and Krugrnan 1985) combines industrial organizationconcepts with trade theory. In effect, it represents an attempt toprovide better explanations of the pattern of trade and moreconclusive results than those of earlier work which assume markets to
be perfectly competitive systems (De Melo and Urata 1986). Theapproach is partly supported by the increasing evidence, particularlyin developing countries, of imperfectly competitive markets markedby high seller concentration (Lee 1992)2 However, the new theoryoffers many scenarios on trade reform but no clear directions for
either theory or I_olicy.Instead it simply stresses the indeterminacy0fthe outcome under imperfect competition, since the results dependon the behavior of firms (Kirkpatrick and Maharaj 1992). Recent
• work focuses on the effects of trade reform both across and within
industries (e.g.,Thomas and Nash 1991; Harrison 1990).
3. In the Philippines, evidence on extensive market concentration has been putforward by Lindsey (1977), De Dios (1986), and Abenoja and Lapid (1991). SGV(1992) presents an extensive analysis of existing barriers to entr_.
22 _1 DennisD,Laloid
This study is premised on two ideas from the new theory. First,trade policy reform affects the competitive environment in a givenmarket. Trade policy has a significant impact on the level ofcompetition in the domestic market, particularly in developingcountries where markets tend to be small (Harrison 1990). Second,market structure affects the behavior of individual firms, which in
turn affects their response, in terms of performance, to policy changes.The level of domestic competition is therefore expected to at leastpartly affect the outcome of trade policy reform.
Under trade protection, there are two important sources ofwelfare loss within the industry (Tybout, De Melo, and Corbo 1991).First, in markets with free entry, the rents created by protection mayattract small inefficient producers, thereby increasing averageproduction costs within the industry. Second, in markets with barriersto entry, protected domestic firms will be able to exercise marketpower and extract monopoly rents. Market power may be defined asthe ability to charge a price above marginal cost (Martin 1988).Without vigorous competition, firms will have little reason to movetowards the "best effort" production frontier. Consequently, they maybe unable to reach the maximum potential output from a given inputcombination (that is, attain technical or x-efficiency) or operate atminimum efficient scale (attain scale efficiency).
Trade reform affects the level of competition chiefly by increasingthe competitive pressure from imports. With free entry and exit,liberalization leads to a rationalization of the domestic industry.R.odrik (1988) argues that increased competition forces outinefficient producers, thereby increasing both allocative and technicalefficiency within the industry.
When barriers to entry are present, or when oligopolistic behavioris observed, exlSosure to international competition will tend to erodethe shares of domestic firms and reduce market power. Domestic firmspreviously enjoying protection are induced to use resources moreefficiently, use new technology, and cut down on costs (Nishimizuand Robinson 1984). This is often referred to as the importdiscipline hypothesis: competition (or simply the threat ofcompetition) from imports induces domestic firms to adopt more
Appliance Industry I_ 23
competitive behavior (De Melo and Urata 1986).The scenario holdseven if trade liberalization reduces the number of domestic producers,since the outcome relies on increased competitive pressure comingfrom imports.
The study attempts to test the import discipline hypothesis on theeffects of trade policy reform and examines the links between thelevel of competition and the adjustment process. Changes in the levelof competition and the degree of market power in the industry aremeasured and analyzed together with those observed for allocativeefficiency, technical efficiency, and competitiveness.
INFLUENCE OF OTHEK FACTORS ON EFHCm.NCY
Although the study focuses on the effects of trade policy, theinfluence of other factors on performance and competitiveness areequally important. For example, there may be non-price factorsinvolved which are not directly related to trade liberalization. Thesefactors would include plant- or firm-specific attributes related toefficiency. Pack (1988), for example, suggests that measures ofallocative and technical efficiency can be related to characteristics suchas entrepreneurial experience and technical knowledge. Page (1984)observes that firm size is thought to be systematically related toefficiency.For example, a large firm facing minimal competition maybe more inefficient than a smaller one, other things being equal. Othernon-price factors include: access to production technology; changesin capacity utilization; the ability to meet quality standards; and otherproduction-related considerations. Furthermore, the present studyalso does not consider the dynamic_'ectsof the policy changes, focusinginstead on the static changes involved. Bhagwati and Srinivasan (1975)have noted that it is impossible to capture all the effects of policychanges using purely static measures.
Macroeconomic stability and the business cycle may also affectperformance in a given year. For example, Tybout, De Melo andCorbo (1991) analyze trade liberalization in Chile using estimates oftechnical efficiency on cross-industry data. They conclude that large
24 ,11 Dennis D. Lapid
reductions in protection led to improvements in average efficiency,but macroeconomic shocks may have masked the effects.
HYPOTHESIS
It may be useful at this point to restate the hypothesis of the studyconcerning the relationship between trade reform, competition, andperformance: Increased competition from imports due to tradeliberalization has apositive effect on performance and competitivenessin the industry. Domestic firms are induced to behave more
competitively because of the entry (or the threat of entry) of imports.
5oo##*.o# #Q #Q_QI _.ta..oQ_ t t ####*#
Data Sourcesand Methodology
DATA SouRcES
This chapter describes the estimates of various measures ofprotection, concentration, efficiency,and competitiveness used in thestudy. Estimates are computed at the industry, subsector, andestablishment levels. Subsector- and industry-level estimates arecomputed from totals of plant-level data.
The analysis relies primarily on data from the 1983 and 1988Census of Manufacturing Establishments from the NSO. Additionaldata for 1986 and 1991 are obtained from a survey of firms andfinancial statements from the Securities and Exchange Commission(SEC).
In order to simplify the analysis, related 5-digit PhilippineStandard Industrial Classification (PSIC) industries from the Censuswere grouped into subsectors in the same manner as the industryassociations. The fiveldigit PSIC industries under the applianceindustry are grouped as follows:
Audio-Video AppliancesPSIC 38321 Radio and TV sets, sound and recording
equipment
Cooking-Heating AppliancesPSIC 38331 Electrical cooking equipment
38333 Cooking appliances (except ranges) and kitchenappliances
26 4 DennisD, Lapid
Refrigerators and Air ConditionersPSIC 38291 Air conditioners
38298 Refrigerators
Miscellaneous Appliances
PSIC 38293 Sewing machines38332 Electric fans, vacuum cleaners, floor waxers and
polishers
38339 Electrical appliances and housewares, n.e.c.
Radio andTV Parts
PSIC 38325 Parts and supplies for radio and TV sets
To supplement the census data, copies of a questionnaire weresent to 52 firms, both appliance firms and parts and componentsmakers. These include most of the market leaders and major brand
names --7-although several known brands were also not included. Most
of the firms surveyed were either unable or unwilling to reply due to
lack of time, unavailability of company records, and fear ofinformation leaks to competitors. Some also complained of the
lengthiness of the questionnaire itself. The large firms generally keptmore complete records than the small ones although the small ones
were more open with information on their operations. Only 18 firms,
most of them appliance makers, responded to the survey. Eleven are
major brands; the rest are smaller and midsize firms in terms of marketposition.The available data made domestic resource cost (DRC) and
effective protection rate (EPR) estimates possible for only three firms
which furnished most of the requested numerical data, such as the
value of various types of assets, the age of equipment, and managers'
compensation. All three are large appliance makers and carry knownbrands. One is a market leader, and two have been in the top 1,000 list
of corporations. One has significant exports, while the other two are
primarily domestic-oriented. One is a multi-product firm, while theother two are limited to one or two products. Due to the limited
survey data, the study's conclusions are based primarily onobservations on the census data.
ApplianceIndustry b. 27
Protection is measured using estimates of EPR, which measurethe protective effect of tari_ and taxes, and direct price comparisons,which account for the additional effect of quantitative restrictions.The level of competition is examined using various measures oftenused in the industrial organization literature. The level of foreigncompetition is measured by import penetration ratios, or the share ofimports in the domestic market. The level of domestic competitionand market power are measured by concentration ratios, the numberand size distribution of plants, and price-cost margins. Performance ismeasured in terms of the following: exports; allocativ_ efficiency(using the DR.C); technical emciency (using a frontier efficiencymodel by Nishimizu and Page [1982]); and factor productivity (usinglabor and capital). Competitiveness is measured using estimates of theDR.C in market prices, which measures the viability of a businessenterprise from the owner's point of view.
T_ADr.Poucv I_FOkM
EffectiveProtectionRates p
Trade liberalization is expected to create a more open andoutward-oriented trade regime by reducing the protection given toindustries. Changes in the level of protection are measured usingeffective protection rates (EPILs) which indicate the amount ofprotection on the value added of a firm or industry.
EPKs are estimated for 1983 and 1988 using census data. EPRsfor 1986 and 1991 are based on data from the survey and financialstatements. The estimation method follows Bautista, Power, and
Associates (1979), with some modifications.The EPR. is defined as the percentage excess of domestic value
added over world (or free trade) value added (Tariff Commission,undated).The difference between domestic and free trade value addedindicates the extent to which protection policy raisesdomestic pricesabove world prices.Thus we may write:
28 _1 . DennisD,Lapid
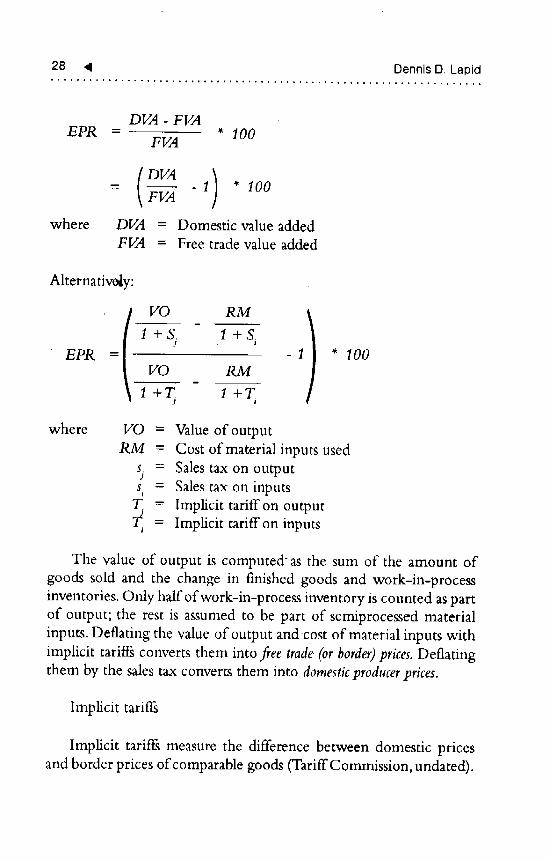
DVA - £VAEPR - * 100FVA
= -1 * 100FVA
where DVA = Domestic value addedFVA = Free trade value added
Alternativoly:
VO RM )
1 +S t 1 +S iEPR = - 1 * 100
VO RM
1 +T 1 +TJ J
where VO = Value of outputRM = Cost of material inputs used
s = Sales tax on outputJ
s, = Sales tax on inputsT. = hnplicit tariff on output
= Implicit tariff on inputs
The value of output is computed-as the sum of the amount ofgoods sold and the change in finished goods and work-in-processinventories. Only half of work-in-process inventory is counted as partof output; the rest is assumed to be part of semiprocessed materialinputs. Deflating the value of output and cost of material inputs withimplicit tariffs converts them into fiee trade(orborder)prices.Deflatingthem by the sales tax converts them into domesticproducerprices.
Implicit tariffs
Implicit tariffs measure the difference between domestic pricesand border prices of comparable goods (TariffCommission, undated).
Appliance Industry _ 29
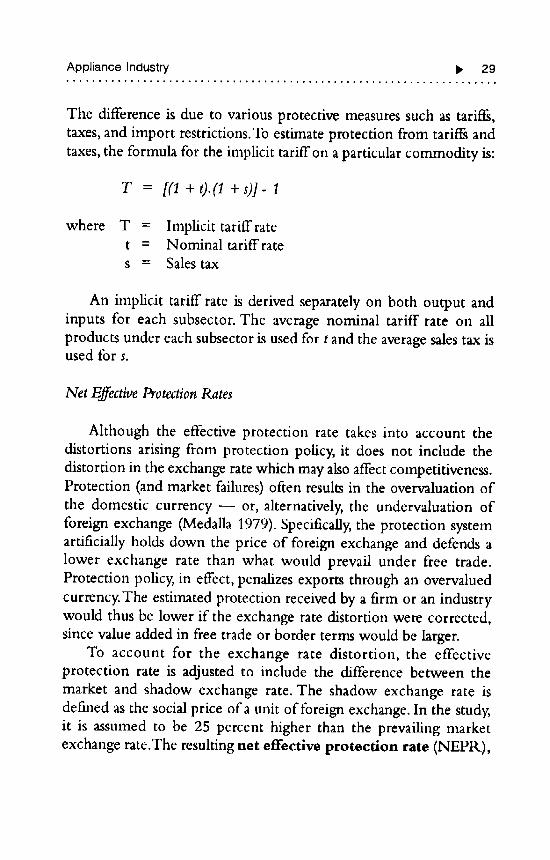
The difference is due to various protective measures such as tariffs,taxes, and import restrictions. To estimate protection from tariffs andtaxes, the formula for the implicit tariff on a particular commodity is:
r = [(1+t).(1+s)]- 1
where T = Implicit tariffratet = Nominal tariff rates = Sales tax
An implicit tariff rate is derived separately on both output andinputs for each subsector. The average nominal tariff rate on allproducts under each subsector is used for t and the average sales tax isused for s.
Net EffectiveProtectionRates
Although the effective protection rate takes into account thedistortions arising from protection policy, it does not include thedistortion in the exchange rate which may also affect competitiveness.Protection (and market failures) often results in the overvaluation ofthe domestic currency -- or, alternatively, the undervaluation offoreign exchange (Medalla 1979). Specifically, the protection systemartificially holds down the price of foreign exchange and defends alower exchange rate than what would prevail under free trade.Protection policy, in effect, penalizes exports through an overvaluedcurrency.The estimated protection received by a firm or an industrywould thus be lower if the exchange rate distortion were corrected,since value added in free trade or border terms would be larger.
To account for the exchange rate distortion, the effectiveprotection rate is adjusted to include the difference between themarket and shadow exchange rate. The shadow exchange rate isdefined as the social price of a unit of foreign exchange. In the study,it is assumed to be 25 percent higher than the prevailing marketexchange rate.The resulting net effective protection rate (NEPR),
30 _1 DennisD.Lapid
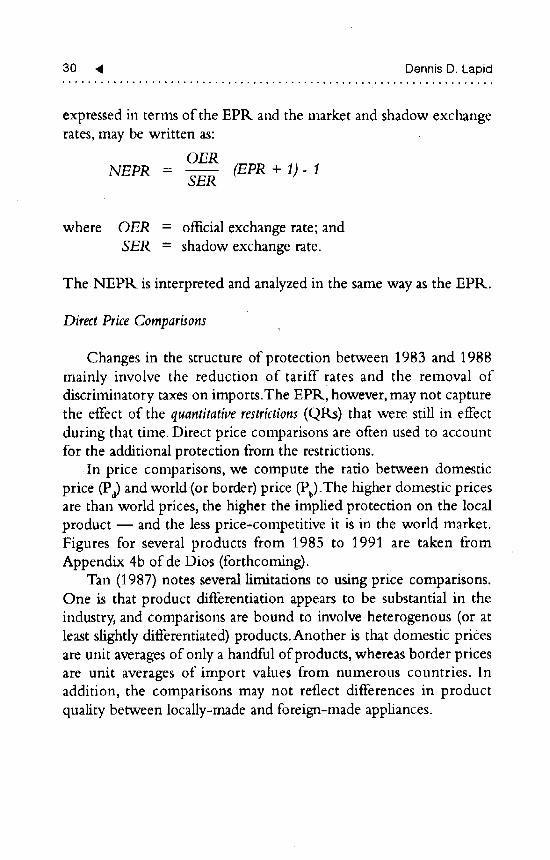
expressed in terms of the EPR and the market and shadow exchangerates, may be written as:
OERNEPR - (EPR + 1)- 1
SER
where OER = official exchange rate; andSER = shadow exchange rate.
The NEPR is interpreted and analyzed in the same way as the EPR.
Direct PriceComparisons
Changes in the structure of protection between 1983 and 1988mainly involve the reduction of tariff rates and the removal ofdiscriminatory taxes on imports.The EPR.I however, may not capturethe effect of the quantitativerestrictions(QRs) that were still in effectduring that time. Direct price comparisons are often used to account •for the additional protection from the restrictions.
•In price comparisons, we compute the ratio between domesticprice (Pa)and world(or border) price (Pb).The higher domestic pricesare than world prices, the higher the implied protection on the localproduct -- and the less price-competitive it is in the world market.Figures for several products from 1985 to 1991 are taken fromAppendix 4b of de Dios (forthcoming).
Tan (1987) notes several limitations to using price comparisons.One is that product differentiation appears to be substantial in theindustry, and comparisons are bound to involve heterogenous (or atleast slightly differentiated) products.Another is that domestic pricesare unit averages of only a handful of products, whereas border pricesare unit averages of import values from numerous countries. Inaddition, the comparisons may not reflect differences in productquality between locally-made and foreign-made appliances.
ApplianceIndustry I_ 31
MARKET STRUCTURE
We employ a number of measures of the level of competitionoften used in the industrial organization literature. In general, withincreased competition from imports, one would expect the industryto move towards greater domestic competition.We first measure theamount of foreign competition based on the share of imports. Greaterdomestic competition is, in turn, indicated by an increased numberand proportion of small-sized plants and reduced market power.Concentration is normally expected to fall, but it may also rise if theindustry or subsector undergoes rationalization, where inefficientproducers are forced out by increased competition.
Exposure to Import Competition
Import penetration ratios indicate the industry's exposure toimport competition by measuring the share of imports in the domesticmarket.The size of the domestic market is measured by the amount oflocalproduction minus exports and plus imports.Thus, we may write:
ImportsIPR =
Domestic Sales- Exports + Imports
Ratios for the entire industry are computed using census and tradedata. A match-up of commodities in the National StatisticalCoordination Board (NSCB) Foreign Trade StatisticsYearbook andthe census subsectors was constructed for the study.Total exports andimports were then taken for each subsector. Domestic production ismeasured by the total sales ofaU establishments. An increased share ofimports in the domestic market implies stronger competitive pressurefrom imports, and possibl_ a weaker influence on the part of thedomestic firms.We thus expect import penetration ratios to increasewith trade liberalization.
32 _ DennisD.Lapid
SellerConcentration
The amount of competition in the domestic market is oftenmeasured by indicators ofseUer concentration, which is defined as thenumber and size distribution of firms in the market (Lee 1992).Market size is often measured in terms of output or value added.Thehigher the level of concentration in an industry, the greater would bethe likely influence of its top frms, and the lower the degree ofcompetition that would prevail.
Concentration ratios measure the influence of the largest n firmsin the industry, typically the largest four. The study follows earlierwork (e.g., Lindsey 1977) in using the four-firm value addedconcentration ratio -- the combined share of the largest fourestablishments in total value added for the industry or subsector. Anindustry with a ratio greater than 60 percent may be considered highlyconcentrated (SGV 1992).
The Herfindahl index is another standard measure of
concentration.We may write it in equation form as:
H -_- ._,si2
where H = Herfindahl index; and
si = the share of firm i in total value added for theindustry or subsector.
The advantage of the Herfindahl index is that it includes the shares ofall firms, whereas the concentration ratio focuses on the possibleinfluence of the largest n firms (Martin 1988). In addition, the choiceof n is often arbitrary and based on convention. If the industry isevenly dispersed in terms of size (or not concentrated), the Herfindahlindex is equal to the reciprocal of the total number of firms. It is thushighly concentrated if H substantially exceeds the reciprocal of thenumber of firms- assuming a fairly large number of firms.
Patalinghug (1983) characterizes the industry as highlyconcentrated based on concentration ratios from 4-digit PSIC data.Using more disaggregated 5-digit data for 1983 and 1988, we
ApplianceIndustry I_ 33
compute value added concentration ratios and Herfindahl indices for
the industry and its subsectors. Trade liberalization is normallyexpected to cause a reduction in both concentration ratios andHerfindahl indices.
However, the measures used here do not include the share of
imports. Thus, they pertain more to concentration among domesticproducers rather than all sellers (Lee 1992). Concentration asmeasured in the study may therefore either rise or fall under tradereform. Increased concentration, for example, may simply be due tothe rationalizing effect of trade reform, which forces out of the
industry those inefficient producers previously attracted by highprotection.
The Size Distribution of Sellers
Structure is also indicated by the size distribution of firms. An
industry with a greater number and proportion of large firms is likelyto be more concentrated. All t_ings being equal, large firms areexpected to have more influence in the industry than small firms.Weclassify plants according to size and construct a frequency tabulation.To standardize the classification across subsectors, total employment isused as a measure of the size of the firm. Small-sized firms are definedas those with 5 to 99 employees; medium-sized firms are those with100 to 199; and large firms are those with 200 or more.The numberand proportion of small and medium-sized firms are expected toincrease, while those of the large firms are expected to decrease.Thisindicates a weakening of the influence of the large dominant firms.
Profitabilityand Market Power
Another indicator is the extent of market power or the ability offirms to raise prices above marginal cost.A measure often used is theprice-cost margin, which is also associated with profitability andprovides an indication of the extent of profits where substantialconcentration is expected (Scherer 1980). The price-cost margin is
34 4 DennisD.Lapid
defined as the excess of price over marginal cost, expressed as aproportion of price:
p - mcPCM =
P
The measure indicates the deviation from competitive pricing(denoted by p = mc). Since marginal cost is usually difficult toestimate, a number of proxies are employed in the literature. One ofthe often-used is employed by Linclsey (1977):
CensusValueAdded- CompensationPCM =
Valueof Output
The difference between'value added and compensation representspayments to factors other than labor and indicates profitability. Theentry of imports is expected to reduce the ability of firms to raiseprices above marginal cost, and price-cost margins are thus expectedto fall. Estimates are computed for the industry and the subsectorsusing census data.
PERFORMANCE
Exports
Performance may be measured by the proportion of outputexported by the industry, which is computed from NSO input-outputtables for 1983 and 1988. Ratios are computed only for the applianceand electronic parts industries since the input-output data are forbroadly-grouped sectors. However, the figures provide a generalindication of export performance.
We also examine the level of exports.Trade statistics for selectedyears are collected and grouped based on a matching of trade andcensus classification made for the study. Data are collected for boththe industry and the subsectors.
Applianceindustry li_ 35
Exports are seen to increase with trade liberalization.The entry ofimports may reduce the profitability the domestic market. Assumingthere are no barriers to exporting, exports may become a means ofexpanding the firms' effective market. The import disciplinephenomenon may alsoprompt local firms to export more.
AUocativeEfficiency
The DR.C may be used in before-after comparisons as an ex postmeasure of the effects of the policy changes.This study uses the DKCin shadow prices to examine allocative efficiency before and after tradepolicy reform.
As a cost-benefit measure for a production activity, the shadow-price D1LC is useful in developing countries with distorted marketsand scarce foreign exchange. Distortions such as governmentintervention drive a wedge between market prices and the true socialcosts and benefits of goods and resources (Tariff Commission,undated). The DKC corrects for distortions by expressing in shadowprices the value of output and the cost of factors of production (whichinclude foreign exchange).The shadow price is defined as the cost tosociety of providing the private sector an additional unit of a particulargood (Tower 1992).
A high D1LC estimate means that a production activity is usingtoo much resources in earning or saving foreign exchange; the activityis infl_cient,and society would do well to cut down on it.The sociallyefficient level of the DKC is usually set in rehtion to the shadow=xchange rate (SEK); the ratio between the DtLC and the SERmeasures allocative efficiency and comparative advantage. A DKC-SEK ratio between 0 and 1.2 implies a high level of allocativeefficiency and comparative advantage. Socially efficient DILC/SEKvalues are traditionally between 0 and 1 but we make an allowance of0.2 for measurement errors.A DRC/SEK of 1.2-1.5 indicates mild
inefficiency, while a value greater than 1.5 indicates outrightinefficiency. A DR.C estimate below zero indicates negative netforeign exchange earning or saving- the activity's foreign cost exceeds
36 4 DennisO.Lapid
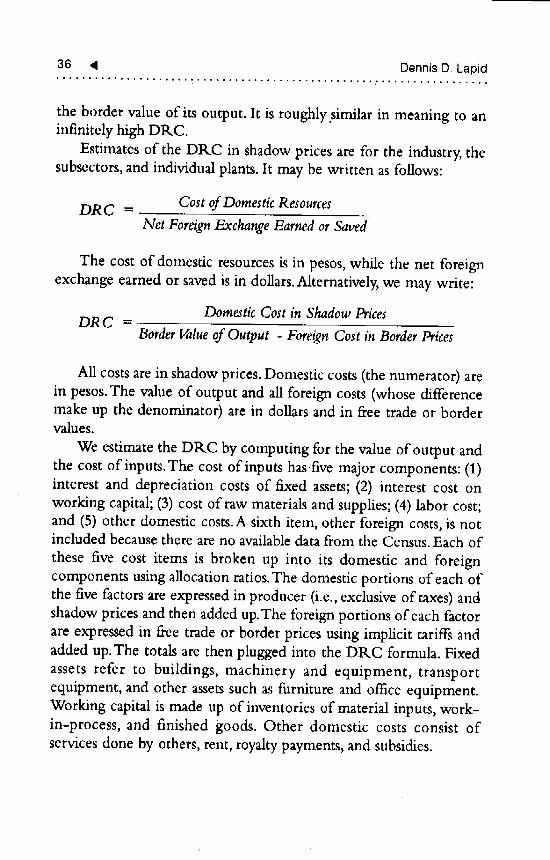
the border value of its output. It is roughly similar in meaning to aninfinitely high DtkC.
Estimates of the DI:kC in shadow prices are for the industry, thesubsectors, and individual plants. It may be written as follows:
Cost of DomesticResourcesDRC =Net ForeignExchange Earned or Saved
The cost of domestic resources is in pesos, while the net foreignexchange earned or saved is in dollars.Alternatively, we may write:
Domestic Cost in Shadow PricesDRC =
BorderValueof Output - ForeignCost in BorderPrices
All costs are in shadow prices. Domestic costs (the numerator) arein pesos. The value of output and all foreign costs (whose differencemake up the denominator) are in dollars and in free trade or bordervalues.
We estimate the DP,.C by computing for the value of output andthe cost of inputs.The cost of inputs has five major components: (1)interest and depreciation costs of fixed assets; (2) interest cost onworking capital; (3) cost of raw materials and supplies; (4) labor cost;and (5) other domestic costs.A sixth item, other foreign costs, is notincluded because there are no available data from the Census. Each of
these five cost items is broken up into its domestic and foreigncomponents using allocation ratios.The domestic portions of each ofthe five factors are expressed in producer (i.e., exclusive of taxes) andshadow prices and then added up.The foreign portions of each factorare expressed in free trade or border prices using imphcit tarif_ andadded up.The totals are then plugged into the DKC formula. Fixedassets refer to buildings, machinery and equipment, transportequipment, and other assets such as furniture and office equipment.Working capital is made up of inventories of material inputs, work-in-process, and finished goods. Other domestic costs consist ofservices done by others, rent, royalty payments, and subsidies.
Appliance Industry > 37
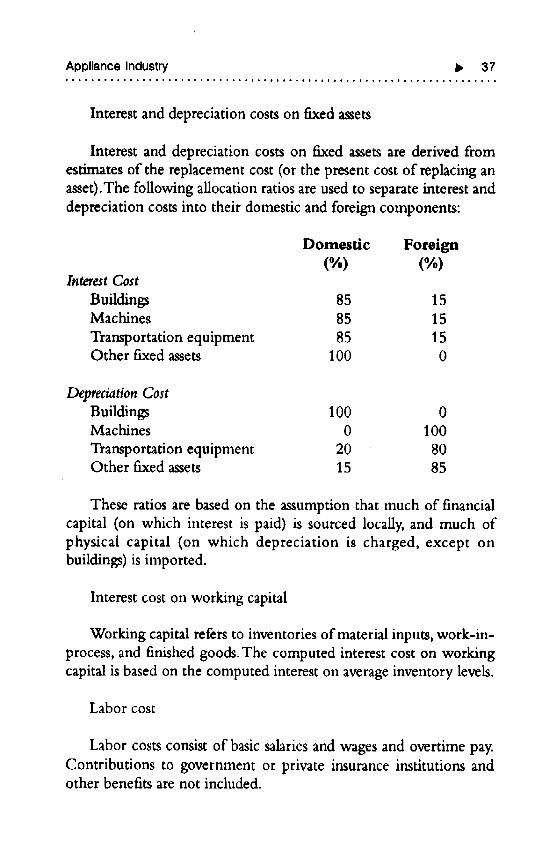
Interest and depreciation costs on fixed assets
Interest and depreciation costs on fixed assets are derived fromestimates of the replacement cost (or the present cost of replacing anasset).The following allocation ratios are used to separate interest anddepreciation costs into their domestic and foreign components:
Domestic Foreign(%) (%)
InterestCost
Buildings 85 15Machines 85 15
Transportation equipment 85 15Other fixed assets 100 0
DepreciationCostBuildings 100 0Machines 0 100
Transportation equipment 20 80Other fixed assets 15 85
These ratios are based on the assumption that much of financialcapital (on which interest is paid) is sourced locally, and much ofphysical capital (on which depreciation is charged, except onbuildings) is imported.
Interest cost on working capital
Working capital refers to inventories of material inputs, work-in-process, and finished goods. The computed interest cost on workingcapital is based on the computed interest on average inventory levels.
Labor cost
Labor costs consist of basic salaries and wages and overtime pay.Contributions to government or private insurance institutions andother benefits are not included.
38 _1 DennisD.Lapid
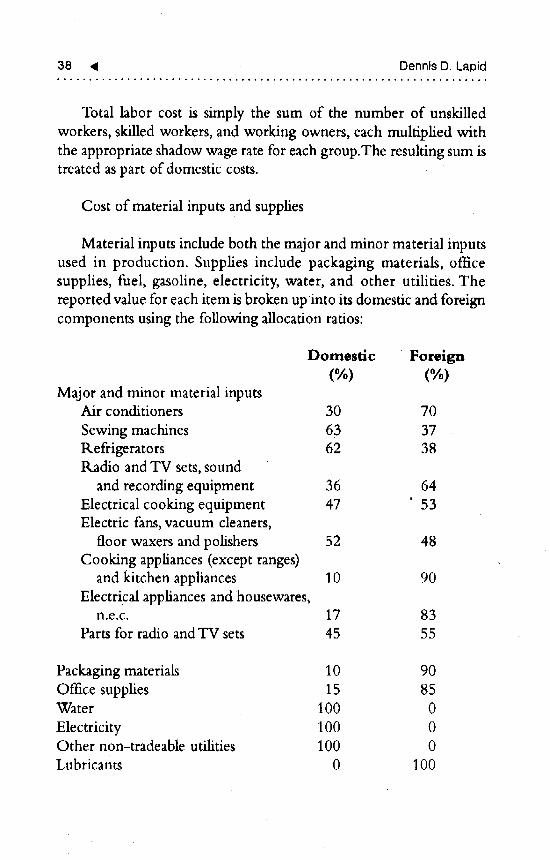
Total labor cost is simply the sum of the number of unskilledworkers, skilled workers, and working owners, each multiplied withthe appropriate shadow wage rate for each group.The resulting sum istreated as part of domestic costs.
Cost of material inputs and supplies
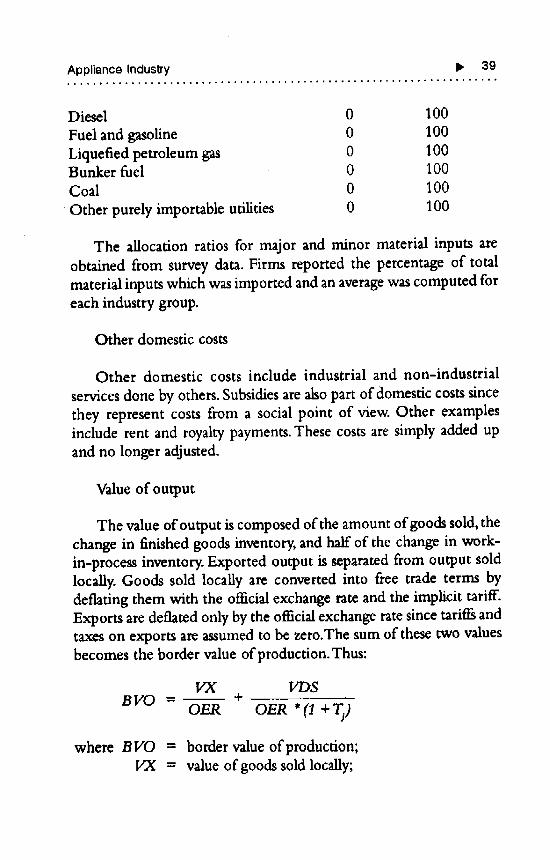
Material inputs include both the major and minor material inputsused in production. Supplies include packaging materials, officesupplies, fuel, gasoline, electricity, water, and other utilities. Thereported value for each item is broken up•into its domestic and foreigncomponents using the following allocation ratios:
Domestic Foreign(%) (%)
Major and minor material inputsAir conditioners 30 70
Sewing machines 63 37Refrigerators 62 38Radio and TV sets, sound
and re•cording equipment 36 64Electrical cooking equipment 47 ' 53Electric fans, vacuum cleaners,
floor waxers and polishers 52 48Cooking appliances (except ranges)
and kitchen appliances 10 90Electrical appliances and housewares,
n.e.c. 17 83Parts for radio and TV sets 45 55
Packaging materials 10 90Office supplies 15 85Water 100 0
Electricity 100 0Other non-tradeable utilities 100 0Lubricants 0 100
Appliance Industry Ib 39..... , .......................... ° ...................... , ............
Diesel 0 100
Fuel and gasoline 0 100Liquefied petroleum gas 0 100Bunker fuel 0 100Coal 0 100
•Other purely importable utilities 0 100
The allocation ratios for major and minor material inputs areobtained from survey data. Firms reported the percentage of totalmaterial inputs which was imported and an average was computed foreach industry group.
Other domestic costs
Other domestic costs include industrial and non-industrial
services done by others. Subsidies are also part of domestic costs sincethey represent costs from a social point of view. Other examplesinclude rent and royalty payments. These costs are simply added upand no longer adjusted.
Value of output
The value of output is composed of the amount of goods sold, thechange in finished goods inventory, and half of the change in work-in-process inventory. Exported output is separated from output soldlocally. Goods sold locally are converted into free trade terms bydeflating them with the official exchange rate and the implicit tariff.Exports are deflated only by the officialexchange ratesince tariffs andtaxes on exports are assumed to be zero.The sum of these two valuesbecomes the border value of production.Thus:
VX VDSBVO =_ +
OER OER•(1+Tj)
where BVO = border value of production;VX = value of goods sold locally;
40 4 Dennis D, Lapid
VDS = value of exports;OER = market exchange rate; and
Tj = implicit tariff on output.
The sum of the domestic portions of each cost item becomes thenumerator of the DRC formula, while the sum of the foreignportions is subtracted from the border value of production as part ofthe denominator.
TotalDomestic CostsDRC =
BorderValueof Production- TotalForeignCosts
All costs are expressed in shadow prices. Domestic costs, thenumerator, is valued in pesos. The border value of output and allforeign costs are in dollars and in border values.
Frequency distributions
Frequency distributions are used in order to show the linkbetween performance and other variables. Specifically, there is anattempt to relate efficiency with protection and firm size. Protectionis measured by EPRs, efficiency by the DRC and firm size by thelevel of employment.
To see the correlation between efficiency and protection, weconstruct a frequency distribution for the DI_C-SER ratio and theEPK. Establishments are classified according to the level of protectionusing multiples of the average EPR. for the entire manufacturingsector. Those with EPRs substantially exceeding the manufacturingaverage are considered highly protected. Observations are alsoclassified according to DR.C-SER. ratios. A possible correlationbetween high EPRa and high DRC-SER. ratios among establishmentswould imply that high levels of protection may have at least partlycaused inettlciency in the industry.
We also relate efficiency with firm size. Small-sized plants aredefined as having 5 to 99 employees; medium-sized,plants are thosewith 100 to 199; and large plants are those with more than 200. Small
Appliance Industry I_ 41
phnts may have experienced difficulties in importing needed partsbecause of exchange controls which tended to favor large firms. Inaddition, imported inputs typically embody technology that is
•unavailable to domestic firms (Nishimizu and Robinson 1984).Thehypothesis is that lifting of restrictions on various parts andcomponents enabled smaller plants to gain access to better-quality (orat least less costly) imported inputs and thus improve their efficiency.
TechnicalEfficiency
We compute measures of technical efficiency,which is defined asthe ability to produce the maximum possible output from a specifiedamount of inputs given existing technology (Nishimizu and Page1982). Most studies use Farrell's (1957) approach, which involvesestimating a frontier or "best practice" production function thatrepresents the maximum achievable output for any given level ofinputs. Attainment of the maximum is assumed to arise fromadherence to best practice. When maximum output is known, anindex of technical efficiency may be constructed using the ratiobetween actual output and the maximum level of output.
Nelson (1981) observes two weaknesses in the frontier model.First, it assumes that firms in an industry are sufficiently homogenousto be grouped together and represented by a single productionfrontier. Production technology may vary greatly even within anindustry, particularly with multi-product firms. Second, the use ofactual data to estimate the frontier may generate an averageproduction function instead of a "best practice" production frontier,which the estimation theoretically represents.
Two common methods for the estimation are the deterministic
method and the stochastic method. Deterministic models identify thedifference between actual output and maximum potential output asbeing exclusively due to inefficiency. Stochastic models, such as thatby Aigner, Lovell and Schmidt (1979), break up the deviation intotwo components: technical inefficiency and a random disturbanceterm. This separates technical inefficiency from other factocs which
42 _ Dennis D. Lapid
may cause deviations from the frontier, making stochastic modelsmore accurate than deterministic models. However, the statisticalsoftware for a stochastic model is not available. We use instead adeterministic model by Nishimizu and Page (1982) which estimates atranscendental logarithm (or translog) frontier production functionusing linear programming. The translog form imposes fewerrestrictions on the structure of production than the Cobb-Douglasform used in many studies and is regardedas more flexible.
The estimation uses plant-level data to compute technicalefficiency indices for plants in the appliance and electronic partsindustries. Since most firms in the appliance industry produce morethan one product and may therefore employ divergent technology fordifferent products, the observations are treated as a single sample ofmulti-product firms. Although this may precisely lead to an averagefunction, it seems reasonable since the sample for some subsectors istoo small for estimation. For the electronic parts industry, plants seemto be more homogenous.
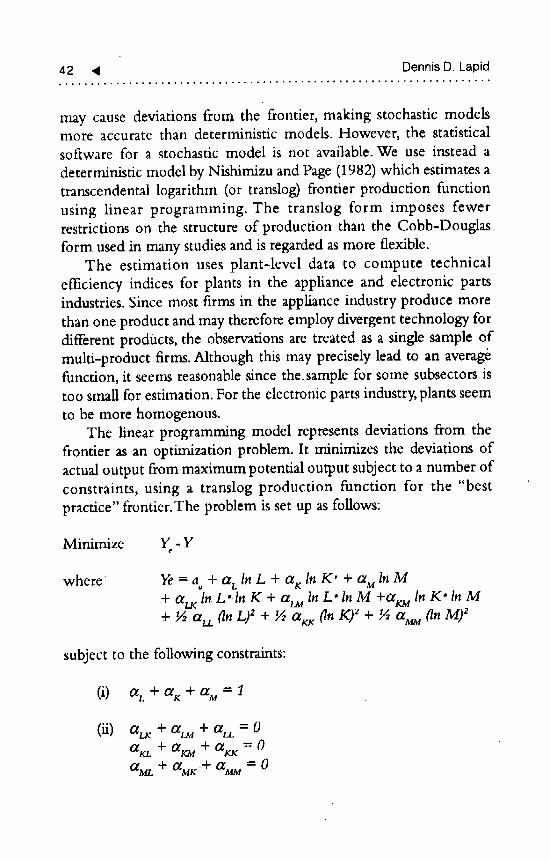
The linear programming model represents deviations from thefrontier as an optimization problem. It minimizes the deviations ofactual output from maximum potential output subject to a number ofconstraints, using a translog production function for the "bestpractice" frontier.The problem is set up as follows:
Minimize Y - Y
where Ye = ao+ ctLIn L + ctr In K" + a MIn M+ atr In L'ln K + CtLUin L" In M +arm In K" In M
�_er_ ('lnL)z + ½ at.x (In K)2 + ½ _ (InM)z
subject to the following constraints:
(i)a_+a K+% =I
(ii) au¢ + a_ + at,, = 0OtKL+ Otr._ + ark = 0
aML + _MK" q- _MM = 0
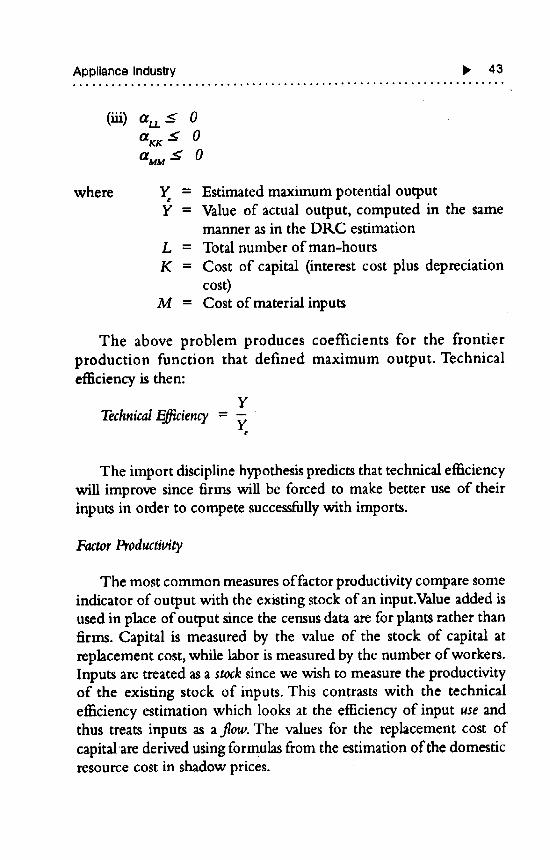
Appliance Industry I_ 43
(iii) a,, s 0am_< 0a_s 0
where Y = Estimated maximum potential outputY ffi Value of actual output, computed in the same
manner as in the DKC estimationL = Total number of man-hours
K = Cost of capital (interest cost plus depreciationCOSt)
M = Cost of material inputs
The above problem produces coefficients for the frontierproduction function that defined maximum output. Technicalefficiency is then:
Y
TechnicalEfficiency = -_ "
The import discipline hypothesis predicts that technical efficiencywill improve since firms will be forced to make better use of theirinputs in order to compete successfully with imports.
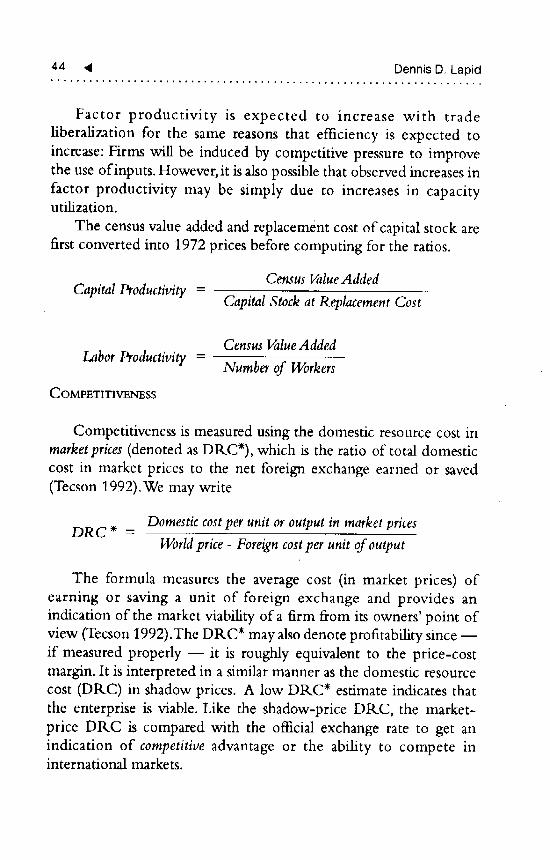
FactorProductivity
The most common measures of factor productivity compare someindicator of output with the existing stock of an input.Value added isused in place of output since the census data are for plants rather thanfirms. Capital is measured by the value of the stock of capital atrephcement cost, while labor is measured by the number of workers.Inputs are treated as a stock since we wish to measure the productivityof the existing stock of inputs. This contrasts with the technicalefficiency estimation which looks at the efficiency of input use andthus treats inputs as a flow. The values for the replacement cost ofcapital are derived using formulas from the estimation of the domesticresource cost in shadow prices.
44 _1 Dennis D, Lapid
Factor productivity is expected to increase with trade
liberalization for the same reasons that efficiency is expected to
increase: Firms will be induced by competitive pressure to improvethe use of inputs. However, it is also possible that observed increases in
factor productivity may be simply due to increases in capacityutilization.
The census value added and replacement cost of capital stock are
first converted into 1972 prices before computing for the ratios.
Census ValueAddedCapital Productivity =
Capital Stock at Replacement Cost
Census ValueAddedLabor Productivity =
Number of Workers
COMPETITIVENESS
Competitiveness is measured using the domestic resource cost in
market prices (denoted as DRC*), which is the ratio of total domestic
cost in market prices to the net foreign exchange earned or saved
(Tecson 1992).We may write
Domestic costper unit or output in market pricesD RC* =
World price - Foreign costper unit of output
The formula measures the average cost (in market prices) ofearning or saving a unit of foreign exchange and provides an
indication of the market viability of a firm from its owners' point of
view (Tecson 1992).The DRC* may also denote profitability since --
if measured properly -- it is roughly equivalent to the price-cost
margin. It is interpreted in a similar manner as the domestic resource
cost (DRC) in shadow prices. A low DRC* estimate indicates that
the enterprise is viable. Like the shadow-price DRC, the market-
price DRC is compared with the official exchange rate to get an
indication of competitive advantage or the ability to compete ininternational naarkets.
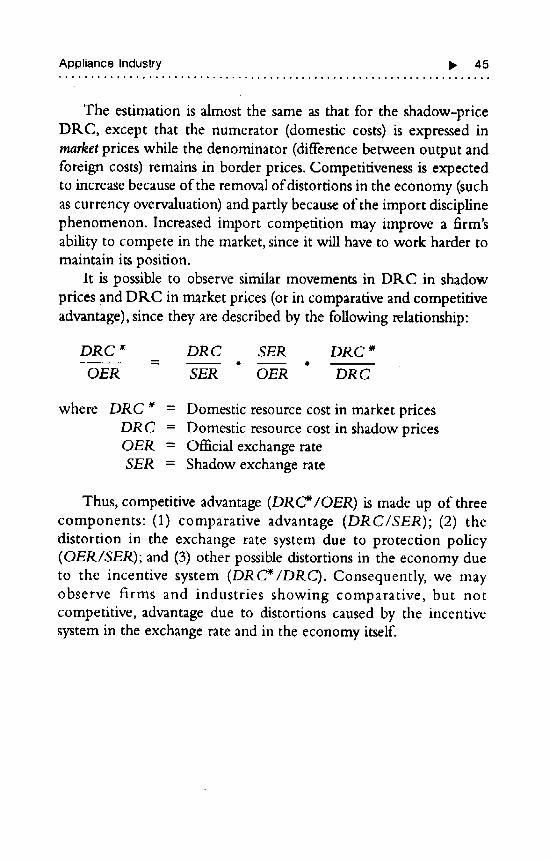
Appliance Industry II_ 45
The estimation is almost the same as that for the shadow-priceDRC, except that the numerator (domestic costs) is expressed inmarket prices while the denominator (difference between output andforeign costs) remains in border prices. Competitiveness is expectedto increase because of the removal of distortions in the economy (suchas currency overvaluation) and partly because of the import disciplinephenomenon. Increased import competition may improve a firm'sability to compete in the market, since it will have to work harder tomaintain its position.
It is possible to observe similar movements in DRC in shadowprices and DRC in market prices (or in comparative and competitiveadvantage), since they are described by the following relationship:
DR C _ DR C SER DR C _
OER SER OER DR C
where DRC _ = Domestic resource cost in market pricesDRC = Domestic resource cost in shadow pricesOER = Official exchange rateSER = Shadow exchange rate
Thus, competitive advantage (DRC*/OER) is made up of threecomponents: (1) comparative advantage (DRC/SER); (2) thedistortion in the exchange rate system due to protection policy(OER/SER); and (3) other possible distortions in the economy dueto the incentive system (DRC_/DRC). Consequently, we mayobserve firms and industries showing comparative, but notcompetitive, advantage due to distortions caused by the incentivesystem in the exchange rate and in the economy itself.
6Ott t _O#OOtIQ#O#Ottm_O#_t mla_
Analysis of Results
TH,s chapter examines the changes in the industry during tradepolicy reform. It presents the estimation results and attempts todescribe the adjustment process.
Competition is expected to increase with the entry of imports.Although lower concentration is expected, higher concentration mayoccur if industry rationalization takes place, since the concentrationmeasures pertain more to production concentration. Inefficiency isthen expected to decline and performance and competitivene.ss toimprove as domestic competition increases.
We examine changes in market structure, performance, andcompetitiveness and attempt to relate them with observed changes inprotection policy below.
PROTECTION POLICY
EffectiveProtectionRates
Effective protection rates (EPRs) measure the level of protectionon value added for a firm or industry. Estimates were made for theindustry and its subsectors using census data from ,the NSO aspresented in Table 4.
There is a general decline in effective protection between 1983and 1988 for the industry.The EPR. for the appliance industry wentdown significantly, by 40.56 percent, while those for the subsectors,including electronic parts, went down by half on the average. Audio-video appliances showed the largest decrease.
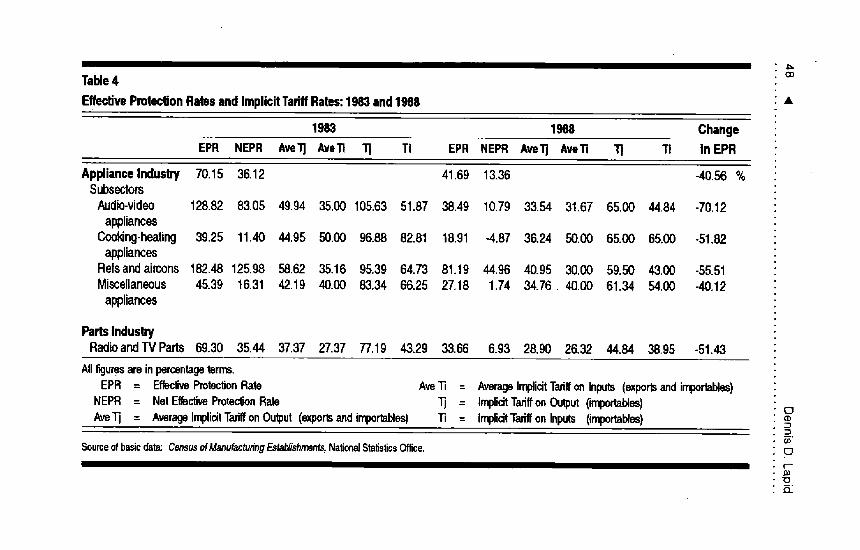
Table4 co
EffecUveProtectionRatesandImplicitTadffRates:1983and1988 •
1983 1988 Change
EPR NEPR AveTJ AveTt TJ TI EPR NEPR Ave'l'J Ave'l'i TJ 11 in EPR
ApplianceIndusby 70.15 36.12 41.69 13.36 -40.56 %Subsectors
Audio-video 128.82 83.05 49.94 35.00 105.63 51.87 38.49 10.79 33.54 31.67 65.00 44.84 -70.12appliances
Cooking-heating 39.25 11.40 44.95 50.00 96.88 82.81 18.91 -4.87 36.24 50.00 65.00 65.00 -51.82appliances
Refsandaircons 182.48 125.98 58.62 35.16 95.39 64.73 81.19 44.96 40.95 30.00 59.50 43.00 -55.51Miscellaneous 45.39 16.31 42.19 40.00 83.34 66.25 27.18 1.74 34.76. 40.00 61.34 54.00 -40.12appliances
PartsInduslryRadioandTV Parts 69.30 35.44 37.37 27.37 77.19 43.29 33.66 6.93 28.90 26.32 44.64 38.95 -51.43
NI _guresareinpercentageterms.
EPR = Effec_eProtec_rmRate Ave"13 = AverageImplicitTariffonInputs(exporlsandimportables)
NEPR = NetE_c'_e ProtedJonRate TI = ImplicitTariffonOutput('m'1_rtables) oAveT] = AverageImplicitTariffonOutput(exporlsandirnportsbles) "1i = ImplicitTariffonInputs(importab/es) -'-1
-I
Source of basic data: Census of ManufactufingEsta_ishrmnts, National Sta_stics Office. E3
_r_
-oEL
Applianceindustry I_ 49
As with the EPR, the averageimplicittar/_ in Table 4 measure thecombined protection on both importables and exportables. In general,the EPR tends to be higher (lower) than the average T. when the• J
average T, is greater (less) than the average T.. The implicit tari_ oninputs arid output (Ti and T,0 denote protection only on importsubstitutesand were used to derive border values for EPR. and DIKCestimates.
Effective protection on different types of goods is also partlyaffected by the exchange rate.Tradeable goods may either be penalized(relative to nontradeables) by an overvalued currency or protected byan undervalued currency (Tan 1979).The EPtLs are corrected for thedistortion in the exchange rate distortion to derive the net effectiveprotection rates (NEPILs):
OERNEPR - (EPR + 1)- 1SER
where OER = the official exchange rate; andSER = the shadow exchange rate.
The penalizing effect of currency overvaluation on tradeables relativeto nontradeables is shown by the similar movements in EPRs andNEPRs and the smaller values for the NEPRs.
To use more recent data, EPRs were also estimated for 1986 and
1991 using financial statements and survey data for the three firms.The EPRs went down between 1986 and 1991, indicating thatprotection also fell when restrictions were lifted in 1991 .The EPR forFirm A went down from 62.26 to 47.12 percent; for Firm B from91.05 to 65.87 percent; and for Firm C from 69.0 to 55.36 percent.
It is important to note that during the period 1983-1988, thereforms were still incomplete. Most import restrictions were notremoved until 1991. In addition, the EPR estimates account only forthe protective effect of tarif_ and taxes. The effect of quantitativerestrictions (QRs), another important protection measure for theindustry, is not captured in the figures above.
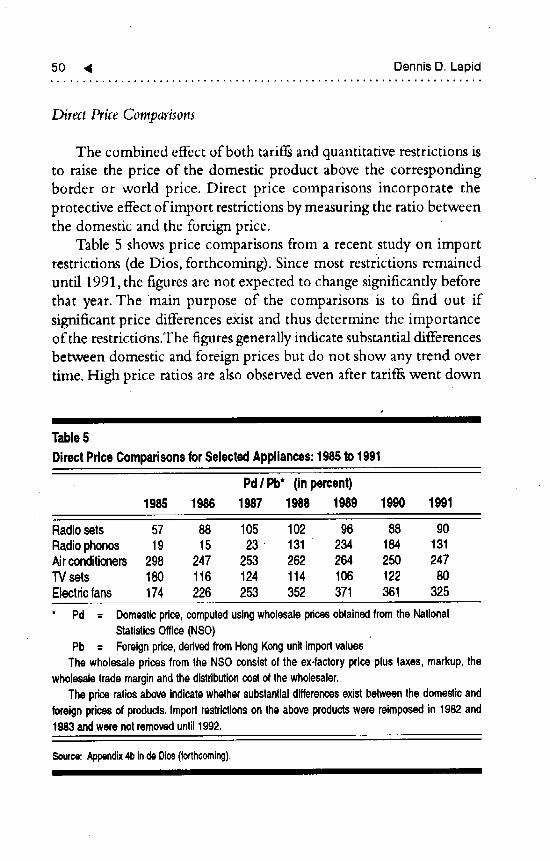
50 _1 Dennis D. Lapid
DirectPriceComparisons
The combined effect of both tarif_ and quantitative restrictions isto raise the price of the domestic product above the correspondingborder or world price. Direct price comparisons incorporate theprotective effect of import restrictions by measuring the ratio betweenthe domestic and the foreign price.
Table 5 shows price comparisons from a recent study on importrestrictions (de Dios, forthcoming). Since most restrictions remaineduntil 1991, the figures are not expected to change significantly beforethat year. The main purpose of the comparisons is to find out ifsignificant price differences exist and thus determine the importanceof the restrictions.The figures generally indicate substantial differencesbetween domestic and foreign prices but do not show any trend overtime. High price ratios are also observed even after tariffs went down
IIII I I
Table5
DirectPriceComparisonsforSelectedAppliances:1985to1991
Pd/ Pb* (inpercent)1985 1986 1987 1988 1989 1990 1991
Radiosets 57 88 105 102 96 88 90Radiophonos 19 15 23• 131 234 184 131Airconditioners298 247 253 262 264 250 247TVsets 180 116 124 114 106 122 80Electdcfans 174 226 253 352 371 361 325
• Pd = Domesticprice,computedusingwholesalepdcesobtainedfromtheNationalStatisticsOffice(NSO)
Pb = Foreignpdce,dedvadfromHongKongunitimportvaluesThewholesalepricesfromtheNSOconsistof theex-factorypriceplustaxes,markup,the
wholesaletrademarginandthedistributioncostofthewholesaler.ThepriceratiosaboveIndlcetewhethersubstantialdifferencesexistbetweenthedomesticand
foreignpricesofproducts.Importrestrictionsontheaboveproductswerereimposedin 1982and1983andwerenotremoveduntil1992.
Source:Appendix4bindeDios(forthcoming),I llllIll J II
Appliance Industry I_ 51
D a possible effect of the restrictions. The restrictions thus seem tohave a considerable effect on the level of protection.
However, although the restrictions appear to be important inprotecting the industry, they do not seem to be fully binding for twomasons. One is that the share of imports (to be discussed below)increased. The other is that substantial domestic,.foreign pricedifferences were observed bothbefore and after tariffs were reduced.
It can also be argued that the share of imports would be higher if noQRs were present.Thus, the restrictions seem to have raised the priceof imports and may have dampened the positive effects of reducedprotection, hut they also did not completely curtail imports.
Overall Changesin Protection
We observe a general reduction in effective protection usingcensus data for the appliance and electronic parts industries. Similarly,the estimates from the survey point to a possible reduction in effectiveprotection between 1986 and 1991. However, we also find substantialdifferences between the domestic and foreign prices of some
appliances, which may be an effect of the quantitative restrictions.The quantitative restrictions appear to be not fully binding since theshare of imports increased even as substantial price differences wereobserved.
We turn to the corresponding changes in the level of competition,performance, and competitiveness in the succeeding discussion.
MARKET STRUCTURE
Competitionfrom Imports
We first measure the effect of trade liberalization on the amount
of competition from imports. Import penetration ratios, defined asthe share of imports in total domestic demand, are estimated fromcensus and trade data using a match-up of commodities and censussubsectors constructed for the study.
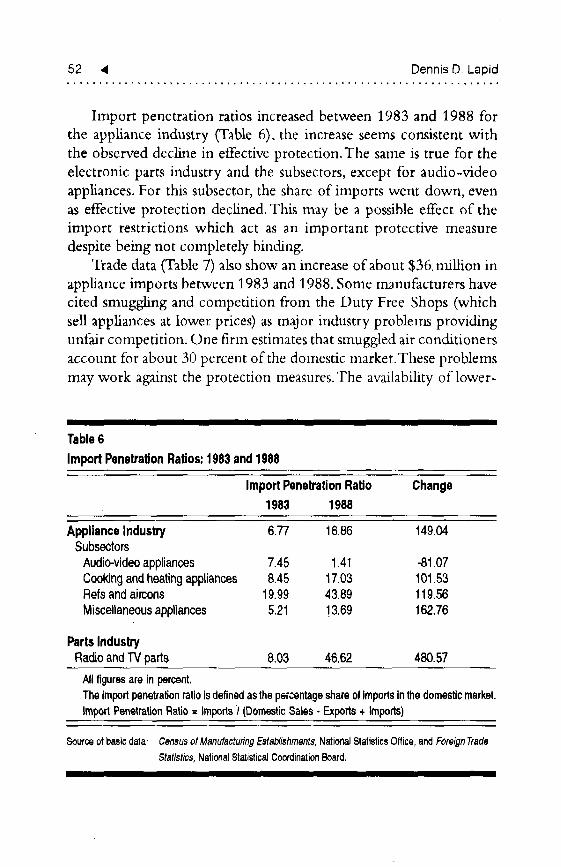
52 4 DennisD Lapid
Import penetration ratios increased between 1983 and 1988 for
the appliance industry (Table 6). the increase seems consistent with
the observed decline in effective protection.The same is true for the
electronic parts industry and the subsectors, except for audio-video
appliances. For this subsector, the share of imports went down, evenas effective protection declined. This may be a possible effect of the
import restrictions which act as an important protective measure
despite being not completely binding.Trade data (Table 7) also show an increase of about $36. miUion in
appliance imports between 1983 and 1988. Some manufacturers have
cited smuggling and competition from the Duty Free Shops (whichsell appliances at lower prices) as major industry problems providing
unfair competition. One firm estimates that smuggled air conditioners
account for about 30 percent of the domestic market.These problems
may work against the protection measures. The availability of lower-
• I II III II I
Table6
ImportPenetrationRatios:1983and1988
ImportPenetrationRatio Change1983 1988
ApplianceIndustry 6,77 16,86 149.04Subsectors
Audio-videoappliances 7.45 141 -81.07Cookingandheatingappliances 8,45 17.03 101.53Refsandaircons 19.99 43.89 119.56Miscellaneousappliances 5.21 13,69 162.76
PartsIndustryRadioandTVparts 8,03 46.62 480.57
Allfiguresareinpercent.Theimportpenetrationratioisdefinedasthepercentageshareofimportsinthedomesticmarket.importPenetrationRatio= Imports/ (DomesticSales.Exports+ Imports)
Sourceofbasicdata:CensusofManufacturingEstablishments,NationalStatisticsOffice,andForeignTradeStatistics,NationalStatisticalCoordinationBoard,
I I I
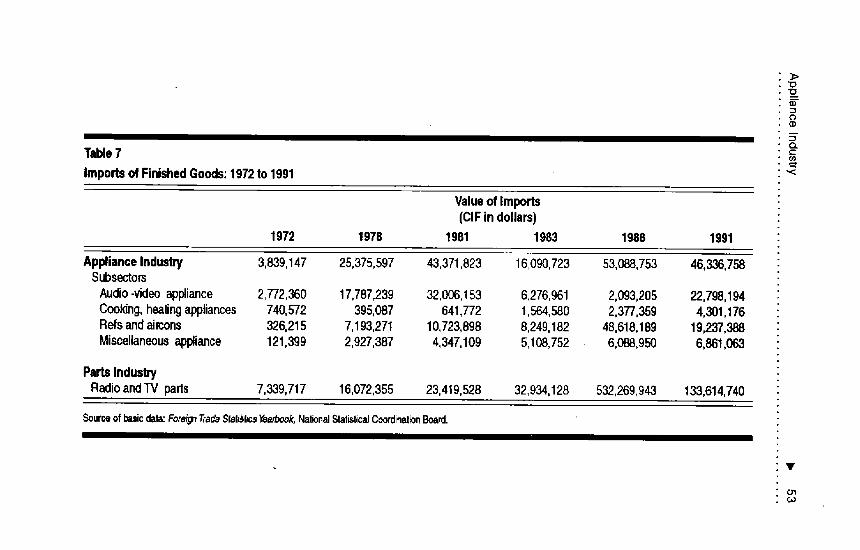
>
CJ
Q.TaUe7
Importsof FinishedGoods:1972to1991
Valueof Imports(CIFindollars)
1972 1978 1981 1983 1988 1991
ApplianceIndustry 3,839,147 25,375,597 43,37t,823 16,090,723 53,088,753 46,336,758Subsectors
Audio-videoappliance 2,772,360 17,787,239 32,006,t53 6,276,961 2,093,205 22,798,194Cooking,healingappliances 740,572 395,087 641,772 t,5641580 2,377,359 4,301,176Refsandaircons 326,215 7,193,271 10,723,898 8,249,182 48,618,189 19,237,388Miscellaneousappliance 121,399 2,927,387 4,347,109 5,108,752 6,088,950 6,861,063
PartsInduslryRadioandTV parts 7,339,717 16,072,355 23,419,528 32,934,128 532,269,943 133,614,740
Sourceof basicdata:Fore/g_Trad_StatiMics"_sarbook,Naf_onalStalist_calCoordinet_onBoard.
V
O'1Co
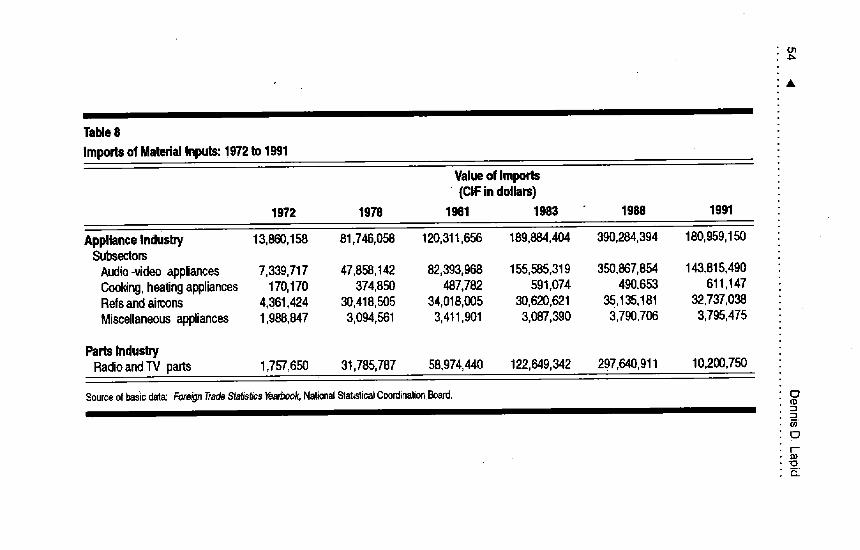
O1.b=
Taide8
Importsof MaterialInputs:!972to1991
ValueofImports• (CIFindo41ars)
1972 1978 1981 1983 1988 1991
ApplianceIndusbT" 13,860,158 81,746,058 120,311,656 189,884,404 390,284,394 180,959,150SubsectorsAudio-videoappliances 7,339,717 47,858,142 82,393,968 155,585,319 350,867,854 143,815,490Cooking,hea_ngappliances 170,170 374,850 437,782 591,074 4911,653 611,147Refsandaircons 4,361,424 30,418,505 34,018,005 30,620,621 35,135,181 32,737,038Miscellaneousappliances 1,988,847 3,094,561 3,4tl 1901 3,087,390 3,790,706 3,795,475
PartsIndusln/RadioandTV parts 1,757,650 31,785,787 58,974,440 122,649,342 297,640,911 10,200,750
SourceOfbasicdata:Forek_TradeStatics_ NationalStat_icatCoordinationBoard. 0• _,
or-
'oCL
Appliance Industry _ 55
priced imports, legal or otherwise, effectively increases importcompetition, and may also contribute to the changes in performanceand competitiveness. Duty Free sales, for example, may have helpedto increase the share of imports in spite of the import restrictions.
Concentration
The degree of domestic competition is measured by indicators ofconcentration, defined as the number and size distribution of firms inthe market (Lee 1992). Higher concentration may imply a greateramount of influence for the larger firms and a lower degree ofcompetition. The study uses four-plant concentration ratios (CR4)and Herfindahl indices for the industry and the subsectors. The CR.4is the combined share of the largest four plants in total value added oroutput for the industry, while the Herflndahl index is the sum of thesquares of the shares of all plants.
Trade liberalization is expected to foster greater competition.However, the concentration measures exclude the share of importsand thus reflect concentration only among producersrather than sellers.Greater competition in the industry may therefore occur with eitherhigher or lower concentration. A rise in concentration, for example,may simply be due to the rationalizingeffect of trade reform, whichforces out inefficient producers attracted earlier to the industry byhigh protection.
The Herfindahl index shows reduced concentration for the
appliance industry (Table 9), although the four-plant concentrationratio seems to have hardly changed. The Herfindahl index isconsidered more accurate since it includes all plants in the industry (orsubsector), whereas the CR4 shows only one point on the cumulativedistribution curve for the industry (Lee 1992).
Both measures declined for miscellaneous appliances andelectronic parts. Both increased for cooking-heating appliances andrefrigerators-air conditioners,possibly indicating the exit of inefficientproducers. For audio-video appliances, the concentration ratioincreased while the Herfindahl index went down. Thus, even as the
share of the largest four plants increased, the size dispersion of plants
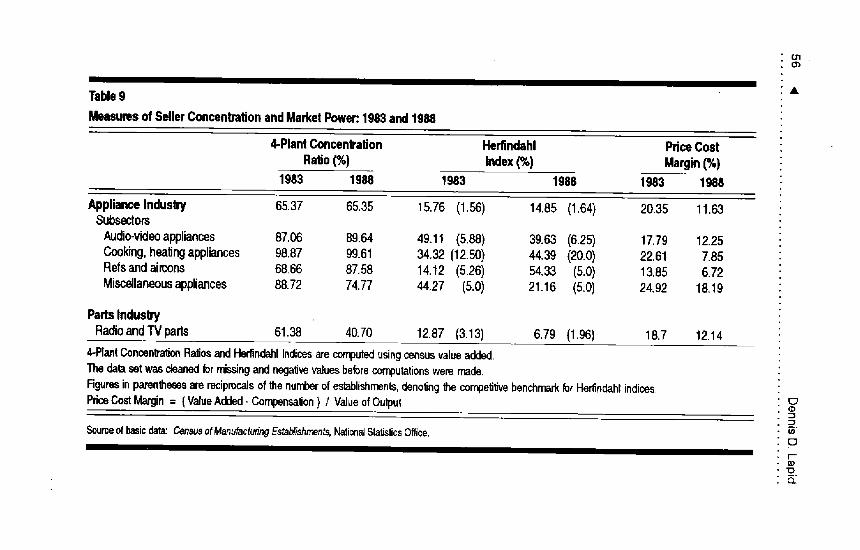
0'1Cr_
TaMe9 •
Measuresof SellerConcentrationandMarketPower:.1983and1988
4-PlantConcenb'alion Herfindahl PriceCost
Ratio(%) Index(%) Margin(%)1983 1998 1983 1988 1983 1988
Appliencelndusby 65.37 65.35 15.76 (1.56) 14.85 (1.64) 20.35 11.63Subsectors
Audio-videoappliances 87.06 89.64 49.11 (5.88) 39.63 (6.25) 17.79 12.25Cooking,heatingappliances 98.87 99.61 34.32 (12.50) 44.39 (20.0) 22.61 7.85Refsandaircons 68.66 87.58 14.t2 (5.26) 54.33 (5.0) 13.85 6.72Miscellaneousappliances 88.72 74.77 44.27 (5.0) 21.16 (5.0) 24.92 18.19
PartsIndustry
RadioandTV parts 61.38 40.70 12.87 (3.13) 6.79 (1.96) 18.7 12.14
4-PlantConcenlra_onRatiosandHedindahlIndicesarecomputedusingcensusvalueadded.ThedatasetwascleanedIormissingandnega_vevaluesbeforecogitationsweremade.Figuresinparen_ arereciprocalsof te numberofestablishments,denotingP,ecompetJWebenchmarkforHerfindahtindices.PriceCostMargin= (ValueAdded-CompensaHon) / ValueofOutpu( o
Sourceofbasicdata:CensusofManufacturingEstabtishments,NationaJStatJslicsOffice. _E3I'-"
5:
ApplianceIndustry b, 57
seems to have narrowed down. Concentration may thus generally havedecreased for the appliance subsectors. It also appears to havedecreased for the electronic parts industry based on both measures.The industry, however, remained highly concentrated in 1988.This isindicated by (a) the largest four plants comprising more than 60percent of industry size, or Co)the Herfindahl index being significantlygreater than the reciprocal of the number of plants, assuming a sizablenumber of plants. A larger Herfindahl index indicates greaterdispersion in the size distribution of plants in the industry. Theconcentration ratio for appliances decreased but was still above 60percent in 1988; the same is observed for miscellaneous apphances.By contrast, the radio andTV parts subsector became only moderatelyconcentrated in 1988.
The increases in concentration in two subsectors (cooking-heatingand refs-aircons) coincided with reduced protection and may signifysome sort of rationalization due to trade policy reform. For the othersubsectors and the parts industry, reduced concentration and higherimport penetration ratios imply a move towards greater competition.It thus appears that competition in the industry hasgenerally increasedwith the entry of imports.
Number and Size Distributionof Plants
Between 1983 and 1988, the total number of plants decreasedslightly for the apphance industry and increased by more than half forthe parts industry (Table 10). Audio-video and cooking-heatingappliances had fewer plants, miscellaneous appliances showed nochange and refs-aircons added one more. As for size,small plants aredefined as those with 5-99 employees, medium-sized plants with 100-199 employees, and large plants with more than 200.
The number of small plants did not change in the applianceindustry, but the number of both medium-sized and large plants fell,causing a larger proportion of the smallplants (from 58 to 61 percent).The majority, however, were large in both years. For the electronicparts industry, there was an increase in all size groups, with the smallplants ahnost doubhng in number. The proportion of small plants
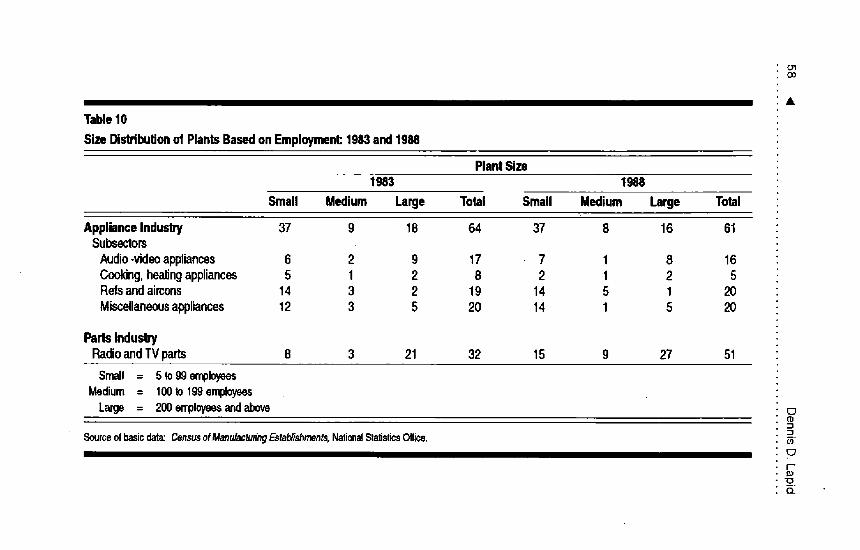
C-'1Co
&
TaMe10
Size[Hs_buUonof PlantsBasedonEmployment:1983and1988
PlantSize1983 1988
Small Medium Large Total Small Medium Large Total
ApplianceIndustw 37 9 18 64 37 8 16 61Subsectors
Audio-videoappliances 6 2 9 17 7 1 8 16Cooking,healingappliances 5 1 2 8 2 1 2 5Refsandaicons 14 3 2 19 14 5 1 20Miscellaneousappliances 12 3 5 20 14 1 5 20
PartsIndustryRadioandTVparts 8 3 21 32 15 9 27 51
Small = 5 to99employeesMedium= 100to199employees
Large = 200en"doyeesandabove o-I
Source of ba_c data: Census ofManufactumg Estab_'_ts, National Stalistics Office. _-
i--
cL
Appliance Industry _ 59......... o ........ , ........ ° ........ , ............... . ...............
increased from 25 to 29.4 percent, while that ofhrge plants decreasedfrom 65.6 to 52.9 percent. Most of the phnts were likewise large inboth years.
The increased relative proportion of small plants in the industrycoincides with reduced concentration, bolstering the possibility thatreduced protection resulted in a more competitive industry structure.
Profitabilityand Market Power
The extent of market power, or the ability to raise prices abovemarginal cost, is another indicator of the amount of competition. Acommonly-used measure for market power is the price-cost margin(PCM), which is also associated with profitability and thereforeprovides an indication of the amount of profits where highconcentration is expected (Scherer 1980). Price-cost margins areexpected to decline since increased import competition is expected toreduce the ability of firms to raise prices above marginal cost.
The results seem to agree with expectations. Price-cost marginswent down for the appliance industry, its subsectors, and for theelectronic parts industry (Table 9). Interestingly, except for the audio-video subsector, reduced price-cost margins seem to be associatedwith higher import penetration ratios (shown in Table 6). Increasedcompetition from imports may have reduced the profitability ormarket power of incumbents. In addition, except for the cooking-heating and ref-aircon subsectors, lower price-cost margins alsocoincide with lower concentration based on Herfindahl indices.This
agrees with findings by earlier studies (e.g., Cowling 1976) of apositive relationship between concentration and price-cost margins.
Lower price-cost margins are observed with higher Herfindahlindices and higher import ratios in the ref-aircon and cooking-heatingsubsectors, which may imply rationalization from increased importcompetition. For miscellaneous appliances and electronic parts, lowerprice-cost margins coincided with reduced concentration andincreased import penetration J likewise signifying greatercompetition. Audio-video appliances showed a different combinationof results: reduced import competition with decreased concentration
60 _ Dennis D. Lapid
and a lower price-cost margin. The reduced import share may havebeen due to improved competitiveness of audio-video productswhich in turn may have been brought about by heightenedcompetition as implied by the lower price-cost margin.
Reduced market power and profitability within the industry thusseem to be attended by two things: An overall increase in the share ofimports and a general reduction in industry concentration.
OverallChanges in Market Structure
To summarize, we observe the following changes in the structureof the industry: an increased share of imports, a general reduction inconcentration, and an overall reduction in profitability and marketpower. These changes coincide with reduced protection and implyincreased competition in both the appliance industry and theelectronic parts industry.The census data also show a greater numberof establishments in the industry. Lower profitability andconcentration may have been due to competition from new entrants.The size distribution also indicates that a sizable proportion of thenew plants are small. Lower market power and profitability, therefore,seem to be associated with reduced effective protection and increasedcompetition either from new entrants, which appear to be small, orfrom imports.
Given these observations, the important question will concernthe links between reduced protection and increased competition onthe one hand, and changes in performance and competitiveness onthe other.
PERFORMANCE
Exports
As earlier noted, the industry is primarily domestic-oriented:Local subsidiaries,joint ventures and Filipino-owned firms primarilysell to the domestic market, and this inward orientation may be traced
Appliance industry I_ 61..... , ......... , ........... **°..o .... . .......... ** ........... 44* ....
partly to substantial protection. Exports are expected to increase withtrade liberalization. The increased share of imports may reduce theprofitability of the local market, and make exports a means ofexpanding a firm's effective market.
Exports have been rising steadily in nominal terms (Table 11).The largest share belongs to audio-video appliances, but the othersubsectors seem to be catching up. The share of exports in totaloutput, computed from NSO input-output data, likewise increasedfrom 4.45 percent in 1983 to 23.38 percent in 1988. Export ratioscannot be computed for radio andTV parts, but the trade data showan increase of about $50 million in the value of exports between 1983and 1988.
Industry sources say that some appliance firms are actually losingmoney in exports and recover losses only through local sales.Moreover, the decision to export is largely determined by strategicconcerns, particuhrly for subsidiaries of foreign firms. Exporting alsoentails a number of problems, such as costly delays in processingnecessary documents. It is encouraging, however, that the industrygenerally seems to have become more export-oriented, possibly usingthe local market to sustain efforts to enter the export market. Theliberalization process may have also led to the greater interest inexports by inducing firms to consider prospects outside the domesticmarket.
AUocativeEfficiency
DlLC in shadow prices increased for the appliance industry butwent down for two of its subsectors, namely audio-video andcooking-heating appliances (Table 12). Higher DI:LCswere observedfor re£s-aircons, miscellaneous appliances, and the radio-TV partsindustry.
However, ratios of the DKC and the shadow exchange rate (SEIL)uniformly went down for the industry and its subsectors, indicatingreduced allocative inefficiency and improved comparative advantage.The SEtL represents the social value of foreign exchange and is set at25 percent above the market exchange rate to reflect the overvaluation
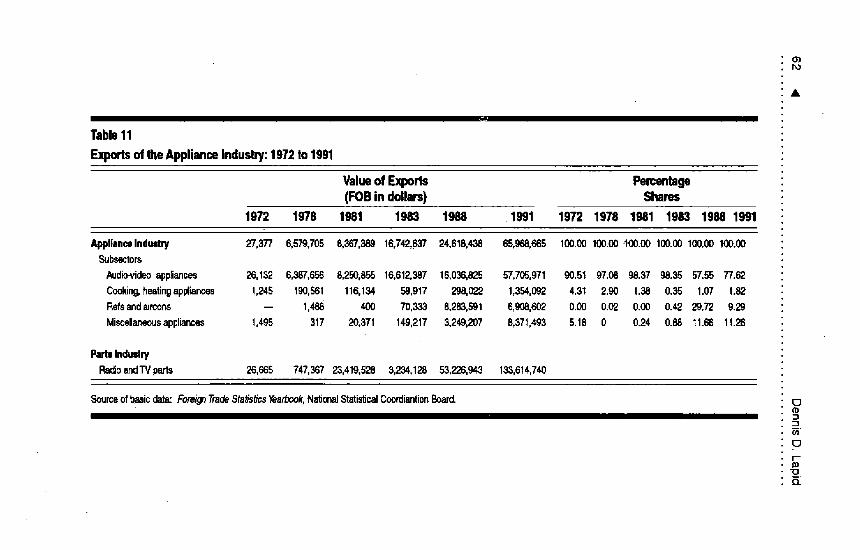
o)Po
Table11
Exports of the Appliance industry:1972to 1991
Valueof Exports Percentage(FOBin dollars) Shares
1972 1978 1981 1983 1988 .1991 1972 1978 1981 1983 1988 1991
Appfiancelndustry 27,377 6,579,705 8,367,389 16,742,637 24,618,438 65,968,665 100.00 ICO.CO.t00.00 100.00 100.00 100.00Subsectors
Audio-videoappliances 26,132 6,387,666 8,250,855 16,612,387 16,036,825 57,705,971 gO.5t 97.08 98.37 38.35 57.55 77.62
Cooking,heatingapl_ianc_s 1,245 190,561 116,134 59,917 298,322 1,354,092 4.3t 2.90 1.38 0.35 1.07 1.82
Refsandaircons -- 1,488 400 70,333 ¢283,591 6,908,602 0._0 0.02 0.(X) 0.42 29.72 9.26
Miscelaneousappliances 1,495 317 20,371 149,217 3,249,207 8,371,493 5.18 0 0.24 0.68 11.66 11.26
PadsIndustP/
RadloandTVparts 26,665 747,357 23,419,528 3,234,128 53,226,943 133,614,740
Sourceofbasicdata: Fore_ TradeSta_'s_s Yearbook,NationalStati_cal Coo¢liantionBoard(b
E3I'--
io
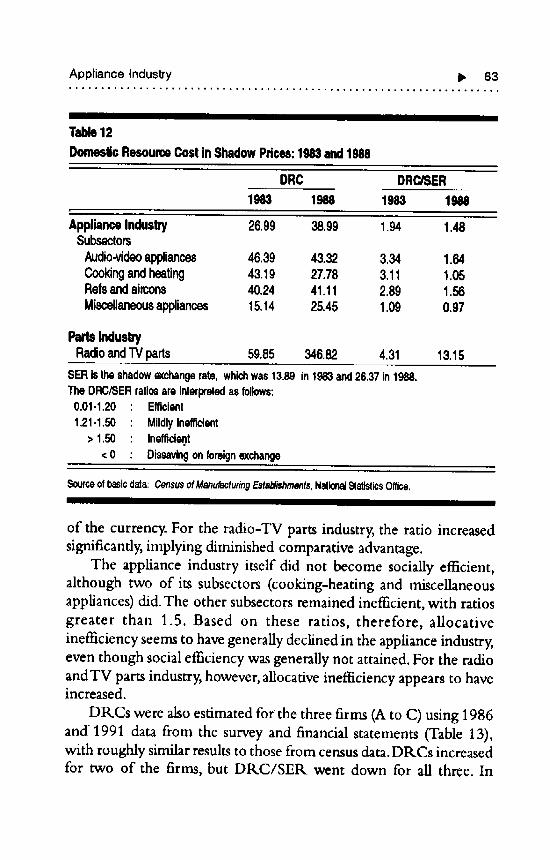
Appliance Industry I_ 63
I111III Immlll I I II
Table12
DomesticResourceCostinShadowPrices:1983and1988
DRC DRC/SER1983 1988 1983 1988
ApplianceIndustry 26.99 38.99 1.94 1.48SubsectorsAudio-videoappliances 46.39 43.32 334 164Cookingandheating 43.19 27.78 3.11 1.05Refsandaircons 40.24 41.11 2.89 1.56Miscellaneousappliances 15.14 25.45 1.09 0.97
PartsI.dus_RadioandTVparts 59.85 346.82 4.31 13.15
SERistheshadowexchangerate,whichwas13.89in1983and26.37in1988.TheDRC/././SERratiosareinterpretedasfollows:0.01-1.20 : Efficient
1,21-1.50 : MildlyInefficient> 1,50 : Inefficier)t
<0 : Dissavingonforeignexchange
Sourceofbasicdata:CensusofManufacturingEstablishments,NationalStatisticsOffice.I II I
of the currency. For the radio-TV parts industry, the ratio increasedsignificantly, implying diminished comparative advantage.
The appliance industry itself did not become socially efficient,although two of its subsectors (cooking-heating and miscellaneousappliances) did. The other subsectors remained inefficient, with ratiosgreater than 1.5. Based on these ratios, therefore, allocative
inefficiency seems to have generally declined in the appliance industry,even though social efficiency was generally not attained. For the radioandTV parts industry, however, allocative inefficiency appears to haveincreased.
DRCs were also estimated for the three firms (A to C) using 1986and 1991 data from the survey and financial statements (Table 13),with roughly similar results to those from census data. DtkCs increasedfor two of the firms, but DR.C/SER went down for all three. In
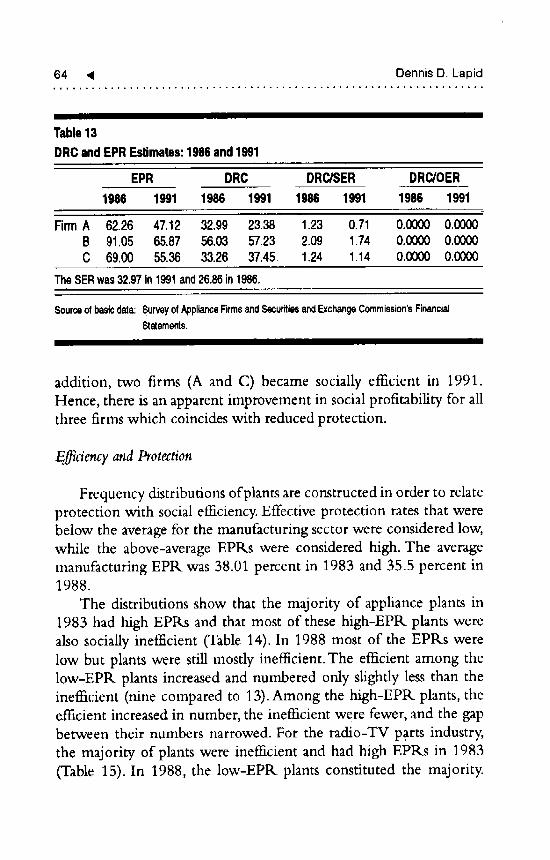
64 _ Dennis D. Lapid
III JIL I
Table13DRCandEPREstimates:1986and1991
EPR DRC DRC/SER DRC/OER1986 1991 1986 1991 1986 1991 1986 1991
FirmA 62.26 47.12 32.99 23.38 1.23 0.71 0.0000 0.0000B 91.05 65.87 56,03 57,23 2.09 1.74 0.0000 0.0000C 69,00 55.36 33.26 37,45 1,24 1.14 0.0000 0.0000
TheSERwas32,97In1991and26.86in1986.
Sourceof basicdata: SurveyofApplianceFirmsandSecuritiesandExchangeCommission'sFinancial
Statements,
II
addition, two firms (A and C) became socially efficient in 1991.Hence, there is an apparent improvement in social profitability for allthree firms which coincides with reduced protection.
E_ciency and Protection
Frequency distributions of plants are constructed in order to relateprotection with social efficiency.Effective protection rates that werebelow the average for the manufacturing sector were considered low,while the above-average EPRs were considered high. The averagemanufacturing EPR was 38.01 percent in 1983 and 35.5 percent in1988.
The distributions show that the majority of appliance plants in1983 had high EPtLs and that most of these high-EPR plants werealso socially inefficient (Table 14). In 1988 most of the EPRs werelow but plants were still mostly inefficient. The efficient among thelow-:EPR plants increased and numbered only slightly less than theinefficient (nine compared to 13). Among the high-EPR plants, theefficient increased in number, the inefficient were fewer, and the gapbetween their numbers narrowed. For the radio-TV parts industry,the majority of plants were inefficient and had high EPRs in 1983(Table 15). In 1988, the low-EPR plants constituted the majority.
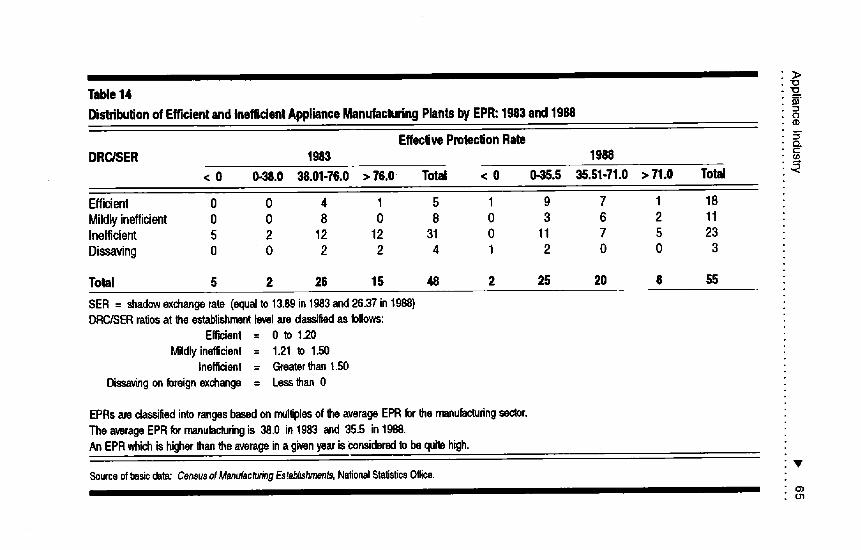
3>10
Table14 1o9)
Distribution of Efficient and Inefficient Appliance Manufacturing Plants by EPR:1983and 1988 (D
EffecUveProtectionRate _.DRC/SER 1983 1988
< 0 0-38.0 38.01-76.0 > 76.0 Total < 0 0-35.5 35.51-71.0 • 71.0 Total _<
Eff'¢ient 0 0 4 1 5 1 9 7 1 18
Mildtyinefficient 0 0 8 0 8 0 3 6 2 11Inefficient 5 2 12 12 31 0 11 7 5 23
Dissaving 0 0 2 2 4 1 2 0 0 3
Total 5 2 26 15 48 2 25 20 8 55
SER= shadowexchangerate(equalto13.89in1983and26.37in1988)DRCJSERratiosat_e establishmentlevelaredasdfiedasUlow¢
Elficiant = 0 to 120
Mildlyinefficient= 1.21to 1.50inefficient= Greaterthant.50
Dissavingonforeignexchange = Lessbhan0
EPRsareclassifiedintorangesbasedonrngl_plesoftheaverageEPRforthemanufacturingsector.TheaverageEPRformanufactudngis 38.0 in1983and35.5 in1988.AnEPRwhichishigherthantheaverageinagivenyearisconsideredto bequitehigh.
Sourceofbasicdata:CensusofManufacfu,'ingEsfablishments,Na_nalStalJsticsOffcce.03rJ_
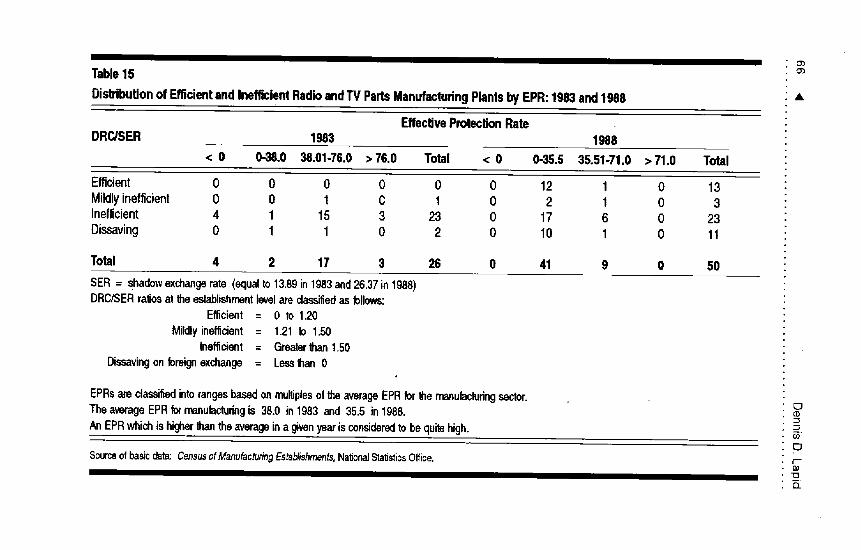
Cr'j
Table15 o_
Disldbu6onof Efficientand InefficientRadioandTV PartsManufactudngPlantsby EPR:1983and1988 A
EffeclJveProtectionRateDRC/SER 1983 1988
< 0 0-38.0 38.01-76.0 • 76.0 Total < 0 0-35.5 35.51-71.0 > 71.0 Total
Efficient 0 0 0 0 0 0 t2 1 0 13Mildlyinefficient 0 0 t O 1 0 2 1 0 3Inefficient 4 1 15 3 23 0 17 6 0 23Dissaving 0 1 1 0 2 0 I0 1 0 1t
Total 4 2 17 3 26 0 41 9 0 50
SER= shadowexchangerate (equalto13.89in1983aru:126.37in1988)DRC/SERra_osattheestablishmentlevelaredessifiedasfollows:
Ef_cient = 0 to 1.20Mildlyinefficient= 1.21to 1.50
inefficient= Greaterthan1.50Dissavingonforeignexchange= Less1hart0
EPRsareclassifiedintorangesbasedonrnul_plesof theaverageEPRforthen'_ufacturingsector.E3Thea_srageEPRforn,anufacturingis 38.0 in1983and 35.5in 1988. _o
AnEPRwhichishigherthantheaverageinagivenyearisconsideredtobequitehigh. _E3
Source of basic _ta: Census of Manufacturing Establishments, National Sta_stics Office. _-m
-oEL
ApplianceIndustry I_ 67
Most of these plants were still inefficient, but the efficient haveincreased in number. Almost all of the high-EPR plants wereinefficient.Thus, it generally seems that slightly better results in termsof efficiency were observed among the plants with relatively lowEPRs.This would imply that reduced protection has some links withimproved efficiency.
EFFICIENCYANDESTABLISHMENTSIZE
Similar distributions are made to relate size with efficiency.Efficient and inefficient plants are classified by size based onemployment. Plants with five to 99 employees were classified as small,those with 100 to 199 as medium-sized,and those with 200 and moreas/arge.
The majority of both smalland large appliance plants were sociallyinefficient in 1983 (Table 16). In 1988, the majority of the smallplants were still inefficient, but a greater number became efficient.Most of the large plants were socially efficient. For the radio---TVpartsindustry, the majority of both large and small plants were sociallyinefficient in 1983 (Table 17). In 1988, inefficient small plantsnumbered sfightly more than the efficient small plants, while most ofthe large plants were still inefficient.
The small plants in the appliance industry increased and a greaternumber of them were also efficient. The number of medium- and
large-sized plants did not change significantly. It is thus possible that agood proportion of the new appliance plants in 1988 were both smalland relatively efficient.Trade data show an increase of $200 million inindustry imports of material inputs, parts, and components between1983 and 1988 (Table 8).This supports the hypothesis that a largerproportion of small plants gained access to imported inputs because oflower protection.The increased accessto imported inputs may have inturn contributed to the efficiency gains for the industry as a whole.
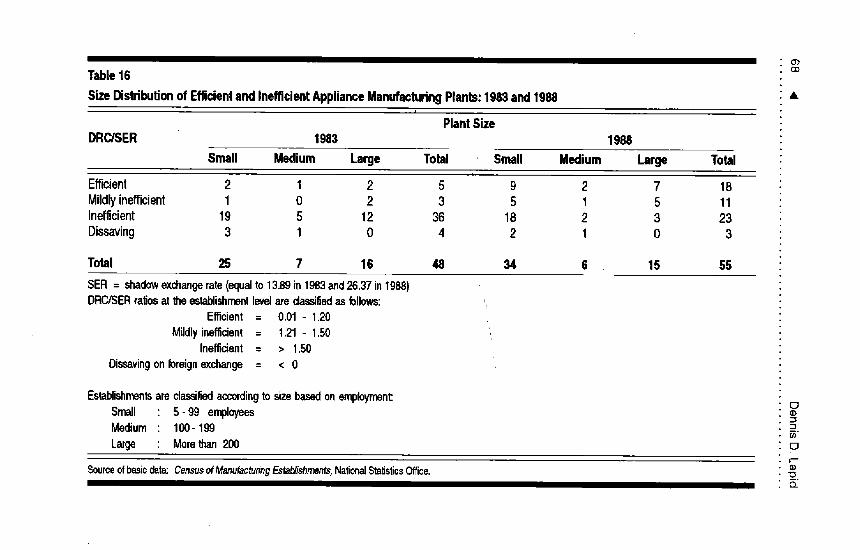
cr_
Table16 o_
SizeDisldbutJonof EfficientandInefficientApplianceManufacluringPlants:1983and1988 &t
Plant SizeDRC.JSER 1983 1988
Small Medium Large Total Small Medium Large Total
Effmient 2 1 2 5 9 2 7 18Mildlyinefficient 1 0 2 3 5 1 5 11Inefficient 19 5 12 36 18 2 3 23Dissaving 3 1 0 4 2 1 0 3
Total 25 7 16 48 34 6 15 55
SER= shadowexchangerate(equal1o13.89in 1983and26.37in1988)DRC_JSERraEosattheestablishmentlevelaredassiffedasfollows:
Efficient= 0.01- 1.20Mildlyinefficient= t21 - 1.50 =
Inefficient= • 1.50Dissavingonforeignexchange= < 0
Establishrnentsaredass_edaccordingtosizebasedonemployment:Small " 5- 99 employees _rMedium• 100-199 _2.
r_
Large • Morethan200 ot--
Sourceofbasic_ta: CensusofMenufactuhngEsfabh'shments,Na_or_Sta_sScsOffice. =o"0
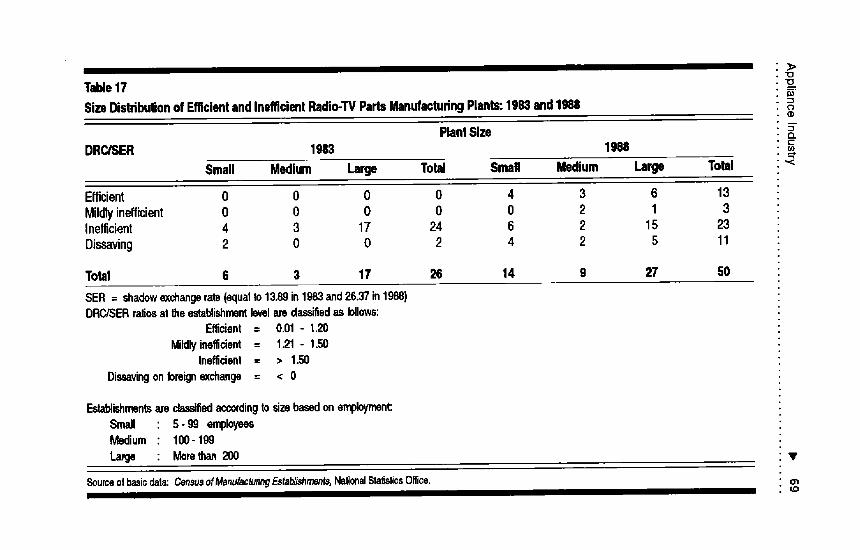
_>"[3
Table 17 _--SizeDistdbulJonof EfficientandInefficientRadio-TVPadsManufactudngPlants:1983and1988 o'CD
Plant Size _.DRC/SER 1983 1988 c
Small Medium Large Total Small Medium Large Total '<
Efficient 0 0 0 0 4 3 6 13
Mildlyinefficient 0 0 0 0 0 2 1 3Inefficient 4 3 17 24 6 2 15 23
Dissaving 2 0 0 2 • 4 2 5 11
Total 6 3 17 26 14 9 27 50
SER = shadowe_changerate(equalto13.89in1983and26.37in1988)DRCISERraEosatt_eestaUishmentlevelaredassifiedasbllows:
Efficient= 0.01- 1,20
Mildlyinefficient= t.21 - 1.50Ine_cienl = • 1.50
Dissavingonbreigne_change= < 0
Est_ishmentsaredas,siliedaccordingtosizebasedonemployment:Small : 5- 99 employeesMedium : 100-199
Large : Mornthan200 •
Sourceo{basicdateCansusofManufacturingEstab/ishmen_Na_onalSta'dsticeOffice.rj_
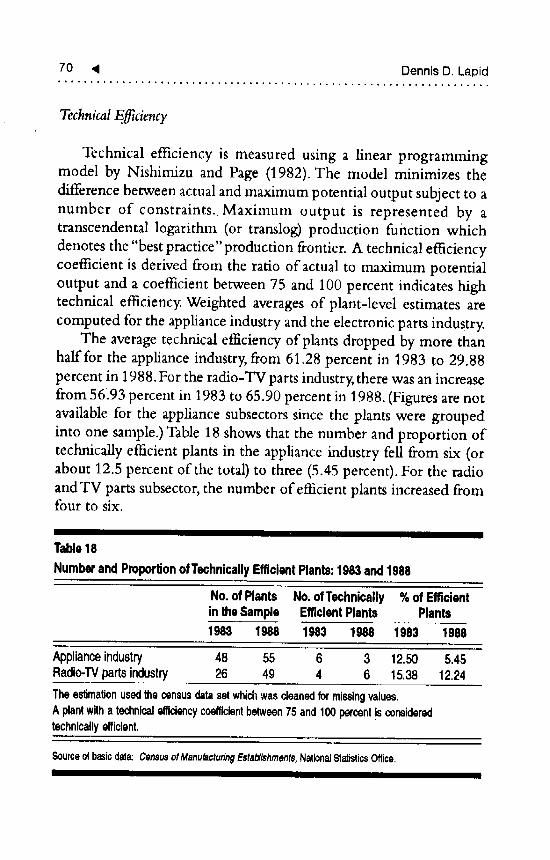
70 41 Dennis D. Lapid*,,* ............ 4 ...................................................
TechnicalEfficiency
Technical efficiency is measured using a linear programmingmodel by Nishimizu and Page (1982). The model minimizes the
difference between actual and maximum potential output subject to anumber of constraints. Maximum output is represented by atranscendental logarithm (or translog) production function whichdenotes the "best practice" production frontier. A technical efficiencycoefficient is derived from the ratio of actual to maximum potentialoutput and a coefficient between 75 and 100 percent indicates hightechnical efficiency. Weighted averages of plant-level estimates arecomputed for the appliance industry and the electronic parts industry.
The average technical efficiency of plants dropped by more thanhalf for the appliance industry, from 61.28 percent in 1983 to 29.88percent in 1988. For the radio-TV parts industry, there was an increasefrom 56.93 percent in 1983 to 65.90 percent in 1988. (Figures are notavailable for the appliance subsectors since the plants were groupedinto one sample.) Table 18 shows that the number and proportion oftechnically efficient plants in the appliance industry fell from six (orabout 12.5 percent of the total) to three (5.45 percent). For the radioand TV parts subsector, the number of efficient plants increased fromfour to six.
i I III lie Ill
Table 18
NumberandProportionofTechnicallyEfficientPlants:1983and1988
No.ofPlants No.ofTechnically%ofEfficientinIheSample EfficientPlants Plants1983 1988 1983 1988 1983 1988
Applianceindustry 48 55 6 3 12.50 5.45Radio-TVpartsindustry 26 49 4 6 15.38 12.24
Theestimationusedthecensusdatasetwhici_wascleanedformissingvalues.A plantwithatechnicalefficiencycoefficientbetween75and100percentis consideredtechnicallyefficient.
Sourceofbasicdata:CensusofManufacturingEstab/ishments,NationalStatisticsOffice.i I in II II II
ApplianceIndustry P, 71
It is possible that while trade reform removed enough distortionsto reduce allocative inefficiency, input use among most applianceplants remained inefficient. Similarly, the opposite movements in theDI_C and technical efficiency estimates for the electronic partsindustry point to the possible influence of other factors not related totrade policy. For example, increased technical efficiency as estimated
here may simply be due to improved capacity utilization. Anotherexplanation is that some plants m_llave improved to a greater degreethan others in technical efficiency_e to the reforms, thereby raisingthe average best-practice level of 4Dciency and widening the averagegap between actual and best-pracn'_e output.
It is also possible that the more efficient plants (or those withlarger efficiency gains) had a smaller share in sectoral output, resultingin a lower weightedaverage of plant-level technical efficiency. Othernontrade-related factors affecting efficiency include productionproblems cited by firms: The high cost and low quality of locally-made parts and components; the unavailability of specialized parts,and; the lack of testing facilities for products.
The results may also signify some deficiencies in the estimation.Nelson (1981) notes that Farrell's (1957) estimation technique fortechnical efficiency relies on neoclassical assumptions which for himseem to be too strong or too heroic. For example, the assumption ofhomogenous production technology within an industry may poseproblems when multi-product plants are involved.
FactorProductivity
Performance is also measured by the productivity of both laborand capital. Capital productivity is measured by the ratio betweenvalue added and the stock of capital while labor productivity ismeasured by the ratio between value added and the number ofproduction workers.
For the appliance industry, capital productivity appears to havegenerally gone up while labor productivity has gone down (Table 19).The capital productivity increases may imply that trade reforminduced firms to invest in new production equipment, improving
Administrator
Administrator
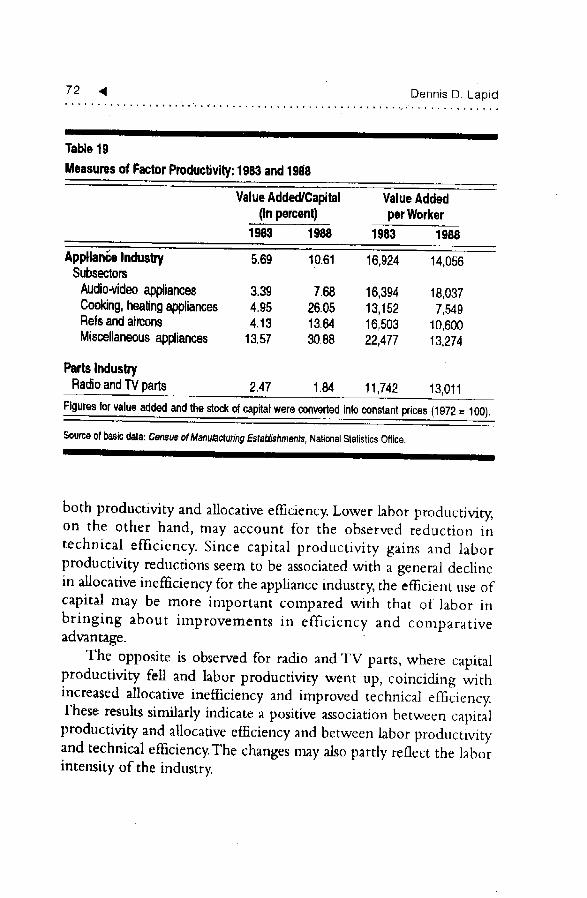
ApplianceIndustry I_ 73
OverallChanges in Performance
The following changes in the performance of the applianceindustry were observed. First, the amount and proportion of exportedoutput have increased. Second, allocative inefficiency declined andcomparative advantage (measured by the DKC-SER. ratio) improved.Frequency distributions with plant-level data also indicate thatreduced protection may have some links with improved efficiency.This is shown by slightly better results in terms of efficiency amongthe plants with relatively low EP1Ls. In addition, the industry hadmore small plants, a greater number of which were also relativelyefficient.This supports the hypothesis that reduced protection led toefficiency gains in the industry by giving access to imported inputs toa larger proportion of small plants.
The decrease in average technical efficiency in the applianceindustry may be explained either by very large improvements intechnical efficiency for a handful of plants or by relatively smallersectoral output shares for efficient plants, both of which wouldproduce a lower weighted average for technical efficiency.The resultsalso point to the effect of other factors not accounted for in theanalysis and to imperfections in the estimation procedure. Capitalproductivity appears to have increased while labor productivity seemsto have declined in the appliance industry.The hypothesized effect ofthe productivity changes on efficiency is thought to be related to thecapital intensity of production.
For the radio-TV parts industry, exports have increased, whileallocative efhciency and comparative advantage seem to haveworsened, as seen from the DILC-SER ratios. Technical efficiencyseems to have improved. Although the estimation results call for someskepticism because of some of the assumptions made, they also suggestthe influence of other nontrade-related factors on performance, suchas changes in capacity utilization and other production-relatedproblems. The parts industry also showed a decline in capitalproductivity and a rise in labor productivity. The accompanyingchanges in allocadve and technical efficiency may reflect the hborintensity of the industry.
74 41 Dennis D. Lapid
The results of trade liberalization may be incomplete given thedelay of its implementation. In addition, there may be a time lag forthe effects of the reforms, and the data used may denote a transitionperiod. However, the immediate impact of the reforms appear to bemoderate improvements in allocative efficiency and comparativeadvantage for the appliance industry and in technical efficiency for theelectronic parts industry. Both cases would indicate modest positiveresults from trade reform.
COMPETITIVENESS
CompetitiveAdvantage
Competitive advantage is measured using the domestic resourcecost in market prices (DRC*), defined as the ratio of total domesticcost in market prices to the net foreign exchange earned or saved(Tecson 1992).The market-price DRC provides an indication of themarket viability of a firm from its owners' point of view and isinterpreted in the same manner as the shadow-price DRC. The ratiobetween the DRC* and the official exchange rate (OER) denotescompetitive advantage.
Competitiveness is expected to increase with trade liberalizationbecause of the removal of distortions in the economy (such as currencyovervaluation) and partly because of the import disciplinephenomenon: Increased import competition may improve a firm'sability to compete in both domestic and external markets.
DRC*s from census data indicate improved competitiveness forthe appliance industry (Table 20). The changes generally seem toparallel those observed for the DRCs in shadow prices. DRCs inmarket prices improved for three subsectors (audio-video appliances,cooking-heating appliances, and refs-aircons) but worsened for theentire industry.
The DRC*-OER ratios, however, went down for the applianceindustry, indicating improved competitive advantage. However, noneof the subsectors became socially efficient (signified by ratios between
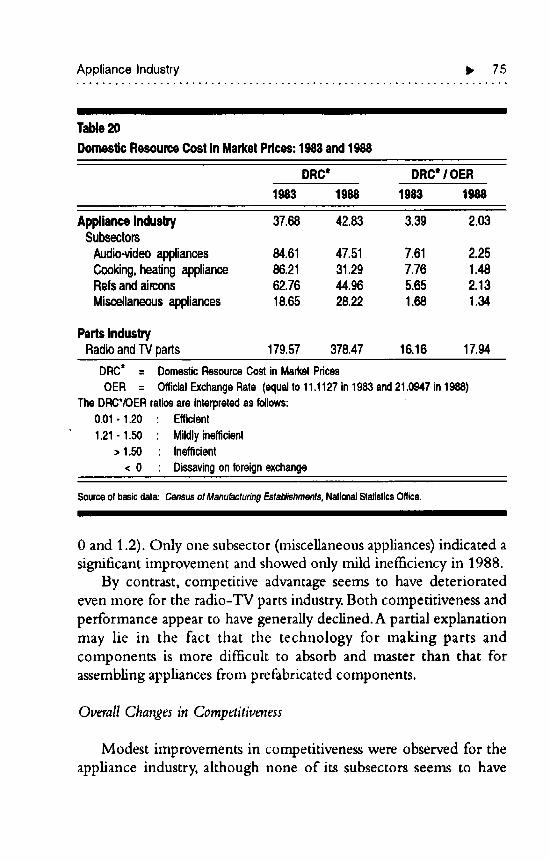
Appliance Industry b, 75
Table20
DomesticResourceCostinMarketPdces:1983and1998
DRC* DRC*I OER
1983 1988 1983 1988
Applianceindustry 37.68 42.83 3.39 2.03Subsectors
Audio-videoappliances 84.61 47.51 7.61 2,25Cooking,healingappliance 86.21 31.29 7.76 1.48Refsandaircons 62.76 44.96 5.65 2.13Miscellaneousappliances 18.65 28.22 1.68 1.34
PartsIndusWRadioandTVparts 179.57 378.47 16.16 17.94
DRC* = DomesticResourceCostinMad(elPricesOER = OfficialExchangeRate(equaJto11.1127In1983and21.0947in1988)
TheDRC*/OERratiosareInterpretedasfollows:0.01- 120 : Efficient
1.21- 1.50 : Mildlyinefficient>1.50 : Inefficient
< 0 : Dissavingonforeignexchange
Source of basic data: Census of Menufacturing Establishments, National Statistics Office.
iiiiim
0 and 1.2). Only one subsector (miscellaneous appliances) indicated a
significant improvement and showed only mild inefficiency in 1988.
By contrast, competitive advantage seems to have deteriorated
even more for the radio-TV parts industry. Both competitiveness and
performance appear to have generally declined. A partial explanation
may lie in the fact that the technology for making parts and
components is more difficult to absorb and master than that for
assembling appliances from prefabricated components.
Overall Changes in Competitiveness
Modest improvements in competitiveness were observed for the
appliance industry, although none of its subsectors seems to have
76 ,11 DennisD,Lapid
attained competitive advantage. For the radio-TV parts industry,competitiveness seems to have deteriorated.
It is possible that large improvements in both competitiveness andefficiency were not observed because of the delays in the reforms andbecause of other factors not directly related to liberalization. Forexample, changes in technical efficiency may be linked to changes incapacity utilization. Other nontrade-related factors which may affectefficiency are: (a) limited access to production technology, whichoften tends to be proprietary or specialized; and (b) the ability to meet
•quality standards. For the electronic parts subsector, the decline incompetitive advantage may be partly due to the relative difficulty ofabsorbing and mastering the technology for manufacturing parts andcomponents compared with assembling appliances.
7ooo_t ##o###oi_t t##Qoooiomoo##
Conclusionand PolicyRecommendations
THIS study analyzes the effects of trade liberalization on the structure,performance, and competitiveness of the appliance industry. It exam-ines the links between changes in industry structure and changes inperformance and competitiveness. Performance and competitivenessare expected to improve under trade reform due to competition fromimports. The conclusions of the study are based primarily on theanalysis of census data for 1983 and 1988.
Estimates of EPRs reflect reduced tariff protection for theindustry. Import restrictions seem to be notfully bindingsince the shareof imports increased even though substantial differences were foundbetween local and foreign prices. Competition also seems to havegenerally increased, indicated by increases in import competition,reductions in industry concentration, a larger proportion of smallplants and reductions in market power.
The appliance industry's responses to these changes includemodest improvements in both performance and competitiveness. Forthe radio-TV parts industry, performance improved nominally,although competitiveness declined.The full effects may not be evidentsince the liberalization process was only partially complete.There mayalso be a time lag between the reforms and their effects,and the periodconsidered here may well be a transition period.The immediateimpactof the reforms, however, appear to be positive, albeit modest.Generally, therefore, some positive results from trade reform for theindustry were observed. In addition, mere appear to be links betweenthe level of competition and changes in performance and
78 ,4 Dennis D. Lapid
competitiveness under trade reform. Some support for the importdiscipline hypothesis were also noted, since reduced protection,market power, and profitability were observed with improvements inperformance and competitiveness.
It is also important not to Overlook the influence of factors otherthan trade liberalization. Non-price factors may be linked to theobserved changes, such asplant-specific attributes related to efficiency,changes in capacity utilization, and other production-relatedconcerns. Factors such as the business cycle and macroeconomicstability may also affect the performance of industries in general.Moreover, the present study does not consider the equally importantdynamic effects of the policy changes.
The crucial question for the industry concerns the direction oftrade policy after EO 470. Recently, the National Economic andDevelopment Authority (NEDA) announced a target maximum of 5percent for all tariffsby 2001 aspart of a reduction program tosimplifythe present structure and align tariffpolicy with the AFTA-CEPT andthe GATT Uruguay Round. Under the plan proposed by theCommittee for Tariff and Related Matters (TRM), the present 60percent tariff on consumer durables will.be cut to 30 percent by nextyear, then to 20 percent by 1998, and to 10 percent by the year 2000.Worried of being edged out by foreign goods, local manufacturers areunderstandably opposing the plan. However, as the TRM points out,the industry had had substantial protection for quite some time.Moreover, the high protection and the QR-based developmentprograms did not seem to improve the industry's efficiency andcompetitive ability. Although partial trade reform seems to haveproduced only modest positive results, continued protection for theindustry must have specific, compelling reasons. Otherwise, the tariffreductions proposed by the TRM should be strongly supported.
It should be noted, however, that trade reform alone will not
guarantee improved performance and competitiveness. It will requirecomplementary measures to address other distortions in the economyand to help industries in preparing for increased foreign competition.This involves dealing with problems that raise unit costs for local firths.For example, in the small local market, it is difficult to achieve high
ApplianceIndustry i_ 79
production volumes that will bring down unit costs and enable firmsto compete with foreign rivals. Higher unit costs are also attributed tohigh interest rates (which particularly affect smaller firms) and thepoor condition of transportation infrastructure (which raises the costof transporting material inputs).
The latter two problems generally affect all industries and may behandled through low-cost financing and prudent infrastructurespending. But the smallness of the market also poses problems for theindustry's future growth and ways will have to be found to increasethe effective market. One obvious solution is exports. Efforts topromote the industry should set an eye toward external markets.Promoting the local assembly of appliances for export has beensuggested, encouraged no doubt by the increased exports of somelocaUy-assembled low-end products. Problems in exporting -- suchas costly delays in the processing of import shipments and incentive-related documents -- will have to be addressed.The government canhelp with measures to provide technical and marketing assistance,promote product quality standards, and speed up the flow ofdocuments.
A competitive parts industry will also strengthen the applianceindustry. Institutional support and encouragement from governmentwill be crucial in encouraging local production and tapping externalmarkets. Local parts production has been impeded by problems suchas high costs, low quality, and a low volume of orders -- problemsrelated to the state of the appliance industry itself. Sufficient localdemand for parts will build up once the appliance industry expands,and business decisions should play a greater role.Yet, there are anumber of things that the government can do, such as putting outmeasures aimed directly at the problems of the small and medium-sized enterprises which comprise the supplier industries. Amongthese are: (1) lack of financing; (2) shortage of suitably trainedmanpower; (3) equipment; (4) an information network to linkprospective buyers with suppliers; and (5) lack of training in world-class manufacturing techniques (such asjust-in-time manufacturing).Investments in manpower training, technical assistance, andinformation networks will particularly benefit the small firms.

80 _ Dennis D. Lapid
Marketing assistance will also be important in external markets. Forexample, regular trade missions may made part of a sustained effort tohelp exporters find new markets.
As a final note, while the results of the study may strengthen thepossibility of improved performance and competitiveness under tradereform, much still has to be known about the actual adjustmentprocess, and future research may yet provide a better answer.
A
Bibliography##oo #i a • o# #### ooQ omoe m_o o ## #_##
Abenoja, Zeno Ik. and Dennis D. Lapid. "Barriers to Entry, Market
Concentration, and Wages in the Philippine Manufacturing Sector,1987" Philippine Review of Economicsanti Business XXVIII (December1991): 191-217.
Aigner, Dennis, C. A. Knox LoveD,and Peter Schmidt. "Formtflation and
Estimation of Stochastic Frontier Production Function Models'JournalofEwnometrics 6 (1977): 21-37.
Bautista, Romeo M., John H. Power, and Associates. Industrial Promotion
Policiesin the Philippines. Makati: Philippine Institute for DevelopmentStudies, 1979.
Bhagwati, Jagdish and T. N. Srinivasan. ForeignTradeRegimes and Economic
Development:India. New York: Columbia University Press, 1975.
Chan, Richard A. "A Feasibility Study on the Assembly and Sale of RoomAir Conditioners in Metro Manila." Master's thesis in Business
Management. Asian Institute of Management, Makati, 1991.
Cowling, Keith. "On the Theoretical Specification of Industrial Structure-
Performance ikelationships." European EconomicReview 8 (1976): 1-14.De Dios, Emmanuel S. "Protection, Concentration, and the Direction of
Foreign Investments." The Philippine Review of Economicsand Business1 &2, XXIII (1986).
De Dios, Loreli C. "A Review of the Remaining Regulated Commodities"
PIDS Research Paper Series. Philippine Institute for DevelopmentStudies, forthcoming.
Department of Trade and Industry. Tradeand Industry Planning Workshop:
SectorProfilesandAction Plans.Makati: Department ofTrade and Industry,1987.
De Melo, Jaime and Shujiro Urata. "The Influence of Increased Foreign
Competition on Industrial Concentration and Profitability." InternationalJournal of Industrial C_anization 4 (1986): 287-304.
FarreU,Michael J. "The Measurement of Productive Ealciency."Journal ofthe Royal StatisticalSodety 120 (1957): 11-181.
82 4 DennisD.Lapid
Harrison, Anne E. "Productivity, Imperfect Competition, and Trade
Liberalization in the Cote d'lvoire,'Working Paper Series No. 451.
Washington, D.C.:World Bank, 1990.
Havrylyshyn, Oli. "Trade Policy and Productivity Gains in DevelopingCountries: A Survey of the Literature." The WorldBank Research Observer
5 (1990): 1-24.
Helpman, Elhanan and Paul Krugtnan. Market Struaure and ForeignTrade.
Cambridge, Massachusetts: MIT Press, 1985.
Hill, Hal C. "Subcontracting and Technological Diffusion in Philippine
Manufacturing." Discussion Paper Series No. 81-12. Quezon City:
University of the Philippines School of Economics, 1981.
Kirkpatrick, Colin and Jassodra Maharaj. "The Effect of Trade Liberalization
on Industrial-sector Productivity Performance in Developing Countries."
In Jean-Marc Fontane (ed.) ForeignTradeReform and DevelopmentStrategy.
London: Roudedge, 1992.
Lee, Norman."Market Structure and Trade in Developing Countries." In G.
K. Helleiner (ed.) Trade Policy,Industrialization, and Development: New
Perspectives.Oxford: Clarendon Press, 1992.
Lindsey, Charles W. III. "Market Concentration in Philippine
Manufacturing, 1970?' The Philippine EconomicJournal XVI, 34 (1977):289-312.
Martin, Stephen S. Industrial Economics:EconomicAnalysis and Public Policy.New York: MacMillan, 1988.
Medalla, Erlinda M. "Estimating the Shadow Exchange Rate under
Alternative Policy Assumptions." In R,. M. Bautista, John H. Power andAssociates, IndustrialPromotionPolitiesin the Philippines.Makati: Philippine
lnstatute for Development Studies, 1979.National Statistics Office (NSO), Census of Manufacturing Establishments.
Manila: NSO, various years.
National Statistical Coordination Board (NSCB). Foreign Trade Statistics
Yearbook.Manila: NSCB, various years.
Nelson, R.ichard R. "Research on Productivity Growth and Productivity
Differences: Dead Ends and New Departures." Journal of Economic
Literature 19 (1981): 1029-64.
Nishimizu, Mieko and John M. Page,Jr."Total Factor Productivity Growth,
Technological Progress, andTechnical Efficiency Change: Dimensions of
ApplianceIndustry I_ 83
Productivity Change in Yugoslavia: 1965-78:' The EconomicJournal 92
(1982): 920-36.Nishimizu, Mieko and Sherman Robinson."Trade Policies and Productivity
Change in Semi-industrialized Countries." Journal of DevelopmentEwnomics16 (1984): 177-206.
Pack, Howard. "Industrialization and Trade." In H. Chenery and T. N.
Srinivasan (eds.) Handbook of Development Economics.Vol. 1. Amsterdam:North-Holland, 1988.
Page, John M. Jr. "Firm Size and Technical Efficiency: Application ofProduction Frontiers to Indian Survey Data:' Journal of Development
Economics16 (1984): 129-52.
Patalinghug, Epictetus. "Market Concentration in the Philippine Food,
Home Appliance, and Textile Industries." The Philippine Review of
Economicsand Business 2, 20 (1983): 215-33.
Pineda,Virginia S. "A Study of the Effects of the Tariff Reform and importLiberalization on the Paper Industry." Tariff Commission-PlDS Joint
Research Project Staff Paper Series No. 86-13. Makati: Philippine
Institute for Development Studies, 1986.
Rodrik, Dani. "Trade and Industrial Policy Reform in DevelopingCountries." Mimeographed, undated.
•"Closing the Technology Gap: Does Trade Liberalization ReallyHelp.;" Working Paper No. 2654. Cambridge, Massachusetts: NationalBureau of Economic tLesearch, 1988.
Soriano, Paul C. "A Project Feasibility Study on Washing Machines byPhilacor." Master's thesis in Business Management. Asian Institute of
Management, Makati, 1991.Scherer, E M. Industrial Market Structureand EconomicPerformance.2nd ed.
Chicago: Rand McNaUy, 1980.SGV Consulting. Ban/ersto Entry: Final Report. Makati: Sycip, Gorres,Vdayo
and Co., 1992.
Tan, Elizabeth S. "A Study of the Comparative Advantage of the Home
Appliance Industry." Staff Paper Series No. 86-12. Philippine Institute forDevelopment Studies, 1987.
Tan, Norma A. "The Structure of Protection and Resource Flows in the
Philippines." In R. M. Bautista, John H. Power, and Associates, Indus_al
84 _1 DennisD, Lapid
Promotion Policies in the Philippines. Makati: Philippine Institute for
Development Studies, 1979.
Tariff Commission. "Estimating Effective Protection Rates."
Mimeographed, undated.
_. Tariff and Customs Code of the Philippines. Quezon City: TariffCommission, n.d.
Tecson, Gwendolyn R. "Performance, Competitiveness, and Structure of
Philippine Manufacturing Industries: A Research Design." Working
Paper Series No. 92-02. Makati: Philippine Institute for DevelopmentStudies, 1992.
Thomas, Vinod and John Nash. Best Practice in Trade Policy Reform.Washington, D.C.: World Bank, 1991.
Tower, Edward. "Domestic Resource Cost" Joumal of InternationalEconomic
Integration7, 1 (Spring 1992): 20-44.
Tybout, James, Jaime de Melo, and Vittorio Corbo. "The Effects of Trade
Reforms on Scale and Technical Efficiency: New Evidence from Chile."
Journal of InternationalEconomics31 (1991): 231-50.World Bank. Colombia: Industrial Competition and Performance.Washington,
D.C.: World Bank, 1991.