GOVDELIVERY.COM New Email Distribution Service Georgia EPD Air Protection Branch.
Appendix L
Characterization of Meteorology in the VISTAS Region

VISTAS
Characterization of Meteorology and Its Relationships
to Fine Particulate Mass and Visibility
in the VISTAS Region
Final Report
December 8, 2006
06-046

This page deliberately left blank.

VISTAS
Characterization of Meteorology and Its Relationships
to Fine Particulate Mass and Visibility
in the VISTAS Region
Final Report
December 8, 2006
Prepared for Patricia Brewer VISTAS 2090 U.S. Highway 70 Swannanoa, NC 28778 (828) 296-4500 Prepared by: Sharon Douglas Belle Hudischewskyj YiHua Wei ICF International 101 Lucas Valley Road, Suite 260 San Rafael, CA 94903 (415) 507-7108
06-046

This page deliberately left blank.
Table of Contents Executive Summary....................................................................................................................1 1. Introduction ........................................................................................................................1-1
1.1. Background..............................................................................................................................1-1 1.2. Objectives and Key Questions.................................................................................................1-1 1.3. Overview of the Methodologies ...............................................................................................1-2 1.4. Report Contents.......................................................................................................................1-3
2. Data Acquisition, Processing, and Quality Assurance ..................................................2-1 2.1. Particulate Matter and Visibility Data .......................................................................................2-1
2.1.1. Monitoring Sites and Data Availability................................................................................................................2-1 2.1.2. Parameters of Interest.............................................................................................................................................2-4 2.1.3. Calculation of Extinction Coefficient ...................................................................................................................2-4 2.1.4. Data Processing and Quality Assurance Procedures...................................................................................2-5
2.2. Meteorological Data .................................................................................................................2-5 2.2.1. Monitoring Sites and Data Availability................................................................................................................2-5 2.2.2. Parameters of Interest.............................................................................................................................................2-9 2.2.3. Data Processing and Quality Assurance Procedures...................................................................................2-9
2.3. Quality Assurance of the Datasets ..........................................................................................2-9 3. Examination of Relationships between Meteorological and Air Quality Data
Using Classification and Regression Tree (CART) Analysis .........................................3-1 3.1. Overview of CART ...................................................................................................................3-1 3.2. CART Application Procedures .................................................................................................3-2
3.2.1. Identification of CART Input Parameters ..........................................................................................................3-2 3.2.2. Display and Analysis of the CART Input Data.................................................................................................3-5 3.2.3. CART Application Procedures ..............................................................................................................................3-5 3.2.4. Display and Analysis of CART Results..............................................................................................................3-7
3.3. CART Classification Results....................................................................................................3-7 3.3.1. Visibility ........................................................................................................................................................................3-7 3.3.2. PM2.5............................................................................................................................................................................3-9
3.4. Important Classification Parameters......................................................................................3-10 3.4.1. Summary of Important Parameters...................................................................................................................3-10 3.4.2. CART-Based Site Groupings ..............................................................................................................................3-21
3.5. Meteorological Influences on Visibility and Fine Particles .....................................................3-27 3.5.1. Categorical Comparisons .....................................................................................................................................3-27 3.5.2. Analysis of Key Bins ..............................................................................................................................................3-82
4. Meteorological Representativeness and Episode Selection Exercises........................4-1 4.1. Meteorological Characterization and Episode Selection Tool .................................................4-1
4.1.1. Meteorological Characterization Component ..................................................................................................4-2 4.1.2. Episode Selection Component .............................................................................................................................4-5
4.2. Analysis of the Representativeness of the 2002 Simulation Period ........................................4-7 4.2.1. IMPROVE Sites .........................................................................................................................................................4-7 4.2.2. STN Sites...................................................................................................................................................................4-15 4.2.3. SEARCH Sites .........................................................................................................................................................4-38
4.3. Selection Subset Episodes for Model-Based Sensitivity Analysis.........................................4-50 4.3.1. Episode Selection ...................................................................................................................................................4-50 4.3.2. Episode Representativeness ..............................................................................................................................4-51
4.4. Calculation of Meteorologically-Based Weighting Factors ....................................................4-74 4.4.1. Annual Weighting Factors for Regional Haze ...............................................................................................4-75 4.4.2. Episodic Weighting Factors for PM2.5.............................................................................................................4-77
5. Key Findings and Implications for VISTAS Air Quality Modeling .................................5-1 6. References..........................................................................................................................6-1 Appendix: Comparison of Results for the STN and SEARCH Birmingham Sites............. A-1
Comparative Analysis......................................................................................................................... A-1 Summary of Findings........................................................................................................................ A-11
ICF International i VISTAS Meteorological Characterization 06-046 December 8, 2006

Characterization of Meteorology and Its Relationships to Fine Particulate Mass and Visibility in the VISTAS Region Table of Contents
List of Figures Figure 2-1. Locations of the IMPROVE, STN and SEARCH Sites Used for the VISTAS CART Analysis.......................................... 2-3 Figure 3-1. Simple CART Classification Tree Diagram, with Splits on Relative Humidity (RH), Wind Speed (WS),
and Wind Direction (WD). ........................................................................................................................................... 3-2 Figure 3-2a. Average Parameter Importance for the CART Visibility Analysis: IMPROVE Sites. .................................................... 3-12 Figure 3-2b. Average Parameter Importance for the CART Visibility Analysis: Inland IMPROVE Sites. ......................................... 3-12 Figure 3-2c. Average Parameter Importance for the CART Visibility Analysis: Coastal IMPROVE Sites. ....................................... 3-13 Figure 3-2d. Average Parameter Importance for the CART Visibility Analysis: Mountain IMPROVE Sites. .................................... 3-13 Figure 3-3a. Average Parameter Importance for the CART PM2.5 Analysis: IMPROVE Sites.......................................................... 3-14 Figure 3-3b. Average Parameter Importance for the CART PM2.5 Analysis: Inland IMPROVE Sites. .............................................. 3-15 Figure 3-3c. Average Parameter Importance for the CART PM2.5 Analysis: Coastal IMPROVE Sites............................................. 3-15 Figure 3-3d. Average Parameter Importance for the CART PM2.5 Analysis: Mountain IMPROVE Sites. ......................................... 3-16 Figure 3-4a. Average Parameter Importance for the CART PM2.5 Analysis: STN Sites. .................................................................. 3-17 Figure 3-4b. Average Parameter Importance for the CART PM2.5 Analysis: More Northern STN Sites. .......................................... 3-17 Figure 3-4c. Average Parameter Importance for the CART PM2.5 Analysis: More Southern STN Sites........................................... 3-18 Figure 3-5a. Average Parameter Importance for the CART PM2.5 Analysis: SEARCH Sites. .......................................................... 3-19 Figure 3-5b. Average Parameter Importance for the CART PM2.5 Analysis: Inland SEARCH Sites................................................. 3-19 Figure 3-5c. Average Parameter Importance for the CART PM2.5 Analysis: Coastal SEARCH Sites. ............................................. 3-20 Figure 3-5d. Average Parameter Importance for the CART PM2.5 Analysis: Urban SEARCH Sites................................................. 3-20 Figure 3-5e. Average Parameter Importance for the CART PM2.5 Analysis: Rural/Suburban SEARCH Sites. ................................ 3-21 Figure 3-6a. Average Elemental Carbon (EC), Nitrate (NO3), Organic Matter (OM), and Sulfate (SO4) Concentrations (μgm-3)
for Key Visibility Bins for All CART Classification Categories: IMPROVE Site Breton. .......................................... 3-107 Figure 3-6b. Average Elemental Carbon (EC), Nitrate (NO3), Organic Matter (OM), and Sulfate (SO4) Concentrations (μgm-3)
for Key Visibility Bins for All CART Classification Categories: IMPROVE Site Brigantine...................................... 3-107 Figure 3-6c. Average Elemental Carbon (EC), Nitrate (NO3), Organic Matter (OM), and Sulfate (SO4) Concentrations (μgm-3)
for Key Visibility Bins for All CART Classification Categories: IMPROVE Site Cadiz............................................. 3-108 Figure 3-6d. Average Elemental Carbon (EC), Nitrate (NO3), Organic Matter (OM), and Sulfate (SO4) Concentrations (μgm-3)
for Key Visibility Bins for All CART Classification Categories: IMPROVE Site Caney Creek. ................................... 3-108 Figure 3-6e. Average Elemental Carbon (EC), Nitrate (NO3), Organic Matter (OM), and Sulfate (SO4) Concentrations (μgm-3)
for Key Visibility Bins for All CART Classification Categories: IMPROVE Site Cape Romain. .................................. 3-109 Figure 3-6f. Average Elemental Carbon (EC), Nitrate (NO3), Organic Matter (OM), and Sulfate (SO4) Concentrations (μgm-3)
for Key Visibility Bins for All CART Classification Categories: IMPROVE Site Chassahowitzka................................... 3-109 Figure 3-6g. Average Elemental Carbon (EC), Nitrate (NO3), Organic Matter (OM), and Sulfate (SO4) Concentrations (μgm-3)
for Key Visibility Bins for All CART Classification Categories: IMPROVE Site Cohutta. ........................................ 3-110 Figure 3-6h. Average Elemental Carbon (EC), Nitrate (NO3), Organic Matter (OM), and Sulfate (SO4) Concentrations (μgm-3)
for Key Visibility Bins for All CART Classification Categories: IMPROVE Site Dolly Sods..................................... 3-110 Figure 3-6i. Average Elemental Carbon (EC), Nitrate (NO3), Organic Matter (OM), and Sulfate (SO4) Concentrations (μgm-3)
for Key Visibility Bins for All CART Classification Categories: IMPROVE Site Everglades.................................... 3-111 Figure 3-6j. Average Elemental Carbon (EC), Nitrate (NO3), Organic Matter (OM), and Sulfate (SO4) Concentrations (μgm-3)
for Key Visibility Bins for All CART Classification Categories: IMPROVE Site Great Smoky Mountains. .............. 3-111 Figure 3-6k. Average Elemental Carbon (EC), Nitrate (NO3), Organic Matter (OM), and Sulfate (SO4) Concentrations (μgm-3) for Key Visibility
Bins for All CART Classification Categories: IMPROVE Site James River Face............................................................ 3-112 Figure 3-6l. Average Elemental Carbon (EC), Nitrate (NO3), Organic Matter (OM), and Sulfate (SO4) Concentrations (μgm-3)
for Key Visibility Bins for All CART Classification Categories: IMPROVE Site Linville Gorge. .................................. 3-112 Figure 3-6m. Average Elemental Carbon (EC), Nitrate (NO3), Organic Matter (OM), and Sulfate (SO4) Concentrations (μgm-3)
for Key Visibility Bins for All CART Classification Categories: IMPROVE Site Mammoth Cave. .................................. 3-113 Figure 3-6n. Average Elemental Carbon (EC), Nitrate (NO3), Organic Matter (OM), and Sulfate (SO4) Concentrations (μgm-3)
for Key Visibility Bins for All CART Classification Categories: IMPROVE Site Mingo. ........................................... 3-113 Figure 3-6o. Average Elemental Carbon (EC), Nitrate (NO3), Organic Matter (OM), and Sulfate (SO4) Concentrations (μgm-3)
for Key Visibility Bins for All CART Classification Categories: IMPROVE Site Okefenokee. ................................. 3-114 Figure 3-6p. Average Elemental Carbon (EC), Nitrate (NO3), Organic Matter (OM), and Sulfate (SO4) Concentrations (μgm-3)
for Key Visibility Bins for All CART Classification Categories: IMPROVE Site Shenandoah..................................... 3-114 Figure 3-6q. Average Elemental Carbon (EC), Nitrate (NO3), Organic Matter (OM), and Sulfate (SO4) Concentrations (μgm-3)
for Key Visibility Bins for All CART Classification Categories: IMPROVE Site Shining Rock. ................................... 3-115 Figure 3-6r. Average Elemental Carbon (EC), Nitrate (NO3), Organic Matter (OM), and Sulfate (SO4) Concentrations (μgm-3)
for Key Visibility Bins for All CART Classification Categories: IMPROVE Site Sipsey. .......................................... 3-115 Figure 3-6s. Average Elemental Carbon (EC), Nitrate (NO3), Organic Matter (OM), and Sulfate (SO4) Concentrations (μgm-3)
for Key Visibility Bins for All CART Classification Categories: IMPROVE Site St Mark’s....................................... 3-116 Figure 3-6t. Average Elemental Carbon (EC), Nitrate (NO3), Organic Matter (OM), and Sulfate (SO4) Concentrations (μgm-3)
for Key Visibility Bins for All CART Classification Categories: IMPROVE Site Swanquarter..................................... 3-116 Figure 3-6u. Average Elemental Carbon (EC), Nitrate (NO3), Organic Matter (OM), and Sulfate (SO4) Concentrations (μgm-3)
for Key Visibility Bins for All CART Classification Categories: IMPROVE Site Upper Buffalo. .................................. 3-117 Figure 3-7a. Average Elemental Carbon (EC), Nitrate (NO3), Organic Matter (OM), and Sulfate (SO4) Concentrations (μgm-3)
for Key PM2.5 Bins for All CART Classification Categories: IMPROVE Site Breton................................................ 3-142
ICF International ii VISTAS Meteorological Characterization 06-046 December 8, 2006

Characterization of Meteorology and Its Relationships to Fine Particulate Mass and Visibility in the VISTAS Region Table of Contents
Figure 3-7b. Average Elemental Carbon (EC), Nitrate (NO3), Organic Matter (OM), and Sulfate (SO4) Concentrations (μgm-3) for Key PM2.5 Bins for All CART Classification Categories: IMPROVE Site Brigantine. ......................................... 3-142
Figure 3-7c. Average Elemental Carbon (EC), Nitrate (NO3), Organic Matter (OM), and Sulfate (SO4) Concentrations (μgm-3) for Key PM2.5 Bins for All CART Classification Categories: IMPROVE Site Cadiz. ................................................ 3-143
Figure 3-7d. Average Elemental Carbon (EC), Nitrate (NO3), Organic Matter (OM), and Sulfate (SO4) Concentrations (μgm-3) for Key PM2.5 Bins for All CART Classification Categories: IMPROVE Site Caney Creek. .................................... 3-143
Figure 3-7e. Average Elemental Carbon (EC), Nitrate (NO3), Organic Matter (OM), and Sulfate (SO4) Concentrations (μgm-3) for Key PM2.5 Bins for All CART Classification Categories: IMPROVE Site Cape Romain. ................................... 3-144
Figure 3-7f. Average Elemental Carbon (EC), Nitrate (NO3), Organic Matter (OM), and Sulfate (SO4) Concentrations (μgm-3) for Key PM2.5 Bins for All CART Classification Categories: IMPROVE Site Chassahowitzka. ............................... 3-144
Figure 3-7g. Average Elemental Carbon (EC), Nitrate (NO3), Organic Matter (OM), and Sulfate (SO4) Concentrations (μgm-3) for Key PM2.5 Bins for All CART Classification Categories: IMPROVE Site Cohutta.............................................. 3-145
Figure 3-7h. Average Elemental Carbon (EC), Nitrate (NO3), Organic Matter (OM), and Sulfate (SO4) Concentrations (μgm-3) for Key PM2.5 Bins for All CART Classification Categories: IMPROVE Site Dolly Sods. ........................................ 3-145
Figure 3-7i. Average Elemental Carbon (EC), Nitrate (NO3), Organic Matter (OM), and Sulfate (SO4) Concentrations (μgm-3) for Key PM2.5 Bins for All CART Classification Categories: IMPROVE Site Everglades. ....................................... 3-146
Figure 3-7j. Average Elemental Carbon (EC), Nitrate (NO3), Organic Matter (OM), and Sulfate (SO4) Concentrations (μgm-3) for Key PM2.5 Bins for All CART Classification Categories: IMPROVE Site Great Smoky Mountains.................... 3-146
Figure 3-7k. Average Elemental Carbon (EC), Nitrate (NO3), Organic Matter (OM), and Sulfate (SO4) Concentrations (μgm-3) for Key PM2.5 Bins for All CART Classification Categories: IMPROVE Site James River Face. ............................ 3-147
Figure 3-7l. Average Elemental Carbon (EC), Nitrate (NO3), Organic Matter (OM), and Sulfate (SO4) Concentrations (μgm-3) for Key PM2.5 Bins for All CART Classification Categories: IMPROVE Site Linville Gorge. ................................... 3-147
Figure 3-7m. Average Elemental Carbon (EC), Nitrate (NO3), Organic Matter (OM), and Sulfate (SO4) Concentrations (μgm-3) for Key PM2.5 Bins for All CART Classification Categories: IMPROVE Site Mammoth Cave. ................................ 3-148
Figure 3-7n. Average Elemental Carbon (EC), Nitrate (NO3), Organic Matter (OM), and Sulfate (SO4) Concentrations (μgm-3) for Key PM2.5 Bins for All CART Classification Categories: IMPROVE Site Mingo. ............................................... 3-148
Figure 3-7o. Average Elemental Carbon (EC), Nitrate (NO3), Organic Matter (OM), and Sulfate (SO4) Concentrations (μgm-3) for Key PM2.5 Bins for All CART Classification Categories: IMPROVE Site Okefenokee. ...................................... 3-149
Figure 3-7p. Average Elemental Carbon (EC), Nitrate (NO3), Organic Matter (OM), and Sulfate (SO4) Concentrations (μgm-3) for Key PM2.5 Bins for All CART Classification Categories: IMPROVE Site Shenandoah...................................... 3-149
Figure 3-7q. Average Elemental Carbon (EC), Nitrate (NO3), Organic Matter (OM), and Sulfate (SO4) Concentrations (μgm-3) for Key PM2.5 Bins for All CART Classification Categories: IMPROVE Site Shining Rock. .................................... 3-150
Figure 3-7r. Average Elemental Carbon (EC), Nitrate (NO3), Organic Matter (OM), and Sulfate (SO4) Concentrations (μgm-3) for Key PM2.5 Bins for All CART Classification Categories: IMPROVE Site Sipsey. .............................................. 3-150
Figure 3-7s. Average Elemental Carbon (EC), Nitrate (NO3), Organic Matter (OM), and Sulfate (SO4) Concentrations (μgm-3) for Key PM2.5 Bins for All CART Classification Categories: IMPROVE Site St Mark’s. .......................................... 3-151
Figure 3-7t. Average Elemental Carbon (EC), Nitrate (NO3), Organic Matter (OM), and Sulfate (SO4) Concentrations (μgm-3) for Key PM2.5 Bins for All CART Classification Categories: IMPROVE Site Swanquarter. ..................................... 3-151
Figure 3-7u. Average Elemental Carbon (EC), Nitrate (NO3), Organic Matter (OM), and Sulfate (SO4) Concentrations (μgm-3) for Key PM2.5 Bins for All CART Classification Categories: IMPROVE Site Upper Buffalo. ................................... 3-152
Figure 3-8a. Average Elemental Carbon (EC), Nitrate (NO3), Organic Matter (OM), and Sulfate (SO4) Concentrations (μgm-3) for Key PM2.5 Bins for All CART Classification Categories: STN Site Birmingham. ............................................... 3-170
Figure 3-8b. Average Elemental Carbon (EC), Nitrate (NO3), Organic Matter (OM), and Sulfate (SO4) Concentrations (μgm-3) for Key PM2.5 Bins for All CART Classification Categories: STN Site Charlotte. .................................................... 3-170
Figure 3-8c. Average Elemental Carbon (EC), Nitrate (NO3), Organic Matter (OM), and Sulfate (SO4) Concentrations (μgm-3) for Key PM2.5 Bins for All CART Classification Categories: STN Site Chattanooga. .............................................. 3-171
Figure 3-8d. Average Elemental Carbon (EC), Nitrate (NO3), Organic Matter (OM), and Sulfate (SO4) Concentrations (μgm-3) for Key PM2.5 Bins for All CART Classification Categories: STN Site Greenville-Spartanburg. ............................. 3-171
Figure 3-8e. Average Elemental Carbon (EC), Nitrate (NO3), Organic Matter (OM), and Sulfate (SO4) Concentrations (μgm-3) for Key PM2.5 Bins for All CART Classification Categories: STN Site Hickory........................................................ 3-172
Figure 3-8f. Average Elemental Carbon (EC), Nitrate (NO3), Organic Matter (OM), and Sulfate (SO4) Concentrations (μgm-3) for Key PM2.5 Bins for All CART Classification Categories: STN Site Huntington-Ashland. ................................... 3-172
Figure 3-8g. Average Elemental Carbon (EC), Nitrate (NO3), Organic Matter (OM), and Sulfate (SO4) Concentrations (μgm-3) for Key PM2.5 Bins for All CART Classification Categories: STN Site Jackson. ..................................................... 3-173
Figure 3-8h. Average Elemental Carbon (EC), Nitrate (NO3), Organic Matter (OM), and Sulfate (SO4) Concentrations (μgm-3) for Key PM2.5 Bins for All CART Classification Categories: STN Site Kingsport-Bristol. ........................................ 3-173
Figure 3-8i. Average Elemental Carbon (EC), Nitrate (NO3), Organic Matter (OM), and Sulfate (SO4) Concentrations (μgm-3) for Key PM2.5 Bins for All CART Classification Categories: STN Site Louisville. .................................................... 3-174
Figure 3-8j. Average Elemental Carbon (EC), Nitrate (NO3), Organic Matter (OM), and Sulfate (SO4) Concentrations (μgm-3) for Key PM2.5 Bins for All CART Classification Categories: STN Site Macon. ........................................................ 3-174
Figure 3-8k. Average Elemental Carbon (EC), Nitrate (NO3), Organic Matter (OM), and Sulfate (SO4) Concentrations (μgm-3) for Key PM2.5 Bins for All CART Classification Categories: STN Site Memphis. .................................................... 3-175
Figure 3-8l. Average Elemental Carbon (EC), Nitrate (NO3), Organic Matter (OM), and Sulfate (SO4) Concentrations (μgm-3) for Key PM2.5 Bins for All CART Classification Categories: STN Site Montgomery................................................ 3-175
ICF International iii VISTAS Meteorological Characterization 06-046 December 8, 2006

Characterization of Meteorology and Its Relationships to Fine Particulate Mass and Visibility in the VISTAS Region Table of Contents
Figure 3-8m. Average Elemental Carbon (EC), Nitrate (NO3), Organic Matter (OM), and Sulfate (SO4) Concentrations (μgm-3) for Key PM2.5 Bins for All CART Classification Categories: STN Site Nashville. .................................................... 3-176
Figure 3-8n. Average Elemental Carbon (EC), Nitrate (NO3), Organic Matter (OM), and Sulfate (SO4) Concentrations (μgm-3) for Key PM2.5 Bins for All CART Classification Categories: STN Site Raleigh. ...................................................... 3-176
Figure 3-8o. Average Elemental Carbon (EC), Nitrate (NO3), Organic Matter (OM), and Sulfate (SO4) Concentrations (μgm-3) for Key PM2.5 Bins for All CART Classification Categories: STN Site Richmond. .................................................. 3-177
Figure 3-8p. Average Elemental Carbon (EC), Nitrate (NO3), Organic Matter (OM), and Sulfate (SO4) Concentrations (μgm-3) for Key PM2.5 Bins for All CART Classification Categories: STN Site Savannah. .................................................. 3-177
Figure 3-9a. Average Elemental Carbon (EC), Nitrate (NO3), Organic Matter (OM), and Sulfate (SO4) Concentrations (μgm-3) for Key PM2.5 Bins for All CART Classification Categories: SEARCH Site Atlanta................................................. 3-186
Figure 3-9b. Average Elemental Carbon (EC), Nitrate (NO3), Organic Matter (OM), and Sulfate (SO4) Concentrations (μgm-3) for Key PM2.5 Bins for All CART Classification Categories: SEARCH Site Yorkville. ............................................. 3-187
Figure 3-9c. Average Elemental Carbon (EC), Nitrate (NO3), Organic Matter (OM), and Sulfate (SO4) Concentrations (μgm-3) for Key PM2.5 Bins for All CART Classification Categories: SEARCH Site Birmingham......................................... 3-187
Figure 3-9d. Average Elemental Carbon (EC), Nitrate (NO3), Organic Matter (OM), and Sulfate (SO4) Concentrations (μgm-3) for Key PM2.5 Bins for All CART Classification Categories: SEARCH Site Centreville. .......................................... 3-188
Figure 3-9e. Average Elemental Carbon (EC), Nitrate (NO3), Organic Matter (OM), and Sulfate (SO4) Concentrations (μgm-3) for Key PM2.5 Bins for All CART Classification Categories: SEARCH Site Pensacola. .......................................... 3-188
Figure 3-9f. Average Elemental Carbon (EC), Nitrate (NO3), Organic Matter (OM), and Sulfate (SO4) Concentrations (μgm-3) for Key PM2.5 Bins for All CART Classification Categories: SEARCH Site Outlying Landing Field. ....................... 3-189
Figure 3-9g. Average Elemental Carbon (EC), Nitrate (NO3), Organic Matter (OM), and Sulfate (SO4) Concentrations (μgm-3) for Key PM2.5 Bins for All CART Classification Categories: SEARCH Site Gulfport. .............................................. 3-189
Figure 3-9h. Average Elemental Carbon (EC), Nitrate (NO3), Organic Matter (OM), and Sulfate (SO4) Concentrations (μgm-3) for Key PM2.5 Bins for All CART Classification Categories: SEARCH Site Oak Grove. ......................................... 3-190
Figure 4-1. Schematic Diagram of the VISTAS Meteorological Characterization and Episode Selection Tool.................................. 4-2 Figure 4-2. Initial Input Screen for the Characterization Portion of the VISTAS Meteorological Characterization Tool:
Example for PM2.5 for all STN Sites Plus the Atlanta, Birmingham, Gulfport, and Pensacola SEARCH Sites, for 6/3/02-7/10/02. ...................................................................................................................................................... 4-3
Figure 4-3. Example Characterization Result Screen for PM2.5. ....................................................................................................... 4-4 Figure 4-4. Initial Input Screen for the Episode Selection Portion of the VISTAS Meteorological Characterization Tool:
Example for PM2.5 for Atlanta.................................................................................................................................... 4-6 Figure 4-5. Example Episode Selection Result Screen for PM2.5...................................................................................................... 4-7 Figure 4-6. Year-by-Year Tendencies in Weighted Average PM2.5 and Daily Maximum 24-hour Average PM2.5............................. 4-22
(a) Birmingham ......................................................................................................................................................... 4-22 (b) Charlotte.............................................................................................................................................................. 4-23 (c) Chattanooga........................................................................................................................................................ 4-24 (d) Greenville-Spartanburg ....................................................................................................................................... 4-25 (e) Hickory ................................................................................................................................................................ 4-26 (f) Huntington-Ashland.............................................................................................................................................. 4-27 (g) Jackson ............................................................................................................................................................... 4-28 (h) Kingsport ............................................................................................................................................................. 4-29 (i) Louisville............................................................................................................................................................... 4-30 (j) Macon................................................................................................................................................................... 4-31 (k) Memphis .............................................................................................................................................................. 4-32 (l) Montgomery.......................................................................................................................................................... 4-33 (m) Nashville............................................................................................................................................................. 4-34 (n) Raleigh ................................................................................................................................................................ 4-35 (o) Richmond ............................................................................................................................................................ 4-36 (p) Savannah ............................................................................................................................................................ 4-37
Figure 4-7. Year-by-Year Tendencies in Weighted Average PM2.5 and Daily Maximum 24-hour Average PM2.5 for Each of the SEARCH Sites.......................................................................................................................................................... 4-42 (a) Atlanta ................................................................................................................................................................. 4-42 (b) Yorkville............................................................................................................................................................... 4-43 (c) Birmingham ......................................................................................................................................................... 4-44 (d) Centreville ........................................................................................................................................................... 4-45 (e) Pensacola............................................................................................................................................................ 4-46 (f) OLF ...................................................................................................................................................................... 4-47 (g) Gulfport................................................................................................................................................................ 4-48 (h) Oak Grove........................................................................................................................................................... 4-49
Figure 4-8. Comparison of Species Concentrations (μgm-3) for Sulfate (SO4), Nitrate (NO3), Organic Carbon (OC), Elemental Carbon (EC) and Ammonium (NH4) for 2000-2004, 2002, and 2002 VISTAS Episode Periods: IMPROVE Sites.. 4-57 (a) Cape Romain ...................................................................................................................................................... 4-57 (b) Great Smoky Mountains...................................................................................................................................... 4-58 (c) Mammoth Cave ................................................................................................................................................... 4-58
Figure 4-9. Distribution of Surface Wind Directions by Quadrant for 2000-2004, 2002, and 2002 VISTAS Episode Periods: IMPROVE Sites. ....................................................................................................................................................... 4-59
ICF International iv VISTAS Meteorological Characterization 06-046 December 8, 2006

Characterization of Meteorology and Its Relationships to Fine Particulate Mass and Visibility in the VISTAS Region Table of Contents
(a) Cape Romain ...................................................................................................................................................... 4-59 (b) Great Smoky Mountains...................................................................................................................................... 4-59 (c) Mammoth Cave ................................................................................................................................................... 4-60
Figure 4-10. Comparison of Species Concentrations (μgm-3) for Sulfate (SO4), Nitrate (NO3), Organic Carbon (OC), Elemental Carbon (EC) and Ammonium (NH4) for 2000-2004, 2002, and 2002 VISTAS Episode Periods: STN Sites. .......... 4-65 (a) Charlotte.............................................................................................................................................................. 4-65 (b) Chattanooga........................................................................................................................................................ 4-66 (c) Louisville.............................................................................................................................................................. 4-66 (d) Macon.................................................................................................................................................................. 4-67
Figure 4-11. Distribution of Surface Wind Directions by Quadrant for 2000-2004, 2002, and 2002 VISTAS Episode Periods: STN Sites.................................................................................................................................................................. 4-67 (a) Charlotte.............................................................................................................................................................. 4-67 (b) Chattanooga........................................................................................................................................................ 4-68 (c) Louisville.............................................................................................................................................................. 4-68 (d) Macon.................................................................................................................................................................. 4-69
Figure 4-12. Comparison of Species Concentrations (μgm-3) for Sulfate (SO4), Nitrate (NO3), Organic Carbon (OC), Elemental Carbon (EC) and Ammonium (NH4) for 2000-2004, 2002, and 2002 VISTAS Episode Periods: SEARCH Sites. .. 4-72 (a) Atlanta ................................................................................................................................................................. 4-72 (b) Birmingham ......................................................................................................................................................... 4-73
Figure 4-13. Distribution of Surface Wind Directions by Quadrant for 2000-2004, 2002, and 2002 VISTAS Episode Periods: SEARCH Sites.......................................................................................................................................................... 4-73 (a) Atlanta ................................................................................................................................................................. 4-73 (b) Birmingham ......................................................................................................................................................... 4-74
Figure A-1. Parameter Importance for the CART PM2.5 Analysis: Birmingham STN Site...................................................................A-1 Figure A-2. Parameter Importance for the CART PM2.5 Analysis: Birmingham SEARCH Site. ..........................................................A-2 Figure A-3. Average Elemental Carbon (EC), Nitrate (NO3), Organic Matter (OM), and Sulfate (SO4) Concentrations (μgm-3)
for Key PM2.5 Bins for All CART Classification Categories: Birmingham STN Site. ...................................................A-7 Figure A-4. Average Elemental Carbon (EC), Nitrate (NO3), Organic Matter (OM), and Sulfate (SO4) Concentrations (μgm-3)
for Key PM2.5 Bins for All CART Classification Categories: Birmingham SEARCH Site.............................................A-7 Figure A-5. Comparison of Species Concentrations (μgm-3) for Sulfate (SO4), Nitrate (NO3), Organic Carbon (OC), Elemental
Carbon (EC) and Ammonium (NH4) for 2000-2004, 2002, and 2002 VISTAS Episode Periods: Birmingham........A-10 (a) STN .....................................................................................................................................................................A-10 (b) SEARCH .............................................................................................................................................................A-10
ICF International v VISTAS Meteorological Characterization 06-046 December 8, 2006

Characterization of Meteorology and Its Relationships to Fine Particulate Mass and Visibility in the VISTAS Region Table of Contents
List of Tables Table 2-1a. VISTAS IMPROVE Sites and Summary of Data Availability for the CART Visibility and PM2.5 Analyses. ...................... 2-1 Table 2-1b. IMPROVE Sites in Neighboring States and Summary of Data Availability for the VISTAS CART
Visibility and PM2.5 Analyses....................................................................................................................................... 2-2 Table 2-2. STN Sites and Summary of Data Availability for the CART Visibility and PM2.5 Analyses. ............................................... 2-2 Table 2-3. SEARCH Sites and Summary of Data Availability for the VISTAS CART Visibility and PM2.5 Analyses........................... 2-3 Table 2-4. IMPROVE and Surface Meteorological Monitoring Site Pairs. .......................................................................................... 2-6 Table 2-5. STN and Surface Meteorological Monitoring Site Pairs..................................................................................................... 2-6 Table 2-6. IMPROVE and Upper-Air Meteorological Monitoring Site Pairs. ....................................................................................... 2-7 Table 2-7. STN and Upper-Air Meteorological Monitoring Site Pairs.................................................................................................. 2-8 Table 2-8. SEARCH and Upper-Air Meteorological Monitoring Site Pairs.......................................................................................... 2-8 Table 3-1a. Summary of CART Classification Accuracy for the VISTAS Visibility Analysis: IMPROVE Sites. .................................. 3-8 Table 3-1b. Summary of CART Classification Accuracy for the VISTAS Visibility Analysis: SEARCH Sites. .................................... 3-8 Table 3-2a. Summary of CART Classification Accuracy for the VISTAS PM2.5 Analysis: IMPROVE Sites. ..................................... 3-9 Table 3-2b. Summary of CART Classification Accuracy for the VISTAS PM2.5 Analysis: STN Sites. .............................................. 3-9 Table 3-2c. Summary of CART Classification Accuracy for the VISTAS PM2.5 Analysis: SEARCH Sites. ..................................... 3-10 Table 3-3. Euclidean Distances (unitless) for IMPROVE Sites for Visibility: Inland Sites................................................................. 3-22 Table 3-4a. Euclidean Distances (unitless) for IMPROVE Sites for Visibility: Coastal Sites (Group 1). ........................................... 3-23 Table 3-4b. Euclidean Distances (unitless) for IMPROVE Sites for Visibility: Coastal Sites (Group 2). ........................................... 3-23 Table 3-5a. Euclidean Distances (unitless) for IMPROVE Sites for Visibility: Mountain Sites (Group 1). ........................................ 3-23 Table 3-5b. Euclidean Distances (unitless) for IMPROVE Sites for Visibility: Mountain Sites (Group 2) ......................................... 3-23 Table 3-6. Euclidean Distances (unitless) for IMPROVE Sites for PM2.5: Inland Sites. .................................................................... 3-24 Table 3-7. Euclidean Distances (unitless) for IMPROVE Sites for PM2.5: Coastal Sites (Group 1). ................................................. 3-24 Table 3-8a. Euclidean Distances (unitless) for IMPROVE Sites for PM2.5: Mountain Sites (Group 1).............................................. 3-24 Table 3-8b. Euclidean Distances (unitless) for IMPROVE Sites for PM2.5: Mountain Sites (Group 2).............................................. 3-25 Table 3-9a. Euclidean Distances (unitless) for STN Sites for PM2.5: Group 1. ................................................................................. 3-25 Table 3-9b. Euclidean Distances (unitless) for STN Sites for PM2.5: Group 2. ................................................................................. 3-25 Table 3-9c. Euclidean Distances (unitless) for STN Sites for PM2.5: Group 3................................................................................... 3-25 Table 3-9d. Euclidean Distances (unitless) for STN Sites for PM2.5: Group 4 .................................................................................. 3-26 Table 3-10a. Euclidean Distances (unitless) for SEARCH Sites for PM2.5: Group 1......................................................................... 3-26 Table 3-10b. Euclidean Distances (unitless) for SEARCH Sites for PM2.5: Group 2......................................................................... 3-26 Table 3-10c. Euclidean Distances (unitless) for SEARCH Sites for PM2.5: Group 3......................................................................... 3-26 Table 3-11a. Summary of Average Input Parameters for Each CART Classification Category: Visibility CART
Analysis for the IMPROVE Site Breton..................................................................................................................... 3-28 Table 3-11b. Summary of Average Input Parameters for Each CART Classification Category: Visibility CART Analysis
for the IMPROVE Site Brigantine. ............................................................................................................................ 3-29 Table 3-11c. Summary of Average Input Parameters for Each CART Classification Category: Visibility CART Analysis
for the IMPROVE Site Cadiz. ................................................................................................................................... 3-30 Table 3-11d. Summary of Average Input Parameters for Each CART Classification Category: Visibility CART Analysis
for the IMPROVE Site Caney Creek......................................................................................................................... 3-31 Table 3-11e. Summary of Average Input Parameters for Each CART Classification Category: Visibility CART Analysis
for the IMPROVE Site Cape Romain........................................................................................................................ 3-32 Table 3-11f. Summary of Average Input Parameters for Each CART Classification Category: Visibility CART Analysis
for the IMPROVE Site Chassahowitzka. .................................................................................................................. 3-33 Table 3-11g. Summary of Average Input Parameters for Each CART Classification Category: Visibility CART Analysis
for the IMPROVE Site Cohutta. ................................................................................................................................ 3-34 Table 3-11h. Summary of Average Input Parameters for Each CART Classification Category: Visibility CART Analysis
for the IMPROVE Site Dolly Sods. ........................................................................................................................... 3-35 Table 3-11i. Summary of Average Input Parameters for Each CART Classification Category: Visibility CART Analysis
for the IMPROVE Site Everglades............................................................................................................................ 3-36 Table 3-11j. Summary of Average Input Parameters for Each CART Classification Category: Visibility CART Analysis
for the IMPROVE Site Great Smoky Mountains. ...................................................................................................... 3-37 Table 3-11k. Summary of Average Input Parameters for Each CART Classification Category: Visibility CART Analysis
for the IMPROVE Site James River Face................................................................................................................. 3-38 Table 3-11l. Summary of Average Input Parameters for Each CART Classification Category: Visibility CART Analysis
for the IMPROVE Site Linville Gorge........................................................................................................................ 3-39 Table 3-11m. Summary of Average Input Parameters for Each CART Classification Category: Visibility CART Analysis
for the IMPROVE Site Mammoth Cave. ................................................................................................................... 3-40 Table 3-11n. Summary of Average Input Parameters for Each CART Classification Category: Visibility CART Analysis
for the IMPROVE Site Mingo. ................................................................................................................................... 3-41 Table 3-11o. Summary of Average Input Parameters for Each CART Classification Category: Visibility CART Analysis
for the IMPROVE Site Okefenokee. ......................................................................................................................... 3-43 Table 3-11p. Summary of Average Input Parameters for Each CART Classification Category: Visibility CART Analysis
for the IMPROVE Site Shenandoah. ........................................................................................................................ 3-44
ICF International vi VISTAS Meteorological Characterization 06-046 December 8, 2006
Characterization of Meteorology and Its Relationships to Fine Particulate Mass and Visibility in the VISTAS Region Table of Contents
Table 3-11q. Summary of Average Input Parameters for Each CART Classification Category: Visibility CART Analysis for the IMPROVE Site Shining Rock. ....................................................................................................................... 3-45
Table 3-11r. Summary of Average Input Parameters for Each CART Classification Category: Visibility CART Analysis for the IMPROVE Site Sipsey. .................................................................................................................................. 3-46
Table 3-11s. Summary of Average Input Parameters for Each CART Classification Category: Visibility CART Analysis for the IMPROVE Site St. Marks. ............................................................................................................................. 3-47
Table 3-11t. Summary of Average Input Parameters for Each CART Classification Category: Visibility CART Analysis for the IMPROVE Site Swanquarter. ........................................................................................................................ 3-48
Table 3-11u. Summary of Average Input Parameters for Each CART Classification Category: Visibility CART Analysis for the IMPROVE Site Upper Buffalo........................................................................................................................ 3-49
Table 3-12a. Summary of Average Input Parameters for Each CART Classification Category: PM2.5 CART Analysis for the STN Site Birmingham.................................................................................................................................... 3-54
Table 3-12b. Summary of Average Input Parameters for Each CART Classification Category: PM2.5 CART Analysis for the STN Site Charlotte. ....................................................................................................................................... 3-55
Table 3-12c. Summary of Average Input Parameters for Each CART Classification Category: PM2.5 CART Analysis for the STN Site Chattanooga. ................................................................................................................................. 3-56
Table 3-12d. Summary of Average Input Parameters for Each CART Classification Category: PM2.5 CART Analysis for the STN Site Greenville-Spartanburg. ................................................................................................................. 3-57
Table 3-12e. Summary of Average Input Parameters for Each CART Classification Category: PM2.5 CART Analysis for the STN Site Hickory. .......................................................................................................................................... 3-58
Table 3-12f. Summary of Average Input Parameters for Each CART Classification Category: PM2.5 CART Analysis for the STN Site Huntington-Ashland. ...................................................................................................................... 3-59
Table 3-12g. Summary of Average Input Parameters for Each CART Classification Category: PM2.5 CART Analysis for the STN Site Jackson.......................................................................................................................................... 3-60
Table 3-12h. Summary of Average Input Parameters for Each CART Classification Category: PM2.5 CART Analysis for the STN Site Kingsport-Bristol............................................................................................................................. 3-61
Table 3-12i. Summary of Average Input Parameters for Each CART Classification Category: PM2.5 CART Analysis for the STN Site Louisville. ....................................................................................................................................... 3-62
Table 3-12j. Summary of Average Input Parameters for Each CART Classification Category: PM2.5 CART Analysis for the STN Site Macon. ........................................................................................................................................... 3-63
Table 3-12k. Summary of Average Input Parameters for Each CART Classification Category: PM2.5 CART Analysis for the STN Site Memphis. ....................................................................................................................................... 3-64
Table 3-12l. Summary of Average Input Parameters for Each CART Classification Category: PM2.5 CART Analysis for the STN Site Montgomery. .................................................................................................................................. 3-65
Table 3-12m. Summary of Average Input Parameters for Each CART Classification Category: PM2.5 CART Analysis for the STN Site Nashville. ....................................................................................................................................... 3-66
Table 3-12n. Summary of Average Input Parameters for Each CART Classification Category: PM2.5 CART Analysis for the STN Site Raleigh. .......................................................................................................................................... 3-67
Table 3-12o. Summary of Average Input Parameters for Each CART Classification Category: PM2.5 CART Analysis for the STN Site Richmond. ...................................................................................................................................... 3-68
Table 3-12p. Summary of Average Input Parameters for Each CART Classification Category: PM2.5 CART Analysis for the STN Site Savannah. ...................................................................................................................................... 3-69
Table 3-13a. Summary of Average Input Parameters for Each CART Classification Category: PM2.5 CART Analysis for the SEARCH Site Atlanta (Jefferson St.). ........................................................................................................... 3-73
Table 3-13b. Summary of Average Input Parameters for Each CART Classification Category: PM2.5 CART Analysis for the SEARCH Site Yorkville.................................................................................................................................. 3-74
Table 3-13c. Summary of Average Input Parameters for Each CART Classification Category: PM2.5 CART Analysis for the SEARCH Site Birmingham. ........................................................................................................................... 3-75
Table 3-13d. Summary of Average Input Parameters for Each CART Classification Category: PM2.5 CART Analysis for the SEARCH Site Centreville. ............................................................................................................................. 3-76
Table 3-13e. Summary of Average Input Parameters for Each CART Classification Category: PM2.5 CART Analysis for the SEARCH Site Pensacola. ............................................................................................................................. 3-77
Table 3-13f. Summary of Average Input Parameters for Each CART Classification Category: PM2.5 CART Analysis for the SEARCH Site Outlying Landing Field (OLF). ................................................................................................ 3-78
Table 3-13g. Summary of Average Input Parameters for Each CART Classification Category: PM2.5 CART Analysis for the SEARCH Site Gulfport. ................................................................................................................................. 3-79
Table 3-13h. Summary of Average Input Parameters for Each CART Classification Category: PM2.5 CART Analysis for the SEARCH Site Oak Grove. ............................................................................................................................. 3-80
Table 3-14a. Summary of Average Input Parameters for Key Bins for CART Classification Categories 4 and 5: Visibility CART Analysis for the IMPROVE Site Breton..................................................................................................................... 3-83
Table 3-14b. Summary of Average Input Parameters for Key Bins for CART Classification Categories 4 and 5: Visibility CART Analysis for the IMPROVE Site Brigantine. .............................................................................................................. 3-84
Table 3-14c. Summary of Average Input Parameters for Key Bins for CART Classification Categories 4 and 5: Visibility CART Analysis for the IMPROVE Site Cadiz. ..................................................................................................................... 3-85
Table 3-14d. Summary of Average Input Parameters for Key Bins for CART Classification Categories 4 and 5: Visibility CART Analysis for the IMPROVE Site Caney Creek. ......................................................................................................... 3-86
ICF International vii VISTAS Meteorological Characterization 06-046 December 8, 2006

Characterization of Meteorology and Its Relationships to Fine Particulate Mass and Visibility in the VISTAS Region Table of Contents
Table 3-14e. Summary of Average Input Parameters for Key Bins for CART Classification Categories 4 and 5: Visibility CART Analysis for the IMPROVE Site Cape Romain. ........................................................................................................ 3-87
Table 3-14f. Summary of Average Input Parameters for Key Bins for CART Classification Categories 4 and 5: Visibility CART Analysis for the IMPROVE Site Chassahowitzka. .................................................................................................... 3-88
Table 3-14g. Summary of Average Input Parameters for Key Bins for CART Classification Categories 4 and 5: Visibility CART Analysis for the IMPROVE Site Cohutta................................................................................................................... 3-89
Table 3-14h. Summary of Average Input Parameters for Key Bins for CART Classification Categories 4 and 5: Visibility CART Analysis for the IMPROVE Site Dolly Sods. ............................................................................................................. 3-90
Table 3-14i. Summary of Average Input Parameters for Key Bins for CART Classification Categories 4 and 5: Visibility CART Analysis for the IMPROVE Site Everglades. ............................................................................................................ 3-92
Table 3-14j. Summary of Average Input Parameters for Key Bins for CART Classification Categories 4 and 5: Visibility CART Analysis for the IMPROVE Site Great Smoky Mountains......................................................................................... 3-93
Table 3-14k. Summary of Average Input Parameters for Key Bins for CART Classification Categories 4 and 5: Visibility CART Analysis for the IMPROVE Site James River Face. ................................................................................................. 3-94
Table 3-14l. Summary of Average Input Parameters for Key Bins for CART Classification Categories 4 and 5: Visibility CART Analysis for the IMPROVE Site Linville Gorge. ........................................................................................................ 3-95
Table 3-14m. Summary of Average Input Parameters for Key Bins for CART Classification Categories 4 and 5: Visibility CART Analysis for the IMPROVE Site Mammoth Cave...................................................................................................... 3-96
Table 3-14n. Summary of Average Input Parameters for Key Bins for CART Classification Categories 4 and 5: Visibility CART Analysis for the IMPROVE Site Mingo. .................................................................................................................... 3-97
Table 3-14o. Summary of Average Input Parameters for Key Bins for CART Classification Categories 4 and 5: Visibility CART Analysis for the IMPROVE Site Okefenokee............................................................................................................ 3-99
Table 3-14p. Summary of Average Input Parameters for Key Bins for CART Classification Categories 4 and 5: Visibility CART Analysis for the IMPROVE Site Shenandoah......................................................................................................... 3-100
Table 3-14q. Summary of Average Input Parameters for Key Bins for CART Classification Categories 4 and 5: Visibility CART Analysis for the IMPROVE Site Shining Rock. ....................................................................................................... 3-101
Table 3-14r. Summary of Average Input Parameters for Key Bins for CART Classification Categories 4 and 5: Visibility CART Analysis for the IMPROVE Site Sipsey. ................................................................................................................. 3-102
Table 3-14s. Summary of Average Input Parameters for Key Bins for CART Classification Categories 4 and 5: Visibility CART Analysis for the IMPROVE Site St. Marks. ............................................................................................................. 3-103
Table 3-14t. Summary of Average Input Parameters for Key Bins for CART Classification Categories 4 and 5: Visibility CART Analysis for the IMPROVE Site Swanquarter. ........................................................................................................ 3-104
Table 3-14u. Summary of Average Input Parameters for Key Bins for CART Classification Categories 4 and 5: Visibility CART Analysis for the IMPROVE Site Upper Buffalo. ...................................................................................................... 3-105
Table 3-15a. Summary of Average Input Parameters for Key Bins for CART Classification Categories 3 and 4: PM2.5 CART Analysis for IMPROVE Site Breton. ............................................................................................................. 3-118
Table 3-15b. Summary of Average Input Parameters for Key Bins for CART Classification Categories 3 and 4: PM2.5 CART Analysis IMPROVE Site Brigantine. ............................................................................................................ 3-119
Table 3-15c. Summary of Average Input Parameters for Key Bins for CART Classification Categories 3 and 4: PM2.5 CART Analysis for IMPROVE Site Cadiz. .............................................................................................................. 3-120
Table 3-15d. Summary of Average Input Parameters for Key Bins for CART Classification Categories 3 and 4: PM2.5 CART Analysis for IMPROVE Site Caney Creek. .................................................................................................. 3-121
Table 3-15e. Summary of Average Input Parameters for Key Bins for CART Classification Categories 3 and 4: PM2.5 CART Analysis for IMPROVE Site Cape Romain. ................................................................................................. 3-122
Table 3-15f. Summary of Average Input Parameters for Each Key Bins for CART Classification Categories 3 and 4: PM2.5 CART Analysis for IMPROVE Site Chassahowitzka. ............................................................................................. 3-123
Table 3-15g. Summary of Average Input Parameters for Key Bins for CART Classification Categories 3 and 4: PM2.5 CART Analysis for IMPROVE Site Cohutta. ........................................................................................................... 3-124
Table 3-15h. Summary of Average Input Parameters for Key Bins for CART Classification Categories 3 and 4: PM2.5 CART Analysis for IMPROVE Site Dolly Sods. ...................................................................................................... 3-125
Table 3-15i. Summary of Average Input Parameters for Key Bins for CART Classification Categories 3 and 4: PM2.5 CART Analysis for IMPROVE Site Everglades. ..................................................................................................... 3-127
Table 3-15j. Summary of Average Input Parameters for Key Bins for CART Classification Categories 3 and 4: PM2.5 CART Analysis for IMPROVE Site Great Smoky Mountains.................................................................................. 3-128
Table 3-15k. Summary of Average Input Parameters for Key Bins for CART Classification Categories 3 and 4: PM2.5 CART Analysis for IMPROVE Site James River Face. .......................................................................................... 3-129
Table 3-15l. Summary of Average Input Parameters for Key Bins for CART Classification Categories 3 and 4: PM2.5 CART Analysis for IMPROVE Site Linville Gorge. ................................................................................................. 3-130
Table 3-15m. Summary of Average Input Parameters for Key Bins for CART Classification Categories 3 and 4: PM2.5 CART Analysis for IMPROVE Site Mammoth Cave. .............................................................................................. 3-131
Table 3-15n. Summary of Average Input Parameters for Key Bins for CART Classification Categories 3 and 4: PM2.5 CART Analysis for IMPROVE Site Mingo............................................................................................................... 3-132
Table 3-15o. Summary of Average Input Parameters for Key Bins for CART Classification Categories 3 and 4: PM2.5 CART Analysis for Okefenokee. ............................................................................................................................. 3-134
Table 3-15p. Summary of Average Input Parameters for Key Bins for CART Classification Categories 3 and 4: PM2.5 CART Analysis for IMPROVE Site Shenandoah. ................................................................................................... 3-135
ICF International viii VISTAS Meteorological Characterization 06-046 December 8, 2006

Characterization of Meteorology and Its Relationships to Fine Particulate Mass and Visibility in the VISTAS Region Table of Contents
Table 3-15q. Summary of Average Input Parameters for Key Bins for CART Classification Categories 3 and 4: PM2.5 CART Analysis for IMPROVE Site Shining Rock. .................................................................................................. 3-136
Table 3-15r. Summary of Average Input Parameters for Key Bins for CART Classification Categories 3 and 4: PM2.5 CART Analysis for IMPROVE Site Sipsey.............................................................................................................. 3-137
Table 3-15s. Summary of Average Input Parameters for Key Bins for CART Classification Categories 3 and 4: PM2.5 CART Analysis for IMPROVE Site St. Marks. ........................................................................................................ 3-138
Table 3-15t. Summary of Average Input Parameters for Key Bins for CART Classification Categories 3 and 4: PM2.5 CART Analysis for IMPROVE Site Swanquarter. ................................................................................................... 3-139
Table 3-15u. Summary of Average Input Parameters for Key Bins for CART Classification Categories 3 and 4: PM2.5 CART Analysis for IMPROVE Site Upper Buffalo. ................................................................................................. 3-140
Table 3-16a. Summary of Average Input Parameters for Key Bins for CART Classification Categories 3 and 4: PM2.5 CART Analysis for STN Site Birmingham............................................................................................................... 3-153
Table 3-16b. Summary of Average Input Parameters for Key Bins for CART Classification Categories 3 and 4: PM2.5 CART Analysis for STN Site Charlotte. .................................................................................................................. 3-154
Table 3-16c. Summary of Average Input Parameters for Key Bins for CART Classification Categories 3 and 4: PM2.5 CART Analysis for STN Site Chattanooga. ............................................................................................................ 3-155
Table 3-16d. Summary of Average Input Parameters for Key Bins for CART Classification Categories 3 and 4: PM2.5 CART Analysis for STN Site Greenville-Spartanburg............................................................................................. 3-156
Table 3-16e. Summary of Average Input Parameters for Key Bins for CART Classification Categories 3 and 4: PM2.5 CART Analysis for STN Site Hickory. ..................................................................................................................... 3-157
Table 3-16f. Summary of Average Input Parameters for Key Bins for CART Classification Categories 3 and 4: PM2.5 CART Analysis for STN Site Huntington-Ashland. ................................................................................................. 3-158
Table 3-16g. Summary of Average Input Parameters for Key Bins for CART Classification Categories 3 and 4: PM2.5 CART Analysis for STN Site Jackson..................................................................................................................... 3-159
Table 3-16h. Summary of Average Input Parameters for Key Bins for CART Classification Categories 3 and 4: PM2.5 CART Analysis for STN Site Kingsport-Bristol. ...................................................................................................... 3-160
Table 3-16i. Summary of Average Input Parameters for Key Bins for CART Classification Categories 3 and 4: PM2.5 CART Analysis for STN Site Louisville. .................................................................................................................. 3-161
Table 3-16j. Summary of Average Input Parameters for Key Bins for CART Classification Categories 3 and 4: PM2.5 CART Analysis for STN Site Macon. ...................................................................................................................... 3-162
Table 3-16k. Summary of Average Input Parameters for Each Key Bins for CART Classification Categories 3 and 4: PM2.5 CART Analysis for STN Site Memphis. .................................................................................................................. 3-163
Table 3-16l. Summary of Average Input Parameters for Key Bins for CART Classification Categories 3 and 4: PM2.5 CART Analysis for STN Site Montgomery. ............................................................................................................. 3-164
Table 3-16m. Summary of Average Input Parameters for Key Bins for CART Classification Categories 3 and 4: PM2.5 CART Analysis for STN Site Nashville. .................................................................................................................. 3-165
Table 3-16n. Summary of Average Input Parameters for Key Bins for CART Classification Categories 3 and 4: PM2.5 CART Analysis for STN Site Raleigh...................................................................................................................... 3-166
Table 3-16o. Summary of Average Input Parameters for Key Bins for CART Classification Categories 3 and 4: PM2.5 CART Analysis for STN Site Richmond.................................................................................................................. 3-167
Table 3-16p. Summary of Average Input Parameters for Key Bins for CART Classification Categories 3 and 4: PM2.5 CART Analysis for STN Site Savannah.................................................................................................................. 3-168
Table 3-17a. Summary of Average Input Parameters for Key Bins for CART Classification Categories 3 and 4: PM2.5 CART Analysis for SEARCH Site Atlanta (Jefferson St.). ...................................................................................... 3-178
Table 3-17b. Summary of Average Input Parameters for Key Bins for CART Classification Categories 3 and 4: PM2.5 CART Analysis for SEARCH Site Yorkville. ........................................................................................................... 3-179
Table 3-17c. Summary of Average Input Parameters for Key Bins for CART Classification Categories 3 and 4: PM2.5 CART Analysis for SEARCH Site Birmingham....................................................................................................... 3-180
Table 3-17d. Summary of Average Input Parameters for Key Bins for CART Classification Categories 3 and 4: PM2.5 CART Analysis for SEARCH Site Centreville. ........................................................................................................ 3-181
Table 3-17e. Summary of Average Input Parameters for Key Bins for CART Classification Categories 3 and 4: PM2.5 CART Analysis for SEARCH Site Pensacola. ........................................................................................................ 3-182
Table 3-17f. Summary of Average Input Parameters for Key Bins for CART Classification Categories 3 and 4: PM2.5 CART Analysis for SEARCH Site Outlying Landing Field (OLF)............................................................................ 3-183
Table 3-17g. Summary of Average Input Parameters for Key Bins for CART Classification Categories 3 and 4: PM2.5 CART Analysis for SEARCH Site Gulfport. ............................................................................................................ 3-184
Table 3-17h. Summary of Average Input Parameters for Key Bins for CART Classification Categories 3 and 4: PM2.5 CART Analysis for SEARCH Site Oak Grove......................................................................................................... 3-185
Table 4-1. Summary of Visibility, PM2.5, and Meteorological Characteristics for the 2000-2004 Analysis Period: IMPROVE Sites. .. 4-8 (a) Breton.................................................................................................................................................................... 4-8 (b) Brigantine .............................................................................................................................................................. 4-8 (c) Cadiz ..................................................................................................................................................................... 4-8 (d) Caney Creek ......................................................................................................................................................... 4-9 (e) Cape Romain ........................................................................................................................................................ 4-9 (f) Chassahowitzka ..................................................................................................................................................... 4-9 (g) Cohutta................................................................................................................................................................ 4-10 (h) Dolly Sods ........................................................................................................................................................... 4-10
ICF International ix VISTAS Meteorological Characterization 06-046 December 8, 2006

Characterization of Meteorology and Its Relationships to Fine Particulate Mass and Visibility in the VISTAS Region Table of Contents
(i) Everglades............................................................................................................................................................ 4-10 (j) Great Smoky Mountains ....................................................................................................................................... 4-11 (k) James River Face................................................................................................................................................ 4-11 (l) Linville Gorge........................................................................................................................................................ 4-11 (m) Mammoth Cave.................................................................................................................................................. 4-12 (n) Mingo................................................................................................................................................................... 4-12 (o) Okefenokee......................................................................................................................................................... 4-12 (p) Shenandoah........................................................................................................................................................ 4-13 (q) Shining Rock ....................................................................................................................................................... 4-13 (r) Sipsey .................................................................................................................................................................. 4-13 (s) St. Marks ............................................................................................................................................................. 4-14 (t) Swanquarter ......................................................................................................................................................... 4-14 (u) Upper Buffalo ...................................................................................................................................................... 4-14
Table 4-2. Summary of PM2.5 and Meteorological Characteristics for the 2000-2004 Analysis Period: STN Sites. ......................... 4-16 (a) Birmingham ......................................................................................................................................................... 4-16 (b) Charlotte.............................................................................................................................................................. 4-16 (c) Chattanooga........................................................................................................................................................ 4-16 (d) Greenville-Spartanburg ....................................................................................................................................... 4-17 (e) Hickory ................................................................................................................................................................ 4-17 (f) Huntington-Ashland.............................................................................................................................................. 4-17 (g) Jackson ............................................................................................................................................................... 4-18 (h) Kingsport-Bristol .................................................................................................................................................. 4-18 (i) Louisville............................................................................................................................................................... 4-18 (j) Macon................................................................................................................................................................... 4-19 (k) Memphis .............................................................................................................................................................. 4-19 (l) Montgomery.......................................................................................................................................................... 4-19 (m) Nashville............................................................................................................................................................. 4-20 (n) Raleigh ................................................................................................................................................................ 4-20 (o) Richmond ............................................................................................................................................................ 4-20 (p) Savannah ............................................................................................................................................................ 4-21
Table 4-3. Summary of PM2.5 and Meteorological Characteristics for the 2000-2004 Analysis Period: SEARCH Sites. ................. 4-38 (a) Atlanta (Jefferson St.) ......................................................................................................................................... 4-38 (b) Yorkville............................................................................................................................................................... 4-39 (c) Birmingham ......................................................................................................................................................... 4-39 (d) Centreville ........................................................................................................................................................... 4-39 (e) Pensacola............................................................................................................................................................ 4-40 (f) Outlying Landing Field.......................................................................................................................................... 4-40 (g) Gulfport................................................................................................................................................................ 4-40 (h) Oak Grove........................................................................................................................................................... 4-41
Table 4-4. Summary of Visibility, PM2.5 and Meteorological Characteristics for 2000-2004, 2002, and the 2002 VISTAS Episodic Analysis Periods: IMPROVE Sites. ........................................................................ 4-51 (a) Breton.................................................................................................................................................................. 4-51 (b) Brigantine ............................................................................................................................................................ 4-52 (c) Cadiz ................................................................................................................................................................... 4-52 (d) Caney Creek ....................................................................................................................................................... 4-52 (e) Cape Romain ...................................................................................................................................................... 4-52 (f) Chassahowitzka ................................................................................................................................................... 4-53 (g) Cohutta................................................................................................................................................................ 4-53 (h) Dolly Sods ........................................................................................................................................................... 4-53 (i) Everglades............................................................................................................................................................ 4-53 (j) Great Smoky Mountains ....................................................................................................................................... 4-54 (k) James River Face................................................................................................................................................ 4-54 (l) Linville Gorge........................................................................................................................................................ 4-54 (m) Mammoth Cave.................................................................................................................................................. 4-54 (n) Mingo................................................................................................................................................................... 4-55 (o) Okefenokee......................................................................................................................................................... 4-55 (p) Shenandoah........................................................................................................................................................ 4-55 (q) Shining Rock ....................................................................................................................................................... 4-55 (r) Sipsey .................................................................................................................................................................. 4-56 (s) St. Marks ............................................................................................................................................................. 4-56 (t) Swanquarter ......................................................................................................................................................... 4-56 (u) Upper Buffalo ...................................................................................................................................................... 4-56
Table 4-5. Summary of PM2.5 and Meteorological Characteristics for 2000-2004, 2002, and the 2002 VISTAS Episodic Analysis Periods: STN Sites. .................................................................................................................................................. 4-61 (a) Birmingham ......................................................................................................................................................... 4-61 (b) Charlotte.............................................................................................................................................................. 4-61 (c) Chattanooga........................................................................................................................................................ 4-61
ICF International x VISTAS Meteorological Characterization 06-046 December 8, 2006

Characterization of Meteorology and Its Relationships to Fine Particulate Mass and Visibility in the VISTAS Region Table of Contents
(d) Greenville-Spartanburg ....................................................................................................................................... 4-61 (e) Hickory ................................................................................................................................................................ 4-62 (f) Huntington-Ashland.............................................................................................................................................. 4-62 (g) Jackson ............................................................................................................................................................... 4-62 (h) Kingsport-Bristol .................................................................................................................................................. 4-62 (i) Louisville............................................................................................................................................................... 4-63 (j) Macon................................................................................................................................................................... 4-63 (k) Memphis .............................................................................................................................................................. 4-63 (l) Montgomery.......................................................................................................................................................... 4-63 (m) Nashville............................................................................................................................................................. 4-64 (n) Raleigh ................................................................................................................................................................ 4-64 (o) Richmond ............................................................................................................................................................ 4-64 (p) Savannah ............................................................................................................................................................ 4-64
Table 4-6. Summary of PM2.5 and Meteorological Characteristics for 2000-2004, 2002, and the 2002 VISTAS Episodic Analysis Periods: SEARCH Sites. .......................................................................................................................................... 4-70 (a) Atlanta (Jefferson St.) ......................................................................................................................................... 4-70 (b) Yorkville............................................................................................................................................................... 4-70 (c) Birmingham ......................................................................................................................................................... 4-70 (d) Centreville ........................................................................................................................................................... 4-70 (e) Pensacola............................................................................................................................................................ 4-71 (f) Outlying Landing Field.......................................................................................................................................... 4-71 (g) Gulfport................................................................................................................................................................ 4-71 (h) Oak Grove........................................................................................................................................................... 4-71
Table A-1. Summary of Average Input Parameters for Each CART Classification Category: PM2.5 CART Analysis for the Birmingham STN Site. ................................................................................................................................................A-3
Table A-2. Summary of Average Input Parameters for Each CART Classification Category: PM2.5 CART Analysis for the Birmingham SEARCH Site. ........................................................................................................................................A-4
Table A-3. Summary of Average Input Parameters for Key Bins for CART Classification Category 4: PM2.5 CART Analysis for Birmingham.................................................................................................................................................................A-5
Table A-4. Summary of PM2.5 and Meteorological Characteristics for the 2000-2004 Analysis Period: Birmingham STN Site. ........A-8 Table A-5. Summary of PM2.5 and Meteorological Characteristics for the 2000-2004 Analysis Period: Birmingham SEARCH Site. A-8 Table A-6. Summary of PM2.5 and Meteorological Characteristics for 2000-2004, 2002, and the 2002 VISTAS Episodic Analysis
Periods: Birmingham STN Site. ..................................................................................................................................A-9 Table A-7. Summary of PM2.5 and Meteorological Characteristics for 2000-2004, 2002, and the 2002 VISTAS Episodic Analysis
Periods: Birmingham SEARCH Site. ..........................................................................................................................A-9
ICF International xi VISTAS Meteorological Characterization 06-046 December 8, 2006

Characterization of Meteorology and Its Relationships to Fine Particulate Mass and Visibility in the VISTAS Region Table of Contents
This page deliberately left blank.
ICF International xii VISTAS Meteorological Characterization 06-046 December 8, 2006

Executive Summary This report summarizes the methods and results of a meteorological characterization study designed to examine the relationships between meteorology, fine particulates, and regional haze at air quality monitoring sites throughout the Southeastern U.S. This study is one of the technical analyses conducted by the Visibility Improvement—State and Tribal Association of the Southeast (VISTAS) to support regulatory planning for regional haze and related air quality issues for the southeastern states.
The results of this study are intended to provide information on the site-specific and regional meteorological and air quality characteristics of the 2000-2004 regional-haze baseline period and, in particular, the representativeness of the meteorological and air quality conditions for 2002, which is the annual simulation period for the VISTAS air quality modeling analysis.
A primary objective of this analysis was to provide the information and tools needed to characterize the relationships between visibility (regional haze), fine particulate matter, and meteorology for Class I and other selected areas within and surrounding the VISTAS region. Classification and Regression Tree (CART) statistical analysis was used to examine these relationships for Interagency Monitoring of Protected Visual Environments (IMPROVE), Speciated Trends Network (STN), and Southeastern Aerosol Research and Characterization (SEARCH) air quality monitoring sites located throughout the Southeast. The CART results provide insight into the relationships between meteorology, fine particulates, and visibility that are important to atmospheric modeling.
Separate CART analyses were conducted for visibility (as defined by the extinction coefficient) and fine particulates (particulate matter with a diameter less than 2.5 microns, PM2.5). Visibility analyses were conducted for the IMPROVE and SEARCH sites only; PM2.5 analyses were conducted for the IMPROVE, STN, and SEARCH sites. CART was applied for each site and was used to classify days for the period 2000-2004 into groups (or bins) with similar air quality (visibility or PM2.5) and meteorological characteristics. Classification accuracy ranged from approximately 72 to 85 percent for visibility and from approximately 75 to 90 percent for PM2.5. In applying the CART technique, we found that good classification for most sites was dependent on information about prior day air quality. This indicates that regional buildup and transport of fine particles and related precursor species influences regional visibility and PM2.5 concentrations. We also found that moisture is a important meteorological parameter for good classification for both PM2.5 and visibility and that the more complex role of moisture in determining light extinction—affecting both particle formation and the contribution of sulfate and nitrate particle species to light extinction—may account for the overall, better classification accuracy for PM2.5, compared to extinction coefficient.
The CART results indicate that he most important parameters for determining visibility in the southeastern U.S. include: relative humidity, prior day PM2.5 concentrations at potentially upwind monitoring sites, 850 mb temperature, surface temperature (reflecting seasonal differences), and wind speed (both near the surface and aloft). The list of important parameters is similar for PM2.5, but relative humidity is less important. Wind directions are not used frequently enough in the CART trees to be considered important parameters to the overall classification, but they are often used near the end of the CART pathways to distinguish poor visibility and high PM2.5 days. These results vary by site, although, there are similarities among the sites with similar geographical features.
The CART-derived parameter importance rankings and values were also used to examine potential site groupings. We assumed that similarities in the important parameters between or
ICF International 1 VISTAS Meteorological Characterization 06-046 December 8, 2006

Characterization of Meteorology and Its Relationships to Fine Particulate Mass and Visibility in the VISTAS Region Executive Summary
among sites indicate similarities in the mechanisms influencing air quality at these sites, and quantified the similarities and differences using a Euclidean distance metric. Although there are some exceptions, the CART-derived groupings, which are based on parameter importance, are also supported by similarities in location and geography. These groupings may provide the basis for assessing model performance and understanding the reasons for model performance problems, as well as accounting for differences in the effectiveness of air quality measures across the monitoring sites and regions.
We also used the CART input data and results to explore the relationships between the meteorological and other input parameters and the air quality metrics, and to examine the specific combinations of parameters (conditions) that lead to impaired air quality. There are often clear distinctions between the average values of the parameters for days in high and low visibility categories and the high and low PM2.5 categories.
Insight for atmospheric modeling is gained by considering the characteristics of the bins that contain the 20 percent haziest days or the high PM2.5 days for each site. Poor visibility and high PM2.5 days are grouped into bins that are characterized by different meteorological and prior-day air quality conditions. One of the more notable differences among the different poor visibility and high PM2.5 bins is wind direction, especially surface wind direction. This indicates that different sources (source-receptor relationships) may influence visibility and PM2.5 on different days and has implications for emissions control strategy development. In addition, for several sites, large differences in average temperature among the key bins indicate that the regimes vary with season. Other differences involve prior day PM2.5 concentration, relative humidity, stability, and degree of persistence (indicating a sea or gulf breeze) for the coastal sites. The differences in the individual parameters combine to represent the different regimes, and there are multiple regimes associated with poor visibility and high PM2.5 for all of the areas of interest.
The CART analyses also provide insight into PM2.5 composition for different types of poor visibility days and high PM2.5 days. In general, analysis of the compositional characteristics for the bins containing the 20 percent haziest days for the IMPROVE sites within the VISTAS region indicates that, on average, ammonium sulfate and organic carbon are the two most important contributors to poor visibility and that their relative contributions vary by site, by bin, and with meteorology. For the inland IMPROVE sites, ammonium sulfate is the dominant contributor. For the coastal IMPROVE sites the contributions from ammonium sulfate and organic carbon on the poor visibility days are more comparable than for the interior sites. As for visibility, the high PM2.5 concentration bins are distinguished from the lower concentration bins by higher sulfate and organic matter concentrations.
The STN and SEARCH PM2.5 analyses indicate a much larger proportional contribution from organic matter than the IMPROVE sites, especially for the higher PM2.5 bins. This is in part due to differences between the measurement techniques for organic carbon. With the higher values for organics, the dominant species varies by bin, much more so than for the IMPROVE sites. These variations are attributable to differences in meteorology as well as regional pollutant transport.
The CART results were used to explore several questions related to modeling episode period representativeness. The key question addressed is: How representative is the year 2002, as selected for VISTAS atmospheric modeling, considering meteorology, fine particulate, and visibility, relative to the full baseline period? The characteristics of the 2000-2004 baseline period and each individual year comprising that period were examined and compared.
ICF International 2 VISTAS Meteorological Characterization 06-046 December 8, 2006
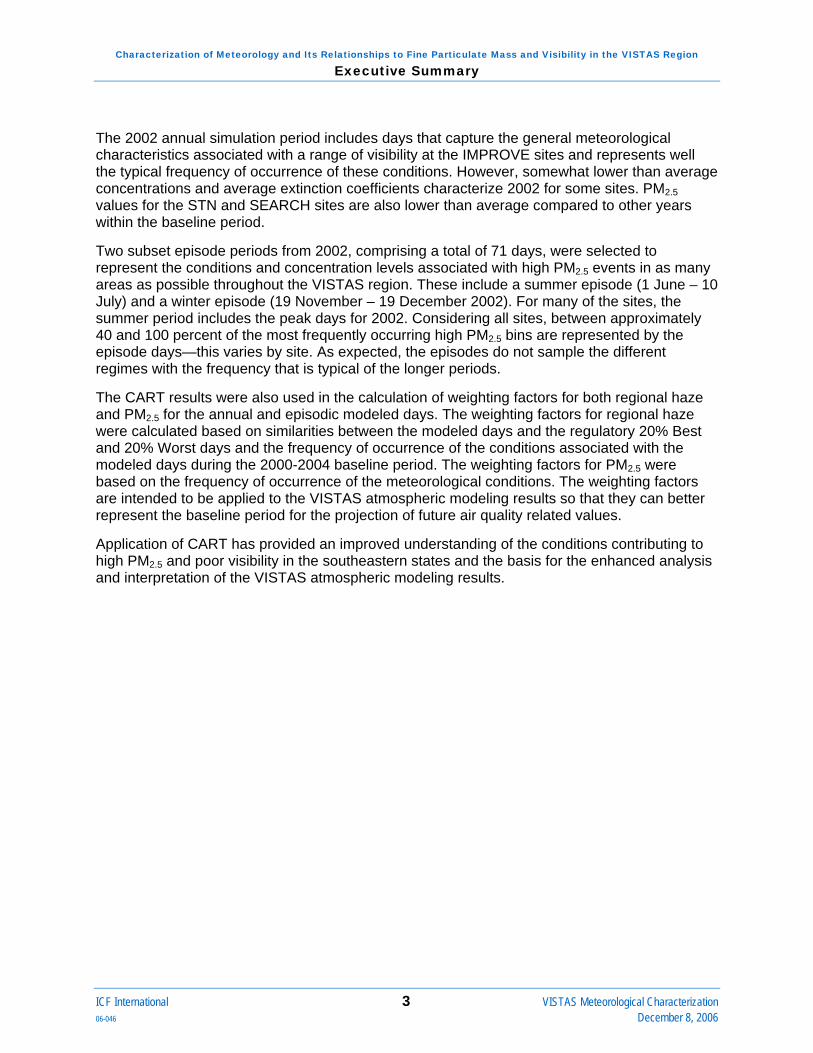
Characterization of Meteorology and Its Relationships to Fine Particulate Mass and Visibility in the VISTAS Region Executive Summary
The 2002 annual simulation period includes days that capture the general meteorological characteristics associated with a range of visibility at the IMPROVE sites and represents well the typical frequency of occurrence of these conditions. However, somewhat lower than average concentrations and average extinction coefficients characterize 2002 for some sites. PM2.5 values for the STN and SEARCH sites are also lower than average compared to other years within the baseline period.
Two subset episode periods from 2002, comprising a total of 71 days, were selected to represent the conditions and concentration levels associated with high PM2.5 events in as many areas as possible throughout the VISTAS region. These include a summer episode (1 June – 10 July) and a winter episode (19 November – 19 December 2002). For many of the sites, the summer period includes the peak days for 2002. Considering all sites, between approximately 40 and 100 percent of the most frequently occurring high PM2.5 bins are represented by the episode days—this varies by site. As expected, the episodes do not sample the different regimes with the frequency that is typical of the longer periods.
The CART results were also used in the calculation of weighting factors for both regional haze and PM2.5 for the annual and episodic modeled days. The weighting factors for regional haze were calculated based on similarities between the modeled days and the regulatory 20% Best and 20% Worst days and the frequency of occurrence of the conditions associated with the modeled days during the 2000-2004 baseline period. The weighting factors for PM2.5 were based on the frequency of occurrence of the meteorological conditions. The weighting factors are intended to be applied to the VISTAS atmospheric modeling results so that they can better represent the baseline period for the projection of future air quality related values.
Application of CART has provided an improved understanding of the conditions contributing to high PM2.5 and poor visibility in the southeastern states and the basis for the enhanced analysis and interpretation of the VISTAS atmospheric modeling results.
ICF International 3 VISTAS Meteorological Characterization 06-046 December 8, 2006

Characterization of Meteorology and Its Relationships to Fine Particulate Mass and Visibility in the VISTAS Region Executive Summary
This page deliberately left blank.
ICF International 4 VISTAS Meteorological Characterization 06-046 December 8, 2006
1. Introduction This report summarizes the methods and results of the VISTAS meteorological characterization study. This study was designed to examine the relationships between meteorology, fine particulates, and regional haze at air quality monitoring sites throughout the Southeastern U.S., and to provide information on the site-specific and regional meteorological and air quality characteristics of the 2000-2004 baseline and 2002 air quality modeling periods.
1.1. Background In 1999, the U.S. Environmental Protection Agency (EPA) promulgated regional haze regulations to prevent “any future, and remedy any existing, impairment of visibility” at 156 designated Class I areas (national parks greater than 6000 acres and wilderness areas greater than 5000 acres) (Regional Haze Regulations, 1999). The regional haze rule calls for states to establish “reasonable progress goals” for each Class I area to improve visibility on the 20% haziest days and to prevent visibility degradation on the 20% clearest days. The national goal is to return visibility to natural background levels by 2064. Using the period 2000 to 2004 as the baseline period, states are to evaluate progress in improving visibility by 2018 and every 10 years thereafter. State Implementation Plans (SIPs) for the first phase of the regional haze regulation are due in December 2007.
The National Ambient Air Quality Standard (NAAQS) for particulate matter was revised in 1997 to set annual and 24-hour limits for particles with diameters less than 2.5 microns (PM2.5). Based on data for 2001-2003, several counties in the southeastern states were designated in December 2004 as not attaining the annual PM2.5 standard. By April 2008, affected states are required to submit a SIP demonstrating control strategies to attain the annual PM2.5 standard by April 2010.
The Visibility Improvement – State and Tribal Association of the Southeast (VISTAS) is the Regional Planning Organization (RPO) for ten southeastern states and is conducting the technical analyses to support the States’ regulatory planning for regional haze and related air quality issues. As part of this technical support, VISTAS is conducting regional-scale air quality modeling for regional haze and PM2.5 using an annual simulation period of 2002. In order to use the simulation results appropriately, VISTAS is also conducting the data analysis study described in this report to identify, describe, and otherwise characterize the meteorological conditions that result in different values of visibility and PM2.5, and to relate these metrics to the days that comprise the annual simulation period.
1.2. Objectives and Key Questions A primary objective of this analysis was to provide the information and tools needed to characterize the relationships between visibility (regional haze), PM2.5, and meteorology for Class I and other selected areas within and surrounding the VISTAS region. Classification and Regression Tree (CART) statistical analysis was used to examine these relationships for Interagency Monitoring of Protected Visual Environments (IMPROVE), Speciated Trends Network (STN), and Southeastern Aerosol Research and Characterization (SEARCH) air quality monitoring sites located in the Southeast.
A second objective of the study was to assess the meteorological representativeness of the 2002 modeling period and to guide the use and interpretation of the modeling results for each area of interest and the region. The reliable application of modeling tools for analysis of the effects of future emissions changes on air quality requires that the periods selected for model application represent the type and range of meteorological conditions and pollutant concentration levels that characterize the air quality problem. This applies to discrete multi-day simulation periods and their use in representing expected changes in seasonal and annual
ICF International 1-1 VISTAS Meteorological Characterization 06-046 December 8, 2006

Characterization of Meteorology and Its Relationships to Fine Particulate Mass and Visibility in the VISTAS Region Introduction
metrics, as well as to annual simulation periods and their ability to reliably represent future-year values of the NAAQS that typically rely on multiple years of data to determine progress and compliance. A key assumption in any modeling exercise is that the results for the modeled periods can be applied to the evaluation of the effects of emissions changes and the determination of attainment or compliance for some future year. Thus, it is important that the modeled periods represent the range and type of frequently occurring meteorological conditions that describe the current (and possible future) air quality.
At first thought, use of an annual simulation period for modeling regional haze and PM2.5 seems a reasonable solution to the episode selection problem. However, this is only the case if the year that is selected exhibits the type, range, and relative frequencies of meteorological conditions that characterize an area relative to specific air quality parameters. It follows that the ability to identify, describe, and otherwise characterize the conditions that result in different values of the relevant air quality metrics, and to relate these to the days that comprise the modeling episode periods, is key to the appropriate use of the any simulation results.
To support this type of assessment for VISTAS, the CART input data and results were also used in this study to provide information about the frequency of occurrence of different types of meteorological conditions; differences in PM species concentrations for different ranges of visibility, PM2.5 concentrations and meteorological types; and the representativeness of selected annual or multi-day simulation periods. Specifically, key questions that are being considered in this study include, but are not limited to, the following:
1. How representative is the year 2002, as selected for VISTAS atmospheric modeling, considering meteorology, fine particulate, and visibility? This is addressed for each site and for the VISTAS region.
2. How well do subset modeling periods chosen by VISTAS for emission sensitivity analysis capture the range of relationships between meteorology and air quality for each site of interest and for the VISTAS region?
1.3. Overview of the Methodologies Classification and Regression Tree (CART) statistical analysis was used in this study to classify days for the period 2000–2004 according to visibility (as defined by the extinction coefficient), fine particulates (particulate matter with a diameter less than 2.5 microns, PM2.5), and meteorological parameters. The CART input data and results provide information about the relationships between the meteorology and the visibility and PM2.5 parameters, the frequency of occurrence of different types of meteorological conditions, the basis for examining differences in PM species concentrations for different ranges of visibility and PM2.5 concentrations and different meteorological types, and the basis for examining the representativeness of selected multi-day or annual simulation periods.
The CART results were used to define the role of meteorology in determining visibility and PM2.5 concentrations and distinguishing between hazy and clear days for each site. Similarities and differences among the sites were used to develop a regional perspective. The CART results were also used to examine the role of carryover or regional transport of pollutants and the contribution of these mechanisms to visibility degradation.
The CART results for 2000-2004 were incorporated into an interactive analytical tool that, in its characterization mode, allows users to extract information that can be used to answer questions
ICF International 1-2 VISTAS Meteorological Characterization 06-046 December 8, 2006

Characterization of Meteorology and Its Relationships to Fine Particulate Mass and Visibility in the VISTAS Region Introduction
about how well selected days or groups of days represent the visibility (and optionally PM2.5) and meteorological characteristics for a selected site or group of sites. The analytical tool also incorporates an episode selection algorithm (a version of the EPISODES program that was first developed for the Southern Appalachian Mountains Initiative (SAMI) by Deuel and Douglas (1998)). In this alternative, episode selection mode, the analytical tool provides lists of days and multi-day periods that best achieve episode selection criteria that are defined based on user-specified input parameters (for example, specific sites or groups of sites, a maximum number of days, years or periods from which to select days, options for defining key conditions, relative importance of selecting sequential days versus minimizing the error in representing the metrics). In both modes, the ability of the user- or algorithm-selected days to represent key VISTAS regional haze metrics is calculated and presented as an error.
The CART results were also used in the calculation of weighting factors that have enabled VISTAS to make optimum use of the modeled days in representing the best and worst visibility days and annual PM2.5 metrics based on the frequency of occurrence of meteorological conditions.
The CART-based episode selection and analysis methodology was previously applied for the SAMI modeling study for the integrated selection of representative episode periods for atmospheric modeling of ozone, particulates, and acid deposition (Deuel and Douglas, 1998). Recent efforts that focus on identifying and understanding the relationships between fine particulates and meteorology include the analysis of high-resolution, speciated PM2.5 data collected as part of SEARCH monitoring program (Douglas et al., 2003) and the development of PM2.5 forecasting tools for urban areas within the Mid-Atlantic region (Douglas et al., 2004).
Various researchers have employed other statistical techniques in attempting to define the relationships between meteorology and air quality. For example, Cox and Chu (1996) employed regression analysis and Eder et al. (1993) used cluster analysis, which typically relies on principal component analysis, to find similarities in descriptive parameters and then group days with similar conditions. One benefit of CART compared to these techniques is that it allows for the possibility that two days can have similar characteristics but for different reasons (in other words, that there are multiple pathways to that lead to poor visibility or high PM2.5 concentrations).
This project has provided (1) an improved understanding of the relationships between meteorology, visibility, and PM2.5 throughout the VISTAS region, (2) a turn-key analytical tool that can be used to address a variety of questions regarding meteorological characterization and representativeness as well as the selection of new and/or subset episodes, and (3) weighting factors for use in examining the modeling results.
1.4. Report Contents The data that were used in the analysis and the data processing and quality assurance procedures are summarized in Section 2 of this report. The CART analysis methods and results are presented in Section 3. Meteorological representativeness of the full and subset modeling periods is addressed in Section 4. The meteorological characterization tool is also described in this section. Key findings and implications for VISTAS are presented in Section 5. Finally, a comparison of the results for Birmingham, Alabama using two different datasets (STN and SEARCH) is provided in the appendix.
ICF International 1-3 VISTAS Meteorological Characterization 06-046 December 8, 2006

Characterization of Meteorology and Its Relationships to Fine Particulate Mass and Visibility in the VISTAS Region Introduction
This page deliberately left blank.
ICF International 1-4 VISTAS Meteorological Characterization 06-046 December 8, 2006

2. Data Acquisition, Processing, and Quality Assurance In this section of the report, we summarize data that were used in the CART applications for 2000-2004 and in developing the corresponding meteorological characterization tool. The data processing and quality assurance procedures are also described.
2.1. Particulate Matter and Visibility Data Data from the IMPROVE, STN, and SEARCH air quality monitoring network datasets were used to specify daily and speciated PM2.5 mass and to calculate extinction coefficient (visibility).
The data were obtained from the following web sites:
• IMPROVE: http://vista.cira.colostate.edu/views (CIRA, 2005)
• STN: http://www.epa.gov/ttn/airsaqs (EPA, 2005)
• SEARCH: http://www.atmospheric-research.com/public (ARA, 2005)
The VISTAS CART and meteorological classification analyses focused on the IMPROVE and STN data, for selected sites. Under separate funding, we conducted similar work using the SEARCH data/sites and then incorporated this information into the VISTAS meteorological characterization tool and analyses.
2.1.1. Monitoring Sites and Data Availability The IMPROVE sites within the VISTAS region are listed in Table 2-1a, along with their locations and data availability dates for the 2000-2004 period. IMPROVE measurements are taken every three days. Data completeness for the period 2000-2004 is also provided, and this measure of data completeness accounts for measurement frequency. The IMPROVE sites were used for both the visibility and PM2.5 analyses.
Table 2-1a. VISTAS IMPROVE Sites and Summary of Data Availability for the CART Visibility and PM2.5 Analyses.
Site Name State Elevation (m)
Latitude (deg)
Longitude (deg)
First Date with Data after 1999
Last Date with Data (as
of 12/04)
% Complete
(for 1/2000-12/2004)
Cadiz KY 188 36.79 -87.95 3/8/2001 12/31/2004 74 Cape Romain National Wildlife Refuge SC 3 32.94 -79.66 1/1/2000 12/31/2004 98 Chassahowitzka National Wildlife Refuge FL 2 28.75 -82.55 1/1/2000 12/31/2004 60 Cohutta GA 743 34.79 -84.63 6/3/2000 12/31/2004 72 Dolly Sods/Otter Creek Wilderness WV 1158 39.11 -79.43 1/1/2000 12/31/2004 97 Everglades National Park FL 3 25.39 -80.68 6/7/2000 12/31/2004 89 Great Smoky Mountains National Park TN 815 35.63 -83.94 1/1/2000 12/31/2004 99 James River Face VA 299 37.63 -79.51 6/3/2000 12/31/2004 94 Linville Gorge NC 986 35.97 -81.93 4/1/2000 12/31/2004 92 Mammoth Cave National Park KY 248 37.13 -86.15 1/1/2000 12/31/2004 99 Okefenokee National Wildlife Refuge GA 49 30.74 -82.13 1/1/2000 12/31/2004 99 St. Marks FL 2 30.09 -84.16 9/3/2000 12/31/2004 69 Shenandoah National Park VA 1098 38.52 -78.43 1/1/2000 12/31/2004 93 Shining Rock Wilderness NC 1621 35.39 -82.77 1/1/2000 12/31/2004 79 Sipsey Wilderness AL 279 34.34 -87.34 1/1/2000 12/31/2004 88 Swanquarter NC 2 35.45 -76.21 6/10/2000 12/31/2004 62
ICF International 2-1 VISTAS Meteorological Characterization 06-046 December 8, 2006

Characterization of Meteorology and Its Relationships to Fine Particulate Mass and Visibility in the VISTAS Region Data Acquisition, Processing, and Quality Assurance
A total of 15 IMPROVE sites and one CASTNET site (Cadiz) within the VISTAS region were included in the analysis. We will refer to these sites as the VISTAS IMPROVE sites throughout the remainder of this report.
In addition to the IMPROVE sites located within the VISTAS region, we also included five IMPROVE sites that are located in neighboring states. These are listed in Table 2-1b.
Table 2-1b. IMPROVE Sites in Neighboring States and Summary of Data Availability for the VISTAS CART Visibility and PM2.5 Analyses.
Site Name State Elevation (m)
Latitude (deg)
Longitude (deg)
First Date with Data after 1999
Last Date with Data (as
of 12/04) %
Complete
Breton National Wilderness Area LA 2 29.12 -89.21 8/28/2000 12/31/2004 64 Brigantine National Wildlife Refuge NJ 5 39.47 -74.45 1/1/2000 12/31/2004 96 Caney Creek AR 690 34.45 -94.14 6/24/2000 12/31/2004 86 Mingo MO 112 39.97 -90.14 6/3/2000 12/31/2004 38 Upper Buffalo Wilderness AR 723 35.83 -93.20 1/5/2000 12/31/2004 96
The analysis also included 16 STN sites located in urban or rural areas throughout the VISTAS region. FRM-based PM2.5 data are collected on a daily basis for Birmingham, Charlotte, Greenville-Spartanburg, Louisville, Memphis, Nashville, Raleigh, and Richmond and every three days for the remaining sites. Speciated measurements are collected every three days for Birmingham, Charlotte, Memphis, and Richmond sites and every six days for the remaining sites. The 16 sites are listed in Table 2-4. The period of record refers to the speciated data, since most sites have FRM data for the full period. Data completeness designates the completeness of the FRM data, relative to the full period.
Table 2-2. STN Sites and Summary of Data Availability for the CART Visibility and PM2.5 Analyses.
Site Name State Elevation (m)
Latitude (deg)
Longitude (deg)
First Date with STN Data after
1999
Last Date with STN Data (as of 12/04)
% Complete FRM (for 1/2000-12/2004)
Birmingham AL 174 33.55 -86.82 1/13/2001 12/31/2004 97 Charlotte NC 232 35.24 -80.79 1/13/2001 12/31/2004 94 Chattanooga TN 2001 35.05 -85.30 11/27/2001 12/31/2004 100 Greenville-Spartanburg SC 3001 34.90 -82.31 11/21/2001 12/31/2004 96 Hickory NC 333 35.73 -81.37 1/2/2002 12/31/2004 99 Huntington-Ashland WV 200 38.46 -82.64 11/3/2001 12/31/2004 100 Jackson MS 1001 32.10 -90.19 9/22/2001 12/31/2004 95 Kingsport-Bristol TN 4330 36.54 -82.52 12/3/2001 12/31/2004 100 Louisville KY 148 38.24 -85.73 11/9/2001 12/31/2004 98 Macon GA 89 32.78 -83.65 3/3/2002 12/31/2004 90 Memphis TN 701 35.21 -90.03 9/10/2001 12/31/2004 93 Montgomery AL 220 32.41 -86.26 2/7/2002 12/31/2004 100 Nashville TN 160 36.18 -86.74 2/13/2002 12/31/2004 92 Raleigh NC 100 35.86 -78.57 1/2/2002 12/31/2004 95 Richmond VA 59 37.51 -77.50 3/2/2001 12/31/2004 88 Savannah GA 12 32.09 -81.14 3/3/2002 12/31/2004 96 1STN site elevation unavailable; value is approximate based on nearby surface met sites.
ICF International 2-2 VISTAS Meteorological Characterization 06-046 December 8, 2006

Characterization of Meteorology and Its Relationships to Fine Particulate Mass and Visibility in the VISTAS Region Data Acquisition, Processing, and Quality Assurance
These sites were selected based on: 1) 2000-2002 PM2.5 design value at the STN site, 2) proximity of the STN site to a Class I area, 3) location relative to spatial gaps in the IMPROVE and SEARCH monitoring networks, and 4) period of record for speciated data (a monitoring start date of January 2002 or earlier was preferred). In addition, one site in the Birmingham area was specifically selected to accommodate a comparison of results for multiple sites in an urban area and a direct comparison with the results obtained using the SEARCH data.
The SEARCH network consists of eight monitoring sites within the VISTAS region. PM2.5 mass data are collected on a daily basis, and speciated measurements are collected every three days. These sites are listed in Table 2-3.
Table 2-3. SEARCH Sites and Summary of Data Availability for the VISTAS CART Visibility and PM2.5 Analyses.
Site Name State Elevation (m)
Latitude (deg)
Longitude (deg)
First Date with Data after 1999
Last Date with Data (as
of 12/04) %
Complete
Atlanta (Jefferson St.) GA 275 33.78 -84.41 1/1/2000 12/31/2004 99 Yorkville GA 395 33.93 -85.05 1/1/2000 12/31/2004 98 Birmingham AL 200 33.55 -86.82 1/1/2000 12/31/2004 98 Centreville AL 135 32.90 -87.25 1/1/2000 12/31/2004 99 Pensacola FL 27 30.44 -87.26 1/1/2000 12/31/2004 89 Outlying Landing Field (OLF) FL 45 30.55 -87.38 1/1/2000 12/31/2004 98 Gulfport MS 5 30.39 -89.05 1/1/2000 12/31/2004 96 Oak Grove MS 100 30.99 -88.93 1/1/2000 12/31/2004 97
The locations of the IMPROVE, STN, and SEARCH sites are show in Figure 2-1.
Figure 2-1. Locations of the IMPROVE, STN and SEARCH Sites Used for the VISTAS CART Analysis.
ICF International 2-3 VISTAS Meteorological Characterization 06-046 December 8, 2006

Characterization of Meteorology and Its Relationships to Fine Particulate Mass and Visibility in the VISTAS Region Data Acquisition, Processing, and Quality Assurance
Finally, PM2.5 data from FRM and STN sites that were not the focus of the CART analysis were used in addition to data from the selected STN sites and the SEARCH sites to represent potential upwind and/or regional values of the air quality parameters.
2.1.2. Parameters of Interest For the visibility analysis, extinction coefficient is the CART classification variable. The IMPROVE data consist of 24-hour measurements, taken every three days, of the species required for estimating light extinction. The species include ammonium sulfate, ammonium nitrate, organic mass, elemental carbon, soil elements, and coarse mass.
These same species measurements are available from the SEARCH and EPA STN sites, with a couple of exceptions. First, the soil measurement for the SEARCH data is metal oxides. We assumed that this is equivalent to the soil elements measurement from the IMPROVE data. Second, there are no coarse PM measurements for the EPA STN sites and this term was not included in the calculation of extinction coefficient for these sites. For most sites, the contribution from coarse PM is expected to be small. Sea salt may enhance the course PM contribution at coastal sites, but only one of the STN sites included in this analysis is a located in a coastal area.
For the PM2.5 analysis we used 24-hour average PM2.5 concentration as the CART classification variable. For the IMPROVE sites we used reconstructed fine mass which is intended by IMPROVE for direct comparison to the Federal Reference Method (FRM). FRM mass was used for the STN sites and FRM-equivalent mass was used for the SEARCH sites.
2.1.3. Calculation of Extinction Coefficient The EPA protocol for the calculation of extinction coefficient was applied and hourly relative humidity values were used in the calculations.
Specifically, the EPA equation for calculating the chemical extinction coefficient (Bext) from the concentrations of particulate species was used as follows:
Bext = 10 + 3·f(RH)·{[ammonium sulfate] + [ammonium nitrate]}
+ 4·[organic carbonaceous material] +10·[black carbon]
+ 1·[soil] + 0.6·[coarse matter]
where the square brackets represent concentrations in μgm-3 and f(RH) represents the effect of relative humidity on light scattering. The units for Bext are Mm-1.
Hourly relative humidity values were used to determine f(RH). In the EPA methodology, f(RH) consists of a set of monthly-average climatological factors that are unique to each IMPROVE site. For this project, however, we used a site-specific, daily average f(RH) value. For each hour, we determined the value of f(RH) based on measured RH and the values provided in the look up table by EPA (EPA, 2001). We then calculated a daily average f(RH) value, based on the hourly values. The use of hourly RH values means that the best and worst visibility days used in the CART analysis will not necessarily be the same as the best and worst visibility days used in the model-based projections for regional haze. However, use of daily relative humidity data was necessary for the CART analysis since the classification of each day is based on the
ICF International 2-4 VISTAS Meteorological Characterization 06-046 December 8, 2006

Characterization of Meteorology and Its Relationships to Fine Particulate Mass and Visibility in the VISTAS Region Data Acquisition, Processing, and Quality Assurance
relationships between the daily meteorological parameters and visibility (there is no such relationship with monthly relative humidity).
Relative humidity data for the calculation of f(RH) was either for the same site or a nearby meteorological monitoring site. Some of the IMPROVE and STN sites and all of the SEARCH sites have relative humidity data. For sites that lack relative humidity information, we used relative humidity data from the nearest geographically similar site in the calculation of visibility. Geographical similarity was based on elevation, latitude, land-use, and proximity to/location relative to a coastline. The meteorological data and monitoring sites are presented in the next section.
2.1.4. Data Processing and Quality Assurance Procedures The speciated PM data and calculated extinction coefficients were processed for input to CART and stored in both Excel and database management system (DBMS) format.
Our data quality assurance procedures were designed specifically to ensure that the data being input to CART are reasonable and consistent with our intended use of the software.
Some key actions were undertaken to ensure the reliability of the underlying data from the IMPROVE, STN and SEARCH databases:
• For each monitoring site, site-specific files were created from the larger database and the locations for all sites and units for all data elements were confirmed.
• Randomly selected values in the re-formatted, site-specific files were cross-checked against the original data files for accuracy.
• PM2.5 mass and species values and calculated extinction coefficients for each site were extracted and sorted according to magnitude, to check the range of values for reasonableness and the completeness of the dataset (i.e., that missing values were accounted for and properly indicated).
2.2. Meteorological Data The meteorological data used for this analysis consisted of both surface and upper-air data and were obtained from the National Climatic Data Center (NCDC), primarily via the Internet (NCDC, 2005). Surface meteorological data from the IMPROVE, CASTNET, and SEARCH sites were also used, as indicated in the tables that appear later in this section.
Each PM2.5 monitoring site of interest was matched with meteorological data from one or more nearby meteorological monitoring sites. The matching was based on proximity but also considered elevation, latitude, land-use, and location relative to a coastline.
2.2.1. Monitoring Sites and Data Availability The surface meteorological monitoring sites selected for use with the IMPROVE sites are listed in Table 2-4. The location and elevation of both the IMPROVE and surface meteorological sites are also listed. Four of the IMPROVE sites have hourly surface temperature and relative humidity data that were used directly for those sites. These sites are Great Smoky Mountains National Park, Mammoth Cave, Okefenokee, and Shining Rock. These are not specifically listed in Table 2-4. All other surface meteorological parameters for these four sites were obtained from the site matches listed below. The distance between the IMPROVE and surface meteorological monitoring sites is also given in the table and ranges from approximately 0 to 50 km.
ICF International 2-5 VISTAS Meteorological Characterization 06-046 December 8, 2006
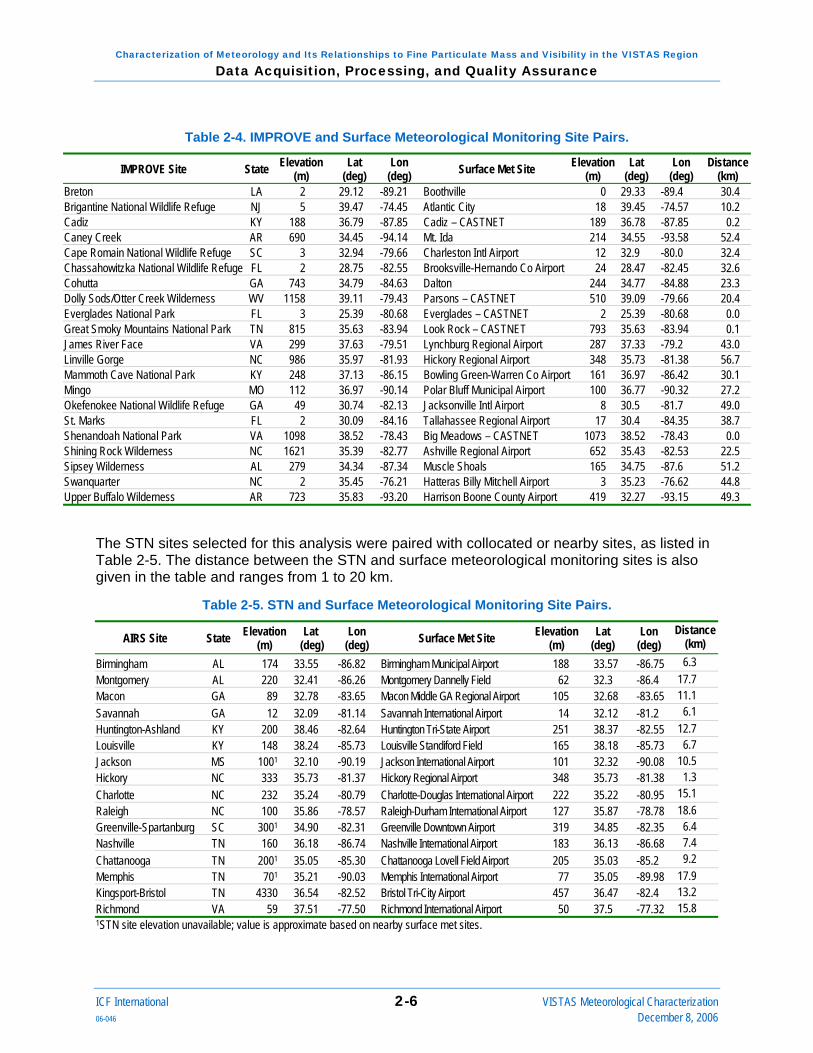
Characterization of Meteorology and Its Relationships to Fine Particulate Mass and Visibility in the VISTAS Region Data Acquisition, Processing, and Quality Assurance
Table 2-4. IMPROVE and Surface Meteorological Monitoring Site Pairs.
IMPROVE Site State Elevation (m)
Lat (deg)
Lon (deg) Surface Met Site Elevation
(m) Lat
(deg) Lon
(deg) Distance
(km) Breton LA 2 29.12 -89.21 Boothville 0 29.33 -89.4 30.4 Brigantine National Wildlife Refuge NJ 5 39.47 -74.45 Atlantic City 18 39.45 -74.57 10.2 Cadiz KY 188 36.79 -87.85 Cadiz – CASTNET 189 36.78 -87.85 0.2 Caney Creek AR 690 34.45 -94.14 Mt. Ida 214 34.55 -93.58 52.4 Cape Romain National Wildlife Refuge SC 3 32.94 -79.66 Charleston Intl Airport 12 32.9 -80.0 32.4 Chassahowitzka National Wildlife Refuge FL 2 28.75 -82.55 Brooksville-Hernando Co Airport 24 28.47 -82.45 32.6 Cohutta GA 743 34.79 -84.63 Dalton 244 34.77 -84.88 23.3 Dolly Sods/Otter Creek Wilderness WV 1158 39.11 -79.43 Parsons – CASTNET 510 39.09 -79.66 20.4 Everglades National Park FL 3 25.39 -80.68 Everglades – CASTNET 2 25.39 -80.68 0.0 Great Smoky Mountains National Park TN 815 35.63 -83.94 Look Rock – CASTNET 793 35.63 -83.94 0.1 James River Face VA 299 37.63 -79.51 Lynchburg Regional Airport 287 37.33 -79.2 43.0 Linville Gorge NC 986 35.97 -81.93 Hickory Regional Airport 348 35.73 -81.38 56.7 Mammoth Cave National Park KY 248 37.13 -86.15 Bowling Green-Warren Co Airport 161 36.97 -86.42 30.1 Mingo MO 112 36.97 -90.14 Polar Bluff Municipal Airport 100 36.77 -90.32 27.2 Okefenokee National Wildlife Refuge GA 49 30.74 -82.13 Jacksonville Intl Airport 8 30.5 -81.7 49.0 St. Marks FL 2 30.09 -84.16 Tallahassee Regional Airport 17 30.4 -84.35 38.7 Shenandoah National Park VA 1098 38.52 -78.43 Big Meadows – CASTNET 1073 38.52 -78.43 0.0 Shining Rock Wilderness NC 1621 35.39 -82.77 Ashville Regional Airport 652 35.43 -82.53 22.5 Sipsey Wilderness AL 279 34.34 -87.34 Muscle Shoals 165 34.75 -87.6 51.2 Swanquarter NC 2 35.45 -76.21 Hatteras Billy Mitchell Airport 3 35.23 -76.62 44.8 Upper Buffalo Wilderness AR 723 35.83 -93.20 Harrison Boone County Airport 419 32.27 -93.15 49.3
The STN sites selected for this analysis were paired with collocated or nearby sites, as listed in Table 2-5. The distance between the STN and surface meteorological monitoring sites is also given in the table and ranges from 1 to 20 km.
Table 2-5. STN and Surface Meteorological Monitoring Site Pairs.
AIRS Site State Elevation (m)
Lat (deg)
Lon (deg) Surface Met Site Elevation
(m) Lat
(deg) Lon
(deg) Distance
(km) Birmingham AL 174 33.55 -86.82 Birmingham Municipal Airport 188 33.57 -86.75 6.3 Montgomery AL 220 32.41 -86.26 Montgomery Dannelly Field 62 32.3 -86.4 17.7 Macon GA 89 32.78 -83.65 Macon Middle GA Regional Airport 105 32.68 -83.65 11.1 Savannah GA 12 32.09 -81.14 Savannah International Airport 14 32.12 -81.2 6.1 Huntington-Ashland KY 200 38.46 -82.64 Huntington Tri-State Airport 251 38.37 -82.55 12.7 Louisville KY 148 38.24 -85.73 Louisville Standiford Field 165 38.18 -85.73 6.7 Jackson MS 1001 32.10 -90.19 Jackson International Airport 101 32.32 -90.08 10.5 Hickory NC 333 35.73 -81.37 Hickory Regional Airport 348 35.73 -81.38 1.3 Charlotte NC 232 35.24 -80.79 Charlotte-Douglas International Airport 222 35.22 -80.95 15.1 Raleigh NC 100 35.86 -78.57 Raleigh-Durham International Airport 127 35.87 -78.78 18.6 Greenville-Spartanburg SC 3001 34.90 -82.31 Greenville Downtown Airport 319 34.85 -82.35 6.4 Nashville TN 160 36.18 -86.74 Nashville International Airport 183 36.13 -86.68 7.4 Chattanooga TN 2001 35.05 -85.30 Chattanooga Lovell Field Airport 205 35.03 -85.2 9.2 Memphis TN 701 35.21 -90.03 Memphis International Airport 77 35.05 -89.98 17.9 Kingsport-Bristol TN 4330 36.54 -82.52 Bristol Tri-City Airport 457 36.47 -82.4 13.2 Richmond VA 59 37.51 -77.50 Richmond International Airport 50 37.5 -77.32 15.8 1STN site elevation unavailable; value is approximate based on nearby surface met sites.
ICF International 2-6 VISTAS Meteorological Characterization 06-046 December 8, 2006

Characterization of Meteorology and Its Relationships to Fine Particulate Mass and Visibility in the VISTAS Region Data Acquisition, Processing, and Quality Assurance
All of the SEARCH sites have a full suite of surface meteorological parameters.
The upper-air meteorological monitoring sites selected for use with the IMPROVE sites are listed in Table 2-6. The location and elevation of both the IMPROVE and upper-air meteorological sites are also listed. In several cases, the nearest upper-air site was not significantly closer or (based on geography) more clearly representative of the areas than other surrounding sites and multiple upper-air sites were used to define the airflow and pressure patterns aloft. The distance between the IMPROVE and upper-air meteorological monitoring sites is also given in the table and ranges from 35 to approximately 380 km.
Table 2-6. IMPROVE and Upper-Air Meteorological Monitoring Site Pairs.
IMPROVE Site State Elevation (m)
Lat (deg)
Lon (deg) Upper-Air Met Site(s) Elevation
(m) Lat
(deg) Lon
(deg) Distance
(km) Breton LA 2 29.12 -89.21 Slidell 8 30.33 -89.82 147.3 Brigantine National Wildlife Refuge NJ 5 39.47 -74.45 Brookhaven, NY 20 40.87 -72.87 206.1 Sterling, VA (Dulles Intl Airport) 85 38.98 -77.47 266.0 Cadiz KY 188 36.79 -87.85 Nashville 180 36.25 -86.57 129.1 Caney Creek AR 690 34.45 -94.14 Little Rock 172 34.83 -92.27 176.5 Cape Romain National Wildlife Refuge SC 3 32.94 -79.66 Charleston 15 32.9 -80.03 35.1 Chassahowitzka National Wildlife Refuge FL 2 28.75 -82.55 Tampa 13 27.7 -82.4 117.7 Cohutta GA 743 34.79 -84.63 Atlanta 246 33.35 -84.56 159.8 Dolly Sods/Otter Creek Wilderness WV 1158 39.11 -79.43 Sterling, VA (Dulles Intl Airport) 85 38.98 -77.47 169.7 Roanoke 648 37.2 -80.41 229.0 Wilmington, OH 317 39.42 -83.82 380.2 Pittsburgh 360 40.53 -80.23 164.8 Everglades National Park FL 3 25.39 -80.68 Miami 4 25.75 -80.38 50.1 Great Smoky Mountains National Park TN 815 35.63 -83.94 Nashville 180 36.25 -86.57 246.6 Greensboro 277 36.08 -79.95 363.5 Atlanta 246 33.35 -84.56 260.4 James River Face VA 299 37.63 -79.51 Roanoke 648 37.2 -80.41 92.5 Sterling, VA (Dulles Intl Airport) 85 38.98 -77.47 233.5 Linville Gorge NC 986 35.97 -81.93 Greensboro 277 36.08 -79.95 178.9 Mammoth Cave National Park KY 248 37.13 -86.15 Nashville 180 36.25 -86.57 105.1 Mingo MO 112 36.97 -90.14 Springfield 394 37.23 -93.4 290.5 Lincoln-Logan County 178 40.15 -89.33 360.8 Nashville 180 36.25 -86.57 329.2 Little Rock 172 34.83 -92.27 305.9 Okefenokee National Wildlife Refuge GA 49 30.74 -82.13 Tallahassee 25 30.38 -84.37 218.6 Jacksonville 10 30.43 -81.7 53.6 St. Marks FL 2 30.09 -84.16 Tallahassee 25 30.38 -84.37 37.8 Shenandoah National Park VA 1098 38.52 -78.43 Sterling, VA (Dulles Intl Airport) 85 38.98 -77.47 98.0 Roanoke 648 37.2 -80.41 227.6 Shining Rock Wilderness NC 1621 35.39 -82.77 Greensboro 277 36.08 -79.95 266.3 Sipsey Wilderness AL 279 34.34 -87.34 Birmingham 178 33.1 -86.7 150.5 Swanquarter NC 2 35.45 -76.21 Morehead City/Newport News 11 34.7 -76.8 99.5 Upper Buffalo Wilderness AR 723 35.83 -93.20 Little Rock 172 34.83 -92.27 139.5
The STN sites selected for this analysis were paired with collocated or nearby sites, as presented in Table 2-7. The distance between the STN and upper-air meteorological monitoring sites is also given in the table and ranges from approximately 10 to 425 km.
ICF International 2-7 VISTAS Meteorological Characterization 06-046 December 8, 2006

Characterization of Meteorology and Its Relationships to Fine Particulate Mass and Visibility in the VISTAS Region Data Acquisition, Processing, and Quality Assurance
Table 2-7. STN and Upper-Air Meteorological Monitoring Site Pairs.
STN Site State Elevation (m)
Lat (deg)
Lon (deg) Upper-Air Met Site Elevation
(m) Lat
(deg) Lon
(deg) Distance
(km) Birmingham AL 174 33.55 -86.82 Birmingham 178 33.1 -86.7 51.5 Montgomery AL 220 32.41 -86.26 Birmingham 178 33.1 -86.7 84.5 Macon GA 89 32.78 -83.65 Atlanta 246 33.35 -84.56 106.2 Savannah GA 12 32.09 -81.14 Atlanta 246 33.35 -84.56 349.1 Charleston 15 32.9 -80.03 137.9 Huntington-Ashland KY 200 38.46 -82.64 Wilmington, OH 317 39.42 -83.82 147.9 Nashville 180 36.25 -86.57 425.8 Roanoke 648 37.2 -80.41 241.0 Louisville KY 148 38.24 -85.73 Wilmington, OH 317 39.42 -83.82 211.4 Nashville 180 36.25 -86.57 233.7 Lincoln-Logan County, IL 178 40.15 -89.33 376.2 Jackson MS 1001 32.301 -90.19 Jackson 91 32.32 -90.07 11.4 Hickory NC 333 35.73 -81.37 Greensboro 277 36.08 -79.95 133.5 Charlotte NC 232 35.24 -80.79 Greensboro 277 36.08 -79.95 120.2 Raleigh NC 100 35.86 -78.57 Greensboro 277 36.08 -79.95 126.4 Greenville-Spartanburg SC 3001 34.90 -82.31 Atlanta 246 33.35 -84.56 269.4 Greensboro 277 36.08 -79.95 251.3 Nashville TN 160 36.18 -86.74 Nashville 180 36.25 -86.57 17.2 Chattanooga TN 2001 35.05 -85.30 Nashville 180 36.25 -86.57 176.3 Atlanta 246 33.35 -84.56 201.0 Memphis TN 701 35.21 -90.03 Nashville 180 36.25 -86.57 333.2 Little Rock 172 34.83 -92.27 208.8 Kingsport-Bristol TN 4330 36.54 -82.52 Nashville 180 36.25 -86.57 364.3 Roanoke 648 37.2 -80.41 201.7 Richmond VA 59 37.51 -77.50 Roanoke 648 37.2 -80.41 259.9 Sterling, VA (Dulles Intl Airport) 85 38.98 -77.47 163.6 1STN site elevation unavailable; value is approximate based on nearby surface met sites.
The SEARCH sites were paired with collocated or nearby sites, as presented in Table 2-8. The distance between the SEARCH and upper-air meteorological monitoring sites is also given in the table and ranges from approximately 50 to 300 km.
Table 2-8. SEARCH and Upper-Air Meteorological Monitoring Site Pairs.
SEARCH Site State Elevation (m)
Lat (deg)
Lon (deg) Upper-Air Met Site Elevation
(m) Lat
(deg) Lon
(deg) Distance
(km) Atlanta (Jefferson St.) GA 275 33.78 -84.41 Atlanta 246 33.35 -84.56 49.4 Yorkville GA 395 33.93 -85.05 Atlanta 246 33.35 -84.56 78.8 Birmingham AL 200 33.55 -86.82 Birmingham 178 33.1 -86.7 51.5 Centreville AL 135 32.90 -87.25 Birmingham 178 33.1 -86.7 55.9 Pensacola FL 27 30.44 -87.26 Tallahassee 25 30.38 -84.37 277.1 Slidell 8 30.33 -89.82 246.5 Birmingham 178 33.1 -86.7 301.0 Outlying Landing Field (OLF) FL 45 30.55 -87.38 Tallahassee 25 30.38 -84.37 289.0 Slidell 8 30.33 -89.82 235.8 Birmingham 178 33.1 -86.7 290.9 Gulfport MS 5 30.39 -89.05 Slidell 8 30.33 -89.82 74.3 Jackson 91 32.32 -90.07 235.6 Oak Grove MS 100 30.99 -88.93 Slidell 8 30.33 -89.82 112.0 Jackson 91 32.32 -90.07 183.6
ICF International 2-8 VISTAS Meteorological Characterization 06-046 December 8, 2006

Characterization of Meteorology and Its Relationships to Fine Particulate Mass and Visibility in the VISTAS Region Data Acquisition, Processing, and Quality Assurance
2.2.2. Parameters of Interest Surface meteorological parameters include hourly values of temperature, relative humidity, wind speed, wind direction, precipitation, and solar radiation.
Upper-air meteorological parameters include twice-daily values of temperature for the 900, 850, and 700 mb levels and dew-point temperature, wind speed, wind direction, and geopotential height for the 850 and 700 mb levels. The levels refer to the altitudes at which the pressure is equal to 900, 850, or 700 mb. Typical altitudes for the 900, 850, and 700 mb pressure levels are 1000, 1500 and 3000 meters.
2.2.3. Data Processing and Quality Assurance Procedures The surface and upper-air meteorological data were processed for input to CART on a site-by-site basis, and stored in both Excel and database management system (DBMS) format.
The following procedures were followed to ensure that the meteorological data were of sufficient quality and prepared correctly for use in CART.
• All source codes used to collect and reprocess data from the original format to that used by CART were specifically reviewed before application to confirm the suitability of the software for the data type/format. Following this review, the data were formatted into site-specific data files and any data-derived quantities for CART were computed.
• The units for all data elements and for all sites were confirmed.
• The range of time over which the data are available and the timestamp for each data element were reviewed.
• For data elements that are used directly by CART, several (at least ten) random dates and times were selected and the values of the meteorological data elements were spot-checked against the original data files.
• For data elements that are computed from the original values, several (at least 10) random dates and times were selected and the values of the derived quantities were checked for reasonableness. The original data were then used to independently calculate the derived quantity for each of the selected dates and times and the values were compared.
• The values of the meteorological parameters for each site were sorted according to magnitude to check that the values were reasonable and the dataset complete.
2.3. Quality Assurance of the Datasets The meteorological data and air quality data were merged into a single, CART-ready data file. Several more checks were performed on this merged file, including:
• The first, last, and several intermediate records in the merged file were checked against their values in the corresponding source data files for consistency.
• The format of the merged file was checked for completeness, with respect to dates and variables. Missing data are indicated by “–999.”
• The merged files were then processed using a DBMS tool, which prepares the input database. The outputs of this tool were checked specifically to see if the ranges, minima,
ICF International 2-9 VISTAS Meteorological Characterization 06-046 December 8, 2006

Characterization of Meteorology and Its Relationships to Fine Particulate Mass and Visibility in the VISTAS Region Data Acquisition, Processing, and Quality Assurance
maxima, and number of observations of each variable were reasonable and preserved from the original fields. In this final file, missing data are indicated by a “.”.
Several fields in this merged database were then spot checked against the original values to ensure consistency throughout the process.
As part of the quality assurance of the data, standard statistical analysis techniques were used to summarize and examine the contents of the CART input dataset with respect to completeness, inter-variable (including geographical and meteorological) correlations, spatial and temporal correlations, and distribution of the various elements by site and by year. The results of this task were then used to guide certain aspects of the CART analysis.
ICF International 2-10 VISTAS Meteorological Characterization 06-046 December 8, 2006
3. Examination of Relationships between Meteorological and Air Quality Data Using Classification and Regression Tree (CART) Analysis
Classification and Regression Tree (CART) analysis was used to classify days within the period 2000-2004 according to their meteorological and air quality characteristics. The CART input data and results were used for a variety of different analyses and as input to the meteorological characterization tool. In particular, CART was used to examine the meteorological influences on visibility and PM2.5 for each IMPROVE, STN, and SEARCH site. The CART analysis and meteorological characterization are described in this section. CART was applied separately for each IMPROVE, STN, and SEARCH site, and for visibility and PM2.5. A comparison of the results for Birmingham using the STN and SEARCH datasets is provided in the appendix.
3.1. Overview of CART The CART analysis software (Brieman et al., 1984; Steinburg and Colla, 1997) is a statistical analysis tool that partitions a dataset into discrete subgroups based on the value of a user-defined classification parameter (e.g., 24-hour average light extinction coefficient or PM2.5 concentration). The remaining parameters in the database are used to segregate the data elements into groups that correspond to different values of the classification parameter. The analysis procedure assumes that there is a causal relationship between the independent input parameters and the classification (or dependent) parameter. Consequently, it is necessary to construct a database of independent parameters such that this relationship can be identified.
For air quality related analyses, the CART technique is used to segregate days with different values of an air quality parameter (the classification parameter) into different groups. The CART technique accomplishes this task through the development of a binary decision tree, comprised of a progression of binary splits on the values of the various independent input parameters. At each split, or node, the days are divided according to the value for one of the independent input parameters, in a way that improves their segregation by the classification parameter. The end of a branch—called a terminal node, or bin—corresponds to a subset of the days with predominantly one value for the classification parameter and characterized by independent input parameter ranges defined along the path to that bin. The tree identifies the conditions associated with each bin, as well as the relative importance of the various air quality and meteorological parameters to the classification. Thus, the CART technique not only segregates the days, but does so in a manner that provides physical insight into the classified days (and, in the case of air quality analysis, information on the meteorological conditions that lead to specific values of the air quality parameters).
Each value of the classification parameter may be represented by more than one bin, allowing for the possibility that different combinations of the independent input parameters can be associated with a single value of the classification parameter. By segregating the data values into the classification bins, CART also provides information regarding the frequency of occurrence of the conditions associated with each classification bin (or group of days). In this manner, the likely recurrence rate for a particular type of day and the associated prevailing conditions are obtained.
In addition to assembling an input dataset consisting of relevant air quality and meteorological parameters, the user must also define the classification categories, specify the “costs” associated with the misclassification of days into bins corresponding to a different category than indicated by the observed data, and select approximate number of bins to be included in the
ICF International 3-1 VISTAS Meteorological Characterization 06-046 December 8, 2006

Characterization of Meteorology and Its Relationships to Fine Particulate Mass and Visibility in the VISTAS Region Examination of Relationships between Meteorological and Air Quality Data Using
Classification and Regression Tree (CART) Analysis
classification tree. Thus, the CART results are influenced by some amount of subjectivity. Details of the CART application for this study are presented in the following sections.
A simple example of a CART classification tree diagram is provided in Figure 3-1. In this example, 365 days are grouped into four classification bins that correspond to different levels of PM2.5 concentrations. The bins are distinguished by three independent input parameters: relative humidity, wind speed, and wind direction. In this example, Bin #3 includes 15 days that are classified as belonging to the highest PM2.5 category (with concentrations greater than or equal to 65 μgm-3). Days with relative humidity values greater than 65 percent and northerly winds are placed in this bin. Bins 1, 2, and 4 are comprised of days with different PM concentrations and different meteorological characteristics.
Figure 3-1. Simple CART Classification Tree Diagram, with Splits on Relative Humidity (RH), Wind Speed (WS), and Wind Direction (WD).
All Days = 365
N = 200 N = 165RH> 65%RH ≤ 65%
WD=NWS ≤ 2 m s-1 WD = E, S, WWS > 2 m s-1
BIN #1CLASS = 3
40.5 ≤ PM < 65.5N = 50
BIN #2CLASS = 1PM < 15.5N = 150
BIN #3CLASS = 4PM ≥ 65.5
N = 15
BIN #4CLASS = 2
15.5 ≤ PM < 40.5N = 150
Note that this is a very simple example of a CART tree. For the VISTAS CART analyses, most trees have approximately 25 to 35 bins and include multiple bins for each classification category.
3.2. CART Application Procedures A first step in the application of CART is the identification of the input parameters. Our list includes available meteorological and air quality parameters that are expected to influence visibility and the formation and distribution of particulates.
3.2.1. Identification of CART Input Parameters In identifying the input parameters for CART, we began with those used for a recent CART-based PM2.5 and visibility analysis using the SEARCH data (Douglas et al., 2003). Additional parameters were added based on data availability at the IMPROVE and STN sites, and input from the VISTAS technical work group.
Surface Meteorological Parameters Surface meteorological parameters are used to characterize the local meteorological conditions. The surface meteorological inputs for CART are listed below.
ICF International 3-2 VISTAS Meteorological Characterization 06-046 December 8, 2006

Characterization of Meteorology and Its Relationships to Fine Particulate Mass and Visibility in the VISTAS Region Examination of Relationships between Meteorological and Air Quality Data Using
Classification and Regression Tree (CART) Analysis
ICF International 3-3 VISTAS Meteorological Characterization 06-046 December 8, 2006
• Temperature
− Maximum temperature (ºC)
− Minimum temperature (ºC)
• Relative Humidity
− 24-hour average relative humidity (%)
• Wind
− 24-hour average wind direction bin; value of 1 through 5, indicating the wind direction corresponding to the 24-hour vector average wind direction: (in degrees) [315, 45), [45, 135), [135, 225), [225, 315), or calm, respectively
− 24-hour vector wind speed (ms-1)
− Persistence or gulf/sea breeze index (vector wind speed/scalar wind speed). This is an indicator of wind persistence. If the value is 1, this indicates that the vector and scalar wind speeds were the same, which further indicates that the wind was blowing from the same direction during the entire period. A value of 0 indicates that the wind direction was from one direction for half the time and from the opposite direction the other half of the time. Thus a low value indicates the potential for recirculation.
• Radiation
− Solar radiation at noon (limited availability) (Wm-2)
• Precipitation
− 24-hour total precipitation (in)
− Number of hours of measurable precipitation
Upper-Air Meteorological Parameters Surface meteorological parameters are used to characterize the regional-scale meteorological conditions. The upper-air parameters are as follows:
• Temperature – 900 mb
900 mb—surface temperature gradient, defined here as the difference between the temperature at 900 mb and the surface using the morning temperature sounding data (ºC)
– 850 mb Upper-air 850 mb temperature corresponding to the morning sounding on the current
day (ºC) Upper-air 850 mb temperature corresponding to the evening sounding on the current
day (ºC)
• Wind – 850 mb and 700 mb

Characterization of Meteorology and Its Relationships to Fine Particulate Mass and Visibility in the VISTAS Region Examination of Relationships between Meteorological and Air Quality Data Using
Classification and Regression Tree (CART) Analysis
ICF International 3-4 VISTAS Meteorological Characterization 06-046 December 8, 2006
The following two upper-air wind variables were computed using data from yesterday’s evening sounding, and the current day’s morning and evening soundings for 850 mb and from yesterday’s evening sounding for 700 mb for a total of eight input variables for each upper-air monitoring site: Wind speed (ms-1) Wind direction bin; value of 1 through 5, indicating the wind direction: (in degrees) [315,
45), [45, 135), [135, 225), [225, 315), or calm, respectively
• Recirculation – 850 mb
Recirculation index (value of 0 or 1) that is based on the difference between the wind direction yesterday and today and/or scalar wind speed. If the difference is +/- 15 degrees of 180 degrees or if average scalar wind speed is < 3 ms-1 then the index is set to 1. Otherwise the value is 0.
• Geopotential Height – 700 mb
Difference in the daily average geopotential height above sea level of the 700 mb surface (m) using height today minus height yesterday. Note that geopotential height differs from height above mean sea level in that it accounts for the variation of the effects of gravity with altitude and latitude.
• Clouds – 850 mb/700 mb
The cloud indicator variable combines data from both 850 and 700 mb and was computed using data from the morning and evening soundings. Cloud index. Value based on relative humidity at the 850 mb (rh850) and 700 mb
(rh700) levels. Ranges from 1 to 3 are based on the empirical analysis of observed data and are defined as follows: If (rh850 < 80% and rh700 < 65%) then cloud = 1; if (rh850 >= 80% and rh700 < 65%) then cloud = 2; if (rh850 < 80% and rh700 >= 65%) then cloud = 2; if (rh850 >= 80% and rh700 >= 65%) then cloud = 3
Air Quality Parameters In addition to the meteorological input parameters, several air quality parameters representing PM2.5 concentrations for prior days as well as for the region were also used in the CART analysis.
• Extinction Coefficient Extinction Coefficient—Classification parameter for the application of CART for visibility. Assigned a value of 1 through 5, such that each value corresponds to a different range of extinction coefficient. These correspond to the ranges defined by the 20, 50, 80, and 95 percentile values of calculated extinction coefficient for each site.

Characterization of Meteorology and Its Relationships to Fine Particulate Mass and Visibility in the VISTAS Region Examination of Relationships between Meteorological and Air Quality Data Using
Classification and Regression Tree (CART) Analysis
ICF International 3-5 VISTAS Meteorological Characterization 06-046 December 8, 2006
• PM2.5 24-hour average PM2.5—Classification parameter for the application of CART for PM2.5. Assigned a value of 1 through 4, such that each value corresponds to a different range of PM2.5 concentration. These correspond to the ranges defined by the 70, 90, and 97 percentile values of the PM2.5 concentrations for each site (μgm-3). The ranges were based on CART performance for previous applications and are somewhat subjective.
• Regional PM2.5 Indicator Variables Prior-day 24-hour average PM2.5 concentration for one or more nearby and thus potentially upwind sites (μgm-3). The specific sites and number of potential upwind sites is different for each IMPROVE, STN, and SEARCH site.
The input parameter lists were refined several times during the course of the CART application. The refinements were primarily guided by the CART results and were applied consistently for all of the sites of interest. The list above represents the final list of parameters.
3.2.2. Display and Analysis of the CART Input Data To enable the examination of the variations in the input parameters across classification categories, the average value of all input parameters was calculated for each classification category, for each site. The averages were summarized in tabular format and plots of selected parameters were also prepared. The tables are provided later in this section of the report; additional plots are available in electronic format.
3.2.3. CART Application Procedures CART was applied separately for visibility and PM2.5. For visibility, we used extinction coefficient (as described in Section 2) as the characteristic parameter. The bin structure for each site was defined by the 20, 50, 80, and 95 percentile values of the extinction coefficient, resulting in five classification categories. This distribution was adopted, in part, to allow the 20 percent best and worst visibility days to be easily represented by the categories. Category 1 bins contain the 20 percent best visibility days and Category 4 and 5 bins (combined) contain the 20 percent worst visibility days. For PM2.5, we used PM2.5 mass as the characteristic variable and the bins were assigned a value of 1 through 4, such that each value corresponds to a different range of PM2.5 concentration. These were defined by the 70, 90, and 97 percentile values of the PM2.5 concentrations for each site (μgm-3).
For this application, we assigned the misclassification costs so that misclassification by two categories was twice as costly as misclassification by one category (the costs are applied on a relative basis). Misclassification can occur due to a number of reasons including: monitoring network limitations (the highest PM concentration in an area may not be observed), use of discrete classification categories (days with PM values near the category boundaries may be misplaced into a lower or higher category, but in this case the concentration difference is only slight), the complexity of the inter-variable relationships, the completeness of the dataset with respect to defining these relationships, and data errors or missing data. The misclassification costs are used in optimizing the trees, considering both classification accuracy and the number of terminal bins.

Characterization of Meteorology and Its Relationships to Fine Particulate Mass and Visibility in the VISTAS Region Examination of Relationships between Meteorological and Air Quality Data Using
Classification and Regression Tree (CART) Analysis
ICF International 3-6 VISTAS Meteorological Characterization 06-046 December 8, 2006
CART was applied separately for each site using the period of record and temporal resolution appropriate to that site. The application of CART for each site included several applications of CART with varying inputs, in order to accommodate some refinement of the input variables. Specifically, sensitivity tests examined: 1) use of only meteorological input parameters versus both meteorological and air quality parameters, 2) alternative category definitions, 3) various alternative representations of the potential upwind/regional PM2.5 concentrations (including one-day ago and two-days ago concentrations, day-to-day differences, and several other variations), 4) average upper-air parameters (where the averages were taken over multiple upper-air sites, 5) different forms of the recirculation parameters, 6) potential problems with the use of certain of the upper-air meteorological parameters for high elevation sites, and 7) alternate forms for the relative humidity parameter (for visibility only).
Key findings from the sensitivity testing include:
• While most of the days can be classified based on meteorological data only, use of prior-day PM2.5 data from nearby and potentially upwind sites in addition to the meteorological data improves the classification accuracy for both regional haze and PM2.5 (by up to 10 percentage points for some sites).
• The categories defined by the 20, 50, 80, and 95 percentile values of extinction coefficient work as well as or better than other alternatives.
• For areas with multiple nearby upper-air sites, average temperature and moisture parameters and separate wind parameters give the best results.
• Relative humidity is needed for good classification and daily average relative humidity is the most effective form of the parameter.
Following each application, the results were assessed using statistical measures of the goodness of the classification, and then checked for physical reasonableness, as follows:
• The list of input parameters was checked for completeness.
• The CART input parameters were checked to ensure that they were specified reasonably (per the CART user’s guide) and as intended.
• The values used to determine the branching of the CART output classification trees were checked to ensure that the values are reasonable and consistent with the input data.
• A matrix representing the statistical goodness of the classification (for the historical days) is created by CART, and the elements of this matrix were examined to ensure a minimum number of misclassifications.
• All splits in the decision tree were checked to ensure that the parameters and values used to develop the classification tree are physically meaningful (i.e., consistent with basic conceptual models of regional haze and PM2.5 formation and transport).
• Splits in the decision tree were checked to ensure that CART made decisions (segregating the days) based on values of the input variables that are distinguishable in the data.
• The overall structure of the classification tree and number of classification bins were checked to ensure that the pathways to the different classification bins are distinct and that the bins provide a reasonable segregation of the days based on the daily extinction coefficient values.

Characterization of Meteorology and Its Relationships to Fine Particulate Mass and Visibility in the VISTAS Region Examination of Relationships between Meteorological and Air Quality Data Using
Classification and Regression Tree (CART) Analysis
ICF International 3-7 VISTAS Meteorological Characterization 06-046 December 8, 2006
• Final bins in the decision tree were checked for uniqueness, such that different bins represent different meteorological characteristics.
One or more bins representing each classification category were selected and the decision pathways leading to those bins were explicitly checked for physically reasonableness.
3.2.4. Display and Analysis of CART Results The CART results were displayed in a variety of ways, both as part of the quality assurance and to aid the analysis of the results by the VISTAS participants.
Tabular summaries of classification accuracy were prepared and classification accuracy by category and overall were calculated. Overall classification accuracy ranged from approximately 75 to 85 percent for visibility and approximately 80 to 95 percent for PM2.5. For any given site, classification accuracy was generally better for PM2.5, compared to visibility.
CART trees with approximately 25-35 bins were selected to optimize classification accuracy and physical reasonableness. The majority of the best and worst visibility days and high PM2.5 days, however, were grouped into one to four key bins.
The relative importance of the various input parameters to the CART classification tree was examined and plotted for each site, and was used to establish similarities among the sites.
To enable the examination of the variations in the input parameters among the classification bins for each site, and thus the differences among the bins, the average value of all input parameters was calculated for each bin. The averages were summarized in tabular format and plots of selected parameters were also prepared.
Plots of the average compositional characteristics of the days within each bin were also prepared and used to examine the differences among the bins, among the categories and within each category.
3.3. CART Classification Results Throughout the discussion of the results, the term “classification accuracy” refers to the percentage of days that were assigned to the correct classes (that is, correctly placed into bins with ranges corresponding to their observed values).
3.3.1. Visibility The classification parameter for visibility is extinction coefficient.
CART was first applied for each site for visibility using only meteorological inputs. The air quality related parameters were omitted from the input datasets, CART was run using only the meteorological inputs, and classification accuracy was assessed for each site. For the IMPROVE sites, approximately 65 to 85 percent of the days were assigned to the correct visibility classes. For the SEARCH sites, the percentages are lower, approximately 60 to 70 percent (primarily due to the greater number of data points).
Next, input parameters accounting for PM2.5 mass on the previous day at potentially upwind urban sites were added to the CART input database. This improved the classification accuracy for visibility for all sites, and by as much as 10 percentage points for some sites. This increase

Characterization of Meteorology and Its Relationships to Fine Particulate Mass and Visibility in the VISTAS Region Examination of Relationships between Meteorological and Air Quality Data Using
Classification and Regression Tree (CART) Analysis
ICF International 3-8 VISTAS Meteorological Characterization 06-046 December 8, 2006
in classification accuracy suggests that transport of fine particles and related precursor species influences visibility at both the IMPROVE and SEARCH sites.
Final classification accuracy is within the range of approximately 74 to 85 percent for the IMPROVE sites and 72 to 83 percent for the SEARCH sites. In calculating classification accuracy, we combine the results for Categories 2 and 3, to emphasize the 20 percent best and worst days. CART classification accuracy for extinction coefficient is summarized in Table 3-1, for the IMPROVE and SEARCH sites.
Table 3-1a. Summary of CART Classification Accuracy for the VISTAS Visibility Analysis: IMPROVE Sites.
Site CART Classification Accuracy (%)
Breton 76.8 Brigantine 76.4 Cadiz 84.5 Caney Creek 79.8 Cape Romain 77.7 Chassahowitzka 80.5 Cohutta 81.2 Dolly Sods 78.0 Everglades 77.8 Great Smoky Mtns 78.4 James River Face 82.7 Linville Gorge 83.4 Mammoth Cave 81.2 Mingo 84.4 Okefenokee 78.4 Shenandoah 83.0 Shining Rock 81.5 Sipsey 80.5 St. Marks 74.4 Swanquarter 79.7 Upper Buffalo 79.9
Table 3-1b. Summary of CART Classification Accuracy for the VISTAS Visibility Analysis: SEARCH Sites.
Site CART Classification Accuracy (%)
Atlanta (Jefferson St.) 71.5 Yorkville 82.6 Birmingham 77.1 Centreville 79.1 Pensacola 79.0 Outer Landing Field 79.7 Gulfport 78.0 Oak Grove 76.3
Misclassification can occur due to a number of reasons including monitoring network limitations, length (completeness) of the analysis period, use of discrete classification categories, and data errors or missing data. Our goal for this study was 70 percent classification accuracy for visibility and
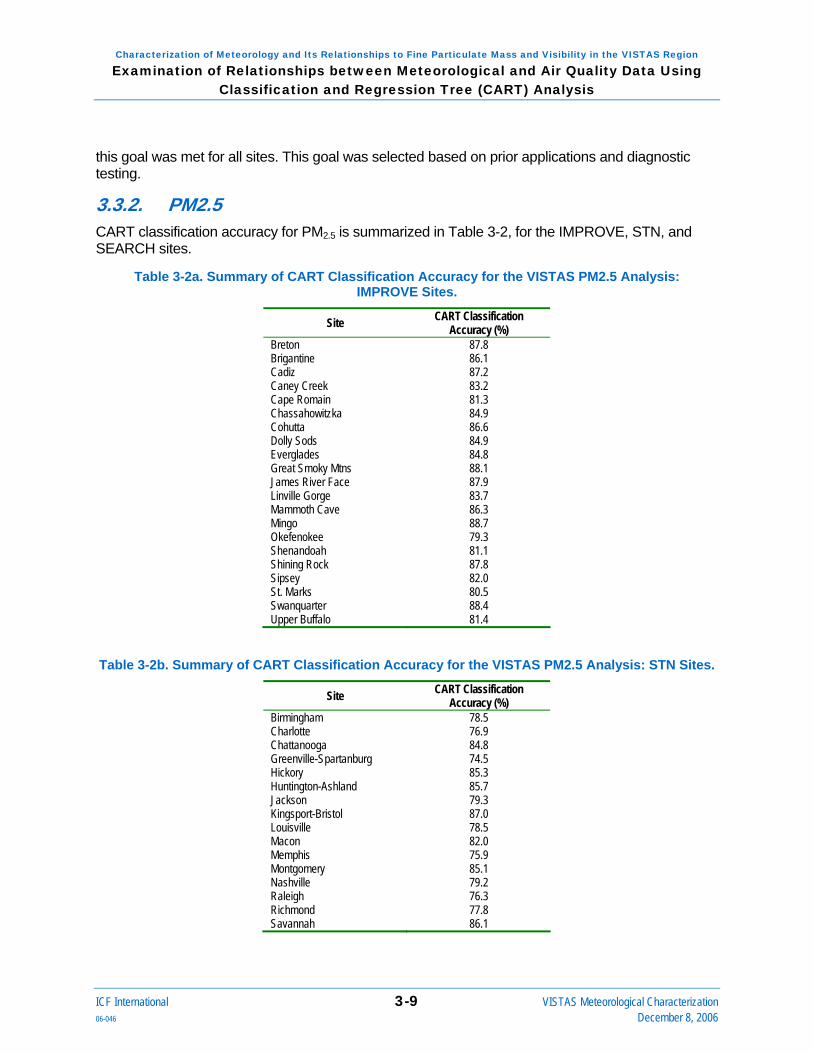
Characterization of Meteorology and Its Relationships to Fine Particulate Mass and Visibility in the VISTAS Region Examination of Relationships between Meteorological and Air Quality Data Using
Classification and Regression Tree (CART) Analysis
ICF International 3-9 VISTAS Meteorological Characterization 06-046 December 8, 2006
this goal was met for all sites. This goal was selected based on prior applications and diagnostic testing.
3.3.2. PM2.5 CART classification accuracy for PM2.5 is summarized in Table 3-2, for the IMPROVE, STN, and SEARCH sites.
Table 3-2a. Summary of CART Classification Accuracy for the VISTAS PM2.5 Analysis: IMPROVE Sites.
Site CART Classification Accuracy (%)
Breton 87.8 Brigantine 86.1 Cadiz 87.2 Caney Creek 83.2 Cape Romain 81.3 Chassahowitzka 84.9 Cohutta 86.6 Dolly Sods 84.9 Everglades 84.8 Great Smoky Mtns 88.1 James River Face 87.9 Linville Gorge 83.7 Mammoth Cave 86.3 Mingo 88.7 Okefenokee 79.3 Shenandoah 81.1 Shining Rock 87.8 Sipsey 82.0 St. Marks 80.5 Swanquarter 88.4 Upper Buffalo 81.4
Table 3-2b. Summary of CART Classification Accuracy for the VISTAS PM2.5 Analysis: STN Sites.
Site CART Classification Accuracy (%)
Birmingham 78.5 Charlotte 76.9 Chattanooga 84.8 Greenville-Spartanburg 74.5 Hickory 85.3 Huntington-Ashland 85.7 Jackson 79.3 Kingsport-Bristol 87.0 Louisville 78.5 Macon 82.0 Memphis 75.9 Montgomery 85.1 Nashville 79.2 Raleigh 76.3 Richmond 77.8 Savannah 86.1

Characterization of Meteorology and Its Relationships to Fine Particulate Mass and Visibility in the VISTAS Region Examination of Relationships between Meteorological and Air Quality Data Using
Classification and Regression Tree (CART) Analysis
ICF International 3-10 VISTAS Meteorological Characterization 06-046 December 8, 2006
Table 3-2c. Summary of CART Classification Accuracy for the VISTAS PM2.5 Analysis: SEARCH Sites.
Site CART Classification Accuracy (%)
Atlanta (Jefferson St.) 71.5 Yorkville 82.6 Birmingham 77.1 Centreville 79.1 Pensacola 79.0 Outer Landing Field 79.7 Gulfport 78.0 Oak Grove 76.3
For PM2.5, classification accuracy ranges from approximately 80 to 90 percent for the IMPROVE sites, from 75 to 87 percent for the STN sites, and from 75 to approximately 80 percent for the SEARCH sites. The greater classification accuracy for PM2.5, compared to extinction coefficient, especially for the IMPROVE sites, indicates that the relationships between the input parameters and the characteristic parameter are better defined for PM2.5 at these sites. This is possibly due to the more complex role of moisture in determining light extinction – affecting both particle formation and the contribution of sulfate and nitrate particle species to light extinction. Sensitivity testing indicates that this increase of approximate 10 percentage points is attributable to the complexities of the extinction coefficient calculation (the IMPROVE equation). When PM2.5 was added to the visibility analysis as an input parameter, classification improved dramatically, but only to about 90 percent, on average. We interpret this to mean that the maximum accuracy for visibility is 90 percent and that a 10 percent error is due to the complex way in which extinction coefficient is related to particulate species concentrations. Note, however, that we do not see this same tendency for the SEARCH sites. For these sites, accuracy is about the same for both PM2.5 and visibility. This could be due to better relatively humidity measurements at the SEARCH sites, which would tend to improve the visibility analysis or more complex particulate chemistry in and nearby the urban areas (where most of the SEARCH sites are located) which would tend to make the PM analysis more challenging. Our goal for this study was 80 percent classification accuracy for PM2.5 and this goal was met or nearly met for most sites. This goal was selected based on prior applications and diagnostic testing.
3.4. Important Classification Parameters Certain of the input parameters are used more frequently in the construction of the classification trees and an analysis of the important parameters provides some insight into the factors that influence air quality, and how these differ for visibility and PM2.5 and among the monitoring sites.
3.4.1. Summary of Important Parameters Here we summarize the relative importance of each input parameter to the classification for visibility and PM2.5, and for specific site groupings. Parameter importance is calculated by CART based on the number of times each parameter is used, either as a split parameter or as a surrogate parameter, to construct the final classification tree. Split parameters are those that explicitly define the branches of the CART tree, and thus separate the days. Surrogate parameters represent the next best splits, and are used in the case of missing data. For example, temperature might be a surrogate for solar radiation since the two parameters tend to be well
Characterization of Meteorology and Its Relationships to Fine Particulate Mass and Visibility in the VISTAS Region Examination of Relationships between Meteorological and Air Quality Data Using
Classification and Regression Tree (CART) Analysis
ICF International 3-11 VISTAS Meteorological Characterization 06-046 December 8, 2006
correlated, and the 850 mb temperature might be a surrogate for the 900 mb to surface temperature difference since both are indicators of stability. Several surrogates are identified for each split.
Parameter importance is assigned a value ranging from 0 to 100, based on the use of the parameter in defining the CART tree. Specifically, the importance indicates the improvement in classification accuracy that results from using the best split parameter compared to the best surrogate split parameter. The importance values are normalized such that the most important parameter has a value of 100. The values are only meaningful in a relative sense and within the context of the CART analysis. We use parameter importance in this analysis to identify those parameters that are statistically relevant to the classification and assume that these same parameters are also physically relevant to visibility and particulate matter concentrations. That is, we assume that the parameters that are most important in determining the structure of the CART tree are also most important in determining air quality.
Visibility Considering visibility for all IMPROVE sites, the most important parameters include: relative humidity, prior day PM2.5 concentrations at potentially upwind monitoring sites, 850 mb temperature, surface temperature (reflecting seasonal differences), and wind speed (both near the surface and aloft). Of secondary importance are surface pressure, boundary layer stability, wind direction, precipitation, and cloud cover.
We also grouped the sites according to geography as inland, coastal, and mountain and examined the relative importance of the CART parameters for each grouping. For this analysis, the inland sites include (in alphabetical order): Cadiz, Caney Creek, Mammoth Cave, Mingo, Sipsey, and Upper Buffalo. The coastal sites are: Breton, Brigantine, Chassahowitzka, Cape Romain, Everglades, Okefenokee, St. Mark’s, and Swanquarter. The mountain sites are Cohutta, Dolly Sods, Great Smoky Mountains, James River, Linville Gorge, Shenandoah, and Shining Rock.
For both the inland and coastal sites the most important parameters for the classification of days for visibility are: prior day PM2.5 concentrations at potentially upwind monitoring sites, relative humidity, 850 mb temperature, surface temperature, and wind speed (both near the surface and aloft).
For the mountain sites, temperature both near the surface and aloft are the two most important parameters, emphasizing that visibility varies by season. These are followed in importance by relative humidity, wind speed (near the surface and aloft), and prior day PM2.5 concentration. Thus, the important parameters are the same, but their relative importance varies among the three groups. These are displayed in Figure 3-2. Note that in each plot, the prior-day PM2.5 concentrations and upper-air parameter importance values may be an average over multiple sites, although each may be represented separately in the CART analysis. This average value is then averaged over all sites in the grouping. In this and subsequent plots of parameter importance, blue is used for air quality parameters, red (maroon) is used for surface meteorological parameters, and yellow is used for upper-air parameters.

Characterization of Meteorology and Its Relationships to Fine Particulate Mass and Visibility in the VISTAS Region Examination of Relationships between Meteorological and Air Quality Data Using
Classification and Regression Tree (CART) Analysis
ICF International 3-12 VISTAS Meteorological Characterization 06-046 December 8, 2006
Figure 3-2a. Average Parameter Importance for the CART Visibility Analysis: IMPROVE Sites.
Figure 3-2b. Average Parameter Importance for the CART Visibility Analysis: Inland IMPROVE Sites.

Characterization of Meteorology and Its Relationships to Fine Particulate Mass and Visibility in the VISTAS Region Examination of Relationships between Meteorological and Air Quality Data Using
Classification and Regression Tree (CART) Analysis
ICF International 3-13 VISTAS Meteorological Characterization 06-046 December 8, 2006
Figure 3-2c. Average Parameter Importance for the CART Visibility Analysis: Coastal IMPROVE Sites.
Figure 3-2d. Average Parameter Importance for the CART Visibility Analysis: Mountain IMPROVE Sites.

Characterization of Meteorology and Its Relationships to Fine Particulate Mass and Visibility in the VISTAS Region Examination of Relationships between Meteorological and Air Quality Data Using
Classification and Regression Tree (CART) Analysis
ICF International 3-14 VISTAS Meteorological Characterization 06-046 December 8, 2006
PM2.5 For PM2.5, we consider the IMPROVE, STN, and SEARCH sites separately.
IMPROVE The most important parameters in the PM2.5 analysis for the IMPROVE sites include: prior day PM2.5 concentrations at potentially upwind monitoring sites, surface temperature, 850 mb temperature, prior day wind speed aloft, relative humidity, surface pressure, and wind speed (both near the surface and aloft). A key difference when compared to visibility is that relative humidity is less important, but the list of important parameters is similar.
Using the geographical groupings defined above, we looked for differences in parameter importance among the different subsets of the IMPROVE sites. These are displayed in Figure 3-3.
Figure 3-3a. Average Parameter Importance for the CART PM2.5 Analysis: IMPROVE Sites.

Characterization of Meteorology and Its Relationships to Fine Particulate Mass and Visibility in the VISTAS Region Examination of Relationships between Meteorological and Air Quality Data Using
Classification and Regression Tree (CART) Analysis
ICF International 3-15 VISTAS Meteorological Characterization 06-046 December 8, 2006
Figure 3-3b. Average Parameter Importance for the CART PM2.5 Analysis: Inland IMPROVE Sites.
Figure 3-3c. Average Parameter Importance for the CART PM2.5 Analysis: Coastal IMPROVE Sites.

Characterization of Meteorology and Its Relationships to Fine Particulate Mass and Visibility in the VISTAS Region Examination of Relationships between Meteorological and Air Quality Data Using
Classification and Regression Tree (CART) Analysis
ICF International 3-16 VISTAS Meteorological Characterization 06-046 December 8, 2006
Figure 3-3d. Average Parameter Importance for the CART PM2.5 Analysis: Mountain IMPROVE Sites.
One key difference is that relative humidity and persistence (which, for coastal sites, represents a sea or gulf breeze) are more important for the coastal sites, compared to the inland and mountain sites. As for visibility, the temperature parameters are most important for the mountain sites.
STN For the STN sites, the most important parameters include: prior day PM2.5 concentrations at potentially upwind monitoring sites, 850 mb temperature, surface temperature, and wind speed (both near the surface and aloft). Of secondary importance are stability, relative humidity, surface pressure, and wind direction.
Since there are no mountain sites and only one coastal site with this group of sites, we use latitude to divide the STN sites into more northern and more southern sites. The northern site group includes (in alphabetical order): Hickory, Huntington-Ashland, Kingsport-Bristol, Louisville, Nashville, Raleigh, and Richmond. The southern group consists of: Birmingham, Charlotte, Chattanooga, Greenville-Spartanburg, Jackson, Macon, Memphis, Montgomery, and Savannah.
The average variable importance scores for all sites and the two subsets are displayed in Figure 3-4.

Characterization of Meteorology and Its Relationships to Fine Particulate Mass and Visibility in the VISTAS Region Examination of Relationships between Meteorological and Air Quality Data Using
Classification and Regression Tree (CART) Analysis
ICF International 3-17 VISTAS Meteorological Characterization 06-046 December 8, 2006
Figure 3-4a. Average Parameter Importance for the CART PM2.5 Analysis: STN Sites.
Figure 3-4b. Average Parameter Importance for the CART PM2.5 Analysis: More Northern STN Sites.

Characterization of Meteorology and Its Relationships to Fine Particulate Mass and Visibility in the VISTAS Region Examination of Relationships between Meteorological and Air Quality Data Using
Classification and Regression Tree (CART) Analysis
ICF International 3-18 VISTAS Meteorological Characterization 06-046 December 8, 2006
Figure 3-4c. Average Parameter Importance for the CART PM2.5 Analysis: More Southern STN Sites.
One key difference is that wind speed is relatively more important for the more southern sites and temperature is relatively more important for the more northern sites. For both sets of sites, prior day PM2.5 concentrations are important.
SEARCH For the SEARCH sites, on average, the most important parameters include: prior day PM2.5 concentrations at potentially upwind monitoring sites, wind speed (both near the surface and aloft), surface temperature, relative humidity, and 850 mb temperature. Of secondary importance are persistence, stability, precipitation, surface pressure, and wind direction.
The SEARCH sites were divided into inland and coastal subgroups, and then into urban and rural/suburban subgroups. The average variable importance scores for all sites and the four subsets are displayed in Figure 3-5. The inland grouping includes: Atlanta, Yorkville, Birmingham, and Centreville. The coastal group includes Pensacola, Outlying Landing Field, Gulfport, and Oak Grove. The urban group includes: Atlanta, Birmingham, Pensacola, and Gulfport. The rural/suburban group includes: Yorkville, Centreville, Outlying Landing Field, and Oak Grove.

Characterization of Meteorology and Its Relationships to Fine Particulate Mass and Visibility in the VISTAS Region Examination of Relationships between Meteorological and Air Quality Data Using
Classification and Regression Tree (CART) Analysis
ICF International 3-19 VISTAS Meteorological Characterization 06-046 December 8, 2006
Figure 3-5a. Average Parameter Importance for the CART PM2.5 Analysis: SEARCH Sites.
Figure 3-5b. Average Parameter Importance for the CART PM2.5 Analysis: Inland SEARCH Sites.

Characterization of Meteorology and Its Relationships to Fine Particulate Mass and Visibility in the VISTAS Region Examination of Relationships between Meteorological and Air Quality Data Using
Classification and Regression Tree (CART) Analysis
ICF International 3-20 VISTAS Meteorological Characterization 06-046 December 8, 2006
Figure 3-5c. Average Parameter Importance for the CART PM2.5 Analysis: Coastal SEARCH Sites.
Figure 3-5d. Average Parameter Importance for the CART PM2.5 Analysis: Urban SEARCH Sites.

Characterization of Meteorology and Its Relationships to Fine Particulate Mass and Visibility in the VISTAS Region Examination of Relationships between Meteorological and Air Quality Data Using
Classification and Regression Tree (CART) Analysis
Figure 3-5e. Average Parameter Importance for the CART PM2.5 Analysis: Rural/Suburban SEARCH Sites.
ICF International 3-21 VISTAS Meteorological Characterization 06-046 December 8, 2006
Comparing the inland and coastal sites, the classification for both groups depends most heavily on the prior day PM2.5 concentrations. For the inland sites, wind speed and temperature parameters are next most important, while for the coastal sites, relative humidity, wind speed, and persistence are among the next most important parameters. The more even values for the coastal sites suggest that a combination of parameters is used in the CART trees. It is possible that the required use of multiple upper-air sites to represent the upper-air parameters also contributed to the lower and more equal values for these parameters (through averaging across multiple sites).
Comparing the urban and rural/suburban sites, wind speed seems to be somewhat more important for the urban sites than for the rural/suburban sites.
3.4.2. CART-Based Site Groupings The CART-derived parameter importance rankings and values were also used to examine potential site groupings. We assume here that similarities in the important parameters between or among sites indicate similarities in the mechanisms influencing air quality at these sites. Consequently, grouping the sites may provide the basis for assessing model performance or the effectiveness of air quality measures when the drivers of air quality (and thus the mechanisms resulting in poor air quality) are different.
In order to quantify the differences in parameter importance among the sites, we calculated a Euclidean distance for each site pair. The Euclidean distance is defined as follows:
2,2,1 )()2,1( isite
iisitesitesiteeanDistEuclid Χ−Χ= ∑
{Xsite1,i} - Parameter importance score for parameter i for site 1
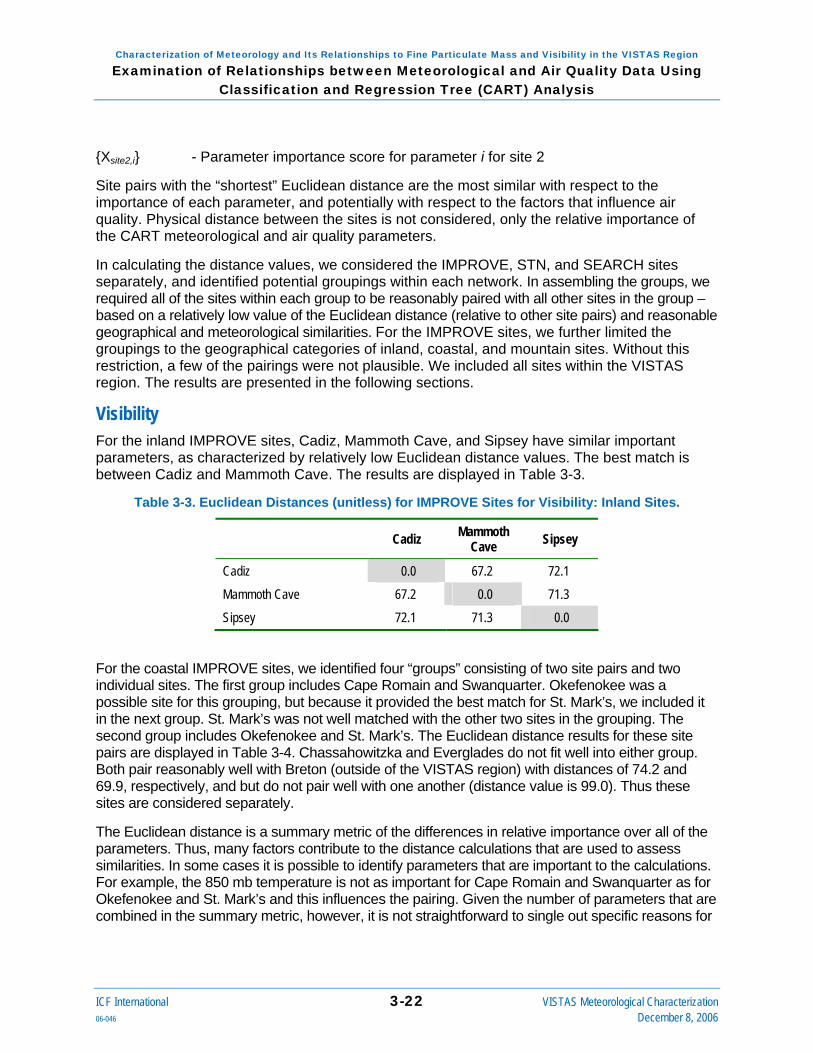
Characterization of Meteorology and Its Relationships to Fine Particulate Mass and Visibility in the VISTAS Region Examination of Relationships between Meteorological and Air Quality Data Using
Classification and Regression Tree (CART) Analysis
ICF International 3-22 VISTAS Meteorological Characterization 06-046 December 8, 2006
{Xsite2,i} - Parameter importance score for parameter i for site 2
Site pairs with the “shortest” Euclidean distance are the most similar with respect to the importance of each parameter, and potentially with respect to the factors that influence air quality. Physical distance between the sites is not considered, only the relative importance of the CART meteorological and air quality parameters.
In calculating the distance values, we considered the IMPROVE, STN, and SEARCH sites separately, and identified potential groupings within each network. In assembling the groups, we required all of the sites within each group to be reasonably paired with all other sites in the group – based on a relatively low value of the Euclidean distance (relative to other site pairs) and reasonable geographical and meteorological similarities. For the IMPROVE sites, we further limited the groupings to the geographical categories of inland, coastal, and mountain sites. Without this restriction, a few of the pairings were not plausible. We included all sites within the VISTAS region. The results are presented in the following sections.
Visibility For the inland IMPROVE sites, Cadiz, Mammoth Cave, and Sipsey have similar important parameters, as characterized by relatively low Euclidean distance values. The best match is between Cadiz and Mammoth Cave. The results are displayed in Table 3-3.
Table 3-3. Euclidean Distances (unitless) for IMPROVE Sites for Visibility: Inland Sites.
Cadiz Mammoth Cave Sipsey
Cadiz 0.0 67.2 72.1
Mammoth Cave 67.2 0.0 71.3
Sipsey 72.1 71.3 0.0
For the coastal IMPROVE sites, we identified four “groups” consisting of two site pairs and two individual sites. The first group includes Cape Romain and Swanquarter. Okefenokee was a possible site for this grouping, but because it provided the best match for St. Mark’s, we included it in the next group. St. Mark’s was not well matched with the other two sites in the grouping. The second group includes Okefenokee and St. Mark’s. The Euclidean distance results for these site pairs are displayed in Table 3-4. Chassahowitzka and Everglades do not fit well into either group. Both pair reasonably well with Breton (outside of the VISTAS region) with distances of 74.2 and 69.9, respectively, and but do not pair well with one another (distance value is 99.0). Thus these sites are considered separately.
The Euclidean distance is a summary metric of the differences in relative importance over all of the parameters. Thus, many factors contribute to the distance calculations that are used to assess similarities. In some cases it is possible to identify parameters that are important to the calculations. For example, the 850 mb temperature is not as important for Cape Romain and Swanquarter as for Okefenokee and St. Mark’s and this influences the pairing. Given the number of parameters that are combined in the summary metric, however, it is not straightforward to single out specific reasons for

Characterization of Meteorology and Its Relationships to Fine Particulate Mass and Visibility in the VISTAS Region Examination of Relationships between Meteorological and Air Quality Data Using
Classification and Regression Tree (CART) Analysis
ICF International 3-23 VISTAS Meteorological Characterization 06-046 December 8, 2006
the differences and the pairings. The Euclidean is intended to provide a mathematical basis for the parings and we applied some judgment in the use of this information to select the groups.
Table 3-4a. Euclidean Distances (unitless) for IMPROVE Sites for Visibility: Coastal Sites (Group 1).
Cape Romain Swanquarter
Cape Romain 0.0 61.8 Swanquarter 61.8 0.0
Table 3-4b. Euclidean Distances (unitless) for IMPROVE Sites for Visibility: Coastal Sites (Group 2).
Okefenokee St. Marks
Okefenokee 0.0 74.1
St. Mark’s 74.1 0.0
For the mountain IMPROVE sites, we identified two groups. The first group includes Great Smoky Mountains (GSM), James River Face, Linville Gorge, and Shenandoah. The second group includes Cohutta, Dolly Sods, and Shining Rock. The Euclidean distance results for these site pairs are displayed in Table 3-5. The groups do not reflect proximity and are guided by the CART results that local meteorological conditions (for example, relative humidity) are more important in determining visibility at the Group 1 sites than the Group 2 sites.
Table 3-5a. Euclidean Distances (unitless) for IMPROVE Sites for Visibility: Mountain Sites (Group 1).
GSM James River
Linville Gorge Shenandoah
GSM 0.0 60.8 38.7 51.5 James River 60.8 0.0 56.8 77.7
Linville Gorge 38.7 56.8 0.0 40.8
Shenandoah 51.5 77.7 40.8 0.0
Table 3-5b. Euclidean Distances (unitless) for IMPROVE Sites for Visibility: Mountain Sites (Group 2)
Cohutta Dolly Sods Shining Rock
Cohutta 0.0 47.4 33.1
Dolly Sods 47.4 0.0 44.6
Shining Rock 33.1 44.6 0.0

Characterization of Meteorology and Its Relationships to Fine Particulate Mass and Visibility in the VISTAS Region Examination of Relationships between Meteorological and Air Quality Data Using
Classification and Regression Tree (CART) Analysis
ICF International 3-24 VISTAS Meteorological Characterization 06-046 December 8, 2006
PM2.5 The results for PM2.5 are similar, but there are some differences. For the inland IMPROVE sites, Cadiz, Mammoth Cave, and Sipsey have similar important parameters, as characterized by relatively low Euclidean distance values. As for visibility, the best match is between Cadiz and Mammoth Cave. The results are displayed in Table 3-6.
Table 3-6. Euclidean Distances (unitless) for IMPROVE Sites for PM2.5: Inland Sites.
Cadiz Mammoth Cave Sipsey
Cadiz 0.0 38.7 43.9
Mammoth Cave 38.7 0.0 44.5
Sipsey 43.9 44.5 0.0
For the coastal IMPROVE sites, we identified two groupings. All sites with the exception of Okefenokee showed similar low Euclidean distances. Okefenokee was not a good match to any of the sites. The Euclidean distance results for the grouped coastal sites are displayed in Table 3-7. Note that the Everglades site is least well matched with all of the other sites and could be excluded from this grouping. In contrast to the values in this table, the lowest value for Okefenokee is 70.5, when matched with Cape Romain.
Table 3-7. Euclidean Distances (unitless) for IMPROVE Sites for PM2.5: Coastal Sites (Group 1).
Cape Romain Chassahowitzka Everglades St. Mark’s Swanquarter
Cape Romain 0.0 47.9 54.6 50.9 37.1
Chassahowitzka 47.9 0.0 58.5 46.5 39.6
Everglades 54.6 58.5 0.0 54.9 48.8
St. Mark’s 50.9 46.3 54.9 0.0 40.9
Swanquarter 37.1 39.6 48.8 40.9 0.0
For the mountain IMPROVE sites, we identified two groups. The first group includes Cohutta, Great Smoky Mountains (GSM), James River Face, Linville Gorge, and Shining Rock. The second group includes Dolly Sods and Shenandoah. The Euclidean distance results for these site pairs are displayed in Table 3-8. Cohutta and James River Face (the southernmost and northernmost sites in Group 1) are not as well matched as the rest of the sites in the group, but they are both good matches to the remaining sites. Note the very good match between Dolly Sods and Shenandoah (Group 2).
Table 3-8a. Euclidean Distances (unitless) for IMPROVE Sites for PM2.5: Mountain Sites (Group 1).
Cohutta GSM James River Linville Gorge Shining Rock
Cohutta 0.0 45.5 70.2 54.3 53.5
GSM 45.5 0.0 44.9 43.4 55.4
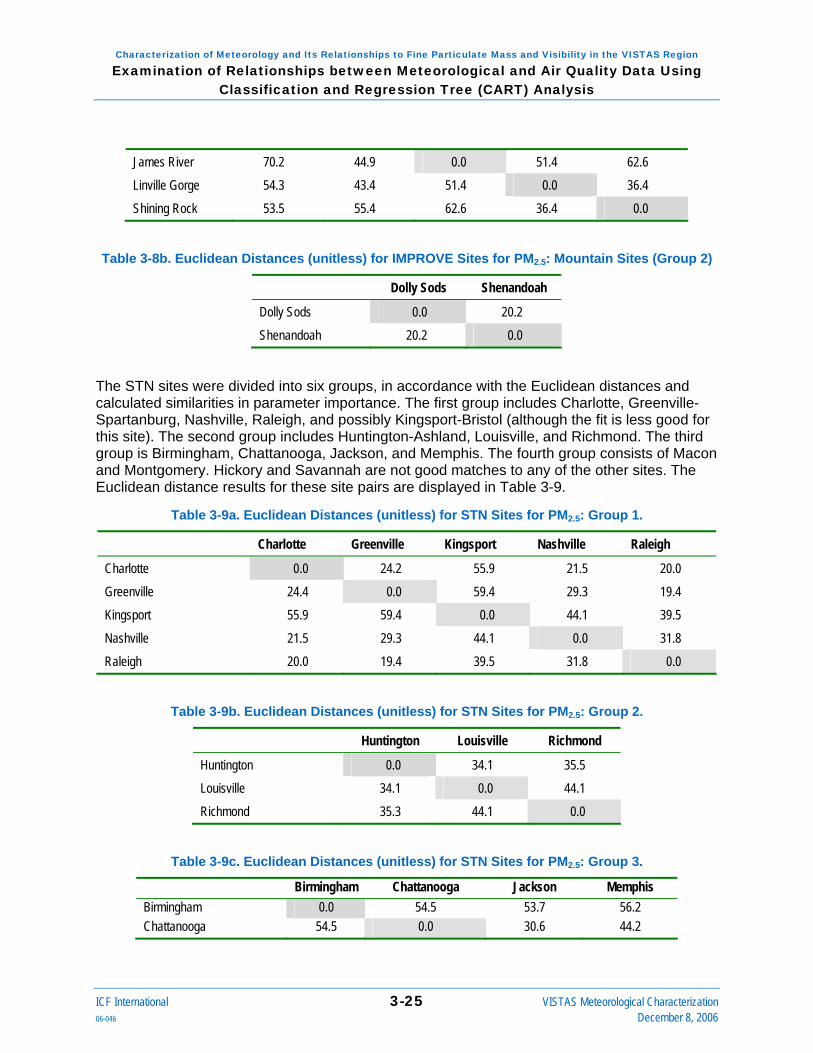
Characterization of Meteorology and Its Relationships to Fine Particulate Mass and Visibility in the VISTAS Region Examination of Relationships between Meteorological and Air Quality Data Using
Classification and Regression Tree (CART) Analysis
ICF International 3-25 VISTAS Meteorological Characterization 06-046 December 8, 2006
James River 70.2 44.9 0.0 51.4 62.6
Linville Gorge 54.3 43.4 51.4 0.0 36.4
Shining Rock 53.5 55.4 62.6 36.4 0.0
Table 3-8b. Euclidean Distances (unitless) for IMPROVE Sites for PM2.5: Mountain Sites (Group 2)
Dolly Sods Shenandoah
Dolly Sods 0.0 20.2
Shenandoah 20.2 0.0
The STN sites were divided into six groups, in accordance with the Euclidean distances and calculated similarities in parameter importance. The first group includes Charlotte, Greenville-Spartanburg, Nashville, Raleigh, and possibly Kingsport-Bristol (although the fit is less good for this site). The second group includes Huntington-Ashland, Louisville, and Richmond. The third group is Birmingham, Chattanooga, Jackson, and Memphis. The fourth group consists of Macon and Montgomery. Hickory and Savannah are not good matches to any of the other sites. The Euclidean distance results for these site pairs are displayed in Table 3-9.
Table 3-9a. Euclidean Distances (unitless) for STN Sites for PM2.5: Group 1.
Charlotte Greenville Kingsport Nashville Raleigh
Charlotte 0.0 24.2 55.9 21.5 20.0
Greenville 24.4 0.0 59.4 29.3 19.4
Kingsport 55.9 59.4 0.0 44.1 39.5
Nashville 21.5 29.3 44.1 0.0 31.8
Raleigh 20.0 19.4 39.5 31.8 0.0
Table 3-9b. Euclidean Distances (unitless) for STN Sites for PM2.5: Group 2.
Huntington Louisville Richmond
Huntington 0.0 34.1 35.5
Louisville 34.1 0.0 44.1
Richmond 35.3 44.1 0.0
Table 3-9c. Euclidean Distances (unitless) for STN Sites for PM2.5: Group 3.
Birmingham Chattanooga Jackson Memphis Birmingham 0.0 54.5 53.7 56.2 Chattanooga 54.5 0.0 30.6 44.2
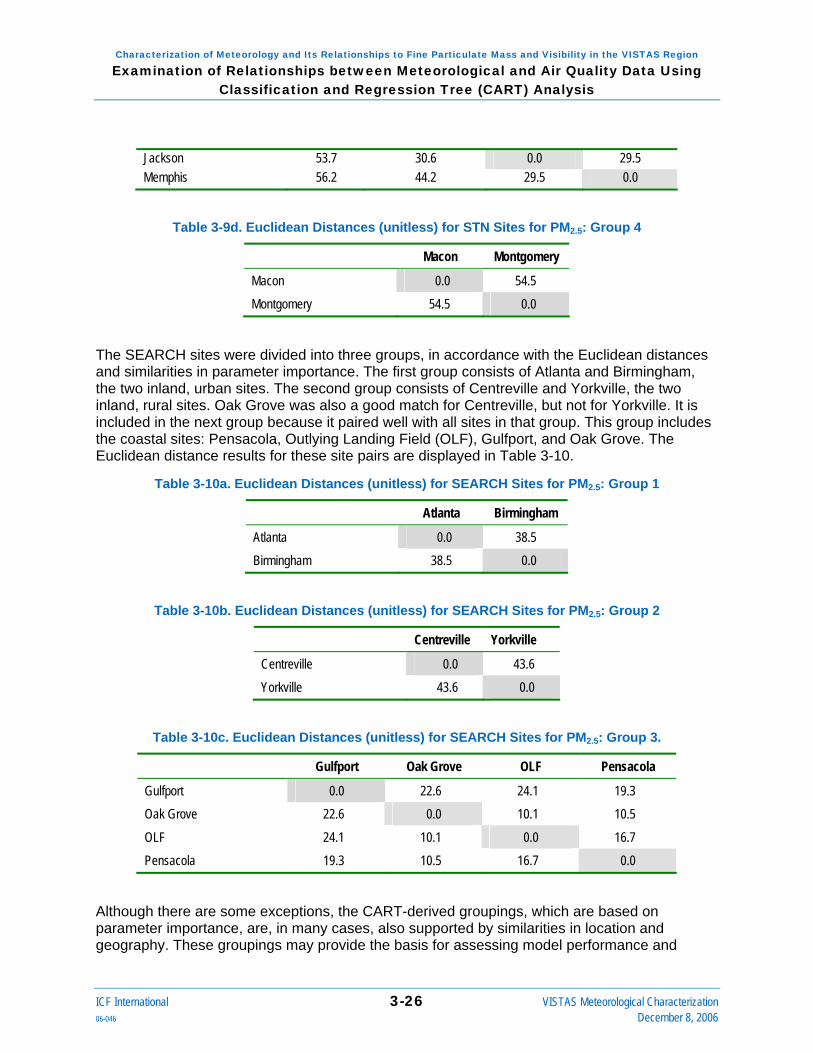
Characterization of Meteorology and Its Relationships to Fine Particulate Mass and Visibility in the VISTAS Region Examination of Relationships between Meteorological and Air Quality Data Using
Classification and Regression Tree (CART) Analysis
ICF International 3-26 VISTAS Meteorological Characterization 06-046 December 8, 2006
Jackson 53.7 30.6 0.0 29.5 Memphis 56.2 44.2 29.5 0.0
Table 3-9d. Euclidean Distances (unitless) for STN Sites for PM2.5: Group 4
Macon Montgomery
Macon 0.0 54.5
Montgomery 54.5 0.0
The SEARCH sites were divided into three groups, in accordance with the Euclidean distances and similarities in parameter importance. The first group consists of Atlanta and Birmingham, the two inland, urban sites. The second group consists of Centreville and Yorkville, the two inland, rural sites. Oak Grove was also a good match for Centreville, but not for Yorkville. It is included in the next group because it paired well with all sites in that group. This group includes the coastal sites: Pensacola, Outlying Landing Field (OLF), Gulfport, and Oak Grove. The Euclidean distance results for these site pairs are displayed in Table 3-10.
Table 3-10a. Euclidean Distances (unitless) for SEARCH Sites for PM2.5: Group 1
Atlanta Birmingham
Atlanta 0.0 38.5
Birmingham 38.5 0.0
Table 3-10b. Euclidean Distances (unitless) for SEARCH Sites for PM2.5: Group 2
Centreville Yorkville
Centreville 0.0 43.6
Yorkville 43.6 0.0
Table 3-10c. Euclidean Distances (unitless) for SEARCH Sites for PM2.5: Group 3.
Gulfport Oak Grove OLF Pensacola
Gulfport 0.0 22.6 24.1 19.3 Oak Grove 22.6 0.0 10.1 10.5
OLF 24.1 10.1 0.0 16.7
Pensacola 19.3 10.5 16.7 0.0
Although there are some exceptions, the CART-derived groupings, which are based on parameter importance, are, in many cases, also supported by similarities in location and geography. These groupings may provide the basis for assessing model performance and

Characterization of Meteorology and Its Relationships to Fine Particulate Mass and Visibility in the VISTAS Region Examination of Relationships between Meteorological and Air Quality Data Using
Classification and Regression Tree (CART) Analysis
ICF International 3-27 VISTAS Meteorological Characterization 06-046 December 8, 2006
understanding the reasons for model performance problems, as well as accounting for differences in the effectiveness of air quality measures across the monitoring sites and regions.
3.5. Meteorological Influences on Visibility and Fine Particles In the previous section, we identified certain parameters that are important to the classification of days with respect to visibility and PM2.5 concentration and concluded that these parameters have the potential to influence air quality at the monitoring sites. However, understanding the causes of poor visibility and high PM2.5 concentrations also requires an understanding of the relationship between the parameters and the air quality metrics, as well as the specific combinations of parameters (conditions) that lead to impaired air quality. In this section, we further explore those relationships using the CART input data and results.
3.5.1. Categorical Comparisons In this section we summarize the variations in the input parameters across classification categories for each site and parameter, first for visibility and then for PM2.5.
Visibility To examine these variations, the average value of each input parameter was calculated for each classification category and for each of the IMPROVE sites. Table 3-11 presents the parameter averages for the five categories of visibility. These are bounded by the 20, 50, 80, and 95 percentile values of extinction coefficient, which vary by site, as indicated at the top of each table. The tables for the IMPROVE sites are in alphabetical order, by site name.

Characterization of Meteorology and Its Relationships to Fine Particulate Mass and Visibility in the VISTAS Region Examination of Relationships between Meteorological and Air Quality Data Using
Classification and Regression Tree (CART) Analysis
ICF International 3-28 VISTAS Meteorological Characterization 06-046 December 8, 2006
Table 3-11a. Summary of Average Input Parameters for Each CART Classification Category: Visibility CART Analysis for the IMPROVE Site Breton.
The ranges in extinction coefficient for Categories 1 through 5 are as follows: <50, 50-70, 70-105, 105-135, and ≥ 135 Mm-1.
Category 1 Category 2 Category 3 Category 4 Category 5 Visibility Parameters Yesterday's FM at New Orleans/Baton Rouge (µg/m3) 10.1 12.4 14.0 18.0 22.1 Yesterday's FM at Gulfport (µg/m3) 7.9 10.2 11.4 15.4 19.3 Yesterday’s FM at Pensacola (µg/m3) 9.4 11.6 13.5 17.5 19.1 Surface Meteorological Parameters Max. surface temperature (°C) 21.8 23.8 24.4 25.7 25.3 Min. surface temperature (°C) 16.0 17.5 18.1 18.9 17.7 Relative humidity (%) 73.7 78.4 83.3 82.9 83.5 Surface wind speed (ms-1) 3.2 3.2 2.9 2.5 1.8 Surface wind direction (degrees) 52 79 119 106 37 Persistence 0.8 0.8 0.8 0.8 0.8 Sea level pressure (mb) 1022 1020 1019 1019 1019 Rainfall (inches) 0.2 0.1 0.2 0.1 0.0 Rain (# periods) 0.7 0.6 0.8 0.6 0.6 Upper-Air Meteorological Parameters Temperature AM 850 mb (°C) 11.5 12.7 13.6 13.9 13.4 Temperature PM 850 mb (°C) 12.3 12.7 13.6 14.1 13.9 Stability at Slidell (°C) 0.8 -0.4 0.1 0.0 0.7 Geopotential height difference 700 mb at Slidell (m) 8.3 0.8 -2.6 -0.5 -6.3 Wind speed yesterday 700 mb at Slidell (ms-1) 11.8 10.6 9.7 7.5 7.0 Wind direction yesterday 700 mb at Slidell (degrees) 283 262 256 289 311 Wind speed yesterday 850 mb at Slidell (ms-1) 8.9 7.7 6.9 6.0 5.7 Wind speed AM 850 mb at Slidell (ms-1) 8.1 8.6 7.8 6.3 5.7 Wind speed PM 850 mb at Slidell (ms-1) 6.4 8.0 7.5 6.4 6.4 Wind direction yesterday 850 mb at Slidell (degrees) 325 245 255 298 323 Wind direction AM 850 mb at Slidell (degrees) 284 233 217 239 243 Wind direction PM 850 mb at Slidell (degrees) 311 284 227 262 14 Recirculation at Slidell 0.05 0.04 0.04 0.11 0.13 Cloud average 1.6 1.7 1.7 1.6 1.6

Characterization of Meteorology and Its Relationships to Fine Particulate Mass and Visibility in the VISTAS Region Examination of Relationships between Meteorological and Air Quality Data Using
Classification and Regression Tree (CART) Analysis
ICF International 3-29 VISTAS Meteorological Characterization 06-046 December 8, 2006
Table 3-11b. Summary of Average Input Parameters for Each CART Classification Category: Visibility CART Analysis for the IMPROVE Site Brigantine.
The ranges in extinction coefficient for Categories 1 through 5 are as follows: <50, 50-80, 80-135, 135-225, and ≥ 225 Mm-1.
Category 1 Category 2 Category 3 Category 4 Category 5 Visibility Parameters Yesterday's FM at Wilmington (µg/m3) 11.2 13.5 17.1 20.1 27.4 Yesterday's FM at New Orleans (µg/m3) 10.3 13.8 17.1 20.3 24.9 Yesterday's FM at Philadelphia (µg/m3) 10.6 12.9 16.8 19.7 26.0 Surface Meteorological Parameters Max. surface temperature (°C) 13.0 15.8 18.0 22.3 22.2 Min. surface temperature (°C) 3.1 5.5 8.0 12.3 13.8 Relative humidity (%) 61.6 71.8 75.5 79.8 85.3 Surface wind speed (ms-1) 4.2 3.3 3.0 2.4 2.2 Surface wind direction (degrees) 306 248 204 212 166 Persistence 0.9 0.8 0.8 0.8 0.8 Sea level pressure (mb) 1023 1022 1020 1019 1018 Rainfall (inches) 0.1 0.1 0.1 0.1 0.1 Rain (# periods) 0.6 0.8 0.8 0.9 1.1 Upper-Air Meteorological Parameters Temperature AM 850 mb (°C) 0.2 4.6 6.6 9.9 11.4 Temperature PM 850 mb (°C) 1.3 4.5 7.1 10.5 11.9 Stability at Brookhaven (°C) -3.4 -0.9 0.2 -0.7 -0.8 Geopotential height difference 700 mb at Brookhaven (m) -2.0 3.0 -5.1 0.3 -9.0 Wind speed yesterday 700 mb at Brookhaven (ms-1) 15.3 15.8 13.2 12.7 11.9 Wind speed yesterday 700 mb at Dulles (ms-1) 16.2 15.2 12.9 11.7 10.0 Wind direction yesterday 700 mb at Brookhaven (degrees) 275 278 274 278 277 Wind direction yesterday 700 mb at Dulles (degrees) 290 274 276 273 270 Wind speed yesterday 850 mb at Brookhaven (ms-1) 12.2 11.5 9.3 9.1 9.0 Wind speed yesterday 850 mb at Dulles (ms-1) 12.6 10.8 9.5 7.6 7.9 Wind speed AM 850 mb at Brookhaven (ms-1) 12.1 11.7 10.4 9.1 8.6 Wind speed AM 850 mb at Dulles (ms-1) 12.8 10.6 10.2 8.7 6.8 Wind speed PM 850 mb at Brookhaven (ms-1) 12.1 11.5 11.1 9.8 8.8 Wind speed PM 850 mb at Dulles (ms-1) 10.5 10.3 10.6 9.2 8.9 Wind direction yesterday 850 mb at Brookhaven (degrees) 312 283 285 268 281 Wind direction yesterday 850 mb at Dulles (degrees) 312 272 260 261 273 Wind direction AM 850 mb at Brookhaven (degrees) 326 287 277 265 280 Wind direction AM 850 mb at Dulles (degrees) 330 290 281 269 279 Wind direction PM 850 mb at Brookhaven (degrees) 324 292 289 273 299 Wind direction PM 850 mb at Dulles (degrees) 303 271 268 278 297 Cloud average 1.8 1.9 2.0 2.0 2.0

Characterization of Meteorology and Its Relationships to Fine Particulate Mass and Visibility in the VISTAS Region Examination of Relationships between Meteorological and Air Quality Data Using
Classification and Regression Tree (CART) Analysis
ICF International 3-30 VISTAS Meteorological Characterization 06-046 December 8, 2006
Table 3-11c. Summary of Average Input Parameters for Each CART Classification Category: Visibility CART Analysis for the IMPROVE Site Cadiz.
The ranges in extinction coefficient for Categories 1 through 5 are as follows: <55, 55-95, 95-155, 155-230, and ≥ 230 Mm-1.
Category 1 Category 2 Category 3 Category 4 Category 5 Visibility Parameters Yesterday's FM at Nashville (µg/m3) 10.0 11.9 16.3 19.6 18.2 Yesterday's FM at St. Louis (µg/m3) 8.9 13.5 16.9 20.8 23.8 Yesterday's FM at Louisville (µg/m3) 10.7 14.4 19.9 22.8 24.8 Surface Meteorological Parameters Max. surface temperature (°C) 13.1 18.7 21.2 22.5 17.0 Min. surface temperature (°C) 3.4 9.8 12.9 14.1 10.1 Relative humidity (%) 57.3 70.0 79.2 84.8 88.5 Surface wind speed (ms-1) 2.6 2.5 2.1 1.6 2.3 Surface wind direction (degrees) 229 188 178 63 0 Persistence 0.8 0.8 0.8 0.8 0.8 Rainfall (inches) 0.0 0.2 0.1 0.2 0.2 Rain (# periods) 0.2 0.6 0.6 0.7 1.0 Solar radiation (W/m2) 600.3 574.2 579.6 501.2 434.4 Upper-Air Meteorological Parameters Temperature AM 850 mb (°C) 2.4 8.6 11.3 12.7 9.2 Temperature PM 850 mb (°C) 3.9 9.4 11.9 13.2 9.0 Stability at Nashville (°C) -0.9 0.2 0.1 -0.2 -0.7 Geopotential height difference 700 mb at Nashville (m) 13.8 3.7 -1.8 -2.7 -9.5 Wind speed yesterday 700 mb at Nashville (ms-1) 18.4 13.1 10.1 8.7 11.9 Wind direction yesterday 700 mb at Nashville (degrees) 279 275 263 270 252 Wind speed yesterday 850 mb at Nashville (ms-1) 12.1 9.1 7.4 6.4 8.5 Wind speed AM 850 mb at Nashville (ms-1) 12.1 11.0 8.2 6.4 7.9 Wind speed PM 850 mb at Nashville (ms-1) 9.3 9.6 8.1 6.2 6.1 Wind direction yesterday 850 mb at Nashville (degrees) 289 267 252 270 281 Wind direction AM 850 mb at Nashville (degrees) 306 271 270 276 243 Wind direction PM 850 mb at Nashville (degrees) 274 258 244 235 225 Recirculation at Nashville 0.0 0.0 0.1 0.1 0.1 Cloud average 1.4 1.8 1.8 1.8 2.1

Characterization of Meteorology and Its Relationships to Fine Particulate Mass and Visibility in the VISTAS Region Examination of Relationships between Meteorological and Air Quality Data Using
Classification and Regression Tree (CART) Analysis
ICF International 3-31 VISTAS Meteorological Characterization 06-046 December 8, 2006
Table 3-11d. Summary of Average Input Parameters for Each CART Classification Category: Visibility CART Analysis for the IMPROVE Site Caney Creek.
The ranges in extinction coefficient for Categories 1 through 5 are as follows: <45, 45-75, 75-115, 115-170, and ≥ 170 Mm-1.
Category 1 Category 2 Category 3 Category 4 Category 5 Visibility Parameters Yesterday's FM at Little Rock (µg/m3) 9.7 12.1 16.0 19.3 22.4 Yesterday's FM at Dallas (µg/m3) 9.8 12.3 15.3 17.7 20.1 Surface Meteorological Parameters Max. surface temperature (°C) 16.5 19.3 25.1 26.7 27.9 Min. surface temperature (°C) 3.3 7.7 12.8 14.5 15.8 Relative humidity (%) 62.8 71.1 72.9 77.1 77.9 Surface wind speed (ms-1) 1.1 1.0 0.9 0.6 0.3 Surface wind direction (degrees) 230 171 139 105 68 Persistence 0.8 0.8 0.9 0.9 0.7 Sea level pressure (mb) 1022 1021 1018 1018 1018 Rainfall (inches) 0.2 0.2 0.1 0.1 0.1 Rain (# periods) 1.0 0.9 0.7 0.7 1.0 Upper-Air Meteorological Parameters Temperature AM 850 mb (°C) 5.9 8.9 12.9 14.1 14.3 Temperature PM 850 mb (°C) 6.4 9.6 13.7 14.7 15.4 Stability at Little Rock (°C) 0.0 -0.3 -0.5 -0.5 -1.8 Geopotential height difference 700 mb at Little Rock (m) 6.8 3.4 -1.3 0.0 4.4 Wind speed yesterday 700 mb at Little Rock (ms-1) 17.8 12.3 10.0 7.8 6.2 Wind direction yesterday 700 mb at Little Rock (degrees) 281 274 289 290 351 Wind speed yesterday 850 mb at Little Rock (ms-1) 11.4 9.1 7.3 5.3 5.1 Wind speed AM 850 mb at Little Rock (ms-1) 11.7 9.2 8.2 5.8 4.6 Wind speed PM 850 mb at Little Rock (ms-1) 10.2 8.9 8.4 6.0 5.7 Wind direction yesterday 850 mb at Little Rock (degrees) 297 261 264 250 0 Wind direction AM 850 mb at Little Rock (degrees) 301 281 268 264 135 Wind direction PM 850 mb at Little Rock (degrees) 285 259 251 238 127 Recirculation at Little Rock 0.0 0.0 0.0 0.2 0.2 Cloud average 1.5 1.7 1.6 1.6 1.9

Characterization of Meteorology and Its Relationships to Fine Particulate Mass and Visibility in the VISTAS Region Examination of Relationships between Meteorological and Air Quality Data Using
Classification and Regression Tree (CART) Analysis
ICF International 3-32 VISTAS Meteorological Characterization 06-046 December 8, 2006
Table 3-11e. Summary of Average Input Parameters for Each CART Classification Category: Visibility CART Analysis for the IMPROVE Site Cape Romain.
The ranges in extinction coefficient for Categories 1 through 5 are as follows: <50, 50-75, 75-110, 110-160, and ≥ 160 Mm-1.
Category 1 Category 2 Category 3 Category 4 Category 5 Visibility Parameters Yesterday's FM at Charleston (µg/m3) 9.3 11.3 12.7 16.1 21.5 Surface Meteorological Parameters Max. surface temperature (°C) 21.9 22.9 24.8 26.9 28.1 Min. surface temperature (°C) 11.6 11.9 14.4 16.3 18.2 Relative humidity (%) 66.9 70.7 75.8 78.5 81.2 Surface wind speed (ms-1) 3.3 3.0 2.7 2.4 1.6 Surface wind direction (degrees) 22 270 206 135 180 Persistence 0.9 0.8 0.8 0.8 0.6 Sea level pressure (mb) 1023 1021 1020 1020 1018 Rainfall (inches) 0.1 0.1 0.1 0.1 0.1 Rain (# periods) 0.6 0.7 0.7 0.7 0.8 Upper-Air Meteorological Parameters Temperature AM 850 mb (°C) 8.9 10.6 12.4 13.7 14.5 Temperature PM 850 mb (°C) 10.1 11.2 12.6 14.1 15.3 Stability at Charleston (°C) -1.9 -0.3 0.1 -0.1 -0.5 Geopotential height difference 700 mb at Charleston (m) 5.0 -0.6 3.4 9.8 -9.9 Wind speed yesterday 700 mb at Charleston (ms-1) 13.3 12.5 10.0 8.7 8.7 Wind direction yesterday 700 mb at Charleston (degrees) 262 272 282 290 295 Wind speed yesterday 850 mb at Charleston (ms-1) 10.4 8.9 7.8 6.2 7.1 Wind speed AM 850 mb at Charleston (ms-1) 9.3 10.0 8.0 6.5 7.3 Wind speed PM 850 mb at Charleston (ms-1) 8.1 9.2 8.3 6.8 7.2 Wind direction yesterday 850 mb at Charleston (degrees) 241 271 275 314 274 Wind direction AM 850 mb at Charleston (degrees) 249 259 282 284 279 Wind direction PM 850 mb at Charleston (degrees) 287 273 277 295 301 Recirculation at Charleston 0.0 0.1 0.1 0.1 0.1 Cloud average 1.7 1.6 1.7 1.8 1.9

Characterization of Meteorology and Its Relationships to Fine Particulate Mass and Visibility in the VISTAS Region Examination of Relationships between Meteorological and Air Quality Data Using
Classification and Regression Tree (CART) Analysis
ICF International 3-33 VISTAS Meteorological Characterization 06-046 December 8, 2006
Table 3-11f. Summary of Average Input Parameters for Each CART Classification Category: Visibility CART Analysis for the IMPROVE Site Chassahowitzka.
The ranges in extinction coefficient for Categories 1 through 5 are as follows: <60, 60-85, 85-115, 115-165, and ≥ 165 Mm-1.
Category 1 Category 2 Category 3 Category 4 Category 5 Visibility Parameters Yesterday's FM at Tampa (µg/m3) 10.1 11.0 13.7 14.7 22.6 Yesterday's FM at Orlando (µg/m3) 8.4 10.5 11.7 13.0 18.2 Surface Meteorological Parameters Max. surface temperature (°C) 24.5 27.5 27.8 27.7 30.9 Min. surface temperature (°C) 13.0 15.0 14.5 14.9 17.2 Relative humidity (%) 71.3 75.9 78.4 79.9 80.0 Surface wind speed (ms-1) 3.0 2.2 1.4 1.7 1.1 Surface wind direction (degrees) 18 333 279 17 300 Persistence 0.9 0.8 0.7 0.7 0.6 Sea level pressure (mb) 1021 1020 1020 1021 1018 Rainfall (inches) 0.1 0.1 0.1 0.2 0.0 Rain (# periods) 0.7 0.7 0.6 0.7 0.2 Upper-Air Meteorological Parameters Temperature AM 850 mb (°C) 12.4 13.6 14.4 14.3 15.8 Temperature PM 850 mb (°C) 12.8 13.9 14.6 14.1 16.3 Stability at Tampa (°C) -1.9 -1.4 -0.4 -0.7 -1.0 Geopotential height difference 700 mb at Tampa (m) 2.1 -0.8 -0.3 5.2 -1.9 Wind speed yesterday 700 mb at Tampa (ms-1) 10.2 8.1 7.2 7.7 5.3 Wind direction yesterday 700 mb at Tampa (degrees) 274 268 254 285 304 Wind speed yesterday 850 mb at Tampa (ms-1) 9.0 7.2 6.1 5.4 4.4 Wind speed AM 850 mb at Tampa (ms-1) 8.6 7.4 6.3 5.3 3.5 Wind speed PM 850 mb at Tampa (ms-1) 7.6 7.3 6.4 5.7 3.7 Wind direction yesterday 850 mb at Tampa (degrees) 243 143 125 0 81 Wind direction AM 850 mb at Tampa (degrees) 294 222 222 209 297 Wind direction PM 850 mb at Tampa (degrees) 127 200 132 45 124 Recirculation at Tampa 0.0 0.1 0.1 0.2 0.1 Cloud average 1.8 1.7 1.7 1.8 1.4

Characterization of Meteorology and Its Relationships to Fine Particulate Mass and Visibility in the VISTAS Region Examination of Relationships between Meteorological and Air Quality Data Using
Classification and Regression Tree (CART) Analysis
ICF International 3-34 VISTAS Meteorological Characterization 06-046 December 8, 2006
Table 3-11g. Summary of Average Input Parameters for Each CART Classification Category: Visibility CART Analysis for the IMPROVE Site Cohutta.
The ranges in extinction coefficient for Categories 1 through 5 are as follows: <50, 50-80, 80-135, 135-220, and ≥ 220 Mm-1.
Category 1 Category 2 Category 3 Category 4 Category 5 Visibility Parameters Yesterday's FM at Birmingham (µg/m3) 12.7 15.8 20.6 25.9 33.3 Yesterday's FM at Atlanta (µg/m3) 13.4 16.5 19.4 24.6 30.2 Yesterday's FM at Nashville (µg/m3) 10.0 12.2 15.6 20.3 26.4 Yesterday's FM at Knoxville (µg/m3) 11.3 14.1 18.3 23.3 30.9 Surface Meteorological Parameters Max. surface temperature (°C) 12.5 17.4 24.5 29.7 31.7 Min. surface temperature (°C) 2.7 6.4 13.8 18.3 19.1 Relative humidity (%) 67.0 72.8 77.8 76.9 75.1 Surface wind speed (ms-1) 2.4 1.8 1.6 1.2 0.9 Surface wind direction (degrees) 354 287 194 231 164 Persistence 0.9 0.8 0.8 0.8 0.7 Rainfall (inches) 0.2 0.1 0.1 0.1 0.0 Rain (# periods) 0.6 0.6 0.6 0.5 0.4 Upper-Air Meteorological Parameters Temperature AM 850 mb (°C) 6.0 8.9 13.2 15.6 16.3 Temperature PM 850 mb (°C) 5.8 9.2 13.5 15.9 17.4 Stability at Atlanta (°C) 2.1 2.5 2.4 1.7 2.8 Geopotential height difference 700 mb at Atlanta (m) 6.1 1.1 -1.9 -2.8 -3.4 Wind speed yesterday 700 mb at Atlanta (ms-1) 18.6 12.8 8.8 6.7 4.5 Wind direction yesterday 700 mb at Atlanta (degrees) 276 268 269 270 74 Wind speed yesterday 850 mb at Atlanta (ms-1) 12.2 9.0 6.7 5.1 3.9 Wind speed AM 850 mb at Atlanta (ms-1) 13.7 10.2 7.4 5.7 4.5 Wind speed PM 850 mb at Atlanta (ms-1) 9.3 8.8 6.9 5.4 4.6 Wind direction yesterday 850 mb at Atlanta (degrees) 294 267 235 291 45 Wind direction AM 850 mb at Atlanta (degrees) 316 267 255 243 270 Wind direction PM 850 mb at Atlanta (degrees) 310 276 249 208 180 Recirculation at Atlanta 0.0 0.0 0.1 0.2 0.2 Cloud average 1.4 1.6 1.8 2.0 2.0

Characterization of Meteorology and Its Relationships to Fine Particulate Mass and Visibility in the VISTAS Region Examination of Relationships between Meteorological and Air Quality Data Using
Classification and Regression Tree (CART) Analysis
ICF International 3-35 VISTAS Meteorological Characterization 06-046 December 8, 2006
Table 3-11h. Summary of Average Input Parameters for Each CART Classification Category: Visibility CART Analysis for the IMPROVE Site Dolly Sods.
The ranges in extinction coefficient for Categories 1 through 5 are as follows: <40, 40-65, 65-125, 125-215, and ≥ 215 Mm-1.
Category 1 Category 2 Category 3 Category 4 Category 5 Visibility Parameters Yesterday's FM at DC (µg/m3) 13.1 13.7 17.3 22.2 25.0 Yesterday's FM at Richmond (µg/m3) 10.9 12.5 15.5 18.0 21.7 Yesterday's FM at Columbus (µg/m3) 13.8 14.0 18.3 22.0 29.4 Surface Meteorological Parameters Max. surface temperature (°C) 10.2 10.3 17.9 23.3 25.6 Min. surface temperature (°C) 0.2 0.5 7.9 13.6 15.6 Relative humidity (%) 61.7 64.8 69.4 74.6 78.1 Surface wind speed (ms-1) 1.9 1.9 1.1 0.7 0.4 Surface wind direction (degrees) 263 273 286 351 300 Persistence 0.7 0.7 0.6 0.5 0.3 Rainfall (inches) 0.1 0.1 0.1 0.2 0.1 Rain (# periods) 0.7 0.5 0.6 0.7 0.5 Solar radiation (W/m2) 418.5 423.5 523.6 564.9 666.1 Upper-Air Meteorological Parameters Temperature AM 850 mb (°C) 1.4 0.9 8.1 13.3 14.6 Temperature PM 850 mb (°C) 2.2 1.7 8.9 13.9 15.7 Stability at Pittsburgh (°C) 0.0 -0.9 -0.1 0.9 1.4 Geopotential height difference 700 mb at Pittsburgh (m) -1.1 2.4 1.1 0.3 -5.7 Wind speed yesterday 700 mb at Dulles (ms-1) 17.8 17.3 11.6 8.9 6.7 Wind speed yesterday 700 mb at Roanoke (ms-1) 17.8 18.1 11.9 7.7 6.3 Wind speed yesterday 700 mb at Wilmington (ms-1) 17.2 17.6 13.0 8.8 6.3 Wind speed yesterday 700 mb at Pittsburgh (ms-1) 16.7 16.6 12.8 9.6 7.3 Wind direction yesterday 700 mb at Dulles (degrees) 270 276 284 277 302 Wind direction yesterday 700 mb at Roanoke (degrees) 269 275 282 278 287 Wind direction yesterday 700 mb at Wilmington (degrees) 266 281 285 280 283 Wind direction yesterday 700 mb at Pittsburgh (degrees) 269 276 282 276 295 Wind speed yesterday 850 mb at Dulles (ms-1) 12.7 12.3 8.9 6.6 4.7 Wind speed yesterday 850 mb at Roanoke (ms-1) 11.5 11.4 8.1 5.6 4.0 Wind speed yesterday 850 mb at Wilmington (ms-1) 12.4 12.3 9.4 6.8 4.2 Wind speed yesterday 850 mb at Pittsburgh (ms-1) 11.6 12.1 8.5 6.3 5.0 Wind speed AM 850 mb at Dulles (ms-1) 13.6 13.3 9.0 6.5 4.6 Wind speed AM 850 mb at Roanoke (ms-1) 12.4 12.9 10.1 6.9 6.3 Wind speed AM 850 mb at Wilmington (ms-1) 11.8 12.1 9.7 8.7 5.7 Wind speed AM 850 mb at Pittsburgh (ms-1) 12.3 12.0 9.8 7.6 5.9 Wind speed PM 850 mb at Dulles (ms-1) 12.2 11.9 9.1 7.0 6.3 Wind speed PM 850 mb at Roanoke (ms-1) 10.8 10.3 8.1 6.8 4.4 Wind speed PM 850 mb at Wilmington (ms-1) 12.6 10.7 9.3 8.3 5.4 Wind speed PM 850 mb at Pittsburgh (ms-1) 11.4 10.7 8.6 7.0 6.1 Wind direction yesterday 850 mb at Dulles (degrees) 270 272 279 267 281 Wind direction yesterday 850 mb at Roanoke (degrees) 245 268 269 266 304 Wind direction yesterday 850 mb at Wilmington (degrees) 252 279 272 271 240 Wind direction yesterday 850 mb at Pittsburgh (degrees) 261 269 277 268 286

Characterization of Meteorology and Its Relationships to Fine Particulate Mass and Visibility in the VISTAS Region Examination of Relationships between Meteorological and Air Quality Data Using
Classification and Regression Tree (CART) Analysis
ICF International 3-36 VISTAS Meteorological Characterization 06-046 December 8, 2006
Category 1 Category 2 Category 3 Category 4 Category 5 Wind direction AM 850 mb at Dulles (degrees) 279 291 300 279 278 Wind direction AM 850 mb at Roanoke (degrees) 259 285 288 276 257 Wind direction AM 850 mb at Wilmington (degrees) 270 290 291 274 270 Wind direction AM 850 mb at Pittsburgh (degrees) 269 286 282 278 276 Wind direction PM 850 mb at Dulles (degrees) 267 281 288 265 283 Wind direction PM 850 mb at Roanoke (degrees) 264 272 282 258 288 Wind direction PM 850 mb at Wilmington (degrees) 261 265 269 268 288 Wind direction PM 850 mb at Pittsburgh (degrees) 270 270 276 274 264 Cloud average 1.9 1.8 1.9 2.0 2.0
Table 3-11i. Summary of Average Input Parameters for Each CART Classification Category: Visibility CART Analysis for the IMPROVE Site Everglades.
The ranges in extinction coefficient for Categories 1 through 5 are as follows: <40, 40-55, 55-80, 80-120, and ≥ 120 Mm-1.
Category 1 Category 2 Category 3 Category 4 Category 5 Visibility Parameters Yesterday's FM at Palm Beach (µg/m3) 5.6 6.9 8.4 11.0 13.3 Yesterday's FM at Ft. Lauderdale (µg/m3) 6.0 7.4 9.2 11.9 13.6 Surface Meteorological Parameters Max. surface temperature (°C) 27.9 28.7 27.2 27.7 27.7 Min. surface temperature (°C) 20.5 20.6 18.4 18.2 19.0 Relative humidity (%) 79.1 78.9 78.7 77.0 78.9 Surface wind speed (ms-1) 2.1 1.7 1.7 1.4 1.6 Surface wind direction (degrees) 93 85 71 41 58 Persistence 0.8 0.8 0.8 0.7 0.8 Rainfall (inches) 0.3 0.2 0.1 0.1 0.0 Rain (# periods) 0.8 0.8 0.6 0.3 0.3 Solar radiation (W/m2) 604.6 637.5 598.7 642.3 655.0 Upper-Air Meteorological Parameters Temperature AM 850 mb (°C) 14.6 15.3 14.4 14.2 14.6 Temperature PM 850 mb (°C) 14.8 15.7 14.5 14.3 14.9 Stability at Miami (°C) -5.0 -4.6 -3.7 -3.4 -3.3 Geopotential height difference 700 mb at Miami (m) -3.8 1.0 0.4 0.9 2.8 Wind speed yesterday 700 mb at Miami (ms-1) 6.7 6.1 7.6 7.2 8.0 Wind direction yesterday 700 mb at Miami (degrees) 95 172 268 275 286 Wind speed yesterday 850 mb at Miami (ms-1) 7.3 6.0 6.3 5.6 6.8 Wind speed AM 850 mb at Miami (ms-1) 7.7 6.1 6.2 6.0 6.4 Wind speed PM 850 mb at Miami (ms-1) 7.3 5.6 6.6 5.9 5.8 Wind direction yesterday 850 mb at Miami (degrees) 95 85 320 309 308 Wind direction AM 850 mb at Miami (degrees) 125 131 208 258 243 Wind direction PM 850 mb at Miami (degrees) 111 88 0 318 333 Recirculation at Miami 0.0 0.1 0.1 0.1 0.1 Cloud average 1.9 1.7 1.7 1.7 1.5
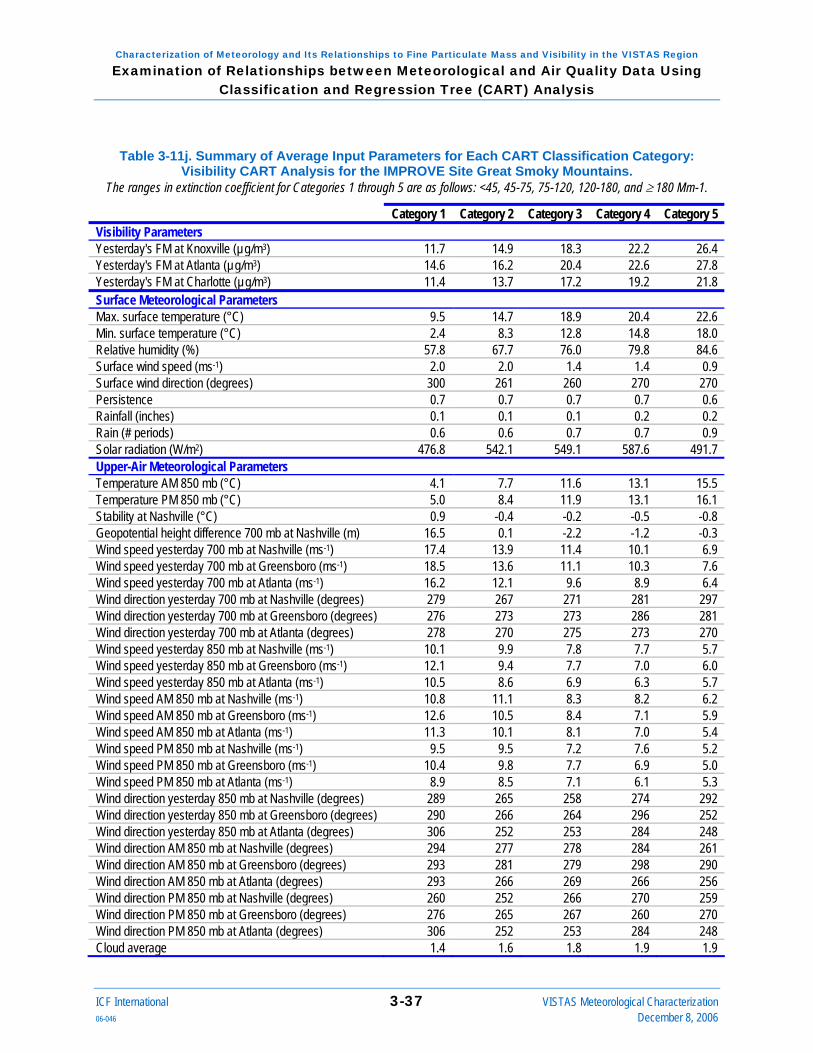
Characterization of Meteorology and Its Relationships to Fine Particulate Mass and Visibility in the VISTAS Region Examination of Relationships between Meteorological and Air Quality Data Using
Classification and Regression Tree (CART) Analysis
ICF International 3-37 VISTAS Meteorological Characterization 06-046 December 8, 2006
Table 3-11j. Summary of Average Input Parameters for Each CART Classification Category: Visibility CART Analysis for the IMPROVE Site Great Smoky Mountains.
The ranges in extinction coefficient for Categories 1 through 5 are as follows: <45, 45-75, 75-120, 120-180, and ≥ 180 Mm-1.
Category 1 Category 2 Category 3 Category 4 Category 5 Visibility Parameters Yesterday's FM at Knoxville (µg/m3) 11.7 14.9 18.3 22.2 26.4 Yesterday's FM at Atlanta (µg/m3) 14.6 16.2 20.4 22.6 27.8 Yesterday's FM at Charlotte (µg/m3) 11.4 13.7 17.2 19.2 21.8 Surface Meteorological Parameters Max. surface temperature (°C) 9.5 14.7 18.9 20.4 22.6 Min. surface temperature (°C) 2.4 8.3 12.8 14.8 18.0 Relative humidity (%) 57.8 67.7 76.0 79.8 84.6 Surface wind speed (ms-1) 2.0 2.0 1.4 1.4 0.9 Surface wind direction (degrees) 300 261 260 270 270 Persistence 0.7 0.7 0.7 0.7 0.6 Rainfall (inches) 0.1 0.1 0.1 0.2 0.2 Rain (# periods) 0.6 0.6 0.7 0.7 0.9 Solar radiation (W/m2) 476.8 542.1 549.1 587.6 491.7 Upper-Air Meteorological Parameters Temperature AM 850 mb (°C) 4.1 7.7 11.6 13.1 15.5 Temperature PM 850 mb (°C) 5.0 8.4 11.9 13.1 16.1 Stability at Nashville (°C) 0.9 -0.4 -0.2 -0.5 -0.8 Geopotential height difference 700 mb at Nashville (m) 16.5 0.1 -2.2 -1.2 -0.3 Wind speed yesterday 700 mb at Nashville (ms-1) 17.4 13.9 11.4 10.1 6.9 Wind speed yesterday 700 mb at Greensboro (ms-1) 18.5 13.6 11.1 10.3 7.6 Wind speed yesterday 700 mb at Atlanta (ms-1) 16.2 12.1 9.6 8.9 6.4 Wind direction yesterday 700 mb at Nashville (degrees) 279 267 271 281 297 Wind direction yesterday 700 mb at Greensboro (degrees) 276 273 273 286 281 Wind direction yesterday 700 mb at Atlanta (degrees) 278 270 275 273 270 Wind speed yesterday 850 mb at Nashville (ms-1) 10.1 9.9 7.8 7.7 5.7 Wind speed yesterday 850 mb at Greensboro (ms-1) 12.1 9.4 7.7 7.0 6.0 Wind speed yesterday 850 mb at Atlanta (ms-1) 10.5 8.6 6.9 6.3 5.7 Wind speed AM 850 mb at Nashville (ms-1) 10.8 11.1 8.3 8.2 6.2 Wind speed AM 850 mb at Greensboro (ms-1) 12.6 10.5 8.4 7.1 5.9 Wind speed AM 850 mb at Atlanta (ms-1) 11.3 10.1 8.1 7.0 5.4 Wind speed PM 850 mb at Nashville (ms-1) 9.5 9.5 7.2 7.6 5.2 Wind speed PM 850 mb at Greensboro (ms-1) 10.4 9.8 7.7 6.9 5.0 Wind speed PM 850 mb at Atlanta (ms-1) 8.9 8.5 7.1 6.1 5.3 Wind direction yesterday 850 mb at Nashville (degrees) 289 265 258 274 292 Wind direction yesterday 850 mb at Greensboro (degrees) 290 266 264 296 252 Wind direction yesterday 850 mb at Atlanta (degrees) 306 252 253 284 248 Wind direction AM 850 mb at Nashville (degrees) 294 277 278 284 261 Wind direction AM 850 mb at Greensboro (degrees) 293 281 279 298 290 Wind direction AM 850 mb at Atlanta (degrees) 293 266 269 266 256 Wind direction PM 850 mb at Nashville (degrees) 260 252 266 270 259 Wind direction PM 850 mb at Greensboro (degrees) 276 265 267 260 270 Wind direction PM 850 mb at Atlanta (degrees) 306 252 253 284 248 Cloud average 1.4 1.6 1.8 1.9 1.9

Characterization of Meteorology and Its Relationships to Fine Particulate Mass and Visibility in the VISTAS Region Examination of Relationships between Meteorological and Air Quality Data Using
Classification and Regression Tree (CART) Analysis
ICF International 3-38 VISTAS Meteorological Characterization 06-046 December 8, 2006
Table 3-11k. Summary of Average Input Parameters for Each CART Classification Category: Visibility CART Analysis for the IMPROVE Site James River Face.
The ranges in extinction coefficient for Categories 1 through 5 are as follows: <50, 50-85, 85-155, 155-220, and ≥ 220 Mm-1.
Category 1 Category 2 Category 3 Category 4 Category 5 Visibility Parameters Yesterday's FM at Richmond (µg/m3) 10.6 12.5 15.8 18.6 23.8 Yesterday's FM at Greensboro-Winston-Salem (µg/m3) 10.8 13.2 17.2 21.3 25.3 Yesterday's FM at Knoxville (µg/m3) 11.3 15.4 18.9 23.2 26.3 Surface Meteorological Parameters Max. surface temperature (°C) 12.1 17.1 22.3 25.1 23.0 Min. surface temperature (°C) 0.6 4.3 11.4 14.8 13.7 Relative humidity (%) 51.0 63.8 75.9 79.2 85.4 Surface wind speed (ms-1) 2.4 1.8 1.5 1.2 0.8 Surface wind direction (degrees) 266 226 193 180 196 Persistence 0.8 0.8 0.8 0.8 0.8 Sea level pressure (mb) 1023 1022 1021 1019 1022 Rainfall (inches) 0.0 0.1 0.2 0.2 0.1 Rain (# periods) 0.4 0.7 1.1 1.0 1.1 Upper-Air Meteorological Parameters Temperature AM 850 mb (°C) -1.7 5.2 10.8 13.0 12.0 Temperature PM 850 mb (°C) -0.1 5.3 11.3 14.0 12.6 Stability at Roanoke (°C) 0.2 2.7 2.6 1.9 1.3 Geopotential height difference 700 mb at Roanoke (m) 16.3 1.6 -8.9 -7.6 7.6 Wind speed yesterday 700 mb at Dulles (ms-1) 19.8 15.6 11.3 9.5 7.8 Wind speed yesterday 700 mb at Roanoke (ms-1) 20.7 15.6 10.9 9.2 7.6 Wind direction yesterday 700 mb at Dulles (degrees) 280 279 276 283 273 Wind direction yesterday 700 mb at Roanoke (degrees) 278 274 277 282 266 Wind speed yesterday 850 mb at Dulles (ms-1) 14.5 11.4 8.2 6.5 5.0 Wind speed yesterday 850 mb at Roanoke (ms-1) 13.4 9.8 7.7 5.8 5.0 Wind speed AM 850 mb at Dulles (ms-1) 15.7 11.0 8.9 7.0 5.3 Wind speed AM 850 mb at Roanoke (ms-1) 14.3 11.8 9.1 7.9 6.5 Wind speed PM 850 mb at Dulles (ms-1) 12.3 11.2 8.9 7.9 6.4 Wind speed PM 850 mb at Roanoke (ms-1) 10.9 9.7 8.2 6.4 5.9 Wind direction yesterday 850 mb at Dulles (degrees) 279 276 268 267 270 Wind direction yesterday 850 mb at Roanoke (degrees) 278 270 252 259 264 Wind direction AM 850 mb at Dulles (degrees) 312 293 286 268 266 Wind direction AM 850 mb at Roanoke (degrees) 304 273 274 270 232 Wind direction PM 850 mb at Dulles (degrees) 294 280 272 258 240 Wind direction PM 850 mb at Roanoke (degrees) 288 267 270 260 198 Recirculation at Roanoke 0.0 0.1 0.1 0.0 0.2 Cloud average 1.8 1.8 2.1 2.1 2.1

Characterization of Meteorology and Its Relationships to Fine Particulate Mass and Visibility in the VISTAS Region Examination of Relationships between Meteorological and Air Quality Data Using
Classification and Regression Tree (CART) Analysis
ICF International 3-39 VISTAS Meteorological Characterization 06-046 December 8, 2006
Table 3-11l. Summary of Average Input Parameters for Each CART Classification Category: Visibility CART Analysis for the IMPROVE Site Linville Gorge.
The ranges in extinction coefficient for Categories 1 through 5 are as follows: <35, 35-70, 70-120, 120-180, and ≥ 180 Mm-1.
Category 1 Category 2 Category 3 Category 4 Category 5 Visibility Parameters Yesterday's FM at Knoxville (µg/m3) 11.1 14.4 19.0 23.8 29.3 Yesterday's FM at Charlotte (µg/m3) 11.3 13.7 16.7 20.8 23.1 Yesterday's FM at Greenville (µg/m3) 10.9 12.8 16.6 20.4 24.8 Surface Meteorological Parameters Max. surface temperature (°C) 12.2 17.5 23.6 26.6 26.9 Min. surface temperature (°C) 1.4 6.6 13.5 16.3 17.5 Relative humidity (%) 52.5 65.3 73.8 76.1 79.6 Surface wind speed (ms-1) 2.1 1.8 1.5 1.2 0.8 Surface wind direction (degrees) 309 312 194 323 0 Persistence 0.7 0.8 0.8 0.7 0.7 Sea level pressure (mb) 1022 1020 1020 1019 1020 Rainfall (inches) 0.1 0.1 0.1 0.1 0.1 Rain (# periods) 0.5 0.7 0.8 0.8 0.6 Upper-Air Meteorological Parameters Temperature AM 850 mb (°C) 0.9 7.4 12.3 14.1 14.8 Temperature PM 850 mb (°C) 2.4 7.2 12.9 15.1 15.2 Stability at Greensboro (°C) -0.7 0.7 0.2 0.4 -0.1 Geopotential height difference 700 mb at Greensboro (m) 11.3 -4.6 1.1 1.6 -0.6 Wind speed yesterday 700 mb at Greensboro (ms-1) 20.9 14.4 10.3 7.4 7.3 Wind direction yesterday 700 mb at Greensboro (degrees) 272 273 276 292 301 Wind speed yesterday 850 mb at Greensboro (ms-1) 14.0 10.1 7.2 5.6 3.5 Wind speed AM 850 mb at Greensboro (ms-1) 14.6 10.9 7.6 6.0 4.3 Wind speed PM 850 mb at Greensboro (ms-1) 10.6 9.7 7.9 5.7 4.6 Wind direction yesterday 850 mb at Greensboro (degrees) 278 273 269 263 329 Wind direction AM 850 mb at Greensboro (degrees) 304 281 286 286 300 Wind direction PM 850 mb at Greensboro (degrees) 293 275 248 257 256 Recirculation at Greensboro 0.0 0.0 0.1 0.1 0.2 Cloud average 1.5 1.6 1.9 1.9 2.0

Characterization of Meteorology and Its Relationships to Fine Particulate Mass and Visibility in the VISTAS Region Examination of Relationships between Meteorological and Air Quality Data Using
Classification and Regression Tree (CART) Analysis
ICF International 3-40 VISTAS Meteorological Characterization 06-046 December 8, 2006
Table 3-11m. Summary of Average Input Parameters for Each CART Classification Category: Visibility CART Analysis for the IMPROVE Site Mammoth Cave.
The ranges in extinction coefficient for Categories 1 through 5 are as follows: <55, 55-90, 90-155, 155-250, and ≥ 250 Mm-1.
Category 1 Category 2 Category 3 Category 4 Category 5 Visibility Parameters Yesterday's FM at Nashville (µg/m3) 10.2 13.0 15.9 19.4 24.9 Yesterday's FM at Knoxville (µg/m3) 12.2 16.1 17.6 22.3 27.3 Yesterday's FM at Louisville (µg/m3) 10.0 14.9 18.4 24.9 29.8 Surface Meteorological Parameters Max. surface temperature (°C) 14.2 17.6 21.9 24.9 28.2 Min. surface temperature (°C) 1.9 6.2 11.7 15.1 17.9 Relative humidity (%) 58.7 67.9 76.0 78.8 79.4 Surface wind speed (ms-1) 2.6 2.7 2.2 1.7 1.2 Surface wind direction (degrees) 191 218 206 143 202 Persistence 0.9 0.8 0.8 0.7 0.7 Sea level pressure (mb) 1025 1022 1020 1020 1019 Rainfall (inches) 0.0 0.1 0.2 0.2 0.3 Rain (# periods) 0.3 0.8 0.9 0.8 0.9 Upper-Air Meteorological Parameters Temperature AM 850 mb (°C) 3.1 6.9 10.6 13.5 15.7 Temperature PM 850 mb (°C) 4.5 7.6 11.3 13.5 16.7 Stability at Nashville (°C) -0.2 0.0 0.0 -0.1 -0.2 Geopotential height difference 700 mb at Nashville (m) 14.7 5.6 -2.8 -5.5 1.2 Wind speed yesterday 700 mb at Nashville (ms-1) 18.2 13.8 11.3 8.7 7.8 Wind direction yesterday 700 mb at Nashville (degrees) 285 273 268 266 306 Wind speed yesterday 850 mb at Nashville (ms-1) 11.1 9.5 8.3 6.6 4.2 Wind speed AM 850 mb at Nashville (ms-1) 11.3 11.2 8.9 6.8 4.9 Wind speed PM 850 mb at Nashville (ms-1) 8.4 9.8 8.4 6.4 5.0 Wind direction yesterday 850 mb at Nashville (degrees) 300 267 264 238 315 Wind direction AM 850 mb at Nashville (degrees) 315 272 275 262 291 Wind direction PM 850 mb at Nashville (degrees) 271 255 266 255 238 Recirculation at Nashville 0.0 0.0 0.0 0.1 0.2 Cloud average 1.4 1.7 1.8 1.9 1.9
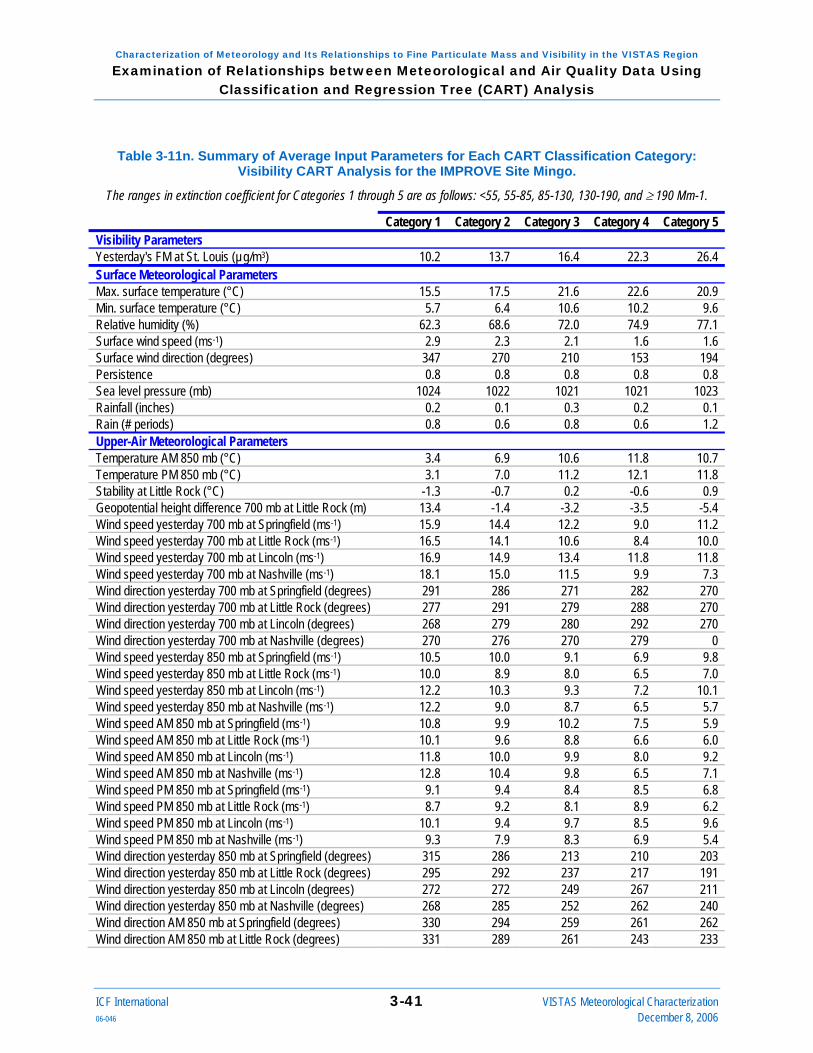
Characterization of Meteorology and Its Relationships to Fine Particulate Mass and Visibility in the VISTAS Region Examination of Relationships between Meteorological and Air Quality Data Using
Classification and Regression Tree (CART) Analysis
ICF International 3-41 VISTAS Meteorological Characterization 06-046 December 8, 2006
Table 3-11n. Summary of Average Input Parameters for Each CART Classification Category: Visibility CART Analysis for the IMPROVE Site Mingo.
The ranges in extinction coefficient for Categories 1 through 5 are as follows: <55, 55-85, 85-130, 130-190, and ≥ 190 Mm-1.
Category 1 Category 2 Category 3 Category 4 Category 5 Visibility Parameters Yesterday's FM at St. Louis (µg/m3) 10.2 13.7 16.4 22.3 26.4 Surface Meteorological Parameters Max. surface temperature (°C) 15.5 17.5 21.6 22.6 20.9 Min. surface temperature (°C) 5.7 6.4 10.6 10.2 9.6 Relative humidity (%) 62.3 68.6 72.0 74.9 77.1 Surface wind speed (ms-1) 2.9 2.3 2.1 1.6 1.6 Surface wind direction (degrees) 347 270 210 153 194 Persistence 0.8 0.8 0.8 0.8 0.8 Sea level pressure (mb) 1024 1022 1021 1021 1023 Rainfall (inches) 0.2 0.1 0.3 0.2 0.1 Rain (# periods) 0.8 0.6 0.8 0.6 1.2 Upper-Air Meteorological Parameters Temperature AM 850 mb (°C) 3.4 6.9 10.6 11.8 10.7 Temperature PM 850 mb (°C) 3.1 7.0 11.2 12.1 11.8 Stability at Little Rock (°C) -1.3 -0.7 0.2 -0.6 0.9 Geopotential height difference 700 mb at Little Rock (m) 13.4 -1.4 -3.2 -3.5 -5.4 Wind speed yesterday 700 mb at Springfield (ms-1) 15.9 14.4 12.2 9.0 11.2 Wind speed yesterday 700 mb at Little Rock (ms-1) 16.5 14.1 10.6 8.4 10.0 Wind speed yesterday 700 mb at Lincoln (ms-1) 16.9 14.9 13.4 11.8 11.8 Wind speed yesterday 700 mb at Nashville (ms-1) 18.1 15.0 11.5 9.9 7.3 Wind direction yesterday 700 mb at Springfield (degrees) 291 286 271 282 270 Wind direction yesterday 700 mb at Little Rock (degrees) 277 291 279 288 270 Wind direction yesterday 700 mb at Lincoln (degrees) 268 279 280 292 270 Wind direction yesterday 700 mb at Nashville (degrees) 270 276 270 279 0 Wind speed yesterday 850 mb at Springfield (ms-1) 10.5 10.0 9.1 6.9 9.8 Wind speed yesterday 850 mb at Little Rock (ms-1) 10.0 8.9 8.0 6.5 7.0 Wind speed yesterday 850 mb at Lincoln (ms-1) 12.2 10.3 9.3 7.2 10.1 Wind speed yesterday 850 mb at Nashville (ms-1) 12.2 9.0 8.7 6.5 5.7 Wind speed AM 850 mb at Springfield (ms-1) 10.8 9.9 10.2 7.5 5.9 Wind speed AM 850 mb at Little Rock (ms-1) 10.1 9.6 8.8 6.6 6.0 Wind speed AM 850 mb at Lincoln (ms-1) 11.8 10.0 9.9 8.0 9.2 Wind speed AM 850 mb at Nashville (ms-1) 12.8 10.4 9.8 6.5 7.1 Wind speed PM 850 mb at Springfield (ms-1) 9.1 9.4 8.4 8.5 6.8 Wind speed PM 850 mb at Little Rock (ms-1) 8.7 9.2 8.1 8.9 6.2 Wind speed PM 850 mb at Lincoln (ms-1) 10.1 9.4 9.7 8.5 9.6 Wind speed PM 850 mb at Nashville (ms-1) 9.3 7.9 8.3 6.9 5.4 Wind direction yesterday 850 mb at Springfield (degrees) 315 286 213 210 203 Wind direction yesterday 850 mb at Little Rock (degrees) 295 292 237 217 191 Wind direction yesterday 850 mb at Lincoln (degrees) 272 272 249 267 211 Wind direction yesterday 850 mb at Nashville (degrees) 268 285 252 262 240 Wind direction AM 850 mb at Springfield (degrees) 330 294 259 261 262 Wind direction AM 850 mb at Little Rock (degrees) 331 289 261 243 233

Characterization of Meteorology and Its Relationships to Fine Particulate Mass and Visibility in the VISTAS Region Examination of Relationships between Meteorological and Air Quality Data Using
Classification and Regression Tree (CART) Analysis
ICF International 3-42 VISTAS Meteorological Characterization 06-046 December 8, 2006
Category 1 Category 2 Category 3 Category 4 Category 5 Wind direction AM 850 mb at Lincoln (degrees) 302 277 278 256 279 Wind direction AM 850 mb at Nashville (degrees) 290 286 281 247 288 Wind direction PM 850 mb at Springfield (degrees) 306 279 219 180 239 Wind direction PM 850 mb at Little Rock (degrees) 323 265 253 191 214 Wind direction PM 850 mb at Lincoln (degrees) 292 264 259 225 236 Wind direction PM 850 mb at Nashville (degrees) 283 279 242 225 307 Cloud average 1.7 1.7 1.8 1.8 1.8

Characterization of Meteorology and Its Relationships to Fine Particulate Mass and Visibility in the VISTAS Region Examination of Relationships between Meteorological and Air Quality Data Using
Classification and Regression Tree (CART) Analysis
ICF International 3-43 VISTAS Meteorological Characterization 06-046 December 8, 2006
Table 3-11o. Summary of Average Input Parameters for Each CART Classification Category: Visibility CART Analysis for the IMPROVE Site Okefenokee.
The ranges in extinction coefficient for Categories 1 through 5 are as follows: <55, 55-80, 80-110, 110-170, and ≥ 170 Mm-1.
Category 1 Category 2 Category 3 Category 4 Category 5 Visibility Parameters Yesterday's FM at Jacksonville (µg/m3) 8.1 9.5 11.2 14.7 18.8 Surface Meteorological Parameters Max. surface temperature (°C) 21.5 26.1 26.7 26.5 28.6 Min. surface temperature (°C) 10.5 15.0 15.3 15.4 18.5 Relative humidity (%) 70.0 75.3 76.8 80.0 80.9 Surface wind speed (ms-1) 2.7 2.3 2.1 2.2 1.9 Surface wind direction (degrees) 315 186 110 78 90 Persistence 0.8 0.8 0.7 0.8 0.8 Sea level pressure (mb) 1022 1021 1020 1020 1019 Rainfall (inches) 0.1 0.1 0.2 0.1 0.1 Rain (# periods) 0.7 0.7 0.7 0.6 0.4 Upper-Air Meteorological Parameters Temperature AM 850 mb (°C) 9.8 13.2 13.3 13.4 15.4 Temperature PM 850 mb (°C) 10.1 13.3 13.7 13.8 15.6 Stability at Jacksonville (°C) 0.1 0.1 0.1 0.4 -0.2 Geopotential height difference 700 mb at Jacksonville (m) -1.5 0.2 5.2 -1.5 1.3 Wind speed yesterday 700 mb at Jacksonville (ms-1) 15.3 9.7 9.2 8.4 7.6 Wind speed yesterday 700 mb at Tallahassee (ms-1) 14.1 9.1 8.5 7.5 7.4 Wind direction yesterday 700 mb at Jacksonville (degrees) 265 256 279 300 297 Wind direction yesterday 700 mb at Tallahassee (degrees) 259 260 268 297 301 Wind speed yesterday 850 mb at Jacksonville (ms-1) 11.2 7.8 6.8 6.1 5.2 Wind speed yesterday 850 mb at Tallahassee (ms-1) 10.7 7.5 6.2 4.9 3.9 Wind speed AM 850 mb at Jacksonville (ms-1) 10.9 8.6 7.1 6.4 4.6 Wind speed AM 850 mb at Tallahassee (ms-1) 10.2 7.7 6.8 5.2 4.5 Wind speed PM 850 mb at Jacksonville (ms-1) 8.9 8.1 7.1 6.6 4.7 Wind speed PM 850 mb at Tallahassee (ms-1) 8.4 7.2 6.0 5.8 5.3 Wind direction yesterday 850 mb at Jacksonville (degrees) 274 241 265 311 315 Wind direction yesterday 850 mb at Tallahassee (degrees) 280 258 283 335 343 Wind direction AM 850 mb at Jacksonville (degrees) 283 239 247 277 279 Wind direction AM 850 mb at Tallahassee (degrees) 280 245 247 276 230 Wind direction PM 850 mb at Jacksonville (degrees) 284 260 254 286 304 Wind direction PM 850 mb at Tallahassee (degrees) 295 266 287 338 315 Recirculation at Jacksonville 0.0 0.1 0.1 0.0 0.2 Cloud average 1.7 1.8 1.8 1.8 1.8

Characterization of Meteorology and Its Relationships to Fine Particulate Mass and Visibility in the VISTAS Region Examination of Relationships between Meteorological and Air Quality Data Using
Classification and Regression Tree (CART) Analysis
ICF International 3-44 VISTAS Meteorological Characterization 06-046 December 8, 2006
Table 3-11p. Summary of Average Input Parameters for Each CART Classification Category: Visibility CART Analysis for the IMPROVE Site Shenandoah.
The ranges in extinction coefficient for Categories 1 through 5 are as follows: <40, 40-70, 70-145, 145-255, and ≥ 255 Mm-1.
Category 1 Category 2 Category 3 Category 4 Category 5 Visibility Parameters Yesterday's FM at Richmond (µg/m3) 10.3 13.6 14.6 20.0 22.1 Yesterday's FM at DC (µg/m3) 11.7 14.5 18.1 23.1 24.0 Yesterday's FM at Columbus (µg/m3) 13.4 14.8 19.2 22.2 26.0 Surface Meteorological Parameters Max. surface temperature (°C) 4.9 7.2 14.6 19.6 20.5 Min. surface temperature (°C) -2.2 0.3 7.7 13.6 15.6 Relative humidity (%) 56.6 69.1 78.7 83.4 88.3 Surface wind speed (ms-1) 2.6 2.5 1.9 1.4 1.0 Surface wind direction (degrees) 263 276 261 175 189 Persistence 0.9 0.8 0.8 0.8 0.6 Rainfall (inches) 0.1 0.1 0.1 0.1 0.1 Rain (# periods) 0.5 0.6 0.7 0.8 0.9 Solar radiation (W/m2) 511.2 494.4 542.8 574.9 353.0 Upper-Air Meteorological Parameters Temperature AM 850 mb (°C) 0.7 2.6 9.5 13.9 15.5 Temperature PM 850 mb (°C) 2.4 3.1 9.9 14.9 15.9 Stability at Dulles (°C) 0.5 -0.4 0.1 -0.4 0.0 Geopotential height difference 700 mb at Dulles (m) 22.7 -10.5 -5.4 0.5 10.8 Wind speed yesterday 700 mb at Dulles (ms-1) 18.3 16.2 12.1 8.7 7.1 Wind speed yesterday 700 mb at Roanoke (ms-1) 18.6 17.2 11.9 8.4 6.0 Wind direction yesterday 700 mb at Dulles (degrees) 286 275 280 281 284 Wind direction yesterday 700 mb at Roanoke (degrees) 278 274 285 276 270 Wind speed yesterday 850 mb at Dulles (ms-1) 12.8 11.7 8.9 6.4 5.3 Wind speed yesterday 850 mb at Roanoke (ms-1) 11.3 10.8 8.1 6.0 4.8 Wind speed AM 850 mb at Dulles (ms-1) 13.9 12.1 8.6 6.3 5.2 Wind speed AM 850 mb at Roanoke (ms-1) 12.4 12.1 10.0 7.4 6.6 Wind speed PM 850 mb at Dulles (ms-1) 11.1 11.8 9.4 7.3 6.3 Wind speed PM 850 mb at Roanoke (ms-1) 9.7 10.4 8.0 6.8 4.6 Wind direction yesterday 850 mb at Dulles (degrees) 288 275 267 278 278 Wind direction yesterday 850 mb at Roanoke (degrees) 277 263 263 270 262 Wind direction AM 850 mb at Dulles (degrees) 293 290 293 278 270 Wind direction AM 850 mb at Roanoke (degrees) 282 277 279 278 248 Wind direction PM 850 mb at Dulles (degrees) 275 280 285 265 263 Wind direction PM 850 mb at Roanoke (degrees) 267 277 275 267 217 Recirculation at Dulles 0.0 0.0 0.0 0.1 0.2 Cloud average 1.7 1.9 2.0 2.1 2.3

Characterization of Meteorology and Its Relationships to Fine Particulate Mass and Visibility in the VISTAS Region Examination of Relationships between Meteorological and Air Quality Data Using
Classification and Regression Tree (CART) Analysis
ICF International 3-45 VISTAS Meteorological Characterization 06-046 December 8, 2006
Table 3-11q. Summary of Average Input Parameters for Each CART Classification Category: Visibility CART Analysis for the IMPROVE Site Shining Rock.
The ranges in extinction coefficient for Categories 1 through 5 are as follows: <30, 30-60, 60-110, 110-180, and ≥ 180 Mm-1.
Category 1 Category 2 Category 3 Category 4 Category 5 Visibility Parameters Yesterday's FM at Knoxville (µg/m3) 12.0 14.7 17.3 23.7 30.8 Yesterday's FM at Charlotte (µg/m3) 11.4 13.7 16.6 19.6 25.7 Yesterday's FM at Greenville (µg/m3) 10.9 13.1 16.0 19.9 26.2 Surface Meteorological Parameters Max. surface temperature (°C) 11.0 15.4 22.5 26.4 27.2 Min. surface temperature (°C) 0.3 4.7 11.2 14.5 15.4 Relative humidity (%) 62.1 69.3 75.1 75.9 78.5 Surface wind speed (ms-1) 3.3 2.8 1.8 1.2 1.0 Surface wind direction (degrees) 2 346 0 175 207 Persistence 0.8 0.8 0.7 0.7 0.7 Sea level pressure (mb) 1022 1022 1021 1020 1021 Rainfall (inches) 0.1 0.1 0.1 0.1 0.1 Rain (# periods) 0.9 0.9 0.9 0.7 0.7 Upper-Air Meteorological Parameters Temperature AM 850 mb (°C) 2.2 6.0 11.9 14.8 15.4 Temperature PM 850 mb (°C) 2.9 6.5 12.4 15.7 16.3 Stability at Greensboro (°C) -0.3 0.2 0.3 0.8 0.9 Geopotential height difference 700 mb at Greensboro (m) 5.8 -2.3 1.7 4.8 -6.3 Wind speed yesterday 700 mb at Greensboro (ms-1) 19.2 14.6 10.6 8.3 6.0 Wind direction yesterday 700 mb at Greensboro (degrees) 271 267 276 299 336 Wind speed yesterday 850 mb at Greensboro (ms-1) 12.5 10.1 7.7 5.6 4.1 Wind speed AM 850 mb at Greensboro (ms-1) 13.8 10.4 8.5 6.1 4.5 Wind speed PM 850 mb at Greensboro (ms-1) 10.8 9.8 8.0 5.8 5.2 Wind direction yesterday 850 mb at Greensboro (degrees) 280 263 270 293 315 Wind direction AM 850 mb at Greensboro (degrees) 296 280 279 296 305 Wind direction PM 850 mb at Greensboro (degrees) 290 268 256 251 270 Recirculation at Greensboro 0.0 0.0 0.0 0.1 0.2 Cloud average 1.6 1.7 1.8 1.8 1.8

Characterization of Meteorology and Its Relationships to Fine Particulate Mass and Visibility in the VISTAS Region Examination of Relationships between Meteorological and Air Quality Data Using
Classification and Regression Tree (CART) Analysis
ICF International 3-46 VISTAS Meteorological Characterization 06-046 December 8, 2006
Table 3-11r. Summary of Average Input Parameters for Each CART Classification Category: Visibility CART Analysis for the IMPROVE Site Sipsey.
The ranges in extinction coefficient for Categories 1 through 5 are as follows: <60, 60-95, 95-135, 135-200, and ≥ 200 Mm-1.
Category 1 Category 2 Category 3 Category 4 Category 5 Visibility Parameters Yesterday's FM at Birmingham (µg/m3) 12.2 17.1 21.0 26.3 32.0 Yesterday's FM at Atlanta (µg/m3) 14.0 17.0 19.2 25.8 26.3 Yesterday's FM at Nashville (µg/m3) 9.6 12.5 16.9 20.2 22.3 Yesterday's FM at Memphis (µg/m3) 9.8 12.1 16.8 17.9 22.9 Surface Meteorological Parameters Max. surface temperature (°C) 15.8 21.7 23.8 25.6 26.4 Min. surface temperature (°C) 4.8 10.6 12.5 15.3 16.2 Relative humidity (%) 60.7 72.0 75.7 77.3 79.5 Surface wind speed (ms-1) 2.7 2.4 1.8 1.5 0.9 Surface wind direction (degrees) 281 218 152 90 135 Persistence 0.8 0.8 0.7 0.8 0.7 Sea level pressure (mb) 1024 1021 1021 1020 1020 Rainfall (inches) 0.1 0.2 0.1 0.1 0.1 Rain (# periods) 0.5 0.9 0.9 0.8 0.8 Upper-Air Meteorological Parameters Temperature AM 850 mb (°C) 6.7 11.3 12.8 13.9 14.3 Temperature PM 850 mb (°C) 7.3 11.3 13.0 14.6 15.0 Stability at Birmingham (°C) 0.3 0.6 0.6 0.3 0.4 Geopotential height difference 700 mb at Birmingham (m) 9.2 -0.1 1.3 -5.7 4.1 Wind speed yesterday 700 mb at Birmingham (ms-1) 15.9 10.8 9.0 8.1 7.2 Wind direction yesterday 700 mb at Birmingham (degrees) 277 261 278 277 27 Wind speed yesterday 850 mb at Birmingham (ms-1) 10.1 8.3 7.0 5.5 4.9 Wind speed AM 850 mb at Birmingham (ms-1) 11.7 9.8 7.3 6.9 4.1 Wind speed PM 850 mb at Birmingham (ms-1) 8.4 8.7 7.0 6.1 5.0 Wind direction yesterday 850 mb at Birmingham (degrees) 291 246 267 288 72 Wind direction AM 850 mb at Birmingham (degrees) 297 263 250 226 229 Wind direction PM 850 mb at Birmingham (degrees) 292 270 234 239 180 Recirculation at Birmingham 0.0 0.0 0.1 0.1 0.2 Cloud average 1.5 1.7 1.8 2.0 1.6

Characterization of Meteorology and Its Relationships to Fine Particulate Mass and Visibility in the VISTAS Region Examination of Relationships between Meteorological and Air Quality Data Using
Classification and Regression Tree (CART) Analysis
ICF International 3-47 VISTAS Meteorological Characterization 06-046 December 8, 2006
Table 3-11s. Summary of Average Input Parameters for Each CART Classification Category: Visibility CART Analysis for the IMPROVE Site St. Marks.
The ranges in extinction coefficient for Categories 1 through 5 are as follows: <40, 40-70, 70-100, 100-140, and ≥ 140 Mm-1.
Category 1 Category 2 Category 3 Category 4 Category 5 Visibility Parameters Yesterday's FM at Orlando (µg/m3) 9.2 9.0 11.4 11.3 14.9 Yesterday's FM at Pensacola (µg/m3) 9.6 11.2 14.1 16.9 20.9 Surface Meteorological Parameters Max. surface temperature (°C) 23.2 25.7 25.6 27.8 28.2 Min. surface temperature (°C) 12.0 13.6 13.0 15.2 16.7 Relative humidity (%) 65.7 71.8 72.3 74.9 78.5 Surface wind speed (ms-1) 2.4 2.0 1.9 1.5 1.2 Surface wind direction (degrees) 42 86 143 174 121 Persistence 0.8 0.7 0.8 0.7 0.6 Sea level pressure (mb) 1022 1021 1020 1020 1021 Rainfall (inches) 0.2 0.2 0.1 0.1 0.1 Rain (# periods) 0.7 0.7 0.6 0.6 0.5 Upper-Air Meteorological Parameters Temperature AM 850 mb (°C) 11.1 12.8 12.8 14.0 14.9 Temperature PM 850 mb (°C) 11.5 13.0 12.8 14.2 14.8 Stability at Tallahassee (°C) -0.7 0.0 0.3 0.2 0.3 Geopotential height difference 700 mb at Tallahassee (m) -1.4 2.0 -0.6 1.0 26.3 Wind speed yesterday 700 mb at Tallahassee (ms-1) 13.2 9.4 9.5 8.1 7.1 Wind direction yesterday 700 mb at Tallahassee (degrees) 264 264 262 269 307 Wind speed yesterday 850 mb at Tallahassee (ms-1) 10.4 7.7 7.0 6.0 4.8 Wind speed AM 850 mb at Tallahassee (ms-1) 10.0 7.8 7.4 6.3 5.0 Wind speed PM 850 mb at Tallahassee (ms-1) 7.8 7.5 6.8 5.7 5.3 Wind direction yesterday 850 mb at Tallahassee (degrees) 278 270 267 288 318 Wind direction AM 850 mb at Tallahassee (degrees) 279 234 246 255 279 Wind direction PM 850 mb at Tallahassee (degrees) 315 302 268 248 342 Recirculation at Tallahassee 0.0 0.1 0.0 0.1 0.2 Cloud average 1.6 1.7 1.7 1.7 1.6

Characterization of Meteorology and Its Relationships to Fine Particulate Mass and Visibility in the VISTAS Region Examination of Relationships between Meteorological and Air Quality Data Using
Classification and Regression Tree (CART) Analysis
ICF International 3-48 VISTAS Meteorological Characterization 06-046 December 8, 2006
Table 3-11t. Summary of Average Input Parameters for Each CART Classification Category: Visibility CART Analysis for the IMPROVE Site Swanquarter.
The ranges in extinction coefficient for Categories 1 through 5 are as follows: <40, 40-70, 70-115, 115-175, and ≥ 175 Mm-1.
Category 1 Category 2 Category 3 Category 4 Category 5 Visibility Parameters Yesterday's FM at Raleigh (µg/m3) 11.1 13.3 15.3 18.8 23.4 Yesterday's FM at Norfolk (µg/m3) 9.1 11.1 13.7 15.8 20.4 Surface Meteorological Parameters Max. surface temperature (°C) 19.2 18.9 20.6 24.0 25.7 Min. surface temperature (°C) 12.9 12.8 14.2 17.3 20.4 Relative humidity (%) 68.5 72.0 80.3 84.5 89.2 Surface wind speed (ms-1) 3.8 3.8 3.7 3.1 3.2 Surface wind direction (degrees) 318 335 307 255 221 Persistence 0.9 0.8 0.8 0.8 0.8 Sea level pressure (mb) 1023 1022 1020 1019 1016 Rainfall (inches) 0.2 0.1 0.2 0.1 0.0 Rain (# periods) 0.8 0.7 0.9 0.9 0.4 Upper-Air Meteorological Parameters Temperature AM 850 mb (°C) 7.6 8.5 10.6 13.4 15.5 Temperature PM 850 mb (°C) 8.3 8.8 10.7 13.6 16.0 Stability at Moorhead (°C) -1.3 -0.7 -0.2 -0.2 -0.6 Geopotential height difference 700 mb at Moorhead (m) 0.9 3.2 -1.0 -7.0 -7.1 Wind speed yesterday 700 mb at Moorhead (ms-1) 12.8 13.4 12.5 10.9 9.7 Wind direction yesterday 700 mb at Moorhead (degrees) 260 275 277 282 284 Wind speed yesterday 850 mb at Moorhead (ms-1) 9.6 8.8 9.1 7.9 7.7 Wind speed AM 850 mb at Moorhead (ms-1) 9.6 9.2 8.4 8.9 7.9 Wind speed PM 850 mb at Moorhead (ms-1) 8.8 9.4 8.9 8.6 7.6 Wind direction yesterday 850 mb at Moorhead (degrees) 245 288 271 279 273 Wind direction AM 850 mb at Moorhead (degrees) 268 288 276 281 270 Wind direction PM 850 mb at Moorhead (degrees) 287 284 272 277 282 Recirculation at Moorhead 0.0 0.1 0.0 0.0 0.0 Cloud average 1.7 1.6 1.8 1.6 1.7

Characterization of Meteorology and Its Relationships to Fine Particulate Mass and Visibility in the VISTAS Region Examination of Relationships between Meteorological and Air Quality Data Using
Classification and Regression Tree (CART) Analysis
ICF International 3-49 VISTAS Meteorological Characterization 06-046 December 8, 2006
Table 3-11u. Summary of Average Input Parameters for Each CART Classification Category: Visibility CART Analysis for the IMPROVE Site Upper Buffalo.
The ranges in extinction coefficient for Categories 1 through 5 are as follows: <40, 40-65, 65-100, 100-150, and ≥ 150 Mm-1.
Category 1 Category 2 Category 3 Category 4 Category 5 Visibility Parameters Yesterday's FM at Little Rock (µg/m3) 10.3 12.7 15.9 18.9 22.2 Yesterday's FM at Dallas (µg/m3) 10.8 12.7 14.8 16.5 21.5 Surface Meteorological Parameters Max. surface temperature (°C) 13.9 19.3 21.4 25.0 23.2 Min. surface temperature (°C) 2.2 8.5 11.4 13.9 13.4 Relative humidity (%) 57.3 66.5 71.5 73.6 81.4 Surface wind speed (ms-1) 2.9 2.6 2.8 2.4 1.9 Surface wind direction (degrees) 235 189 180 160 117 Persistence 0.8 0.8 0.8 0.8 0.7 Sea level pressure (mb) 1023 1021 1020 1019 1018 Rainfall (inches) 0.2 0.2 0.1 0.1 0.2 Rain (# periods) 0.5 0.6 0.5 0.3 0.4 Upper-Air Meteorological Parameters Temperature AM 850 mb (°C) 6.1 10.4 12.4 14.3 13.4 Temperature PM 850 mb (°C) 6.6 10.8 12.7 14.8 14.3 Stability at Little Rock (°C) 0.2 -0.5 -0.8 -1.2 -1.2 Geopotential height difference 700 mb at Little Rock (m) 12.9 -1.7 -3.3 -2.8 1.3 Wind speed yesterday 700 mb at Little Rock (ms-1) 17.1 11.9 10.7 8.2 9.7 Wind direction yesterday 700 mb at Little Rock (degrees) 289 276 275 306 288 Wind speed yesterday 850 mb at Little Rock (ms-1) 11.2 8.8 8.2 5.6 6.3 Wind speed AM 850 mb at Little Rock (ms-1) 10.3 9.3 9.1 6.9 6.7 Wind speed PM 850 mb at Little Rock (ms-1) 9.6 8.8 9.1 7.4 7.3 Wind direction yesterday 850 mb at Little Rock (degrees) 303 260 251 287 117 Wind direction AM 850 mb at Little Rock (degrees) 309 270 257 243 293 Wind direction PM 850 mb at Little Rock (degrees) 289 243 253 221 198 Recirculation at Little Rock 0.0 0.0 0.0 0.2 0.2 Cloud average 1.5 1.7 1.7 1.7 1.8
There are often clear distinctions between the average values of these key parameters for days in high and low visibility categories. A summary of the characteristics and categorical variations in selected parameters associated with poor visibility for each site follows:
For Breton, poor visibility is associated with:
• Moderate to high prior-day PM2.5 (at potentially upwind sites).
• Moderate temperatures and high relative humidity.
• Low wind speeds near the surface and aloft.
• Westerly winds aloft and northeasterly to easterly winds near the surface.

Characterization of Meteorology and Its Relationships to Fine Particulate Mass and Visibility in the VISTAS Region Examination of Relationships between Meteorological and Air Quality Data Using
Classification and Regression Tree (CART) Analysis
ICF International 3-50 VISTAS Meteorological Characterization 06-046 December 8, 2006
For Brigantine, poor visibility is associated with:
• High prior-day PM2.5 (at potentially upwind sites).
• Moderate temperatures and high relative humidity.
• Low wind speeds (recirculation).
• Westerly winds aloft and southerly winds near the surface.
For Cadiz, poor visibility is associated with:
• High prior-day PM2.5 (at potentially upwind sites).
• Moderate temperatures (lower for Category 5) and high relative humidity.
• Low to moderate wind speeds near the surface and aloft (higher for Category 5).
• Westerly winds aloft and northerly to northeasterly winds near the surface.
For Caney Creek, poor visibility is associated with:
• High prior-day PM2.5 (at potentially upwind sites).
• Moderate to high temperatures and relative humidity.
• Very low wind speeds near the surface and low wind speeds aloft.
• Westerly and southeasterly winds aloft and northeasterly to easterly winds near the surface.
For Cape Romain, poor visibility is associated with:
• Moderate to high prior-day PM2.5 (at potentially upwind sites).
• Moderately high temperatures and high relative humidity.
• Low wind speeds near the surface and moderate wind speeds aloft.
• Westerly winds aloft and southeasterly to southerly winds near the surface.
For Chassahowitzka, poor visibility is associated with:
• Moderate to high prior-day PM2.5 (higher for Category 5).
• Moderate to high temperatures and high relative humidity.
• Low wind speeds near the surface and aloft.
• Southwesterly to westerly winds aloft; westerly to northerly winds near the surface.
For Cohutta, poor visibility is associated with:
• Moderate to high prior-day PM2.5 (at potentially upwind sites).
• High temperatures and relative humidity.
• Low wind speeds near the surface and aloft.
• Westerly winds aloft and southerly to southwesterly winds near the surface.
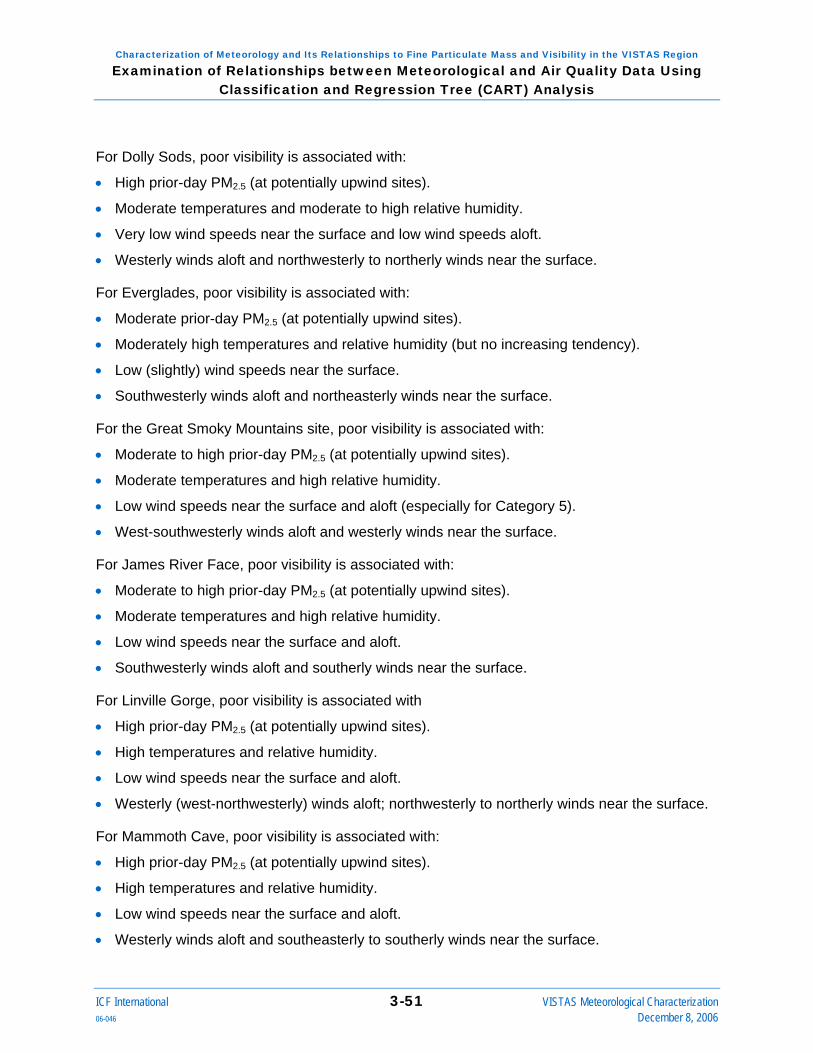
Characterization of Meteorology and Its Relationships to Fine Particulate Mass and Visibility in the VISTAS Region Examination of Relationships between Meteorological and Air Quality Data Using
Classification and Regression Tree (CART) Analysis
ICF International 3-51 VISTAS Meteorological Characterization 06-046 December 8, 2006
For Dolly Sods, poor visibility is associated with:
• High prior-day PM2.5 (at potentially upwind sites).
• Moderate temperatures and moderate to high relative humidity.
• Very low wind speeds near the surface and low wind speeds aloft.
• Westerly winds aloft and northwesterly to northerly winds near the surface.
For Everglades, poor visibility is associated with:
• Moderate prior-day PM2.5 (at potentially upwind sites).
• Moderately high temperatures and relative humidity (but no increasing tendency).
• Low (slightly) wind speeds near the surface.
• Southwesterly winds aloft and northeasterly winds near the surface.
For the Great Smoky Mountains site, poor visibility is associated with:
• Moderate to high prior-day PM2.5 (at potentially upwind sites).
• Moderate temperatures and high relative humidity.
• Low wind speeds near the surface and aloft (especially for Category 5).
• West-southwesterly winds aloft and westerly winds near the surface.
For James River Face, poor visibility is associated with:
• Moderate to high prior-day PM2.5 (at potentially upwind sites).
• Moderate temperatures and high relative humidity.
• Low wind speeds near the surface and aloft.
• Southwesterly winds aloft and southerly winds near the surface.
For Linville Gorge, poor visibility is associated with
• High prior-day PM2.5 (at potentially upwind sites).
• High temperatures and relative humidity.
• Low wind speeds near the surface and aloft.
• Westerly (west-northwesterly) winds aloft; northwesterly to northerly winds near the surface.
For Mammoth Cave, poor visibility is associated with:
• High prior-day PM2.5 (at potentially upwind sites).
• High temperatures and relative humidity.
• Low wind speeds near the surface and aloft.
• Westerly winds aloft and southeasterly to southerly winds near the surface.

Characterization of Meteorology and Its Relationships to Fine Particulate Mass and Visibility in the VISTAS Region Examination of Relationships between Meteorological and Air Quality Data Using
Classification and Regression Tree (CART) Analysis
ICF International 3-52 VISTAS Meteorological Characterization 06-046 December 8, 2006
For Mingo, poor visibility is associated with:
• Moderate to high prior-day PM2.5 (at potentially upwind sites).
• Moderate temperatures and high relative humidity.
• Low wind speeds near the surface and aloft.
• Southwesterly winds aloft and southeasterly to southerly winds near the surface.
For Okefenokee, poor visibility is associated with:
• Moderate prior-day PM2.5 (at potentially upwind sites).
• High temperatures and relative humidity (slight increasing tendency).
• Low wind speeds near the surface (slightly) and aloft.
• Westerly winds aloft and easterly winds near the surface.
For Shenandoah, poor visibility is associated with:
• High prior-day PM2.5 (at potentially upwind sites).
• Moderate temperatures and high relative humidity.
• Low wind speeds near the surface and aloft.
• Westerly winds aloft and southerly winds near the surface.
For Shining Rock, poor visibility is associated with:
• High prior-day PM2.5 (at potentially upwind sites).
• Moderate to high temperatures and high relative humidity.
• Low wind speeds near the surface and aloft.
• Westerly winds aloft and southerly to westerly winds near the surface.
For Sipsey, poor visibility is associated with:
• High prior-day PM2.5 (at potentially upwind sites).
• Moderate temperatures and high relative humidity.
• Low wind speeds near the surface and aloft.
• Southwesterly winds aloft and easterly to southeasterly winds near the surface.
For St. Mark’s, poor visibility is associated with:
• Moderate prior-day PM2.5 (at potentially upwind sites).
• High temperatures and moderate to high relative humidity (with a slight increasing tendency).
• Low wind speeds near the surface and aloft.
• Westerly winds aloft and southeasterly to easterly winds near the surface.

Characterization of Meteorology and Its Relationships to Fine Particulate Mass and Visibility in the VISTAS Region Examination of Relationships between Meteorological and Air Quality Data Using
Classification and Regression Tree (CART) Analysis
ICF International 3-53 VISTAS Meteorological Characterization 06-046 December 8, 2006
For Swanquarter, poor visibility is associated with:
• Moderate prior-day PM2.5 (there is a jump in concentration between Categories 4 and 5).
• Moderate temperatures and high relative humidity.
• Moderate wind speeds (with a slight decreasing tendency near surface).
• Westerly winds aloft and southwesterly to westerly winds near the surface.
For Upper Buffalo, poor visibility is associated with:
• High prior-day PM2.5 (at potentially upwind sites).
• Moderate to high temperatures and relative humidity.
• Low wind speeds near the surface (slight) and aloft.
• Westerly winds aloft and southeasterly winds near the surface.
PM2.5 The average value of each input parameter was also calculated for each PM2.5 classification category for each of the STN and SEARCH sites. These are presented in Tables 3-12 and 3-13. The four PM2.5 categories are defined by the 70, 90, and 97 percentile values of PM2.5 mass, which vary by site, as indicated at the top of each table. Table 3-12 summarizes the data for the STN sites, in alphabetical order, by site name.

Characterization of Meteorology and Its Relationships to Fine Particulate Mass and Visibility in the VISTAS Region Examination of Relationships between Meteorological and Air Quality Data Using
Classification and Regression Tree (CART) Analysis
ICF International 3-54 VISTAS Meteorological Characterization 06-046 December 8, 2006
Table 3-12a. Summary of Average Input Parameters for Each CART Classification Category: PM2.5 CART Analysis for the STN Site Birmingham.
The ranges in PM2.5 for Categories 1 through 4 are as follows: <22.5, 22.5-32.5, 32.5-40 and ≥ 40 μgm-3.
Category 1 Category 2 Category 3 Category 4 PM2.5 Parameters Yesterday's FM at Birmingham (µg/m3) 16.8 25.2 29.9 40.5 Yesterday's FM at Atlanta (µg/m3) 16.9 22.1 24.8 31.1 Yesterday's FM at Memphis (µg/m3) 12.9 17.7 19.8 25.1 Yesterday's FM at Nashville (µg/m3) 13.3 18.5 20.9 24.7 Surface Meteorological Parameters Max. surface temperature (°C) 20.9 25.9 27.2 29.0 Min. surface temperature (°C) 10.9 14.0 14.4 15.2 Relative humidity (%) 70.4 66.5 63.4 62.3 Surface wind speed (ms-1) 2.5 1.5 1.2 0.9 Surface wind direction (degrees) 279 79 87 11 Persistence 0.8 0.8 0.7 0.7 Sea level pressure (mb) 1021 1021 1021 1022 Rainfall (inches) 0.2 0.1 0.0 0.0 Rain (# periods) 1.0 0.6 0.3 0.1 Upper-Air Meteorological Parameters Temperature AM 850 mb (°C) 10.2 12.9 13.6 14.3 Temperature PM 850 mb (°C) 10.2 13.8 14.3 15.2 Stability at Birmingham (°C) -0.1 2.1 2.9 4.1 Geopotential height difference 700 mb at Birmingham (m) -1.2 5.3 0.6 2.8 Wind speed yesterday 700 mb at Birmingham (ms-1) 12.7 8.1 7.9 6.0 Wind direction yesterday 700 mb at Birmingham (degrees) 265 302 322 339 Wind speed yesterday 850 mb at Birmingham (ms-1) 8.9 5.6 5.0 3.9 Wind speed AM 850 mb at Birmingham (ms-1) 10.2 6.3 5.8 4.3 Wind speed PM 850 mb at Birmingham (ms-1) 8.9 5.9 5.5 3.7 Wind direction yesterday 850 mb at Birmingham (degrees) 255 345 10 32 Wind direction AM 850 mb at Birmingham (degrees) 264 261 258 284 Wind direction PM 850 mb at Birmingham (degrees) 271 238 90 315 Recirculation at Birmingham 0.0 0.1 0.1 0.3 Cloud average 1.8 1.6 1.6 1.6

Characterization of Meteorology and Its Relationships to Fine Particulate Mass and Visibility in the VISTAS Region Examination of Relationships between Meteorological and Air Quality Data Using
Classification and Regression Tree (CART) Analysis
ICF International 3-55 VISTAS Meteorological Characterization 06-046 December 8, 2006
Table 3-12b. Summary of Average Input Parameters for Each CART Classification Category: PM2.5 CART Analysis for the STN Site Charlotte.
The ranges in PM2.5 for Categories 1 through 4 are as follows: <17.5, 17.5-22.5, 22.5-30 and ≥ 30 μgm-3.
Category 1 Category 2 Category 3 Category 4 PM2.5 Parameters Yesterday's FM at Atlanta (µg/m3) 16.6 21.9 25.9 33.6 Yesterday's FM at Charlotte (µg/m3) 13.5 18.2 22.8 29.2 Yesterday's FM at Greensboro (µg/m3) 13.4 18.1 22.0 28.8 Yesterday's FM at Winston-Salem (µg/m3) 13.5 18.1 22.8 28.4 Surface Meteorological Parameters Max. surface temperature (°C) 19.8 23.8 26.5 29.0 Min. surface temperature (°C) 9.1 12.0 14.9 17.3 Relative humidity (%) 67.7 69.3 69.7 70.6 Surface wind speed (ms-1) 2.2 1.6 1.5 1.3 Surface wind direction (degrees) 251 175 150 198 Persistence 0.8 0.7 0.7 0.7 Sea level pressure (mb) 1021 1021 1021 1019 Rainfall (inches) 0.1 0.1 0.1 0.0 Rain (# periods) 0.8 0.6 0.5 0.5 Upper-Air Meteorological Parameters Temperature AM 850 mb (°C) 7.7 11.3 13.2 15.5 Temperature PM 850 mb (°C) 8.3 11.9 14.1 16.2 Stability at Greensboro (°C) -0.1 1.5 1.4 1.2 Geopotential height difference 700 mb at Greensboro (m) -1.3 2.1 4.1 0.0 Wind speed yesterday 700 mb at Greensboro (ms-1) 13.9 10.3 9.4 6.8 Wind direction yesterday 700 mb at Greensboro (degrees) 271 290 296 315 Wind speed yesterday 850 mb at Greensboro (ms-1) 9.7 6.7 5.8 5.1 Wind speed AM 850 mb at Greensboro (ms-1) 10.6 7.4 6.6 5.3 Wind speed PM 850 mb at Greensboro (ms-1) 9.5 7.5 6.6 6.8 Wind direction yesterday 850 mb at Greensboro (degrees) 262 281 280 306 Wind direction AM 850 mb at Greensboro (degrees) 281 288 280 288 Wind direction PM 850 mb at Greensboro (degrees) 269 261 273 274 Recirculation at Greensboro 0.0 0.1 0.1 0.1 Cloud average 1.7 1.7 1.7 1.6

Characterization of Meteorology and Its Relationships to Fine Particulate Mass and Visibility in the VISTAS Region Examination of Relationships between Meteorological and Air Quality Data Using
Classification and Regression Tree (CART) Analysis
ICF International 3-56 VISTAS Meteorological Characterization 06-046 December 8, 2006
Table 3-12c. Summary of Average Input Parameters for Each CART Classification Category: PM2.5 CART Analysis for the STN Site Chattanooga.
The ranges in PM2.5 for Categories 1 through 4 are as follows: <17.5, 17.5-25, 25-32.5 and ≥ 32.5 μgm-3.
Category 1 Category 2 Category 3 Category 4 PM2.5 Parameters Yesterday's FM at Birmingham (µg/m3) 16 25 30 39 Yesterday's FM at Atlanta (µg/m3) 15.8 22.6 25.7 38.3 Yesterday's FM at Knoxville (µg/m3) 14.0 20.5 27.2 42.0 Surface Meteorological Parameters Max. surface temperature (°C) 19.1 25.7 28.5 25.3 Min. surface temperature (°C) 8.5 14.4 16.0 13.1 Relative humidity (%) 66.8 70.6 66.9 74.5 Surface wind speed (ms-1) 2.0 1.4 1.0 0.8 Surface wind direction (degrees) 298 225 210 180 Persistence 0.8 0.7 0.7 0.8 Sea level pressure (mb) 1022 1020 1021 1024 Rainfall (inches) 0.2 0.1 0.1 0.0 Rain (# periods) 0.9 0.7 0.4 0.5 Upper-Air Meteorological Parameters Temperature AM 850 mb (°C) 7.7 12.8 14.5 12.4 Temperature PM 850 mb (°C) 8.2 13.5 14.9 13.0 Stability at Atlanta (°C) 1.8 3.0 4.1 4.1 Geopotential height difference 700 mb at Atlanta (m) 2.2 -2.8 -5.6 -3.0 Wind speed yesterday 700 mb at Atlanta (ms-1) 13.5 8.3 6.4 4.4 Wind speed yesterday 700 mb at Nashville (ms-1) 15.0 10.4 7.6 5.9 Wind direction yesterday 700 mb at Atlanta (degrees) 272 282 342 117 Wind direction yesterday 700 mb at Nashville (degrees) 273 276 280 135 Wind speed yesterday 850 mb at Atlanta (ms-1) 9.5 6.1 4.4 4.7 Wind speed yesterday 850 mb at Nashville (ms-1) 10.1 7.5 5.3 5.1 Wind speed AM 850 mb at Atlanta (ms-1) 10.9 6.7 5.2 4.9 Wind speed AM 850 mb at Nashville (ms-1) 10.6 8.7 6.8 6.3 Wind speed PM 850 mb at Atlanta (ms-1) 9.0 6.2 5.2 5.5 Wind speed PM 850 mb at Nashville (ms-1) 9.0 7.4 6.7 6.7 Wind direction yesterday 850 mb at Atlanta (degrees) 269 266 56 90 Wind direction yesterday 850 mb at Nashville (degrees) 276 266 248 207 Wind direction AM 850 mb at Atlanta (degrees) 280 253 288 90 Wind direction AM 850 mb at Nashville (degrees) 288 268 270 248 Wind direction PM 850 mb at Atlanta (degrees) 286 221 158 225 Wind direction PM 850 mb at Nashville (degrees) 274 245 231 214 Cloud average 1.8 2.0 1.9 1.9
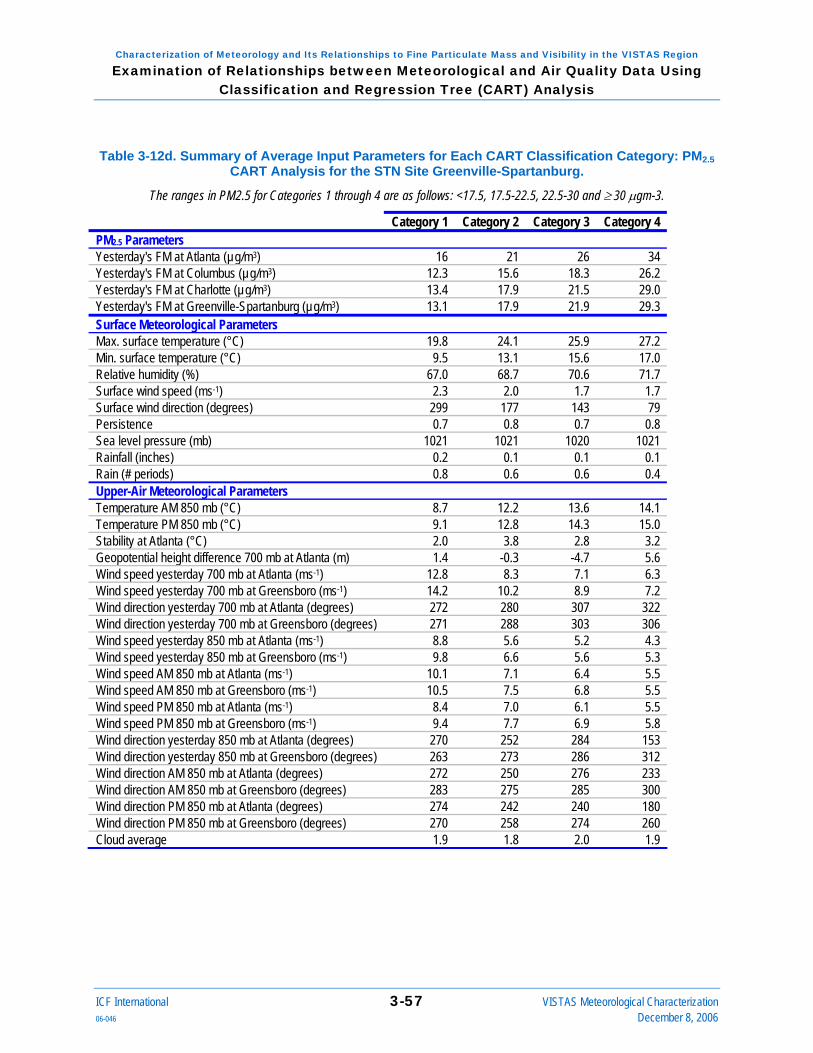
Characterization of Meteorology and Its Relationships to Fine Particulate Mass and Visibility in the VISTAS Region Examination of Relationships between Meteorological and Air Quality Data Using
Classification and Regression Tree (CART) Analysis
ICF International 3-57 VISTAS Meteorological Characterization 06-046 December 8, 2006
Table 3-12d. Summary of Average Input Parameters for Each CART Classification Category: PM2.5 CART Analysis for the STN Site Greenville-Spartanburg.
The ranges in PM2.5 for Categories 1 through 4 are as follows: <17.5, 17.5-22.5, 22.5-30 and ≥ 30 μgm-3.
Category 1 Category 2 Category 3 Category 4 PM2.5 Parameters Yesterday's FM at Atlanta (µg/m3) 16 21 26 34 Yesterday's FM at Columbus (µg/m3) 12.3 15.6 18.3 26.2 Yesterday's FM at Charlotte (µg/m3) 13.4 17.9 21.5 29.0 Yesterday's FM at Greenville-Spartanburg (µg/m3) 13.1 17.9 21.9 29.3 Surface Meteorological Parameters Max. surface temperature (°C) 19.8 24.1 25.9 27.2 Min. surface temperature (°C) 9.5 13.1 15.6 17.0 Relative humidity (%) 67.0 68.7 70.6 71.7 Surface wind speed (ms-1) 2.3 2.0 1.7 1.7 Surface wind direction (degrees) 299 177 143 79 Persistence 0.7 0.8 0.7 0.8 Sea level pressure (mb) 1021 1021 1020 1021 Rainfall (inches) 0.2 0.1 0.1 0.1 Rain (# periods) 0.8 0.6 0.6 0.4 Upper-Air Meteorological Parameters Temperature AM 850 mb (°C) 8.7 12.2 13.6 14.1 Temperature PM 850 mb (°C) 9.1 12.8 14.3 15.0 Stability at Atlanta (°C) 2.0 3.8 2.8 3.2 Geopotential height difference 700 mb at Atlanta (m) 1.4 -0.3 -4.7 5.6 Wind speed yesterday 700 mb at Atlanta (ms-1) 12.8 8.3 7.1 6.3 Wind speed yesterday 700 mb at Greensboro (ms-1) 14.2 10.2 8.9 7.2 Wind direction yesterday 700 mb at Atlanta (degrees) 272 280 307 322 Wind direction yesterday 700 mb at Greensboro (degrees) 271 288 303 306 Wind speed yesterday 850 mb at Atlanta (ms-1) 8.8 5.6 5.2 4.3 Wind speed yesterday 850 mb at Greensboro (ms-1) 9.8 6.6 5.6 5.3 Wind speed AM 850 mb at Atlanta (ms-1) 10.1 7.1 6.4 5.5 Wind speed AM 850 mb at Greensboro (ms-1) 10.5 7.5 6.8 5.5 Wind speed PM 850 mb at Atlanta (ms-1) 8.4 7.0 6.1 5.5 Wind speed PM 850 mb at Greensboro (ms-1) 9.4 7.7 6.9 5.8 Wind direction yesterday 850 mb at Atlanta (degrees) 270 252 284 153 Wind direction yesterday 850 mb at Greensboro (degrees) 263 273 286 312 Wind direction AM 850 mb at Atlanta (degrees) 272 250 276 233 Wind direction AM 850 mb at Greensboro (degrees) 283 275 285 300 Wind direction PM 850 mb at Atlanta (degrees) 274 242 240 180 Wind direction PM 850 mb at Greensboro (degrees) 270 258 274 260 Cloud average 1.9 1.8 2.0 1.9
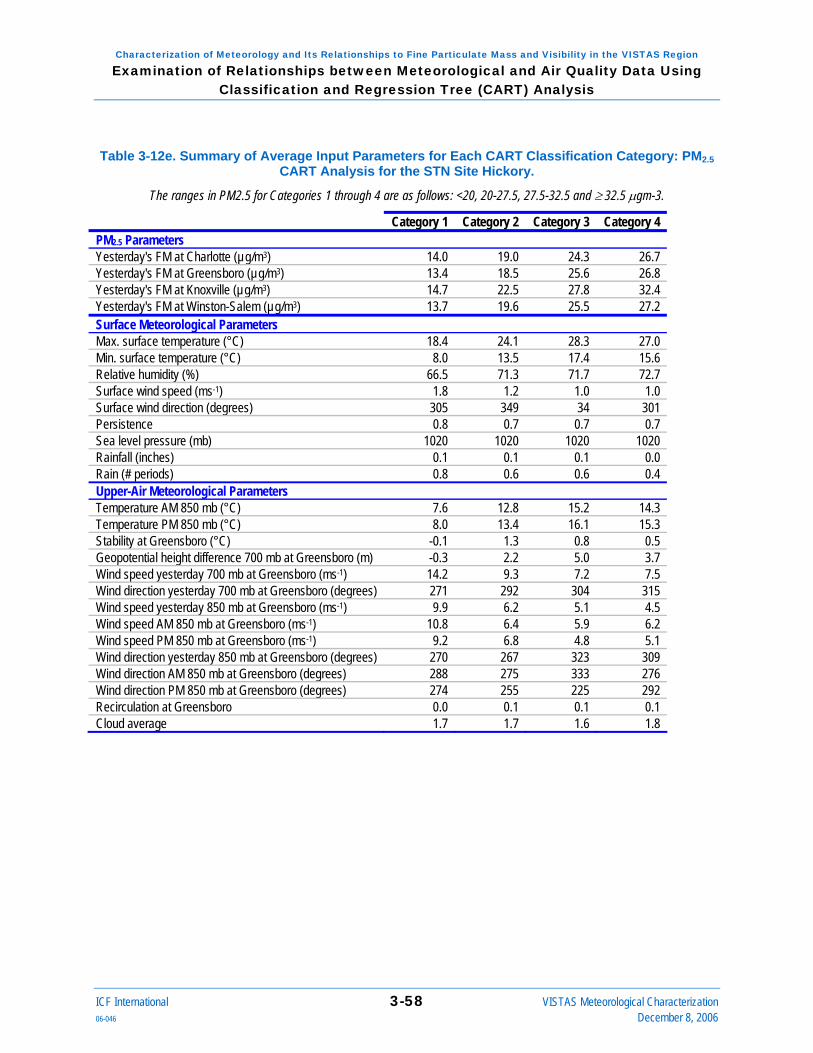
Characterization of Meteorology and Its Relationships to Fine Particulate Mass and Visibility in the VISTAS Region Examination of Relationships between Meteorological and Air Quality Data Using
Classification and Regression Tree (CART) Analysis
ICF International 3-58 VISTAS Meteorological Characterization 06-046 December 8, 2006
Table 3-12e. Summary of Average Input Parameters for Each CART Classification Category: PM2.5 CART Analysis for the STN Site Hickory.
The ranges in PM2.5 for Categories 1 through 4 are as follows: <20, 20-27.5, 27.5-32.5 and ≥ 32.5 μgm-3.
Category 1 Category 2 Category 3 Category 4 PM2.5 Parameters Yesterday's FM at Charlotte (µg/m3) 14.0 19.0 24.3 26.7 Yesterday's FM at Greensboro (µg/m3) 13.4 18.5 25.6 26.8 Yesterday's FM at Knoxville (µg/m3) 14.7 22.5 27.8 32.4 Yesterday's FM at Winston-Salem (µg/m3) 13.7 19.6 25.5 27.2 Surface Meteorological Parameters Max. surface temperature (°C) 18.4 24.1 28.3 27.0 Min. surface temperature (°C) 8.0 13.5 17.4 15.6 Relative humidity (%) 66.5 71.3 71.7 72.7 Surface wind speed (ms-1) 1.8 1.2 1.0 1.0 Surface wind direction (degrees) 305 349 34 301 Persistence 0.8 0.7 0.7 0.7 Sea level pressure (mb) 1020 1020 1020 1020 Rainfall (inches) 0.1 0.1 0.1 0.0 Rain (# periods) 0.8 0.6 0.6 0.4 Upper-Air Meteorological Parameters Temperature AM 850 mb (°C) 7.6 12.8 15.2 14.3 Temperature PM 850 mb (°C) 8.0 13.4 16.1 15.3 Stability at Greensboro (°C) -0.1 1.3 0.8 0.5 Geopotential height difference 700 mb at Greensboro (m) -0.3 2.2 5.0 3.7 Wind speed yesterday 700 mb at Greensboro (ms-1) 14.2 9.3 7.2 7.5 Wind direction yesterday 700 mb at Greensboro (degrees) 271 292 304 315 Wind speed yesterday 850 mb at Greensboro (ms-1) 9.9 6.2 5.1 4.5 Wind speed AM 850 mb at Greensboro (ms-1) 10.8 6.4 5.9 6.2 Wind speed PM 850 mb at Greensboro (ms-1) 9.2 6.8 4.8 5.1 Wind direction yesterday 850 mb at Greensboro (degrees) 270 267 323 309 Wind direction AM 850 mb at Greensboro (degrees) 288 275 333 276 Wind direction PM 850 mb at Greensboro (degrees) 274 255 225 292 Recirculation at Greensboro 0.0 0.1 0.1 0.1 Cloud average 1.7 1.7 1.6 1.8

Characterization of Meteorology and Its Relationships to Fine Particulate Mass and Visibility in the VISTAS Region Examination of Relationships between Meteorological and Air Quality Data Using
Classification and Regression Tree (CART) Analysis
ICF International 3-59 VISTAS Meteorological Characterization 06-046 December 8, 2006
Table 3-12f. Summary of Average Input Parameters for Each CART Classification Category: PM2.5 CART Analysis for the STN Site Huntington-Ashland.
The ranges in PM2.5 for Categories 1 through 4 are as follows: <17.5, 17.5-25, 25-32.5 and ≥ 32.5 μgm-3.
Category 1 Category 2 Category 3 Category 4 PM2.5 Parameters Yesterday's FM at Louisville (µg/m3) 14.1 22.4 28.1 31.2 Yesterday's FM at Cincinnati (µg/m3) 15.0 21.7 28.0 33.4 Surface Meteorological Parameters Max. surface temperature (°C) 15.4 23.2 25.9 29.5 Min. surface temperature (°C) 5.6 12.5 13.9 17.7 Relative humidity (%) 67.7 75.1 75.2 78.0 Surface wind speed (ms-1) 2.3 1.4 1.0 0.8 Surface wind direction (degrees) 244 150 180 150 Persistence 0.8 0.7 0.7 0.7 Sea level pressure (mb) 1022 1020 1021 1021 Rainfall (inches) 0.1 0.1 0.1 0.1 Rain (# periods) 1.2 0.9 0.8 0.7 Upper-Air Meteorological Parameters Temperature AM 850 mb (°C) 5 12 13 16 Temperature PM 850 mb (°C) 5.5 12.7 14.2 16.9 Stability at Wilmington (°C) -0.8 1.1 1.2 1.4 Geopotential height difference 700 mb at Wilmington (m) 2.2 2.5 -4.2 6.4 Wind speed yesterday 700 mb at Nashville (ms-1) 15.2 8.9 6.6 6.3 Wind speed yesterday 700 mb at Roanoke (ms-1) 16.1 10.2 6.0 5.3 Wind direction yesterday 700 mb at Nashville (degrees) 274 280 225 90 Wind direction yesterday 700 mb at Roanoke (degrees) 276 279 301 0 Wind speed yesterday 850 mb at Wilmington (ms-1) 11.9 7.6 6.0 4.0 Wind speed yesterday 850 mb at Nashville (ms-1) 10.3 6.2 5.1 4.2 Wind speed yesterday 850 mb at Roanoke (ms-1) 10.6 6.4 4.9 3.9 Wind speed AM 850 mb at Wilmington (ms-1) 11.8 8.8 6.2 5.3 Wind speed AM 850 mb at Nashville (ms-1) 10.9 7.6 5.6 4.6 Wind speed AM 850 mb at Roanoke (ms-1) 12.6 7.8 5.2 5.2 Wind speed PM 850 mb at Wilmington (ms-1) 10.7 8.7 7.5 5.9 Wind speed PM 850 mb at Nashville (ms-1) 9.1 7.3 5.3 5.1 Wind speed PM 850 mb at Roanoke (ms-1) 10.4 6.2 4.7 4.7 Wind direction yesterday 850 mb at Wilmington (degrees) 273 271 255 315 Wind direction yesterday 850 mb at Nashville (degrees) 275 260 210 90 Wind direction yesterday 850 mb at Roanoke (degrees) 266 269 243 326 Wind direction AM 850 mb at Wilmington (degrees) 286 283 262 270 Wind direction AM 850 mb at Nashville (degrees) 288 270 248 146 Wind direction AM 850 mb at Roanoke (degrees) 279 281 263 45 Wind direction PM 850 mb at Wilmington (degrees) 270 266 255 270 Wind direction PM 850 mb at Nashville (degrees) 273 238 233 166 Wind direction PM 850 mb at Roanoke (degrees) 276 257 207 0 Recirculation at Wilmington 0.0 0.1 0.1 0.1 Cloud average 1.8 1.8 1.8 1.8

Characterization of Meteorology and Its Relationships to Fine Particulate Mass and Visibility in the VISTAS Region Examination of Relationships between Meteorological and Air Quality Data Using
Classification and Regression Tree (CART) Analysis
ICF International 3-60 VISTAS Meteorological Characterization 06-046 December 8, 2006
Table 3-12g. Summary of Average Input Parameters for Each CART Classification Category: PM2.5 CART Analysis for the STN Site Jackson.
The ranges in PM2.5 for Categories 1 through 4 are as follows: <15, 15-22.5, 22.5-27.5 and ≥ 27.5 μgm-3.
Category 1 Category 2 Category 3 Category 4 PM2.5 Parameters Yesterday's FM at Birmingham (µg/m3) 17.1 22.9 29.1 39.5 Yesterday's FM at Memphis (µg/m3) 12.8 16.9 20.4 25.5 Yesterday's FM at Gulfport (µg/m3) 9.6 13.7 17.8 20.3 Yesterday's FM at New Orleans/Baton Rouge (µg/m3) 12.3 16.5 21.1 24.2 Surface Meteorological Parameters Max. surface temperature (°C) 22.4 25.7 25.7 29.8 Min. surface temperature (°C) 11.9 12.9 12.5 15.8 Relative humidity (%) 73.0 69.2 67.6 69.0 Surface wind speed (ms-1) 2.2 1.5 1.3 1.0 Surface wind direction (degrees) 143 96 108 117 Persistence 0.8 0.8 0.8 0.8 Sea level pressure (mb) 1021 1021 1021 1020 Rainfall (inches) 0.2 0.1 0.0 0.0 Rain (# periods) 0.9 0.5 0.5 0.3 Upper-Air Meteorological Parameters Temperature AM 850 mb (°C) 11.2 12.4 11.9 15.3 Temperature PM 850 mb (°C) 11.3 13.1 12.7 15.8 Stability at Jacksonville (°C) -0.3 1.5 1.7 2.5 Geopotential height difference 700 mb at Jacksonville (m) -1.0 3.3 -6.2 4.0 Wind speed yesterday 700 mb at Jacksonville (ms-1) 12.6 8.4 9.3 6.6 Wind direction yesterday 700 mb at Jacksonville (degrees) 263 302 310 45 Wind speed yesterday 850 mb at Jacksonville (ms-1) 9.1 6.4 6.2 5.1 Wind speed AM 850 mb at Jacksonville (ms-1) 9.9 6.7 7.0 5.2 Wind speed PM 850 mb at Jacksonville (ms-1) 8.8 6.4 6.6 4.4 Wind direction yesterday 850 mb at Jacksonville (degrees) 251 319 27 45 Wind direction AM 850 mb at Jacksonville (degrees) 258 286 217 172 Wind direction PM 850 mb at Jacksonville (degrees) 260 210 194 180 Recirculation at Jacksonville 0.0 0.1 0.1 0.2 Cloud average 1.7 1.6 1.5 1.6

Characterization of Meteorology and Its Relationships to Fine Particulate Mass and Visibility in the VISTAS Region Examination of Relationships between Meteorological and Air Quality Data Using
Classification and Regression Tree (CART) Analysis
ICF International 3-61 VISTAS Meteorological Characterization 06-046 December 8, 2006
Table 3-12h. Summary of Average Input Parameters for Each CART Classification Category: PM2.5 CART Analysis for the STN Site Kingsport-Bristol.
The ranges in PM2.5 for Categories 1 through 4 are as follows: <17.5, 17.5-25, 25-32.5 and ≥ 32.5 μgm-3.
Category 1 Category 2 Category 3 Category 4 PM2.5 Parameters Yesterday's FM at Louisville (µg/m3) 14.6 20.1 27.2 37.5 Yesterday's FM at Knoxville (µg/m3) 14.2 21.1 29.1 37.8 Yesterday's FM at Winston-Salem (µg/m3) 13.3 18.2 24.7 25.1 Yesterday's FM at Richmond (µg/m3) 12.6 16.2 20.9 21.0 Surface Meteorological Parameters Max. surface temperature (°C) 16.9 23.4 26.9 27.0 Min. surface temperature (°C) 5.5 10.2 14.2 13.4 Relative humidity (%) 70.0 71.2 73.0 72.7 Surface wind speed (ms-1) 1.7 1.0 0.8 0.6 Persistence 0.8 0.7 0.6 0.8 Sea level pressure (mb) 1022 1021 1020 1022 Surface wind direction (degrees) 280 260 255 276 Rainfall (inches) 0.1 0.1 0.0 0.0 Rain (# periods) 1.0 0.5 0.4 0.4 Upper-Air Meteorological Parameters Temperature AM 850 mb (°C) 5.7 11.5 14.5 14.9 Temperature PM 850 mb (°C) 6.7 12.3 15.4 15.9 Stability at Roanoke (°C) 1.3 3.1 3.4 6.5 Geopotential height difference 700 mb at Roanoke (m) -0.3 5.1 -0.6 -8.8 Wind speed yesterday 700 mb at Nashville (ms-1) 14.7 10.7 6.9 5.3 Wind speed yesterday 700 mb at Roanoke (ms-1) 15.8 11.5 8.0 5.4 Wind direction yesterday 700 mb at Nashville (degrees) 273 276 278 180 Wind direction yesterday 700 mb at Roanoke (degrees) 272 284 295 349 Wind speed yesterday 850 mb at Nashville (ms-1) 9.9 8.0 5.0 4.5 Wind speed yesterday 850 mb at Roanoke (ms-1) 10.4 7.1 5.0 4.6 Wind speed AM 850 mb at Nashville (ms-1) 10.4 9.3 6.6 6.6 Wind speed AM 850 mb at Roanoke (ms-1) 11.7 10.0 6.8 8.4 Wind speed PM 850 mb at Nashville (ms-1) 8.8 8.0 6.5 6.3 Wind speed PM 850 mb at Roanoke (ms-1) 9.9 7.5 5.6 5.8 Wind direction yesterday 850 mb at Nashville (degrees) 277 264 254 188 Wind direction yesterday 850 mb at Roanoke (degrees) 263 269 267 342 Wind direction AM 850 mb at Nashville (degrees) 288 269 262 220 Wind direction AM 850 mb at Roanoke (degrees) 278 274 280 330 Wind direction PM 850 mb at Nashville (degrees) 266 252 236 234 Wind direction PM 850 mb at Roanoke (degrees) 274 264 252 310 Cloud average 2.0 1.9 2.0 2.1

Characterization of Meteorology and Its Relationships to Fine Particulate Mass and Visibility in the VISTAS Region Examination of Relationships between Meteorological and Air Quality Data Using
Classification and Regression Tree (CART) Analysis
ICF International 3-62 VISTAS Meteorological Characterization 06-046 December 8, 2006
Table 3-12i. Summary of Average Input Parameters for Each CART Classification Category: PM2.5 CART Analysis for the STN Site Louisville.
The ranges in PM2.5 for Categories 1 through 4 are as follows: <20, 20-27.5, 27.5-37.5 and ≥ 37.5 μgm-3.
Category 1 Category 2 Category 3 Category 4 PM2.5 Parameters Yesterday's FM at Nashville (µg/m3) 13.0 18.2 22.1 26.9 Yesterday's FM at Louisville (µg/m3) 14.0 21.3 27.9 35.4 Yesterday's FM at Cincinnati (µg/m3) 15.1 21.4 26.8 30.9 Yesterday's FM at St. Louis (µg/m3) 13.6 19.9 22.9 29.0 Surface Meteorological Parameters Max. surface temperature (°C) 17.0 22.5 26.6 29.3 Min. surface temperature (°C) 7.8 12.6 16.7 18.8 Relative humidity (%) 67.3 69.9 70.1 67.3 Surface wind speed (ms-1) 3.1 2.3 1.9 1.5 Surface wind direction (degrees) 244 194 185 198 Persistence 0.8 0.8 0.7 0.7 Sea level pressure (mb) 1021 1020 1020 1020 Rainfall (inches) 0.2 0.1 0.1 0.1 Rain (# periods) 1.0 0.7 0.6 0.4 Upper-Air Meteorological Parameters Temperature AM 850 mb (°C) 5.2 10.2 13.6 15.1 Temperature PM 850 mb (°C) 5.6 10.8 14.5 15.9 Stability at Wilmington (°C) -0.4 1.1 1.5 2.4 Geopotential height difference 700 mb at Wilmington (m) -0.3 0.1 1.3 3.1 Wind speed yesterday 700 mb at Wilmington (ms-1) 15.9 10.6 8.6 6.5 Wind speed yesterday 700 mb at Nashville (ms-1) 14.6 9.3 7.0 5.8 Wind direction yesterday 700 mb at Wilmington (degrees) 278 278 287 301 Wind direction yesterday 700 mb at Nashville (degrees) 276 275 276 14 Wind speed yesterday 850 mb at Wilmington (ms-1) 11.5 7.7 6.5 4.4 Wind speed yesterday 850 mb at Nashville (ms-1) 9.8 6.6 4.9 4.1 Wind speed AM 850 mb at Wilmington (ms-1) 11.7 8.9 7.3 5.6 Wind speed AM 850 mb at Nashville (ms-1) 10.8 7.7 5.9 4.8 Wind speed PM 850 mb at Wilmington (ms-1) 11.1 9.0 6.8 5.6 Wind speed PM 850 mb at Nashville (ms-1) 9.6 7.2 5.7 4.9 Wind direction yesterday 850 mb at Wilmington (degrees) 271 262 255 264 Wind direction yesterday 850 mb at Nashville (degrees) 271 244 233 121 Wind direction AM 850 mb at Wilmington (degrees) 281 271 273 282 Wind direction AM 850 mb at Nashville (degrees) 284 260 253 264 Wind direction PM 850 mb at Wilmington (degrees) 271 260 260 275 Wind direction PM 850 mb at Nashville (degrees) 273 238 239 247 Cloud average 1.7 1.8 1.8 1.8

Characterization of Meteorology and Its Relationships to Fine Particulate Mass and Visibility in the VISTAS Region Examination of Relationships between Meteorological and Air Quality Data Using
Classification and Regression Tree (CART) Analysis
ICF International 3-63 VISTAS Meteorological Characterization 06-046 December 8, 2006
Table 3-12j. Summary of Average Input Parameters for Each CART Classification Category: PM2.5 CART Analysis for the STN Site Macon.
The ranges in PM2.5 for Categories 1 through 4 are as follows: <17.5, 17.5-25, 25-30 and ≥ 30 μgm-3.
Category 1 Category 2 Category 3 Category 4 PM2.5 Parameters Yesterday's FM at Atlanta (µg/m3) 16.2 22.3 26.1 32.5 Surface Meteorological Parameters Max. surface temperature (°C) 22.4 26.4 27.8 29.4 Min. surface temperature (°C) 11.2 12.7 14.2 14.7 Relative humidity (%) 68.7 68.6 66.4 69.1 Surface wind speed (ms-1) 2.3 1.6 1.3 0.9 Surface wind direction (degrees) 273 236 252 261 Persistence 0.8 0.8 0.8 0.6 Sea level pressure (mb) 1021 1021 1021 1020 Rainfall (inches) 0.2 0.1 0.0 0.1 Rain (# periods) 0.8 0.5 0.2 0.3 Upper-Air Meteorological Parameters Temperature AM 850 mb (°C) 9.7 12.4 13.0 14.0 Temperature PM 850 mb (°C) 10.0 13.1 13.9 14.8 Stability at Atlanta (°C) 1.3 4.0 4.3 5.1 Geopotential height difference 700 mb at Atlanta (m) 0.0 2.4 -5.8 5.5 Wind speed yesterday 700 mb at Atlanta (ms-1) 13.1 9.7 7.2 7.2 Wind direction yesterday 700 mb at Atlanta (degrees) 264 281 337 340 Wind speed yesterday 850 mb at Atlanta (ms-1) 9.4 6.4 5.5 4.7 Wind speed AM 850 mb at Atlanta (ms-1) 10.7 7.5 5.6 5.3 Wind speed PM 850 mb at Atlanta (ms-1) 8.8 7.2 4.9 4.4 Wind direction yesterday 850 mb at Atlanta (degrees) 263 273 355 342 Wind direction AM 850 mb at Atlanta (degrees) 270 270 261 309 Wind direction PM 850 mb at Atlanta (degrees) 273 256 259 315 Recirculation at Atlanta 0.0 0.1 0.2 0.1 Cloud average 1.7 1.6 1.7 1.7

Characterization of Meteorology and Its Relationships to Fine Particulate Mass and Visibility in the VISTAS Region Examination of Relationships between Meteorological and Air Quality Data Using
Classification and Regression Tree (CART) Analysis
ICF International 3-64 VISTAS Meteorological Characterization 06-046 December 8, 2006
Table 3-12k. Summary of Average Input Parameters for Each CART Classification Category: PM2.5 CART Analysis for the STN Site Memphis.
The ranges in PM2.5 for Categories 1 through 4 are as follows: <17.5, 17.5-22.5, 22.5-30 and ≥ 30 μgm-3.
Category 1 Category 2 Category 3 Category 4 PM2.5 Parameters Yesterday's FM at Birmingham (µg/m3) 17.8 24.1 28.6 32.5 Yesterday's FM at Memphis (µg/m3) 12.5 17.7 21.9 29.4 Yesterday's FM at Nashville (µg/m3) 13.3 18.2 21.5 27.1 Yesterday's FM at St. Louis (µg/m3) 13.8 18.7 22.0 28.2 Yesterday's FM at Little Rock (µg/m3) 12.5 17.8 21.8 25.4 Surface Meteorological Parameters Max. surface temperature (°C) 20.8 23.8 25.4 27.6 Min. surface temperature (°C) 11.5 13.8 15.0 17.6 Relative humidity (%) 66.1 65.3 64.0 64.2 Surface wind speed (ms-1) 3.2 2.5 2.3 2.2 Surface wind direction (degrees) 179 158 135 135 Persistence 0.8 0.8 0.8 0.8 Sea level pressure (mb) 1021 1021 1021 1020 Rainfall (inches) 0.2 0.1 0.1 0.0 Rain (# periods) 0.9 0.6 0.5 0.2 Upper-Air Meteorological Parameters Temperature AM 850 mb (°C) 8.8 11.1 12.0 13.7 Temperature PM 850 mb (°C) 9.2 11.7 12.7 14.3 Stability at Nashville (°C) -0.5 1.1 1.5 1.3 Geopotential height difference 700 mb at Nashville (m) -0.6 0.8 3.3 -6.7 Wind speed yesterday 700 mb at Nashville (ms-1) 14.1 9.8 8.4 7.6 Wind speed yesterday 700 mb at Little Rock (ms-1) 13.2 9.5 7.6 8.2 Wind direction yesterday 700 mb at Nashville (degrees) 272 288 299 12 Wind direction yesterday 700 mb at Little Rock (degrees) 277 284 293 18 Wind speed yesterday 850 mb at Nashville (ms-1) 9.7 6.5 5.6 5.1 Wind speed yesterday 850 mb at Little Rock (ms-1) 9.5 7.2 5.5 5.5 Wind speed AM 850 mb at Nashville (ms-1) 10.6 7.8 6.4 5.5 Wind speed AM 850 mb at Little Rock (ms-1) 10.2 7.4 6.0 5.8 Wind speed PM 850 mb at Nashville (ms-1) 9.5 7.1 5.9 5.8 Wind speed PM 850 mb at Little Rock (ms-1) 9.3 7.6 5.9 6.0 Wind direction yesterday 850 mb at Nashville (degrees) 260 282 278 336 Wind direction yesterday 850 mb at Little Rock (degrees) 265 260 228 131 Wind direction AM 850 mb at Nashville (degrees) 276 281 279 287 Wind direction AM 850 mb at Little Rock (degrees) 277 271 240 240 Wind direction PM 850 mb at Nashville (degrees) 264 271 240 290 Wind direction PM 850 mb at Little Rock (degrees) 268 255 225 169 Cloud average 1.9 1.8 1.8 1.9

Characterization of Meteorology and Its Relationships to Fine Particulate Mass and Visibility in the VISTAS Region Examination of Relationships between Meteorological and Air Quality Data Using
Classification and Regression Tree (CART) Analysis
ICF International 3-65 VISTAS Meteorological Characterization 06-046 December 8, 2006
Table 3-12l. Summary of Average Input Parameters for Each CART Classification Category: PM2.5 CART Analysis for the STN Site Montgomery.
The ranges in PM2.5 for Categories 1 through 4 are as follows: <17.5, 17.5-25, 25-30 and ≥ 30 μgm-3.
Category 1 Category 2 Category 3 Category 4 PM2.5 Parameters Yesterday's FM at Birmingham (µg/m3) 16.3 24.6 33.2 41.5 Yesterday's FM at Atlanta (µg/m3) 16.4 22.1 28.2 33.5 Yesterday's FM at New Orleans/Baton Rouge (µg/m3) 12.4 16.4 20.4 23.4 Surface Meteorological Parameters Max. surface temperature (°C) 23.2 27.3 30.0 30.0 Min. surface temperature (°C) 11.9 14.1 17.0 17.6 Relative humidity (%) 71.5 68.9 69.2 68.4 Surface wind speed (ms-1) 2.3 1.6 1.4 0.9 Surface wind direction (degrees) 180 106 117 135 Persistence 0.8 0.8 0.7 0.7 Sea level pressure (mb) 1021 1020 1020 1020 Rainfall (inches) 0.1 0.1 0.1 0.0 Rain (# periods) 0.8 0.5 0.3 0.6 Upper-Air Meteorological Parameters Temperature AM 850 mb (°C) 10.3 12.6 14.7 14.9 Temperature PM 850 mb (°C) 10.5 12.9 15.8 15.7 Stability at Birmingham (°C) 0.1 1.5 2.0 2.4 Geopotential height difference 700 mb at Birmingham (m) 1.9 -1.2 1.1 -0.6 Wind speed yesterday 700 mb at Birmingham (ms-1) 12.3 8.9 6.9 6.7 Wind direction yesterday 700 mb at Birmingham (degrees) 264 293 293 338 Wind speed yesterday 850 mb at Birmingham (ms-1) 8.8 6.2 5.2 4.3 Wind speed AM 850 mb at Birmingham (ms-1) 10.0 7.1 5.0 5.0 Wind speed PM 850 mb at Birmingham (ms-1) 8.5 6.4 4.8 4.1 Wind direction yesterday 850 mb at Birmingham (degrees) 253 285 0 329 Wind direction AM 850 mb at Birmingham (degrees) 265 267 219 276 Wind direction PM 850 mb at Birmingham (degrees) 274 264 180 307 Recirculation at Birmingham 0.0 0.1 0.1 0.3 Cloud average 1.7 1.6 1.6 1.9

Characterization of Meteorology and Its Relationships to Fine Particulate Mass and Visibility in the VISTAS Region Examination of Relationships between Meteorological and Air Quality Data Using
Classification and Regression Tree (CART) Analysis
ICF International 3-66 VISTAS Meteorological Characterization 06-046 December 8, 2006
Table 3-12m. Summary of Average Input Parameters for Each CART Classification Category: PM2.5 CART Analysis for the STN Site Nashville.
The ranges in PM2.5 for Categories 1 through 4 are as follows: <17.5, 17.5-25, 25-32.5 and ≥ 32.5 μgm-3.
Category 1 Category 2 Category 3 Category 4 PM2.5 Parameters Yesterday's FM at Birmingham (µg/m3) 17.4 25.1 29.3 32.9 Yesterday's FM at Memphis (µg/m3) 12.5 17.3 23.1 26.3 Yesterday's FM at Nashville (µg/m3) 12.9 18.0 25.0 28.5 Yesterday's FM at Louisville (µg/m3) 14.8 20.2 25.8 32.4 Yesterday's FM at Cincinnati (µg/m3) 15.7 20.0 26.0 31.3 Yesterday's FM at Knoxville (µg/m3) 15.4 20.1 24.7 30.1 Surface Meteorological Parameters Max. surface temperature (°C) 19.3 23.5 26.6 29.2 Min. surface temperature (°C) 9.3 12.6 15.8 17.3 Relative humidity (%) 67.4 69.2 68.9 66.6 Surface wind speed (ms-1) 2.7 2.0 1.7 1.5 Surface wind direction (degrees) 211 175 147 153 Persistence 0.8 0.8 0.7 0.7 Sea level pressure (mb) 1021 1021 1020 1021 Rainfall (inches) 0.2 0.1 0.1 0.0 Rain (# periods) 0.9 0.6 0.5 0.3 Upper-Air Meteorological Parameters Temperature AM 850 mb (°C) 7.7 11.3 13.4 15.4 Temperature PM 850 mb (°C) 8.2 11.9 14.3 15.9 Stability at Nashville (°C) -0.4 1.0 1.1 1.0 Geopotential height difference 700 mb at Nashville (m) -1.4 2.6 2.1 2.0 Wind speed yesterday 700 mb at Nashville (ms-1) 14.3 9.1 7.4 7.0 Wind direction yesterday 700 mb at Nashville (degrees) 273 285 304 45 Wind speed yesterday 850 mb at Nashville (ms-1) 9.7 6.5 4.6 4.9 Wind speed AM 850 mb at Nashville (ms-1) 10.7 7.6 5.7 5.8 Wind speed PM 850 mb at Nashville (ms-1) 9.4 7.1 5.6 5.1 Wind direction yesterday 850 mb at Nashville (degrees) 264 262 291 333 Wind direction AM 850 mb at Nashville (degrees) 278 270 278 278 Wind direction PM 850 mb at Nashville (degrees) 267 256 254 263 Recirculation at Nashville 0.0 0.1 0.1 0.2 Cloud average 1.8 1.7 1.7 1.8

Characterization of Meteorology and Its Relationships to Fine Particulate Mass and Visibility in the VISTAS Region Examination of Relationships between Meteorological and Air Quality Data Using
Classification and Regression Tree (CART) Analysis
ICF International 3-67 VISTAS Meteorological Characterization 06-046 December 8, 2006
Table 3-12n. Summary of Average Input Parameters for Each CART Classification Category: PM2.5 CART Analysis for the STN Site Raleigh.
The ranges in PM2.5 for Categories 1 through 4 are as follows: <17.5, 17.5-22.5, 22.5-30 and ≥ 30 μgm-3.
Category 1 Category 2 Category 3 Category 4 PM2.5 Parameters Yesterday's FM at Charlotte (µg/m3) 13.8 18.6 22.1 28.6 Yesterday's FM at Richmond (µg/m3) 12.5 16.8 19.9 27.2 Yesterday's FM at Raleigh (µg/m3) 13.0 18.2 21.8 29.4 Yesterday's FM at Winston-Salem (µg/m3) 13.8 18.5 22.7 28.1 Surface Meteorological Parameters Max. surface temperature (°C) 19.6 24.9 27.5 30.9 Min. surface temperature (°C) 8.9 12.3 15.0 17.9 Relative humidity (%) 68.9 69.6 70.4 69.7 Surface wind speed (ms-1) 2.4 2.1 1.8 1.9 Surface wind direction (degrees) 274 208 221 231 Persistence 0.8 0.8 0.8 0.8 Sea level pressure (mb) 1022 1021 1020 1018 Rainfall (inches) 0.1 0.1 0.1 0.0 Rain (# periods) 0.8 0.6 0.4 0.3 Upper-Air Meteorological Parameters Temperature AM 850 mb (°C) 7.6 11.9 13.7 16.0 Temperature PM 850 mb (°C) 8.1 12.6 14.5 16.6 Stability at Greensboro (°C) -0.2 1.9 1.3 1.2 Geopotential height difference 700 mb at Greensboro (m) -1.3 3.5 0.7 0.2 Wind speed yesterday 700 mb at Greensboro (ms-1) 13.8 10.7 9.2 7.5 Wind direction yesterday 700 mb at Greensboro (degrees) 272 282 302 298 Wind speed yesterday 850 mb at Greensboro (ms-1) 9.5 7.2 5.8 5.2 Wind speed AM 850 mb at Greensboro (ms-1) 10.3 8.0 7.0 6.0 Wind speed PM 850 mb at Greensboro (ms-1) 9.3 7.9 6.9 6.1 Wind direction yesterday 850 mb at Greensboro (degrees) 263 269 278 298 Wind direction AM 850 mb at Greensboro (degrees) 281 283 277 296 Wind direction PM 850 mb at Greensboro (degrees) 269 262 263 277 Recirculation at Greensboro 0.0 0.1 0.1 0.1 Cloud average 1.8 1.6 1.7 1.6

Characterization of Meteorology and Its Relationships to Fine Particulate Mass and Visibility in the VISTAS Region Examination of Relationships between Meteorological and Air Quality Data Using
Classification and Regression Tree (CART) Analysis
ICF International 3-68 VISTAS Meteorological Characterization 06-046 December 8, 2006
Table 3-12o. Summary of Average Input Parameters for Each CART Classification Category: PM2.5 CART Analysis for the STN Site Richmond.
The ranges in PM2.5 for Categories 1 through 4 are as follows: <17.5, 17.5-25, 25-30 and ≥ 30 μgm-3.
Category 1 Category 2 Category 3 Category 4 PM2.5 Parameters Yesterday's FM at Richmond (µg/m3) 12.2 17.9 21.7 27.7 Yesterday's FM at Winston-Salem (µg/m3) 13.5 19.6 22.7 28.1 Yesterday's FM at Washington, D.C. (µg/m3) 14.1 20.5 24.7 34.0 Surface Meteorological Parameters Max. surface temperature (°C) 18.7 23.9 25.0 29.9 Min. surface temperature (°C) 8.3 12.2 14.6 18.5 Relative humidity (%) 69.1 72.3 74.9 73.2 Surface wind speed (ms-1) 2.9 2.3 2.0 2.0 Surface wind direction (degrees) 289 179 149 183 Persistence 0.8 0.8 0.7 0.7 Sea level pressure (mb) 1022 1021 1020 1019 Rainfall (inches) 0.1 0.1 0.1 0.1 Rain (# periods) 0.9 0.6 0.7 0.5 Upper-Air Meteorological Parameters Temperature AM 850 mb (°C) 5.1 10.6 11.8 15.4 Temperature PM 850 mb (°C) 6.1 11.3 12.9 16.3 Stability at Dulles (°C) -0.3 2.0 1.0 1.9 Geopotential height difference 700 mb at Dulles (m) -3.1 5.2 9.4 -3.8 Wind speed yesterday 700 mb at Roanoke (ms-1) 15.0 11.1 9.5 6.7 Wind speed yesterday 700 mb at Dulles (ms-1) 15.0 11.7 10.7 8.8 Wind direction yesterday 700 mb at Roanoke (degrees) 276 283 281 297 Wind direction yesterday 700 mb at Dulles (degrees) 276 283 288 300 Wind speed yesterday 850 mb at Roanoke (ms-1) 9.8 7.1 6.1 4.8 Wind speed yesterday 850 mb at Dulles (ms-1) 10.8 8.3 7.2 6.6 Wind speed AM 850 mb at Roanoke (ms-1) 11.4 9.8 7.7 7.4 Wind speed AM 850 mb at Dulles (ms-1) 11.1 8.4 7.0 7.0 Wind speed PM 850 mb at Roanoke (ms-1) 9.4 7.9 6.5 6.5 Wind speed PM 850 mb at Dulles (ms-1) 10.6 9.1 7.3 7.6 Wind direction yesterday 850 mb at Roanoke (degrees) 264 263 282 284 Wind direction yesterday 850 mb at Dulles (degrees) 272 274 285 297 Wind direction AM 850 mb at Roanoke (degrees) 272 276 277 270 Wind direction AM 850 mb at Dulles (degrees) 285 276 291 283 Wind direction PM 850 mb at Roanoke (degrees) 270 257 255 264 Wind direction PM 850 mb at Dulles (degrees) 277 265 281 264 Cloud average 2.0 1.9 2.0 1.8

Characterization of Meteorology and Its Relationships to Fine Particulate Mass and Visibility in the VISTAS Region Examination of Relationships between Meteorological and Air Quality Data Using
Classification and Regression Tree (CART) Analysis
ICF International 3-69 VISTAS Meteorological Characterization 06-046 December 8, 2006
Table 3-12p. Summary of Average Input Parameters for Each CART Classification Category: PM2.5 CART Analysis for the STN Site Savannah.
The ranges in PM2.5 for Categories 1 through 4 are as follows: <17.5, 17.5-22.5, 22.5-27.5 and ≥ 27.5 μgm-3.
Category 1 Category 2 Category 3 Category 4 PM2.5 Parameters Yesterday's FM at Atlanta (µg/m3) 17.4 22.1 26.1 26.8 Yesterday's FM at Charleston (µg/m3) 11.0 15.2 19.2 21.8 Surface Meteorological Parameters Max. surface temperature (°C) 24.4 25.5 27.1 26.1 Min. surface temperature (°C) 13.9 12.4 14.1 13.1 Relative humidity (%) 74.1 72.3 72.9 70.2 Surface wind speed (ms-1) 2.3 1.7 1.3 1.4 Surface wind direction (degrees) 193 305 270 180 Persistence 0.8 0.8 0.7 0.7 Sea level pressure (mb) 1021 1021 1020 1020 Rainfall (inches) 0.1 0.0 0.1 0.1 Rain (# periods) 0.7 0.4 0.4 0.4 Upper-Air Meteorological Parameters Temperature AM 850 mb (°C) 10.8 11.4 12.5 12.6 Temperature PM 850 mb (°C) 11.3 12.2 13.3 12.7 Stability at Charleston (°C) -1.2 1.2 1.3 0.6 Geopotential height difference 700 mb at Charleston (m) 1.6 14.8 1.1 5.2 Wind speed yesterday 700 mb at Atlanta (ms-1) 11.7 10.4 8.3 11.8 Wind speed yesterday 700 mb at Charleston (ms-1) 11.5 10.2 9.2 10.5 Wind direction yesterday 700 mb at Atlanta (degrees) 267 294 305 315 Wind direction yesterday 700 mb at Charleston (degrees) 268 300 308 321 Wind speed yesterday 850 mb at Atlanta (ms-1) 8.5 6.7 5.9 7.1 Wind speed yesterday 850 mb at Charleston (ms-1) 8.8 7.7 6.2 7.6 Wind speed AM 850 mb at Atlanta (ms-1) 9.4 8.0 7.0 8.5 Wind speed AM 850 mb at Charleston (ms-1) 9.1 8.0 6.3 8.0 Wind speed PM 850 mb at Atlanta (ms-1) 7.8 7.5 5.9 6.0 Wind speed PM 850 mb at Charleston (ms-1) 8.6 7.5 7.1 7.1 Wind direction yesterday 850 mb at Atlanta (degrees) 259 302 299 307 Wind direction yesterday 850 mb at Charleston (degrees) 257 302 310 306 Wind direction AM 850 mb at Atlanta (degrees) 267 285 281 319 Wind direction AM 850 mb at Charleston (degrees) 261 292 295 304 Wind direction PM 850 mb at Atlanta (degrees) 267 276 279 302 Wind direction PM 850 mb at Charleston (degrees) 273 310 318 319 Cloud 1.9 1.7 1.9 1.8
A summary of the characteristics and categorical variations in selected parameters associated with poor visibility for each site follows:
Characterization of Meteorology and Its Relationships to Fine Particulate Mass and Visibility in the VISTAS Region Examination of Relationships between Meteorological and Air Quality Data Using
Classification and Regression Tree (CART) Analysis
ICF International 3-70 VISTAS Meteorological Characterization 06-046 December 8, 2006
For Birmingham, high PM2.5 is associated with
• High temperatures.
• High PM2.5 on previous day (local & potentially upwind sites).
• Low wind speeds near the surface and aloft.
• Westerly winds aloft and northerly winds near the surface.
• Stable lapse rates.
For Charlotte, high PM2.5 for is associated with
• High temperatures.
• High PM2.5 on previous day (local & potentially upwind sites).
• Low wind speeds near the surface and aloft.
• Westerly winds aloft and southerly winds near the surface.
For Chattanooga, high PM2.5 is associated with
• Moderate temperatures.
• Very high PM2.5 on previous day (potentially upwind sites).
• Low wind speeds near the surface and aloft.
• Easterly winds aloft and southerly winds near the surface.
• Stable conditions.
• Slightly higher RH (compared to lower PM2.5 bins).
For Greenville-Spartanburg, high PM2.5 is associated with
• Moderate to high temperatures.
• High PM2.5 on previous day (local & potentially upwind sites).
• Low wind speeds near the surface and aloft (slight tendency for lower wind speeds compared to lower PM2.5 bins).
• Southwesterly winds aloft and easterly winds near the surface.
For Hickory, high PM2.5 is associated with
• Moderate to high temperatures.
• High PM2.5 on previous day (potentially upwind sites).
• Very low wind speeds near the surface.
• Westerly winds aloft and near the surface.

Characterization of Meteorology and Its Relationships to Fine Particulate Mass and Visibility in the VISTAS Region Examination of Relationships between Meteorological and Air Quality Data Using
Classification and Regression Tree (CART) Analysis
ICF International 3-71 VISTAS Meteorological Characterization 06-046 December 8, 2006
High PM2.5 for Huntington-Ashland is associated with
• Moderate to high temperatures.
• High relative humidity.
• High PM2.5 on previous day (potentially upwind sites).
• Very low wind speeds near the surface and low wind speeds aloft.
• Westerly winds aloft and southeasterly winds near the surface.
• Stable conditions.
For Jackson, high PM2.5 is associated with
• High temperatures.
• High PM2.5 on previous day (potentially upwind sites).
• Low wind speeds, especially near the surface.
• Southerly winds aloft and easterly winds near the surface (easterly surface winds appear for all categories).
• Stable lapse rates.
For Kingsport-Bristol, high PM2.5 is associated with
• Moderate temperatures.
• High PM2.5 on previous day (potential upwind sites).
• Very low wind speeds near the surface; moderate wind speeds aloft.
• Northwesterly winds aloft and westerly winds near the surface.
• Stable conditions.
For Louisville, high PM2.5 is associated with
• Moderate temperatures.
• High PM2.5 on previous day (local & potentially upwind sites).
• Low wind speeds near the surface and aloft.
• Westerly winds aloft and southerly winds near the surface.
• Stable conditions.
High PM2.5 for Macon is associated with
• Moderate temperatures.
• High PM2.5 on previous day (potentially upwind sites).
• Very low wind speeds near the surface and low wind speeds aloft.

Characterization of Meteorology and Its Relationships to Fine Particulate Mass and Visibility in the VISTAS Region Examination of Relationships between Meteorological and Air Quality Data Using
Classification and Regression Tree (CART) Analysis
ICF International 3-72 VISTAS Meteorological Characterization 06-046 December 8, 2006
• West-northwesterly winds aloft and westerly winds near the surface.
• Stable conditions.
High PM2.5 for Memphis is associated with
• Moderate to high temperatures.
• High PM2.5 on previous day (local & potentially upwind sites).
• Moderate wind speeds near the surface and low wind speeds aloft.
• Westerly winds aloft and southeasterly winds near the surface.
For Montgomery, high PM2.5 is associated with
• Moderate temperatures.
• High PM2.5 on previous day (potentially upwind sites).
• Low wind speeds, especially near the surface.
• Westerly winds aloft and southeasterly winds near the surface.
• Stable conditions.
For Nashville, high PM2.5 is associated with
• High temperatures.
• High PM2.5 on previous day (local & potentially upwind sites).
• Low wind speeds near the surface and aloft.
• Westerly winds aloft and south-southeasterly winds near the surface.
For Raleigh, high PM2.5 is associated with
• High temperatures.
• High PM2.5 on previous day (local & potentially upwind sites).
• Low to moderate wind speeds near the surface and aloft.
• Westerly winds aloft and southwesterly winds near the surface.
For Richmond, high PM2.5 is associated with
• High temperatures.
• High PM2.5 on previous day (local & potentially upwind sites).
• Low to moderate wind speeds.
• Westerly winds aloft and southerly winds near the surface.
• Stable conditions.

Characterization of Meteorology and Its Relationships to Fine Particulate Mass and Visibility in the VISTAS Region Examination of Relationships between Meteorological and Air Quality Data Using
Classification and Regression Tree (CART) Analysis
ICF International 3-73 VISTAS Meteorological Characterization 06-046 December 8, 2006
For Savannah, high PM2.5 is associated with
• Moderate to high temperatures.
• Relatively high PM2.5 on previous day (potentially upwind).
• Low to moderate wind speeds near the surface and aloft (high bins are not distinguished by wind speed).
• Westerly winds aloft and southerly winds near the surface.
Table 3-13 summarizes the data for the SEARCH sites, for the inland sites and then the coastal sites.
Table 3-13a. Summary of Average Input Parameters for Each CART Classification Category: PM2.5 CART Analysis for the SEARCH Site Atlanta (Jefferson St.).
The ranges in PM2.5 for Categories 1 through 4 are as follows: <20, 20-27.5, 27.5-35 and ≥ 35 μgm-3.
Category 1 Category 2 Category 3 Category 4 PM2.5 Parameters Yesterday's FM at Atlanta (µg/m3) 16.3 22.9 27.2 33.8 Yesterday's FM at Birmingham (µg/m3) 16.8 25.4 30.5 37.1 Surface Meteorological Parameters Max. surface temperature (°C) 20.9 25.6 26.7 27.4 Min. surface temperature (°C) 11.4 15.0 15.7 15.7 Relative humidity (%) 68.4 68.1 67.1 67.0 Surface wind speed (ms-1) 1.8 1.2 1.0 0.9 Surface wind direction (degrees) 275 227 241 275 Persistence 0.8 0.8 0.7 0.8 Station pressure (mb) 989 989 989 989 Rainfall (inches) 0.2 0.1 0.1 0.0 Rain (# periods) 0.8 0.5 0.6 0.1 Upper-Air Meteorological Parameters Temperature AM 850 mb (°C) 10.1 13.0 13.3 14.2 Temperature PM 850 mb (°C) 10.2 13.8 14.0 15.0 Stability at Atlanta (°C) 1.8 4.0 4.3 5.8 Geopotential height difference 700 mb at Atlanta (m) -0.2 3.2 -1.1 8.0 Wind speed yesterday 700 mb at Atlanta (ms-1) 12.7 8.5 7.1 6.4 Wind direction yesterday 700 mb at Atlanta (degrees) 268 299 305 346 Wind speed yesterday 850 mb at Atlanta (ms-1) 8.8 5.5 5.0 4.1 Wind speed AM 850 mb at Atlanta (ms-1) 10.3 6.3 6.0 4.6 Wind speed PM 850 mb at Atlanta (ms-1) 8.7 5.9 5.8 4.6 Wind direction yesterday 850 mb at Atlanta (degrees) 260 291 322 324 Wind direction AM 850 mb at Atlanta (degrees) 265 273 287 278 Wind direction PM 850 mb at Atlanta (degrees) 271 249 244 276 Recirculation at Atlanta 0.0 0.1 0.2 0.3 Cloud average 1.7 1.7 1.7 1.5

Characterization of Meteorology and Its Relationships to Fine Particulate Mass and Visibility in the VISTAS Region Examination of Relationships between Meteorological and Air Quality Data Using
Classification and Regression Tree (CART) Analysis
ICF International 3-74 VISTAS Meteorological Characterization 06-046 December 8, 2006
Table 3-13b. Summary of Average Input Parameters for Each CART Classification Category: PM2.5 CART Analysis for the SEARCH Site Yorkville.
The ranges in PM2.5 for Categories 1 through 4 are as follows: <15, 15-22.5, 22.5-30 and ≥ 30 μgm-3.
Category 1 Category 2 Category 3 Category 4 PM2.5 Parameters Yesterday's FM at Atlanta (µg/m3) 16.1 21.5 27.1 33.7 Yesterday's FM at Birmingham (µg/m3) 16.1 24.5 29.8 40.2 Yesterday's FM at Yorkville (µg/m3) 10.6 16.7 21.8 29.6 Surface Meteorological Parameters Max. surface temperature (°C) 18.5 25.0 27.2 28.6 Min. surface temperature (°C) 9.1 15.2 17.3 18.6 Relative humidity (%) 73.3 72.5 72.1 73.6 Surface wind speed (ms-1) 2.8 2.2 2.0 1.5 Surface wind direction (degrees) 271 117 79 79 Persistence 0.8 0.8 0.8 0.7 Station pressure (mb) 975 975 974 975 Rainfall (inches) 0.2 0.1 0.0 0.0 Rain (# periods) 1.0 0.7 0.7 0.5 Upper-Air Meteorological Parameters Temperature AM 850 mb (°C) 9.5 13.2 14.5 15.2 Temperature PM 850 mb (°C) 9.5 14.0 15.1 16.4 Stability at Atlanta (°C) 2.1 3.0 3.0 3.4 Geopotential height difference 700 mb at Atlanta (m) -0.3 2.5 -0.1 4.2 Wind speed yesterday 700 mb at Atlanta (ms-1) 13.4 8.0 6.5 5.7 Wind direction yesterday 700 mb at Atlanta (degrees) 268 291 317 17 Wind speed yesterday 850 mb at Atlanta (ms-1) 9.2 5.4 4.8 4.0 Wind speed AM 850 mb at Atlanta (ms-1) 10.6 6.5 5.8 4.0 Wind speed PM 850 mb at Atlanta (ms-1) 8.9 6.3 5.3 4.3 Wind direction yesterday 850 mb at Atlanta (degrees) 261 293 0 21 Wind direction AM 850 mb at Atlanta (degrees) 269 257 289 45 Wind direction PM 850 mb at Atlanta (degrees) 274 218 257 58 Recirculation at Atlanta 0.0 0.1 0.2 0.3 Cloud average 1.7 1.7 1.7 1.7

Characterization of Meteorology and Its Relationships to Fine Particulate Mass and Visibility in the VISTAS Region Examination of Relationships between Meteorological and Air Quality Data Using
Classification and Regression Tree (CART) Analysis
ICF International 3-75 VISTAS Meteorological Characterization 06-046 December 8, 2006
Table 3-13c. Summary of Average Input Parameters for Each CART Classification Category: PM2.5 CART Analysis for the SEARCH Site Birmingham.
The ranges in PM2.5 for Categories 1 through 4 are as follows: <20, 20-30, 30-37.5 and ≥ 37.5 μgm-3.
Category 1 Category 2 Category 3 Category 4 PM2.5 Parameters Yesterday's FM at Birmingham (µg/m3) 16.5 24.1 29.5 38.2 Yesterday's FM at Atlanta (µg/m3) 16.7 21.6 23.7 30.8 Yesterday's FM at Memphis (µg/m3) 12.7 17.0 19.9 23.3 Yesterday's FM at Nashville (µg/m3) 13.2 17.5 20.6 23.4 Surface Meteorological Parameters Max. surface temperature (°C) 21.6 26.0 27.5 28.4 Min. surface temperature (°C) 11.5 14.3 13.9 14.7 Relative humidity (%) 70.9 66.4 63.0 62.3 Surface wind speed (ms-1) 1.8 1.3 1.0 0.8 Surface wind direction (degrees) 247 73 18 345 Persistence 0.8 0.8 0.7 0.7 Station pressure (mb) 998 998 998 1000 Rainfall (inches) 0.2 0.1 0.0 0.0 Rain (# periods) 1.0 0.6 0.4 0.3 Upper-Air Meteorological Parameters Temperature AM 850 mb (°C) 10.2 12.5 13.0 13.9 Temperature PM 850 mb (°C) 10.3 13.2 13.9 14.7 Stability at Birmingham (°C) -0.3 2.1 3.1 3.5 Geopotential height difference 700 mb at Birmingham (m) -1.7 5.2 2.3 5.1 Wind speed yesterday 700 mb at Birmingham (ms-1) 12.8 8.7 7.7 6.9 Wind direction yesterday 700 mb at Birmingham (degrees) 265 298 307 329 Wind speed yesterday 850 mb at Birmingham (ms-1) 9.1 5.9 4.6 4.5 Wind speed AM 850 mb at Birmingham (ms-1) 10.3 6.6 5.6 5.0 Wind speed PM 850 mb at Birmingham (ms-1) 8.9 6.3 5.5 4.3 Wind direction yesterday 850 mb at Birmingham (degrees) 252 345 349 14 Wind direction AM 850 mb at Birmingham (degrees) 264 251 283 243 Wind direction PM 850 mb at Birmingham (degrees) 273 219 321 270 Recirculation at Birmingham 0.02 0.08 0.13 0.28 Cloud average 1.8 1.6 1.6 1.5

Characterization of Meteorology and Its Relationships to Fine Particulate Mass and Visibility in the VISTAS Region Examination of Relationships between Meteorological and Air Quality Data Using
Classification and Regression Tree (CART) Analysis
ICF International 3-76 VISTAS Meteorological Characterization 06-046 December 8, 2006
Table 3-13d. Summary of Average Input Parameters for Each CART Classification Category: PM2.5 CART Analysis for the SEARCH Site Centreville.
The ranges in PM2.5 for Categories 1 through 4 are as follows: <15, 15-22.5, 22.5-30 and ≥ 30 μgm-3.
Category 1 Category 2 Category 3 Category 4 PM2.5 Parameters Yesterday's FM at Birmingham (µg/m3) 16.6 25.4 31.4 35.8 Yesterday's FM at Atlanta (µg/m3) 16.7 22.1 26.7 28.9 Yesterday's FM at Centreville (µg/m3) 10.2 16.8 22.4 26.4 Surface Meteorological Parameters Max. surface temperature (°C) 21.4 27.4 30.4 29.7 Min. surface temperature (°C) 11.1 16.0 18.8 17.9 Relative humidity (%) 73.8 71.3 70.7 67.5 Surface wind speed (ms-1) 2.1 1.7 1.3 1.2 Surface wind direction (degrees) 207 80 40 341 Persistence 0.8 0.8 0.7 0.7 Station pressure (mb) 1005 1004 1004 1005 Rainfall (inches) 0.2 0.1 0.0 0.0 Rain (# periods) 0.8 0.5 0.3 0.2 Upper-Air Meteorological Parameters Temperature AM 850 mb (°C) 9.9 13.4 14.8 14.1 Temperature PM 850 mb (°C) 10.1 14.0 15.8 14.9 Stability at Birmingham (°C) 0.1 1.6 1.6 2.6 Geopotential height difference 700 mb at Birmingham (m) -0.1 1.7 0.3 4.9 Wind speed yesterday 700 mb at Birmingham (ms-1) 12.7 7.9 6.9 7.5 Wind direction yesterday 700 mb at Birmingham (degrees) 265 287 337 335 Wind speed yesterday 850 mb at Birmingham (ms-1) 268 224 27 344 Wind speed AM 850 mb at Birmingham (ms-1) 10.0 6.7 5.2 5.5 Wind speed PM 850 mb at Birmingham (ms-1) 8.7 6.5 4.9 4.5 Wind direction yesterday 850 mb at Birmingham (degrees) 256 289 0 6 Wind direction AM 850 mb at Birmingham (degrees) 266 241 254 304 Wind direction PM 850 mb at Birmingham (degrees) 268 224 27 344 Recirculation at Birmingham 0.0 0.1 0.2 0.2 Cloud average 1.8 1.6 1.7 1.7

Characterization of Meteorology and Its Relationships to Fine Particulate Mass and Visibility in the VISTAS Region Examination of Relationships between Meteorological and Air Quality Data Using
Classification and Regression Tree (CART) Analysis
ICF International 3-77 VISTAS Meteorological Characterization 06-046 December 8, 2006
Table 3-13e. Summary of Average Input Parameters for Each CART Classification Category: PM2.5 CART Analysis for the SEARCH Site Pensacola.
The ranges in PM2.5 for Categories 1 through 4 are as follows: <15, 15-22.5, 22.5-27.5 and ≥ 27.5 μgm-3.
Category 1 Category 2 Category 3 Category 4 PM2.5 Parameters Yesterday's FM at Gulfport (µg/m3) 9.4 13.9 17.0 20.8 Yesterday's FM at Pensacola (µg/m3) 10.7 16.1 21.0 24.8 Yesterday's FM at New Orleans/Baton Rouge (µg/m3) 12.1 16.8 19.5 21.8 Surface Meteorological Parameters Max. surface temperature (°C) 24.0 24.2 24.7 26.8 Min. surface temperature (°C) 16.1 14.4 14.3 17.2 Relative humidity (%) 79.7 75.4 74.8 73.8 Surface wind speed (ms-1) 1.6 1.2 1.0 0.8 Surface wind direction (degrees) 110 69 37 225 Persistence 0.8 0.7 0.7 0.6 Station pressure (mb) 1019 1020 1021 1019 Rainfall (inches) 0.2 0.1 0.0 0.1 Rain (# periods) 1.0 0.5 0.3 0.4 Upper-Air Meteorological Parameters Temperature AM 850 mb (°C) 12.8 12.4 12.3 13.5 Temperature PM 850 mb (°C) 12.8 12.9 12.7 14.0 Stability at Tallahassee (°C) -0.4 1.1 1.7 1.7 Geopotential height difference 700 mb at Tallahassee (m) -3.2 7.3 8.3 3.0 Wind speed yesterday 700 mb at Slidell (ms-1) 10.6 8.9 7.9 6.2 Wind speed yesterday 700 mb at Tallahassee (ms-1) 10.1 9.2 9.1 7.9 Wind speed yesterday 700 mb at Birmingham (ms-1) 12.1 10.6 9.7 7.5 Wind direction yesterday 700 mb at Slidell (degrees) 259 294 295 312 Wind direction yesterday 700 mb at Tallahassee (degrees) 256 296 309 305 Wind direction yesterday 700 mb at Birmingham (degrees) 261 291 305 299 Wind speed yesterday 850 mb at Slidell (ms-1) 8.1 6.2 6.3 4.5 Wind speed yesterday 850 mb at Tallahassee (ms-1) 7.5 6.2 5.9 5.6 Wind speed yesterday 850 mb at Birmingham (ms-1) 8.6 6.8 6.3 4.9 Wind speed AM 850 mb at Slidell (ms-1) 8.8 6.3 5.8 4.7 Wind speed AM 850 mb at Tallahassee (ms-1) 8.4 6.4 6.0 5.2 Wind speed AM 850 mb at Birmingham (ms-1) 9.9 7.6 6.9 5.0 Wind speed PM 850 mb at Slidell (ms-1) 8.1 6.4 6.1 4.9 Wind speed PM 850 mb at Tallahassee (ms-1) 7.7 5.9 5.5 5.3 Wind speed PM 850 mb at Birmingham (ms-1) 8.6 6.9 6.7 4.9 Wind direction yesterday 850 mb at Slidell (degrees) 250 330 345 349 Wind direction yesterday 850 mb at Tallahassee (degrees) 245 330 340 334 Wind direction yesterday 850 mb at Birmingham (degrees) 242 316 315 337 Wind direction AM 850 mb at Slidell (degrees) 235 260 207 270 Wind direction AM 850 mb at Tallahassee (degrees) 236 277 302 286 Wind direction AM 850 mb at Birmingham (degrees) 253 277 291 294 Wind direction PM 850 mb at Slidell (degrees) 271 279 304 0 Wind direction PM 850 mb at Tallahassee (degrees) 258 312 353 326 Wind direction PM 850 mb at Birmingham (degrees) 265 259 305 302 Cloud average 1.9 1.7 1.5 1.7
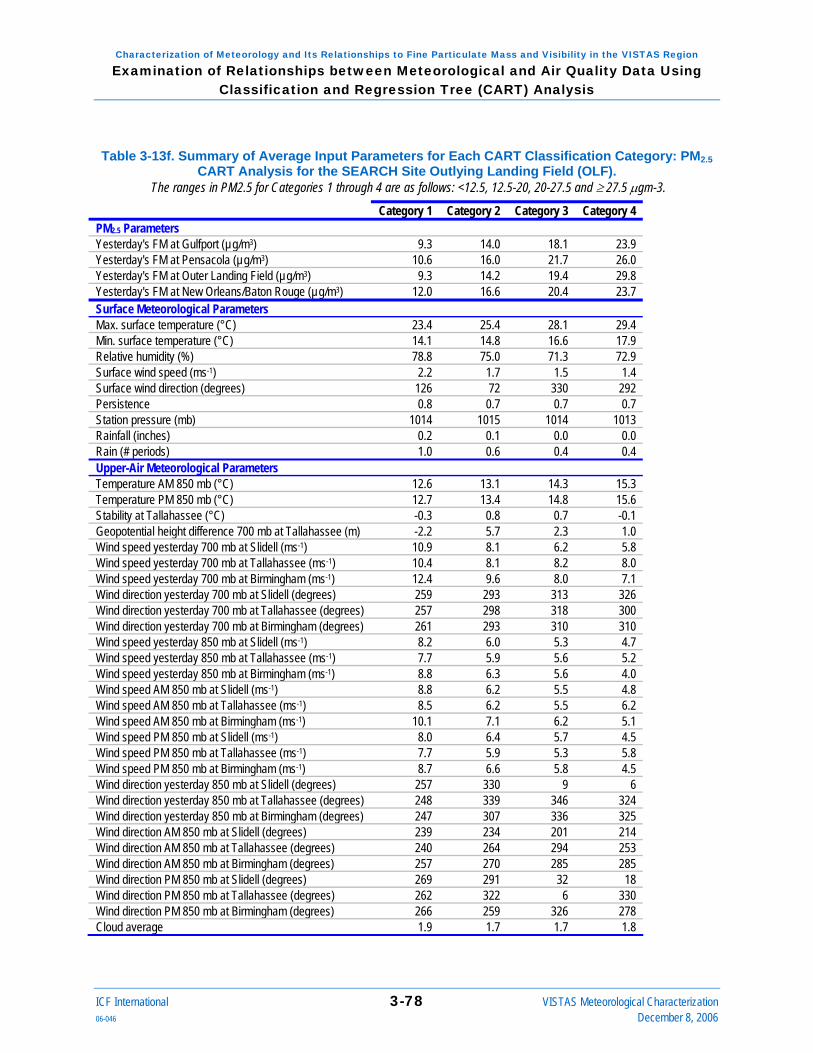
Characterization of Meteorology and Its Relationships to Fine Particulate Mass and Visibility in the VISTAS Region Examination of Relationships between Meteorological and Air Quality Data Using
Classification and Regression Tree (CART) Analysis
ICF International 3-78 VISTAS Meteorological Characterization 06-046 December 8, 2006
Table 3-13f. Summary of Average Input Parameters for Each CART Classification Category: PM2.5 CART Analysis for the SEARCH Site Outlying Landing Field (OLF).
The ranges in PM2.5 for Categories 1 through 4 are as follows: <12.5, 12.5-20, 20-27.5 and ≥ 27.5 μgm-3.
Category 1 Category 2 Category 3 Category 4 PM2.5 Parameters Yesterday's FM at Gulfport (µg/m3) 9.3 14.0 18.1 23.9 Yesterday's FM at Pensacola (µg/m3) 10.6 16.0 21.7 26.0 Yesterday's FM at Outer Landing Field (µg/m3) 9.3 14.2 19.4 29.8 Yesterday's FM at New Orleans/Baton Rouge (µg/m3) 12.0 16.6 20.4 23.7 Surface Meteorological Parameters Max. surface temperature (°C) 23.4 25.4 28.1 29.4 Min. surface temperature (°C) 14.1 14.8 16.6 17.9 Relative humidity (%) 78.8 75.0 71.3 72.9 Surface wind speed (ms-1) 2.2 1.7 1.5 1.4 Surface wind direction (degrees) 126 72 330 292 Persistence 0.8 0.7 0.7 0.7 Station pressure (mb) 1014 1015 1014 1013 Rainfall (inches) 0.2 0.1 0.0 0.0 Rain (# periods) 1.0 0.6 0.4 0.4 Upper-Air Meteorological Parameters Temperature AM 850 mb (°C) 12.6 13.1 14.3 15.3 Temperature PM 850 mb (°C) 12.7 13.4 14.8 15.6 Stability at Tallahassee (°C) -0.3 0.8 0.7 -0.1 Geopotential height difference 700 mb at Tallahassee (m) -2.2 5.7 2.3 1.0 Wind speed yesterday 700 mb at Slidell (ms-1) 10.9 8.1 6.2 5.8 Wind speed yesterday 700 mb at Tallahassee (ms-1) 10.4 8.1 8.2 8.0 Wind speed yesterday 700 mb at Birmingham (ms-1) 12.4 9.6 8.0 7.1 Wind direction yesterday 700 mb at Slidell (degrees) 259 293 313 326 Wind direction yesterday 700 mb at Tallahassee (degrees) 257 298 318 300 Wind direction yesterday 700 mb at Birmingham (degrees) 261 293 310 310 Wind speed yesterday 850 mb at Slidell (ms-1) 8.2 6.0 5.3 4.7 Wind speed yesterday 850 mb at Tallahassee (ms-1) 7.7 5.9 5.6 5.2 Wind speed yesterday 850 mb at Birmingham (ms-1) 8.8 6.3 5.6 4.0 Wind speed AM 850 mb at Slidell (ms-1) 8.8 6.2 5.5 4.8 Wind speed AM 850 mb at Tallahassee (ms-1) 8.5 6.2 5.5 6.2 Wind speed AM 850 mb at Birmingham (ms-1) 10.1 7.1 6.2 5.1 Wind speed PM 850 mb at Slidell (ms-1) 8.0 6.4 5.7 4.5 Wind speed PM 850 mb at Tallahassee (ms-1) 7.7 5.9 5.3 5.8 Wind speed PM 850 mb at Birmingham (ms-1) 8.7 6.6 5.8 4.5 Wind direction yesterday 850 mb at Slidell (degrees) 257 330 9 6 Wind direction yesterday 850 mb at Tallahassee (degrees) 248 339 346 324 Wind direction yesterday 850 mb at Birmingham (degrees) 247 307 336 325 Wind direction AM 850 mb at Slidell (degrees) 239 234 201 214 Wind direction AM 850 mb at Tallahassee (degrees) 240 264 294 253 Wind direction AM 850 mb at Birmingham (degrees) 257 270 285 285 Wind direction PM 850 mb at Slidell (degrees) 269 291 32 18 Wind direction PM 850 mb at Tallahassee (degrees) 262 322 6 330 Wind direction PM 850 mb at Birmingham (degrees) 266 259 326 278 Cloud average 1.9 1.7 1.7 1.8

Characterization of Meteorology and Its Relationships to Fine Particulate Mass and Visibility in the VISTAS Region Examination of Relationships between Meteorological and Air Quality Data Using
Classification and Regression Tree (CART) Analysis
ICF International 3-79 VISTAS Meteorological Characterization 06-046 December 8, 2006
Table 3-13g. Summary of Average Input Parameters for Each CART Classification Category: PM2.5 CART Analysis for the SEARCH Site Gulfport.
The ranges in PM2.5 for Categories 1 through 4 are as follows: <12.5, 12.5-20, 20-25 and ≥ 25 μgm-3.
Category 1 Category 2 Category 3 Category 4 PM2.5 Parameters Yesterday's FM at Gulfport (µg/m3) 9.1 13.9 19.2 23.7 Yesterday's FM at Pensacola (µg/m3) 11.1 16.0 20.8 25.1 Yesterday's FM at New Orleans/Baton Rouge (µg/m3) 11.8 16.4 21.9 25.2 Surface Meteorological Parameters Max. surface temperature (°C) 23.5 26.1 27.0 28.8 Min. surface temperature (°C) 15.1 16.4 16.3 18.3 Relative humidity (%) 78.3 76.0 74.1 72.6 Surface wind speed (ms-1) 2.0 1.5 1.2 1.0 Surface wind direction (degrees) 170 176 195 259 Persistence 0.8 0.7 0.6 0.6 Station pressure (mb) 1017 1017 1018 1017 Rainfall (inches) 0.2 0.1 0.0 0.0 Rain (# periods) 0.9 0.4 0.3 0.3 Upper-Air Meteorological Parameters Temperature AM 850 mb (°C) 11.9 13.2 13.1 13.6 Temperature PM 850 mb (°C) 12.0 13.5 13.5 14.5 Stability at Slidell (°C) -0.2 1.1 2.2 1.5 Geopotential height difference 700 mb at Slidell (m) -0.4 1.7 2.9 0.6 Wind speed yesterday 700 mb at Jacksonville (ms-1) 12.5 9.3 8.1 6.5 Wind speed yesterday 700 mb at Slidell (ms-1) 11.0 8.1 6.7 6.2 Wind direction yesterday 700 mb at Jacksonville (degrees) 262 292 297 325 Wind direction yesterday 700 mb at Slidell (degrees) 257 295 320 340 Wind speed yesterday 850 mb at Jacksonville (ms-1) 9.1 6.4 5.5 5.0 Wind speed yesterday 850 mb at Slidell (ms-1) 8.3 6.0 5.7 5.3 Wind speed AM 850 mb at Jacksonville (ms-1) 10.0 7.2 5.8 4.9 Wind speed AM 850 mb at Slidell (ms-1) 8.9 6.3 5.5 4.6 Wind speed PM 850 mb at Jacksonville (ms-1) 8.9 6.9 5.9 5.0 Wind speed PM 850 mb at Slidell (ms-1) 8.1 6.5 5.6 4.8 Wind direction yesterday 850 mb at Jacksonville (degrees) 244 289 319 0 Wind direction yesterday 850 mb at Slidell (degrees) 248 346 14 7 Wind direction AM 850 mb at Jacksonville (degrees) 254 268 266 294 Wind direction AM 850 mb at Slidell (degrees) 237 245 186 342 Wind direction PM 850 mb at Jacksonville (degrees) 259 244 208 0 Wind direction PM 850 mb at Slidell (degrees) 264 331 342 6 Recirculation at Slidell 0.0 0.1 0.2 0.2 Cloud average 1.9 1.7 1.6 1.7

Characterization of Meteorology and Its Relationships to Fine Particulate Mass and Visibility in the VISTAS Region Examination of Relationships between Meteorological and Air Quality Data Using
Classification and Regression Tree (CART) Analysis
ICF International 3-80 VISTAS Meteorological Characterization 06-046 December 8, 2006
Table 3-13h. Summary of Average Input Parameters for Each CART Classification Category: PM2.5 CART Analysis for the SEARCH Site Oak Grove.
The ranges in PM2.5 for Categories 1 through 4 are as follows: <12.5, 12.5-20, 20-27.5 and ≥ 27.5 μgm-3.
Category 1 Category 2 Category 3 Category 4 PM2.5 Parameters Yesterday's FM at Gulfport (µg/m3) 9.1 14.2 19.3 21.4 Yesterday's FM at Oak Grove (µg/m3) 9.3 14.2 19.7 25.1 Yesterday's FM at Pensacola (µg/m3) 11.1 16.6 21.3 22.9 Yesterday's FM at New Orleans/Baton Rouge (µg/m3) 11.7 16.5 21.6 24.2 Surface Meteorological Parameters Max. surface temperature (°C) 22.6 26.6 28.4 27.3 Min. surface temperature (°C) 12.4 15.1 16.0 16.6 Relative humidity (%) 75.2 72.9 68.0 66.1 Surface wind speed (ms-1) 1.8 1.6 1.2 1.2 Surface wind direction (degrees) 120 111 62 356 Persistence 0.8 0.8 0.7 0.7 Station pressure (mb) 1010 1010 1011 1010 Rainfall (inches) 0.2 0.1 0.0 0.0 Rain (# periods) 0.8 0.5 0.3 0.3 Upper-Air Meteorological Parameters Temperature AM 850 mb (°C) 11.7 13.8 14.2 13.1 Temperature PM 850 mb (°C) 11.8 14.1 14.8 13.9 Stability at Slidell (°C) 0.1 0.6 1.2 1.1 Geopotential height difference 700 mb at Slidell (m) -0.2 1.3 1.7 4.3 Wind speed yesterday 700 mb at Jacksonville (ms-1) 12.5 8.7 7.6 8.5 Wind speed yesterday 700 mb at Slidell (ms-1) 11.0 7.4 6.4 7.6 Wind direction yesterday 700 mb at Jacksonville (degrees) 265 287 301 293 Wind direction yesterday 700 mb at Slidell (degrees) 259 292 333 324 Wind speed yesterday 850 mb at Jacksonville (ms-1) 9.1 6.2 5.3 5.6 Wind speed yesterday 850 mb at Slidell (ms-1) 8.2 5.9 5.3 5.8 Wind speed AM 850 mb at Jacksonville (ms-1) 9.8 7.1 5.4 6.3 Wind speed AM 850 mb at Slidell (ms-1) 8.8 6.2 5.0 5.5 Wind speed PM 850 mb at Jacksonville (ms-1) 8.8 6.8 5.4 5.5 Wind speed PM 850 mb at Slidell (ms-1) 8.0 6.4 5.3 5.2 Wind direction yesterday 850 mb at Jacksonville (degrees) 250 261 337 315 Wind direction yesterday 850 mb at Slidell (degrees) 256 352 17 357 Wind direction AM 850 mb at Jacksonville (degrees) 258 254 254 291 Wind direction AM 850 mb at Slidell (degrees) 242 215 204 263 Wind direction PM 850 mb at Jacksonville (degrees) 261 231 204 306 Wind direction PM 850 mb at Slidell (degrees) 271 276 50 3 Recirculation at Slidell 0.0 0.1 0.2 0.2 Cloud average 1.9 1.8 1.7 1.8
A summary of the characteristics and categorical variations in selected parameters associated with poor visibility for each site follows:
Characterization of Meteorology and Its Relationships to Fine Particulate Mass and Visibility in the VISTAS Region Examination of Relationships between Meteorological and Air Quality Data Using
Classification and Regression Tree (CART) Analysis
ICF International 3-81 VISTAS Meteorological Characterization 06-046 December 8, 2006
For Atlanta, high PM2.5 is associated with
• High PM2.5 on the previous day (local & potentially upwind sites).
• Moderate temperatures.
• Low wind speeds near the surface and aloft.
• Westerly winds aloft and near the surface.
• Stable conditions.
For Yorkville, high PM2.5 is associated with
• Moderate to high temperatures.
• High PM2.5 on the previous day (local & potentially upwind sites).
• Low wind speeds near the surface and aloft.
• Northeasterly winds aloft and easterly winds near the surface.
• Stable conditions.
High PM2.5 for Birmingham is associated with
• Moderate to high temperatures.
• High PM2.5 on the previous day (local & potentially upwind sites).
• Very low wind speeds near the surface and low winds speeds aloft.
• Southwesterly winds aloft and northwesterly winds near the surface.
• Stable conditions.
For Centreville, high PM2.5 is associated with
• High temperatures.
• High PM2.5 on the previous day (local & potentially upwind sites).
• Low wind speeds near the surface and moderate wind speeds aloft.
• West-northwesterly winds aloft and northwesterly winds near the surface.
• Stable conditions.
For Pensacola, high PM2.5 is associated with
• Moderate temperatures.
• High PM2.5 on the previous day (local & potentially upwind sites).
• Low wind speeds near the surface and aloft.
• Westerly winds aloft and southwesterly winds near the surface.
• Stable conditions.
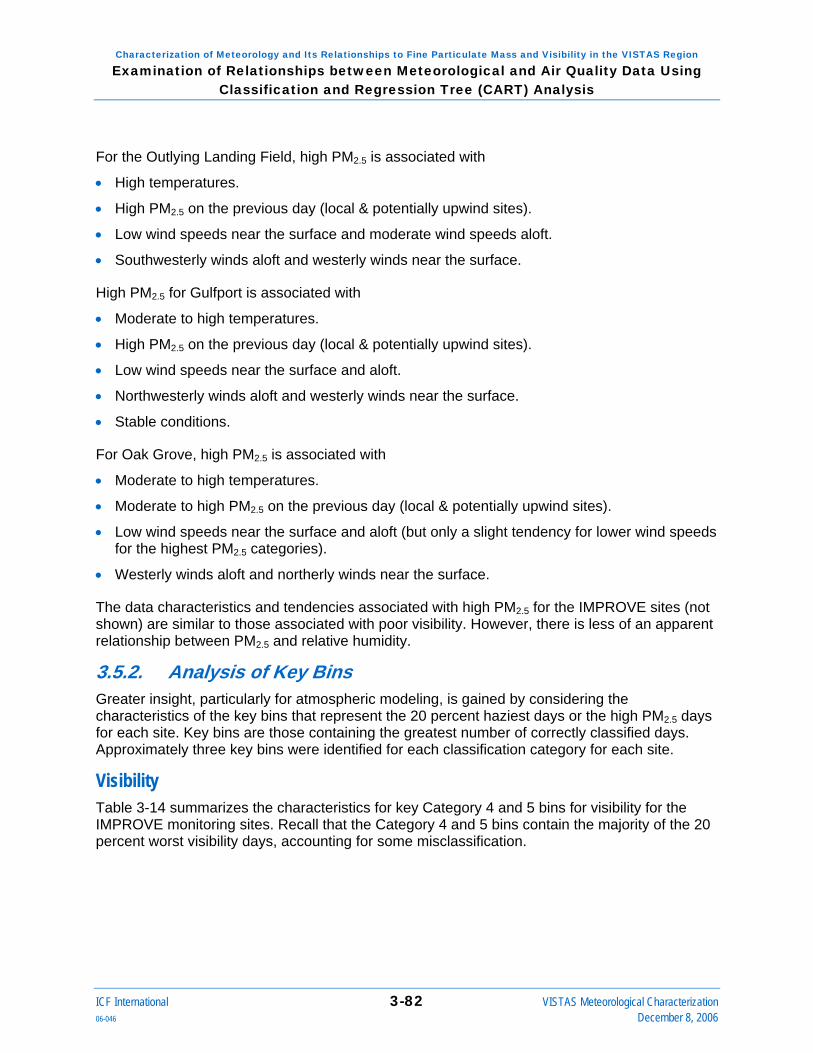
Characterization of Meteorology and Its Relationships to Fine Particulate Mass and Visibility in the VISTAS Region Examination of Relationships between Meteorological and Air Quality Data Using
Classification and Regression Tree (CART) Analysis
ICF International 3-82 VISTAS Meteorological Characterization 06-046 December 8, 2006
For the Outlying Landing Field, high PM2.5 is associated with
• High temperatures.
• High PM2.5 on the previous day (local & potentially upwind sites).
• Low wind speeds near the surface and moderate wind speeds aloft.
• Southwesterly winds aloft and westerly winds near the surface.
High PM2.5 for Gulfport is associated with
• Moderate to high temperatures.
• High PM2.5 on the previous day (local & potentially upwind sites).
• Low wind speeds near the surface and aloft.
• Northwesterly winds aloft and westerly winds near the surface.
• Stable conditions.
For Oak Grove, high PM2.5 is associated with
• Moderate to high temperatures.
• Moderate to high PM2.5 on the previous day (local & potentially upwind sites).
• Low wind speeds near the surface and aloft (but only a slight tendency for lower wind speeds for the highest PM2.5 categories).
• Westerly winds aloft and northerly winds near the surface.
The data characteristics and tendencies associated with high PM2.5 for the IMPROVE sites (not shown) are similar to those associated with poor visibility. However, there is less of an apparent relationship between PM2.5 and relative humidity.
3.5.2. Analysis of Key Bins Greater insight, particularly for atmospheric modeling, is gained by considering the characteristics of the key bins that represent the 20 percent haziest days or the high PM2.5 days for each site. Key bins are those containing the greatest number of correctly classified days. Approximately three key bins were identified for each classification category for each site.
Visibility Table 3-14 summarizes the characteristics for key Category 4 and 5 bins for visibility for the IMPROVE monitoring sites. Recall that the Category 4 and 5 bins contain the majority of the 20 percent worst visibility days, accounting for some misclassification.

Characterization of Meteorology and Its Relationships to Fine Particulate Mass and Visibility in the VISTAS Region Examination of Relationships between Meteorological and Air Quality Data Using
Classification and Regression Tree (CART) Analysis
ICF International 3-83 VISTAS Meteorological Characterization 06-046 December 8, 2006
Table 3-14a. Summary of Average Input Parameters for Key Bins for CART Classification Categories 4 and 5: Visibility CART Analysis for the IMPROVE Site Breton.
The ranges in extinction coefficient for Categories 4 and 5 are 105-135 and ≥ 135 Mm-1.
Class 4 Class 5 Bin 31 Bin 33 Visibility Parameters Yesterday's FM at New Orleans/Baton Rouge (µg/m3) 16.7 31.9 Yesterday's FM at Gulfport (µg/m3) 16.7 26.5 Yesterday’s FM at Pensacola (µg/m3) 19.5 25.8 Surface Meteorological Parameters Max. surface temperature (°C) 24.2 21.8 Min. surface temperature (°C) 17.0 12.5 Relative humidity (%) 80.9 86.2 Surface wind speed (ms-1) 3.4 1.8 Surface wind direction (degrees) 101 360 Persistence 1.0 0.8 Sea level pressure (mb) 1020 1022 Rainfall (inches) 0.0 0.0 Rain (# periods) 0.3 0.8 Upper-Air Meteorological Parameters Temperature AM 850 mb (°C) 12.4 9.1 Temperature PM 850 mb (°C) 13.1 9.8 Stability at Slidell (°C) 1.4 3.0 Geopotential height difference 700 mb at Slidell (m) 11.7 -2.8 Wind speed yesterday 700 mb at Slidell (ms-1) 7.6 8.0 Wind direction yesterday 700 mb at Slidell (degrees) 304 288 Wind speed yesterday 850 mb at Slidell (ms-1) 6.7 6.7 Wind speed AM 850 mb at Slidell (ms-1) 6.7 6.2 Wind speed PM 850 mb at Slidell (ms-1) 6.1 7.1 Wind direction yesterday 850 mb at Slidell (degrees) 315 270 Wind direction AM 850 mb at Slidell (degrees) 288 315 Wind direction PM 850 mb at Slidell (degrees) 243 45 Recirculation at Slidell 0.1 0.0 Cloud average 1.5 1.7

Characterization of Meteorology and Its Relationships to Fine Particulate Mass and Visibility in the VISTAS Region Examination of Relationships between Meteorological and Air Quality Data Using
Classification and Regression Tree (CART) Analysis
ICF International 3-84 VISTAS Meteorological Characterization 06-046 December 8, 2006
Table 3-14b. Summary of Average Input Parameters for Key Bins for CART Classification Categories 4 and 5: Visibility CART Analysis for the IMPROVE Site Brigantine.
The ranges in extinction coefficient for Categories 4 and 5 are 135-225 and ≥ 225 Mm-1.
Class 4 Class 5 Bin 24 Bin 25 Bin 16 Bin 26 Bin 27 Bin 22 Visibility Parameters Yesterday's FM at Wilmington (µg/m3) 20.4 20.9 22.3 39.7 33.3 19.3 Yesterday's FM at New Orleans (µg/m3) 21.5 15.7 21.3 29.3 31.4 20.8 Yesterday's FM at Philadelphia (µg/m3) 19.2 19.7 21.2 37.7 32.8 17.8 Surface Meteorological Parameters Max. surface temperature (°C) 20.8 9.3 29.3 23.9 16.9 13.9 Min. surface temperature (°C) 11.4 0.3 18.0 14.6 9.4 10.0 Relative humidity (%) 82.8 87.2 67.8 78.9 87.3 96.5 Surface wind speed (ms-1) 0.8 0.7 0.8 0.7 0.7 0.9 Surface wind direction (degrees) 1022 1023 1018 1020 1016 1015 Persistence 2.2 2.2 2.7 2.2 2.8 2.4 Sea level pressure (mb) 162 27 252 180 n/a 108 Rainfall (inches) 0.1 0.1 0.0 0.0 0.6 0.1 Rain (# periods) 0.9 1.1 0.6 1.0 2.0 1.5 Upper-Air Meteorological Parameters Temperature AM 850 mb (°C) 9.1 0.5 14.0 11.5 9.5 8.6 Temperature PM 850 mb (°C) 10.5 -0.1 14.0 12.1 6.9 7.7 Stability at Brookhaven (°C) -0.1 -1.5 -0.6 -1.6 0.9 -2.0 Geopotential height difference 700 mb at Brookhaven (m) 10.7 3.1 -7.3 10.1 -34.5 -6.4 Wind speed yesterday 700 mb at Brookhaven (ms-1) 10.2 21.8 10.2 13.4 14.9 14.3 Wind speed yesterday 700 mb at Dulles (ms-1) 9.5 18.6 9.0 12.1 21.1 12.2 Wind direction yesterday 700 mb at Brookhaven (degrees) 285 270 270 270 270 297 Wind direction yesterday 700 mb at Dulles (degrees) 270 270 281 270 270 270 Wind speed yesterday 850 mb at Brookhaven (ms-1) 7.2 11.7 8.4 10.8 13.8 9.6 Wind speed yesterday 850 mb at Dulles (ms-1) 5.6 11.1 6.6 8.1 13.4 8.8 Wind speed AM 850 mb at Brookhaven (ms-1) 7.5 11.6 8.2 8.0 18.3 9.4 Wind speed AM 850 mb at Dulles (ms-1) 8.1 12.1 6.9 5.8 16.5 8.7 Wind speed PM 850 mb at Brookhaven (ms-1) 9.1 11.0 9.4 8.1 7.2 8.7 Wind speed PM 850 mb at Dulles (ms-1) 9.2 13.3 7.4 6.3 15.9 13.9 Wind direction yesterday 850 mb at Brookhaven (degrees) 287 261 262 277 270 281 Wind direction yesterday 850 mb at Dulles (degrees) 255 270 236 270 270 281 Wind direction AM 850 mb at Brookhaven (degrees) 255 270 270 297 270 288 Wind direction AM 850 mb at Dulles (degrees) 243 270 293 292 270 281 Wind direction PM 850 mb at Brookhaven (degrees) 265 297 278 297 270 270 Wind direction PM 850 mb at Dulles (degrees) 253 262 307 270 270 297 Cloud average 2.0 1.9 1.7 2.1 2.0 2.2

Characterization of Meteorology and Its Relationships to Fine Particulate Mass and Visibility in the VISTAS Region Examination of Relationships between Meteorological and Air Quality Data Using
Classification and Regression Tree (CART) Analysis
ICF International 3-85 VISTAS Meteorological Characterization 06-046 December 8, 2006
Table 3-14c. Summary of Average Input Parameters for Key Bins for CART Classification Categories 4 and 5: Visibility CART Analysis for the IMPROVE Site Cadiz.
The ranges in extinction coefficient for Categories 4 and 5 are 155-230 and ≥ 230 Mm-1.
Class 4 Class 5 Bin 18 Bin 25 Bin 22 Bin 31 Bin 32 Bin 29 Visibility Parameters Yesterday's FM at Nashville (µg/m3) 19.6 21.8 14.4 18.2 22.9 7.9 Yesterday's FM at St. Louis (µg/m3) 14.3 26.3 13.5 22.5 28.8 22.1 Yesterday's FM at Louisville (µg/m3) 22.6 27.8 15.3 19.1 33.0 16.0 Surface Meteorological Parameters Max. surface temperature (°C) 27.1 26.5 15.0 16.2 23.3 9.5 Min. surface temperature (°C) 18.4 17.3 8.3 9.1 15.5 4.0 Relative humidity (%) 83.3 86.0 96.8 83.5 88.1 90.8 Surface wind speed (ms-1) 1.2 1.5 1.8 1.8 1.5 1.7 Surface wind direction (degrees) 315 146 135 0 180 346 Persistence 0.7 0.8 0.8 0.8 0.7 0.8 Rainfall (inches) 0.2 0.2 0.2 0.0 0.1 0.1 Rain (# periods) 0.7 0.6 1.5 0.4 0.6 0.8 Solar radiation (W/m2) 537 511 351 457 558 352 Upper-Air Meteorological Parameters Temperature AM 850 mb (°C) 15.8 15.1 8.4 8.5 14.5 1.8 Temperature PM 850 mb (°C) 16.5 16.0 7.9 8.3 13.5 4.6 Stability at Nashville (°C) -0.3 0.4 -2.0 -1.3 0.3 -3.5 Geopotential height difference 700 mb at Nashville (m) -16.0 6.7 -22.8 -2.3 -0.5 9.5 Wind speed yesterday 700 mb at Nashville (ms-1) 7.1 4.4 12.9 14.6 12.0 17.4 Wind direction yesterday 700 mb at Nashville (degrees) 297 198 243 256 270 236 Wind speed yesterday 850 mb at Nashville (ms-1) 5.8 4.6 7.6 8.5 6.0 14.1 Wind speed AM 850 mb at Nashville (ms-1) 5.3 6.4 10.2 6.6 8.2 10.4 Wind speed PM 850 mb at Nashville (ms-1) 4.9 6.9 9.0 6.1 6.6 6.0 Wind direction yesterday 850 mb at Nashville (degrees) 321 169 252 315 256 256 Wind direction AM 850 mb at Nashville (degrees) 321 180 225 307 236 304 Wind direction PM 850 mb at Nashville (degrees) 315 172 259 333 243 270 Recirculation at Nashville 0.1 0.1 0.1 0.0 0.0 0.0 Cloud average 1.8 2.1 2.1 1.7 2.1 1.8
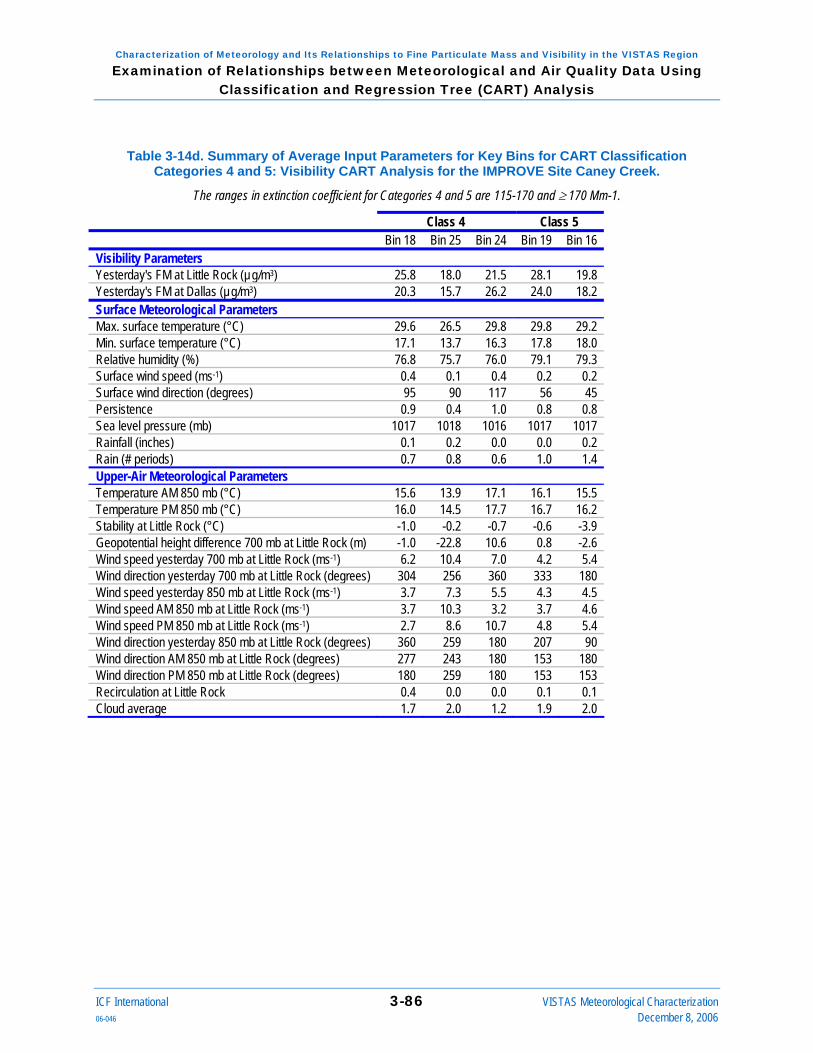
Characterization of Meteorology and Its Relationships to Fine Particulate Mass and Visibility in the VISTAS Region Examination of Relationships between Meteorological and Air Quality Data Using
Classification and Regression Tree (CART) Analysis
ICF International 3-86 VISTAS Meteorological Characterization 06-046 December 8, 2006
Table 3-14d. Summary of Average Input Parameters for Key Bins for CART Classification Categories 4 and 5: Visibility CART Analysis for the IMPROVE Site Caney Creek.
The ranges in extinction coefficient for Categories 4 and 5 are 115-170 and ≥ 170 Mm-1.
Class 4 Class 5 Bin 18 Bin 25 Bin 24 Bin 19 Bin 16 Visibility Parameters Yesterday's FM at Little Rock (µg/m3) 25.8 18.0 21.5 28.1 19.8 Yesterday's FM at Dallas (µg/m3) 20.3 15.7 26.2 24.0 18.2 Surface Meteorological Parameters Max. surface temperature (°C) 29.6 26.5 29.8 29.8 29.2 Min. surface temperature (°C) 17.1 13.7 16.3 17.8 18.0 Relative humidity (%) 76.8 75.7 76.0 79.1 79.3 Surface wind speed (ms-1) 0.4 0.1 0.4 0.2 0.2 Surface wind direction (degrees) 95 90 117 56 45 Persistence 0.9 0.4 1.0 0.8 0.8 Sea level pressure (mb) 1017 1018 1016 1017 1017 Rainfall (inches) 0.1 0.2 0.0 0.0 0.2 Rain (# periods) 0.7 0.8 0.6 1.0 1.4 Upper-Air Meteorological Parameters Temperature AM 850 mb (°C) 15.6 13.9 17.1 16.1 15.5 Temperature PM 850 mb (°C) 16.0 14.5 17.7 16.7 16.2 Stability at Little Rock (°C) -1.0 -0.2 -0.7 -0.6 -3.9 Geopotential height difference 700 mb at Little Rock (m) -1.0 -22.8 10.6 0.8 -2.6 Wind speed yesterday 700 mb at Little Rock (ms-1) 6.2 10.4 7.0 4.2 5.4 Wind direction yesterday 700 mb at Little Rock (degrees) 304 256 360 333 180 Wind speed yesterday 850 mb at Little Rock (ms-1) 3.7 7.3 5.5 4.3 4.5 Wind speed AM 850 mb at Little Rock (ms-1) 3.7 10.3 3.2 3.7 4.6 Wind speed PM 850 mb at Little Rock (ms-1) 2.7 8.6 10.7 4.8 5.4 Wind direction yesterday 850 mb at Little Rock (degrees) 360 259 180 207 90 Wind direction AM 850 mb at Little Rock (degrees) 277 243 180 153 180 Wind direction PM 850 mb at Little Rock (degrees) 180 259 180 153 153 Recirculation at Little Rock 0.4 0.0 0.0 0.1 0.1 Cloud average 1.7 2.0 1.2 1.9 2.0

Characterization of Meteorology and Its Relationships to Fine Particulate Mass and Visibility in the VISTAS Region Examination of Relationships between Meteorological and Air Quality Data Using
Classification and Regression Tree (CART) Analysis
ICF International 3-87 VISTAS Meteorological Characterization 06-046 December 8, 2006
Table 3-14e. Summary of Average Input Parameters for Key Bins for CART Classification Categories 4 and 5: Visibility CART Analysis for the IMPROVE Site Cape Romain.
The ranges in extinction coefficient for Categories 4 and 5 are 110-160 and ≥ 160 Mm-1.
Class 4 Class 5 Bin 33 Bin 21 Bin 17 Bin 27 Bin 32 Visibility Parameters Yesterday's FM at Charleston (µg/m3) 24.1 12.8 14.3 15.9 23.7 Surface Meteorological Parameters Max. surface temperature (°C) 30.8 25.7 24.6 24.0 27.6 Min. surface temperature (°C) 21.6 14.8 14.3 12.7 18.2 Relative humidity (%) 76.6 83.1 80.2 77.7 81.8 Surface wind speed (ms-1) 3.0 2.2 1.9 3.1 1.4 Surface wind direction (degrees) 198 0 76 121 158 Persistence 0.9 0.8 0.7 0.9 0.5 Sea level pressure (mb) 1018 1021 1022 1023 1018 Rainfall (inches) 0.0 0.0 0.1 0.0 0.2 Rain (# periods) 0.4 0.9 0.9 0.3 0.9 Upper-Air Meteorological Parameters Temperature AM 850 mb (°C) 16.5 12.5 12.4 11.6 14.5 Temperature PM 850 mb (°C) 16.8 14.3 13.4 12.4 15.2 Stability at Charleston (°C) -2.0 0.6 0.1 0.5 -0.9 Geopotential height difference 700 mb at Charleston (m) -3.7 3.6 45.6 28.2 -4.3 Wind speed yesterday 700 mb at Charleston (ms-1) 7.2 7.7 7.9 6.9 9.2 Wind direction yesterday 700 mb at Charleston (degrees) 323 279 301 315 301 Wind speed yesterday 850 mb at Charleston (ms-1) 6.4 3.7 4.2 4.5 7.6 Wind speed AM 850 mb at Charleston (ms-1) 6.6 6.9 2.0 4.7 8.0 Wind speed PM 850 mb at Charleston (ms-1) 7.7 5.7 4.0 3.7 7.6 Wind direction yesterday 850 mb at Charleston (degrees) 338 270 11 0 285 Wind direction AM 850 mb at Charleston (degrees) 315 292 309 143 279 Wind direction PM 850 mb at Charleston (degrees) 315 323 342 180 297 Recirculation at Charleston 0.0 0.1 0.3 0.3 0.1 Cloud average 1.8 1.6 1.8 1.9 2.0
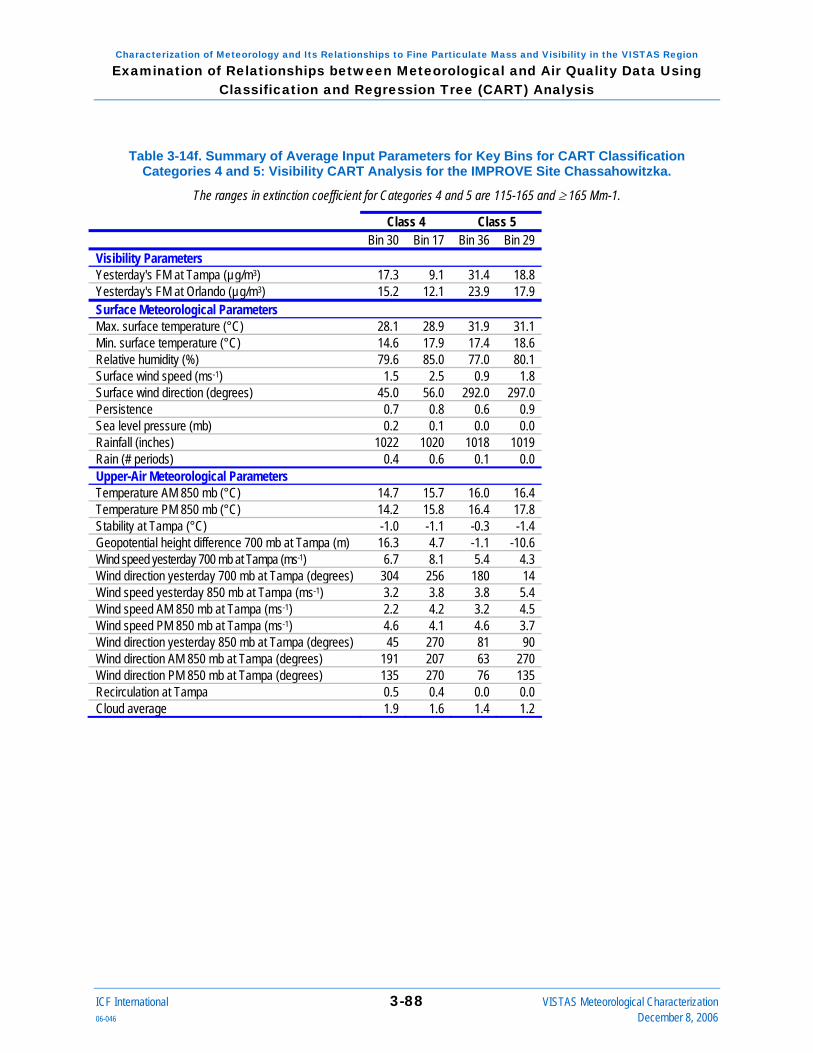
Characterization of Meteorology and Its Relationships to Fine Particulate Mass and Visibility in the VISTAS Region Examination of Relationships between Meteorological and Air Quality Data Using
Classification and Regression Tree (CART) Analysis
ICF International 3-88 VISTAS Meteorological Characterization 06-046 December 8, 2006
Table 3-14f. Summary of Average Input Parameters for Key Bins for CART Classification Categories 4 and 5: Visibility CART Analysis for the IMPROVE Site Chassahowitzka.
The ranges in extinction coefficient for Categories 4 and 5 are 115-165 and ≥ 165 Mm-1.
Class 4 Class 5 Bin 30 Bin 17 Bin 36 Bin 29 Visibility Parameters Yesterday's FM at Tampa (µg/m3) 17.3 9.1 31.4 18.8 Yesterday's FM at Orlando (µg/m3) 15.2 12.1 23.9 17.9 Surface Meteorological Parameters Max. surface temperature (°C) 28.1 28.9 31.9 31.1 Min. surface temperature (°C) 14.6 17.9 17.4 18.6 Relative humidity (%) 79.6 85.0 77.0 80.1 Surface wind speed (ms-1) 1.5 2.5 0.9 1.8 Surface wind direction (degrees) 45.0 56.0 292.0 297.0 Persistence 0.7 0.8 0.6 0.9 Sea level pressure (mb) 0.2 0.1 0.0 0.0 Rainfall (inches) 1022 1020 1018 1019 Rain (# periods) 0.4 0.6 0.1 0.0 Upper-Air Meteorological Parameters Temperature AM 850 mb (°C) 14.7 15.7 16.0 16.4 Temperature PM 850 mb (°C) 14.2 15.8 16.4 17.8 Stability at Tampa (°C) -1.0 -1.1 -0.3 -1.4 Geopotential height difference 700 mb at Tampa (m) 16.3 4.7 -1.1 -10.6 Wind speed yesterday 700 mb at Tampa (ms-1) 6.7 8.1 5.4 4.3 Wind direction yesterday 700 mb at Tampa (degrees) 304 256 180 14 Wind speed yesterday 850 mb at Tampa (ms-1) 3.2 3.8 3.8 5.4 Wind speed AM 850 mb at Tampa (ms-1) 2.2 4.2 3.2 4.5 Wind speed PM 850 mb at Tampa (ms-1) 4.6 4.1 4.6 3.7 Wind direction yesterday 850 mb at Tampa (degrees) 45 270 81 90 Wind direction AM 850 mb at Tampa (degrees) 191 207 63 270 Wind direction PM 850 mb at Tampa (degrees) 135 270 76 135 Recirculation at Tampa 0.5 0.4 0.0 0.0 Cloud average 1.9 1.6 1.4 1.2

Characterization of Meteorology and Its Relationships to Fine Particulate Mass and Visibility in the VISTAS Region Examination of Relationships between Meteorological and Air Quality Data Using
Classification and Regression Tree (CART) Analysis
ICF International 3-89 VISTAS Meteorological Characterization 06-046 December 8, 2006
Table 3-14g. Summary of Average Input Parameters for Key Bins for CART Classification Categories 4 and 5: Visibility CART Analysis for the IMPROVE Site Cohutta.
The ranges in extinction coefficient for Categories 4 and 5 are 135-220 and ≥ 220 Mm-1.
Class 4 Class 5 Bin 27 Bin 19 Bin 22 Bin 28 Visibility Parameters Yesterday's FM at Birmingham (µg/m3) 29.6 35.4 18.4 32.4 Yesterday's FM at Atlanta (µg/m3) 22.3 39.3 18.3 33.2 Yesterday's FM at Nashville (µg/m3) 23.2 19.3 13.8 27.8 Yesterday's FM at Knoxville (µg/m3) 21.9 27.2 18.8 37.9 Surface Meteorological Parameters Max. surface temperature (°C) 31.6 28.1 31.0 32.9 Min. surface temperature (°C) 20.3 8.1 21.9 20.3 Relative humidity (%) 73.2 71.7 72.3 76.7 Surface wind speed (ms-1) 1.5 1.3 0.5 0.5 Surface wind direction (degrees) 360 360 180 180 Persistence 1.0 0.7 0.4 0.6 Rainfall (inches) 0.2 0.0 0.2 0.0 Rain (# periods) 0.7 0.2 1.0 0.3 Upper-Air Meteorological Parameters Temperature AM 850 mb (°C) 17.1 13.6 16.3 17.6 Temperature PM 850 mb (°C) 17.9 13.8 17.2 18.6 Stability at Atlanta (°C) 1.0 5.0 -0.9 1.7 Geopotential height difference 700 mb at Atlanta (m) 10.7 -6.5 24.9 -1.8 Wind speed yesterday 700 mb at Atlanta (ms-1) 4.8 6.6 7.4 4.3 Wind direction yesterday 700 mb at Atlanta (degrees) 323 281 256 101 Wind speed yesterday 850 mb at Atlanta (ms-1) 4.1 4.2 4.9 3.3 Wind speed AM 850 mb at Atlanta (ms-1) 4.5 5.4 4.1 4.1 Wind speed PM 850 mb at Atlanta (ms-1) 5.4 6.0 3.3 4.4 Wind direction yesterday 850 mb at Atlanta (degrees) 292 281 243 63 Wind direction AM 850 mb at Atlanta (degrees) 256 297 236 270 Wind direction PM 850 mb at Atlanta (degrees) 360 259 214 135 Recirculation at Atlanta 0.2 0.2 0.6 0.3 Cloud average 2.0 1.5 2.2 1.7
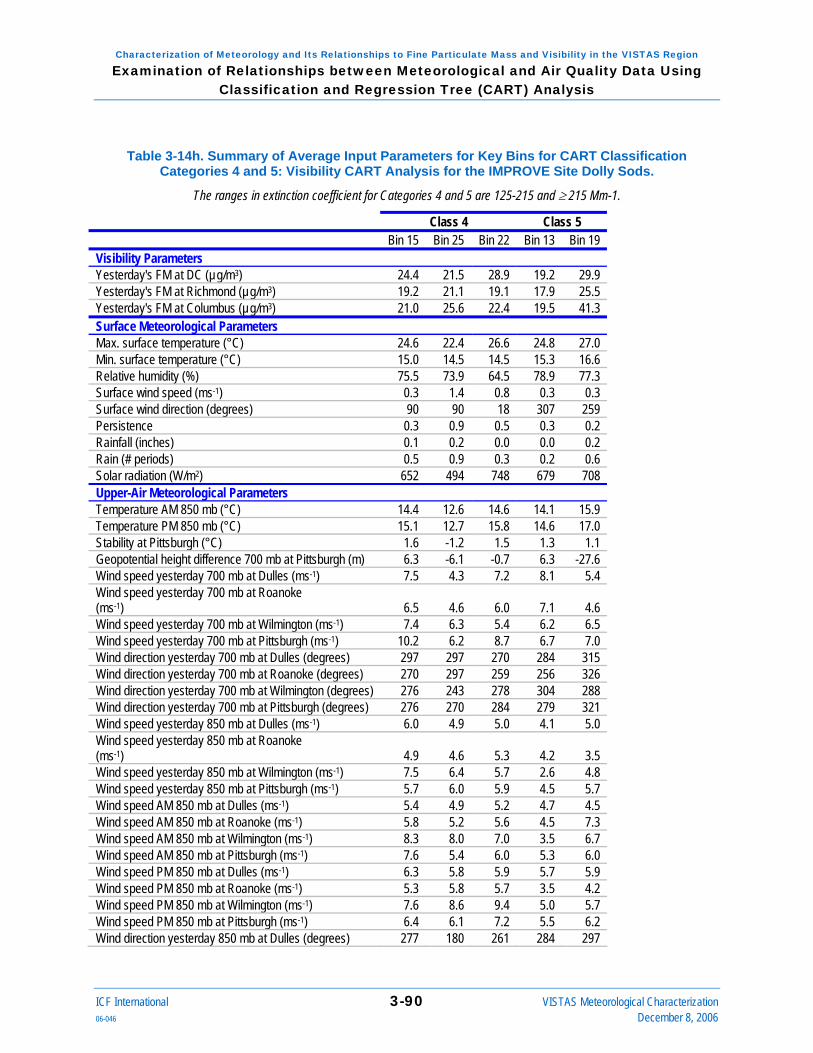
Characterization of Meteorology and Its Relationships to Fine Particulate Mass and Visibility in the VISTAS Region Examination of Relationships between Meteorological and Air Quality Data Using
Classification and Regression Tree (CART) Analysis
ICF International 3-90 VISTAS Meteorological Characterization 06-046 December 8, 2006
Table 3-14h. Summary of Average Input Parameters for Key Bins for CART Classification Categories 4 and 5: Visibility CART Analysis for the IMPROVE Site Dolly Sods.
The ranges in extinction coefficient for Categories 4 and 5 are 125-215 and ≥ 215 Mm-1.
Class 4 Class 5 Bin 15 Bin 25 Bin 22 Bin 13 Bin 19 Visibility Parameters Yesterday's FM at DC (µg/m3) 24.4 21.5 28.9 19.2 29.9 Yesterday's FM at Richmond (µg/m3) 19.2 21.1 19.1 17.9 25.5 Yesterday's FM at Columbus (µg/m3) 21.0 25.6 22.4 19.5 41.3 Surface Meteorological Parameters Max. surface temperature (°C) 24.6 22.4 26.6 24.8 27.0 Min. surface temperature (°C) 15.0 14.5 14.5 15.3 16.6 Relative humidity (%) 75.5 73.9 64.5 78.9 77.3 Surface wind speed (ms-1) 0.3 1.4 0.8 0.3 0.3 Surface wind direction (degrees) 90 90 18 307 259 Persistence 0.3 0.9 0.5 0.3 0.2 Rainfall (inches) 0.1 0.2 0.0 0.0 0.2 Rain (# periods) 0.5 0.9 0.3 0.2 0.6 Solar radiation (W/m2) 652 494 748 679 708 Upper-Air Meteorological Parameters Temperature AM 850 mb (°C) 14.4 12.6 14.6 14.1 15.9 Temperature PM 850 mb (°C) 15.1 12.7 15.8 14.6 17.0 Stability at Pittsburgh (°C) 1.6 -1.2 1.5 1.3 1.1 Geopotential height difference 700 mb at Pittsburgh (m) 6.3 -6.1 -0.7 6.3 -27.6 Wind speed yesterday 700 mb at Dulles (ms-1) 7.5 4.3 7.2 8.1 5.4 Wind speed yesterday 700 mb at Roanoke (ms-1) 6.5 4.6 6.0 7.1 4.6 Wind speed yesterday 700 mb at Wilmington (ms-1) 7.4 6.3 5.4 6.2 6.5 Wind speed yesterday 700 mb at Pittsburgh (ms-1) 10.2 6.2 8.7 6.7 7.0 Wind direction yesterday 700 mb at Dulles (degrees) 297 297 270 284 315 Wind direction yesterday 700 mb at Roanoke (degrees) 270 297 259 256 326 Wind direction yesterday 700 mb at Wilmington (degrees) 276 243 278 304 288 Wind direction yesterday 700 mb at Pittsburgh (degrees) 276 270 284 279 321 Wind speed yesterday 850 mb at Dulles (ms-1) 6.0 4.9 5.0 4.1 5.0 Wind speed yesterday 850 mb at Roanoke (ms-1) 4.9 4.6 5.3 4.2 3.5 Wind speed yesterday 850 mb at Wilmington (ms-1) 7.5 6.4 5.7 2.6 4.8 Wind speed yesterday 850 mb at Pittsburgh (ms-1) 5.7 6.0 5.9 4.5 5.7 Wind speed AM 850 mb at Dulles (ms-1) 5.4 4.9 5.2 4.7 4.5 Wind speed AM 850 mb at Roanoke (ms-1) 5.8 5.2 5.6 4.5 7.3 Wind speed AM 850 mb at Wilmington (ms-1) 8.3 8.0 7.0 3.5 6.7 Wind speed AM 850 mb at Pittsburgh (ms-1) 7.6 5.4 6.0 5.3 6.0 Wind speed PM 850 mb at Dulles (ms-1) 6.3 5.8 5.9 5.7 5.9 Wind speed PM 850 mb at Roanoke (ms-1) 5.3 5.8 5.7 3.5 4.2 Wind speed PM 850 mb at Wilmington (ms-1) 7.6 8.6 9.4 5.0 5.7 Wind speed PM 850 mb at Pittsburgh (ms-1) 6.4 6.1 7.2 5.5 6.2 Wind direction yesterday 850 mb at Dulles (degrees) 277 180 261 284 297

Characterization of Meteorology and Its Relationships to Fine Particulate Mass and Visibility in the VISTAS Region Examination of Relationships between Meteorological and Air Quality Data Using
Classification and Regression Tree (CART) Analysis
ICF International 3-91 VISTAS Meteorological Characterization 06-046 December 8, 2006
Class 4 Class 5 Bin 15 Bin 25 Bin 22 Bin 13 Bin 19 Wind direction yesterday 850 mb at Roanoke (degrees) 292 207 207 243 342 Wind direction yesterday 850 mb at Wilmington (degrees) 264 225 252 180 252 Wind direction yesterday 850 mb at Pittsburgh (degrees) 277 270 278 0 279 Wind direction AM 850 mb at Dulles (degrees) 239 90 270 256 286 Wind direction AM 850 mb at Roanoke (degrees) 259 135 225 180 278 Wind direction AM 850 mb at Wilmington (degrees) 260 297 270 252 291 Wind direction AM 850 mb at Pittsburgh (degrees) 270 270 293 270 291 Wind direction PM 850 mb at Dulles (degrees) 256 117 214 270 293 Wind direction PM 850 mb at Roanoke (degrees) 247 90 180 117 323 Wind direction PM 850 mb at Wilmington (degrees) 241 315 243 180 304 Wind direction PM 850 mb at Pittsburgh (degrees) 249 207 243 207 288 Cloud average 2.0 2.0 1.8 2.0 2.0

Characterization of Meteorology and Its Relationships to Fine Particulate Mass and Visibility in the VISTAS Region Examination of Relationships between Meteorological and Air Quality Data Using
Classification and Regression Tree (CART) Analysis
ICF International 3-92 VISTAS Meteorological Characterization 06-046 December 8, 2006
Table 3-14i. Summary of Average Input Parameters for Key Bins for CART Classification Categories 4 and 5: Visibility CART Analysis for the IMPROVE Site Everglades.
The ranges in extinction coefficient for Categories 4 and 5 are 80-120 and ≥ 120 Mm-1.
Class 4 Class 5 Bin 22 Bin 24 Bin 36 Visibility Parameters Yesterday's FM at Palm Beach (µg/m3) 11.9 10.8 16.2 Yesterday's FM at Ft. Lauderdale (µg/m3) 12.2 9.5 16.2 Surface Meteorological Parameters Max. surface temperature (°C) 25.0 28.6 28.1 Min. surface temperature (°C) 13.8 18.8 19.5 Relative humidity (%) 71.4 79.9 80.8 Surface wind speed (ms-1) 1.5 1.6 1.4 Surface wind direction (degrees) 15 63 59 Persistence 0.8 0.8 0.7 Rainfall (inches) 0.0 0.0 0.0 Rain (# periods) 0.2 0.4 0.3 Solar radiation (W/m2) 704 633 635 Upper-Air Meteorological Parameters Temperature AM 850 mb (°C) 11.0 14.4 14.8 Temperature PM 850 mb (°C) 11.0 14.6 15.3 Stability at Miami (°C) -2.4 -3.4 -3.4 Geopotential height difference 700 mb at Miami (m) 2.3 -6.4 -0.1 Wind speed yesterday 700 mb at Miami (ms-1) 8.8 3.4 7.6 Wind direction yesterday 700 mb at Miami (degrees) 295 270 302 Wind speed yesterday 850 mb at Miami (ms-1) 6.0 4.8 6.1 Wind speed AM 850 mb at Miami (ms-1) 6.5 5.4 5.3 Wind speed PM 850 mb at Miami (ms-1) 5.8 6.3 5.4 Wind direction yesterday 850 mb at Miami (degrees) 350 292 320 Wind direction AM 850 mb at Miami (degrees) 349 259 225 Wind direction PM 850 mb at Miami (degrees) 31 297 338 Recirculation at Miami 0.1 0.3 0.1 Cloud average 1.6 1.6 1.5
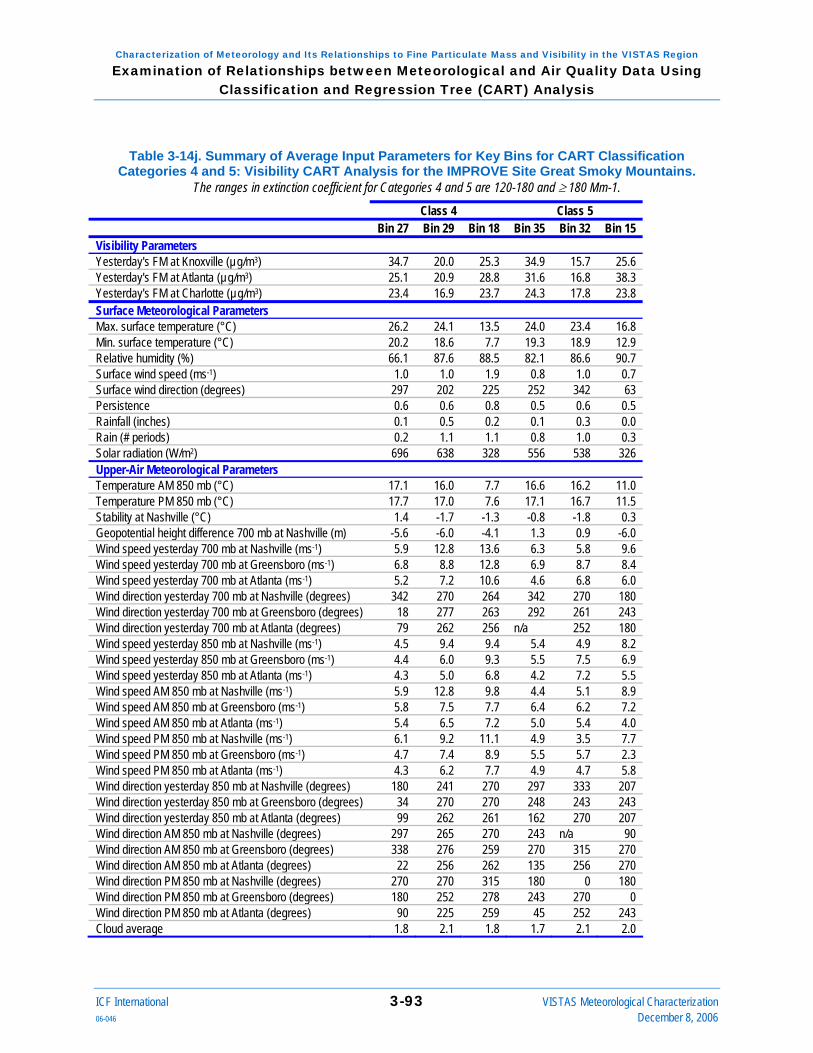
Characterization of Meteorology and Its Relationships to Fine Particulate Mass and Visibility in the VISTAS Region Examination of Relationships between Meteorological and Air Quality Data Using
Classification and Regression Tree (CART) Analysis
ICF International 3-93 VISTAS Meteorological Characterization 06-046 December 8, 2006
Table 3-14j. Summary of Average Input Parameters for Key Bins for CART Classification Categories 4 and 5: Visibility CART Analysis for the IMPROVE Site Great Smoky Mountains.
The ranges in extinction coefficient for Categories 4 and 5 are 120-180 and ≥ 180 Mm-1.
Class 4 Class 5 Bin 27 Bin 29 Bin 18 Bin 35 Bin 32 Bin 15 Visibility Parameters Yesterday's FM at Knoxville (µg/m3) 34.7 20.0 25.3 34.9 15.7 25.6 Yesterday's FM at Atlanta (µg/m3) 25.1 20.9 28.8 31.6 16.8 38.3 Yesterday's FM at Charlotte (µg/m3) 23.4 16.9 23.7 24.3 17.8 23.8 Surface Meteorological Parameters Max. surface temperature (°C) 26.2 24.1 13.5 24.0 23.4 16.8 Min. surface temperature (°C) 20.2 18.6 7.7 19.3 18.9 12.9 Relative humidity (%) 66.1 87.6 88.5 82.1 86.6 90.7 Surface wind speed (ms-1) 1.0 1.0 1.9 0.8 1.0 0.7 Surface wind direction (degrees) 297 202 225 252 342 63 Persistence 0.6 0.6 0.8 0.5 0.6 0.5 Rainfall (inches) 0.1 0.5 0.2 0.1 0.3 0.0 Rain (# periods) 0.2 1.1 1.1 0.8 1.0 0.3 Solar radiation (W/m2) 696 638 328 556 538 326 Upper-Air Meteorological Parameters Temperature AM 850 mb (°C) 17.1 16.0 7.7 16.6 16.2 11.0 Temperature PM 850 mb (°C) 17.7 17.0 7.6 17.1 16.7 11.5 Stability at Nashville (°C) 1.4 -1.7 -1.3 -0.8 -1.8 0.3 Geopotential height difference 700 mb at Nashville (m) -5.6 -6.0 -4.1 1.3 0.9 -6.0 Wind speed yesterday 700 mb at Nashville (ms-1) 5.9 12.8 13.6 6.3 5.8 9.6 Wind speed yesterday 700 mb at Greensboro (ms-1) 6.8 8.8 12.8 6.9 8.7 8.4 Wind speed yesterday 700 mb at Atlanta (ms-1) 5.2 7.2 10.6 4.6 6.8 6.0 Wind direction yesterday 700 mb at Nashville (degrees) 342 270 264 342 270 180 Wind direction yesterday 700 mb at Greensboro (degrees) 18 277 263 292 261 243 Wind direction yesterday 700 mb at Atlanta (degrees) 79 262 256 n/a 252 180 Wind speed yesterday 850 mb at Nashville (ms-1) 4.5 9.4 9.4 5.4 4.9 8.2 Wind speed yesterday 850 mb at Greensboro (ms-1) 4.4 6.0 9.3 5.5 7.5 6.9 Wind speed yesterday 850 mb at Atlanta (ms-1) 4.3 5.0 6.8 4.2 7.2 5.5 Wind speed AM 850 mb at Nashville (ms-1) 5.9 12.8 9.8 4.4 5.1 8.9 Wind speed AM 850 mb at Greensboro (ms-1) 5.8 7.5 7.7 6.4 6.2 7.2 Wind speed AM 850 mb at Atlanta (ms-1) 5.4 6.5 7.2 5.0 5.4 4.0 Wind speed PM 850 mb at Nashville (ms-1) 6.1 9.2 11.1 4.9 3.5 7.7 Wind speed PM 850 mb at Greensboro (ms-1) 4.7 7.4 8.9 5.5 5.7 2.3 Wind speed PM 850 mb at Atlanta (ms-1) 4.3 6.2 7.7 4.9 4.7 5.8 Wind direction yesterday 850 mb at Nashville (degrees) 180 241 270 297 333 207 Wind direction yesterday 850 mb at Greensboro (degrees) 34 270 270 248 243 243 Wind direction yesterday 850 mb at Atlanta (degrees) 99 262 261 162 270 207 Wind direction AM 850 mb at Nashville (degrees) 297 265 270 243 n/a 90 Wind direction AM 850 mb at Greensboro (degrees) 338 276 259 270 315 270 Wind direction AM 850 mb at Atlanta (degrees) 22 256 262 135 256 270 Wind direction PM 850 mb at Nashville (degrees) 270 270 315 180 0 180 Wind direction PM 850 mb at Greensboro (degrees) 180 252 278 243 270 0 Wind direction PM 850 mb at Atlanta (degrees) 90 225 259 45 252 243 Cloud average 1.8 2.1 1.8 1.7 2.1 2.0
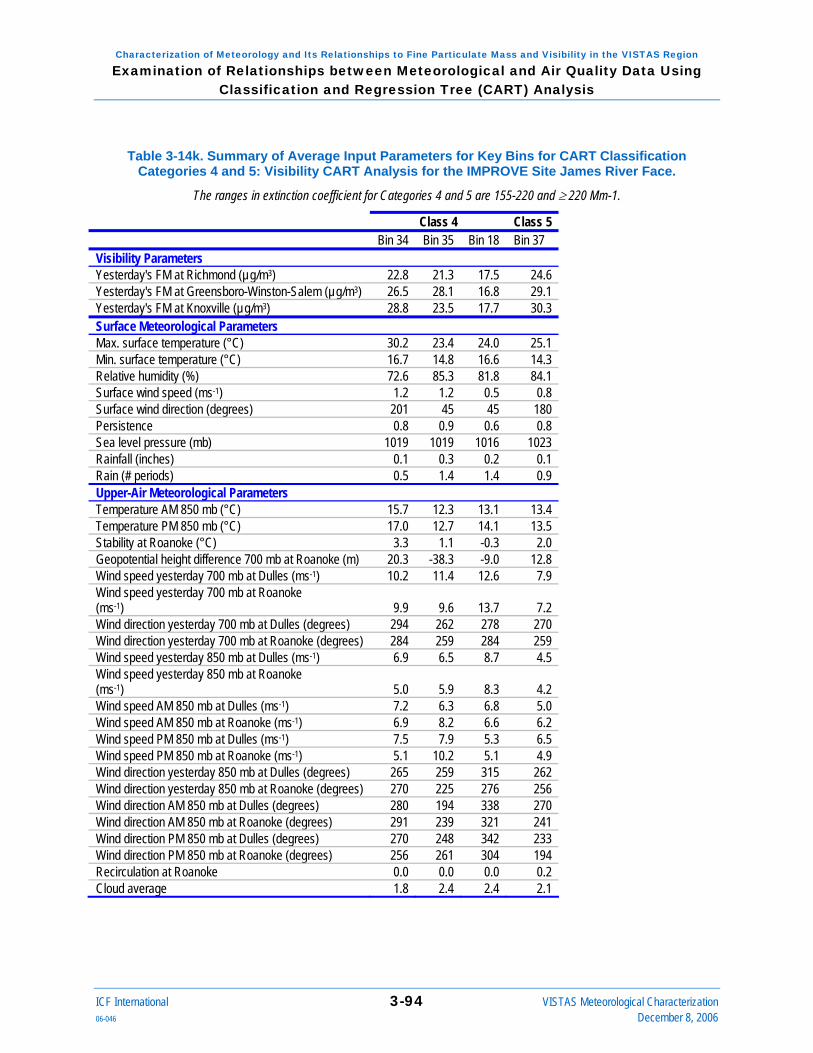
Characterization of Meteorology and Its Relationships to Fine Particulate Mass and Visibility in the VISTAS Region Examination of Relationships between Meteorological and Air Quality Data Using
Classification and Regression Tree (CART) Analysis
ICF International 3-94 VISTAS Meteorological Characterization 06-046 December 8, 2006
Table 3-14k. Summary of Average Input Parameters for Key Bins for CART Classification Categories 4 and 5: Visibility CART Analysis for the IMPROVE Site James River Face.
The ranges in extinction coefficient for Categories 4 and 5 are 155-220 and ≥ 220 Mm-1.
Class 4 Class 5 Bin 34 Bin 35 Bin 18 Bin 37 Visibility Parameters Yesterday's FM at Richmond (µg/m3) 22.8 21.3 17.5 24.6 Yesterday's FM at Greensboro-Winston-Salem (µg/m3) 26.5 28.1 16.8 29.1 Yesterday's FM at Knoxville (µg/m3) 28.8 23.5 17.7 30.3 Surface Meteorological Parameters Max. surface temperature (°C) 30.2 23.4 24.0 25.1 Min. surface temperature (°C) 16.7 14.8 16.6 14.3 Relative humidity (%) 72.6 85.3 81.8 84.1 Surface wind speed (ms-1) 1.2 1.2 0.5 0.8 Surface wind direction (degrees) 201 45 45 180 Persistence 0.8 0.9 0.6 0.8 Sea level pressure (mb) 1019 1019 1016 1023 Rainfall (inches) 0.1 0.3 0.2 0.1 Rain (# periods) 0.5 1.4 1.4 0.9 Upper-Air Meteorological Parameters Temperature AM 850 mb (°C) 15.7 12.3 13.1 13.4 Temperature PM 850 mb (°C) 17.0 12.7 14.1 13.5 Stability at Roanoke (°C) 3.3 1.1 -0.3 2.0 Geopotential height difference 700 mb at Roanoke (m) 20.3 -38.3 -9.0 12.8 Wind speed yesterday 700 mb at Dulles (ms-1) 10.2 11.4 12.6 7.9 Wind speed yesterday 700 mb at Roanoke (ms-1) 9.9 9.6 13.7 7.2 Wind direction yesterday 700 mb at Dulles (degrees) 294 262 278 270 Wind direction yesterday 700 mb at Roanoke (degrees) 284 259 284 259 Wind speed yesterday 850 mb at Dulles (ms-1) 6.9 6.5 8.7 4.5 Wind speed yesterday 850 mb at Roanoke (ms-1) 5.0 5.9 8.3 4.2 Wind speed AM 850 mb at Dulles (ms-1) 7.2 6.3 6.8 5.0 Wind speed AM 850 mb at Roanoke (ms-1) 6.9 8.2 6.6 6.2 Wind speed PM 850 mb at Dulles (ms-1) 7.5 7.9 5.3 6.5 Wind speed PM 850 mb at Roanoke (ms-1) 5.1 10.2 5.1 4.9 Wind direction yesterday 850 mb at Dulles (degrees) 265 259 315 262 Wind direction yesterday 850 mb at Roanoke (degrees) 270 225 276 256 Wind direction AM 850 mb at Dulles (degrees) 280 194 338 270 Wind direction AM 850 mb at Roanoke (degrees) 291 239 321 241 Wind direction PM 850 mb at Dulles (degrees) 270 248 342 233 Wind direction PM 850 mb at Roanoke (degrees) 256 261 304 194 Recirculation at Roanoke 0.0 0.0 0.0 0.2 Cloud average 1.8 2.4 2.4 2.1

Characterization of Meteorology and Its Relationships to Fine Particulate Mass and Visibility in the VISTAS Region Examination of Relationships between Meteorological and Air Quality Data Using
Classification and Regression Tree (CART) Analysis
ICF International 3-95 VISTAS Meteorological Characterization 06-046 December 8, 2006
Table 3-14l. Summary of Average Input Parameters for Key Bins for CART Classification Categories 4 and 5: Visibility CART Analysis for the IMPROVE Site Linville Gorge.
The ranges in extinction coefficient for Categories 4 and 5 are 120-180 and ≥ 180 Mm-1.
Class 4 Class 5 Bin 20 Bin 23 Bin 28 Visibility Parameters Yesterday's FM at Knoxville (µg/m3) 24.8 24.1 39.5 Yesterday's FM at Charlotte (µg/m3) 20.8 21.4 28.8 Yesterday's FM at Greenville (µg/m3) 18.9 21.1 33.4 Surface Meteorological Parameters Max. surface temperature (°C) 28.9 28.1 27.3 Min. surface temperature (°C) 17.4 18.5 16.4 Relative humidity (%) 72.4 83.6 77.5 Surface wind speed (ms-1) 1.1 0.6 0.8 Surface wind direction (degrees) 310 252 315 Persistence 0.7 0.6 0.7 Sea level pressure (mb) 1019 1019 1021 Rainfall (inches) 0.6 1.1 0.6 Rain (# periods) 0.0 0.3 0.0 Upper-Air Meteorological Parameters Temperature AM 850 mb (°C) 15.4 15.9 15.1 Temperature PM 850 mb (°C) 16.3 16.8 15.7 Stability at Greensboro (°C) 0.5 0.7 0.6 Geopotential height difference 700 mb at Greensboro (m) 0.7 8.5 0.1 Wind speed yesterday 700 mb at Greensboro (ms-1) 6.5 6.1 7.2 Wind direction yesterday 700 mb at Greensboro (degrees) 297 262 315 Wind speed yesterday 850 mb at Greensboro (ms-1) 4.9 4.5 4.2 Wind speed AM 850 mb at Greensboro (ms-1) 5.0 5.4 5.5 Wind speed PM 850 mb at Greensboro (ms-1) 4.7 4.2 5.3 Wind direction yesterday 850 mb at Greensboro (degrees) 297 217 270 Wind direction AM 850 mb at Greensboro (degrees) 329 217 286 Wind direction PM 850 mb at Greensboro (degrees) 297 210 281 Recirculation at Greensboro 0.0 0.1 0.1 Cloud average 1.9 1.9 1.8

Characterization of Meteorology and Its Relationships to Fine Particulate Mass and Visibility in the VISTAS Region Examination of Relationships between Meteorological and Air Quality Data Using
Classification and Regression Tree (CART) Analysis
ICF International 3-96 VISTAS Meteorological Characterization 06-046 December 8, 2006
Table 3-14m. Summary of Average Input Parameters for Key Bins for CART Classification Categories 4 and 5: Visibility CART Analysis for the IMPROVE Site Mammoth Cave.
The ranges in extinction coefficient for Categories 4 and 5 are 155-250 and ≥ 250 Mm-1.
Class 4 Class 5 Bin 29 Bin 8 Bin 34 Visibility Parameters Yesterday's FM at Nashville (µg/m3) 18.1 25.5 27.7 Yesterday's FM at Knoxville (µg/m3) 23.7 31.0 28.6 Yesterday's FM at Louisville (µg/m3) 23.1 31.2 31.7 Surface Meteorological Parameters Max. surface temperature (°C) 29.0 33.0 28.3 Min. surface temperature (°C) 18.8 18.1 16.8 Relative humidity (%) 77.0 64.0 77.9 Surface wind speed (ms-1) 2.4 1.0 1.2 Surface wind direction (degrees) 189 360 194 Persistence 0.8 0.7 0.8 Sea level pressure (mb) 1018 1021 1018 Rainfall (inches) 0.1 0.0 0.0 Rain (# periods) 1.1 0.3 0.5 Upper-Air Meteorological Parameters Temperature AM 850 mb (°C) 15.0 16.9 15.6 Temperature PM 850 mb (°C) 16.7 17.6 17.0 Stability at Nashville (°C) 0.6 2.3 0.9 Geopotential height difference 700 mb at Nashville (m) -8.6 2.6 -1.6 Wind speed yesterday 700 mb at Nashville (ms-1) 6.9 4.4 6.1 Wind direction yesterday 700 mb at Nashville (degrees) 233 45 349 Wind speed yesterday 850 mb at Nashville (ms-1) 6.5 4.3 4.1 Wind speed AM 850 mb at Nashville (ms-1) 8.7 5.2 3.2 Wind speed PM 850 mb at Nashville (ms-1) 8.4 5.5 4.6 Wind direction yesterday 850 mb at Nashville (degrees) 202 252 0 Wind direction AM 850 mb at Nashville (degrees) 259 0 338 Wind direction PM 850 mb at Nashville (degrees) 233 45 180 Recirculation at Nashville 0.0 0.1 0.3 Cloud average 1.9 1.9 1.8

Characterization of Meteorology and Its Relationships to Fine Particulate Mass and Visibility in the VISTAS Region Examination of Relationships between Meteorological and Air Quality Data Using
Classification and Regression Tree (CART) Analysis
ICF International 3-97 VISTAS Meteorological Characterization 06-046 December 8, 2006
Table 3-14n. Summary of Average Input Parameters for Key Bins for CART Classification Categories 4 and 5: Visibility CART Analysis for the IMPROVE Site Mingo.
The ranges in extinction coefficient for Categories 4 and 5 are 130-190 and ≥ 190 Mm-1.
Class 4 Class 5 Bin 28 Bin 21 Bin 31 Visibility Parameters Yesterday's FM at St. Louis (µg/m3) 27.2 14.6 29.2 Surface Meteorological Parameters Max. surface temperature (°C) 22.5 26.1 18.9 Min. surface temperature (°C) 10.7 10.2 7.0 Relative humidity (%) 74.3 70.3 74.7 Surface wind speed (ms-1) 1.4 1.8 1.8 Surface wind direction (degrees) 108 225 225 Persistence 0.7 0.8 0.8 Sea level pressure (mb) 1022 1020 1024 Rainfall (inches) 0.1 0.0 0.2 Rain (# periods) 0.7 0.3 1.1 Upper-Air Meteorological Parameters Temperature AM 850 mb (°C) 11.7 12.8 9.0 Temperature PM 850 mb (°C) 11.8 13.4 9.6 Stability at Little Rock (°C) -1.0 0.8 1.5 Geopotential height difference 700 mb at Little Rock (m) -2.6 -3.4 -10.8 Wind speed yesterday 700 mb at Springfield (ms-1) 7.8 7.8 11.1 Wind speed yesterday 700 mb at Little Rock (ms-1) 7.8 4.8 11.3 Wind speed yesterday 700 mb at Lincoln (ms-1) 10.1 10.9 13.2 Wind speed yesterday 700 mb at Nashville (ms-1) 9.2 8.4 7.1 Wind direction yesterday 700 mb at Springfield (degrees) 270 270 261 Wind direction yesterday 700 mb at Little Rock (degrees) 307 284 236 Wind direction yesterday 700 mb at Lincoln (degrees) 307 270 270 Wind direction yesterday 700 mb at Nashville (degrees) 304 252 n/a Wind speed yesterday 850 mb at Springfield (ms-1) 5.3 7.4 9.8 Wind speed yesterday 850 mb at Little Rock (ms-1) 5.5 6.5 8.4 Wind speed yesterday 850 mb at Lincoln (ms-1) 5.2 7.8 12.1 Wind speed yesterday 850 mb at Nashville (ms-1) 5.3 5.9 6.7 Wind speed AM 850 mb at Springfield (ms-1) 7.4 6.8 5.4 Wind speed AM 850 mb at Little Rock (ms-1) 6.6 6.2 6.8 Wind speed AM 850 mb at Lincoln (ms-1) 7.5 7.4 10.0 Wind speed AM 850 mb at Nashville (ms-1) 5.2 8.1 7.4 Wind speed PM 850 mb at Springfield (ms-1) 7.6 9.8 6.3 Wind speed PM 850 mb at Little Rock (ms-1) 8.4 5.9 5.9 Wind speed PM 850 mb at Lincoln (ms-1) 7.4 7.6 7.9 Wind speed PM 850 mb at Nashville (ms-1) 6.7 5.6 5.8 Wind direction yesterday 850 mb at Springfield (degrees) 198 207 217 Wind direction yesterday 850 mb at Little Rock (degrees) 225 180 202 Wind direction yesterday 850 mb at Lincoln (degrees) 270 243 217

Characterization of Meteorology and Its Relationships to Fine Particulate Mass and Visibility in the VISTAS Region Examination of Relationships between Meteorological and Air Quality Data Using
Classification and Regression Tree (CART) Analysis
ICF International 3-98 VISTAS Meteorological Characterization 06-046 December 8, 2006
Class 4 Class 5 Bin 28 Bin 21 Bin 31 Wind direction yesterday 850 mb at Nashville (degrees) 270 180 239 Wind direction AM 850 mb at Springfield (degrees) 254 270 256 Wind direction AM 850 mb at Little Rock (degrees) 236 256 236 Wind direction AM 850 mb at Lincoln (degrees) 263 252 297 Wind direction AM 850 mb at Nashville (degrees) 191 270 284 Wind direction PM 850 mb at Springfield (degrees) 166 180 214 Wind direction PM 850 mb at Little Rock (degrees) 169 198 217 Wind direction PM 850 mb at Lincoln (degrees) 262 146 270 Wind direction PM 850 mb at Nashville (degrees) 207 207 315 Cloud average 1.8 1.7 1.9

Characterization of Meteorology and Its Relationships to Fine Particulate Mass and Visibility in the VISTAS Region Examination of Relationships between Meteorological and Air Quality Data Using
Classification and Regression Tree (CART) Analysis
ICF International 3-99 VISTAS Meteorological Characterization 06-046 December 8, 2006
Table 3-14o. Summary of Average Input Parameters for Key Bins for CART Classification Categories 4 and 5: Visibility CART Analysis for the IMPROVE Site Okefenokee.
The ranges in extinction coefficient for Categories 4 and 5 are 110-170 and ≥ 170 Mm-1.
Class 4 Class 5 Bin 34 Bin 16 Bin 22 Bin 30 Visibility Parameters Yesterday's FM at Jacksonville (µg/m3) 20.5 10.0 10.9 23.9 Surface Meteorological Parameters Max. surface temperature (°C) 25.3 26.7 22.9 31.1 Min. surface temperature (°C) 12.6 14.6 13.6 20.6 Relative humidity (%) 76.3 76.7 88.9 78.1 Surface wind speed (ms-1) 2.4 2.1 1.8 1.7 Surface wind direction (degrees) 70 90 90 117 Persistence 0.9 0.8 0.8 0.7 Sea level pressure (mb) 1022 1021 1021 1016 Rainfall (inches) 0.0 0.0 0.0 0.1 Rain (# periods) 0.4 0.5 0.4 0.7 Upper-Air Meteorological Parameters Temperature AM 850 mb (°C) 11.6 13.5 12.6 16.6 Temperature PM 850 mb (°C) 12.2 14.0 13.0 16.9 Stability at Jacksonville (°C) 1.2 1.2 0.7 -0.3 Geopotential height difference 700 mb at Jacksonville (m) 4.6 -6.5 -1.9 -3.0 Wind speed yesterday 700 mb at Jacksonville (ms-1) 7.8 7.4 9.3 7.3 Wind speed yesterday 700 mb at Tallahassee (ms-1) 7.0 5.3 10.0 6.4 Wind direction yesterday 700 mb at Jacksonville (degrees) 326 0 270 301 Wind direction yesterday 700 mb at Tallahassee (degrees) 339 315 263 309 Wind speed yesterday 850 mb at Jacksonville (ms-1) 4.9 4.6 7.6 4.9 Wind speed yesterday 850 mb at Tallahassee (ms-1) 3.7 3.3 6.5 3.8 Wind speed AM 850 mb at Jacksonville (ms-1) 5.7 6.9 6.7 4.3 Wind speed AM 850 mb at Tallahassee (ms-1) 4.4 3.3 5.4 4.6 Wind speed PM 850 mb at Jacksonville (ms-1) 6.6 6.6 6.2 3.6 Wind speed PM 850 mb at Tallahassee (ms-1) 5.5 4.8 5.7 5.3 Wind direction yesterday 850 mb at Jacksonville (degrees) 360 18 270 315 Wind direction yesterday 850 mb at Tallahassee (degrees) 50 45 256 351 Wind direction AM 850 mb at Jacksonville (degrees) 117 18 248 281 Wind direction AM 850 mb at Tallahassee (degrees) 101 360 270 233 Wind direction PM 850 mb at Jacksonville (degrees) 117 315 236 304 Wind direction PM 850 mb at Tallahassee (degrees) 68 11 214 326 Recirculation at Jacksonville 0.1 0.0 0.0 0.3 Cloud average 1.6 1.5 1.9 1.8

Characterization of Meteorology and Its Relationships to Fine Particulate Mass and Visibility in the VISTAS Region Examination of Relationships between Meteorological and Air Quality Data Using
Classification and Regression Tree (CART) Analysis
ICF International 3-100 VISTAS Meteorological Characterization 06-046 December 8, 2006
Table 3-14p. Summary of Average Input Parameters for Key Bins for CART Classification Categories 4 and 5: Visibility CART Analysis for the IMPROVE Site Shenandoah.
The ranges in extinction coefficient for Categories 4 and 5 are 145-255 and ≥ 255 Mm-1.
Class 4 Class 5 Bin 26 Bin 38 Bin 34 Bin 28 Visibility Parameters Yesterday's FM at Richmond (µg/m3) 9.4 20.5 12.7 23.4 Yesterday's FM at DC (µg/m3) 11.8 23.1 14.2 27.3 Yesterday's FM at Columbus (µg/m3) 18.7 26.2 18.4 22.8 Surface Meteorological Parameters Max. surface temperature (°C) 16.9 21.4 22.1 19.6 Min. surface temperature (°C) 15.6 15.6 16.3 15.7 Relative humidity (%) 97.9 81.0 86.1 92.5 Surface wind speed (ms-1) 1.4 1.4 1.3 1.0 Surface wind direction (degrees) 180 90 180 180 Persistence 0.9 0.9 0.8 0.6 Rainfall (inches) 2.5 0.6 0.8 1.3 Rain (# periods) 0.6 0.1 0.1 0.2 Solar radiation (W/m2) 123 690 620 226 Upper-Air Meteorological Parameters Temperature AM 850 mb (°C) 13.6 15.2 15.9 15.9 Temperature PM 850 mb (°C) 14.1 16.5 17.0 15.6 Stability at Dulles (°C) -3.4 -1.1 0.0 0.4 Geopotential height difference 700 mb at Dulles (m) -16.5 5.3 -14.8 20.7 Wind speed yesterday 700 mb at Dulles (ms-1) 11.6 8.4 5.5 5.9 Wind speed yesterday 700 mb at Roanoke (ms-1) 11.3 7.5 5.7 5.9 Wind direction yesterday 700 mb at Dulles (degrees) 270 310 315 277 Wind direction yesterday 700 mb at Roanoke (degrees) 270 281 270 254 Wind speed yesterday 850 mb at Dulles (ms-1) 6.2 5.4 4.9 4.7 Wind speed yesterday 850 mb at Roanoke (ms-1) 6.1 5.7 3.5 4.8 Wind speed AM 850 mb at Dulles (ms-1) 9.3 5.8 5.8 4.3 Wind speed AM 850 mb at Roanoke (ms-1) 4.3 5.5 5.0 6.7 Wind speed PM 850 mb at Dulles (ms-1) 6.2 5.6 6.9 6.2 Wind speed PM 850 mb at Roanoke (ms-1) 3.9 5.1 5.1 5.0 Wind direction yesterday 850 mb at Dulles (degrees) 225 270 315 270 Wind direction yesterday 850 mb at Roanoke (degrees) n/a 315 270 248 Wind direction AM 850 mb at Dulles (degrees) 270 0 270 243 Wind direction AM 850 mb at Roanoke (degrees) 180 0 297 217 Wind direction PM 850 mb at Dulles (degrees) 180 180 225 198 Wind direction PM 850 mb at Roanoke (degrees) n/a 68 270 169 Recirculation at Dulles 0.5 0.3 0.4 0.3 Cloud average 3.0 2.0 2.5 2.5

Characterization of Meteorology and Its Relationships to Fine Particulate Mass and Visibility in the VISTAS Region Examination of Relationships between Meteorological and Air Quality Data Using
Classification and Regression Tree (CART) Analysis
ICF International 3-101 VISTAS Meteorological Characterization 06-046 December 8, 2006
Table 3-14q. Summary of Average Input Parameters for Key Bins for CART Classification Categories 4 and 5: Visibility CART Analysis for the IMPROVE Site Shining Rock.
The ranges in extinction coefficient for Categories 4 and 5 are 110-180 and ≥ 180 Mm-1.
Class 4 Class 5 Bin 11 Bin 31 Bin 25 Bin 28 Visibility Parameters Yesterday's FM at Knoxville (µg/m3) 18.1 31.4 30.3 40.4 Yesterday's FM at Charlotte (µg/m3) 16.7 25.8 21.7 29.2 Yesterday's FM at Greenville (µg/m3) 16.3 27.7 25.3 32.2 Surface Meteorological Parameters Max. surface temperature (°C) 26.0 27.7 24.8 28.2 Min. surface temperature (°C) 14.8 16.8 13.3 16.7 Relative humidity (%) 75.0 82.1 75.1 76.2 Surface wind speed (ms-1) 0.9 1.1 1.1 1.1 Surface wind direction (degrees) 27 297 180 315 Persistence 0.6 0.6 0.7 0.7 Sea level pressure (mb) 1021 1018 1021 1021 Rainfall (inches) 0.0 0.2 0.0 0.0 Rain (# periods) 0.5 1.7 0.4 0.2 Upper-Air Meteorological Parameters Temperature AM 850 mb (°C) 14.6 16.6 12.5 16.4 Temperature PM 850 mb (°C) 15.7 16.6 13.4 17.8 Stability at Greensboro (°C) 1.7 0.0 1.0 -0.2 Geopotential height difference 700 mb at Greensboro (m) 4.1 -8.2 14.7 -4.2 Wind speed yesterday 700 mb at Greensboro (ms-1) 7.7 8.6 9.4 5.8 Wind direction yesterday 700 mb at Greensboro (degrees) 324 279 284 323 Wind speed yesterday 850 mb at Greensboro (ms-1) 4.8 7.2 4.9 3.4 Wind speed AM 850 mb at Greensboro (ms-1) 5.8 6.2 4.0 4.9 Wind speed PM 850 mb at Greensboro (ms-1) 5.2 6.8 2.4 6.1 Wind direction yesterday 850 mb at Greensboro (degrees) 321 270 360 286 Wind direction AM 850 mb at Greensboro (degrees) 339 292 270 277 Wind direction PM 850 mb at Greensboro (degrees) 252 256 153 263 Recirculation at Greensboro 0.1 0.1 0.2 0.0 Cloud average 1.7 1.7 1.6 1.8

Characterization of Meteorology and Its Relationships to Fine Particulate Mass and Visibility in the VISTAS Region Examination of Relationships between Meteorological and Air Quality Data Using
Classification and Regression Tree (CART) Analysis
ICF International 3-102 VISTAS Meteorological Characterization 06-046 December 8, 2006
Table 3-14r. Summary of Average Input Parameters for Key Bins for CART Classification Categories 4 and 5: Visibility CART Analysis for the IMPROVE Site Sipsey.
The ranges in extinction coefficient for Categories 4 and 5 are 135-200 and ≥ 200 Mm-1.
Class 4 Class 5 Bin 23 Bin 26 Bin 15 Bin 25 Visibility Parameters Yesterday's FM at Birmingham (µg/m3) 36.2 36.7 19.6 33.2 Yesterday's FM at Atlanta (µg/m3) 34.0 40.6 17.1 24.8 Yesterday's FM at Nashville (µg/m3) 23.5 27.9 17.2 22.3 Yesterday's FM at Memphis (µg/m3) 24.0 22.2 12.7 21.0 Surface Meteorological Parameters Max. surface temperature (°C) 29.8 30.5 28.6 27.8 Min. surface temperature (°C) 16.1 18.9 16.7 17.8 Relative humidity (%) 58.1 74.3 74.8 79.1 Surface wind speed (ms-1) 2.0 1.3 0.9 1.0 Surface wind direction (degrees) 117 225 34 180 Persistence 0.8 0.8 0.8 0.7 Sea level pressure (mb) 1023 1019 1020 1020 Rainfall (inches) 0.0 0.0 0.1 0.0 Rain (# periods) 0.0 0.4 0.7 0.9 Upper-Air Meteorological Parameters Temperature AM 850 mb (°C) 15.2 16.3 15.8 15.0 Temperature PM 850 mb (°C) 16.1 17.1 16.2 15.9 Stability at Birmingham (°C) 2.6 1.4 1.3 0.5 Geopotential height difference 700 mb at Birmingham (m) 2.8 0.9 -0.6 4.8 Wind speed yesterday 700 mb at Birmingham (ms-1) 6.1 5.1 6.3 7.1 Wind direction yesterday 700 mb at Birmingham (degrees) 180 14 326 315 Wind speed yesterday 850 mb at Birmingham (ms-1) 4.6 2.8 5.4 4.2 Wind speed AM 850 mb at Birmingham (ms-1) 2.5 3.1 4.1 3.4 Wind speed PM 850 mb at Birmingham (ms-1) 5.4 3.9 3.2 4.2 Wind direction yesterday 850 mb at Birmingham (degrees) 270 56 360 90 Wind direction AM 850 mb at Birmingham (degrees) 243 225 n/a 202 Wind direction PM 850 mb at Birmingham (degrees) 63 180 18 180 Recirculation at Birmingham 0.2 0.4 0.1 0.1 Cloud average 1.4 1.8 1.7 1.5

Characterization of Meteorology and Its Relationships to Fine Particulate Mass and Visibility in the VISTAS Region Examination of Relationships between Meteorological and Air Quality Data Using
Classification and Regression Tree (CART) Analysis
ICF International 3-103 VISTAS Meteorological Characterization 06-046 December 8, 2006
Table 3-14s. Summary of Average Input Parameters for Key Bins for CART Classification Categories 4 and 5: Visibility CART Analysis for the IMPROVE Site St. Marks.
The ranges in extinction coefficient for Categories 4 and 5 are 100-140 and ≥ 140 Mm-1.
Class 4 Class 5 Bin 21 Bin 19 Bin 27 Visibility Parameters Yesterday's FM at Orlando (µg/m3) 13.3 6.9 28.2 Yesterday's FM at Pensacola (µg/m3) 18.0 18.6 25.9 Surface Meteorological Parameters Max. surface temperature (°C) 28.8 24.7 26.8 Min. surface temperature (°C) 14.5 15.1 12.2 Relative humidity (%) 72.8 85.6 69.2 Surface wind speed (ms-1) 1.3 2.2 0.7 Surface wind direction (degrees) 146 45 45 Persistence 0.7 0.8 0.7 Sea level pressure (mb) 1020 1024 1021 Rainfall (inches) 0.0 0.3 0.0 Rain (# periods) 0.3 1.3 0.0 Upper-Air Meteorological Parameters Temperature AM 850 mb (°C) 13.8 14.5 11.8 Temperature PM 850 mb (°C) 14.1 14.1 11.6 Stability at Tallahassee (°C) 1.8 2.1 3.2 Geopotential height difference 700 mb at Tallahassee (m) 5.8 12.8 -4.8 Wind speed yesterday 700 mb at Tallahassee (ms-1) 7.1 9.1 6.1 Wind direction yesterday 700 mb at Tallahassee (degrees) 270 225 315 Wind speed yesterday 850 mb at Tallahassee (ms-1) 3.6 7.3 2.6 Wind speed AM 850 mb at Tallahassee (ms-1) 4.9 3.3 4.9 Wind speed PM 850 mb at Tallahassee (ms-1) 5.1 5.9 6.8 Wind direction yesterday 850 mb at Tallahassee (degrees) 315 315 342 Wind direction AM 850 mb at Tallahassee (degrees) 225 297 315 Wind direction PM 850 mb at Tallahassee (degrees) 207 n/a 18 Recirculation at Tallahassee 0.1 0.3 0.3 Cloud average 1.5 1.5 1.8

Characterization of Meteorology and Its Relationships to Fine Particulate Mass and Visibility in the VISTAS Region Examination of Relationships between Meteorological and Air Quality Data Using
Classification and Regression Tree (CART) Analysis
ICF International 3-104 VISTAS Meteorological Characterization 06-046 December 8, 2006
Table 3-14t. Summary of Average Input Parameters for Key Bins for CART Classification Categories 4 and 5: Visibility CART Analysis for the IMPROVE Site Swanquarter.
The ranges in extinction coefficient for Categories 4 and 5 are 115-175 and ≥ 175 Mm-1.
Class 4 Class 5 Bin 28 Bin 30 Bin 23 Bin 27 Visibility Parameters Yesterday's FM at Raleigh (µg/m3) 21.9 17.8 20.3 22.6 Yesterday's FM at Norfolk (µg/m3) 16.9 20.0 14.1 18.4 Surface Meteorological Parameters Max. surface temperature (°C) 20.9 24.0 19.9 25.1 Min. surface temperature (°C) 14.9 15.4 13.1 20.0 Relative humidity (%) 88.3 87.0 82.3 91.6 Surface wind speed (ms-1) 2.6 1.5 3.0 3.2 Surface wind direction (degrees) 180 225 281 212 Persistence 0.7 0.7 0.7 0.8 Sea level pressure (mb) 1022 1018 1019 1016 Rainfall (inches) 0.0 0.3 0.1 0.1 Rain (# periods) 0.5 1.2 1.2 0.7 Upper-Air Meteorological Parameters Temperature AM 850 mb (°C) 12.7 13.0 9.7 15.9 Temperature PM 850 mb (°C) 13.0 13.9 8.8 16.2 Stability at Moorhead (°C) -0.2 2.0 -1.4 0.1 Geopotential height difference 700 mb at Moorhead (m) 2.7 -19.8 -32.6 -9.6 Wind speed yesterday 700 mb at Moorhead (ms-1) 10.4 6.3 20.4 9.8 Wind direction yesterday 700 mb at Moorhead (degrees) 270 281 243 280 Wind speed yesterday 850 mb at Moorhead (ms-1) 9.2 5.0 13.1 7.5 Wind speed AM 850 mb at Moorhead (ms-1) 11.3 8.8 9.4 8.4 Wind speed PM 850 mb at Moorhead (ms-1) 6.7 7.0 12.7 8.3 Wind direction yesterday 850 mb at Moorhead (degrees) 252 270 259 265 Wind direction AM 850 mb at Moorhead (degrees) 270 180 270 270 Wind direction PM 850 mb at Moorhead (degrees) 259 342 281 276 Recirculation at Moorhead 0.0 0.2 0.0 0.1 Cloud average 1.7 1.5 1.5 1.7

Characterization of Meteorology and Its Relationships to Fine Particulate Mass and Visibility in the VISTAS Region Examination of Relationships between Meteorological and Air Quality Data Using
Classification and Regression Tree (CART) Analysis
ICF International 3-105 VISTAS Meteorological Characterization 06-046 December 8, 2006
Table 3-14u. Summary of Average Input Parameters for Key Bins for CART Classification Categories 4 and 5: Visibility CART Analysis for the IMPROVE Site Upper Buffalo.
The ranges in extinction coefficient for Categories 4 and 5 are 100-150 and ≥ 150 Mm-1.
Class 4 Class 5 Bin 28 Bin 33 Bin 29 Bin 38 Bin 34 Visibility Parameters Yesterday's FM at Little Rock (µg/m3) 18.8 29.6 15.0 22.7 28.4 Yesterday's FM at Dallas (µg/m3) 18.3 21.8 17.5 25.5 28.9 Surface Meteorological Parameters Max. surface temperature (°C) 28.2 28.5 21.0 25.6 30.4 Min. surface temperature (°C) 16.6 17.2 10.2 17.7 17.2 Relative humidity (%) 1.8 2.5 3.0 2.4 2.0 Surface wind speed (ms-1) 159 191 180 162 135 Surface wind direction (degrees) 0.7 0.8 0.9 0.8 0.8 Persistence 73.3 69.6 74.0 87.4 71.3 Sea level pressure (mb) 1020 1017 1018 1016 1017 Rainfall (inches) 0.0 0.0 0.0 0.1 0.0 Rain (# periods) 0.1 0.0 0.6 0.4 0.0 Upper-Air Meteorological Parameters Temperature AM 850 mb (°C) 15.5 16.2 12.4 16.5 16.7 Temperature PM 850 mb (°C) 16.6 17.1 11.5 17.2 17.5 Stability at Little Rock (°C) -1.9 -1.5 -2.0 -2.3 0.2 Geopotential height difference 700 mb at Little Rock (m) 1.7 -14.5 -38.0 7.2 -2.8 Wind speed yesterday 700 mb at Little Rock (ms-1) 4.9 6.7 9.8 9.9 5.3 Wind direction yesterday 700 mb at Little Rock (degrees) 323 360 256 256 90 Wind speed yesterday 850 mb at Little Rock (ms-1) 2.8 4.4 8.9 6.2 4.3 Wind speed AM 850 mb at Little Rock (ms-1) 4.0 5.3 10.5 5.8 3.9 Wind speed PM 850 mb at Little Rock (ms-1) 3.2 5.1 12.4 7.9 3.7 Wind direction yesterday 850 mb at Little Rock (degrees) 22 239 180 194 45 Wind direction AM 850 mb at Little Rock (degrees) 220 252 270 248 315 Wind direction PM 850 mb at Little Rock (degrees) 180 236 360 207 135 Recirculation at Little Rock 0.5 0.3 0.0 0.4 0.2 Cloud average 1.8 1.4 1.9 1.6 1.7
While there are many similarities in the conditions that describe the key bins, there are also some important differences (that relate directly to source-receptor relationships and potentially to control strategy effectiveness). For discussion purposes, we examine the results for the Cape Romain, Great Smoky Mountains, and Mammoth Cave IMPROVE sites.
For Cape Romain, the extinction coefficients for Categories 4 and 5 are in the range 100 to 160 and greater than or equal to 160 Mm-1, respectively. We note that all the key bins of the 20 percent haziest days at Cape Romain are characterized by high temperatures, low surface wind speeds, and moderate to high relative humidity, but the values vary among the bins. Prior day PM2.5 values for Charleston are in the range of 12 to 24 μgm-3, and vary more considerably among the key bins. One possible reason for this is that transport from Charleston is potentially more important for two of the bins, Bins 33 and 32, compared to the remaining bins. Average

Characterization of Meteorology and Its Relationships to Fine Particulate Mass and Visibility in the VISTAS Region Examination of Relationships between Meteorological and Air Quality Data Using
Classification and Regression Tree (CART) Analysis
ICF International 3-106 VISTAS Meteorological Characterization 06-046 December 8, 2006
surface wind direction is more variable across the key bins, and is northerly to northeasterly for two of the key bins, southeasterly for two of the bins, and south-southwesterly for the remaining key bin, indicating differences in the transport patterns and or source-receptor relationships between the days that comprise the bins. Recirculation by the sea breeze (as indicated by persistence) is important for Bin 32, the key Category 5 bin. Upper-air wind speeds and directions vary among the bins. Wind speeds are higher aloft for Bins 33 and 32, compared to the other key bins. Morning and evening 850 mb wind directions are northwesterly for all but Bin 27, which has southeasterly to southerly winds. Bins 33 and 32, which are in close proximity in the CART tree, have, as expected, similar average characteristics. However, Bin 33 is a Category 4 bin and Bin 32 is a Category 5 bin. An important difference in the characteristics between the bins is surface wind speed. This is also the parameter that splits the two bins in the CART tree. The higher extinction coefficient days in Bin 32 appear to be driven by lower wind speeds and a greater potential for recirculation by the sea breeze.
For GSM, the extinction coefficients for Categories 4 and 5 are in the range 120 to 180 and greater than or equal to 180 Mm-1, respectively. The key bins of the 20 percent haziest days at GSM are characterized by low surface wind speeds. Four of the six key bins have high temperatures (summer regimes) and two have lower temperatures (characteristic of fall or spring regimes). All but one of the key bins is characterized by greater than 80 percent relative humidity. Prior day PM2.5 values for Knoxville, Atlanta, and Charlotte vary among the bins in a consistent manner, but the range in value is different for the three areas (with generally lower values for Charlotte). As for Cape Romain, this indicates that transport from the surrounding areas is potentially more important for some of the bins, compared to others. Average surface wind direction is southwesterly for four of the key bins, northwesterly for one bin, and northeasterly for one bin. Upper-air wind speeds and directions vary among the monitoring sites. The closest and most directly relevant site is Nashville. Wind speeds aloft are lower for the Category 5 bins, compared to the Category 4 bins. The 850 mb wind directions for Nashville are westerly to northwesterly for the Category 4 bins, and westerly then southerly for two of the three Category 5 bins, and northerly for the remaining Category 5 bin. Thus wind direction both near the surface and aloft appears to distinguish the Category 4 bins from the higher bins, and the Category 5 bins from one another. Northerly wind components for Bin 32 seem to drive the poor visibility, since the regional PM2.5 concentrations are relatively low, on average, for this bin. In addition to the summer regimes being distinguished by different wind directions, the two cooler bins (Bins 18 and 15) are also characterized by different wind directions (from one another).
For Mammoth Cave, the extinction coefficients for Categories 4 and 5 are in the range 155 to 250 and greater than or equal to 250 Mm-1, respectively. All three key bins of the 20 percent haziest days at Mammoth Cave are characterized by high temperatures, low surface wind speeds, and moderate relative humidity, but these vary among the bins. Prior day PM2.5 values for Nashville, Knoxville, and Louisville vary among the bins in a consistent manner, with generally lower values for Nashville. Prior day PM2.5 values are higher for Bins 8 and 34, than for Bin 29. Average surface wind direction is southerly for Bins 29 and 34 and northerly for Bin 8. The difference in wind speed between Bins 29 and 34 (lower wind speeds for Bin 34) may account for the higher extinction coefficients for Bin 34, although there are also some differences in wind directions aloft. Upper-air wind speeds are highest for Bin 29. Morning and evening 850 mb wind directions vary considerably among the key bins.

Characterization of Meteorology and Its Relationships to Fine Particulate Mass and Visibility in the VISTAS Region Examination of Relationships between Meteorological and Air Quality Data Using
Classification and Regression Tree (CART) Analysis
CART analyses also provide insight into PM2.5 composition for key bins of poor visibility days at the IMPROVE sites. In general, analysis of the compositional characteristics for the key bins for the 20 percent haziest days for the Southern Appalachian IMPROVE sites indicates a predominance of ammonium sulfate and a contribution from organic carbon. Figure 3-6 shows the average composition for all key visibility bins for each of the IMPROVE sites. Note that the scale may be different for each site.
Figure 3-6a. Average Elemental Carbon (EC), Nitrate (NO3), Organic Matter (OM), and Sulfate (SO4) Concentrations (μgm-3) for Key Visibility Bins for All CART Classification Categories: IMPROVE
Site Breton.
Breton Key Visibility Bins: Component Averages
0.00
1.00
2.00
3.00
4.00
5.00
6.00
2 (20) 1 (24) 10 (8) 5 (10) 23 (7) 3 (8) 12 (21) 21 (15) 17 (8) 31 (16) 33 (6)
Class 1 Class 2 Class 3 Class 4 Class 5
Bin No. (No. of Correctly Classified Days)
Avg.
Con
c. (µ
g/m
3)
ECNO3OMSO4
Figure 3-6b. Average Elemental Carbon (EC), Nitrate (NO3), Organic Matter (OM), and Sulfate (SO4) Concentrations (μgm-3) for Key Visibility Bins for All CART Classification Categories: IMPROVE
Site Brigantine.
Brigantine Key Visibility Bins: Component Averages
0.002.004.006.008.00
10.0012.0014.00
1 (48) 9 (17) 5 (12) 6 (16) 4 (12) 8 (17) 10(12)
13(26)
23(14)
11(15)
24(16)
25(17)
16(10)
26 (9) 17 (5) 22 (6)
Class 1 Class 2 Class 3 Class 4 Class 5
Bin No. (No. of Correctly Classified Days)
Avg
. Con
c. (µ
g/m
3)
ECNO3OMSO4
ICF International 3-107 VISTAS Meteorological Characterization 06-046 December 8, 2006

Characterization of Meteorology and Its Relationships to Fine Particulate Mass and Visibility in the VISTAS Region Examination of Relationships between Meteorological and Air Quality Data Using
Classification and Regression Tree (CART) Analysis
Figure 3-6c. Average Elemental Carbon (EC), Nitrate (NO3), Organic Matter (OM), and Sulfate (SO4) Concentrations (μgm-3) for Key Visibility Bins for All CART Classification Categories: IMPROVE
Site Cadiz.
Cadiz Key Visibility Bins: Component Averages
0.00
2.00
4.00
6.00
8.00
10.00
12.00
14.00
12 (26) 5 (23) 3 (9) 20 (15) 34 (13) 26 (11) 16 (10) 18 (12) 25 (10) 22 (8) 31 (9) 32 (7) 29 (5)
Class 2 Class 3 Class 4 Class 5
Bin No. (No. of Correctly Classified Days)
Avg.
Con
c. (µ
g/m
3)
ECNO3OMSO4
Figure 3-6d. Average Elemental Carbon (EC), Nitrate (NO3), Organic Matter (OM), and Sulfate (SO4) Concentrations (μgm-3) for Key Visibility Bins for All CART Classification Categories: IMPROVE Site
Caney Creek.
Caney Creek Key Visibility Bins: Component Averages
0.00
2.00
4.00
6.00
8.00
10.00
12.00
2 (37) 6 (8) 32 (8) 8 (35) 33(17)
1 (10) 34(30)
14(29)
10(16)
23(15)
18(21)
25 (6) 24 (5) 19 (7) 16 (7)
Class 1 Class 2 Class 3 Class 4 Class 5
Bin No. (No. of Correctly Classified Days)
Avg.
Con
c. (µ
g/m
3)
ECNO3OMSO4
ICF International 3-108 VISTAS Meteorological Characterization 06-046 December 8, 2006

Characterization of Meteorology and Its Relationships to Fine Particulate Mass and Visibility in the VISTAS Region Examination of Relationships between Meteorological and Air Quality Data Using
Classification and Regression Tree (CART) Analysis
Figure 3-6e. Average Elemental Carbon (EC), Nitrate (NO3), Organic Matter (OM), and Sulfate (SO4) Concentrations (μgm-3) for Key Visibility Bins for All CART Classification Categories: IMPROVE Site
Cape Romain.
Cape Romain Key Visibility Bins: Component Averages
0.00
2.00
4.00
6.00
8.00
10.00
12.00
14 (30) 4 (26) 1 (14) 3 (28) 5 (21) 29 (11) 22 (45) 10 (14) 20 (14) 33 (12) 21 (7) 17 (9) 27 (8) 32 (17)
Class 1 Class 2 Class 3 Class 4 Class5
Bin No. (No. of Correctly Classified Days)
Avg.
Con
c. (µ
g/m
3)
ECNO3OMSO4
Figure 3-6f. Average Elemental Carbon (EC), Nitrate (NO3), Organic Matter (OM), and Sulfate (SO4) Concentrations (μgm-3) for Key Visibility Bins for All CART Classification Categories: IMPROVE Site
Chassahowitzka.
Chassahowitzka Key Visibility Bins: Component Averages
0.00
2.00
4.00
6.00
8.00
10.00
7 (31) 9 (14) 12 (26) 18 (8) 14 (6) 26 (28) 2 (9) 35 (8) 30 (12) 17 (5) 36 (7) 29 (5)
Class 1 Class 2 Class 3 Class 4 Class 5
Bin No. (No. of Correctly Classified Days)
Avg.
Con
c. (µ
g/m
3)
ECNO3OMSO4
ICF International 3-109 VISTAS Meteorological Characterization 06-046 December 8, 2006

Characterization of Meteorology and Its Relationships to Fine Particulate Mass and Visibility in the VISTAS Region Examination of Relationships between Meteorological and Air Quality Data Using
Classification and Regression Tree (CART) Analysis
Figure 3-6g. Average Elemental Carbon (EC), Nitrate (NO3), Organic Matter (OM), and Sulfate (SO4) Concentrations (μgm-3) for Key Visibility Bins for All CART Classification Categories: IMPROVE
Site Cohutta.
Cohutta Key Visibility Bins: Component Averages
0.002.004.006.008.00
10.0012.0014.0016.00
1 (35) 10 (15) 9 (11) 2 (51) 12 (10) 13 (8) 17 (33) 15 (13) 4 (9) 27 (13) 19 (6) 22 (5) 28 (12)
Class 1 Class 2 Class 3 Class 4 Class 5
Bin No. (No. of Correctly Classified Days)
Avg.
Con
c. (µ
g/m
3)
ECNO3OMSO4
Figure 3-6h. Average Elemental Carbon (EC), Nitrate (NO3), Organic Matter (OM), and Sulfate (SO4) Concentrations (μgm-3) for Key Visibility Bins for All CART Classification Categories: IMPROVE
Site Dolly Sods.
Dolly Sods Key Visibility Bins: Component Averages
0.002.004.006.008.00
10.0012.0014.0016.0018.00
5 (43) 2 (57) 6 (16) 1 (21) 29 (30) 8 (24) 21 (14) 15 (15) 25 (7) 22 (10) 13 (9) 19 (12)
Class 1 Class 2 Class 3 Class 4 Class 5
Bin No. (No. of Correctly Classified Days)
Avg.
Con
c. (µ
g/m
3)
ECNO3OMSO4
ICF International 3-110 VISTAS Meteorological Characterization 06-046 December 8, 2006

Characterization of Meteorology and Its Relationships to Fine Particulate Mass and Visibility in the VISTAS Region Examination of Relationships between Meteorological and Air Quality Data Using
Classification and Regression Tree (CART) Analysis
Figure 3-6i. Average Elemental Carbon (EC), Nitrate (NO3), Organic Matter (OM), and Sulfate (SO4) Concentrations (μgm-3) for Key Visibility Bins for All CART Classification Categories: IMPROVE
Site Everglades.
Everglades Key Visibility Bins: Component Averages
0.00
2.00
4.00
6.00
8.00
10.00
16 (30) 8 (10) 10 (28) 1 (14) 15 (12) 3 (33) 12 (22) 21 (13) 22 (20) 24 (7) 36 (16)
Class 1 Class 2 Class 3 Class 4 Class 5
Bin No. (No. of Correctly Classified Days)
Avg.
Con
c. (µ
g/m
3)
ECNO3OMSO4
Figure 3-6j. Average Elemental Carbon (EC), Nitrate (NO3), Organic Matter (OM), and Sulfate (SO4) Concentrations (μgm-3) for Key Visibility Bins for All CART Classification Categories: IMPROVE
Site Great Smoky Mountains.
Great Smoky Mountains Key Visibility Bins: Component Averages
0.002.004.006.008.00
10.0012.0014.0016.00
1 (43) 6 (9) 5 (42) 13 (33) 4 (22) 26 (32) 7 (12) 28 (9) 27 (13) 29 (14) 18 (12) 35 (10) 32 (8) 15 (3)
Class 1 Class 2 Class 3 Class 4 Class 5
Bin No. (No. of Correctly Classified Days)
Avg.
Con
c. (µ
g/m
3)
ECNO3OMSO4
ICF International 3-111 VISTAS Meteorological Characterization 06-046 December 8, 2006

Characterization of Meteorology and Its Relationships to Fine Particulate Mass and Visibility in the VISTAS Region Examination of Relationships between Meteorological and Air Quality Data Using
Classification and Regression Tree (CART) Analysis
Figure 3-6k. Average Elemental Carbon (EC), Nitrate (NO3), Organic Matter (OM), and Sulfate (SO4) Concentrations (μgm-3) for Key Visibility Bins for All CART Classification Categories: IMPROVE Site
James River Face.
James River Face Key Visibility Bins: Component Averages
0.00
2.00
4.00
6.00
8.00
10.00
12.00
1 (73) 4 (59) 10 (20) 23 (45) 26 (15) 20 (12) 34 (13) 35 (10) 18 (10) 37 (16)
Class 1 Class 2 Class 3 Class 4 Class 5
Bin No. (No. of Correctly Classified Days)
Avg.
Con
c. (µ
g/m
3)
ECNO3OMSO4
Figure 3-6l. Average Elemental Carbon (EC), Nitrate (NO3), Organic Matter (OM), and Sulfate (SO4) Concentrations (μgm-3) for Key Visibility Bins for All CART Classification Categories: IMPROVE Site
Linville Gorge.
Linville Gorge Key Visibility Bins: Component Averages
0.00
2.00
4.00
6.00
8.00
10.00
12.00
1 (37) 2 (24) 3 (30) 11 (19) 9 (17) 30 (17) 12 (31) 32 (28) 17 (10) 7 (10) 20 (21) 23 (14) 28 (12)
Class 1 Class 2 Class 3 Class 4 Class 5
Bin No. (No. of Correctly Classified Days)
Avg.
Con
c. (µ
g/m
3)
ECNO3OMSO4
ICF International 3-112 VISTAS Meteorological Characterization 06-046 December 8, 2006
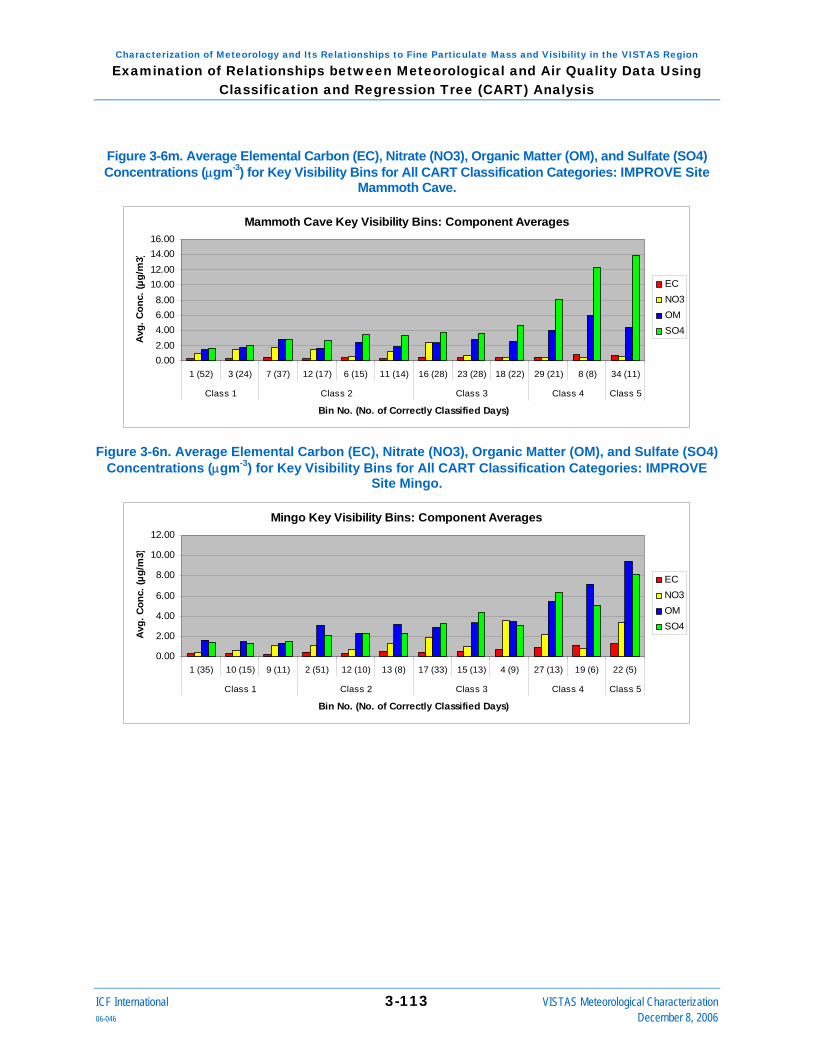
Characterization of Meteorology and Its Relationships to Fine Particulate Mass and Visibility in the VISTAS Region Examination of Relationships between Meteorological and Air Quality Data Using
Classification and Regression Tree (CART) Analysis
Figure 3-6m. Average Elemental Carbon (EC), Nitrate (NO3), Organic Matter (OM), and Sulfate (SO4) Concentrations (μgm-3) for Key Visibility Bins for All CART Classification Categories: IMPROVE Site
Mammoth Cave.
Mammoth Cave Key Visibility Bins: Component Averages
0.002.004.006.008.00
10.0012.0014.0016.00
1 (52) 3 (24) 7 (37) 12 (17) 6 (15) 11 (14) 16 (28) 23 (28) 18 (22) 29 (21) 8 (8) 34 (11)
Class 1 Class 2 Class 3 Class 4 Class 5
Bin No. (No. of Correctly Classified Days)
Avg.
Con
c. (µ
g/m
3)
ECNO3OMSO4
Figure 3-6n. Average Elemental Carbon (EC), Nitrate (NO3), Organic Matter (OM), and Sulfate (SO4) Concentrations (μgm-3) for Key Visibility Bins for All CART Classification Categories: IMPROVE
Site Mingo.
Mingo Key Visibility Bins: Component Averages
0.00
2.00
4.00
6.00
8.00
10.00
12.00
1 (35) 10 (15) 9 (11) 2 (51) 12 (10) 13 (8) 17 (33) 15 (13) 4 (9) 27 (13) 19 (6) 22 (5)
Class 1 Class 2 Class 3 Class 4 Class 5
Bin No. (No. of Correctly Classified Days)
Avg.
Con
c. (µ
g/m
3)
ECNO3OMSO4
ICF International 3-113 VISTAS Meteorological Characterization 06-046 December 8, 2006

Characterization of Meteorology and Its Relationships to Fine Particulate Mass and Visibility in the VISTAS Region Examination of Relationships between Meteorological and Air Quality Data Using
Classification and Regression Tree (CART) Analysis
Figure 3-6o. Average Elemental Carbon (EC), Nitrate (NO3), Organic Matter (OM), and Sulfate (SO4) Concentrations (μgm-3) for Key Visibility Bins for All CART Classification Categories: IMPROVE
Site Okefenokee.
Okefenokee Key Visibility Bins: Component Averages
0.00
2.00
4.00
6.00
8.00
10.00
12.00
26 (38) 7 (13) 27 (10) 2 (54) 20 (32) 24 (10) 9 (10) 15 (29) 18 (15) 25 (9) 34 (17) 16 (8) 22 (11) 30 (13)
Class 1 Class 2 Class 3 Class 4 Class5
Bin No. (No. of Correctly Classified Days)
Avg.
Con
c. (µ
g/m
3)
ECNO3OMSO4
Figure 3-6p. Average Elemental Carbon (EC), Nitrate (NO3), Organic Matter (OM), and Sulfate (SO4) Concentrations (μgm-3) for Key Visibility Bins for All CART Classification Categories: IMPROVE Site
Shenandoah.
Shenandoah Key Visibility Bins: Component Averages
0.00
2.00
4.00
6.00
8.00
10.00
12.00
2 (43) 3 (23) 7 (30) 4 (20) 15 (15) 21 (34) 11 (32) 32 (22) 36 (20) 38 (18) 34 (6) 28 (13)
Class 1 Class 2 Class 3 Class 4 Class 5
Bin No. (No. of Correctly Classified Days)
Avg.
Con
c. (µ
g/m
3)
ECNO3OMSO4
ICF International 3-114 VISTAS Meteorological Characterization 06-046 December 8, 2006

Characterization of Meteorology and Its Relationships to Fine Particulate Mass and Visibility in the VISTAS Region Examination of Relationships between Meteorological and Air Quality Data Using
Classification and Regression Tree (CART) Analysis
Figure 3-6q. Average Elemental Carbon (EC), Nitrate (NO3), Organic Matter (OM), and Sulfate (SO4) Concentrations (μgm-3) for Key Visibility Bins for All CART Classification Categories: IMPROVE Site
Shining Rock.
Shining Rock Key Visibility Bins: Component Averages
0.00
2.00
4.00
6.00
8.00
10.00
12.00
14.00
2 (33) 7 (9) 10 (9) 8 (47) 4 (16) 21 (38) 19 (23) 11 (15) 31 (9) 25 (5) 28 (10)
Class 1 Class 2 Class 3 Class 4 Class 5
Bin No. (No. of Correctly Classified Days)
Avg.
Con
c. (µ
g/m
3)
ECNO3OMSO4
Figure 3-6r. Average Elemental Carbon (EC), Nitrate (NO3), Organic Matter (OM), and Sulfate (SO4) Concentrations (μgm-3) for Key Visibility Bins for All CART Classification Categories: IMPROVE
Site Sipsey.
Sipsy Key Visibility Bins: Component Averages
0.00
2.00
4.00
6.00
8.00
10.00
12.00
2 (8) 7 (1) 10 (4) 8 (3) 4 (6) 21 (5) 19 (32) 11 (3) 31 (5) 25 (12) 28 (9) 29 (9)
Class 1 Class 2 Class 3 Class 4 Class 5
Bin No. (No. of Correctly Classified Days)
Avg.
Con
c. (µ
g/m
3)
ECNO3OMSO4
ICF International 3-115 VISTAS Meteorological Characterization 06-046 December 8, 2006

Characterization of Meteorology and Its Relationships to Fine Particulate Mass and Visibility in the VISTAS Region Examination of Relationships between Meteorological and Air Quality Data Using
Classification and Regression Tree (CART) Analysis
Figure 3-6s. Average Elemental Carbon (EC), Nitrate (NO3), Organic Matter (OM), and Sulfate (SO4) Concentrations (μgm-3) for Key Visibility Bins for All CART Classification Categories: IMPROVE
Site St Mark’s.
St. Marks Key Visibility Bins: Component Averages
0.00
2.00
4.00
6.00
8.00
10.00
2 (25) 6 (11) 13 (8) 4 (22) 15 (10) 11 (11) 3 (19) 29 (18) 23 (15) 21 (22) 19 (4) 27 (4)
Class 1 Class 2 Class 3 Class 4 Class 5
Bin No. (No. of Correctly Classified Days)
Avg.
Con
c. (µ
g/m
3)
ECNO3OMSO4
Figure 3-6t. Average Elemental Carbon (EC), Nitrate (NO3), Organic Matter (OM), and Sulfate (SO4) Concentrations (μgm-3) for Key Visibility Bins for All CART Classification Categories: IMPROVE Site
Swanquarter.
Swanquarter Key Visibility Bins: Component Averages
0.00
2.00
4.00
6.00
8.00
10.00
2 (17) 19 (12) 4 (6) 5 (40) 29 (9) 14 (31) 31 (19) 7 (9) 28 (6) 30 (6) 23 (6) 27 (15)
Class 1 Class 2 Class 3 Class 4 Class 5
Bin No. (No. of Correctly Classified Days)
Avg.
Con
c. (µ
g/m
3)
ECNO3OMSO4
ICF International 3-116 VISTAS Meteorological Characterization 06-046 December 8, 2006

Characterization of Meteorology and Its Relationships to Fine Particulate Mass and Visibility in the VISTAS Region Examination of Relationships between Meteorological and Air Quality Data Using
Classification and Regression Tree (CART) Analysis
Figure 3-6u. Average Elemental Carbon (EC), Nitrate (NO3), Organic Matter (OM), and Sulfate (SO4) Concentrations (μgm-3) for Key Visibility Bins for All CART Classification Categories: IMPROVE Site
Upper Buffalo.
Swanquarter Key Visibility Bins: Component Averages
0.00
2.00
4.00
6.00
8.00
10.00
2 (17) 19 (12) 4 (6) 5 (40) 29 (9) 14 (31) 31 (19) 7 (9) 28 (6) 30 (6) 23 (6) 27 (15)
Class 1 Class 2 Class 3 Class 4 Class 5
Bin No. (No. of Correctly Classified Days)
Avg.
Con
c. (µ
g/m
3)
ECNO3OMSO4
The compositional charts clearly illustrate that the relative contributions of various PM2.5 components vary by bin for each of the sites. The high PM2.5 concentration bins are distinguished from the lower concentration bins by higher sulfate and organic matter concentrations, and, in many cases, lower nitrate concentrations. Within each category, there are variations among the bins that are due to differences in meteorology as well as regional pollutant transport.
For example, consider the three poor visibility bins for Mammoth Cave (Bins 29, 8 and 34). Earlier in this section, we noted that days within Bin 34 are characterized by lower surface wind speeds and higher regional (potential upwind) concentrations than those within Bin 29. In the compositional chart (Figure 3-6m), these differences are manifested as higher sulfate, with little difference in the other components. Bin 8 days have, on average, comparable surface wind speeds and regional concentrations compared to days in Bin 34. Lower relative humidity for Bin 8 may contribute to the lower sulfate concentrations. Winds from the north-northeast (compared to the south) may explain the higher organic matter component, with possible transport of particulates and precursors from Midwestern urban areas such as Louisville, Lexington, and Cincinnati.
In general, the CART-based compositional analysis results indicate that, for the interior and mountain IMPROVE sites in the VISTAS states, ammonium sulfate is the dominant contributor to PM2.5 concentration and organic carbon is an important component of PM2.5 on poor visibility days. For the coastal IMPROVE sites the contributions from ammonium sulfate and organic carbon to PM2.5 on the poor visibility days are more comparable than at the interior sites.
PM2.5 Tables 3-15 through 3-17 summarize the characteristics for key Category 3 and 4 bins for PM2.5 for the IMPROVE, STN and SEARCH monitoring sites, respectively. The Category 3 and 4 bins represent the 10 percent highest PM2.5 days.
ICF International 3-117 VISTAS Meteorological Characterization 06-046 December 8, 2006
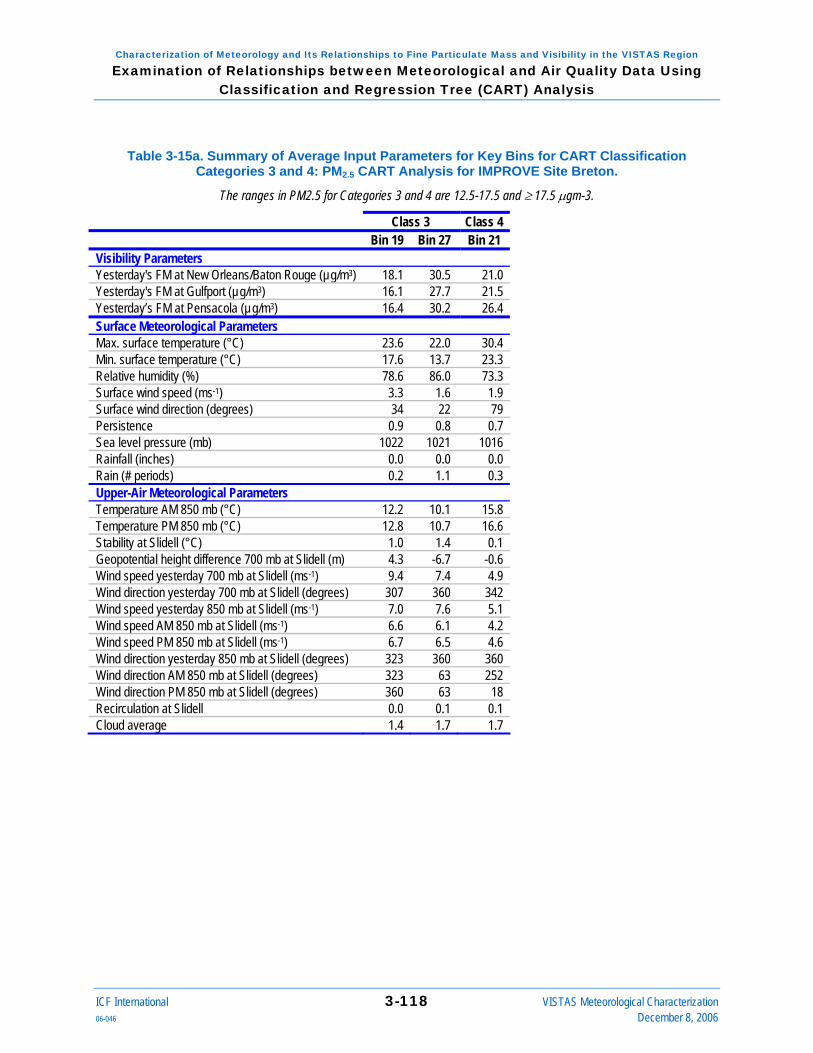
Characterization of Meteorology and Its Relationships to Fine Particulate Mass and Visibility in the VISTAS Region Examination of Relationships between Meteorological and Air Quality Data Using
Classification and Regression Tree (CART) Analysis
ICF International 3-118 VISTAS Meteorological Characterization 06-046 December 8, 2006
Table 3-15a. Summary of Average Input Parameters for Key Bins for CART Classification Categories 3 and 4: PM2.5 CART Analysis for IMPROVE Site Breton.
The ranges in PM2.5 for Categories 3 and 4 are 12.5-17.5 and ≥ 17.5 μgm-3.
Class 3 Class 4 Bin 19 Bin 27 Bin 21 Visibility Parameters Yesterday's FM at New Orleans/Baton Rouge (µg/m3) 18.1 30.5 21.0 Yesterday's FM at Gulfport (µg/m3) 16.1 27.7 21.5 Yesterday’s FM at Pensacola (µg/m3) 16.4 30.2 26.4 Surface Meteorological Parameters Max. surface temperature (°C) 23.6 22.0 30.4 Min. surface temperature (°C) 17.6 13.7 23.3 Relative humidity (%) 78.6 86.0 73.3 Surface wind speed (ms-1) 3.3 1.6 1.9 Surface wind direction (degrees) 34 22 79 Persistence 0.9 0.8 0.7 Sea level pressure (mb) 1022 1021 1016 Rainfall (inches) 0.0 0.0 0.0 Rain (# periods) 0.2 1.1 0.3 Upper-Air Meteorological Parameters Temperature AM 850 mb (°C) 12.2 10.1 15.8 Temperature PM 850 mb (°C) 12.8 10.7 16.6 Stability at Slidell (°C) 1.0 1.4 0.1 Geopotential height difference 700 mb at Slidell (m) 4.3 -6.7 -0.6 Wind speed yesterday 700 mb at Slidell (ms-1) 9.4 7.4 4.9 Wind direction yesterday 700 mb at Slidell (degrees) 307 360 342 Wind speed yesterday 850 mb at Slidell (ms-1) 7.0 7.6 5.1 Wind speed AM 850 mb at Slidell (ms-1) 6.6 6.1 4.2 Wind speed PM 850 mb at Slidell (ms-1) 6.7 6.5 4.6 Wind direction yesterday 850 mb at Slidell (degrees) 323 360 360 Wind direction AM 850 mb at Slidell (degrees) 323 63 252 Wind direction PM 850 mb at Slidell (degrees) 360 63 18 Recirculation at Slidell 0.0 0.1 0.1 Cloud average 1.4 1.7 1.7

Characterization of Meteorology and Its Relationships to Fine Particulate Mass and Visibility in the VISTAS Region Examination of Relationships between Meteorological and Air Quality Data Using
Classification and Regression Tree (CART) Analysis
ICF International 3-119 VISTAS Meteorological Characterization 06-046 December 8, 2006
Table 3-15b. Summary of Average Input Parameters for Key Bins for CART Classification Categories 3 and 4: PM2.5 CART Analysis IMPROVE Site Brigantine.
The ranges in PM2.5 for Categories 3 and 4 are 17.5-22.5 and ≥ 22.5 μgm-3.
Class 3 Class 4 Bin 23 Bin 29 Bin 31 Visibility Parameters Yesterday's FM at Wilmington (µg/m3) 15.1 29.7 33.2 Yesterday's FM at New Orleans (µg/m3) 18.1 24.6 26.8 Yesterday's FM at Philadelphia (µg/m3) 14.1 26.5 32.8 Surface Meteorological Parameters Max. surface temperature (°C) 29.6 30.3 31.8 Min. surface temperature (°C) 18.7 18.1 21.1 Relative humidity (%) 73.9 64.5 67.2 Surface wind speed (ms-1) 2.9 3.1 2.8 Surface wind direction (degrees) 209 225 207 Persistence 0.9 0.8 0.8 Sea level pressure (mb) 1018 1020 1016 Rainfall (inches) 0.0 0.0 0.0 Rain (# periods) 0.4 0.3 0.5 Upper-Air Meteorological Parameters Temperature AM 850 mb (°C) 14.3 14.2 16.1 Temperature PM 850 mb (°C) 15.0 14.4 17.5 Stability at Brookhaven (°C) -0.7 0.0 -0.1 Geopotential height difference 700 mb at Brookhaven (m) 6.2 -4.8 1.0 Wind speed yesterday 700 mb at Brookhaven (ms-1) 8.1 13.1 9.2 Wind speed yesterday 700 mb at Dulles (ms-1) 8.7 12.5 6.7 Wind direction yesterday 700 mb at Brookhaven (degrees) 288 252 306 Wind direction yesterday 700 mb at Dulles (degrees) 292 252 288 Wind speed yesterday 850 mb at Brookhaven (ms-1) 6.3 11.7 9.0 Wind speed yesterday 850 mb at Dulles (ms-1) 6.8 12.1 5.9 Wind speed AM 850 mb at Brookhaven (ms-1) 10.0 11.4 8.6 Wind speed AM 850 mb at Dulles (ms-1) 8.4 10.5 6.6 Wind speed PM 850 mb at Brookhaven (ms-1) 10.1 9.2 9.7 Wind speed PM 850 mb at Dulles (ms-1) 8.3 7.7 8.0 Wind direction yesterday 850 mb at Brookhaven (degrees) 281 252 304 Wind direction yesterday 850 mb at Dulles (degrees) 270 225 270 Wind direction AM 850 mb at Brookhaven (degrees) 275 270 284 Wind direction AM 850 mb at Dulles (degrees) 270 252 293 Wind direction PM 850 mb at Brookhaven (degrees) 270 270 275 Wind direction PM 850 mb at Dulles (degrees) 257 288 304 Cloud average 1.9 1.8 2.0

Characterization of Meteorology and Its Relationships to Fine Particulate Mass and Visibility in the VISTAS Region Examination of Relationships between Meteorological and Air Quality Data Using
Classification and Regression Tree (CART) Analysis
ICF International 3-120 VISTAS Meteorological Characterization 06-046 December 8, 2006
Table 3-15c. Summary of Average Input Parameters for Key Bins for CART Classification Categories 3 and 4: PM2.5 CART Analysis for IMPROVE Site Cadiz.
The ranges in PM2.5 for Categories 3 and 4 are 17.5-22.5 and ≥ 22.5 μgm-3.
Class 3 Class 4 Bin 23 Bin 6 Bin 30 Visibility Parameters Yesterday's FM at Nashville (µg/m3) 21.7 11.9 28.7 Yesterday's FM at St. Louis (µg/m3) 20.6 23.9 28.4 Yesterday's FM at Louisville (µg/m3) 21.7 18.0 39.7 Surface Meteorological Parameters Max. surface temperature (°C) 28.2 19.6 26.7 Min. surface temperature (°C) 17.5 10.9 17.3 Relative humidity (%) 72.4 78.5 76.2 Surface wind speed (ms-1) 1.4 1.8 1.3 Surface wind direction (degrees) 360 360 n/a Persistence 0.9 0.8 0.8 Rainfall (inches) 0.0 0.0 0.1 Rain (# periods) 0.0 0.2 0.4 Solar radiation (W/m2) 822 431 554 Upper-Air Meteorological Parameters Temperature AM 850 mb (°C) 16.8 9.0 15.5 Temperature PM 850 mb (°C) 17.1 11.1 15.8 Stability at Nashville (°C) 1.8 -0.4 1.5 Geopotential height difference 700 mb at Nashville (m) 7.9 18.9 2.2 Wind speed yesterday 700 mb at Nashville (ms-1) 7.9 11.6 7.7 Wind direction yesterday 700 mb at Nashville (degrees) 342 252 27 Wind speed yesterday 850 mb at Nashville (ms-1) 4.2 9.0 4.3 Wind speed AM 850 mb at Nashville (ms-1) 4.0 4.8 5.5 Wind speed PM 850 mb at Nashville (ms-1) 4.3 2.8 5.1 Wind direction yesterday 850 mb at Nashville (degrees) 45 270 360 Wind direction AM 850 mb at Nashville (degrees) 45 297 270 Wind direction PM 850 mb at Nashville (degrees) n/a 180 153 Recirculation at Nashville 0.3 0.0 0.2 Cloud average 1.4 1.8 1.8
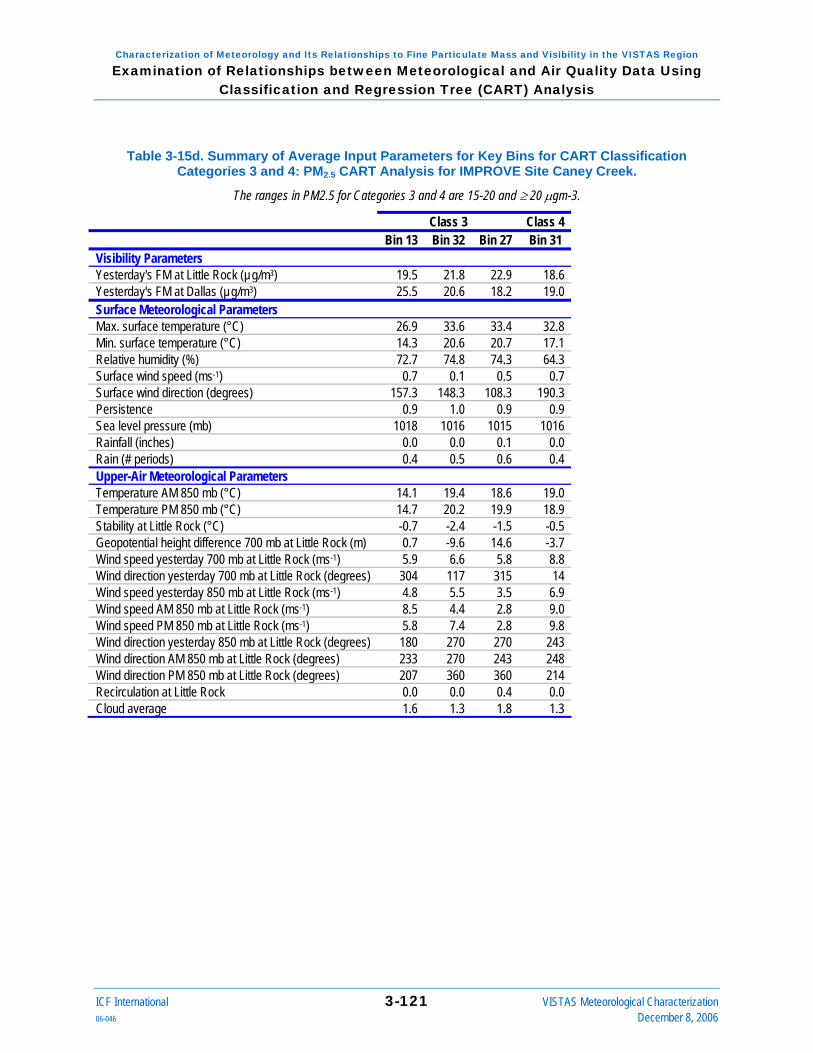
Characterization of Meteorology and Its Relationships to Fine Particulate Mass and Visibility in the VISTAS Region Examination of Relationships between Meteorological and Air Quality Data Using
Classification and Regression Tree (CART) Analysis
ICF International 3-121 VISTAS Meteorological Characterization 06-046 December 8, 2006
Table 3-15d. Summary of Average Input Parameters for Key Bins for CART Classification Categories 3 and 4: PM2.5 CART Analysis for IMPROVE Site Caney Creek.
The ranges in PM2.5 for Categories 3 and 4 are 15-20 and ≥ 20 μgm-3.
Class 3 Class 4 Bin 13 Bin 32 Bin 27 Bin 31 Visibility Parameters Yesterday's FM at Little Rock (µg/m3) 19.5 21.8 22.9 18.6 Yesterday's FM at Dallas (µg/m3) 25.5 20.6 18.2 19.0 Surface Meteorological Parameters Max. surface temperature (°C) 26.9 33.6 33.4 32.8 Min. surface temperature (°C) 14.3 20.6 20.7 17.1 Relative humidity (%) 72.7 74.8 74.3 64.3 Surface wind speed (ms-1) 0.7 0.1 0.5 0.7 Surface wind direction (degrees) 157.3 148.3 108.3 190.3 Persistence 0.9 1.0 0.9 0.9 Sea level pressure (mb) 1018 1016 1015 1016 Rainfall (inches) 0.0 0.0 0.1 0.0 Rain (# periods) 0.4 0.5 0.6 0.4 Upper-Air Meteorological Parameters Temperature AM 850 mb (°C) 14.1 19.4 18.6 19.0 Temperature PM 850 mb (°C) 14.7 20.2 19.9 18.9 Stability at Little Rock (°C) -0.7 -2.4 -1.5 -0.5 Geopotential height difference 700 mb at Little Rock (m) 0.7 -9.6 14.6 -3.7 Wind speed yesterday 700 mb at Little Rock (ms-1) 5.9 6.6 5.8 8.8 Wind direction yesterday 700 mb at Little Rock (degrees) 304 117 315 14 Wind speed yesterday 850 mb at Little Rock (ms-1) 4.8 5.5 3.5 6.9 Wind speed AM 850 mb at Little Rock (ms-1) 8.5 4.4 2.8 9.0 Wind speed PM 850 mb at Little Rock (ms-1) 5.8 7.4 2.8 9.8 Wind direction yesterday 850 mb at Little Rock (degrees) 180 270 270 243 Wind direction AM 850 mb at Little Rock (degrees) 233 270 243 248 Wind direction PM 850 mb at Little Rock (degrees) 207 360 360 214 Recirculation at Little Rock 0.0 0.0 0.4 0.0 Cloud average 1.6 1.3 1.8 1.3

Characterization of Meteorology and Its Relationships to Fine Particulate Mass and Visibility in the VISTAS Region Examination of Relationships between Meteorological and Air Quality Data Using
Classification and Regression Tree (CART) Analysis
ICF International 3-122 VISTAS Meteorological Characterization 06-046 December 8, 2006
Table 3-15e. Summary of Average Input Parameters for Key Bins for CART Classification Categories 3 and 4: PM2.5 CART Analysis for IMPROVE Site Cape Romain.
The ranges in PM2.5 for Categories 3 and 4 are 15-17.5 and ≥ 17.5 μgm-3.
Class 3 Class 4 Bin 15 Bin 31 Bin 22 Bin 33 Visibility Parameters Yesterday's FM at Charleston (µg/m3) 13.0 21.5 24.5 29.7 Surface Meteorological Parameters Max. surface temperature (°C) 17.9 34.6 28.2 31.0 Min. surface temperature (°C) 7.8 23.6 18.0 19.1 Relative humidity (%) 67.9 73.8 77.5 68.9 Surface wind speed (ms-1) 3.3 2.7 1.5 2.9 Surface wind direction (degrees) 225 225 153 214 Persistence 0.9 0.9 0.5 0.9 Sea level pressure (mb) 1020 1014 1018 1017 Rainfall (inches) 0.0 0.0 0.0 0.0 Rain (# periods) 0.8 0.3 0.6 0.3 Upper-Air Meteorological Parameters Temperature AM 850 mb (°C) 7.9 19.2 14.5 14.7 Temperature PM 850 mb (°C) 9.7 20.2 14.7 16.4 Stability at Charleston (°C) 2.3 -1.3 -0.6 -1.1 Geopotential height difference 700 mb at Charleston (m) 5.0 -13.3 -3.5 -13.2 Wind speed yesterday 700 mb at Charleston (ms-1) 19.9 8.4 7.7 8.3 Wind direction yesterday 700 mb at Charleston (degrees) 270 342 300 326 Wind speed yesterday 850 mb at Charleston (ms-1) 14.1 5.0 7.3 5.2 Wind speed AM 850 mb at Charleston (ms-1) 8.5 6.2 8.0 6.8 Wind speed PM 850 mb at Charleston (ms-1) 15.4 7.0 6.4 7.3 Wind direction yesterday 850 mb at Charleston (degrees) 270 360 291 333 Wind direction AM 850 mb at Charleston (degrees) 270 360 291 304 Wind direction PM 850 mb at Charleston (degrees) 270 342 329 307 Recirculation at Charleston 0.0 0.3 0.1 0.0 Cloud average 1.7 1.8 1.8 1.4

Characterization of Meteorology and Its Relationships to Fine Particulate Mass and Visibility in the VISTAS Region Examination of Relationships between Meteorological and Air Quality Data Using
Classification and Regression Tree (CART) Analysis
ICF International 3-123 VISTAS Meteorological Characterization 06-046 December 8, 2006
Table 3-15f. Summary of Average Input Parameters for Each Key Bins for CART Classification Categories 3 and 4: PM2.5 CART Analysis for IMPROVE Site Chassahowitzka.
The ranges in PM2.5 for Categories 3 and 4 are 12.5-17.5 and ≥ 17.5 μgm-3.
Class 3 Class 4 Bin 13 Bin 8 Bin 27 Visibility Parameters Yesterday's FM at Tampa (µg/m3) 15.4 15.6 25.8 Yesterday's FM at Orlando (µg/m3) 13.4 11.6 20.3 Surface Meteorological Parameters Max. surface temperature (°C) 29.1 28.0 30.9 Min. surface temperature (°C) 17.7 13.1 17.0 Relative humidity (%) 80.9 78.8 79.9 Surface wind speed (ms-1) 1.8 1.1 1.5 Surface wind direction (degrees) 360 288 270 Persistence 0.8 0.6 0.6 Sea level pressure (mb) 1019 1020 1018 Rainfall (inches) 0.2 0.0 0.0 Rain (# periods) 0.7 0.0 0.2 Upper-Air Meteorological Parameters Temperature AM 850 mb (°C) 15.2 13.7 15.3 Temperature PM 850 mb (°C) 15.4 13.4 16.0 Stability at Tampa (°C) -2.2 -0.9 -0.9 Geopotential height difference 700 mb at Tampa (m) -2.0 -3.3 -0.3 Wind speed yesterday 700 mb at Tampa (ms-1) 5.6 5.9 5.5 Wind direction yesterday 700 mb at Tampa (degrees) 23 270 297 Wind speed yesterday 850 mb at Tampa (ms-1) 5.1 3.7 4.6 Wind speed AM 850 mb at Tampa (ms-1) 2.9 3.9 4.9 Wind speed PM 850 mb at Tampa (ms-1) 5.3 4.6 5.0 Wind direction yesterday 850 mb at Tampa (degrees) 53 72 104 Wind direction AM 850 mb at Tampa (degrees) 90 225 180 Wind direction PM 850 mb at Tampa (degrees) 108 117 90 Recirculation at Tampa 0.1 0.3 0.0 Cloud average 2.2 1.6 1.2

Characterization of Meteorology and Its Relationships to Fine Particulate Mass and Visibility in the VISTAS Region Examination of Relationships between Meteorological and Air Quality Data Using
Classification and Regression Tree (CART) Analysis
ICF International 3-124 VISTAS Meteorological Characterization 06-046 December 8, 2006
Table 3-15g. Summary of Average Input Parameters for Key Bins for CART Classification Categories 3 and 4: PM2.5 CART Analysis for IMPROVE Site Cohutta.
The ranges in PM2.5 for Categories 3 and 4 are 20-25 and ≥ 25 μgm-3.
Class 3 Class 4 Bin 21 Bin 29 Visibility Parameters Yesterday's FM at Birmingham (µg/m3) 36.4 34.1 Yesterday's FM at Atlanta (µg/m3) 30.2 35.5 Yesterday's FM at Nashville (µg/m3) 21.0 31.1 Yesterday's FM at Knoxville (µg/m3) 27.4 38.8 Surface Meteorological Parameters Max. surface temperature (°C) 32.3 32.3 Min. surface temperature (°C) 20.0 19.1 Relative humidity (%) 71.4 76.8 Surface wind speed (ms-1) 0.9 0.6 Surface wind direction (degrees) 198 180 Persistence 0.9 0.6 Rainfall (inches) 0.1 0.0 Rain (# periods) 0.4 0.2 Upper-Air Meteorological Parameters Temperature AM 850 mb (°C) 16.9 16.7 Temperature PM 850 mb (°C) 17.6 17.8 Stability at Atlanta (°C) 2.4 2.3 Geopotential height difference 700 mb at Atlanta (m) -6.8 -7.0 Wind speed yesterday 700 mb at Atlanta (ms-1) 4.3 5.1 Wind direction yesterday 700 mb at Atlanta (degrees) 360 98 Wind speed yesterday 850 mb at Atlanta (ms-1) 3.6 3.7 Wind speed AM 850 mb at Atlanta (ms-1) 2.9 4.8 Wind speed PM 850 mb at Atlanta (ms-1) 5.0 4.7 Wind direction yesterday 850 mb at Atlanta (degrees) 8 117 Wind direction AM 850 mb at Atlanta (degrees) 333 117 Wind direction PM 850 mb at Atlanta (degrees) 135 90 Recirculation at Atlanta 0.3 0.2 Cloud average 1.9 1.7

Characterization of Meteorology and Its Relationships to Fine Particulate Mass and Visibility in the VISTAS Region Examination of Relationships between Meteorological and Air Quality Data Using
Classification and Regression Tree (CART) Analysis
ICF International 3-125 VISTAS Meteorological Characterization 06-046 December 8, 2006
Table 3-15h. Summary of Average Input Parameters for Key Bins for CART Classification Categories 3 and 4: PM2.5 CART Analysis for IMPROVE Site Dolly Sods.
The ranges in PM2.5 for Categories 3 and 4 are 17.5-22.5 and ≥ 22.5 μgm-3.
Class 3 Class 4 Bin 21 Bin 18 Bin 23 Bin 27 Visibility Parameters Yesterday's FM at DC (µg/m3) 18.0 14.1 36.3 28.1 Yesterday's FM at Richmond (µg/m3) 18.9 14.7 26.7 23.1 Yesterday's FM at Columbus (µg/m3) 30.1 15.4 33.9 28.4 Surface Meteorological Parameters Max. surface temperature (°C) 27.6 26.3 26.5 26.9 Min. surface temperature (°C) 15.4 14.6 16.9 15.9 Relative humidity (%) 75.0 68.4 73.9 70.8 Surface wind speed (ms-1) 0.4 0.4 0.4 0.6 Surface wind direction (degrees) 76 252 284 360 Persistence 0.3 0.3 0.3 0.4 Rainfall (inches) 0.1 0.0 0.1 0.0 Rain (# periods) 0.4 0.5 0.6 0.0 Solar radiation (W/m2) 732 692 695 735 Upper-Air Meteorological Parameters Temperature AM 850 mb (°C) 15.9 16.1 16.1 14.2 Temperature PM 850 mb (°C) 17.0 16.9 17.1 15.4 Stability at Pittsburgh (°C) 2.1 1.9 2.5 -1.0 Geopotential height difference 700 mb at Pittsburgh (m) -2.9 4.8 -27.5 30.3 Wind speed yesterday 700 mb at Dulles (ms-1) 7.5 7.2 6.9 6.5 Wind speed yesterday 700 mb at Roanoke (ms-1) 6.3 4.9 6.3 4.6 Wind speed yesterday 700 mb at Wilmington (ms-1) 7.7 11.4 6.0 4.9 Wind speed yesterday 700 mb at Pittsburgh (ms-1) 10.4 10.4 8.5 6.0 Wind direction yesterday 700 mb at Dulles (degrees) 315 288 297 315 Wind direction yesterday 700 mb at Roanoke (degrees) 346 288 309 270 Wind direction yesterday 700 mb at Wilmington (degrees) 270 288 284 270 Wind direction yesterday 700 mb at Pittsburgh (degrees) 277 288 297 315 Wind speed yesterday 850 mb at Dulles (ms-1) 4.6 5.1 6.5 2.4 Wind speed yesterday 850 mb at Roanoke (ms-1) 3.0 4.4 3.9 2.7 Wind speed yesterday 850 mb at Wilmington (ms-1) 6.5 8.0 5.7 4.9 Wind speed yesterday 850 mb at Pittsburgh (ms-1) 5.8 5.5 5.5 3.5 Wind speed AM 850 mb at Dulles (ms-1) 5.6 6.9 5.0 5.5 Wind speed AM 850 mb at Roanoke (ms-1) 5.2 7.9 6.5 3.4 Wind speed AM 850 mb at Wilmington (ms-1) 8.6 13.4 6.7 6.5 Wind speed AM 850 mb at Pittsburgh (ms-1) 7.2 9.9 6.9 7.2 Wind speed PM 850 mb at Dulles (ms-1) 6.1 9.4 5.8 7.7 Wind speed PM 850 mb at Roanoke (ms-1) 4.3 5.1 4.1 4.3 Wind speed PM 850 mb at Wilmington (ms-1) 9.1 8.5 6.5 8.8 Wind speed PM 850 mb at Pittsburgh (ms-1) 6.2 9.3 6.5 8.1 Wind direction yesterday 850 mb at Dulles (degrees) 256 270 291 162

Characterization of Meteorology and Its Relationships to Fine Particulate Mass and Visibility in the VISTAS Region Examination of Relationships between Meteorological and Air Quality Data Using
Classification and Regression Tree (CART) Analysis
ICF International 3-126 VISTAS Meteorological Characterization 06-046 December 8, 2006
Class 3 Class 4 Bin 21 Bin 18 Bin 23 Bin 27 Wind direction yesterday 850 mb at Roanoke (degrees) 243 225 279 135 Wind direction yesterday 850 mb at Wilmington (degrees) 248 270 248 180 Wind direction yesterday 850 mb at Pittsburgh (degrees) 256 225 297 225 Wind direction AM 850 mb at Dulles (degrees) 243 225 300 270 Wind direction AM 850 mb at Roanoke (degrees) 284 225 300 207 Wind direction AM 850 mb at Wilmington (degrees) 254 288 278 225 Wind direction AM 850 mb at Pittsburgh (degrees) 284 270 284 243 Wind direction PM 850 mb at Dulles (degrees) 225 270 291 180 Wind direction PM 850 mb at Roanoke (degrees) 180 225 277 153 Wind direction PM 850 mb at Wilmington (degrees) 233 288 293 207 Wind direction PM 850 mb at Pittsburgh (degrees) 233 270 288 207 Cloud average 2.0 2.0 2.0 1.7

Characterization of Meteorology and Its Relationships to Fine Particulate Mass and Visibility in the VISTAS Region Examination of Relationships between Meteorological and Air Quality Data Using
Classification and Regression Tree (CART) Analysis
ICF International 3-127 VISTAS Meteorological Characterization 06-046 December 8, 2006
Table 3-15i. Summary of Average Input Parameters for Key Bins for CART Classification Categories 3 and 4: PM2.5 CART Analysis for IMPROVE Site Everglades.
The ranges in PM2.5 for Categories 3 and 4 are 12.5-15 and ≥ 15 μgm-3.
Class 3 Class 4 Bin 21 Bin 27 Bin 2 Visibility Parameters Yesterday's FM at Palm Beach (µg/m3) 11.4 11.8 6.6 Yesterday's FM at Ft. Lauderdale (µg/m3) 12.6 13.8 7.7 Surface Meteorological Parameters Max. surface temperature (°C) 28.6 29.0 29.2 Min. surface temperature (°C) 20.2 19.3 20.6 Relative humidity (%) 78.2 74.3 72.1 Surface wind speed (ms-1) 2.0 1.9 2.2 Surface wind direction (degrees) 90 90 108 Persistence 0.9 0.9 0.8 Rainfall (inches) 0.0 0.0 0.1 Rain (# periods) 0.2 0.0 0.5 Solar radiation (W/m2) 731 759 713 Upper-Air Meteorological Parameters Temperature AM 850 mb (°C) 15.0 15.9 14.5 Temperature PM 850 mb (°C) 15.7 15.5 14.7 Stability at Miami (°C) -5.1 -3.4 -6.5 Geopotential height difference 700 mb at Miami (m) -1.8 22.3 -1.5 Wind speed yesterday 700 mb at Miami (ms-1) 11.7 9.5 3.5 Wind direction yesterday 700 mb at Miami (degrees) 270 236 108 Wind speed yesterday 850 mb at Miami (ms-1) 8.9 8.8 5.5 Wind speed AM 850 mb at Miami (ms-1) 7.3 8.5 6.7 Wind speed PM 850 mb at Miami (ms-1) 5.8 6.7 7.0 Wind direction yesterday 850 mb at Miami (degrees) 270 243 90 Wind direction AM 850 mb at Miami (degrees) 270 90 45 Wind direction PM 850 mb at Miami (degrees) 297 360 90 Recirculation at Miami 0.0 0.0 0.0 Cloud average 1.2 1.4 1.8

Characterization of Meteorology and Its Relationships to Fine Particulate Mass and Visibility in the VISTAS Region Examination of Relationships between Meteorological and Air Quality Data Using
Classification and Regression Tree (CART) Analysis
ICF International 3-128 VISTAS Meteorological Characterization 06-046 December 8, 2006
Table 3-15j. Summary of Average Input Parameters for Key Bins for CART Classification Categories 3 and 4: PM2.5 CART Analysis for IMPROVE Site Great Smoky Mountains.
The ranges in PM2.5 for Categories 3 and 4 are 17.5-25 and ≥ 25 μgm-3.
Class 3 Class 4 Bin 11 Bin 13 Bin 26 Bin 24 Visibility Parameters Yesterday's FM at Knoxville (µg/m3) 20.9 18.5 38.1 39.8 Yesterday's FM at Atlanta (µg/m3) 23.8 24.9 26.1 38.8 Yesterday's FM at Charlotte (µg/m3) 22.0 17.3 26.4 27.8 Surface Meteorological Parameters Max. surface temperature (°C) 24.6 24.5 25.1 24.4 Min. surface temperature (°C) 19.7 19.3 19.5 19.3 Relative humidity (%) 72.9 66.8 71.7 71.3 Surface wind speed (ms-1) 1.1 0.8 0.8 0.9 Surface wind direction (degrees) 45 243 180 270 Persistence 0.6 0.6 0.5 0.6 Rainfall (inches) 0.0 0.0 0.1 0.0 Rain (# periods) 0.2 0.4 0.4 0.1 Solar radiation (W/m2) 731 715 679 558 Upper-Air Meteorological Parameters Temperature AM 850 mb (°C) 16.0 15.6 16.1 15.6 Temperature PM 850 mb (°C) 16.9 15.1 16.8 16.4 Stability at Nashville (°C) 0.5 2.5 0.1 1.2 Geopotential height difference 700 mb at Nashville (m) -3.0 -5.1 -3.0 -6.0 Wind speed yesterday 700 mb at Nashville (ms-1) 5.7 4.3 7.0 5.0 Wind speed yesterday 700 mb at Greensboro (ms-1) 5.3 6.3 5.1 6.6 Wind speed yesterday 700 mb at Atlanta (ms-1) 4.0 4.5 4.5 5.4 Wind direction yesterday 700 mb at Nashville (degrees) 281 297 260 59 Wind direction yesterday 700 mb at Greensboro (degrees) 307 315 45 344 Wind direction yesterday 700 mb at Atlanta (degrees) 297 333 135 82 Wind speed yesterday 850 mb at Nashville (ms-1) 2.8 3.6 4.4 4.4 Wind speed yesterday 850 mb at Greensboro (ms-1) 3.8 5.0 3.7 4.7 Wind speed yesterday 850 mb at Atlanta (ms-1) 4.0 4.8 4.4 4.7 Wind speed AM 850 mb at Nashville (ms-1) 3.8 5.7 4.3 5.4 Wind speed AM 850 mb at Greensboro (ms-1) 4.3 5.1 3.5 6.0 Wind speed AM 850 mb at Atlanta (ms-1) 4.4 6.3 4.8 4.3 Wind speed PM 850 mb at Nashville (ms-1) 4.6 4.9 5.4 6.0 Wind speed PM 850 mb at Greensboro (ms-1) 4.4 5.0 3.4 5.4 Wind speed PM 850 mb at Atlanta (ms-1) 4.6 4.3 5.6 4.2 Wind direction yesterday 850 mb at Nashville (degrees) 360 207 135 270 Wind direction yesterday 850 mb at Greensboro (degrees) 360 360 180 297 Wind direction yesterday 850 mb at Atlanta (degrees) 37 360 127 98 Wind direction AM 850 mb at Nashville (degrees) 270 256 180 259 Wind direction AM 850 mb at Greensboro (degrees) 270 360 270 301 Wind direction AM 850 mb at Atlanta (degrees) 135 315 72 108 Wind direction PM 850 mb at Nashville (degrees) 243 284 180 207 Wind direction PM 850 mb at Greensboro (degrees) 315 315 143 291 Wind direction PM 850 mb at Atlanta (degrees) 108 117 108 124 Cloud average 2.0 1.4 2.0 1.5

Characterization of Meteorology and Its Relationships to Fine Particulate Mass and Visibility in the VISTAS Region Examination of Relationships between Meteorological and Air Quality Data Using
Classification and Regression Tree (CART) Analysis
ICF International 3-129 VISTAS Meteorological Characterization 06-046 December 8, 2006
Table 3-15k. Summary of Average Input Parameters for Key Bins for CART Classification Categories 3 and 4: PM2.5 CART Analysis for IMPROVE Site James River Face.
The ranges in PM2.5 for Categories 3 and 4 are 20-25 and ≥ 25 μgm-3. Class 3 Class 4 Bin 23 Bin 14 Bin 16 Visibility Parameters Yesterday's FM at Richmond (µg/m3) 27.9 21.7 22.6 Yesterday's FM at Greensboro-Winston-Salem (µg/m3) 27.7 19.8 25.2 Yesterday's FM at Knoxville (µg/m3) 26.8 23.7 33.3 Surface Meteorological Parameters Max. surface temperature (°C) 30.8 26.7 29.0 Min. surface temperature (°C) 17.6 18.9 13.2 Relative humidity (%) 72.8 83.8 69.4 Surface wind speed (ms-1) 2.0 0.6 0.8 Surface wind direction (degrees) 211 n/a 211 Persistence 0.9 0.8 0.9 Sea level pressure (mb) 1020 1023 1022 Rainfall (inches) 0.1 0.1 0.0 Rain (# periods) 0.8 1.0 0.0 Upper-Air Meteorological Parameters Temperature AM 850 mb (°C) 16.3 14.3 13.9 Temperature PM 850 mb (°C) 16.6 16.0 15.4 Stability at Roanoke (°C) 3.8 0.1 4.9 Geopotential height difference 700 mb at Roanoke (m) -22.4 25.4 -1.8 Wind speed yesterday 700 mb at Dulles (ms-1) 7.9 6.3 4.9 Wind speed yesterday 700 mb at Roanoke (ms-1) 5.6 6.2 4.9 Wind direction yesterday 700 mb at Dulles (degrees) 278 270 352 Wind direction yesterday 700 mb at Roanoke (degrees) 307 225 315 Wind speed yesterday 850 mb at Dulles (ms-1) 5.3 3.3 4.2 Wind speed yesterday 850 mb at Roanoke (ms-1) 3.1 4.4 2.7 Wind speed AM 850 mb at Dulles (ms-1) 6.7 4.0 3.9 Wind speed AM 850 mb at Roanoke (ms-1) 9.5 4.9 5.7 Wind speed PM 850 mb at Dulles (ms-1) 9.0 4.9 5.1 Wind speed PM 850 mb at Roanoke (ms-1) 9.1 6.2 3.5 Wind direction yesterday 850 mb at Dulles (degrees) 278 252 259 Wind direction yesterday 850 mb at Roanoke (degrees) 239 45 315 Wind direction AM 850 mb at Dulles (degrees) 262 180 292 Wind direction AM 850 mb at Roanoke (degrees) 262 180 284 Wind direction PM 850 mb at Dulles (degrees) 243 198 270 Wind direction PM 850 mb at Roanoke (degrees) 225 135 304 Recirculation at Roanoke 0.0 0.3 0.3 Cloud average 1.9 2.3 2.0

Characterization of Meteorology and Its Relationships to Fine Particulate Mass and Visibility in the VISTAS Region Examination of Relationships between Meteorological and Air Quality Data Using
Classification and Regression Tree (CART) Analysis
ICF International 3-130 VISTAS Meteorological Characterization 06-046 December 8, 2006
Table 3-15l. Summary of Average Input Parameters for Key Bins for CART Classification Categories 3 and 4: PM2.5 CART Analysis for IMPROVE Site Linville Gorge.
The ranges in PM2.5 for Categories 3 and 4 are 17.5-20 and ≥ 20 μgm-3.
Class 3 Class 4 Bin 30 Bin 19 Bin 25 Visibility Parameters Yesterday's FM at Knoxville (µg/m3) 30.2 32.1 35.9 Yesterday's FM at Charlotte (µg/m3) 26.4 15.7 30.0 Yesterday's FM at Greensboro-Winston-Salem (µg/m3) 29.9 17.0 28.0 Surface Meteorological Parameters Max. surface temperature (°C) 18.4 18.8 23.3 Min. surface temperature (°C) 29.0 29.3 28.3 Relative humidity (%) 19.6 16.9 16.4 Surface wind speed (ms-1) 77.2 65.5 68.8 Surface wind direction (degrees) 0.8 1.4 0.8 Persistence 326 297 284 Sea level pressure (mb) 0.6 0.7 0.7 Rainfall (inches) 1018 1017 1021 Rain (# periods) 0.1 0.0 0.0 Upper-Air Meteorological Parameters Temperature AM 850 mb (°C) 16.6 15.8 14.7 Temperature PM 850 mb (°C) 17.2 17.3 15.9 Stability at Greensboro (°C) -0.2 2.9 1.1 Geopotential height difference 700 mb at Greensboro (m) -12.3 -0.1 4.3 Wind speed yesterday 700 mb at Greensboro (ms-1) 6 6 6 Wind direction yesterday 700 mb at Greensboro (degrees) 270 326 342 Wind speed yesterday 850 mb at Greensboro (ms-1) 4 6 5 Wind speed AM 850 mb at Greensboro (ms-1) 5.8 6.4 5.0 Wind speed PM 850 mb at Greensboro (ms-1) 5.8 4.7 5.1 Wind direction yesterday 850 mb at Greensboro (degrees) 225 0 338 Wind direction AM 850 mb at Greensboro (degrees) 342 288 315 Wind direction PM 850 mb at Greensboro (degrees) 270 270 297 Recirculation at Greensboro 0.0 0.2 0.1 Cloud average 1.8 1.2 1.9

Characterization of Meteorology and Its Relationships to Fine Particulate Mass and Visibility in the VISTAS Region Examination of Relationships between Meteorological and Air Quality Data Using
Classification and Regression Tree (CART) Analysis
ICF International 3-131 VISTAS Meteorological Characterization 06-046 December 8, 2006
Table 3-15m. Summary of Average Input Parameters for Key Bins for CART Classification Categories 3 and 4: PM2.5 CART Analysis for IMPROVE Site Mammoth Cave.
The ranges in PM2.5 for Categories 3 and 4 are 20-25 and ≥ 25 μgm-3.
Class 3 Class 4 Bin 30 Bin 5 Bin 24 Bin 21 Visibility Parameters Yesterday's FM at Nashville (µg/m3) 26.2 10.0 22.1 30.4 Yesterday's FM at Knoxville (µg/m3) 30.4 16.1 36.4 30.9 Yesterday's FM at Louisville (µg/m3) 33.1 18.5 28.2 34.8 Surface Meteorological Parameters Max. surface temperature (°C) 31.3 28.8 28.9 30.8 Min. surface temperature (°C) 21.2 19.0 19.2 17.2 Relative humidity (%) 72.8 77.7 81.6 69.7 Surface wind speed (ms-1) 2.7 0.8 0.8 1.0 Surface wind direction (degrees) 236 n/a 108 252 Persistence 0.8 0.6 0.6 0.7 Sea level pressure (mb) 1018 1018 1016 1021 Rainfall (inches) 0.4 0.0 0.5 0.0 Rain (# periods) 1.4 0.0 0.8 0.3 Upper-Air Meteorological Parameters Temperature AM 850 mb (°C) 17.2 14.7 16.4 15.9 Temperature PM 850 mb (°C) 18.5 17.7 17.3 16.8 Stability at Nashville (°C) -0.3 -1.0 0.2 1.7 Geopotential height difference 700 mb at Nashville (m) -10.5 22.7 1.3 -0.7 Wind speed yesterday 700 mb at Nashville (ms-1) 7.2 8.9 8.3 4.2 Wind direction yesterday 700 mb at Nashville (degrees) 297 315 315 90 Wind speed yesterday 850 mb at Nashville (ms-1) 4.7 6.3 2.8 3.5 Wind speed AM 850 mb at Nashville (ms-1) 8.0 4.9 3.8 4.6 Wind speed PM 850 mb at Nashville (ms-1) 6.6 3.5 4.6 4.5 Wind direction yesterday 850 mb at Nashville (degrees) 239 288 135 297 Wind direction AM 850 mb at Nashville (degrees) 270 315 225 297 Wind direction PM 850 mb at Nashville (degrees) 225 270 315 180 Recirculation at Nashville 0.0 0.3 0.5 0.3 Cloud average 1.8 1.8 2.0 1.8
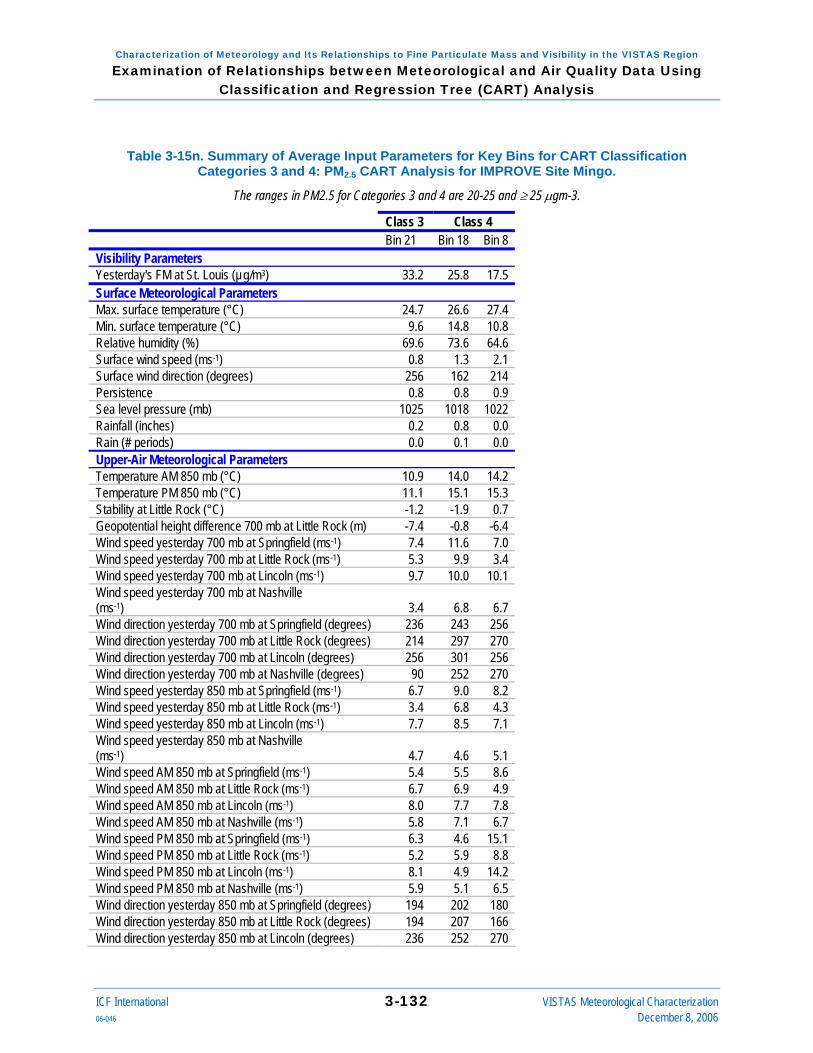
Characterization of Meteorology and Its Relationships to Fine Particulate Mass and Visibility in the VISTAS Region Examination of Relationships between Meteorological and Air Quality Data Using
Classification and Regression Tree (CART) Analysis
ICF International 3-132 VISTAS Meteorological Characterization 06-046 December 8, 2006
Table 3-15n. Summary of Average Input Parameters for Key Bins for CART Classification Categories 3 and 4: PM2.5 CART Analysis for IMPROVE Site Mingo.
The ranges in PM2.5 for Categories 3 and 4 are 20-25 and ≥ 25 μgm-3.
Class 3 Class 4 Bin 21 Bin 18 Bin 8 Visibility Parameters Yesterday's FM at St. Louis (µg/m3) 33.2 25.8 17.5 Surface Meteorological Parameters Max. surface temperature (°C) 24.7 26.6 27.4 Min. surface temperature (°C) 9.6 14.8 10.8 Relative humidity (%) 69.6 73.6 64.6 Surface wind speed (ms-1) 0.8 1.3 2.1 Surface wind direction (degrees) 256 162 214 Persistence 0.8 0.8 0.9 Sea level pressure (mb) 1025 1018 1022 Rainfall (inches) 0.2 0.8 0.0 Rain (# periods) 0.0 0.1 0.0 Upper-Air Meteorological Parameters Temperature AM 850 mb (°C) 10.9 14.0 14.2 Temperature PM 850 mb (°C) 11.1 15.1 15.3 Stability at Little Rock (°C) -1.2 -1.9 0.7 Geopotential height difference 700 mb at Little Rock (m) -7.4 -0.8 -6.4 Wind speed yesterday 700 mb at Springfield (ms-1) 7.4 11.6 7.0 Wind speed yesterday 700 mb at Little Rock (ms-1) 5.3 9.9 3.4 Wind speed yesterday 700 mb at Lincoln (ms-1) 9.7 10.0 10.1 Wind speed yesterday 700 mb at Nashville (ms-1) 3.4 6.8 6.7 Wind direction yesterday 700 mb at Springfield (degrees) 236 243 256 Wind direction yesterday 700 mb at Little Rock (degrees) 214 297 270 Wind direction yesterday 700 mb at Lincoln (degrees) 256 301 256 Wind direction yesterday 700 mb at Nashville (degrees) 90 252 270 Wind speed yesterday 850 mb at Springfield (ms-1) 6.7 9.0 8.2 Wind speed yesterday 850 mb at Little Rock (ms-1) 3.4 6.8 4.3 Wind speed yesterday 850 mb at Lincoln (ms-1) 7.7 8.5 7.1 Wind speed yesterday 850 mb at Nashville (ms-1) 4.7 4.6 5.1 Wind speed AM 850 mb at Springfield (ms-1) 5.4 5.5 8.6 Wind speed AM 850 mb at Little Rock (ms-1) 6.7 6.9 4.9 Wind speed AM 850 mb at Lincoln (ms-1) 8.0 7.7 7.8 Wind speed AM 850 mb at Nashville (ms-1) 5.8 7.1 6.7 Wind speed PM 850 mb at Springfield (ms-1) 6.3 4.6 15.1 Wind speed PM 850 mb at Little Rock (ms-1) 5.2 5.9 8.8 Wind speed PM 850 mb at Lincoln (ms-1) 8.1 4.9 14.2 Wind speed PM 850 mb at Nashville (ms-1) 5.9 5.1 6.5 Wind direction yesterday 850 mb at Springfield (degrees) 194 202 180 Wind direction yesterday 850 mb at Little Rock (degrees) 194 207 166 Wind direction yesterday 850 mb at Lincoln (degrees) 236 252 270
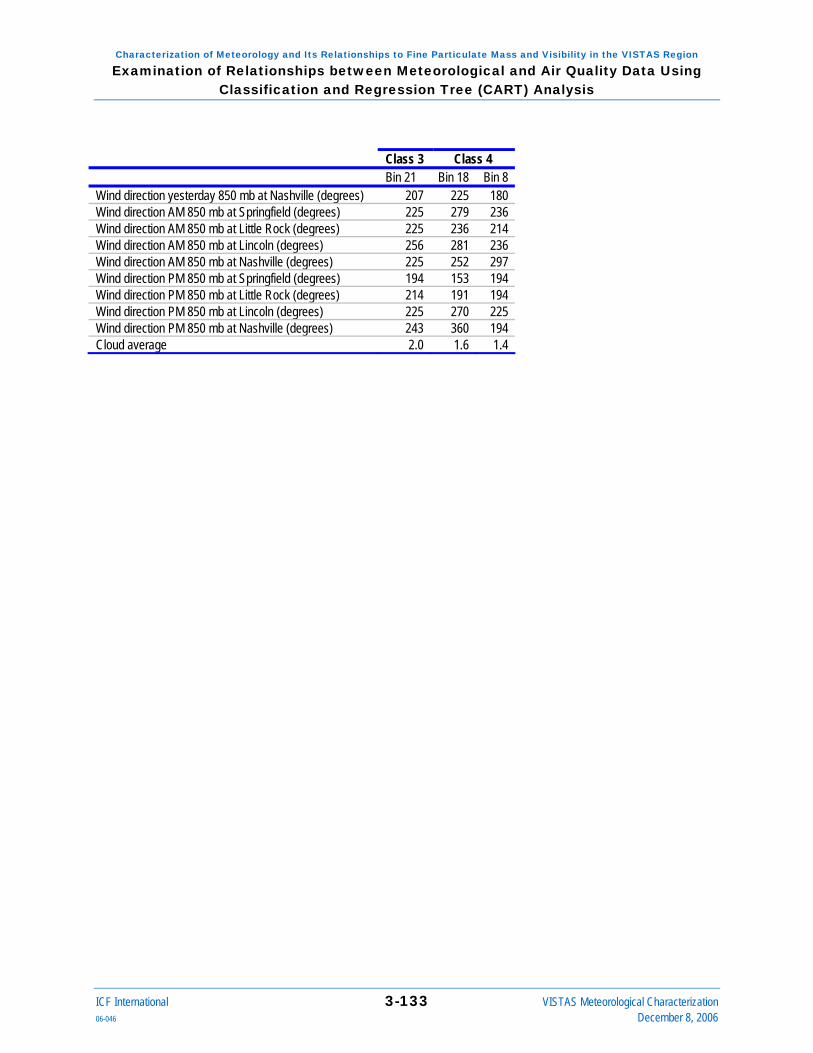
Characterization of Meteorology and Its Relationships to Fine Particulate Mass and Visibility in the VISTAS Region Examination of Relationships between Meteorological and Air Quality Data Using
Classification and Regression Tree (CART) Analysis
ICF International 3-133 VISTAS Meteorological Characterization 06-046 December 8, 2006
Class 3 Class 4 Bin 21 Bin 18 Bin 8 Wind direction yesterday 850 mb at Nashville (degrees) 207 225 180 Wind direction AM 850 mb at Springfield (degrees) 225 279 236 Wind direction AM 850 mb at Little Rock (degrees) 225 236 214 Wind direction AM 850 mb at Lincoln (degrees) 256 281 236 Wind direction AM 850 mb at Nashville (degrees) 225 252 297 Wind direction PM 850 mb at Springfield (degrees) 194 153 194 Wind direction PM 850 mb at Little Rock (degrees) 214 191 194 Wind direction PM 850 mb at Lincoln (degrees) 225 270 225 Wind direction PM 850 mb at Nashville (degrees) 243 360 194 Cloud average 2.0 1.6 1.4

Characterization of Meteorology and Its Relationships to Fine Particulate Mass and Visibility in the VISTAS Region Examination of Relationships between Meteorological and Air Quality Data Using
Classification and Regression Tree (CART) Analysis
ICF International 3-134 VISTAS Meteorological Characterization 06-046 December 8, 2006
Table 3-15o. Summary of Average Input Parameters for Key Bins for CART Classification Categories 3 and 4: PM2.5 CART Analysis for Okefenokee.
The ranges in PM2.5 for Categories 3 and 4 are 15-20 and ≥ 20 μgm-3.
Class 3 Class 4 Bin 28 Bin 31 Bin 3 Bin 30 Visibility Parameters Yesterday's FM at Jacksonville (µg/m3) 18.3 30.2 9.5 30.2 Surface Meteorological Parameters Max. surface temperature (°C) 31.0 27.1 30.8 32.7 Min. surface temperature (°C) 19.3 15.6 17.5 21.6 Relative humidity (%) 71.9 75.9 71.4 74.1 Surface wind speed (ms-1) 2.0 2.6 2.1 1.5 Surface wind direction (degrees) n/a 117 108 153 Persistence 0.7 0.8 0.8 0.6 Sea level pressure (mb) 1016 1022 1020 1016 Rainfall (inches) 0.1 0.0 0.0 0.0 Rain (# periods) 0.6 0.4 0.3 0.1 Upper-Air Meteorological Parameters Temperature AM 850 mb (°C) 15.9 12.7 15.1 17.5 Temperature PM 850 mb (°C) 16.6 13.0 16.1 18.1 Stability at Jacksonville (°C) 0.3 -0.5 1.5 -0.4 Geopotential height difference 700 mb at Jacksonville (m) -3.9 -4.8 2.5 -1.8 Wind speed yesterday 700 mb at Jacksonville (ms-1) 8.5 7.5 5.9 8.6 Wind speed yesterday 700 mb at Tallahassee (ms-1) 6.9 6.2 6.2 6.7 Wind direction yesterday 700 mb at Jacksonville (degrees) 304 270 315 342 Wind direction yesterday 700 mb at Tallahassee (degrees) 315 360 315 346 Wind speed yesterday 850 mb at Jacksonville (ms-1) 6.2 5.6 3.5 4.3 Wind speed yesterday 850 mb at Tallahassee (ms-1) 4.8 2.5 2.7 3.8 Wind speed AM 850 mb at Jacksonville (ms-1) 6.7 7.6 4.7 5.2 Wind speed AM 850 mb at Tallahassee (ms-1) 5.7 4.1 5.0 3.5 Wind speed PM 850 mb at Jacksonville (ms-1) 5.4 7.6 3.3 4.8 Wind speed PM 850 mb at Tallahassee (ms-1) 4.9 5.2 2.2 4.3 Wind direction yesterday 850 mb at Jacksonville (degrees) 315 360 315 326 Wind direction yesterday 850 mb at Tallahassee (degrees) 360 326 90 14 Wind direction AM 850 mb at Jacksonville (degrees) 270 27 45 326 Wind direction AM 850 mb at Tallahassee (degrees) 297 333 135 270 Wind direction PM 850 mb at Jacksonville (degrees) 270 27 315 326 Wind direction PM 850 mb at Tallahassee (degrees) 342 27 315 333 Recirculation at Jacksonville 0.1 0.0 0.0 0.1 Cloud average 1.6 1.4 1.8 1.9

Characterization of Meteorology and Its Relationships to Fine Particulate Mass and Visibility in the VISTAS Region Examination of Relationships between Meteorological and Air Quality Data Using
Classification and Regression Tree (CART) Analysis
ICF International 3-135 VISTAS Meteorological Characterization 06-046 December 8, 2006
Table 3-15p. Summary of Average Input Parameters for Key Bins for CART Classification Categories 3 and 4: PM2.5 CART Analysis for IMPROVE Site Shenandoah.
The ranges in PM2.5 for Categories 3 and 4 are 17.5-22.5 and ≥ 22.5 μgm-3.
Class 3 Class 4 Bin 13 Bin 25 Bin 28 Bin 16 Visibility Parameters Yesterday's FM at Richmond (µg/m3) 18.5 28.2 27.6 18.6 Yesterday's FM at DC (µg/m3) 22.5 29.7 32.6 24.5 Yesterday's FM at Columbus (µg/m3) 17.5 28.5 34.4 34.2 Surface Meteorological Parameters Max. surface temperature (°C) 21.2 21.6 24.1 22.9 Min. surface temperature (°C) 14.8 13.2 18.4 15.7 Relative humidity (%) 83.4 76.8 76.5 71.7 Surface wind speed (ms-1) 1.1 2.3 1.5 0.7 Surface wind direction (degrees) 180 315 207 117 Persistence 0.7 0.9 0.8 0.5 Rainfall (inches) 0.5 0.8 0.4 0.4 Rain (# periods) 0.1 0.1 0.0 0.1 Solar radiation (W/m2) 568 698 690 568 Upper-Air Meteorological Parameters Temperature AM 850 mb (°C) 15.0 15.4 18.5 15.6 Temperature PM 850 mb (°C) 16.6 15.3 18.9 17.3 Stability at Dulles (°C) -0.8 0.6 1.6 2.8 Geopotential height difference 700 mb at Dulles (m) 23.4 -25.8 6.0 5.7 Wind speed yesterday 700 mb at Dulles (ms-1) 8.0 12.2 6.9 5.1 Wind speed yesterday 700 mb at Roanoke (ms-1) 7.5 9.7 5.8 5.4 Wind direction yesterday 700 mb at Dulles (degrees) 293 270 311 342 Wind direction yesterday 700 mb at Roanoke (degrees) 278 236 360 304 Wind speed yesterday 850 mb at Dulles (ms-1) 5.1 7.0 6.5 3.7 Wind speed yesterday 850 mb at Roanoke (ms-1) 3.6 7.3 4.0 2.2 Wind speed AM 850 mb at Dulles (ms-1) 4.5 10.7 6.1 3.2 Wind speed AM 850 mb at Roanoke (ms-1) 4.2 12.1 7.3 3.7 Wind speed PM 850 mb at Dulles (ms-1) 4.3 11.8 7.8 3.6 Wind speed PM 850 mb at Roanoke (ms-1) 4.1 12.2 5.9 3.2 Wind direction yesterday 850 mb at Dulles (degrees) 288 236 291 252 Wind direction yesterday 850 mb at Roanoke (degrees) 315 270 309 270 Wind direction AM 850 mb at Dulles (degrees) 259 252 297 315 Wind direction AM 850 mb at Roanoke (degrees) 259 284 288 304 Wind direction PM 850 mb at Dulles (degrees) 256 270 278 315 Wind direction PM 850 mb at Roanoke (degrees) 211 284 281 180 Recirculation at Dulles 0.2 0.0 0.1 0.5 Cloud average 2.2 1.6 1.7 1.8

Characterization of Meteorology and Its Relationships to Fine Particulate Mass and Visibility in the VISTAS Region Examination of Relationships between Meteorological and Air Quality Data Using
Classification and Regression Tree (CART) Analysis
ICF International 3-136 VISTAS Meteorological Characterization 06-046 December 8, 2006
Table 3-15q. Summary of Average Input Parameters for Key Bins for CART Classification Categories 3 and 4: PM2.5 CART Analysis for IMPROVE Site Shining Rock.
The ranges in PM2.5 for Categories 3 and 4 are 15-20 and ≥ 20 μgm-3.
Class 3 Class 4 Bin 10 Bin 27 Bin 21 Bin 23 Visibility Parameters Yesterday's FM at Knoxville (µg/m3) 19.6 30.6 31.0 35.8 Yesterday's FM at Charlotte (µg/m3) 16.6 23.9 22.7 27.8 Yesterday's FM at Greenville (µg/m3) 16.0 27.2 28.7 28.8 Surface Meteorological Parameters Max. surface temperature (°C) 26.4 28.1 26.3 28.1 Min. surface temperature (°C) 13.1 17.9 16.2 15.8 Relative humidity (%) 74.5 81.3 74.6 73.7 Surface wind speed (ms-1) 1.2 1.1 1.1 1.5 Surface wind direction (degrees) 180 351 297 360 Persistence 0.7 0.6 0.7 0.7 Sea level pressure (mb) 1024 1018 1018 1020 Rainfall (inches) 0.0 0.1 0.0 0.0 Rain (# periods) 26.4 28.1 26.3 28.1 Upper-Air Meteorological Parameters Temperature AM 850 mb (°C) 14.0 17.0 15.0 16.0 Temperature PM 850 mb (°C) 15.2 17.6 15.1 17.3 Stability at Greensboro (°C) 0.5 -0.4 0.4 0.7 Geopotential height difference 700 mb at Greensboro (m) 13.2 -16.4 17.8 -3.2 Wind speed yesterday 700 mb at Greensboro (ms-1) 8.7 7.4 9.2 6.9 Wind direction yesterday 700 mb at Greensboro (degrees) 304 297 284 342 Wind speed yesterday 850 mb at Greensboro (ms-1) 5.3 6.1 5.1 4.8 Wind speed AM 850 mb at Greensboro (ms-1) 5.7 5.7 4.1 5.1 Wind speed PM 850 mb at Greensboro (ms-1) 5.7 5.1 2.7 7.1 Wind direction yesterday 850 mb at Greensboro (degrees) 270 281 315 284 Wind direction AM 850 mb at Greensboro (degrees) 297 292 270 293 Wind direction PM 850 mb at Greensboro (degrees) 198 256 360 278 Recirculation at Greensboro 0.1 0.0 0.0 0.0 Cloud average 2.1 1.9 1.6 1.6
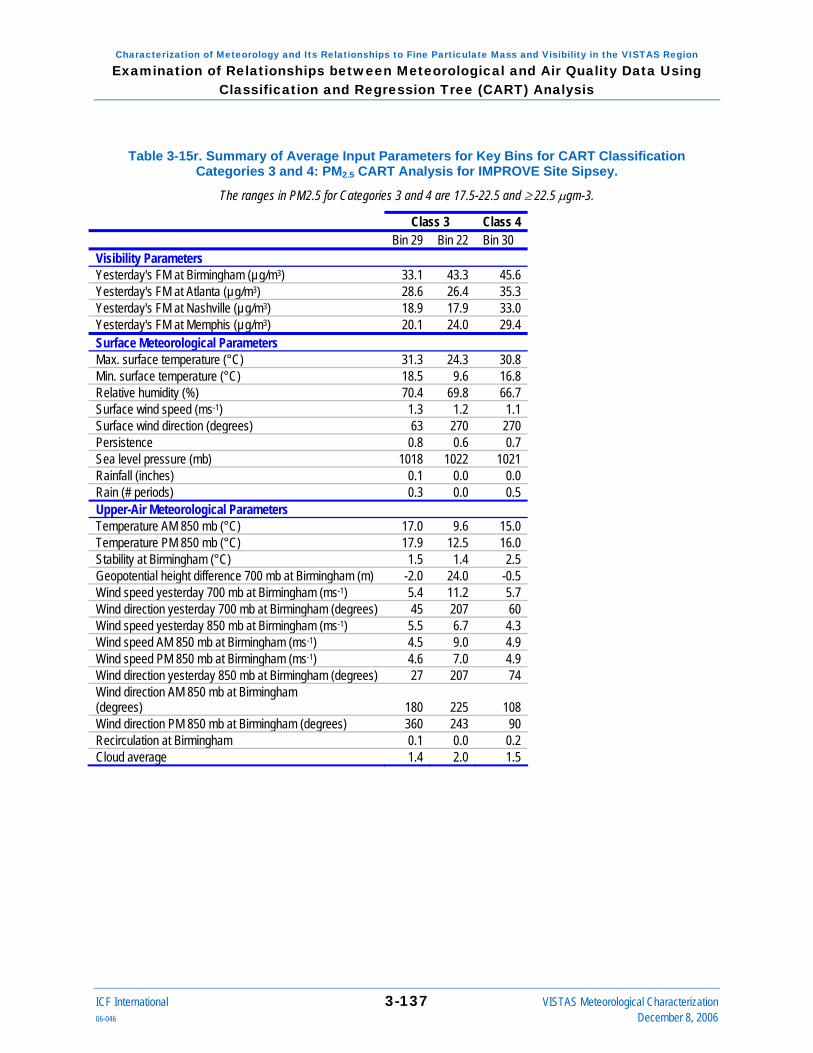
Characterization of Meteorology and Its Relationships to Fine Particulate Mass and Visibility in the VISTAS Region Examination of Relationships between Meteorological and Air Quality Data Using
Classification and Regression Tree (CART) Analysis
ICF International 3-137 VISTAS Meteorological Characterization 06-046 December 8, 2006
Table 3-15r. Summary of Average Input Parameters for Key Bins for CART Classification Categories 3 and 4: PM2.5 CART Analysis for IMPROVE Site Sipsey.
The ranges in PM2.5 for Categories 3 and 4 are 17.5-22.5 and ≥ 22.5 μgm-3.
Class 3 Class 4 Bin 29 Bin 22 Bin 30 Visibility Parameters Yesterday's FM at Birmingham (µg/m3) 33.1 43.3 45.6 Yesterday's FM at Atlanta (µg/m3) 28.6 26.4 35.3 Yesterday's FM at Nashville (µg/m3) 18.9 17.9 33.0 Yesterday's FM at Memphis (µg/m3) 20.1 24.0 29.4 Surface Meteorological Parameters Max. surface temperature (°C) 31.3 24.3 30.8 Min. surface temperature (°C) 18.5 9.6 16.8 Relative humidity (%) 70.4 69.8 66.7 Surface wind speed (ms-1) 1.3 1.2 1.1 Surface wind direction (degrees) 63 270 270 Persistence 0.8 0.6 0.7 Sea level pressure (mb) 1018 1022 1021 Rainfall (inches) 0.1 0.0 0.0 Rain (# periods) 0.3 0.0 0.5 Upper-Air Meteorological Parameters Temperature AM 850 mb (°C) 17.0 9.6 15.0 Temperature PM 850 mb (°C) 17.9 12.5 16.0 Stability at Birmingham (°C) 1.5 1.4 2.5 Geopotential height difference 700 mb at Birmingham (m) -2.0 24.0 -0.5 Wind speed yesterday 700 mb at Birmingham (ms-1) 5.4 11.2 5.7 Wind direction yesterday 700 mb at Birmingham (degrees) 45 207 60 Wind speed yesterday 850 mb at Birmingham (ms-1) 5.5 6.7 4.3 Wind speed AM 850 mb at Birmingham (ms-1) 4.5 9.0 4.9 Wind speed PM 850 mb at Birmingham (ms-1) 4.6 7.0 4.9 Wind direction yesterday 850 mb at Birmingham (degrees) 27 207 74 Wind direction AM 850 mb at Birmingham (degrees) 180 225 108 Wind direction PM 850 mb at Birmingham (degrees) 360 243 90 Recirculation at Birmingham 0.1 0.0 0.2 Cloud average 1.4 2.0 1.5
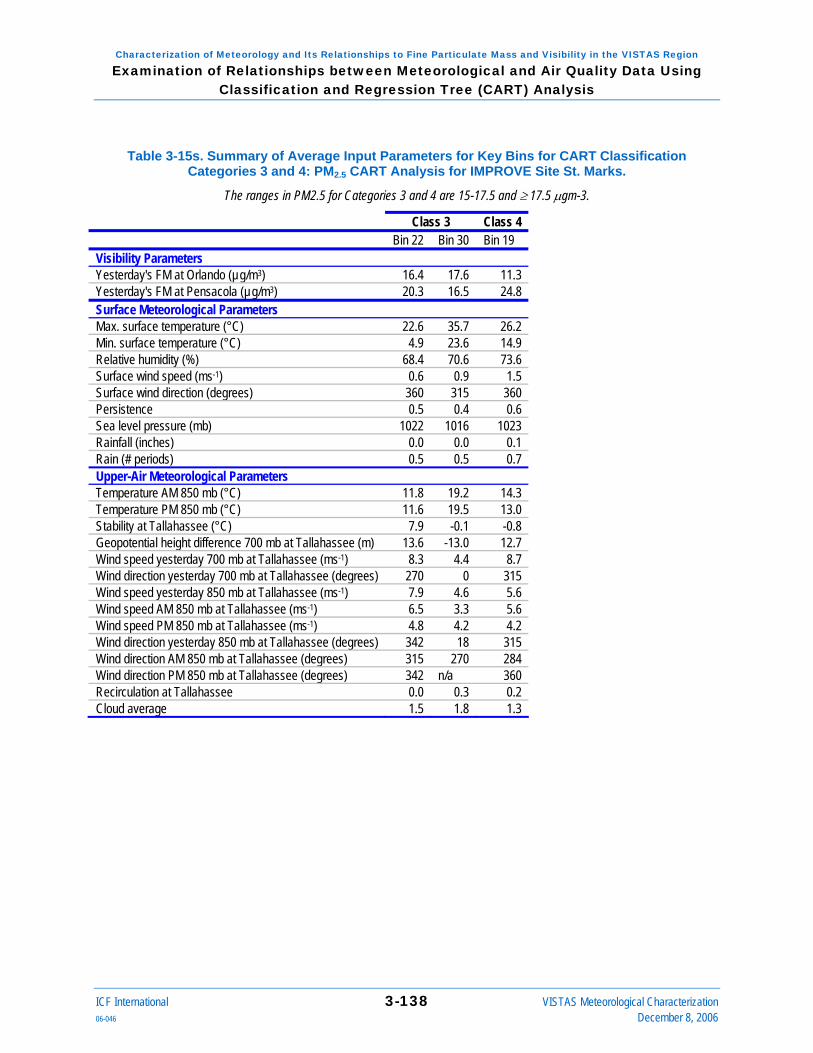
Characterization of Meteorology and Its Relationships to Fine Particulate Mass and Visibility in the VISTAS Region Examination of Relationships between Meteorological and Air Quality Data Using
Classification and Regression Tree (CART) Analysis
ICF International 3-138 VISTAS Meteorological Characterization 06-046 December 8, 2006
Table 3-15s. Summary of Average Input Parameters for Key Bins for CART Classification Categories 3 and 4: PM2.5 CART Analysis for IMPROVE Site St. Marks.
The ranges in PM2.5 for Categories 3 and 4 are 15-17.5 and ≥ 17.5 μgm-3.
Class 3 Class 4 Bin 22 Bin 30 Bin 19 Visibility Parameters Yesterday's FM at Orlando (µg/m3) 16.4 17.6 11.3 Yesterday's FM at Pensacola (µg/m3) 20.3 16.5 24.8 Surface Meteorological Parameters Max. surface temperature (°C) 22.6 35.7 26.2 Min. surface temperature (°C) 4.9 23.6 14.9 Relative humidity (%) 68.4 70.6 73.6 Surface wind speed (ms-1) 0.6 0.9 1.5 Surface wind direction (degrees) 360 315 360 Persistence 0.5 0.4 0.6 Sea level pressure (mb) 1022 1016 1023 Rainfall (inches) 0.0 0.0 0.1 Rain (# periods) 0.5 0.5 0.7 Upper-Air Meteorological Parameters Temperature AM 850 mb (°C) 11.8 19.2 14.3 Temperature PM 850 mb (°C) 11.6 19.5 13.0 Stability at Tallahassee (°C) 7.9 -0.1 -0.8 Geopotential height difference 700 mb at Tallahassee (m) 13.6 -13.0 12.7 Wind speed yesterday 700 mb at Tallahassee (ms-1) 8.3 4.4 8.7 Wind direction yesterday 700 mb at Tallahassee (degrees) 270 0 315 Wind speed yesterday 850 mb at Tallahassee (ms-1) 7.9 4.6 5.6 Wind speed AM 850 mb at Tallahassee (ms-1) 6.5 3.3 5.6 Wind speed PM 850 mb at Tallahassee (ms-1) 4.8 4.2 4.2 Wind direction yesterday 850 mb at Tallahassee (degrees) 342 18 315 Wind direction AM 850 mb at Tallahassee (degrees) 315 270 284 Wind direction PM 850 mb at Tallahassee (degrees) 342 n/a 360 Recirculation at Tallahassee 0.0 0.3 0.2 Cloud average 1.5 1.8 1.3

Characterization of Meteorology and Its Relationships to Fine Particulate Mass and Visibility in the VISTAS Region Examination of Relationships between Meteorological and Air Quality Data Using
Classification and Regression Tree (CART) Analysis
ICF International 3-139 VISTAS Meteorological Characterization 06-046 December 8, 2006
Table 3-15t. Summary of Average Input Parameters for Key Bins for CART Classification Categories 3 and 4: PM2.5 CART Analysis for IMPROVE Site Swanquarter.
The ranges in PM2.5 for Categories 3 and 4 are 12.5-17.5 and ≥ 17.5 μgm-3.
Class 3 Class Bin 21 Bin 17 Bin 13 Bin 28 Visibility Parameters Yesterday's FM at Raleigh (µg/m3) 21.7 22.4 21.6 34.9 Yesterday's FM at Norfolk (µg/m3) 19.2 15.2 19.7 35.8 Surface Meteorological Parameters Max. surface temperature (°C) 26.5 25.4 15.7 29.7 Min. surface temperature (°C) 20.7 17.9 7.2 24.0 Relative humidity (%) 90.8 82.1 77.5 81.5 Surface wind speed (ms-1) 3.5 3.0 1.6 4.2 Surface wind direction (degrees) 210 243 349 270 Persistence 0.8 0.7 0.6 0.9 Sea level pressure (mb) 1017 1020 1025 1016 Rainfall (inches) 0.0 0.1 0.0 0.1 Rain (# periods) 0.5 0.8 0.2 0.3 Upper-Air Meteorological Parameters Temperature AM 850 mb (°C) 16.6 14.7 8.8 17.7 Temperature PM 850 mb (°C) 17.3 14.6 9.9 18.9 Stability at Moorhead (°C) -0.1 -1.7 6.9 -1.5 Geopotential height difference 700 mb at Moorhead (m) -6.2 4.8 11.2 -11.0 Wind speed yesterday 700 mb at Moorhead (ms-1) 8 12 10 7 Wind direction yesterday 700 mb at Moorhead (degrees) 276 270 304 342 Wind speed yesterday 850 mb at Moorhead (ms-1) 6 9 7 4 Wind speed AM 850 mb at Moorhead (ms-1) 7.3 9.1 6.7 7.7 Wind speed PM 850 mb at Moorhead (ms-1) 6.3 7.3 7.0 7.2 Wind direction yesterday 850 mb at Moorhead (degrees) 270 270 326 315 Wind direction AM 850 mb at Moorhead (degrees) 275 270 304 288 Wind direction PM 850 mb at Moorhead (degrees) 270 270 315 270 Recirculation at Moorhead 0.1 0.2 0.0 0.0 Cloud average 1.6 1.8 1.0 1.8

Characterization of Meteorology and Its Relationships to Fine Particulate Mass and Visibility in the VISTAS Region Examination of Relationships between Meteorological and Air Quality Data Using
Classification and Regression Tree (CART) Analysis
ICF International 3-140 VISTAS Meteorological Characterization 06-046 December 8, 2006
Table 3-15u. Summary of Average Input Parameters for Key Bins for CART Classification Categories 3 and 4: PM2.5 CART Analysis for IMPROVE Site Upper Buffalo.
The ranges in PM2.5 for Categories 3 and 4 are 15-17.5 and ≥ 17.5 μgm-3.
Class 3 Class 4 Bin 23 Bin 28 Bin 30 Bin 32 Visibility Parameters Yesterday's FM at Little Rock (µg/m3) 17.6 25.8 23.4 30.0 Yesterday's FM at Dallas (µg/m3) 17.5 21.1 16.6 24.8 Surface Meteorological Parameters Max. surface temperature (°C) 29.3 23.9 33.6 32.2 Min. surface temperature (°C) 17.4 14.0 21.0 20.4 Relative humidity (%) 73.0 78.4 68.9 69.4 Surface wind speed (ms-1) 2.4 2.2 1.7 1.7 Surface wind direction (degrees) 166 135 90 194 Persistence 0.8 0.8 0.8 0.7 Sea level pressure (mb) 1020 1020 1018 1018 Rainfall (inches) 0.0 0.2 0.0 0.0 Rain (# periods) 0.0 0.5 0.0 0.2 Upper-Air Meteorological Parameters Temperature AM 850 mb (°C) 16.4 13.5 19.2 18.2 Temperature PM 850 mb (°C) 17.7 13.5 19.3 19.5 Stability at Little Rock (°C) -2.9 -1.4 -2.7 -1.1 Geopotential height difference 700 mb at Little Rock (m) 25.5 -9.4 6.8 0.4 Wind speed yesterday 700 mb at Little Rock (ms-1) 4.9 2.7 8.1 5.2 Wind direction yesterday 700 mb at Little Rock (degrees) 360 225 45 45 Wind speed yesterday 850 mb at Little Rock (ms-1) 4.4 2.2 3.9 3.8 Wind speed AM 850 mb at Little Rock (ms-1) 5.3 4.5 4.1 3.7 Wind speed PM 850 mb at Little Rock (ms-1) 4.2 4.9 4.5 3.3 Wind direction yesterday 850 mb at Little Rock (degrees) 117 162 45 270 Wind direction AM 850 mb at Little Rock (degrees) 243 252 90 259 Wind direction PM 850 mb at Little Rock (degrees) 194 180 90 236 Recirculation at Little Rock 0.4 0.3 0.8 0.4 Cloud average 1.8 1.5 1.5 1.6 We discuss the findings for Cape Romain, Great Smoky Mountains, and Mammoth Cave below.
For Cape Romain, the PM2.5 concentration ranges for Categories 3 and 4 are 15 to 17.5 and greater than or equal to 17.5 μgm-3, respectively. There are two Category 3 and two Category 4 bins that meet the criteria for key bins. One of the Category 3 bins represents a fall, winter, or early spring regime, and is characterized by a relatively low average maximum temperature. The remaining three bins are characterized by high temperatures, low to moderate surface wind speeds, and moderate relative humidity, and these vary relative to one another among the bins. Prior day PM2.5 values for Charleston are in the range of 13 to 29 μgm-3, and are highest for the Category 4 bins. Average surface wind direction is southwesterly for three of the key bins, and southeasterly for the remaining key bin. Recirculation by the sea breeze (as indicated by persistence) appears to be important for Bin 22, which is a Category 5 bin. Stability is greatest, on average, for the cooler days in Bin 15. Upper-air wind speeds and directions vary slightly
Characterization of Meteorology and Its Relationships to Fine Particulate Mass and Visibility in the VISTAS Region Examination of Relationships between Meteorological and Air Quality Data Using
Classification and Regression Tree (CART) Analysis
ICF International 3-141 VISTAS Meteorological Characterization 06-046 December 8, 2006
among the bins. Wind speeds are highest for the cooler regime (Bin 15). Morning and evening 850 mb wind directions are northwesterly for all bins. A comparison of the two Category 4 bins shows that Bin 22 has lower temperatures, higher humidity, lower surface wind speeds, southeasterly surface winds, and greater cloud cover. Bin 33 has higher temperatures, lower humidity, higher surface wind speeds, southwesterly surface winds, and less cloud cover. Clearly, different combinations of local parameters can result in high PM2.5 concentrations.
For GSM, the PM2.5 concentration ranges for Categories 3 and 4 are 17.5 to 25 and greater than or equal to 25 μgm-3, respectively. All four key bins are characterized by very low surface wind speeds and relatively high temperatures. All but one of the key bins is characterized by greater than 80 percent relative humidity. The Category 4 bin has the highest prior-day PM2.5 concentrations at the three potential upwind areas (Knoxville, Atlanta, and Charlotte). The greatest differences among the bins are the wind directions. An anticyclonic circulation aloft (a high pressure system) over the GSM region is indicated by the upper-level wind directions (southwesterly winds over Nashville, northwesterly winds over Greensboro, and southeasterly winds over Atlanta) for Bin 24 (the Category 4 bin).
For Mammoth Cave, the PM2.5 concentration ranges for Categories 3 and 4 are 20 to 25 and greater than or equal to 25 μgm-3, respectively. All four key bins are characterized by high temperatures. Relative humidity varies among the bins and is lowest for Bin 21 (the Category 4 bin). Average surface wind speed is very low for three of the bins, and somewhat higher (moderate) for Bin 30 (one of the Category 3 bins). Prior day PM2.5 values for Nashville, Knoxville, and Louisville vary among the bins, and the variation is not consistent among the three sites. Bin 5 is distinguished by low prior-day PM2.5 values for all three potential upwind areas. Average surface wind direction is southwesterly for Bins 30 and 21, southeasterly for Bin 24, and not available (unable to be calculated) for Bin 5. Morning and evening 850 mb wind directions vary considerably among the key bins. Bin 21, the Category 4 bin, is distinguished from the Category 3 bins by higher prior-day PM2.5 concentrations at all three potential upwind sites, lower relative humidity, and a shift from northwesterly to southerly winds aloft during the daytime hours.
Figure 3-7 shows the average composition for all key PM2.5 bins for each of the IMPROVE sites.

Characterization of Meteorology and Its Relationships to Fine Particulate Mass and Visibility in the VISTAS Region Examination of Relationships between Meteorological and Air Quality Data Using
Classification and Regression Tree (CART) Analysis
Figure 3-7a. Average Elemental Carbon (EC), Nitrate (NO3), Organic Matter (OM), and Sulfate (SO4) Concentrations (μgm-3) for Key PM2.5 Bins for All CART Classification Categories: IMPROVE Site
Breton.
Breton Key PM Bins: Component Averages
0.00
2.00
4.00
6.00
8.00
10.00
7 (119) 1 (44) 11 (23) 4 (21) 13 (9) 8 (4) 19 (13) 27 (7) 21 (10)
Class 1 Class 2 Class 3 Class 4
Bin No. (No. of Correctly Classified Days)
Avg
. Con
c. (µ
g/m
3)
ECNO3OMSO4
Figure 3-7b. Average Elemental Carbon (EC), Nitrate (NO3), Organic Matter (OM), and Sulfate (SO4) Concentrations (μgm-3) for Key PM2.5 Bins for All CART Classification Categories: IMPROVE Site
Brigantine.
Brigantine Key PM Bins: Component Averages
0.002.004.006.008.00
10.0012.0014.0016.00
1 (219) 8 (91) 16 (12) 25 (12) 23 (14) 29 (4) 31 (12)
Class 1 Class 2 Class 3 Class 4
Bin No. (No. of Correctly Classified Days)
Avg.
Con
c. (µ
g/m
3)
ECNO3OMSO4
ICF International 3-142 VISTAS Meteorological Characterization 06-046 December 8, 2006

Characterization of Meteorology and Its Relationships to Fine Particulate Mass and Visibility in the VISTAS Region Examination of Relationships between Meteorological and Air Quality Data Using
Classification and Regression Tree (CART) Analysis
Figure 3-7c. Average Elemental Carbon (EC), Nitrate (NO3), Organic Matter (OM), and Sulfate (SO4) Concentrations (μgm-3) for Key PM2.5 Bins for All CART Classification Categories: IMPROVE Site
Cadiz.
Cadiz Key PM Bins: Component Averages
0.00
2.00
4.00
6.00
8.00
10.00
12.00
14.00
8 (141) 14 (39) 27 (29) 24 (13) 21 (12) 23 (8) 6 (5) 30 (9)
Class 1 Class 2 Class 3 Class 4
Bin No. (No. of Correctly Classified Days)
Avg
. Con
c. (µ
g/m
3)
ECNO3OMSO4
Figure 3-7d. Average Elemental Carbon (EC), Nitrate (NO3), Organic Matter (OM), and Sulfate (SO4) Concentrations (μgm-3) for Key PM2.5 Bins for All CART Classification Categories: IMPROVE Site
Caney Creek.
Caney Creek Key PM Bins: Component Averages
0.00
2.00
4.00
6.00
8.00
10.00
12.00
3 (164) 18 (43) 5 (26) 11 (14) 22 (12) 31 (10) 13 (7) 32 (6) 27 (5) 29 (10)
Class 1 Class 2 Class 3 Class 4
Bin No. (No. of Correctly Classified Days)
Avg.
Con
c. (µ
g/m
3)
ECNO3OMSO4
ICF International 3-143 VISTAS Meteorological Characterization 06-046 December 8, 2006

Characterization of Meteorology and Its Relationships to Fine Particulate Mass and Visibility in the VISTAS Region Examination of Relationships between Meteorological and Air Quality Data Using
Classification and Regression Tree (CART) Analysis
Figure 3-7e. Average Elemental Carbon (EC), Nitrate (NO3), Organic Matter (OM), and Sulfate (SO4) Concentrations (μgm-3) for Key PM2.5 Bins for All CART Classification Categories: IMPROVE Site
Cape Romain.
Cape Romain Key PM Bins: Component Averages
0.00
2.00
4.00
6.00
8.00
10.00
12.00
1 (191) 13 (59) 8 (37) 29 (17) 20 (14) 18 (11) 6 (10) 15 (4) 31 (4) 22 (11) 33 (7)
Class 1 Class 2 Class 3 Class 4
Bin No. (No. of Correctly Classified Days)
Avg
. Con
c. (µ
g/m
3)
ECNO3OMSO4
Figure 3-7f. Average Elemental Carbon (EC), Nitrate (NO3), Organic Matter (OM), and Sulfate (SO4) Concentrations (μgm-3) for Key PM2.5 Bins for All CART Classification Categories: IMPROVE Site
Chassahowitzka.
Chassahowitzka Key PM Bins: Component Averages
0.00
2.00
4.00
6.00
8.00
10.00
5 (117) 2 (23) 22 (21) 23 (6) 21 (9) 12 (5) 13 (10) 8 (8) 27 (9)
Class 1 Class 2 Class 3 Class 4
Bin No. (No. of Correctly Classified Days)
Avg.
Con
c. (µ
g/m
3)
ECNO3OMSO4
ICF International 3-144 VISTAS Meteorological Characterization 06-046 December 8, 2006

Characterization of Meteorology and Its Relationships to Fine Particulate Mass and Visibility in the VISTAS Region Examination of Relationships between Meteorological and Air Quality Data Using
Classification and Regression Tree (CART) Analysis
Figure 3-7g. Average Elemental Carbon (EC), Nitrate (NO3), Organic Matter (OM), and Sulfate (SO4) Concentrations (μgm-3) for Key PM2.5 Bins for All CART Classification Categories: IMPROVE Site
Cohutta.
Cohutta Key PM Bins: Component Averages
0.002.004.006.008.00
10.0012.0014.0016.00
1 (179) 7 (26) 5 (15) 13 (18) 2 (11) 23 (9) 21 (10) 29 (12)
Class 1 Class 2 Class 3 Class 4
Bin No. (No. of Correctly Classified Days)
Avg.
Con
c. (µ
g/m
3)
ECNO3OMSO4
Figure 3-7h. Average Elemental Carbon (EC), Nitrate (NO3), Organic Matter (OM), and Sulfate (SO4) Concentrations (μgm-3) for Key PM2.5 Bins for All CART Classification Categories: IMPROVE Site
Dolly Sods.
Dolly Sods Key PM Bins: Component Averages
0.002.004.006.008.00
10.0012.0014.0016.0018.00
4 (237) 10 (23) 1 (20) 17 (34) 7 (22) 21 (11) 18 (4) 23 (11) 27 (4)
Class 1 Class 2 Class 3 Class 4
Bin No. (No. of Correctly Classified Days)
Avg.
Con
c. (µ
g/m
3)
ECNO3OMSO4
ICF International 3-145 VISTAS Meteorological Characterization 06-046 December 8, 2006

Characterization of Meteorology and Its Relationships to Fine Particulate Mass and Visibility in the VISTAS Region Examination of Relationships between Meteorological and Air Quality Data Using
Classification and Regression Tree (CART) Analysis
Figure 3-7i. Average Elemental Carbon (EC), Nitrate (NO3), Organic Matter (OM), and Sulfate (SO4) Concentrations (μgm-3) for Key PM2.5 Bins for All CART Classification Categories: IMPROVE Site
Everglades.
Everglades Key PM Bins: Component Averages
0.002.004.006.008.00
10.0012.0014.0016.0018.00
1 (184) 11 (65) 7 (17) 28 (25) 15 (19) 19 (9) 21 (5) 27 (5) 2 (4)
Class 1 Class 2 Class 3 Class 4
Bin No. (No. of Correctly Classified Days)
Avg.
Con
c. (µ
g/m
3)
ECNO3OMSO4
Figure 3-7j. Average Elemental Carbon (EC), Nitrate (NO3), Organic Matter (OM), and Sulfate (SO4) Concentrations (μgm-3) for Key PM2.5 Bins for All CART Classification Categories: IMPROVE Site
Great Smoky Mountains.
Great Smoky Mountains Key PM Bins: Component Averages
0.002.004.006.008.00
10.0012.0014.0016.00
3 (291) 4(42) 17 (20) 20 (20) 22 (12) 5 (8) 11 (10) 13 (7) 26 (7) 24 (14)
Class 1 Class 2 Class 3 Class 4
Bin No. (No. of Correctly Classified Days)
Avg
. Con
c. (µ
g/m
3)
ECNO3OMSO4
ICF International 3-146 VISTAS Meteorological Characterization 06-046 December 8, 2006

Characterization of Meteorology and Its Relationships to Fine Particulate Mass and Visibility in the VISTAS Region Examination of Relationships between Meteorological and Air Quality Data Using
Classification and Regression Tree (CART) Analysis
Figure 3-7k. Average Elemental Carbon (EC), Nitrate (NO3), Organic Matter (OM), and Sulfate (SO4) Concentrations (μgm-3) for Key PM2.5 Bins for All CART Classification Categories: IMPROVE Site
James River Face.
James River Face Key PM Bins: Component Averages
0.00
2.00
4.00
6.00
8.00
10.00
12.00
14.00
1 (174) 25 (51) 28 (45) 9 (28) 26 (18) 19 (12) 23 (8) 14 (4) 16 (8)
Class 1 Class 2 Class 3 Class 4
Bin No. (No. of Correctly Classified Days)
Avg.
Con
c. (µ
g/m
3)
ECNO3OMSO4
Figure 3-7l. Average Elemental Carbon (EC), Nitrate (NO3), Organic Matter (OM), and Sulfate (SO4) Concentrations (μgm-3) for Key PM2.5 Bins for All CART Classification Categories: IMPROVE Site
Linville Gorge.
Linville Gorge Key PM Bins: Component Averages
0.00
2.00
4.00
6.00
8.00
10.00
12.00
14.00
1 (227) 6 (49) 21 (17) 18 (22) 15 (11) 31 (9) 30 (5) 19 (5) 25 (15)
Class 1 Class 2 Class 3 Class 4
Bin No. (No. of Correctly Classified Days)
Avg.
Con
c. (µ
g/m
3)
ECNO3OMSO4
ICF International 3-147 VISTAS Meteorological Characterization 06-046 December 8, 2006

Characterization of Meteorology and Its Relationships to Fine Particulate Mass and Visibility in the VISTAS Region Examination of Relationships between Meteorological and Air Quality Data Using
Classification and Regression Tree (CART) Analysis
Figure 3-7m. Average Elemental Carbon (EC), Nitrate (NO3), Organic Matter (OM), and Sulfate (SO4) Concentrations (μgm-3) for Key PM2.5 Bins for All CART Classification Categories: IMPROVE
Site Mammoth Cave.
Mammoth Cave Key PM Bins: Component Averages
0.002.004.006.008.00
10.0012.0014.0016.00
10 (221) 1 (55) 19 (25) 9 (22) 13 (14) 30 (10) 5 (4) 24 (4) 21 (16)
Class 1 Class 2 Class 3 Class 4
Bin No. (No. of Correctly Classified Days)
Avg.
Con
c. (µ
g/m
3)
ECNO3OMSO4
Figure 3-7n. Average Elemental Carbon (EC), Nitrate (NO3), Organic Matter (OM), and Sulfate (SO4) Concentrations (μgm-3) for Key PM2.5 Bins for All CART Classification Categories: IMPROVE Site
Mingo.
Mingo Key PM Bins: Component Averages
0.00
2.00
4.00
6.00
8.00
10.00
12.00
14 (68) 1 (26) 12 (10) 22 (9) 7 (7) 18 (10) 8 (5) 21 (5)
Class 1 Class 2 Class 3 Class 4
Bin No. (No. of Correctly Classified Days)
Avg.
Con
c. (µ
g/m
3)
ECNO3OMSO4
ICF International 3-148 VISTAS Meteorological Characterization 06-046 December 8, 2006
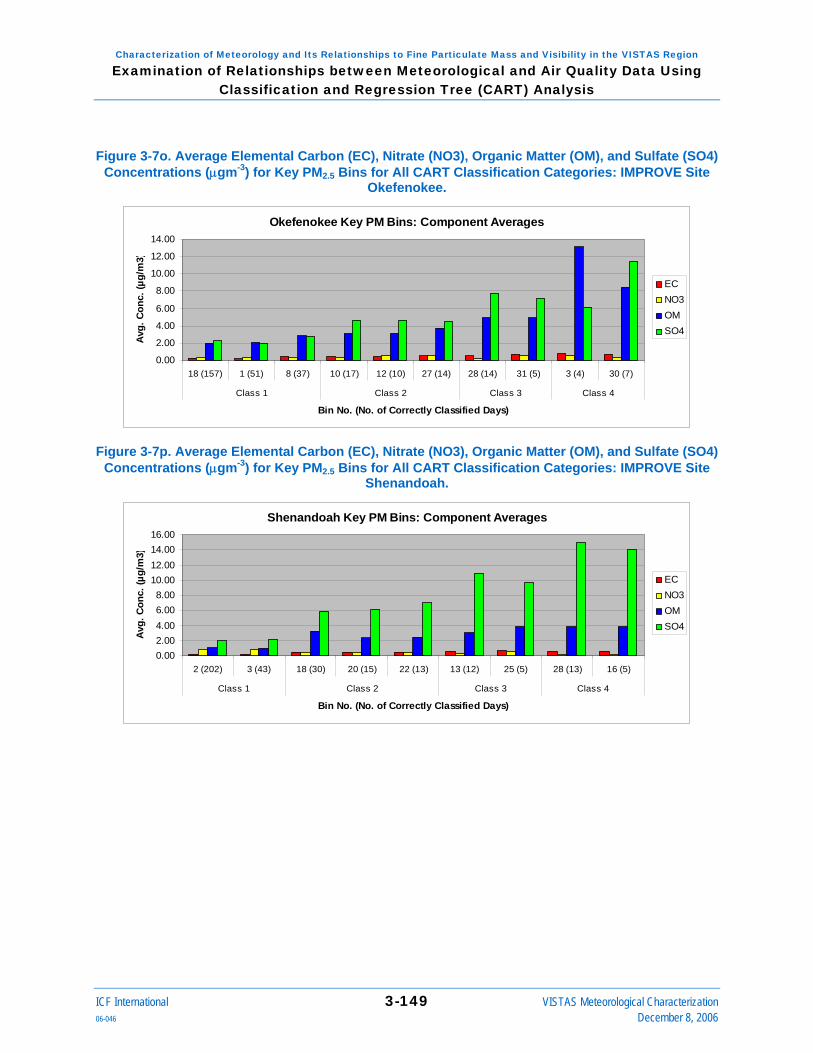
Characterization of Meteorology and Its Relationships to Fine Particulate Mass and Visibility in the VISTAS Region Examination of Relationships between Meteorological and Air Quality Data Using
Classification and Regression Tree (CART) Analysis
Figure 3-7o. Average Elemental Carbon (EC), Nitrate (NO3), Organic Matter (OM), and Sulfate (SO4) Concentrations (μgm-3) for Key PM2.5 Bins for All CART Classification Categories: IMPROVE Site
Okefenokee.
Okefenokee Key PM Bins: Component Averages
0.00
2.00
4.00
6.00
8.00
10.00
12.00
14.00
18 (157) 1 (51) 8 (37) 10 (17) 12 (10) 27 (14) 28 (14) 31 (5) 3 (4) 30 (7)
Class 1 Class 2 Class 3 Class 4
Bin No. (No. of Correctly Classified Days)
Avg.
Con
c. (µ
g/m
3)
ECNO3OMSO4
Figure 3-7p. Average Elemental Carbon (EC), Nitrate (NO3), Organic Matter (OM), and Sulfate (SO4) Concentrations (μgm-3) for Key PM2.5 Bins for All CART Classification Categories: IMPROVE Site
Shenandoah.
Shenandoah Key PM Bins: Component Averages
0.002.004.006.008.00
10.0012.0014.0016.00
2 (202) 3 (43) 18 (30) 20 (15) 22 (13) 13 (12) 25 (5) 28 (13) 16 (5)
Class 1 Class 2 Class 3 Class 4
Bin No. (No. of Correctly Classified Days)
Avg.
Con
c. (µ
g/m
3)
ECNO3OMSO4
ICF International 3-149 VISTAS Meteorological Characterization 06-046 December 8, 2006

Characterization of Meteorology and Its Relationships to Fine Particulate Mass and Visibility in the VISTAS Region Examination of Relationships between Meteorological and Air Quality Data Using
Classification and Regression Tree (CART) Analysis
Figure 3-7q. Average Elemental Carbon (EC), Nitrate (NO3), Organic Matter (OM), and Sulfate (SO4) Concentrations (μgm-3) for Key PM2.5 Bins for All CART Classification Categories: IMPROVE Site
Shining Rock.
Shining Rock Key PM Bins: Component Averages
0.00
2.00
4.00
6.00
8.00
10.00
12.00
14.00
5 (191) 20 (37) 4 (19) 14 (15) 9 (15) 10 (8) 27 (7) 21 (5) 23 (12)
Class 1 Class 2 Class 3 Class 4
Bin No. (No. of Correctly Classified Days)
Avg.
Con
c. (µ
g/m
3)
ECNO3OMSO4
Figure 3-7r. Average Elemental Carbon (EC), Nitrate (NO3), Organic Matter (OM), and Sulfate (SO4) Concentrations (μgm-3) for Key PM2.5 Bins for All CART Classification Categories: IMPROVE Site
Sipsey.
Sipsy Key PM Bins: Component Averages
0.00
2.00
4.00
6.00
8.00
10.00
12.00
14.00
1 (190) 8 (41) 16 (18) 15 (10) 3 (8) 24 (8) 29 (7) 22 (3) 30 (11)
Class 1 Class 2 Class 3 Class 4
Bin No. (No. of Correctly Classified Days)
Avg.
Con
c. (µ
g/m
3)
ECNO3OMSO4
ICF International 3-150 VISTAS Meteorological Characterization 06-046 December 8, 2006
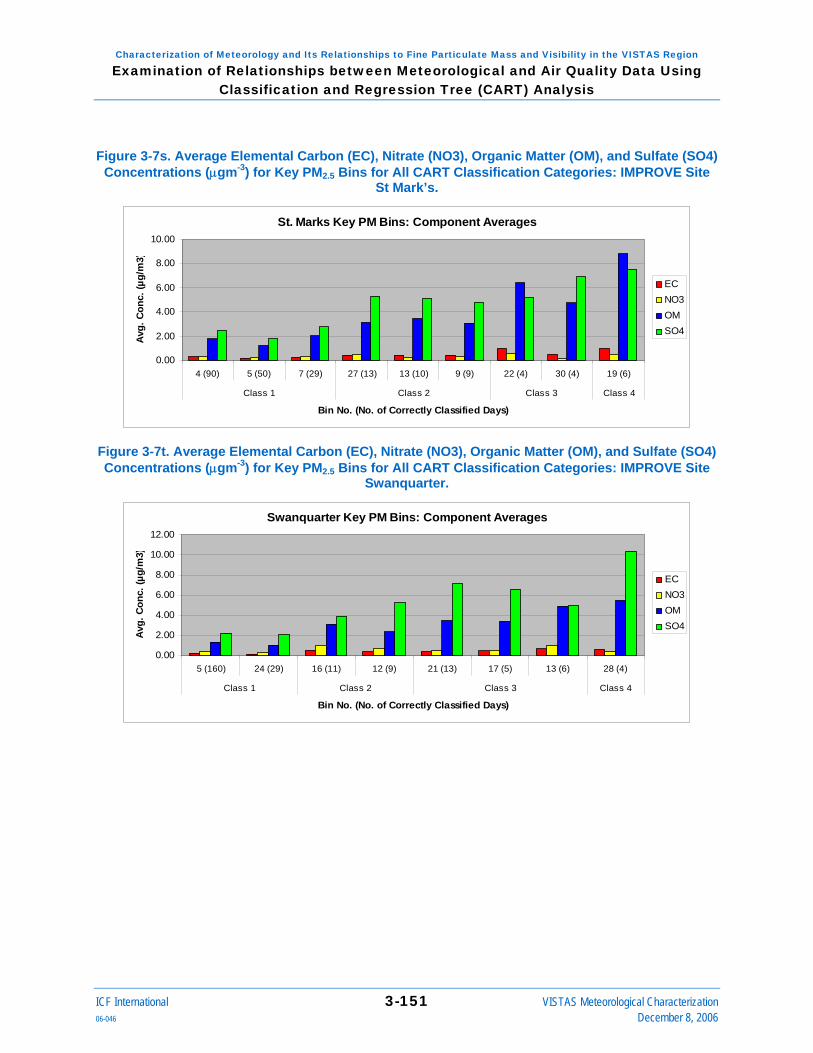
Characterization of Meteorology and Its Relationships to Fine Particulate Mass and Visibility in the VISTAS Region Examination of Relationships between Meteorological and Air Quality Data Using
Classification and Regression Tree (CART) Analysis
Figure 3-7s. Average Elemental Carbon (EC), Nitrate (NO3), Organic Matter (OM), and Sulfate (SO4) Concentrations (μgm-3) for Key PM2.5 Bins for All CART Classification Categories: IMPROVE Site
St Mark’s.
St. Marks Key PM Bins: Component Averages
0.00
2.00
4.00
6.00
8.00
10.00
4 (90) 5 (50) 7 (29) 27 (13) 13 (10) 9 (9) 22 (4) 30 (4) 19 (6)
Class 1 Class 2 Class 3 Class 4
Bin No. (No. of Correctly Classified Days)
Avg.
Con
c. (µ
g/m
3)
ECNO3OMSO4
Figure 3-7t. Average Elemental Carbon (EC), Nitrate (NO3), Organic Matter (OM), and Sulfate (SO4) Concentrations (μgm-3) for Key PM2.5 Bins for All CART Classification Categories: IMPROVE Site
Swanquarter.
Swanquarter Key PM Bins: Component Averages
0.00
2.00
4.00
6.00
8.00
10.00
12.00
5 (160) 24 (29) 16 (11) 12 (9) 21 (13) 17 (5) 13 (6) 28 (4)
Class 1 Class 2 Class 3 Class 4
Bin No. (No. of Correctly Classified Days)
Avg.
Con
c. (µ
g/m
3)
ECNO3OMSO4
ICF International 3-151 VISTAS Meteorological Characterization 06-046 December 8, 2006

Characterization of Meteorology and Its Relationships to Fine Particulate Mass and Visibility in the VISTAS Region Examination of Relationships between Meteorological and Air Quality Data Using
Classification and Regression Tree (CART) Analysis
Figure 3-7u. Average Elemental Carbon (EC), Nitrate (NO3), Organic Matter (OM), and Sulfate (SO4) Concentrations (μgm-3) for Key PM2.5 Bins for All CART Classification Categories: IMPROVE Site
Upper Buffalo.
Upper Buffalo Key PM Bins: Component Averages
0.00
2.00
4.00
6.00
8.00
10.00
2 (167) 17 (33) 21 (38) 20 (15) 12 (10) 23 (5) 28 (4) 30 (4) 32 (16)
Class 1 Class 2 Class 3 Class 4
Bin No. (No. of Correctly Classified Days)
Avg.
Con
c. (µ
g/m
3)
ECNO3OMSO4
The compositional charts for PM2.5 also clearly illustrate that the relative contributions of various PM2.5 components vary by bin for each of the sites. As for visibility, the high PM2.5 concentration bins are distinguished from the lower concentration bins by higher sulfate and organic matter concentrations, and, in many cases, lower nitrate concentrations. Within each category, the variations among the bins are due to differences in meteorology as well as regional pollutant transport.
Table 3-16 summarizes the characteristics for key Category 3 and 4 bins for the STN monitoring sites.
ICF International 3-152 VISTAS Meteorological Characterization 06-046 December 8, 2006

Characterization of Meteorology and Its Relationships to Fine Particulate Mass and Visibility in the VISTAS Region Examination of Relationships between Meteorological and Air Quality Data Using
Classification and Regression Tree (CART) Analysis
ICF International 3-153 VISTAS Meteorological Characterization 06-046 December 8, 2006
Table 3-16a. Summary of Average Input Parameters for Key Bins for CART Classification Categories 3 and 4: PM2.5 CART Analysis for STN Site Birmingham.
The ranges in PM2.5 for Categories 3 and 4 are 32.5-40 and ≥ 40 μgm-3.
Class 3 Class 4 Bin 11 Bin 26 Bin 19 Bin 10 PM2.5 Parameters Yesterday's FM at Birmingham (µg/m3) 30.5 32.6 50.7 32.4 Yesterday's FM at Atlanta (µg/m3) 23.2 24.1 37.6 25.6 Yesterday's FM at Memphis (µg/m3) 21.5 27.9 28.3 22.2 Yesterday's FM at Nashville (µg/m3) 22.0 31.3 27.7 19.5 Surface Meteorological Parameters Max. surface temperature (°C) 27.9 34.0 28.3 29.6 Min. surface temperature (°C) 14.8 22.7 14.5 14.6 Relative humidity (%) 61.3 61.2 63.1 61.6 Surface wind speed (ms-1) 1.0 2.2 0.7 0.3 Surface wind direction (degrees) 90 81 342 112 Persistence 0.7 0.9 0.8 0.5 Sea level pressure (mb) 1021 1017 1022 1023 Rainfall (inches) 0.0 0.0 0.0 0.0 Rain (# periods) 0.3 0.3 0.1 0.2 Upper-Air Meteorological Parameters Temperature AM 850 mb (°C) 13.8 18.2 13.6 14.6 Temperature PM 850 mb (°C) 15.0 19.3 14.4 15.9 Stability at Birmingham (°C) 3.6 0.8 4.5 4.0 Geopotential height difference 700 mb at Birmingham (m) -3.2 6.7 1.3 5.9 Wind speed yesterday 700 mb at Birmingham (ms-1) 6.9 9.2 5.8 6.0 Wind direction yesterday 700 mb at Birmingham (degrees) 24 22 34 22 Wind speed yesterday 850 mb at Birmingham (ms-1) 4.6 6.5 3.6 4.5 Wind speed AM 850 mb at Birmingham (ms-1) 5.5 4.6 3.7 4.0 Wind speed PM 850 mb at Birmingham (ms-1) 5.1 6.9 2.9 3.2 Wind direction yesterday 850 mb at Birmingham (degrees) 24 22 34 22 Wind direction AM 850 mb at Birmingham (degrees) 243 56 270 45 Wind direction PM 850 mb at Birmingham (degrees) 60 68 270 180 Recirculation at Birmingham 0.1 0.0 0.4 0.2 Cloud average 1.6 1.7 1.5 1.5

Characterization of Meteorology and Its Relationships to Fine Particulate Mass and Visibility in the VISTAS Region Examination of Relationships between Meteorological and Air Quality Data Using
Classification and Regression Tree (CART) Analysis
ICF International 3-154 VISTAS Meteorological Characterization 06-046 December 8, 2006
Table 3-16b. Summary of Average Input Parameters for Key Bins for CART Classification Categories 3 and 4: PM2.5 CART Analysis for STN Site Charlotte.
The ranges in PM2.5 for Categories 3 and 4 are 22.5-30 and ≥ 30 μgm-3.
Class 3 Class 4 Bin 31 Bin 15 Bin 12 Bin 18 Bin 26 PM2.5 Parameters Yesterday's FM at Atlanta (µg/m3) 28.2 33.4 20.6 23.2 35.2 Yesterday's FM at Charlotte (µg/m3) 28.6 20.1 19.3 18.8 32.2 Yesterday's FM at Greenville-Spartanburg (µg/m3) 27.2 19.0 18.3 18.3 30.4 Yesterday's FM at Winston-Salem (µg/m3) 29.2 19.7 20.8 22.4 31.7 Surface Meteorological Parameters Max. surface temperature (°C) 31.2 23.6 26.0 33.7 29.2 Min. surface temperature (°C) 19.7 10.6 16.5 20.3 16.7 Relative humidity (%) 70.2 66.8 71.0 62.2 69.1 Surface wind speed (ms-1) 1.8 1.3 1.6 1.1 1.2 Surface wind direction (degrees) 207 194 102 209 185 Persistence 0.7 0.8 0.6 0.7 0.7 Sea level pressure (mb) 1019 1022 1021 1018 1020 Rainfall (inches) 0.2 0.0 0.4 0.0 0.0 Rain (# periods) 0.6 0.2 0.6 0.3 0.3 Upper-Air Meteorological Parameters Temperature AM 850 mb (°C) 17.1 10.3 12.1 18.2 15.2 Temperature PM 850 mb (°C) 17.6 12.2 12.7 19.5 15.7 Stability at Greensboro (°C) 0.5 3.6 -0.4 1.7 1.4 Geopotential height difference 700 mb at Greensboro (m) -6.6 6.6 25.5 2.3 -1.5 Wind speed yesterday 700 mb at Greensboro (ms-1) 9.1 9.2 10.0 7.0 6.5 Wind direction yesterday 700 mb at Greensboro (degrees) 286 288 306 319 326 Wind speed yesterday 850 mb at Greensboro (ms-1) 5.8 5.4 5.5 4.1 5.0 Wind speed AM 850 mb at Greensboro (ms-1) 8.6 6.1 4.7 5.1 3.9 Wind speed PM 850 mb at Greensboro (ms-1) 7.0 7.5 4.1 5.2 5.2 Wind direction yesterday 850 mb at Greensboro (degrees) 259 247 301 301 309 Wind direction AM 850 mb at Greensboro (degrees) 278 246 307 323 302 Wind direction PM 850 mb at Greensboro (degrees) 273 270 n/a 270 278 Recirculation at Greensboro 0 0.1 0.3 0.1 0.2 Cloud average 1.8 1.4 2 1.7 1.5
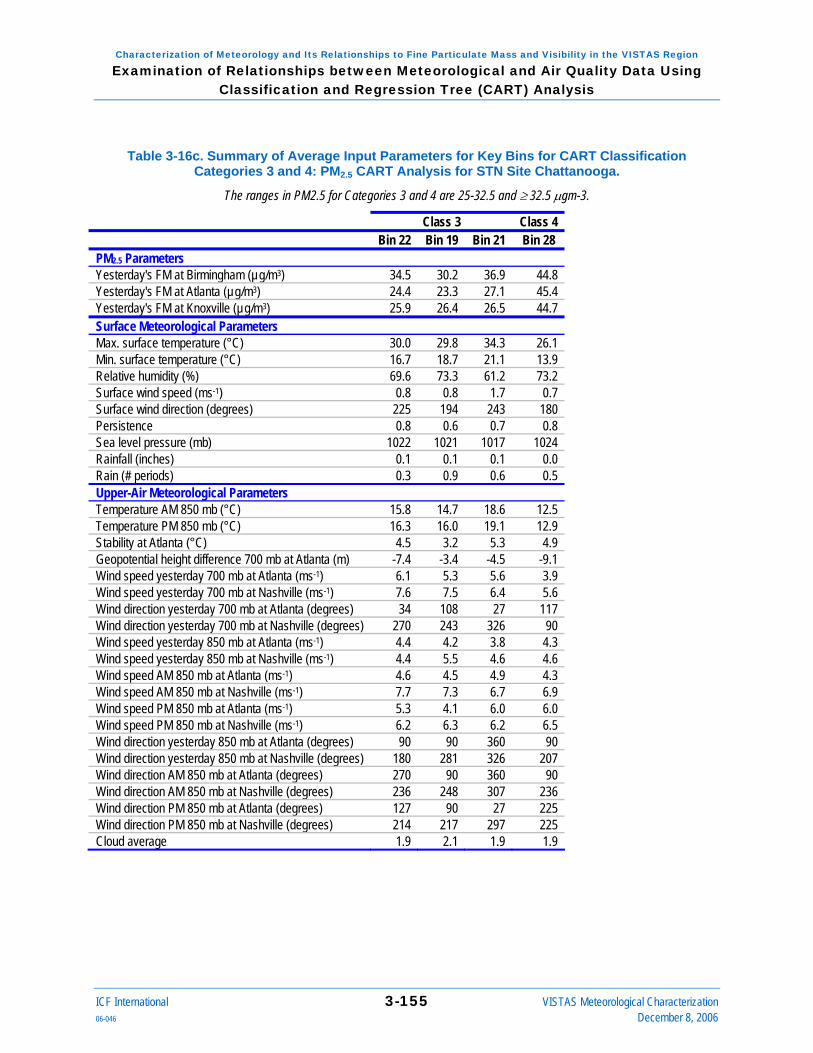
Characterization of Meteorology and Its Relationships to Fine Particulate Mass and Visibility in the VISTAS Region Examination of Relationships between Meteorological and Air Quality Data Using
Classification and Regression Tree (CART) Analysis
ICF International 3-155 VISTAS Meteorological Characterization 06-046 December 8, 2006
Table 3-16c. Summary of Average Input Parameters for Key Bins for CART Classification Categories 3 and 4: PM2.5 CART Analysis for STN Site Chattanooga.
The ranges in PM2.5 for Categories 3 and 4 are 25-32.5 and ≥ 32.5 μgm-3.
Class 3 Class 4 Bin 22 Bin 19 Bin 21 Bin 28 PM2.5 Parameters Yesterday's FM at Birmingham (µg/m3) 34.5 30.2 36.9 44.8 Yesterday's FM at Atlanta (µg/m3) 24.4 23.3 27.1 45.4 Yesterday's FM at Knoxville (µg/m3) 25.9 26.4 26.5 44.7 Surface Meteorological Parameters Max. surface temperature (°C) 30.0 29.8 34.3 26.1 Min. surface temperature (°C) 16.7 18.7 21.1 13.9 Relative humidity (%) 69.6 73.3 61.2 73.2 Surface wind speed (ms-1) 0.8 0.8 1.7 0.7 Surface wind direction (degrees) 225 194 243 180 Persistence 0.8 0.6 0.7 0.8 Sea level pressure (mb) 1022 1021 1017 1024 Rainfall (inches) 0.1 0.1 0.1 0.0 Rain (# periods) 0.3 0.9 0.6 0.5 Upper-Air Meteorological Parameters Temperature AM 850 mb (°C) 15.8 14.7 18.6 12.5 Temperature PM 850 mb (°C) 16.3 16.0 19.1 12.9 Stability at Atlanta (°C) 4.5 3.2 5.3 4.9 Geopotential height difference 700 mb at Atlanta (m) -7.4 -3.4 -4.5 -9.1 Wind speed yesterday 700 mb at Atlanta (ms-1) 6.1 5.3 5.6 3.9 Wind speed yesterday 700 mb at Nashville (ms-1) 7.6 7.5 6.4 5.6 Wind direction yesterday 700 mb at Atlanta (degrees) 34 108 27 117 Wind direction yesterday 700 mb at Nashville (degrees) 270 243 326 90 Wind speed yesterday 850 mb at Atlanta (ms-1) 4.4 4.2 3.8 4.3 Wind speed yesterday 850 mb at Nashville (ms-1) 4.4 5.5 4.6 4.6 Wind speed AM 850 mb at Atlanta (ms-1) 4.6 4.5 4.9 4.3 Wind speed AM 850 mb at Nashville (ms-1) 7.7 7.3 6.7 6.9 Wind speed PM 850 mb at Atlanta (ms-1) 5.3 4.1 6.0 6.0 Wind speed PM 850 mb at Nashville (ms-1) 6.2 6.3 6.2 6.5 Wind direction yesterday 850 mb at Atlanta (degrees) 90 90 360 90 Wind direction yesterday 850 mb at Nashville (degrees) 180 281 326 207 Wind direction AM 850 mb at Atlanta (degrees) 270 90 360 90 Wind direction AM 850 mb at Nashville (degrees) 236 248 307 236 Wind direction PM 850 mb at Atlanta (degrees) 127 90 27 225 Wind direction PM 850 mb at Nashville (degrees) 214 217 297 225 Cloud average 1.9 2.1 1.9 1.9

Characterization of Meteorology and Its Relationships to Fine Particulate Mass and Visibility in the VISTAS Region Examination of Relationships between Meteorological and Air Quality Data Using
Classification and Regression Tree (CART) Analysis
ICF International 3-156 VISTAS Meteorological Characterization 06-046 December 8, 2006
Table 3-16d. Summary of Average Input Parameters for Key Bins for CART Classification Categories 3 and 4: PM2.5 CART Analysis for STN Site Greenville-Spartanburg.
The ranges in PM2.5 for Categories 3 and 4 are 22.5-30 and ≥ 30 μgm-3.
Class 3 Class 4 Bin 20 Bin 25 Bin 22 Bin32 Bin 21 Bin30 PM2.5 Parameters Yesterday's FM at Atlanta (µg/m3) 27.1 36.1 24.9 40.2 26.0 30.1 Yesterday's FM at Columbus (µg/m3) 17.7 28.4 16.6 29.3 17.9 25.4 Yesterday's FM at Charlotte (µg/m3) 23.9 30.1 24.8 32.9 26.3 25.5 Yesterday's FM at Greensboro (µg/m3) 25.2 32.8 24.6 34.1 26.7 23.3 Surface Meteorological Parameters Max. surface temperature (°C) 28.0 28.9 29.5 28.5 26.8 29.6 Min. surface temperature (°C) 17.3 18.9 19.2 18.0 13.4 20.1 Relative humidity (%) 67.8 75.7 70.2 71.9 69.6 70.6 Surface wind speed (ms-1) 2.2 1.4 2.1 1.8 1.9 1.4 Surface wind direction (degrees) 195 236 63 236 112 90 Persistence 0.8 0.7 0.8 0.8 0.8 0.8 Sea level pressure (mb) 1019 1018 1021 1020 1022 1020 Rainfall (inches) 0.0 0.2 0.0 0.1 0.0 0.0 Rain (# periods) 0.6 0.9 0.5 0.4 0.0 0.0 Upper-Air Meteorological Parameters Temperature AM 850 mb (°C) 14.3 15.8 15.8 14.8 13.1 15.5 Temperature PM 850 mb (°C) 16.1 16.2 16.5 15.5 14.1 16.8 Stability at Atlanta (°C) 2.4 2.1 0.0 3.0 2.7 2.5 Geopotential height difference 700 mb at Atlanta (m) -6.5 -20.5 9.2 9.8 -10.3 14.1 Wind speed yesterday 700 mb at Atlanta (ms-1) 6.0 5.6 4.82 5.5 6.5 6.6 Wind speed yesterday 700 mb at Greensboro (ms-1) 8.4 6.2 4.4 7.3 5.9 5.1 Wind direction yesterday 700 mb at Atlanta (degrees) 278 14 108 310 45 34 Wind direction yesterday 700 mb at Greensboro (degrees) 283 326 270 287 9 346 Wind speed yesterday 850 mb at Atlanta (ms-1) 5.0 4.9 4.4 4.2 4.8 3.5 Wind speed yesterday 850 mb at Greensboro (ms-1) 5.9 5.9 6.2 5.4 4.0 3.7 Wind speed AM 850 mb at Atlanta (ms-1) 6.8 5.0 5.0 5.3 4.2 4.0 Wind speed AM 850 mb at Greensboro (ms-1) 7.6 5.2 6.5 6.1 3.5 3.7 Wind speed PM 850 mb at Atlanta (ms-1) 6.4 4.9 5.3 5.1 4.2 4.1 Wind speed PM 850 mb at Greensboro (ms-1) 7.0 5.9 5.1 6.6 3.9 4.6 Wind direction yesterday 850 mb at Atlanta (degrees) 140 284 79 171 90 360 Wind direction yesterday 850 mb at Greensboro (degrees) 270 270 56 270 27 31 Wind direction AM 850 mb at Atlanta (degrees) 239 360 59 234 227 34 Wind direction AM 850 mb at Greensboro (degrees) 257 307 74 266 27 34 Wind direction PM 850 mb at Atlanta (degrees) 250 207 74 211 146 90 Wind direction PM 850 mb at Greensboro (degrees) 249 270 90 274 225 90 Cloud average 2.0 2.2 2.4 1.9 2.0 1.8
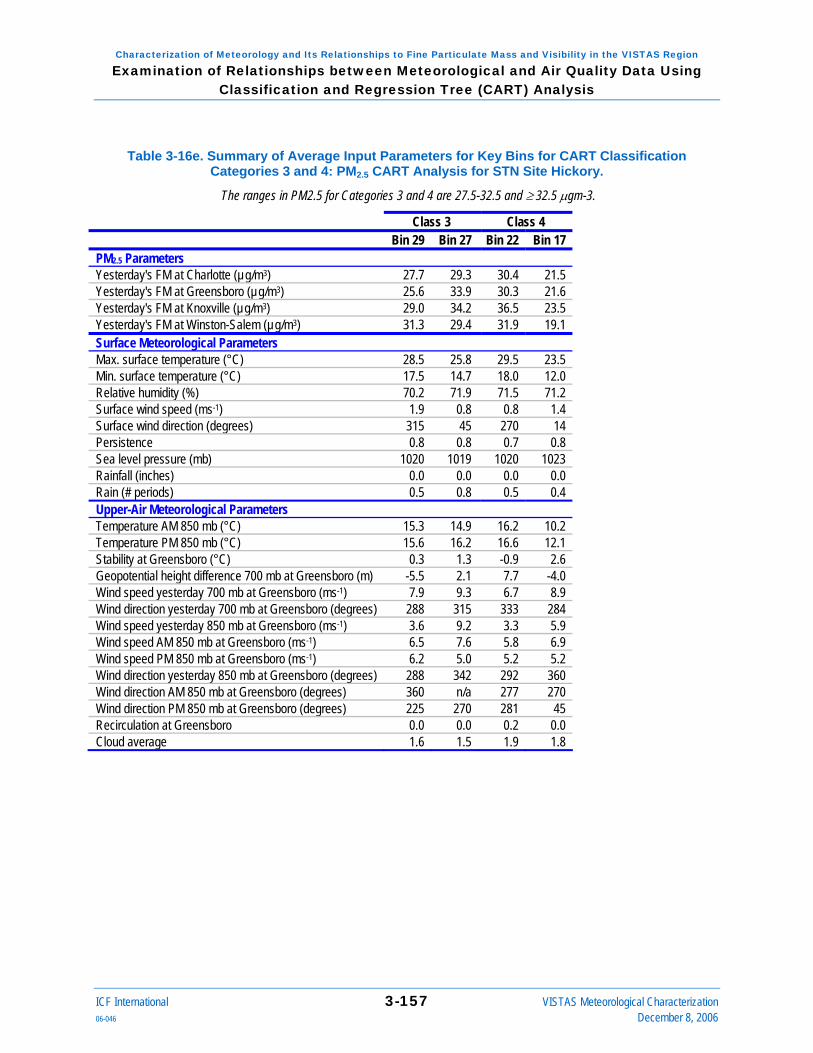
Characterization of Meteorology and Its Relationships to Fine Particulate Mass and Visibility in the VISTAS Region Examination of Relationships between Meteorological and Air Quality Data Using
Classification and Regression Tree (CART) Analysis
ICF International 3-157 VISTAS Meteorological Characterization 06-046 December 8, 2006
Table 3-16e. Summary of Average Input Parameters for Key Bins for CART Classification Categories 3 and 4: PM2.5 CART Analysis for STN Site Hickory.
The ranges in PM2.5 for Categories 3 and 4 are 27.5-32.5 and ≥ 32.5 μgm-3.
Class 3 Class 4 Bin 29 Bin 27 Bin 22 Bin 17 PM2.5 Parameters Yesterday's FM at Charlotte (µg/m3) 27.7 29.3 30.4 21.5 Yesterday's FM at Greensboro (µg/m3) 25.6 33.9 30.3 21.6 Yesterday's FM at Knoxville (µg/m3) 29.0 34.2 36.5 23.5 Yesterday's FM at Winston-Salem (µg/m3) 31.3 29.4 31.9 19.1 Surface Meteorological Parameters Max. surface temperature (°C) 28.5 25.8 29.5 23.5 Min. surface temperature (°C) 17.5 14.7 18.0 12.0 Relative humidity (%) 70.2 71.9 71.5 71.2 Surface wind speed (ms-1) 1.9 0.8 0.8 1.4 Surface wind direction (degrees) 315 45 270 14 Persistence 0.8 0.8 0.7 0.8 Sea level pressure (mb) 1020 1019 1020 1023 Rainfall (inches) 0.0 0.0 0.0 0.0 Rain (# periods) 0.5 0.8 0.5 0.4 Upper-Air Meteorological Parameters Temperature AM 850 mb (°C) 15.3 14.9 16.2 10.2 Temperature PM 850 mb (°C) 15.6 16.2 16.6 12.1 Stability at Greensboro (°C) 0.3 1.3 -0.9 2.6 Geopotential height difference 700 mb at Greensboro (m) -5.5 2.1 7.7 -4.0 Wind speed yesterday 700 mb at Greensboro (ms-1) 7.9 9.3 6.7 8.9 Wind direction yesterday 700 mb at Greensboro (degrees) 288 315 333 284 Wind speed yesterday 850 mb at Greensboro (ms-1) 3.6 9.2 3.3 5.9 Wind speed AM 850 mb at Greensboro (ms-1) 6.5 7.6 5.8 6.9 Wind speed PM 850 mb at Greensboro (ms-1) 6.2 5.0 5.2 5.2 Wind direction yesterday 850 mb at Greensboro (degrees) 288 342 292 360 Wind direction AM 850 mb at Greensboro (degrees) 360 n/a 277 270 Wind direction PM 850 mb at Greensboro (degrees) 225 270 281 45 Recirculation at Greensboro 0.0 0.0 0.2 0.0 Cloud average 1.6 1.5 1.9 1.8

Characterization of Meteorology and Its Relationships to Fine Particulate Mass and Visibility in the VISTAS Region Examination of Relationships between Meteorological and Air Quality Data Using
Classification and Regression Tree (CART) Analysis
ICF International 3-158 VISTAS Meteorological Characterization 06-046 December 8, 2006
Table 3-16f. Summary of Average Input Parameters for Key Bins for CART Classification Categories 3 and 4: PM2.5 CART Analysis for STN Site Huntington-Ashland.
The ranges in PM2.5 for Categories 3 and 4 are 25-32.5 and ≥ 32.5 μgm-3.
Class 3 Class 4 Bin 14 Bin 12 Bin 23 PM2.5 Parameters Yesterday's FM at Louisville (µg/m3) 27.9 28.7 40.2 Yesterday's FM at Cincinnati (µg/m3) 26.8 24.2 44.7 Surface Meteorological Parameters Max. surface temperature (°C) 27.8 29.4 29.1 Min. surface temperature (°C) 15.8 17.6 17.4 Relative humidity (%) 74.8 77.6 75.0 Surface wind speed (ms-1) 1.2 0.8 0.9 Surface wind direction (degrees) 162 135 214 Persistence 0.7 0.6 0.8 Sea level pressure (mb) 1020 1020 1023 Rainfall (inches) 0.0 0.0 0.0 Rain (# periods) 0.8 0.5 0.8 Upper-Air Meteorological Parameters Temperature AM 850 mb (°C) 14.1 15.8 14.7 Temperature PM 850 mb (°C) 15.3 16.7 16.0 Stability at Wilmington (°C) 1.5 2.4 1.3 Geopotential height difference 700 mb at Wilmington (m) -6.6 -7.0 -16.3 Wind speed yesterday 700 mb at Nashville (ms-1) 7.6 5.1 4.4 Wind speed yesterday 700 mb at Roanoke (ms-1) 4.3 5.9 4.7 Wind direction yesterday 700 mb at Nashville (degrees) 198 360 117 Wind direction yesterday 700 mb at Roanoke (degrees) 297 315 22 Wind speed yesterday 850 mb at Wilmington (ms-1) 5.8 5.7 3.5 Wind speed yesterday 850 mb at Nashville (ms-1) 5.5 4.2 3.6 Wind speed yesterday 850 mb at Roanoke (ms-1) 4.3 5.2 3.8 Wind speed AM 850 mb at Wilmington (ms-1) 6.8 4.2 6.4 Wind speed AM 850 mb at Nashville (ms-1) 6.9 2.5 3.8 Wind speed AM 850 mb at Roanoke (ms-1) 4.2 6.8 6.6 Wind speed PM 850 mb at Wilmington (ms-1) 9.4 5.6 6.1 Wind speed PM 850 mb at Nashville (ms-1) 6.2 4.0 5.1 Wind speed PM 850 mb at Roanoke (ms-1) 4.9 4.9 5.6 Wind direction yesterday 850 mb at Wilmington (degrees) 207 288 236 Wind direction yesterday 850 mb at Nashville (degrees) 194 315 207 Wind direction yesterday 850 mb at Roanoke (degrees) 135 315 14 Wind direction AM 850 mb at Wilmington (degrees) 252 270 281 Wind direction AM 850 mb at Nashville (degrees) 270 225 207 Wind direction AM 850 mb at Roanoke (degrees) 214 288 342 Wind direction PM 850 mb at Wilmington (degrees) 233 270 270 Wind direction PM 850 mb at Nashville (degrees) 207 270 207 Wind direction PM 850 mb at Roanoke (degrees) 169 270 342 Recirculation at Wilmington 0 0.3 0.1 Cloud average 1.8 2.0 1.8

Characterization of Meteorology and Its Relationships to Fine Particulate Mass and Visibility in the VISTAS Region Examination of Relationships between Meteorological and Air Quality Data Using
Classification and Regression Tree (CART) Analysis
ICF International 3-159 VISTAS Meteorological Characterization 06-046 December 8, 2006
Table 3-16g. Summary of Average Input Parameters for Key Bins for CART Classification Categories 3 and 4: PM2.5 CART Analysis for STN Site Jackson.
The ranges in PM2.5 for Categories 3 and 4 are 22.5-27.5 and ≥ 27.5 μgm-3.
Class 3 Class 4 Bin 30 Bin 34 Bin 22 PM2.5 Parameters Yesterday's FM at Birmingham (µg/m3) 38.7 42.8 41.3 Yesterday's FM at Memphis (µg/m3) 24.8 23.8 28.0 Yesterday's FM at Gulfport (µg/m3) 24.0 21.2 23.2 Yesterday's FM at New Orleans/Baton Rouge (µg/m3) 26.5 25.1 25.7 Surface Meteorological Parameters Max. surface temperature (°C) 29.0 29.7 30.4 Min. surface temperature (°C) 17.3 14.0 17.6 Relative humidity (%) 70.1 67.6 69.9 Surface wind speed (ms-1) 1.2 1.4 0.8 Surface wind direction (degrees) 63 90 146 Persistence 0.7 0.9 0.8 Sea level pressure (mb) 1018 1021 1019 Rainfall (inches) 0.1 0.0 0.0 Rain (# periods) 0.7 0.3 0.2 Upper-Air Meteorological Parameters Temperature AM 850 mb (°C) 14 16.2 15.1 Temperature PM 850 mb (°C) 16.2 15.3 16.6 Stability at Jacksonville (°C) -0.3 4.7 1.8 Geopotential height difference 700 mb at Jacksonville (m) -3.8 2.3 1.3 Wind speed yesterday 700 mb at Jacksonville (ms-1) 5.8 5.8 5.9 Wind direction yesterday 700 mb at Jacksonville (degrees) 270 45 76 Wind speed yesterday 850 mb at Jacksonville (ms-1) 4.0 5.4 4.4 Wind speed AM 850 mb at Jacksonville (ms-1) 6.7 7.4 3.0 Wind speed PM 850 mb at Jacksonville (ms-1) 6.0 6.9 1.7 Wind direction yesterday 850 mb at Jacksonville (degrees) 117 n/a 76 Wind direction AM 850 mb at Jacksonville (degrees) 191 n/a 171 Wind direction PM 850 mb at Jacksonville (degrees) 180 n/a 180 Recirculation at Jacksonville 0.1 0.0 0.4 Cloud average 2 1.6 1.6

Characterization of Meteorology and Its Relationships to Fine Particulate Mass and Visibility in the VISTAS Region Examination of Relationships between Meteorological and Air Quality Data Using
Classification and Regression Tree (CART) Analysis
ICF International 3-160 VISTAS Meteorological Characterization 06-046 December 8, 2006
Table 3-16h. Summary of Average Input Parameters for Key Bins for CART Classification Categories 3 and 4: PM2.5 CART Analysis for STN Site Kingsport-Bristol.
The ranges in PM2.5 for Categories 3 and 4 are 25-32.5 and ≥ 32.5 μgm-3.
Class 3 Class 4 PM2.5 Parameters Bin 27 Bin 3 Bin 24 Bin 32 Yesterday's FM at Louisville (µg/m3) 28.6 17.1 28.8 41.4 Yesterday's FM at Knoxville (µg/m3) 39.1 24.9 20.5 38.7 Yesterday's FM at Winston-Salem (µg/m3) 28.9 21.1 21.9 26.2 Yesterday's FM at Richmond (µg/m3) 23.3 12.7 19.4 22.1 Surface Meteorological Parameters Max. surface temperature (°C) 30.4 25.9 28.7 27.2 Min. surface temperature (°C) 18.0 12.4 15.7 14.7 Relative humidity (%) 73.0 72.3 75.5 77.4 Surface wind speed (ms-1) 0.8 0.6 0.9 0.7 Persistence 0.7 0.7 0.7 0.8 Sea level pressure (mb) 1019 1022 1019 1022 Surface wind direction (degrees) 198 256 236 270 Rainfall (inches) 0.1 0.0 0.1 0.0 Rain (# periods) 0.6 0.0 0.6 0.6 Upper-Air Meteorological Parameters Temperature AM 850 mb (°C) 17.2 13.1 15.9 15.3 Temperature PM 850 mb (°C) 18.3 14.3 16.8 16.3 Stability at Roanoke (°C) 2.6 3.9 4.2 5.3 Geopotential height difference 700 mb at Roanoke (m) 2.6 -0.2 3.9 -11.6 Wind speed yesterday 700 mb at Nashville (ms-1) 6.2 7.7 6.3 4.6 Wind speed yesterday 700 mb at Roanoke (ms-1) 7.9 7.0 6.5 5.2 Wind direction yesterday 700 mb at Nashville (degrees) 270 270 297 360 Wind direction yesterday 700 mb at Roanoke (degrees) 284 286 292 360 Wind speed yesterday 850 mb at Nashville (ms-1) 4.9 4.2 5.4 3.6 Wind speed yesterday 850 mb at Roanoke (ms-1) 4.6 4.5 5.0 4.3 Wind speed AM 850 mb at Nashville (ms-1) 6.7 5.6 8.3 6.1 Wind speed AM 850 mb at Roanoke (ms-1) 5.4 5.7 8.8 8.3 Wind speed PM 850 mb at Nashville (ms-1) 7.5 5.0 5.7 6.1 Wind speed PM 850 mb at Roanoke (ms-1) 5.4 3.5 7.6 6.4 Wind direction yesterday 850 mb at Nashville (degrees) 217 27. 248 194 Wind direction yesterday 850 mb at Roanoke (degrees) 288 214 256 351 Wind direction AM 850 mb at Nashville (degrees) 247 297 270 239 Wind direction AM 850 mb at Roanoke (degrees) 281 315 270 329 Wind direction PM 850 mb at Nashville (degrees) 236 217 256 243 Wind direction PM 850 mb at Roanoke (degrees) 236 .270 236 301 Cloud average 1.9 1.8 2.1 2.0
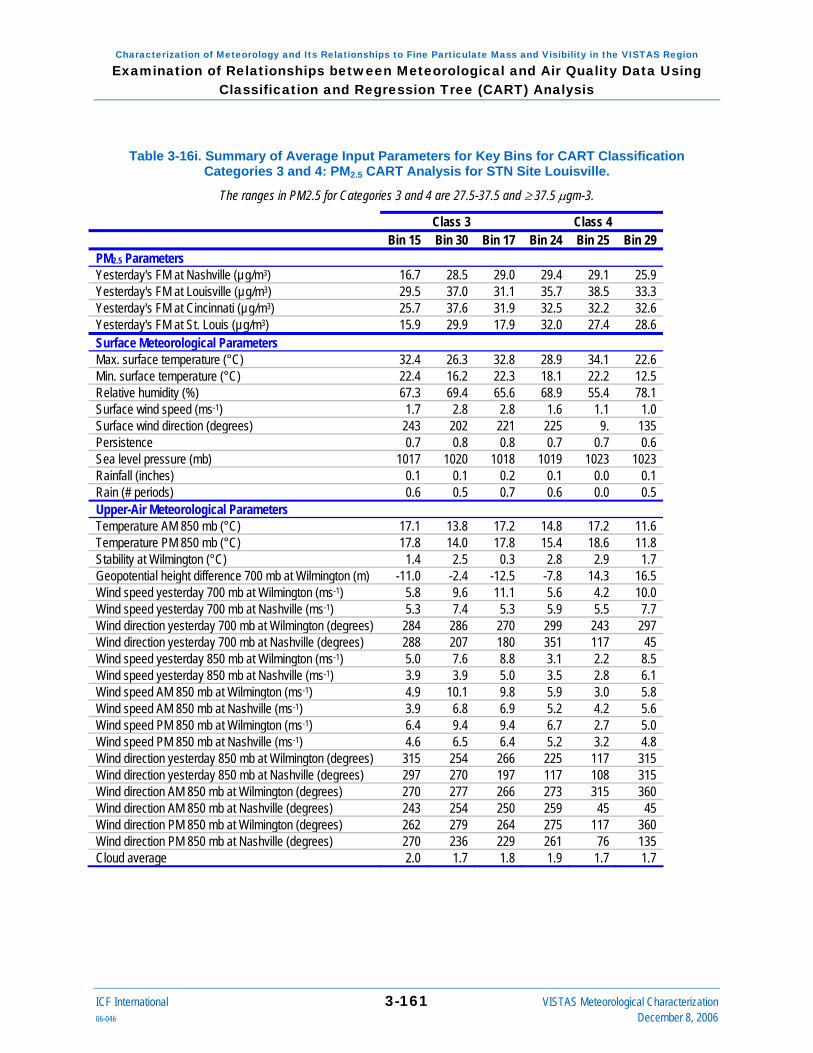
Characterization of Meteorology and Its Relationships to Fine Particulate Mass and Visibility in the VISTAS Region Examination of Relationships between Meteorological and Air Quality Data Using
Classification and Regression Tree (CART) Analysis
ICF International 3-161 VISTAS Meteorological Characterization 06-046 December 8, 2006
Table 3-16i. Summary of Average Input Parameters for Key Bins for CART Classification Categories 3 and 4: PM2.5 CART Analysis for STN Site Louisville.
The ranges in PM2.5 for Categories 3 and 4 are 27.5-37.5 and ≥ 37.5 μgm-3.
Class 3 Class 4 Bin 15 Bin 30 Bin 17 Bin 24 Bin 25 Bin 29 PM2.5 Parameters Yesterday's FM at Nashville (µg/m3) 16.7 28.5 29.0 29.4 29.1 25.9 Yesterday's FM at Louisville (µg/m3) 29.5 37.0 31.1 35.7 38.5 33.3 Yesterday's FM at Cincinnati (µg/m3) 25.7 37.6 31.9 32.5 32.2 32.6 Yesterday's FM at St. Louis (µg/m3) 15.9 29.9 17.9 32.0 27.4 28.6 Surface Meteorological Parameters Max. surface temperature (°C) 32.4 26.3 32.8 28.9 34.1 22.6 Min. surface temperature (°C) 22.4 16.2 22.3 18.1 22.2 12.5 Relative humidity (%) 67.3 69.4 65.6 68.9 55.4 78.1 Surface wind speed (ms-1) 1.7 2.8 2.8 1.6 1.1 1.0 Surface wind direction (degrees) 243 202 221 225 9. 135 Persistence 0.7 0.8 0.8 0.7 0.7 0.6 Sea level pressure (mb) 1017 1020 1018 1019 1023 1023 Rainfall (inches) 0.1 0.1 0.2 0.1 0.0 0.1 Rain (# periods) 0.6 0.5 0.7 0.6 0.0 0.5 Upper-Air Meteorological Parameters Temperature AM 850 mb (°C) 17.1 13.8 17.2 14.8 17.2 11.6 Temperature PM 850 mb (°C) 17.8 14.0 17.8 15.4 18.6 11.8 Stability at Wilmington (°C) 1.4 2.5 0.3 2.8 2.9 1.7 Geopotential height difference 700 mb at Wilmington (m) -11.0 -2.4 -12.5 -7.8 14.3 16.5 Wind speed yesterday 700 mb at Wilmington (ms-1) 5.8 9.6 11.1 5.6 4.2 10.0 Wind speed yesterday 700 mb at Nashville (ms-1) 5.3 7.4 5.3 5.9 5.5 7.7 Wind direction yesterday 700 mb at Wilmington (degrees) 284 286 270 299 243 297 Wind direction yesterday 700 mb at Nashville (degrees) 288 207 180 351 117 45 Wind speed yesterday 850 mb at Wilmington (ms-1) 5.0 7.6 8.8 3.1 2.2 8.5 Wind speed yesterday 850 mb at Nashville (ms-1) 3.9 3.9 5.0 3.5 2.8 6.1 Wind speed AM 850 mb at Wilmington (ms-1) 4.9 10.1 9.8 5.9 3.0 5.8 Wind speed AM 850 mb at Nashville (ms-1) 3.9 6.8 6.9 5.2 4.2 5.6 Wind speed PM 850 mb at Wilmington (ms-1) 6.4 9.4 9.4 6.7 2.7 5.0 Wind speed PM 850 mb at Nashville (ms-1) 4.6 6.5 6.4 5.2 3.2 4.8 Wind direction yesterday 850 mb at Wilmington (degrees) 315 254 266 225 117 315 Wind direction yesterday 850 mb at Nashville (degrees) 297 270 197 117 108 315 Wind direction AM 850 mb at Wilmington (degrees) 270 277 266 273 315 360 Wind direction AM 850 mb at Nashville (degrees) 243 254 250 259 45 45 Wind direction PM 850 mb at Wilmington (degrees) 262 279 264 275 117 360 Wind direction PM 850 mb at Nashville (degrees) 270 236 229 261 76 135 Cloud average 2.0 1.7 1.8 1.9 1.7 1.7

Characterization of Meteorology and Its Relationships to Fine Particulate Mass and Visibility in the VISTAS Region Examination of Relationships between Meteorological and Air Quality Data Using
Classification and Regression Tree (CART) Analysis
ICF International 3-162 VISTAS Meteorological Characterization 06-046 December 8, 2006
Table 3-16j. Summary of Average Input Parameters for Key Bins for CART Classification Categories 3 and 4: PM2.5 CART Analysis for STN Site Macon.
The ranges in PM2.5 for Categories 3 and 4 are 25-30 and ≥ 30 μgm-3.
Class 3 Class 4 Bin 19 Bin 14 PM2.5 Parameters Yesterday's FM at Atlanta (µg/m3) 30.0 31.1 Surface Meteorological Parameters Max. surface temperature (°C) 33.8 27.1 Min. surface temperature (°C) 20.9 10.4 Relative humidity (%) 68.2 67.2 Surface wind speed (ms-1) 0.6 0.7 Surface wind direction (degrees) 153 225 Persistence 0.4 0.7 Sea level pressure (mb) 1017 1021 Rainfall (inches) 0.0 0.0 Rain (# periods) 0.2 0.4 Upper-Air Meteorological Parameters Temperature AM 850 mb (°C) 17.7 12.1 Temperature PM 850 mb (°C) 18.0 12.9 Stability at Atlanta (°C) 3.2 7.4 Geopotential height difference 700 mb at Atlanta (m) 7.4 12.0 Wind speed yesterday 700 mb at Atlanta (ms-1) 0.6 0.7 Wind direction yesterday 700 mb at Atlanta (degrees) 27 326 Wind speed yesterday 850 mb at Atlanta (ms-1) 3.3 4.5 Wind speed AM 850 mb at Atlanta (ms-1) 2.8 5.7 Wind speed PM 850 mb at Atlanta (ms-1) 4.9 4.7 Wind direction yesterday 850 mb at Atlanta (degrees) 34 342 Wind direction AM 850 mb at Atlanta (degrees) 225 333 Wind direction PM 850 mb at Atlanta (degrees) 207 326 Recirculation at Atlanta 0.2 0.1 Cloud average 1.6 1.5

Characterization of Meteorology and Its Relationships to Fine Particulate Mass and Visibility in the VISTAS Region Examination of Relationships between Meteorological and Air Quality Data Using
Classification and Regression Tree (CART) Analysis
ICF International 3-163 VISTAS Meteorological Characterization 06-046 December 8, 2006
Table 3-16k. Summary of Average Input Parameters for Each Key Bins for CART Classification Categories 3 and 4: PM2.5 CART Analysis for STN Site Memphis.
The ranges in PM2.5 for Categories 3 and 4 are 22.5-30 and ≥ 30 μgm-3.
Class 4 Class 5 Bin 14 Bin 5 Bin 25 Bin 15 Bin 32 Bin 22 PM2.5 Parameters Yesterday's FM at Birmingham (µg/m3) 34.6 30.7 29.6 32.2 34.7 27.5 Yesterday's FM at Memphis (µg/m3) 21.8 15.3 21.4 23.0 35.0 23.1 Yesterday's FM at Nashville (µg/m3) 22.1 18.7 19.4 23.0 30.1 25.3 Yesterday's FM at St. Louis (µg/m3) 21.2 18.4 19.7 19.0 31.5 24.7 Yesterday's FM at Little Rock (µg/m3) 21.9 16.6 19.0 26.5 29.0 19.5 Surface Meteorological Parameters Max. surface temperature (°C) 31.0 28.3 23.4 33.4 28.8 24.5 Min. surface temperature (°C) 20.2 17.4 11.2 23.8 18.8 16.6 Relative humidity (%) 59.4 57.4 62.1 63.9 64/3 68.8 Surface wind speed (ms-1) 2.4 2.3 2.8 2.0 2.0 2.0 Surface wind direction (degrees) 157 117 180 180 174 360 Persistence 0.8 0.9 0.9 0.8 0.8 0.8 Sea level pressure (mb) 1020 1021 1022 1019 1019 1019 Rainfall (inches) 0.0 0.0 0.1 0.0 0.0 0.0 Rain (# periods) 0.2 0.4 0.4 0.7 0.2 0.3 Upper-Air Meteorological Parameters Temperature AM 850 mb (°C) 15.4 12.5 11.2 17.9 14.8 13.1 Temperature PM 850 mb (°C) 16.2 13.7 11.8 18.7 15.4 13.7 Stability at Nashville (°C) 2.3 1.5 5.6 -0.3 1.9 0.3 Geopotential height difference 700 mb at Nashville (m) 5.0 8.0 -3.9 -78.3 -5.9 2.9 Wind speed yesterday 700 mb at Nashville (ms-1) 4.2 4.9 6.8 11.0 7.4 6.5 Wind speed yesterday 700 mb at Little Rock (ms-1) 5.7 5.1 6.1 5.8 7.6 7.0 Wind direction yesterday 700 mb at Nashville (degrees) 319 90 326 326 24 63 Wind direction yesterday 700 mb at Little Rock (degrees) 135 90 270 315 90 360 Wind speed yesterday 850 mb at Nashville (ms-1) 3.8 5.3 3.1 3.9 4.6 5.1 Wind speed yesterday 850 mb at Little Rock (ms-1) 4.6 5.4 4.7 2.9 5.3 4.4 Wind speed AM 850 mb at Nashville (ms-1) 4.8 3.7 8.0 4.9 4.6 4.8 Wind speed AM 850 mb at Little Rock (ms-1) 5.8 3.8 7.4 3.9 5.7 4.2 Wind speed PM 850 mb at Nashville (ms-1) 4.3 3.7 12.7 4.5 5.1 5.2 Wind speed PM 850 mb at Little Rock (ms-1) 5.2 4.2 7.7 2.2 6.1 5.2 Wind direction yesterday 850 mb at Nashville (degrees) 221 162 360 360 330 27 Wind direction yesterday 850 mb at Little Rock (degrees) 170 108 221 207 135 360 Wind direction AM 850 mb at Nashville (degrees) 262 270 243 292 292 117 Wind direction AM 850 mb at Little Rock (degrees) 196 153 233 270 204 326 Wind direction PM 850 mb at Nashville (degrees) 193 135 236 284 304 360 Wind direction PM 850 mb at Little Rock (degrees) 187 135 225 270 173 90 Cloud average 1.8 1.9 1.5 1.9 1.9 2.3
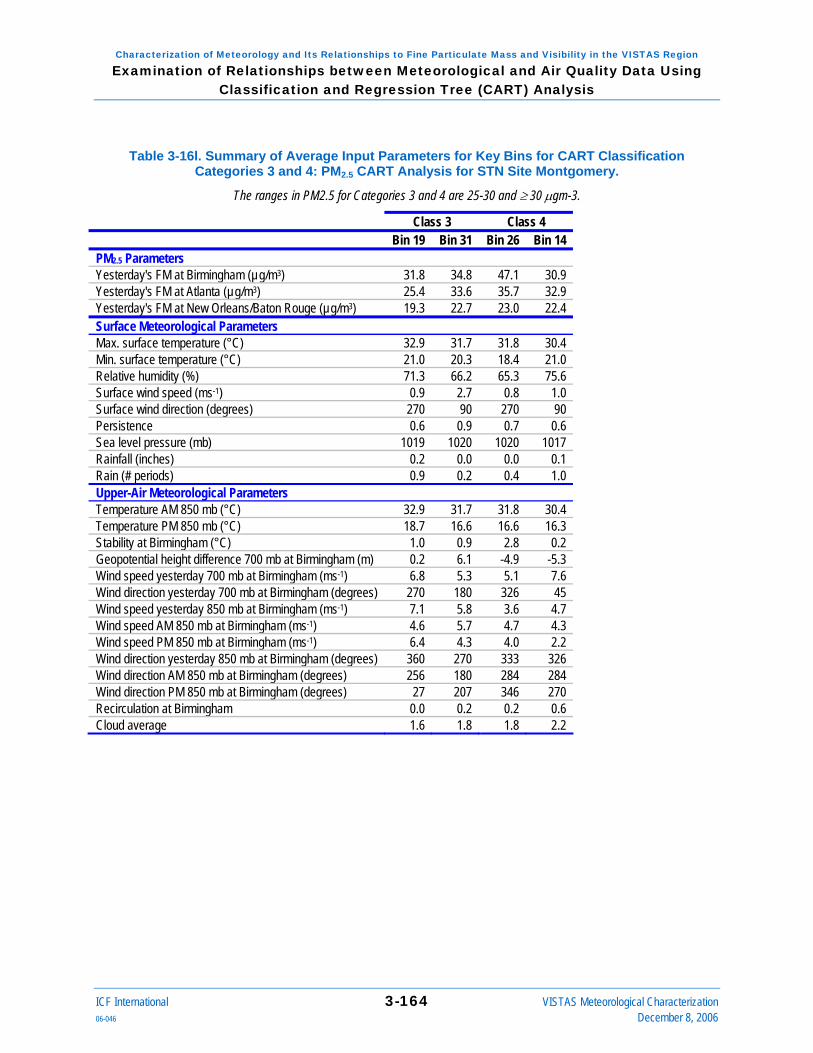
Characterization of Meteorology and Its Relationships to Fine Particulate Mass and Visibility in the VISTAS Region Examination of Relationships between Meteorological and Air Quality Data Using
Classification and Regression Tree (CART) Analysis
ICF International 3-164 VISTAS Meteorological Characterization 06-046 December 8, 2006
Table 3-16l. Summary of Average Input Parameters for Key Bins for CART Classification Categories 3 and 4: PM2.5 CART Analysis for STN Site Montgomery.
The ranges in PM2.5 for Categories 3 and 4 are 25-30 and ≥ 30 μgm-3.
Class 3 Class 4 Bin 19 Bin 31 Bin 26 Bin 14 PM2.5 Parameters Yesterday's FM at Birmingham (µg/m3) 31.8 34.8 47.1 30.9 Yesterday's FM at Atlanta (µg/m3) 25.4 33.6 35.7 32.9 Yesterday's FM at New Orleans/Baton Rouge (µg/m3) 19.3 22.7 23.0 22.4 Surface Meteorological Parameters Max. surface temperature (°C) 32.9 31.7 31.8 30.4 Min. surface temperature (°C) 21.0 20.3 18.4 21.0 Relative humidity (%) 71.3 66.2 65.3 75.6 Surface wind speed (ms-1) 0.9 2.7 0.8 1.0 Surface wind direction (degrees) 270 90 270 90 Persistence 0.6 0.9 0.7 0.6 Sea level pressure (mb) 1019 1020 1020 1017 Rainfall (inches) 0.2 0.0 0.0 0.1 Rain (# periods) 0.9 0.2 0.4 1.0 Upper-Air Meteorological Parameters Temperature AM 850 mb (°C) 32.9 31.7 31.8 30.4 Temperature PM 850 mb (°C) 18.7 16.6 16.6 16.3 Stability at Birmingham (°C) 1.0 0.9 2.8 0.2 Geopotential height difference 700 mb at Birmingham (m) 0.2 6.1 -4.9 -5.3 Wind speed yesterday 700 mb at Birmingham (ms-1) 6.8 5.3 5.1 7.6 Wind direction yesterday 700 mb at Birmingham (degrees) 270 180 326 45 Wind speed yesterday 850 mb at Birmingham (ms-1) 7.1 5.8 3.6 4.7 Wind speed AM 850 mb at Birmingham (ms-1) 4.6 5.7 4.7 4.3 Wind speed PM 850 mb at Birmingham (ms-1) 6.4 4.3 4.0 2.2 Wind direction yesterday 850 mb at Birmingham (degrees) 360 270 333 326 Wind direction AM 850 mb at Birmingham (degrees) 256 180 284 284 Wind direction PM 850 mb at Birmingham (degrees) 27 207 346 270 Recirculation at Birmingham 0.0 0.2 0.2 0.6 Cloud average 1.6 1.8 1.8 2.2

Characterization of Meteorology and Its Relationships to Fine Particulate Mass and Visibility in the VISTAS Region Examination of Relationships between Meteorological and Air Quality Data Using
Classification and Regression Tree (CART) Analysis
ICF International 3-165 VISTAS Meteorological Characterization 06-046 December 8, 2006
Table 3-16m. Summary of Average Input Parameters for Key Bins for CART Classification Categories 3 and 4: PM2.5 CART Analysis for STN Site Nashville.
The ranges in PM2.5 for Categories 3 and 4 are 25-32.5 and ≥ 32.5 μgm-3.
Class 3 Class 4 Bin 19 Bin 16 Bin 27 Bin 25 Bin 20 PM2.5 Parameters Yesterday's FM at Birmingham (µg/m3) 29.4 30.8 28.6 40.1 24.2 Yesterday's FM at Memphis (µg/m3) 24.5 20.3 28.1 29.5 24.4 Yesterday's FM at Nashville (µg/m3) 27.9 21.0 30.1 32.0 29.0 Yesterday's FM at Louisville (µg/m3) 26.4 23.5 32.2 31.5 42.1 Yesterday's FM at Cincinnati (µg/m3) 24.3 23.3 31.6 33.5 29.1 Yesterday's FM at Knoxville (µg/m3) 21.5 23.3 24.5 36.3 20.6 Surface Meteorological Parameters Max. surface temperature (°C) 23.2 32.2 31.2 30.3 33.2 Min. surface temperature (°C) 12.2 20.4 20.8 18.1 21.4 Relative humidity (%) 69.5 66.1 61.6 64.8 67.0 Surface wind speed (ms-1) 1.5 1.7 2.8 1.3 1.4 Surface wind direction (degrees) 194 180 315 180 360 Persistence 0.7 0.7 0.9 0.7 0.7 Sea level pressure (mb) 1021 1020 1018 1022 1017 Rainfall (inches) 0.0 0.0 0.0 0.0 0.0 Rain (# periods) 0.3 0.4 0.1 0.2 0.2 Upper-Air Meteorological Parameters Temperature AM 850 mb (°C) 10.5 16.7 16.8 15.8 19.8 Temperature PM 850 mb (°C) 11.8 17.9 16.8 16.4 20.8 Stability at Nashville (°C) 1.4 1.0 0.5 1.6 0.2 Geopotential height difference 700 mb at Nashville (m) 9.9 15.3 -9.8 -0.6 10.2 Wind speed yesterday 700 mb at Nashville (ms-1) 7.9 4.4 6.6 5.2 7.4 Wind direction yesterday 700 mb at Nashville (degrees) 328 315 333 90 27 Wind speed yesterday 850 mb at Nashville (ms-1) 4.9 3.9 4.8 4.3 4.6 Wind speed AM 850 mb at Nashville (ms-1) 5.4 6.1 6.6 5.6 6.0 Wind speed PM 850 mb at Nashville (ms-1) 5.1 5.3 5.9 5.0 4.5 Wind direction yesterday 850 mb at Nashville (degrees) 281 214 315 225 27 Wind direction AM 850 mb at Nashville (degrees) 301 261 329 243 360 Wind direction PM 850 mb at Nashville (degrees) 236 211 315 180 360 Recirculation at Nashville 0.1 0.1 0.1 0.2 0.2 Cloud average 1.6 1.8 1.5 1.9 1.6

Characterization of Meteorology and Its Relationships to Fine Particulate Mass and Visibility in the VISTAS Region Examination of Relationships between Meteorological and Air Quality Data Using
Classification and Regression Tree (CART) Analysis
ICF International 3-166 VISTAS Meteorological Characterization 06-046 December 8, 2006
Table 3-16n. Summary of Average Input Parameters for Key Bins for CART Classification Categories 3 and 4: PM2.5 CART Analysis for STN Site Raleigh.
The ranges in PM2.5 for Categories 3 and 4 are 22.5-30 and ≥ 30 μgm-3.
Class 3 Class 4 Bin 22 Bin 23 Bin 9 Bin 28 Bin 30 Bin 26 PM2.5 Parameters Yesterday's FM at Charlotte (µg/m3) 19.7 23.6 20.3 31.0 29.3 32.4 Yesterday's FM at Richmond (µg/m3) 18.7 16.7 19.0 31.0 27.0 26.6 Yesterday's FM at Raleigh (µg/m3) 18.9 26.3 18.6 31.8 31.4 30.7 Yesterday's FM at Winston-Salem (µg/m3) 20.7 25.4 22.4 31.2 30.6 27.2 Surface Meteorological Parameters Max. surface temperature (°C) 32.4 23.1 24.8 33.0 34.2 25.1 Min. surface temperature (°C) 18.9 11.8 13.9 20.5 21.6 12.0 Relative humidity (%) 67.8 76.1 73.7 69.9 71.6 71.4 Surface wind speed (ms-1) 1.3 1.9 1.3 1.7 2.2 2.0 Surface wind direction (degrees) 211 243 124 239 211 27 Persistence 0.7 0.8 0.8 0.8 0.7 0.8 Sea level pressure (mb) 1019 1020 1022 1018 1017 1022 Rainfall (inches) 0.2 0.1 0.1 0.0 0.0 0.0 Rain (# periods) 0.4 0.7 0.5 0.2 0.7 0.2 Upper-Air Meteorological Parameters Temperature AM 850 mb (°C) 16.5 11.7 11.8 17.1 18.6 12.3 Temperature PM 850 mb (°C) 18.1 10.9 13.3 18.0 19.0 12.4 Stability at Greensboro (°C) 1.0 1.3 -0.3 0.4 0.9 2.1 Geopotential height difference 700 mb at Greensboro (m) 2.1 -23.6 28.4 -1.6 -8.1 6.0 Wind speed yesterday 700 mb at Greensboro (ms-1) 7.9 11.1 10.4 6.4 8.7 9.4 Wind direction yesterday 700 mb at Greensboro (degrees) 7 276 309 306 270 346 Wind speed yesterday 850 mb at Greensboro (ms-1) 4.3 6.9 6.3 5.0 5.0 5.5 Wind speed AM 850 mb at Greensboro (ms-1) 3.8 9.9 6.1 3.9 9.8 6.7 Wind speed PM 850 mb at Greensboro (ms-1) 3.6 7.3 5.6 4.3 9.1 6.0 Wind direction yesterday 850 mb at Greensboro (degrees) 339 236 297 294 261 360 Wind direction AM 850 mb at Greensboro (degrees) 342 256 270 302 286 14 Wind direction PM 850 mb at Greensboro (degrees) 270 259 270 277 262 326 Recirculation at Greensboro 0.2 0.1 0.2 0.1 0.0 0.2 Cloud average 1.7 1.8 1.8 1.5 1.7 1.4

Characterization of Meteorology and Its Relationships to Fine Particulate Mass and Visibility in the VISTAS Region Examination of Relationships between Meteorological and Air Quality Data Using
Classification and Regression Tree (CART) Analysis
ICF International 3-167 VISTAS Meteorological Characterization 06-046 December 8, 2006
Table 3-16o. Summary of Average Input Parameters for Key Bins for CART Classification Categories 3 and 4: PM2.5 CART Analysis for STN Site Richmond.
The ranges in PM2.5 for Categories 3 and 4 are 25-30 and ≥ 30 μgm-3. Class 3 Class 4 Bin 8 Bin 12 Bin 16 Bin 24 Bin 33 Bin 32 PM2.5 Parameters Yesterday's FM at Richmond (µg/m3) 13.1 21.7 21.9 26.6 37.2 22.7 Yesterday's FM at Winston-Salem (µg/m3) 16.0 21.9 22.6 16.3 33.5 25.7 Yesterday's FM at Washington, D.C. (µg/m3) 15.5 20.8 21.7 37.9 42.2 28.0 Surface Meteorological Parameters Max. surface temperature (°C) 30.3 26.3 22.3 25.3 34.8 33.6 Min. surface temperature (°C) 19.0 16.7 10.9 14.5 22.6 20.6 Relative humidity (%) 70.4 80.2 72.3 78.6 68.8 68.1 Surface wind speed (ms-1) 1.6 2.2 1.2 1.9 2.3 1.9 Surface wind direction (degrees) 326 146 104 144 216 198 Persistence 0.7 0.8 0.6 0.8 0.7 0.8 Sea level pressure (mb) 1018 1020 1020 1020 1018 1020 Rainfall (inches) 0.2 0.0 0.1 0.0 0.1 0.0 Rain (# periods) 0.9 0.5 0.9 0.7 0.7 0.2 Upper-Air Meteorological Parameters Temperature AM 850 mb (°C) 14.9 12.5 9.1 12.5 18.3 18.1 Temperature PM 850 mb (°C) 16.4 13.8 10.4 13.6 19.3 18.1 Stability at Dulles (°C) 1.4 0.8 1.6 2.3 1.1 3.9 Geopotential height difference 700 mb at Dulles (m) 13.3 3.1 13.8 -4.8 12.0 5.6 Wind speed yesterday 700 mb at Roanoke (ms-1) 10.2 8.0 11.5 7.4 6.0 6.3 Wind speed yesterday 700 mb at Dulles (ms-1) 9.7 8.1 13.7 9.9 8.2 8.0 Wind direction yesterday 700 mb at Roanoke (degrees) 307 270 270 288 315 360 Wind direction yesterday 700 mb at Dulles (degrees) 292 309 270 275 300 6 Wind speed yesterday 850 mb at Roanoke (ms-1) 5.0 4.6 6.7 5.0 4.9 3.7 Wind speed yesterday 850 mb at Dulles (ms-1) 7.5 3.9 10.2 6.2 6.7 6.1 Wind speed AM 850 mb at Roanoke (ms-1) 6.0 6.8 7.3 6.9 8.2 7.7 Wind speed AM 850 mb at Dulles (ms-1) 8.9 5.5 8.6 7.4 7.0 6.4 Wind speed PM 850 mb at Roanoke (ms-1) 5.3 4.9 7.5 7.4 5.9 6.5 Wind speed PM 850 mb at Dulles (ms-1) 7.7 7.0 8.0 8.2 7.7 8.2 Wind direction yesterday 850 mb at Roanoke (degrees) 323 270 270 262 276 301 Wind direction yesterday 850 mb at Dulles (degrees) 323 270 270 275 291 326 Wind direction AM 850 mb at Roanoke (degrees) 360 259 270 270 275 225 Wind direction AM 850 mb at Dulles (degrees) 351 309 278 270 290 278 Wind direction PM 850 mb at Roanoke (degrees) 346 198 214 254 270 252 Wind direction PM 850 mb at Dulles (degrees) 338 217 270 259 270 270 Cloud average 1.9 1.9 2.0 1.9 1.8 1.7

Characterization of Meteorology and Its Relationships to Fine Particulate Mass and Visibility in the VISTAS Region Examination of Relationships between Meteorological and Air Quality Data Using
Classification and Regression Tree (CART) Analysis
ICF International 3-168 VISTAS Meteorological Characterization 06-046 December 8, 2006
Table 3-16p. Summary of Average Input Parameters for Key Bins for CART Classification Categories 3 and 4: PM2.5 CART Analysis for STN Site Savannah.
The ranges in PM2.5 for Categories 3 and 4 are 22.5-27.5 and ≥ 27.5 μgm-3.
Class 3 Class 4 Bin 17 Bin 5 Bin 25 PM2.5 Parameters Yesterday's FM at Atlanta (µg/m3) 23.8 30.4 31.5 Yesterday's FM at Charleston (µg/m3) 18.4 11.2 26.1 Surface Meteorological Parameters Max. surface temperature (°C) 25.9 29.6 30.9 Min. surface temperature (°C) 12.7 6.0 19.3 Relative humidity (%) 71.7 67.2 71.3 Surface wind speed (ms-1) 0.9 0.8 1.3 Surface wind direction (degrees) 45 236 207 Persistence 0.7 0.4 0.7 Sea level pressure (mb) 1022 1017 1019 Rainfall (inches) 0.0 0.0 0.0 Rain (# periods) 0.1 0.4 0.0 Upper-Air Meteorological Parameters Temperature AM 850 mb (°C) 11.0 12.9 15.8 Temperature PM 850 mb (°C) 12.0 14.4 16.4 Stability at Charleston (°C) 1.8 1.1 -1.4 Geopotential height difference 700 mb at Charleston (m) 5.8 17.1 -0.9 Wind speed yesterday 700 mb at Atlanta (ms-1) 8.6 9.1 8.6 Wind speed yesterday 700 mb at Charleston (ms-1) 7.3 13.3 7.6 Wind direction yesterday 700 mb at Atlanta (degrees) 315 360 338 Wind direction yesterday 700 mb at Charleston (degrees) 315 315 342 Wind speed yesterday 850 mb at Atlanta (ms-1) 5.1 7.4 3.8 Wind speed yesterday 850 mb at Charleston (ms-1) 5.8 8.6 5.8 Wind speed AM 850 mb at Atlanta (ms-1) 4.8 6.7 7.1 Wind speed AM 850 mb at Charleston (ms-1) 4.7 8.0 6.9 Wind speed PM 850 mb at Atlanta (ms-1) 5.6 5.8 5.3 Wind speed PM 850 mb at Charleston (ms-1) 6.2 6.1 6.0 Wind direction yesterday 850 mb at Atlanta (degrees) 288 333 304 Wind direction yesterday 850 mb at Charleston (degrees) 346 288 321 Wind direction AM 850 mb at Atlanta (degrees) 288 304 18 Wind direction AM 850 mb at Charleston (degrees) 342 284 326 Wind direction PM 850 mb at Atlanta (degrees) 284 326 304 Wind direction PM 850 mb at Charleston (degrees) 333 304 349 Cloud 1.9 2.0 1.8
For Charlotte, the PM2.5 concentration ranges for Categories 3 and 4 are 22.5 to 30 and greater than or equal to 30 μgm-3, respectively. There are four Category 3 and one Category 4 key bins. All of the key high PM2.5 bins are characterized by low surface wind speeds, and moderate relative humidity. Average temperatures and, to some extent, humidity vary relative among the bins. Bins 15 and 12 (two of the Category 3 bins) have lower temperatures, typical of spring or

Characterization of Meteorology and Its Relationships to Fine Particulate Mass and Visibility in the VISTAS Region Examination of Relationships between Meteorological and Air Quality Data Using
Classification and Regression Tree (CART) Analysis
ICF International 3-169 VISTAS Meteorological Characterization 06-046 December 8, 2006
fall. Prior day PM2.5 values at the potential upwind sites are consistently highest for Bin 26, the Category 4 bin. With the exception of Atlanta, the regional concentrations vary consistently among the bins. Average surface wind direction is southwesterly for four of the five key bins, and southeasterly for the remaining key bin (Bin 12). Stability is greatest, on average, for the cooler days in Bin 15. Upper-air wind speeds and directions vary only slightly among the bins. Morning and evening 850 mb wind directions are northwesterly for all bins. The higher regional concentrations are the most distinguishing feature of the Category 4 bin. Thus, regional build-up/transport appears to drive high PM2.5 in Charlotte.
For Chattanooga, the PM2.5 concentration ranges for Categories 3 and 4 are 25 to 32.5 and greater than or equal to 32.5 μgm-3, respectively. There are three Category 3 and one Category 4 bins that meet the criteria for key bins. All of the key high PM2.5 bins are characterized by very low surface wind speeds and moderate relative humidity. Average temperature ranges from moderate to high and varies among the bins. Bins 28 (the Category 4 bin) has the lowest temperatures, both near the surface and aloft. Prior day PM2.5 values for at the potential upwind sites are consistently highest for Bin 28, the Category 4 bin. Average surface wind direction is southwesterly for the three key Category 3 bins, and southerly for the Category 4 bin. Upper-air wind directions vary considerably among the bins. Southwesterly winds over Nashville and easterly followed by southwesterly winds aloft over Atlanta characterize the Bin 28 (Category 4). Average conditions for days within Bin 28 are similar in many respects to those for Bin 19, cooler temperatures and much higher regional concentrations appear to influence the higher PM2.5 concentrations for Bin 28.
For Louisville, the PM2.5 concentration ranges for Categories 3 and 4 are 27.5 to 37.5 and greater than or equal to 37.5 μgm-3, respectively. There are three Category 3 and three Category 4 bins that meet the criteria for key bins. The Category 4 bins have lower average wind speeds and a greater tendency for easterly wind components. The Category 4 bins are characterized by a range of temperature, humidity, and wind direction. All are associated with low wind speeds and high prior-day PM2.5 concentrations at potential upwind sites. Bin 29 has the lowest average temperature and the highest average relative humidity value. This bin is also characterized by southeasterly surface winds and northerly to easterly winds aloft. Bin 24 is distinguished by southwesterly to westerly winds both near the surface and aloft. Bin 25 is characterized by very high average temperatures and low relative humidity. Winds are from the northeast near the surface and from the northwest to the southeast aloft. Winds speeds aloft are low, compared to other bins. For Louisville, CART appears to have identified three distinct high PM2.5 concentration regimes.
For Macon, the PM2.5 concentration ranges for Categories 3 and 4 are 25 to 30 and greater than or equal to 30 μgm-3, respectively. There is one key bin for each category. Both are characterized, on average, by very low surface wind speeds, moderate relative humidity, and prior-day PM2.5 concentrations of about 30 μgm-3 in the Atlanta area. Bin 19 (Category 3) has higher temperatures and lower wind speeds aloft. Surface wind directions are from the southeast, and upper air wind directions are from the southwest. Bin 14 (Category 4) has cooler temperatures and greater stability. Surface wind directions are from the southwest, and upper air wind directions are from the northwest. Local conditions combined with a greater potential for pollutant transport from Atlanta appear to drive the higher PM2.5 concentrations for Bin 14.

Characterization of Meteorology and Its Relationships to Fine Particulate Mass and Visibility in the VISTAS Region Examination of Relationships between Meteorological and Air Quality Data Using
Classification and Regression Tree (CART) Analysis
Figure 3-8 shows the average composition for all key PM2.5 bins for each of the STN sites. Note that for some sites and bins, there were insufficient speciated data to compute the bin averages. These are marked with an asterisk.
Figure 3-8a. Average Elemental Carbon (EC), Nitrate (NO3), Organic Matter (OM), and Sulfate (SO4) Concentrations (μgm-3) for Key PM2.5 Bins for All CART Classification Categories: STN Site
Birmingham.
Birmingham Key PM Bins: Component Averages
0.00
4.00
8.00
12.00
16.00
20.00
24.00
4 (417) 8 (193) 24 (97) 2 (38) 25 (27) 6 (24) 11 (45) 26 (7) 19 (23) 10 (11)
Class 1 Class 2 Class 3 Class 4
Bin No. (No. of Correctly Classified Days)
Avg.
Con
c. (µ
g/m
3)
ECNO3OMSO4
Figure 3-8b. Average Elemental Carbon (EC), Nitrate (NO3), Organic Matter (OM), and Sulfate (SO4) Concentrations (μgm-3) for Key PM2.5 Bins for All CART Classification Categories: STN Site
Charlotte.
Charlotte Key PM Bins: Component Averages
0.00
2.00
4.00
6.00
8.00
10.00
12.00
14.00
1 (739) 21 (121) 20 (73) 6 (83) 8 (15) 31 (27) 15 (18) 12 (14) 18 (14) 26 (31)
Class 1 Class 2 Class 3 Class 4
Bin No. (No. of Correctly Classified Days)
Avg
. Con
c. (µ
g/m
3)
ECNO4OMSO4
ICF International 3-170 VISTAS Meteorological Characterization 06-046 December 8, 2006

Characterization of Meteorology and Its Relationships to Fine Particulate Mass and Visibility in the VISTAS Region Examination of Relationships between Meteorological and Air Quality Data Using
Classification and Regression Tree (CART) Analysis
Figure 3-8c. Average Elemental Carbon (EC), Nitrate (NO3), Organic Matter (OM), and Sulfate (SO4) Concentrations (μgm-3) for Key PM2.5 Bins for All CART Classification Categories: STN Site
Chattanooga.
Chattanooga Key PM Bins: Component Averages
0.002.004.006.008.00
10.0012.0014.0016.00
7 (193) 2 (69) 12 (48) 6 (24) 17 (21) 10 (15) 22 (11) 19 (7) 21 (7) 28 (10)
Class 1 Class 2 Class 3 Class 4
Bin No. (No. of Correctly Classified Days)
Avg
. Con
c. (µ
g/m
3)
ECNO3OMSO4
Figure 3-8d. Average Elemental Carbon (EC), Nitrate (NO3), Organic Matter (OM), and Sulfate (SO4) Concentrations (μgm-3) for Key PM2.5 Bins for All CART Classification Categories: STN Site
Greenville-Spartanburg.
Greenville-Spartanburg Key PM Bins: Component Averages
0.00
4.00
8.00
12.00
16.00
20.00
1 (711) 15(121)
2 (62) 8 (63) 6 (71) 3 (23) 11 (9) 20 (28) 25 (11) 22 (10) 32 (4) 21 (4) 30 (4)
Class 1 Class 2 Class 3 Class 4
Bin No. (No. of Correctly Classified Days)
Avg.
Con
c. (µ
g/m
3)
ECNO3OMSO4
* * *
Greenville-Spartanburg Key PM Bins: Component Averages
0.00
4.00
8.00
12.00
16.00
20.00
1 (711) 15(121)
2 (62) 8 (63) 6 (71) 3 (23) 11 (9) 20 (28) 25 (11) 22 (10) 32 (4) 21 (4) 30 (4)
Class 1 Class 2 Class 3 Class 4
Bin No. (No. of Correctly Classified Days)
Avg.
Con
c. (µ
g/m
3)
ECNO3OMSO4
* * *
* No speciated data for this bin
ICF International 3-171 VISTAS Meteorological Characterization 06-046 December 8, 2006

Characterization of Meteorology and Its Relationships to Fine Particulate Mass and Visibility in the VISTAS Region Examination of Relationships between Meteorological and Air Quality Data Using
Classification and Regression Tree (CART) Analysis
Figure 3-8e. Average Elemental Carbon (EC), Nitrate (NO3), Organic Matter (OM), and Sulfate (SO4) Concentrations (μgm-3) for Key PM2.5 Bins for All CART Classification Categories: STN Site
Hickory.
Hickory Key PM Bins: Component Averages
0.002.004.006.008.00
10.0012.0014.0016.00
2 (272) 8 (35) 13 (21) 12 (18) 6 (10) 18 (6) 29 (8) 27 (6) 22 (11) 17 (5)
Class 1 Class 2 Class 3 Class 4
Bin No. (No. of Correctly Classified Days)
Avg.
Con
c. (µ
g/m
3)
ECNO3OMSO4
* *
Hickory Key PM Bins: Component Averages
0.002.004.006.008.00
10.0012.0014.0016.00
2 (272) 8 (35) 13 (21) 12 (18) 6 (10) 18 (6) 29 (8) 27 (6) 22 (11) 17 (5)
Class 1 Class 2 Class 3 Class 4
Bin No. (No. of Correctly Classified Days)
Avg.
Con
c. (µ
g/m
3)
ECNO3OMSO4
* *
* No speciated data for this bin
Figure 3-8f. Average Elemental Carbon (EC), Nitrate (NO3), Organic Matter (OM), and Sulfate (SO4) Concentrations (μgm-3) for Key PM2.5 Bins for All CART Classification Categories: STN Site
Huntington-Ashland.
Huntington-Ashland Key PM Bins: Component Averages
0.00
4.00
8.00
12.00
16.00
20.00
8 (243) 7 (40) 5 (22) 29 (20) 28 (20) 1 (14) 6 (11) 13 (10) 14 (10) 12 (8) 23 (9)
Class 1 Class 2 Class 3 Class 4
Bin No. (No. of Correctly Classified Days)
Avg.
Con
c. (µ
g/m
3)
ECNO3OMSO4
ICF International 3-172 VISTAS Meteorological Characterization 06-046 December 8, 2006
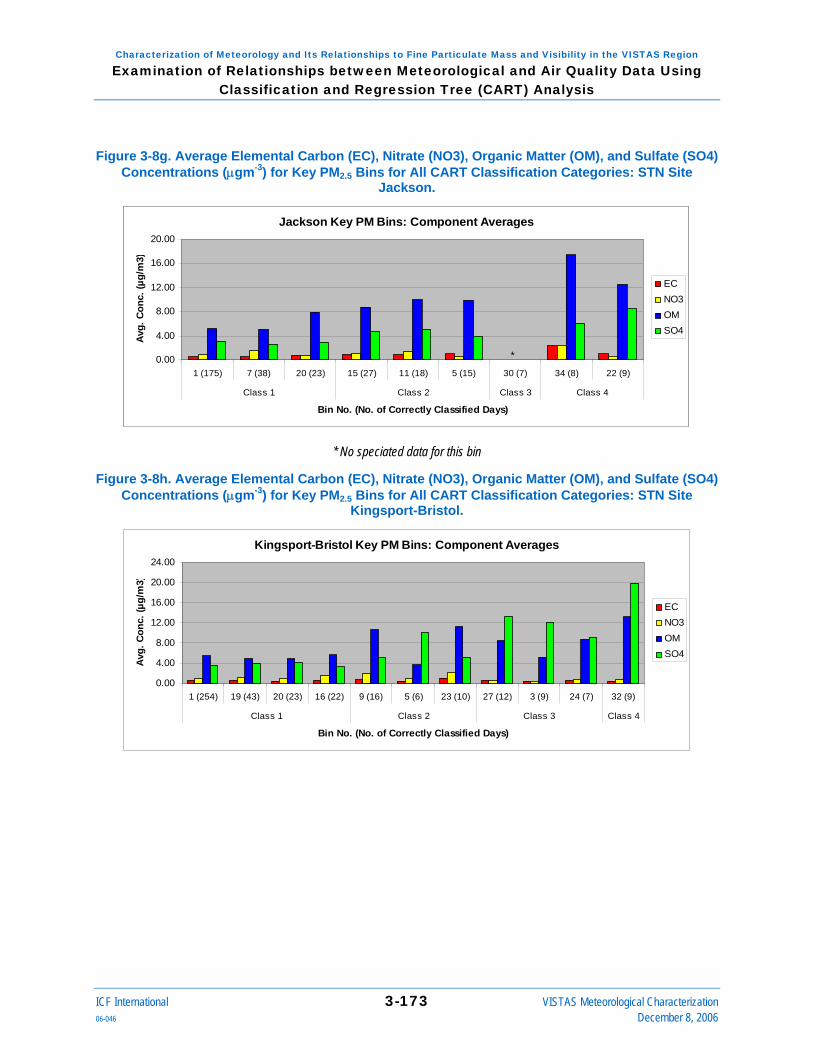
Characterization of Meteorology and Its Relationships to Fine Particulate Mass and Visibility in the VISTAS Region Examination of Relationships between Meteorological and Air Quality Data Using
Classification and Regression Tree (CART) Analysis
Figure 3-8g. Average Elemental Carbon (EC), Nitrate (NO3), Organic Matter (OM), and Sulfate (SO4) Concentrations (μgm-3) for Key PM2.5 Bins for All CART Classification Categories: STN Site
Jackson.
Jackson Key PM Bins: Component Averages
0.00
4.00
8.00
12.00
16.00
20.00
1 (175) 7 (38) 20 (23) 15 (27) 11 (18) 5 (15) 30 (7) 34 (8) 22 (9)
Class 1 Class 2 Class 3 Class 4
Bin No. (No. of Correctly Classified Days)
Avg.
Con
c. (µ
g/m
3)
ECNO3OMSO4
*
Jackson Key PM Bins: Component Averages
0.00
4.00
8.00
12.00
16.00
20.00
1 (175) 7 (38) 20 (23) 15 (27) 11 (18) 5 (15) 30 (7) 34 (8) 22 (9)
Class 1 Class 2 Class 3 Class 4
Bin No. (No. of Correctly Classified Days)
Avg.
Con
c. (µ
g/m
3)
ECNO3OMSO4
*
* No speciated data for this bin
Figure 3-8h. Average Elemental Carbon (EC), Nitrate (NO3), Organic Matter (OM), and Sulfate (SO4) Concentrations (μgm-3) for Key PM2.5 Bins for All CART Classification Categories: STN Site
Kingsport-Bristol.
Kingsport-Bristol Key PM Bins: Component Averages
0.00
4.00
8.00
12.00
16.00
20.00
24.00
1 (254) 19 (43) 20 (23) 16 (22) 9 (16) 5 (6) 23 (10) 27 (12) 3 (9) 24 (7) 32 (9)
Class 1 Class 2 Class 3 Class 4
Bin No. (No. of Correctly Classified Days)
Avg.
Con
c. (µ
g/m
3)
ECNO3OMSO4
ICF International 3-173 VISTAS Meteorological Characterization 06-046 December 8, 2006

Characterization of Meteorology and Its Relationships to Fine Particulate Mass and Visibility in the VISTAS Region Examination of Relationships between Meteorological and Air Quality Data Using
Classification and Regression Tree (CART) Analysis
Figure 3-8i. Average Elemental Carbon (EC), Nitrate (NO3), Organic Matter (OM), and Sulfate (SO4) Concentrations (μgm-3) for Key PM2.5 Bins for All CART Classification Categories: STN Site
Louisville.
Louisville Key PM Bins: Component Averages
0.00
4.00
8.00
12.00
16.00
20.00
24.00
1 (724) 3 (153) 10 (104) 12 (79) 2 (31) 4 (28) 15 (12) 30 (13) 17 (15) 24 (26) 25 (7) 29 (6)
Class 1 Class 2 Class 3 Class 4
Bin No. (No. of Correctly Classified Days)
Avg.
Con
c. (µ
g/m
3)
ECNO3OMSO4
* *
Louisville Key PM Bins: Component Averages
0.00
4.00
8.00
12.00
16.00
20.00
24.00
1 (724) 3 (153) 10 (104) 12 (79) 2 (31) 4 (28) 15 (12) 30 (13) 17 (15) 24 (26) 25 (7) 29 (6)
Class 1 Class 2 Class 3 Class 4
Bin No. (No. of Correctly Classified Days)
Avg.
Con
c. (µ
g/m
3)
ECNO3OMSO4
* *
* No speciated data for this bin
Figure 3-8j. Average Elemental Carbon (EC), Nitrate (NO3), Organic Matter (OM), and Sulfate (SO4) Concentrations (μgm-3) for Key PM2.5 Bins for All CART Classification Categories: STN Site Macon.
Macon Key PM Bins: Component Averages
0.00
4.00
8.00
12.00
16.00
20.00
1 (158) 11 (49) 29 (28) 5 (29) 10 (27) 28 (14) 25 (12) 19 (5) 14 (14)
Class 1 Class 2 Class 3 Class 4
Bin No. (No. of Correctly Classified Days)
Avg.
Con
c. (µ
g/m
3)
ECNO3OMSO4
ICF International 3-174 VISTAS Meteorological Characterization 06-046 December 8, 2006

Characterization of Meteorology and Its Relationships to Fine Particulate Mass and Visibility in the VISTAS Region Examination of Relationships between Meteorological and Air Quality Data Using
Classification and Regression Tree (CART) Analysis
Figure 3-8k. Average Elemental Carbon (EC), Nitrate (NO3), Organic Matter (OM), and Sulfate (SO4) Concentrations (μgm-3) for Key PM2.5 Bins for All CART Classification Categories: STN Site
Memphis.
Memphis Key PM Bins: Component Averages
0.00
4.00
8.00
12.00
16.00
20.00
1 (645) 6 (125) 10 (111) 12 (35) 9 (26) 27 (23) 14 (37) 5 (8) 25 (8) 15 (9) 32 (34) 22 (7)
Class 1 Class 2 Class 3 Class 4
Bin No. (No. of Correctly Classified Days)
Avg.
Con
c. (µ
g/m
3)
ECNO3OMSO4
*
Memphis Key PM Bins: Component Averages
0.00
4.00
8.00
12.00
16.00
20.00
1 (645) 6 (125) 10 (111) 12 (35) 9 (26) 27 (23) 14 (37) 5 (8) 25 (8) 15 (9) 32 (34) 22 (7)
Class 1 Class 2 Class 3 Class 4
Bin No. (No. of Correctly Classified Days)
Avg.
Con
c. (µ
g/m
3)
ECNO3OMSO4
*
* No speciated data for this bin
Figure 3-8l. Average Elemental Carbon (EC), Nitrate (NO3), Organic Matter (OM), and Sulfate (SO4) Concentrations (μgm-3) for Key PM2.5 Bins for All CART Classification Categories: STN Site
Montgomery.
Montgomery Key PM Bins: Component Averages
0.002.004.006.008.00
10.0012.0014.0016.00
1 (242) 5 (69) 2 (19) 13 (18) 30 (11) 18 (13) 19 (7) 31 (5) 26 (11) 14 (5)
Class 1 Class 2 Class 3 Class 4
Bin No. (No. of Correctly Classified Days)
Avg.
Con
c. (µ
g/m
3)
ECNO3OMSO4
ICF International 3-175 VISTAS Meteorological Characterization 06-046 December 8, 2006

Characterization of Meteorology and Its Relationships to Fine Particulate Mass and Visibility in the VISTAS Region Examination of Relationships between Meteorological and Air Quality Data Using
Classification and Regression Tree (CART) Analysis
Figure 3-8m. Average Elemental Carbon (EC), Nitrate (NO3), Organic Matter (OM), and Sulfate (SO4) Concentrations (μgm-3) for Key PM2.5 Bins for All CART Classification Categories: STN Site
Nashville.
Nashville Key PM Bins: Component Averages
0.002.004.006.008.00
10.0012.0014.0016.00
3 (556) 7 (337) 12 (90) 11 (64) 5 (40) 15 (22) 19 (22) 16 (10) 27 (8) 25 (21) 20 (5)
Class 1 Class 2 Class 3 Class 4
Bin No. (No. of Correctly Classified Days)
Avg.
Con
c. (µ
g/m
3)
ECNO3OMSO4
*
Nashville Key PM Bins: Component Averages
0.002.004.006.008.00
10.0012.0014.0016.00
3 (556) 7 (337) 12 (90) 11 (64) 5 (40) 15 (22) 19 (22) 16 (10) 27 (8) 25 (21) 20 (5)
Class 1 Class 2 Class 3 Class 4
Bin No. (No. of Correctly Classified Days)
Avg.
Con
c. (µ
g/m
3)
ECNO3OMSO4
*
* No speciated data for this bin
Figure 3-8n. Average Elemental Carbon (EC), Nitrate (NO3), Organic Matter (OM), and Sulfate (SO4) Concentrations (μgm-3) for Key PM2.5 Bins for All CART Classification Categories: STN Site
Raleigh.
Raleigh Key PM Bins: Component Averages
0.00
4.00
8.00
12.00
16.00
20.00
24.00
1 (615) 4 (239) 2 (144) 13 (57) 24 (17) 16 (19) 22 (20) 23 (11) 9 (12) 28 (20) 30 (10) 26 (5)
Class 1 Class 2 Class 3 Class 4
Bin No. (No. of Correctly Classified Days)
Avg.
Con
c. (µ
g/m
3)
ECNO3OMSO4
* *
Raleigh Key PM Bins: Component Averages
0.00
4.00
8.00
12.00
16.00
20.00
24.00
1 (615) 4 (239) 2 (144) 13 (57) 24 (17) 16 (19) 22 (20) 23 (11) 9 (12) 28 (20) 30 (10) 26 (5)
Class 1 Class 2 Class 3 Class 4
Bin No. (No. of Correctly Classified Days)
Avg.
Con
c. (µ
g/m
3)
ECNO3OMSO4
* *
* No speciated data for this bin
ICF International 3-176 VISTAS Meteorological Characterization 06-046 December 8, 2006

Characterization of Meteorology and Its Relationships to Fine Particulate Mass and Visibility in the VISTAS Region Examination of Relationships between Meteorological and Air Quality Data Using
Classification and Regression Tree (CART) Analysis
Figure 3-8o. Average Elemental Carbon (EC), Nitrate (NO3), Organic Matter (OM), and Sulfate (SO4) Concentrations (μgm-3) for Key PM2.5 Bins for All CART Classification Categories: STN Site
Richmond.
Richmond Key PM Bins: Component Averages
0.00
4.00
8.00
12.00
16.00
20.00
24.00
1 (640) 2 (133) 6 (66) 9 (69) 7 (46) 3 (17) 19 (21) 8 (7) 12 (12) 16 (9) 24 (16) 33 (18) 32 (10)
Class 1 Class 2 Class 3 Class 4
Bin No. (No. of Correctly Classified Days)
Avg.
Con
c. (µ
g/m
3)
ECNO3OMSO4
* No speciated data for this bin
Figure 3-8p. Average Elemental Carbon (EC), Nitrate (NO3), Organic Matter (OM), and Sulfate (SO4) Concentrations (μgm-3) for Key PM2.5 Bins for All CART Classification Categories: STN Site
Savannah.
Savannah Key PM Bins: Component Averages
0.002.004.006.008.00
10.0012.0014.0016.00
9 (217) 8 (61) 14 (55) 18 (8) 11 (6) 3 (6) 17 (8) 5 (5) 25 (9)
Class 1 Class 2 Class 3 Class 4
Bin No. (No. of Correctly Classified Days)
Avg.
Con
c. (µ
g/m
3)
ECNO3OMSO$
*
Savannah Key PM Bins: Component Averages
0.002.004.006.008.00
10.0012.0014.0016.00
9 (217) 8 (61) 14 (55) 18 (8) 11 (6) 3 (6) 17 (8) 5 (5) 25 (9)
Class 1 Class 2 Class 3 Class 4
Bin No. (No. of Correctly Classified Days)
Avg.
Con
c. (µ
g/m
3)
ECNO3OMSO$
*
* No speciated data for this bin
The STN compositional charts show a much larger proportional contribution from organic matter compared to those for the IMPROVE sites, especially for the higher PM2.5 bins. This is in part due to differences between the IMPROVE and STN measurement techniques for organic carbon. Studies (e.g., EPA, 2004) have estimated the STN measurements to be as much as 30 percent higher. Another reason for the higher organic contribution is that the STN sites are located in urban areas, which have higher organic carbon emissions.
The relative contributions of the PM2.5 components vary by bin for each of the sites. The high PM2.5 concentration bins are distinguished from the lower concentration bins by higher sulfate and organic matter concentrations. With the higher values for organics, the dominant species
ICF International 3-177 VISTAS Meteorological Characterization 06-046 December 8, 2006

Characterization of Meteorology and Its Relationships to Fine Particulate Mass and Visibility in the VISTAS Region Examination of Relationships between Meteorological and Air Quality Data Using
Classification and Regression Tree (CART) Analysis
ICF International 3-178 VISTAS Meteorological Characterization 06-046 December 8, 2006
varies by bin, much more so than for the IMPROVE sites. Again, these variations are attributable to differences in meteorology as well as regional pollutant transport.
Consider the two key high PM2.5 bins for Macon (Bins 19 and 14). We noted earlier, that more stable conditions and a greater potential for pollutant transport from Atlanta appear to drive the higher PM2.5 concentrations for Bin 14. This is manifested (Figure 3-8j) by higher average sulfate concentrations for this bin, compared to Bin 19. On average, Bin 19 is dominated by organic matter, while Bin 14 has a greater proportion of sulfate.
Table 3-17 summarizes the characteristics for key Category 3 and 4 bins for the SEARCH monitoring sites.
Table 3-17a. Summary of Average Input Parameters for Key Bins for CART Classification Categories 3 and 4: PM2.5 CART Analysis for SEARCH Site Atlanta (Jefferson St.).
The ranges in PM2.5 for Categories 3 and 4 are 27.5-35 and ≥ 35 μgm-3.
Class 3 Class 4 Bin 28 Bin 31 Bin 21 Bin 19 Bin 23 Bin 26 PM2.5 Parameters Yesterday's FM at Atlanta (µg/m3) 31.3 30.9 33.4 37.7 34.9 43.4 Yesterday's FM at Birmingham (µg/m3) 34.1 35.9 35.5 39.2 34.3 44.0 Surface Meteorological Parameters Max. surface temperature (°C) 31.7 26.2 27.9 29.8 27.23 28.5 Min. surface temperature (°C) 21.4 18.0 16.1 18.6 14.5 15.0 Relative humidity (%) 74.2 70.7 66.0 69.9 61.8 65.1 Surface wind speed (ms-1) 0.7 1.9 0.6 0.8 0.6 0.5 Surface wind direction (degrees) 248 117 207 254 304 63 Persistence 0.6 0.9 0.6 0.8 0.6 0.6 Station pressure (mb) 987 990 990 988 989 991 Rainfall (inches) 0.3 0.1 0 0.0 0.0 0 Rain (# periods) 1.7 0.7 0 0.1 0.1 0 Upper-Air Meteorological Parameters Temperature AM 850 mb (°C) 17.1 14.7 13.5 15.4 13.6 14.1 Temperature PM 850 mb (°C) 17.6 13.8 14.9 16.3 15.7 14.8 Stability at Atlanta (°C) 2.7 2.7 6.1 4.6 6.4 6.8 Geopotential height difference 700 mb at Atlanta (m) -4.6 27.5 -10.8 6.4 -3.3 37.3 Wind speed yesterday 700 mb at Atlanta (ms-1) 6.4 5.5 5.4 5.6 9.9 3.6 Wind direction yesterday 700 mb at Atlanta (degrees) 326 259 31 9 326 0 Wind speed yesterday 850 mb at Atlanta (ms-1) 3.6 5.2 5.2 2.4 6.8 4.9 Wind speed AM 850 mb at Atlanta (ms-1) 5.3 6.8 3.4 3.5 7.1 3.5 Wind speed PM 850 mb at Atlanta (ms-1) 4.7 6.6 3.4 6.7 4.8 3.7 Wind direction yesterday 850 mb at Atlanta (degrees) 281 180 n/a 307 326 315 Wind direction AM 850 mb at Atlanta (degrees) 306 166 90 288 315 45 Wind direction PM 850 mb at Atlanta (degrees) 225 146 135 225 307 76 Recirculation at Atlanta 0.1 0.1 0.2 0.4 0 0.2 Cloud average 2.1 2.1 1.5 1.6 1.6 1.2

Characterization of Meteorology and Its Relationships to Fine Particulate Mass and Visibility in the VISTAS Region Examination of Relationships between Meteorological and Air Quality Data Using
Classification and Regression Tree (CART) Analysis
ICF International 3-179 VISTAS Meteorological Characterization 06-046 December 8, 2006
Table 3-17b. Summary of Average Input Parameters for Key Bins for CART Classification Categories 3 and 4: PM2.5 CART Analysis for SEARCH Site Yorkville.
The ranges in PM2.5 for Categories 3 and 4 are 22.5-30 and ≥ 30 μgm-3.
Class 3 Class 4 Bin 18 Bin 28 Bin 16 Bin 22 Bin 29 Bin 15 PM2.5 Parameters Yesterday's FM at Atlanta (µg/m3) 25.5 35.5 26.3 38.0 39.9 27.1 Yesterday's FM at Birmingham (µg/m3) 28.3 38.3 29.9 43.9 35.3 30.7 Yesterday's FM at Yorkville (µg/m3) 22.2 28.7 22.7 35.4 31.8 21.5 Surface Meteorological Parameters Max. surface temperature (°C) 28.5 28.2 23.2 28.6 26.6 28.6 Min. surface temperature (°C) 18.1 17.6 18.1 18.4 17.2 18.6 Relative humidity (%) 71.7 66.7 92.6 72.8 75.0 71.3 Surface wind speed (ms-1) 2.0 2.7 1.7 1.2 2.6 1.8 Surface wind direction (degrees) 99 243 180 243 90 108 Persistence 0.8 0.9 0.6 0.7 1.0 0.7 Station pressure (mb) 975 972 972 974 978 974 Rainfall (inches) 0.1 0.1 0.1 0.0 0.1 0.1 Rain (# periods) 0.6 0.5 2.0 0.1 0.9 1.2 Upper-Air Meteorological Parameters Temperature AM 850 mb (°C) 15.0 15.2 13.9 15.3 13.4 15.3 Temperature PM 850 mb (°C) 14.3 16.4 15.3 16.5 13.0 16.6 Stability at Atlanta (°C) 2.5 6.6 -1.0 4.0 4.0 2.2 Geopotential height difference 700 mb at Atlanta (m) -6.9 -6 -0.9 4.8 5.4 -1.6 Wind speed yesterday 700 mb at Atlanta (ms-1) 5.1 4.9 7.4 5.7 4.5 6.0 Wind direction yesterday 700 mb at Atlanta (degrees) 48 292 360 23 333 27 Wind speed yesterday 850 mb at Atlanta (ms-1) 4.2 3.4 4.3 3.9 4.5 3.8 Wind speed AM 850 mb at Atlanta (ms-1) 6.1 5.9 5.3 4.0 5.9 4.2 Wind speed PM 850 mb at Atlanta (ms-1) 4.4 7.6 5.2 4.0 5.9 4.2 Wind direction yesterday 850 mb at Atlanta (degrees) 98 249 315 22 117 297 Wind direction AM 850 mb at Atlanta (degrees) 90 277 225 342 124 90 Wind direction PM 850 mb at Atlanta (degrees) 112 254 0 56 124 135 Recirculation at Atlanta 0.2 0.2 0.3 0.4 0 0.2 Cloud average 1.7 1.7 2.5 1.7 2.0 1.8

Characterization of Meteorology and Its Relationships to Fine Particulate Mass and Visibility in the VISTAS Region Examination of Relationships between Meteorological and Air Quality Data Using
Classification and Regression Tree (CART) Analysis
ICF International 3-180 VISTAS Meteorological Characterization 06-046 December 8, 2006
Table 3-17c. Summary of Average Input Parameters for Key Bins for CART Classification Categories 3 and 4: PM2.5 CART Analysis for SEARCH Site Birmingham.
The ranges in PM2.5 for Categories 3 and 4 are 30-37.5 and ≥ 37.5 μgm-3.
Class 3 Class 4 Bin 10 Bin 14 Bin 25 Bin 20 Bin 24 PM2.5 Parameters Yesterday's FM at Birmingham (µg/m3) 24.7 35.6 51.1 33.1 35.8 Yesterday's FM at Atlanta (µg/m3) 21.1 27.8 39.3 23.5 25.5 Yesterday's FM at Memphis (µg/m3) 18.8 21.9 27.8 18.2 20.8 Yesterday's FM at Nashville (µg/m3) 16.8 21.2 28.9 18.7 17.9 Surface Meteorological Parameters Max. surface temperature (°C) 28.6 28.5 28.7 23.7 30.4 Min. surface temperature (°C) 12.8 15.8 14.0 10.2 15.9 Relative humidity (%) 60.1 66.5 58.6 64.8 58.4 Surface wind speed (ms-1) 0.6 0.5 0.5 0.5 0.7 Surface wind direction (degrees) 360 342 344 27 180 Persistence 0.6 0.5 0.7 0.6 0.7 Station pressure (mb) 998 998 1000 1002 1000 Rainfall (inches) 0.0 0.1 0.0 0.0 0.0 Rain (# periods) 0.3 0.6 0.0 0.2 0.1 Upper-Air Meteorological Parameters Temperature AM 850 mb (°C) 12.9 13.1 13.5 11.3 15.0 Temperature PM 850 mb (°C) 13.7 14.5 14.1 12.3 15.9 Stability at Birmingham (°C) 4.0 3.1 4.6 2.9 4.3 Geopotential height difference 700 mb at Birmingham (m) 6.6 -2.9 0.8 -14.7 30.1 Wind speed yesterday 700 mb at Birmingham (ms-1) 6.5 5.2 4.7 9.0 6.8 Wind direction yesterday 700 mb at Birmingham (degrees) 310 292 354 63 338 Wind speed yesterday 850 mb at Birmingham (ms-1) 4.2 2.7 2.9 7.0 2.8 Wind speed AM 850 mb at Birmingham (ms-1) 5.1 4.9 3.7 6.1 4.2 Wind speed PM 850 mb at Birmingham (ms-1) 4.3 4.8 2.9 4.9 3.7 Wind direction yesterday 850 mb at Birmingham (degrees) 360 254 37 27 90 Wind direction AM 850 mb at Birmingham (degrees) 270 243 270 180 270 Wind direction PM 850 mb at Birmingham (degrees) 34 220 360 207 243 Recirculation at Birmingham 0.2 0.3 0.5 0.0 0.4 Cloud average 1.3 1.7 1.4 1.6 1.6

Characterization of Meteorology and Its Relationships to Fine Particulate Mass and Visibility in the VISTAS Region Examination of Relationships between Meteorological and Air Quality Data Using
Classification and Regression Tree (CART) Analysis
ICF International 3-181 VISTAS Meteorological Characterization 06-046 December 8, 2006
Table 3-17d. Summary of Average Input Parameters for Key Bins for CART Classification Categories 3 and 4: PM2.5 CART Analysis for SEARCH Site Centreville.
The ranges in PM2.5 for Categories 3 and 4 are 22.5-30 and ≥ 30 μgm-3.
Class 3 Class 4 Bin 16 Bin 20 Bin 19 Bin 28 Bin 18 Bin 21 PM2.5 Parameters Yesterday's FM at Birmingham (µg/m3) 34.6 33.6 32.8 51.5 25.3 38.6 Yesterday's FM at Atlanta (µg/m3) 28.1 33.1 31.1 38.1 18.5 30.0 Yesterday's FM at Centreville (µg/m3) 24.7 24.6 26.7 38.3 24.3 27.9 Surface Meteorological Parameters Max. surface temperature (°C) 31.2 31.7 32.9 31.0 25.4 35.4 Min. surface temperature (°C) 20.4 20.3 22.8 19.8 13.5 23.7 Relative humidity (%) 70.8 21.9 70.0 67.6 68.0 71.6 Surface wind speed (ms-1) 1.4 0.9 3.0 1.0 1.2 1.0 Surface wind direction (degrees) 330 110 304 349 329 153 Persistence 0.7 0.6 1.0 0.7 0.6 0.6 Station pressure (mb) 1003 1004 997 1005 1003 1005 Rainfall (inches) 0.0 0.0 0.0 0.1 0.1 0.0 Rain (# periods) 0.3 0.4 0.2 0.1 0.6 0.2 Upper-Air Meteorological Parameters Temperature AM 850 mb (°C) 15.5 15.8 18.2 15.2 12.4 18.0 Temperature PM 850 mb (°C) 16.2 17.1 17.9 15.9 11.3 20.1 Stability at Birmingham (°C) 1.6 2 -1.4 2.6 1.7 3.4 Geopotential height difference 700 mb at Birmingham (m) -4.1 -0.2 -19.8 -0.3 15.1 10.3 Wind speed yesterday 700 mb at Birmingham (ms-1) 5.9 5.6 9.3 4.9 12.3 5.2 Wind direction yesterday 700 mb at Birmingham (degrees) 342 56 27 6 297 360 Wind speed yesterday 850 mb at Birmingham (ms-1) 4.6 3.6 5.6 3.7 6.1 2.6 Wind speed AM 850 mb at Birmingham (ms-1) 5.0 3.3 11.0 3.5 8.2 4.6 Wind speed PM 850 mb at Birmingham (ms-1) 4.5 2.6 7.1 2.9 4.7 2.7 Wind direction yesterday 850 mb at Birmingham (degrees) 360 27 14 23 11 n/a Wind direction AM 850 mb at Birmingham (degrees) 309 202 360 243 270 315 Wind direction PM 850 mb at Birmingham (degrees) 356 117 346 45 360 270 Recirculation at Birmingham 0.3 0.4 0 0.4 0 0.3 Cloud average 1.8 1.6 1.6 1.9 1.8 1.7

Characterization of Meteorology and Its Relationships to Fine Particulate Mass and Visibility in the VISTAS Region Examination of Relationships between Meteorological and Air Quality Data Using
Classification and Regression Tree (CART) Analysis
ICF International 3-182 VISTAS Meteorological Characterization 06-046 December 8, 2006
Table 3-17e. Summary of Average Input Parameters for Key Bins for CART Classification Categories 3 and 4: PM2.5 CART Analysis for SEARCH Site Pensacola.
The ranges in PM2.5 for Categories 3 and 4 are 22.5-27.5 and ≥ 27.5 μgm-3.
Class 3 Class 4 Bin 22 Bin 31 Bin 19 Bin 27 Bin 18 PM2.5 Parameters Yesterday's FM at Gulfport (µg/m3) 19.4 24.2 18.2 25.0 16.9 Yesterday's FM at Pensacola (µg/m3) 22.7 30.8 19.5 30.7 20.1 Yesterday's FM at New Orleans/Baton Rouge (µg/m3) 21.3 26.7 18.7 25.3 19.1 Surface Meteorological Parameters Max. surface temperature (°C) 25.2 24.9 25.3 28.0 24.2 Min. surface temperature (°C) 13.1 16.1 14.6 18.7 10.6 Relative humidity (%) 70.4 85.8 73.5 74.1 64.1 Surface wind speed (ms-1) 1.6 0.6 0.5 0.7 0.6 Surface wind direction (degrees) 90 72 153 169 360 Persistence 0.9 0.7 0.4 0.6 0.7 Station pressure (mb) 1019 1019 1022 1018 1024 Rainfall (inches) 0.0 0.1 0.0 0.0 0.0 Rain (# periods) 0.0 0.7 0.1 0.2 0.0 Upper-Air Meteorological Parameters Temperature AM 850 mb (°C) 11.8 14.0 12.5 14.3 10.4 Temperature PM 850 mb (°C) 12.0 14.0 13.0 14.8 11.3 Stability at Tallahassee (°C) 2.3 1.9 2.4 1.5 6.2 Geopotential height difference 700 mb at Tallahassee (m) -7.5 11 23.1 0.6 -2.8 Wind speed yesterday 700 mb at Slidell (ms-1) 8.0 6.4 5.7 4.7 7.5 Wind speed yesterday 700 mb at Tallahassee (ms-1) 7.8 6.7 9.1 7.2 7.5 Wind speed yesterday 700 mb at Birmingham (ms-1) 8.9 9.8 9.9 6.8 10.2 Wind direction yesterday 700 mb at Slidell (degrees) 90 270 297 328 315 Wind direction yesterday 700 mb at Tallahassee (degrees) 315 90 338 309 288 Wind direction yesterday 700 mb at Birmingham (degrees) 284 292 323 310 288 Wind speed yesterday 850 mb at Slidell (ms-1) 7.7 5.8 5.1 3.9 4.6 Wind speed yesterday 850 mb at Tallahassee (ms-1) 5.0 5.4 3.0 4.6 5.7 Wind speed yesterday 850 mb at Birmingham (ms-1) 6.4 6.0 5.3 4.2 6.1 Wind speed AM 850 mb at Slidell (ms-1) 8.1 5.9 3.5 4.3 4.8 Wind speed AM 850 mb at Tallahassee (ms-1) 7.0 5.6 4.2 4.8 4.3 Wind speed AM 850 mb at Birmingham (ms-1) 8.5 7.1 5.9 4.1 6.1 Wind speed PM 850 mb at Slidell (ms-1) 8.1 4.9 4.0 4.3 5.1 Wind speed PM 850 mb at Tallahassee (ms-1) 7.2 6.1 4.0 5.6 4.5 Wind speed PM 850 mb at Birmingham (ms-1) 8.4 8.0 5.4 4.6 5.0 Wind direction yesterday 850 mb at Slidell (degrees) 360 180 346 360 333 Wind direction yesterday 850 mb at Tallahassee (degrees) 360 360 360 339 360 Wind direction yesterday 850 mb at Birmingham (degrees) 270 207 304 342 315 Wind direction AM 850 mb at Slidell (degrees) 207 194 207 214 342 Wind direction AM 850 mb at Tallahassee (degrees) 270 207 333 270 288 Wind direction AM 850 mb at Birmingham (degrees) 284 214 315 282 360 Wind direction PM 850 mb at Slidell (degrees) 297 198 360 22 360 Wind direction PM 850 mb at Tallahassee (degrees) 45 270 63 328 342 Wind direction PM 850 mb at Birmingham (degrees) 270 225 315 270 333 Cloud average 1.4 1.9 1.3 1.8 1.5
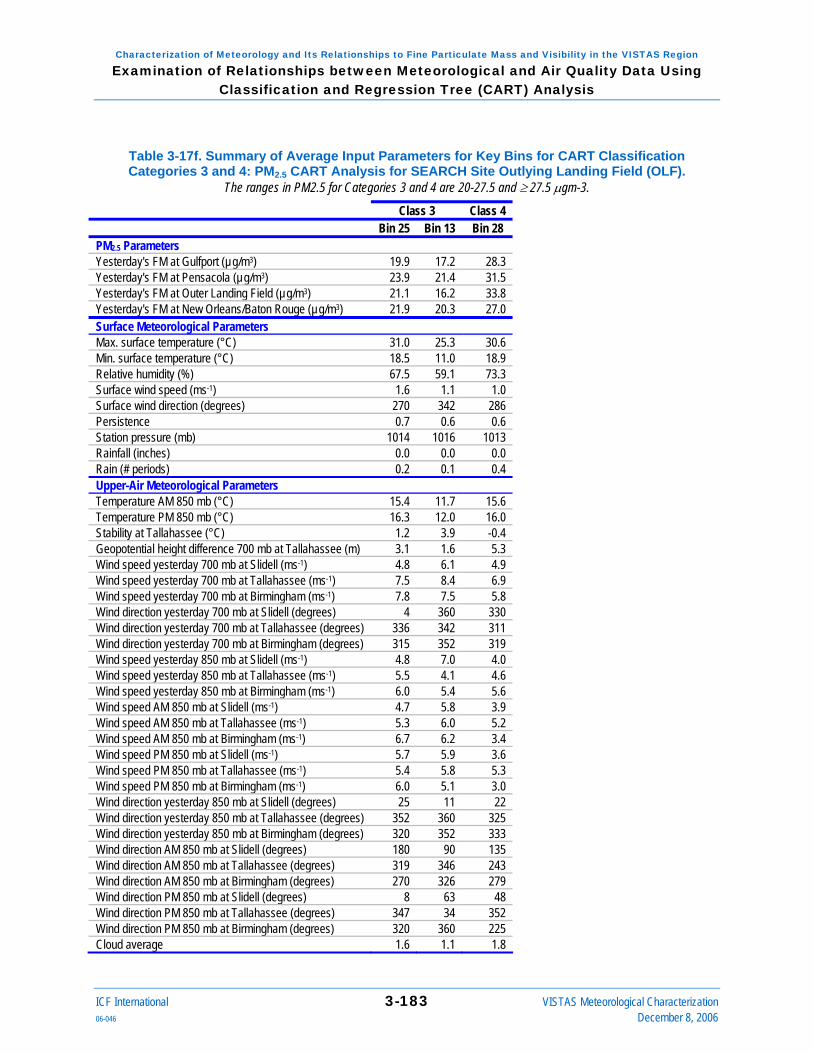
Characterization of Meteorology and Its Relationships to Fine Particulate Mass and Visibility in the VISTAS Region Examination of Relationships between Meteorological and Air Quality Data Using
Classification and Regression Tree (CART) Analysis
ICF International 3-183 VISTAS Meteorological Characterization 06-046 December 8, 2006
Table 3-17f. Summary of Average Input Parameters for Key Bins for CART Classification Categories 3 and 4: PM2.5 CART Analysis for SEARCH Site Outlying Landing Field (OLF).
The ranges in PM2.5 for Categories 3 and 4 are 20-27.5 and ≥ 27.5 μgm-3.
Class 3 Class 4 Bin 25 Bin 13 Bin 28 PM2.5 Parameters Yesterday's FM at Gulfport (µg/m3) 19.9 17.2 28.3 Yesterday's FM at Pensacola (µg/m3) 23.9 21.4 31.5 Yesterday's FM at Outer Landing Field (µg/m3) 21.1 16.2 33.8 Yesterday's FM at New Orleans/Baton Rouge (µg/m3) 21.9 20.3 27.0 Surface Meteorological Parameters Max. surface temperature (°C) 31.0 25.3 30.6 Min. surface temperature (°C) 18.5 11.0 18.9 Relative humidity (%) 67.5 59.1 73.3 Surface wind speed (ms-1) 1.6 1.1 1.0 Surface wind direction (degrees) 270 342 286 Persistence 0.7 0.6 0.6 Station pressure (mb) 1014 1016 1013 Rainfall (inches) 0.0 0.0 0.0 Rain (# periods) 0.2 0.1 0.4 Upper-Air Meteorological Parameters Temperature AM 850 mb (°C) 15.4 11.7 15.6 Temperature PM 850 mb (°C) 16.3 12.0 16.0 Stability at Tallahassee (°C) 1.2 3.9 -0.4 Geopotential height difference 700 mb at Tallahassee (m) 3.1 1.6 5.3 Wind speed yesterday 700 mb at Slidell (ms-1) 4.8 6.1 4.9 Wind speed yesterday 700 mb at Tallahassee (ms-1) 7.5 8.4 6.9 Wind speed yesterday 700 mb at Birmingham (ms-1) 7.8 7.5 5.8 Wind direction yesterday 700 mb at Slidell (degrees) 4 360 330 Wind direction yesterday 700 mb at Tallahassee (degrees) 336 342 311 Wind direction yesterday 700 mb at Birmingham (degrees) 315 352 319 Wind speed yesterday 850 mb at Slidell (ms-1) 4.8 7.0 4.0 Wind speed yesterday 850 mb at Tallahassee (ms-1) 5.5 4.1 4.6 Wind speed yesterday 850 mb at Birmingham (ms-1) 6.0 5.4 5.6 Wind speed AM 850 mb at Slidell (ms-1) 4.7 5.8 3.9 Wind speed AM 850 mb at Tallahassee (ms-1) 5.3 6.0 5.2 Wind speed AM 850 mb at Birmingham (ms-1) 6.7 6.2 3.4 Wind speed PM 850 mb at Slidell (ms-1) 5.7 5.9 3.6 Wind speed PM 850 mb at Tallahassee (ms-1) 5.4 5.8 5.3 Wind speed PM 850 mb at Birmingham (ms-1) 6.0 5.1 3.0 Wind direction yesterday 850 mb at Slidell (degrees) 25 11 22 Wind direction yesterday 850 mb at Tallahassee (degrees) 352 360 325 Wind direction yesterday 850 mb at Birmingham (degrees) 320 352 333 Wind direction AM 850 mb at Slidell (degrees) 180 90 135 Wind direction AM 850 mb at Tallahassee (degrees) 319 346 243 Wind direction AM 850 mb at Birmingham (degrees) 270 326 279 Wind direction PM 850 mb at Slidell (degrees) 8 63 48 Wind direction PM 850 mb at Tallahassee (degrees) 347 34 352 Wind direction PM 850 mb at Birmingham (degrees) 320 360 225 Cloud average 1.6 1.1 1.8

Characterization of Meteorology and Its Relationships to Fine Particulate Mass and Visibility in the VISTAS Region Examination of Relationships between Meteorological and Air Quality Data Using
Classification and Regression Tree (CART) Analysis
ICF International 3-184 VISTAS Meteorological Characterization 06-046 December 8, 2006
Table 3-17g. Summary of Average Input Parameters for Key Bins for CART Classification Categories 3 and 4: PM2.5 CART Analysis for SEARCH Site Gulfport.
The ranges in PM2.5 for Categories 3 and 4 are 20-25 and ≥ 25 μgm-3.
Class 3 Class 4 Bin 29 Bin 12 Bin 10 Bin 30 Bin 16 PM2.5 Parameters Yesterday's FM at Gulfport (µg/m3) 24.3 25.5 17.7 28.1 16.7 Yesterday's FM at Pensacola (µg/m3) 20.0 18.0 21.7 29.9 16.9 Yesterday's FM at New Orleans/Baton Rouge (µg/m3) 26.1 18.3 18.1 28.4 22.1 Surface Meteorological Parameters Max. surface temperature (°C) 26.1 23.4 31.7 29.4 27.4 Min. surface temperature (°C) 6.1 9.6 21.3 19.4 16.7 Relative humidity (%) 77.9 69.7 73.9 73.3 67.9 Surface wind speed (ms-1) 1.4 1.0 1.2 1.0 0.7 Surface wind direction (degrees) 158 191 194 220 225 Persistence 0.7 0.5 0.6 0.5 0.4 Station pressure (mb) 1018 1019 1017 1017 1018 Rainfall (inches) 0.1 0.0 0.0 0.0 0.0 Rain (# periods) 0.5 0.1 0.3 0.3 0.1 Upper-Air Meteorological Parameters Temperature AM 850 mb (°C) 12.5 11.1 16.2 14.2 13.2 Temperature PM 850 mb (°C) 12.5 11.5 16.7 14.9 14.0 Stability at Slidell (°C) 1.7 7.0 -0.1 0.7 2.3 Geopotential height difference 700 mb at Slidell (m) -1.2 9.3 5.0 1.6 -6.7 Wind speed yesterday 700 mb at Jacksonville (ms-1) 7.6 8.1 6.8 6.0 9.0 Wind speed yesterday 700 mb at Slidell (ms-1) 4.6 6.2 5.7 5.5 8.8 Wind direction yesterday 700 mb at Jacksonville (degrees) 279 320 281 330 297 Wind direction yesterday 700 mb at Slidell (degrees) 297 342 360 353 297 Wind speed yesterday 850 mb at Jacksonville (ms-1) 6.3 6.4 3.6 4.2 5.9 Wind speed yesterday 850 mb at Slidell (ms-1) 4.6 6.2 5.7 4.4 8.0 Wind speed AM 850 mb at Jacksonville (ms-1) 6.7 4.9 5.8 4.4 7.3 Wind speed AM 850 mb at Slidell (ms-1) 5.2 5.0 5.0 4.0 6.1 Wind speed PM 850 mb at Jacksonville (ms-1) 6.3 6.4 3.6 4.7 5.1 Wind speed PM 850 mb at Slidell (ms-1) 5.2 5.6 4.8 4.3 5.1 Wind direction yesterday 850 mb at Jacksonville (degrees) 270 360 n/a 9 342 Wind direction yesterday 850 mb at Slidell (degrees) 351 6 90 21 360 Wind direction AM 850 mb at Jacksonville (degrees) 262 262 169 243 304 Wind direction AM 850 mb at Slidell (degrees) 180 243 121 149 360 Wind direction PM 850 mb at Jacksonville (degrees) 217 211 166 225 297 Wind direction PM 850 mb at Slidell (degrees) 270 236 90 29 360 Recirculation at Slidell 0.3 0.2 360 0.2 0.0 Cloud average 1.7 1.2 1.7 1.6 1.6

Characterization of Meteorology and Its Relationships to Fine Particulate Mass and Visibility in the VISTAS Region Examination of Relationships between Meteorological and Air Quality Data Using
Classification and Regression Tree (CART) Analysis
ICF International 3-185 VISTAS Meteorological Characterization 06-046 December 8, 2006
Table 3-17h. Summary of Average Input Parameters for Key Bins for CART Classification Categories 3 and 4: PM2.5 CART Analysis for SEARCH Site Oak Grove.
The ranges in PM2.5 for Categories 3 and 4 are 20-27.5 and ≥ 27.5 μgm-3.
Class 3 Class 4 Bin 19 Bin 29 Bin 14 Bin 31 Bin 26 PM2.5 Parameters Yesterday's FM at Gulfport (µg/m3) 19.4 23.8 14.7 26.0 22.3 Yesterday's FM at Oak Grove (µg/m3) 19.7 22.9 17.1 35.0 22.8 Yesterday's FM at Pensacola (µg/m3) 18.6 28.6 17.1 24.6 30.73 Yesterday's FM at New Orleans/Baton Rouge (µg/m3) 23.8 22.9 16.8 29.3 26.4 Surface Meteorological Parameters Max. surface temperature (°C) 28.6 33.0 29.3 28.7 25.5 Min. surface temperature (°C) 16.2 20.1 14.4 17.2 14.3 Relative humidity (%) 65.2 71.2 62.4 67.6 65.8 Surface wind speed (ms-1) 1.0 1.2 1.4 1.1 1.2 Surface wind direction (degrees) 75 180 360 321 76 Persistence 0.7 0.8 0.8 0.7 0.8 Station pressure (mb) 1012 1010 1011 1010 1011 Rainfall (inches) 0.0 0.0 0.0 0.0 0.0 Rain (# periods) 0.2 0.12 0.1 0.2 0.5 Upper-Air Meteorological Parameters Temperature AM 850 mb (°C) 14.0 17.0 14.6 13.7 11.7 Temperature PM 850 mb (°C) 13.6 18.0 15.4 14.7 12.3 Stability at Slidell (°C) 1.1 0.0 2.7 1.6 0.9 Geopotential height difference 700 mb at Slidell (m) -0.1 4.0 3.7 5.6 6.4 Wind speed yesterday 700 mb at Jacksonville (ms-1) 6.3 5.2 7.9 9.0 5.1 Wind speed yesterday 700 mb at Slidell (ms-1) 5.9 4.9 7.1 7 6.4 Wind direction yesterday 700 mb at Jacksonville (degrees) 323 8 315 297 270 Wind direction yesterday 700 mb at Slidell (degrees) 329 27 329 328 309 Wind speed yesterday 850 mb at Jacksonville (ms-1) 4.8 4.4 4.2 4.7 3.9 Wind speed yesterday 850 mb at Slidell (ms-1) 5.4 4.4 6.3 4.8 4.5 Wind speed AM 850 mb at Jacksonville (ms-1) 5.1 4.7 4.0 6.5 4.5 Wind speed AM 850 mb at Slidell (ms-1) 4.6 3.9 4.3 4.5 5.4 Wind speed PM 850 mb at Jacksonville (ms-1) 4.8 4.4 5.5 5.0 6.6 Wind speed PM 850 mb at Slidell (ms-1) 5.7 4.3 5.0 4.5 5.7 Wind direction yesterday 850 mb at Jacksonville (degrees) 90 342 315 307 270 Wind direction yesterday 850 mb at Slidell (degrees) 48 23 14 0 333 Wind direction AM 850 mb at Jacksonville (degrees) 194 270 326 275 207 Wind direction AM 850 mb at Slidell (degrees) 243 90 45 278 198 Wind direction PM 850 mb at Jacksonville (degrees) 149 284 146 304 153 Wind direction PM 850 mb at Slidell (degrees) 52 63 56 10 27 Recirculation at Slidell 0.2 0.3 0 0.4 0.2 Cloud average 1.7 1.7 1.6 1.7 1.8

Characterization of Meteorology and Its Relationships to Fine Particulate Mass and Visibility in the VISTAS Region Examination of Relationships between Meteorological and Air Quality Data Using
Classification and Regression Tree (CART) Analysis
For Atlanta, the PM2.5 concentration ranges for Categories 3 and 4 are 30 to 37.5 and greater than or equal to 37.5 μgm-3, respectively. There are three Category 3 and three Category 4 bins that meet the criteria for key bins. The Category 4 bins tend to have lower average relative humidity, greater stability, and higher prior-day PM2.5 concentrations, than the Category 3 bins, but many of the characteristics are similar between the two groups of bins. The Category 4 bins are characterized by very low surface wind speeds. Surface wind directions are from the southwest (Bin 19), northwest (Bin 23), and northeast (Bin 26). Two of the Category 4 bins have cooler minimum temperatures than the other key bins and greater stability. This same tendency is reflected in the wind directions aloft. In contrast, southeasterly wind components are associated with the two of the Category 3 bins. CART appears to have identified three distinct high PM2.5 concentration regimes.
For Birmingham, the PM2.5 concentration ranges for Categories 3 and 4 are 30 to 37.5 and greater than or equal to 37.5 μgm-3, respectively. There are two Category 3 and three Category 4 bins that meet the criteria for key bins. All of the key bins are characterized by very low surface wind speeds. Two of the three Category 4 bins are distinguished from the Category 3 bins by lower average relative humidity. The third bin is distinguished from the Category 3 bins and all other key bins by lower temperatures. Bin 25 (Category 4) is very similar to Bin 10 (Category 3), in terms of the average parameter values, with the exception of the prior-day PM concentration for Birmingham. A much higher prior-day value for Bin 25 likely contributes to the higher PM2.5 values and higher category designation. Bins 20 and 24 are differentiated by wind directions. Surface winds are northeasterly for Bin 20 and southerly for Bin 24, compared to northwesterly for Bin 25 and the key Category 3 bins. Upper-level winds are southerly to southwesterly for Bin 20 and (more typically) westerly to southwesterly for Bin 24.
Figure 3-9 shows the average composition for all key PM2.5 bins for each of the SEARCH sites.
Figure 3-9a. Average Elemental Carbon (EC), Nitrate (NO3), Organic Matter (OM), and Sulfate (SO4) Concentrations (μgm-3) for Key PM2.5 Bins for All CART Classification Categories: SEARCH Site
Atlanta.
Atlanta SEARCH Key PM Bins: Component Averages
0.00
4.00
8.00
12.00
16.00
20.00
1 (751) 7 (146) 4 (116) 8 (43) 5 (39) 3 (33) 28 (15) 31 (12) 21 (16) 19 (18) 23 (7) 26 (5)
Class 1 Class 2 Class 3 Class 4
Bin No. (No. of Correctly Classified Days)
Avg.
Con
c. (µ
g/m
3)
ECNO3OMSO4
ICF International 3-186 VISTAS Meteorological Characterization 06-046 December 8, 2006
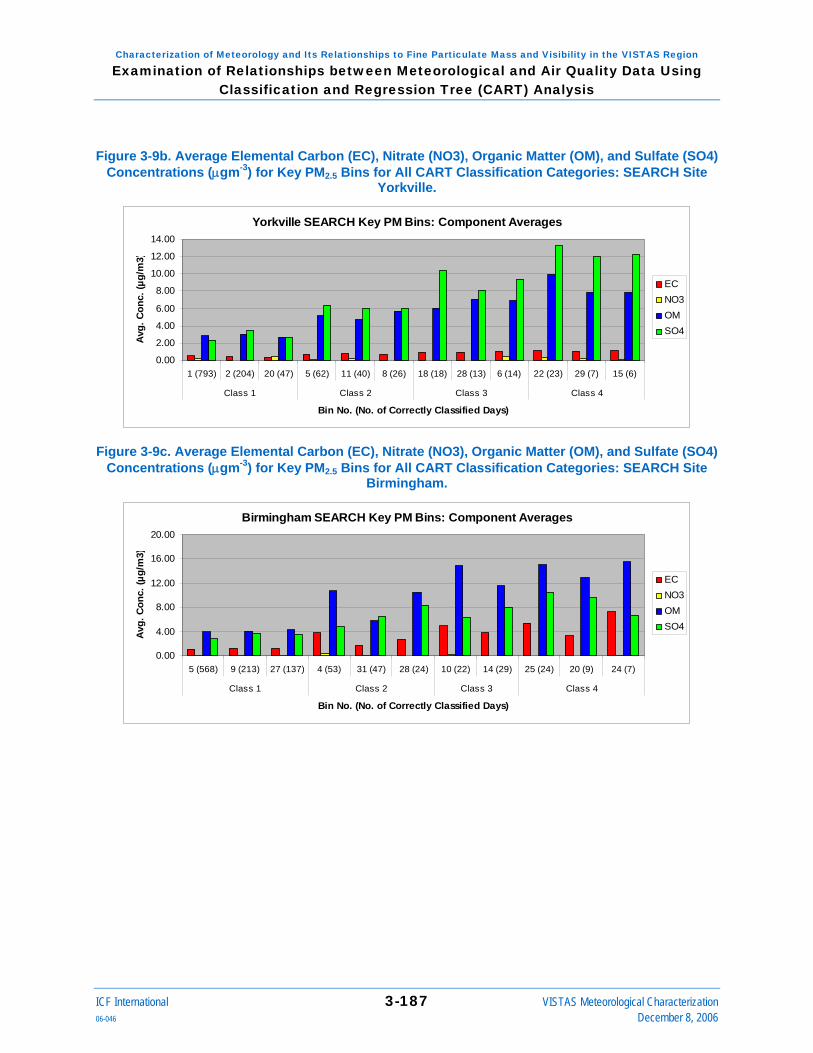
Characterization of Meteorology and Its Relationships to Fine Particulate Mass and Visibility in the VISTAS Region Examination of Relationships between Meteorological and Air Quality Data Using
Classification and Regression Tree (CART) Analysis
Figure 3-9b. Average Elemental Carbon (EC), Nitrate (NO3), Organic Matter (OM), and Sulfate (SO4) Concentrations (μgm-3) for Key PM2.5 Bins for All CART Classification Categories: SEARCH Site
Yorkville.
Yorkville SEARCH Key PM Bins: Component Averages
0.00
2.00
4.00
6.00
8.00
10.00
12.00
14.00
1 (793) 2 (204) 20 (47) 5 (62) 11 (40) 8 (26) 18 (18) 28 (13) 6 (14) 22 (23) 29 (7) 15 (6)
Class 1 Class 2 Class 3 Class 4
Bin No. (No. of Correctly Classified Days)
Avg.
Con
c. (µ
g/m
3)
ECNO3OMSO4
Figure 3-9c. Average Elemental Carbon (EC), Nitrate (NO3), Organic Matter (OM), and Sulfate (SO4) Concentrations (μgm-3) for Key PM2.5 Bins for All CART Classification Categories: SEARCH Site
Birmingham.
Birmingham SEARCH Key PM Bins: Component Averages
0.00
4.00
8.00
12.00
16.00
20.00
5 (568) 9 (213) 27 (137) 4 (53) 31 (47) 28 (24) 10 (22) 14 (29) 25 (24) 20 (9) 24 (7)
Class 1 Class 2 Class 3 Class 4
Bin No. (No. of Correctly Classified Days)
Avg.
Con
c. (µ
g/m
3)
ECNO3OMSO4
ICF International 3-187 VISTAS Meteorological Characterization 06-046 December 8, 2006

Characterization of Meteorology and Its Relationships to Fine Particulate Mass and Visibility in the VISTAS Region Examination of Relationships between Meteorological and Air Quality Data Using
Classification and Regression Tree (CART) Analysis
Figure 3-9d. Average Elemental Carbon (EC), Nitrate (NO3), Organic Matter (OM), and Sulfate (SO4) Concentrations (μgm-3) for Key PM2.5 Bins for All CART Classification Categories: SEARCH Site
Centreville.
Centreville SEARCH Key PM Bins: Component Averages
0.002.004.006.008.00
10.0012.0014.0016.00
1 (672) 3 (115) 2 (112) 10 (80) 7 (45) 24 (33) 16 (34) 20 (19) 9 (9) 28 (16) 18 (8) 21 (6)
Class 1 Class 2 Class 3 Class 4
Bin No. (No. of Correctly Classified Days)
Avg.
Con
c. (µ
g/m
3)
ECNO3OMSO4
Figure 3-9e. Average Elemental Carbon (EC), Nitrate (NO3), Organic Matter (OM), and Sulfate (SO4) Concentrations (μgm-3) for Key PM2.5 Bins for All CART Classification Categories: SEARCH Site
Pensacola.
Pensacola SEARCH Key PM Bins: Component Averages
0.002.004.006.008.00
10.0012.0014.0016.00
1 (581) 3 (8) 2 (1) 10 (1) 7 (1) 24 (2) 16 (4) 20 (13) 9 (1) 28 (2) 18 (6)
Class 1 Class 2 Class 3 Class 4
Bin No. (No. of Correctly Classified Days)
Avg.
Con
c. (µ
g/m
3)
ECNO3OMSO4
ICF International 3-188 VISTAS Meteorological Characterization 06-046 December 8, 2006

Characterization of Meteorology and Its Relationships to Fine Particulate Mass and Visibility in the VISTAS Region Examination of Relationships between Meteorological and Air Quality Data Using
Classification and Regression Tree (CART) Analysis
Figure 3-9f. Average Elemental Carbon (EC), Nitrate (NO3), Organic Matter (OM), and Sulfate (SO4) Concentrations (μgm-3) for Key PM2.5 Bins for All CART Classification Categories: SEARCH Site
Outlying Landing Field.
Outlying Landing Field SEARCH Key PM Bins: Component Averages
0.00
2.00
4.00
6.00
8.00
10.00
12.00
14.00
1 (650) 2 (195) 23 (98) 16 (100) 24 (27) 9 (35) 25 (32) 13 (12) 28 (33)
Class 1 Class 2 Class 3 Class 4
Bin No. (No. of Correctly Classified Days)
Avg.
Con
c. (µ
g/m
3)
ECNO3OMSO4
Figure 3-9g. Average Elemental Carbon (EC), Nitrate (NO3), Organic Matter (OM), and Sulfate (SO4) Concentrations (μgm-3) for Key PM2.5 Bins for All CART Classification Categories: SEARCH Site
Gulfport.
Gulfport SEARCH Key PM Bins: Component Averages
0.00
2.00
4.00
6.00
8.00
10.00
1 (689) 2 (193) 27 (83) 25 (49) 9 (44) 8 (30) 29 (17) 12 (18) 10 (10) 30 (40) 16 (7)
Class 1 Class 2 Class 3 Class 4
Bin No. (No. of Correctly Classified Days)
Avg.
Con
c. (µ
g/m
3)
ECNO3OMSO4
ICF International 3-189 VISTAS Meteorological Characterization 06-046 December 8, 2006

Characterization of Meteorology and Its Relationships to Fine Particulate Mass and Visibility in the VISTAS Region Examination of Relationships between Meteorological and Air Quality Data Using
Classification and Regression Tree (CART) Analysis
Figure 3-9h. Average Elemental Carbon (EC), Nitrate (NO3), Organic Matter (OM), and Sulfate (SO4) Concentrations (μgm-3) for Key PM2.5 Bins for All CART Classification Categories: SEARCH Site
Oak Grove.
Oak Grove SEARCH Key PM Bins: Component Averages
0.002.004.006.008.00
10.0012.0014.0016.00
1 (668) 7 (106) 8 (88) 22 (78) 3 (71) 9 (38) 19 (26) 29 (25) 14 (12) 31 (21) 26 (11)
Class 1 Class 2 Class 3 Class 4
Bin No. (No. of Correctly Classified Days)
Avg.
Con
c. (µ
g/m
3)
ECNO3OMSO4
The compositional charts for the PM2.5 for the SEARCH sites also show a much larger proportional contribution from organics than the IMPROVE charts, especially for the higher PM2.5 bins. The relative ranking of the species contributions is similar to that for the STN sites. A comparison of the compositional averages for Birmingham using the STN (Figure 3-8a) and SEARCH (Figure 3-9c) data, shows that the organic matter and overall PM2.5 values are higher in the STN data, but that the tendency for organic matter to be the dominant species appears in both sets of results.
The compositional analysis results for Birmingham (Figure 3-9c) also show a higher contribution of elemental carbon than for most other sites, and this may be related to emissions from the steel industry facilities that are located in Birmingham.
For all three of the key Category 4 PM2.5 bins for Birmingham (Bins 25, 20, and 24), organic matter is the dominant species. However, the relative proportion of the species concentrations is different for each bin. This may be due to the differences in the average wind directions. All of the key bins are characterized by very low surface wind speeds, but, on average, the days within the bins have different wind directions. Surface winds are northwesterly for Bin 24, northeasterly for Bin 20, and southerly for Bin 24. We noted earlier that Bin 25 (Category 4) is very similar to Bin 10 (Category 3), in terms of the average parameter values, with the exception of the prior-day PM concentration for Birmingham. The two bins have similar species distributions, and the higher values for Bin 24 are due to slight increases in sulfate and organic matter and a greater increase in elemental carbon.
ICF International 3-190 VISTAS Meteorological Characterization 06-046 December 8, 2006
4. Meteorological Representativeness and Episode Selection Exercises
The CART results and a meteorological characterization and episode selection tool, based on these results, were used to provide information related to the representativeness of the model year 2002 and the periods selected by VISTAS for model performance evaluation and preliminary sensitivity testing, relative to the five-year regional haze baseline period. The CART results and tool were also used in selecting subset periods of 2002 for PM2.5 modeling and sensitivity analysis, and in the calculation of weighting factors related to regional haze and PM2.5 for the modeled days. These exercises are described in this section. A comparison of the results for Birmingham using the STN and SEARCH datasets is provided in the appendix.
4.1. Meteorological Characterization and Episode Selection Tool In this study, the CART results served as the basis for developing a tool capable of addressing questions regarding the representativeness of selected episodic and annual simulation periods as well as the selection of discrete multi-day periods for refined modeling or control-strategy evaluation. The CART results (groupings of days with similar characteristics) were coupled with characterization and episode selection algorithms in order to provide this information. The VISTAS meteorological characterization tool is available in electronic format.
For any input set of days, the characterization algorithm assesses and summarizes the range, type, and frequency of sampling of the CART bins; the degree to which key characteristics (CART bins) are represented; mean values for all parameters, including chemical speciation; representation of the days comprising the regional metrics, and ability to represent the regional haze metrics or PM2.5 annual average or design values (estimated using error statistics) for one or more sites selected by the user. A summary of the meteorological parameters for the selected days is also optionally provided, together with an assessment of whether or not the conditions are typical of the full analysis period.
The episode selection algorithm, based on the EPISODES program that we originally developed for SAMI, identifies episodes characterized by typical (frequently occurring) meteorological conditions and representative of the multi-year visibility and PM2.5 metrics. The selection of days is guided by user-input episode selection criteria pertaining to the number of days, contiguousness and length of episode periods, and error tolerance in representing the regional haze metrics. The days identified by the episode selection algorithm can then be summarized using the characterization algorithm.
Figure 4-1 diagrams the VISTAS meteorological characterization and episode selection tool.
ICF International 4-1 VISTAS Meteorological Characterization 06-046 December 8, 2006

Characterization of Meteorology and Its Relationships to Fine Particulate Mass and Visibility in the VISTAS Region Meteorological Representativeness and Episode Selection Exercises
Figure 4-1. Schematic Diagram of the VISTAS Meteorological Characterization and Episode Selection Tool.
Figure 4-1. Schematic Diagram of the VISTAS Meteorological Characterization and Episode Selection Tool.
PM Data (IMPROVE, STN, and SEARCH)
Visibility Meteorological Data
CART
CART classification algorithm/variable importance Conceptual model for visibility
(and, optionally, PM2.5)
Classification category and
bin characteristics
06
Together the CART results and the meteorological characterization and episode selection tool were used to provide information related to the representativeness of the model year 2002 and the periods selected by VISTAS for model performance evaluation and preliminary sensitivity testing.
Together the CART results and the meteorological characterization and episode selection tool were used to provide information related to the representativeness of the model year 2002 and the periods selected by VISTAS for model performance evaluation and preliminary sensitivity testing.
4.1.1. Meteorological Characterization Component 4.1.1. Meteorological Characterization Component In the characterization mode, the user inputs a date or series of dates and the tool provides information about those dates. In the characterization mode, the user inputs a date or series of dates and the tool provides information about those dates.
The user must select the type of analysis (visibility or PM2.5) by selecting the appropriate button. He/she may also select the meteorology option by checking that box. He/she must also select the desired site(s) and either enter the dates manually or read them in from an external file by clicking on the “Read Dates” button. The tool will accept any dates included in the analysis period, which currently includes the years 2000-2004. The dates must be in yymmdd format. The initial input screen for an example application for PM2.5 for the STN sites and the Atlanta, Birmingham, Gulfport, and Pensacola SEARCH sites for 3 June – 10 July 2002 is displayed in Figure 4-2.
The user must select the type of analysis (visibility or PM2.5) by selecting the appropriate button. He/she may also select the meteorology option by checking that box. He/she must also select the desired site(s) and either enter the dates manually or read them in from an external file by clicking on the “Read Dates” button. The tool will accept any dates included in the analysis period, which currently includes the years 2000-2004. The dates must be in yymmdd format. The initial input screen for an example application for PM2.5 for the STN sites and the Atlanta, Birmingham, Gulfport, and Pensacola SEARCH sites for 3 June – 10 July 2002 is displayed in Figure 4-2.
EPISODES
CART Results
CHARACTERIZATION ALGORITHM
Alternate/subset modeling periods
Summary of characteristics, representativeness, and error statistics
Conceptual Description
Meteorological Characterization Episode Selection
User-specified episode selection
parametersUser-specified dates/periods
of interest
ICF International 4-2 VISTAS Meteorological Characterization 06-046 December 8, 2006

Characterization of Meteorology and Its Relationships to Fine Particulate Mass and Visibility in the VISTAS Region Meteorological Representativeness and Episode Selection Exercises
Figure 4-2. Initial Input Screen for the Characterization Portion of the VISTAS Meteorological Characterization Tool: Example for PM2.5 for all STN Sites Plus the Atlanta,
Birmingham, Gulfport, and Pensacola SEARCH Sites, for 6/3/02-7/10/02.
Once the dates are entered, the user must select from among the Visibility Metrics, PM2.5 Metrics, or Meteorological Metrics buttons to obtain the results. For both visibility and PM, key metrics summarize how well the days represent:
• Frequently occurring meteorological conditions, as identified by CART
– Number and type of key1 bins represented.
– Percent of key bins represented within each classification category.
– Distribution of days within the key bins, relative to the full analysis period.
– Distribution of days within all bins, relative to the full analysis period.
For visibility, the output also includes the following regional haze metrics, where the 20 percent worst and best days are defined, respectively, as the 20 percent haziest and 20 percent clearest days in the 2000-2004 baseline period:
• Mean extinction coefficient, calculated using a CART-based frequency weighting of the days. The average is calculated in this manner so that it can be compared with annual mean
1 Key bins for each category are those containing the greatest number of correctly classified days. Approximately three key bins were selected for each classification category for each site.
ICF International 4-3 VISTAS Meteorological Characterization 06-046 December 8, 2006
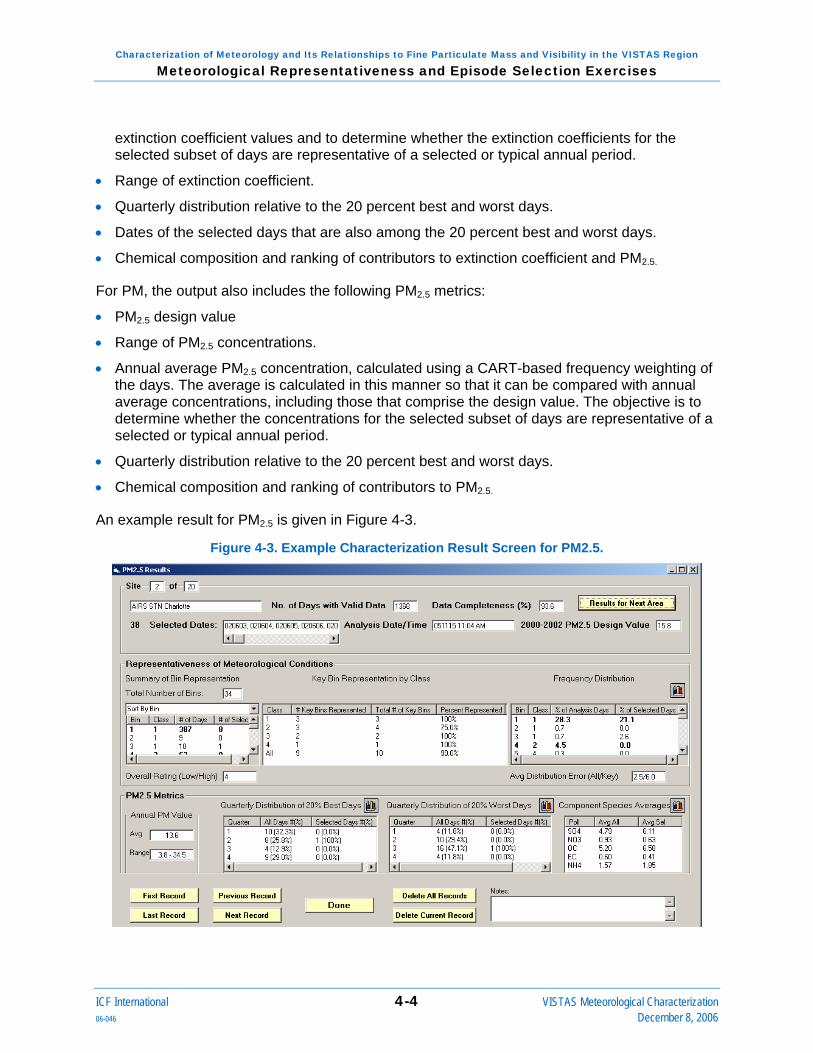
Characterization of Meteorology and Its Relationships to Fine Particulate Mass and Visibility in the VISTAS Region Meteorological Representativeness and Episode Selection Exercises
extinction coefficient values and to determine whether the extinction coefficients for the selected subset of days are representative of a selected or typical annual period.
• Range of extinction coefficient.
• Quarterly distribution relative to the 20 percent best and worst days.
• Dates of the selected days that are also among the 20 percent best and worst days.
• Chemical composition and ranking of contributors to extinction coefficient and PM2.5.
For PM, the output also includes the following PM2.5 metrics:
• PM2.5 design value
• Range of PM2.5 concentrations.
• Annual average PM2.5 concentration, calculated using a CART-based frequency weighting of the days. The average is calculated in this manner so that it can be compared with annual average concentrations, including those that comprise the design value. The objective is to determine whether the concentrations for the selected subset of days are representative of a selected or typical annual period.
• Quarterly distribution relative to the 20 percent best and worst days.
• Chemical composition and ranking of contributors to PM2.5.
An example result for PM2.5 is given in Figure 4-3.
Figure 4-3. Example Characterization Result Screen for PM2.5.
ICF International 4-4 VISTAS Meteorological Characterization 06-046 December 8, 2006

Characterization of Meteorology and Its Relationships to Fine Particulate Mass and Visibility in the VISTAS Region Meteorological Representativeness and Episode Selection Exercises
For meteorology, the output includes the bin and CART category into which each date falls as well as the maximum temperature, relative humidity, wind speed and direction, and precipitation on that date. It also includes the number and percent of the selected days that have atypical meteorological conditions.
There are also several options for graphical display of the results (these are obtained by clicking on the miniature bar charts next to the metric descriptors).
The characterization tool was used during the course of the project to examine the representativeness of the two episode periods selected for air quality model performance evaluation, and to refine the selection of the two episode periods that were used for model sensitivity analysis.
4.1.2. Episode Selection Component In the episode selection mode, the user specifies criteria for episode selection (such as total number of days, sites to optimize over, relative importance of various control factors, etc.) and the analytic tool provides a list of episode dates. These dates can subsequently be input to the characterization scheme to obtain information about the episodes.
The user must select the type of analysis (visibility or PM2.5), by selecting the appropriate button, and select the number (up to 8) and name(s) of the sites from two drop-down menus. He/she may enter the desired number of days (the default is 40), and check a box if he/she wishes to use only properly classified days. The user may also enter values for other control factors, including a distance factor, chain factor, and season factor. The relative values of these factors (and not the absolute values) guide the episode selection and specify the relative importance of 1) representing annual average values of visibility (or PM2.5), 2) including consecutive days, and 3) representing all seasons in the episode selection results. The distance factor determines the relative emphasis on selecting days (combined) that represent the weighted annual average value of extinction coefficient or PM2.5 (whichever is selected) and thus the key bins. The chain factor determines the degree to which consecutive days are sought. The season factor weights the degree to which the different seasons are represented by the selected dates. Finally, the user may check a box if he/she wishes to consider only days from particular classification categories. If so, he/she then has the opportunity to select those categories from a menu. The initial input screen for an example application for PM2.5 for the Atlanta SEARCH site is displayed in Figure 4-4.
ICF International 4-5 VISTAS Meteorological Characterization 06-046 December 8, 2006

Characterization of Meteorology and Its Relationships to Fine Particulate Mass and Visibility in the VISTAS Region Meteorological Representativeness and Episode Selection Exercises
Figure 4-4. Initial Input Screen for the Episode Selection Portion of the VISTAS Meteorological Characterization Tool: Example for PM2.5 for Atlanta.
Once the inputs are entered, the Run button is selected and the results screen appears. This summarizes the total number of episodes (defined by contiguous days), combined error summary for all selected sites, and site-specific errors. The errors summarize how well the selected episodes represent annual average values. The combined-site errors include an average error (the average difference in extinction coefficient or concentration), optimized cost (a relative measure of how well the distance, chain and season criteria are met), and average biased error (biased or signed error, averaged over all sites). The site-specific errors include the distance error (which quantifies the representation of the annual average value of the parameter, scaled to compensate for bins that are not represented) and the biased error (same as the distance error but not scaled to account for missing bins). By clicking on the Save Output button, the user can save and open/view a file containing the episode dates. An example results screen is shown in Figure 4-5.
ICF International 4-6 VISTAS Meteorological Characterization 06-046 December 8, 2006

Characterization of Meteorology and Its Relationships to Fine Particulate Mass and Visibility in the VISTAS Region Meteorological Representativeness and Episode Selection Exercises
Figure 4-5. Example Episode Selection Result Screen for PM2.5.
There is also an option for graphical display of the results (obtained by clicking on the miniature bar chart).
The episode selection component of the tool was used to guide the selection of the two episode periods that were used by VISTAS for model sensitivity analysis.
4.2. Analysis of the Representativeness of the 2002 Simulation Period
The CART results and meteorological characterization tool were used to explore several questions related to modeling episode period representativeness. As noted earlier, the key question is: How representative is the year 2002, as selected for VISTAS atmospheric modeling, considering meteorology, fine particulate, and visibility, relative to the full baseline period. The characteristics of the 2000-2004 baseline period and each individual year comprising that period are examined and compared in this section.
4.2.1. IMPROVE Sites Table 4-1 summarizes and compares 2000-2004, and each individual year within this period for the IMPROVE sites. The summary metrics included in this table are the weighted average extinction coefficient, weighted average PM2.5 concentration, range in PM2.5 concentration, percentage of key visibility bins represented (considering all classes), the relative distribution of days among the key visibility bins for all categories (distribution error), percentage of key PM2.5 bins represented (considering all classes), and the relative distribution of days among the key PM2.5 bins for all categories (distribution error). These terms are explained in more detail, in the discussion following Table 4-1.
ICF International 4-7 VISTAS Meteorological Characterization 06-046 December 8, 2006

Characterization of Meteorology and Its Relationships to Fine Particulate Mass and Visibility in the VISTAS Region Meteorological Representativeness and Episode Selection Exercises
Table 4-1. Summary of Visibility, PM2.5, and Meteorological Characteristics for the 2000-2004 Analysis Period: IMPROVE Sites.
(a) Breton
Period
Weighted Average
Extinction Coefficient
(Mm-1)
Weighted Average PM2.5
Concentration (μgm-3)
Range in PM2.5
Concentration (μgm-3)
Percentage of Key
Visibility Bins Represented
(%)
Distribution Error Over
All Key Visibility Bins (%)
Percentage of Key PM2.5
Bins Represented
(%)
Distribution Error Over
All Key PM2.5 Bins
(%)
2000–2004 78.5 7.6 1.2 – 21.5 100
2000 92.5 9.4 4.3 – 17.2 100 1.9 100 2.9 2001 78.3 7.7 2.2 – 20.3 100 1.3 100 1.4 2002 71.2 6.7 1.8 – 16.4 100 1.6 100 0.7 2003 79.5 7.6 1.7 – 19.7 100 0.9 100 0.9 2004 80.5 7.9 1.2 – 21.5 100 1.3 100 1.3
(b) Brigantine
Period
Weighted Average
Extinction Coefficient
(Mm-1)
Weighted Average PM2.5
Concentration (μgm-3)
Range in PM2.5 Concentration
(μgm-3)
Percentage of Key
Visibility Bins
Represented (%)
Distribution Error Over
All Key Visibility Bins (%)
Percentage of Key PM2.5
Bins Represented
(%)
Distribution Error Over
All Key PM2.5 Bins
(%)
2000–2004 95.6 9.7 1.4 – 39.2
2000 100.2 10.1 1.5 – 27.3 100 0.9 100 0.8 2001 86.1 9.3 2.6 – 30.1 100 1.3 100 2.1 2002 93.6 9.6 1.4 – 36.5 100 0.9 100 1.7 2003 96.7 9.8 1.8 – 39.2 100 1.7 100 1.1 2004 92.5 9.6 3.0 – 28.6 100 1.3 100 1.6
(c) Cadiz
Period
Weighted Average
Extinction Coefficient
(Mm-1)
Weighted Average PM2.5
Concentration (μgm-3)
Range in PM2.5 Concentration
(μgm-3)
Percentage of Key
Visibility Bins
Represented (%)
Distribution Error Over
All Key Visibility Bins (%)
Percentage of Key PM2.5
Bins Represented
(%)
Distribution Error Over
All Key PM2.5 Bins
(%)
2000–2004 107.4 11.0 0.6 – 31.3
2000 NA NA NA NA NA NA NA 2001 100.4 10.9 0.6 – 27.1 100 1.7 100 1.6 2002 107.4 11.1 4.1 – 30.2 100 1.1 100 1.0 2003 111.4 11.1 3.0 – 31.1 100 1.3 100 0.5 2004 105.3 11.1 2.2 – 26.5 100 1.1 100 1.5
ICF International 4-8 VISTAS Meteorological Characterization 06-046 December 8, 2006

Characterization of Meteorology and Its Relationships to Fine Particulate Mass and Visibility in the VISTAS Region Meteorological Representativeness and Episode Selection Exercises
(d) Caney Creek
Period
Weighted Average
Extinction Coefficient
(Mm-1)
Weighted Average PM2.5
Concentration (μgm-3)
Range in PM2.5 Concentration
(μgm-3)
Percentage of Key
Visibility Bins
Represented (%)
Distribution Error Over
All Key Visibility Bins (%)
Percentage of Key PM2.5
Bins Represented
(%)
Distribution Error Over
All Key PM2.5 Bins
(%)
2000–2004 83.0 9.0 0.3 – 28.3
2000 85.8 9.0 0.3 – 22.4 100 1.6 100 1.7 2001 79.1 9.3 0.9 – 21.6 100 1.0 100 1.4 2002 92.1 8.9 0.5 – 28.3 100 0.9 100 1.0 2003 87.5 8.8 1.5 – 25.1 100 1.0 100 1.2 2004 80.9 8.6 0.4 – 19.0 100 1.2 100 1.3
(e) Cape Romain
Period
Weighted Average
Extinction Coefficient
(Mm-1)
Weighted Average PM2.5
Concentration (μgm-3)
Range in PM2.5 Concentration
(μgm-3)
Percentage of Key
Visibility Bins
Represented (%)
Distribution Error Over
All Key Visibility Bins (%)
Percentage of Key PM2.5
Bins Represented
(%)
Distribution Error Over
All Key PM2.5 Bins
(%)
2000–2004 82.0 8.6 1.1 – 30.1
2000 90.5 9.4 2.7 – 24.9 100 1.2 100 2.2 2001 77.2 8.6 2.0 – 21.9 100 0.5 100 1.0 2002 79.8 8.0 1.1 – 22.6 100 1.3 100 1.1 2003 74.0 8.0 1.5 – 18.5 100 1.0 100 1.1 2004 88.7 8.7 1.3 – 30.1 100 0.8 100 1.1
(f) Chassahowitzka
Period
Weighted Average
Extinction Coefficient
(Mm-1)
Weighted Average PM2.5
Concentration (μgm-3)
Range in PM2.5 Concentration
(μgm-3)
Percentage of Key
Visibility Bins
Represented (%)
Distribution Error Over
All Key Visibility Bins (%)
Percentage of Key PM2.5
Bins Represented
(%)
Distribution Error Over
All Key PM2.5 Bins
(%)
2000–2004 89.5 8.7 2.1 – 24.7
2000 96.2 8.8 3.3 – 24.7 100 1.7 100 1.9 2001 88.9 8.8 2.1 – 20.7 100 0.7 100 0.6 2002 86.5 8.2 2.5 – 17.7 100 1.1 100 1.6 2003 69.6 7.8 3.4 – 13.4 100 1.7 100 2.2 2004 NA NA NA NA NA NA NA
ICF International 4-9 VISTAS Meteorological Characterization 06-046 December 8, 2006

Characterization of Meteorology and Its Relationships to Fine Particulate Mass and Visibility in the VISTAS Region Meteorological Representativeness and Episode Selection Exercises
(g) Cohutta
Period
Weighted Average
Extinction Coefficient
(Mm-1)
Weighted Average PM2.5
Concentration (μgm-3)
Range in PM2.5 Concentration
(μgm-3)
Percentage of Key
Visibility Bins
Represented (%)
Distribution Error Over
All Key Visibility Bins (%)
Percentage of Key PM2.5
Bins Represented
(%)
Distribution Error Over
All Key PM2.5 Bins
(%)
2000–2004 95.6 10.7 1.2 – 44.4
2000 128.2 12.8 3.9 – 32.7 100 1.7 100 1.4 2001 87.3 9.8 1.8 – 29.6 100 1.0 100 1.0 2002 95.4 10.6 2.2 – 44.4 100 1.2 100 1.3 2003 92.9 10.4 1.2 – 34.3 100 1.2 100 1.5 2004 98.4 10.1 1.9 – 32.4 100 1.5 100 1.3
(h) Dolly Sods
Period
Weighted Average
Extinction Coefficient
(Mm-1)
Weighted Average PM2.5
Concentration (μgm-3)
Range in PM2.5 Concentration
(μgm-3)
Percentage of Key
Visibility Bins
Represented (%)
Distribution Error Over
All Key Visibility Bins (%)
Percentage of Key PM2.5
Bins Represented
(%)
Distribution Error Over
All Key PM2.5 Bins
(%)
2000–2004 86.0 9.4 0.4 – 37.2
2000 89.3 10.4 1.3 – 26.1 100 1.1 100 1.7 2001 82.0 8.9 2.0 – 35.7 100 0.7 100 1.5 2002 79.1 8.7 1.3 – 37.2 100 1.0 100 0.9 2003 91.5 9.8 0.4 – 29.8 100 1.0 100 1.3 2004 80.8 9.9 0.9 – 31.2 100 1.5 100 1.3
(i) Everglades
Period
Weighted Average
Extinction Coefficient
(Mm-1)
Weighted Average PM2.5
Concentration (μgm-3)
Range in PM2.5 Concentration
(μgm-3)
Percentage of Key
Visibility Bins
Represented (%)
Distribution Error Over
All Key Visibility Bins (%)
Percentage of Key PM2.5
Bins Represented
(%)
Distribution Error Over
All Key PM2.5 Bins
(%)
2000–2004 63.4 6.5 1.1 – 34.4
2000 70.5 6.2 1.1 – 24.9 100 2.3 100 2.5 2001 63.1 6.0 1.8 – 17.5 100 1.1 100 1.3 2002 61.8 6.3 1.4 – 23.4 100 1.0 100 1.3 2003 67.6 7.2 1.7 – 24.1 100 1.3 100 1.3 2004 62.0 6.6 2.1 – 34.4 100 1.5 100 1.1
ICF International 4-10 VISTAS Meteorological Characterization 06-046 December 8, 2006

Characterization of Meteorology and Its Relationships to Fine Particulate Mass and Visibility in the VISTAS Region Meteorological Representativeness and Episode Selection Exercises
(j) Great Smoky Mountains
Period
Weighted Average
Extinction Coefficient
(Mm-1)
Weighted Average PM2.5
Concentration (μgm-3)
Range in PM2.5 Concentration
(μgm-3)
Percentage of Key
Visibility Bins
Represented (%)
Distribution Error Over
All Key Visibility Bins (%)
Percentage of Key PM2.5
Bins Represented
(%)
Distribution Error Over
All Key PM2.5 Bins
(%)
2000–2004 85.7 10.1 0.5 – 35.6
2000 92.3 10.5 2.3 – 35.6 100 1.8 100 1.7 2001 82.2 9.8 1.8 – 29.9 100 1.0 100 1.3 2002 78.6 9.8 1.7 – 27.9 100 1.1 100 0.7 2003 86.7 9.9 0.5 – 32.1 100 1.1 100 1.5 2004 86.0 10.3 1.5 – 23.9 100 1.1 100 1.2
(k) James River Face
Period
Weighted Average
Extinction Coefficient
(Mm-1)
Weighted Average PM2.5
Concentration (μgm-3)
Range in PM2.5 Concentration
(μgm-3)
Percentage of Key
Visibility Bins
Represented (%)
Distribution Error Over
All Key Visibility Bins (%)
Percentage of Key PM2.5
Bins Represented
(%)
Distribution Error Over
All Key PM2.5 Bins
(%)
2000–2004 102.1 10.9 0.5 – 31.5
2000 128.5 12.9 4.5 – 26.9 100 1.3 100 1.4 2001 97.1 10.1 2.8 – 28.9 100 1.4 100 0.9 2002 101.0 11.7 3.5 – 31.5 100 1.3 100 1.1 2003 99.6 10.3 0.5 – 29.2 100 1.3 100 1.4 2004 94 10.0 2.4 – 25.9 100 1.0 100 1.0
(l) Linville Gorge
Period
Weighted Average
Extinction Coefficient
(Mm-1)
Weighted Average PM2.5
Concentration (μgm-3)
Range in PM2.5 Concentration
(μgm-3)
Percentage of Key
Visibility Bins
Represented (%)
Distribution Error Over
All Key Visibility Bins (%)
Percentage of Key PM2.5
Bins Represented
(%)
Distribution Error Over
All Key PM2.5 Bins
(%)
2000–2004 80 8.9 0.3 – 29.2
2000 94.2 10.4 1.3 – 29.2 100 1.5 100 1.7 2001 78.1 8.3 15 – 23.8 100 1.1 100 0.9 2002 72.4 8.8 1.6 – 27.1 92.3 1.7 100 1.0 2003 78.8 8.3 0.3 – 27.6 100 1.5 100 1.1 2004 77.0 8.6 1.5 – 21.6 100 1.0 100 0.9
ICF International 4-11 VISTAS Meteorological Characterization 06-046 December 8, 2006

Characterization of Meteorology and Its Relationships to Fine Particulate Mass and Visibility in the VISTAS Region Meteorological Representativeness and Episode Selection Exercises
(m) Mammoth Cave
Period
Weighted Average
Extinction Coefficient
(Mm-1)
Weighted Average PM2.5
Concentration (μgm-3)
Range in PM2.5 Concentration
(μgm-3)
Percentage of Key
Visibility Bins
Represented (%)
Distribution Error Over
All Key Visibility Bins (%)
Percentage of Key PM2.5
Bins Represented
(%)
Distribution Error Over
All Key PM2.5 Bins
(%)
2000–2004 110.0 11.7 2.0 – 44.6
2000 116.5 12.7 4.0 – 44.6 100 1.6 100 2.1 2001 105.7 11.3 2.0 – 28.4 100 1.7 100 1.3 2002 104.1 11.5 3.8 – 34.0 100 0.8 100 1.4 2003 106.2 11.5 3.9 – 32.4 100 1.1 100 1.1 2004 109.5 11.5 2.5 – 27.6 100 1.5 100 2.0
(n) Mingo
Period
Weighted Average
Extinction Coefficient
(Mm-1)
Weighted Average PM2.5
Concentration (μgm-3)
Range in PM2.5 Concentration
(μgm-3)
Percentage of Key
Visibility Bins
Represented (%)
Distribution Error Over
All Key Visibility Bins (%)
Percentage of Key PM2.5
Bins Represented
(%)
Distribution Error Over
All Key PM2.5 Bins
(%)
2000–2004 94.7 11.5 2.4 – 50.0
2000 101.5 12.9 2.6 – 34.5 100 1.8 100 1.2 2001 90.4 11.3 2.4 – 50.0 100 1.1 100 1.2 2002 80.9 9.1 3.1 – 15.4 100 1.2 100 2.4 2003 NA NA NA NA NA NA NA 2004 NA NA NA NA NA NA NA
(o) Okefenokee
Period
Weighted Average
Extinction Coefficient
(Mm-1)
Weighted Average PM2.5
Concentration (μgm-3)
Range in PM2.5 Concentration
(μgm-3)
Percentage of Key
Visibility Bins
Represented (%)
Distribution Error Over
All Key Visibility Bins (%)
Percentage of Key PM2.5
Bins Represented
(%)
Distribution Error Over
All Key PM2.5 Bins
(%)
2000–2004 86.7 9.1 2.2 – 42.9
2000 94.3 9.5 3.5 – 24.8 100 1.5 100 1.9 2001 85.3 9.5 3.0 – 24.9 100 1.3 100 1.1 2002 88.9 9.5 2.9 – 30.1 100 1.0 100 0.7 2003 81.5 8.5 2.2 – 20.4 100 1.0 80 1.2 2004 85.4 9.0 2.8 – 42.9 100 1.2 100 0.9
ICF International 4-12 VISTAS Meteorological Characterization 06-046 December 8, 2006

Characterization of Meteorology and Its Relationships to Fine Particulate Mass and Visibility in the VISTAS Region Meteorological Representativeness and Episode Selection Exercises
(p) Shenandoah
Period
Weighted Average
Extinction Coefficient
(Mm-1)
Weighted Average PM2.5
Concentration (μgm-3)
Range in PM2.5 Concentration
(μgm-3)
Percentage of Key
Visibility Bins
Represented (%)
Distribution Error Over
All Key Visibility Bins (%)
Percentage of Key PM2.5
Bins Represented
(%)
Distribution Error Over
All Key PM2.5 Bins
(%)
2000–2004 95.2 9.3 0.1 – 33.9
2000 96.9 9.3 0.7 – 22.7 100 1.6 100 0.9 2001 99.4 9.5 1.7 – 33.9 100 1.1 100 1.0 2002 99.0 9.6 0.8 – 29.8 100 2.2 100 1.8 2003 95.0 9.3 0.1 – 29.3 100 1.2 100 1.3 2004 89.9 8.7 0.5 – 26.1 100 1.6 100 0.4
(q) Shining Rock
Period
Weighted Average
Extinction Coefficient
(Mm-1)
Weighted Average PM2.5
Concentration (μgm-3)
Range in PM2.5 Concentration
(μgm-3)
Percentage of Key
Visibility Bins
Represented (%)
Distribution Error Over
All Key Visibility Bins (%)
Percentage of Key PM2.5
Bins Represented
(%)
Distribution Error Over
All Key PM2.5 Bins
(%)
2000–2004 75.1 7.8 0.2 – 57.6
2000 85.4 8.3 1.6 – 57.6 100 1.3 100 0.9 2001 74.5 7.8 1.1 – 24.1 100 1.1 100 0.9 2002 65.0 8.1 0.4 – 23.2 100 1.3 100 1.2 2003 84.2 8.4 0.2 – 34.8 100 1.6 100 1.4 2004 65.3 7.0 0.9 – 17.8 100 1.1 100 0.9
(r) Sipsey
Period
Weighted Average
Extinction Coefficient
(Mm-1)
Weighted Average PM2.5
Concentration (μgm-3)
Range in PM2.5 Concentration
(μgm-3)
Percentage of Key
Visibility Bins
Represented (%)
Distribution Error Over
All Key Visibility Bins (%)
Percentage of Key PM2.5
Bins Represented
(%)
Distribution Error Over
All Key PM2.5 Bins
(%)
2000–2004 100.8 11.1 1.6 – 36.3
2000 104.9 11.6 3.9 – 36.3 100 2.0 100 3.1 2001 100.8 10.7 1.6 – 23.0 100 1.1 100 1.5 2002 95.9 10.8 4.4 – 29.0 100 1.2 100 1.2 2003 104.1 11.7 4.0 – 28.6 100 1.0 100 1.0 2004 95.6 10.8 31 – 26.0 100 1.2 100 1.7
ICF International 4-13 VISTAS Meteorological Characterization 06-046 December 8, 2006

Characterization of Meteorology and Its Relationships to Fine Particulate Mass and Visibility in the VISTAS Region Meteorological Representativeness and Episode Selection Exercises
(s) St. Marks
Period
Weighted Average
Extinction Coefficient
(Mm-1)
Weighted Average PM2.5
Concentration (μgm-3)
Range in PM2.5 Concentration
(μgm-3)
Percentage of Key
Visibility Bins
Represented (%)
Distribution Error Over
All Key Visibility Bins (%)
Percentage of Key PM2.5
Bins Represented
(%)
Distribution Error Over
All Key PM2.5 Bins
(%)
2000–2004 77.9 8.5 1.5 – 31.9
2000 88.5 9.0 3.4 – 20.1 100 1.5 100 1.9 2001 78.9 8.2 2.0 – 18.4 100 0.9 100 1.0 2002 79.2 8.1 2.3 – 21.4 100 1.0 100 1.7 2003 81.1 8.3 1.5 – 23.8 91.7 1.0 100 1.9 2004 73.9 9.4 2.8 – 31.9 100 1.4 100 1.3
(t) Swanquarter
Period
Weighted Average
Extinction Coefficient
(Mm-1)
Weighted Average PM2.5
Concentration (μgm-3)
Range in PM2.5 Concentration
(μgm-3)
Percentage of Key
Visibility Bins
Represented (%)
Distribution Error Over
All Key Visibility Bins (%)
Percentage of Key PM2.5
Bins Represented
(%)
Distribution Error Over
All Key PM2.5 Bins
(%)
2000–2004 81.8 7.9 0.6 – 27.0
2000 89.7 8.3 2.2 – 17.6 100 0.6 100 2.4 2001 79.0 7.7 1.8 – 24.9 100 1.3 100 1.9 2002 79.3 8.1 1.8 – 22.2 100 1.3 100 1.9 2003 78.8 7.1 0.6 – 27.0 100 1.1 100 0.9 2004 NA NA NA NA NA NA NA
(u) Upper Buffalo
Period
Weighted Average
Extinction Coefficient
(Mm-1)
Weighted Average PM2.5
Concentration (μgm-3)
Range in PM2.5 Concentration
(μgm-3)
Percentage of Key
Visibility Bins
Represented (%)
Distribution Error Over
All Key Visibility Bins (%)
Percentage of Key PM2.5
Bins Represented
(%)
Distribution Error Over
All Key PM2.5 Bins
(%)
2000–2004 73.4 8.6 0.1 – 30.0
2000 81.0 9.3 1.1 – 30.0 100 1.1 100 1.4 2001 64.8 7.9 0.7 – 20.7 100 0.8 100 1.4 2002 79.2 9.2 1.7 – 27.1 100 1.0 100 1.6 2003 77.8 9.1 0.1 – 25.1 100 1.7 100 1.5 2004 67.0 8.6 0.7 – 23.5 100 1.3 100 1.3
The weighted average is the average of the daily values that are weighted according to the frequency of occurrence of similar conditions for the full period. The weights are based on the CART results, and frequency of occurrence of conditions is based on the number of days in
ICF International 4-14 VISTAS Meteorological Characterization 06-046 December 8, 2006

Characterization of Meteorology and Its Relationships to Fine Particulate Mass and Visibility in the VISTAS Region Meteorological Representativeness and Episode Selection Exercises
each CART bin. Days that have conditions that occur more frequently are given greater weights, while those that occur less frequently are given lesser weights. In this manner, the frequency of occurrence of meteorological conditions is normalized for each year and the average extinction coefficient and PM2.5 values are more likely to reflect other factors such as emissions. Unusually high or low concentrations/extinction for a certain type of conditions (severity) will also affect the average. For many of the sites, the highest extinction and PM2.5 values occur in 2000. Otherwise the values are fairly similar for all years. The range in PM2.5, which is not normalized for meteorology, is also similar for each of the five years.
For all sites, the key bins for both visibility and PM2.5 are represented for all of the years, although there are a few exceptions. This is expected since we are considering full year periods, each of which represents one fifth of the multi-year period that is used to determine the key bins. As we will see later in this report, this metric is more informative when we consider shorter, episodic periods.
The distribution error ranges quantifies how well the frequency distribution of days among the bins matches that for the full baseline period. It has the units of percent since it is the average difference of two percentage values. For all sites, this value ranges from approximately 0.5 to 3 percent. A smaller error indicates a better match. Considering this metric, 2002 does not stand out as being significantly more or less representative than the other years that comprise the baseline period. No one year stands out as being most typical of the period for a majority of the sites. The distribution error over all key visibility bins is lowest for 2002 for Brigantine, Cadiz, Caney Creek, Everglades, Mammoth Cave, and Okefenokee. The results vary by site.
For example, for Cape Romain (Table 4-1e), the weighted extinction and PM2.5 values for 2002 are lower than on average for the full baseline period. The range in PM2.5 is typical of the other baseline years. The distribution error for visibility is slightly larger than for the other years in the period, and that for PM2.5 is about the same as the other years (except for 2000, which is quite a bit higher).
For the GSM site (Table 4-1j), the weighted average extinction coefficient for 2002 is lower than on average for the full baseline period, but the average PM2.5 value is typical of the period. The range in PM2.5 is also typical of the other baseline years. The distribution error for visibility is about the same as the other years (except for 2000, which is quite a bit higher), that for PM2.5 is the lowest among the five years.
For Mammoth Cave (Table 4-1m), the weighted extinction and PM2.5 values for 2002 are representative of the full baseline period, but slightly below the average values for the full period. The year 2000 has some high values, which tend to increase the five-period average. The range in PM2.5 is typical of the other baseline years, with the exception of 2000. The distribution error for visibility is the lowest among all of the years, while that for PM is in the middle.
Considering the entire VISTAS region, it is not expected that any single year will be typical or representative for all areas of the Class I areas of interest. The year 2000 seems to be the least representative year, and 2002 is as good as or better than most of the others for most sites. Knowing how well the 2002 simulation period represents each area may aid the analysis and interpretation of the VISTAS air quality modeling results.
4.2.2. STN Sites Table 4-2 summarizes and compares 2000-2004, and each individual year within this period for the STN sites. The summary metrics included in this table are the weighted average PM2.5
ICF International 4-15 VISTAS Meteorological Characterization 06-046 December 8, 2006

Characterization of Meteorology and Its Relationships to Fine Particulate Mass and Visibility in the VISTAS Region Meteorological Representativeness and Episode Selection Exercises
concentration, range in PM2.5 concentration, percentage of key PM2.5 bins represented (considering all classes), and the relative distribution of days among the key PM2.5 bins for all categories (distribution error).
Table 4-2. Summary of PM2.5 and Meteorological Characteristics for the 2000-2004 Analysis Period: STN Sites.
(a) Birmingham
Period Weighted
Average PM2.5 Concentration
(μgm-3)
Range in PM2.5 Concentration
(μgm-3)
Percentage of Key PM2.5
Bins Represented
(%)
Distribution Error Over All
Key PM2.5 Bins (%)
2000–2004 18.8 0.4 - 71.3 2000 20.1 0.4 - 71.3 100 2.7 2001 18.4 1.0 - 51.5 100 0.8 2002 17.8 4.2 - 47.8 100 1.1 2003 18.0 2.9 - 46.4 90 1.4 2004 18.4 3.6 – 53.3 80 1.6
(b) Charlotte
Period Weighted
Average PM2.5 Concentration
(μgm-3)
Range in PM2.5 Concentration
(μgm-3)
Percentage of Key PM2.5
Bins Represented
(%)
Distribution Error Over All
Key PM2.5 Bins (%)
2000–2004 14.7 2.3 – 45.2 2000 15.4 2.9 – 43.5 100 1.8 2001 14.5 3.8 – 40.3 100 0.9 2002 14.4 3.2 – 45.2 100 1.6 2003 14.2 2.3 – 40.4 90 1.4 2004 14.6 2.6 – 39.8 100 1.3
(c) Chattanooga
Period Weighted
Average PM2.5 Concentration
(μgm-3)
Range in PM2.5 Concentration
(μgm-3)
Percentage of Key PM2.5
Bins Represented
(%)
Distribution Error Over All
Key PM2.5 Bins (%)
2000–2004 15.6 2.5 – 48.6 2000 16.0 4.8 – 48.6 100 2.3 2001 15.8 2.5 – 47.5 100 1.6 2002 14.5 4.2 – 31.3 100 1.1 2003 15.4 3.0 – 41.4 90 1.6 2004 14.8 3.1 – 31.3 100 1.1
ICF International 4-16 VISTAS Meteorological Characterization 06-046 December 8, 2006
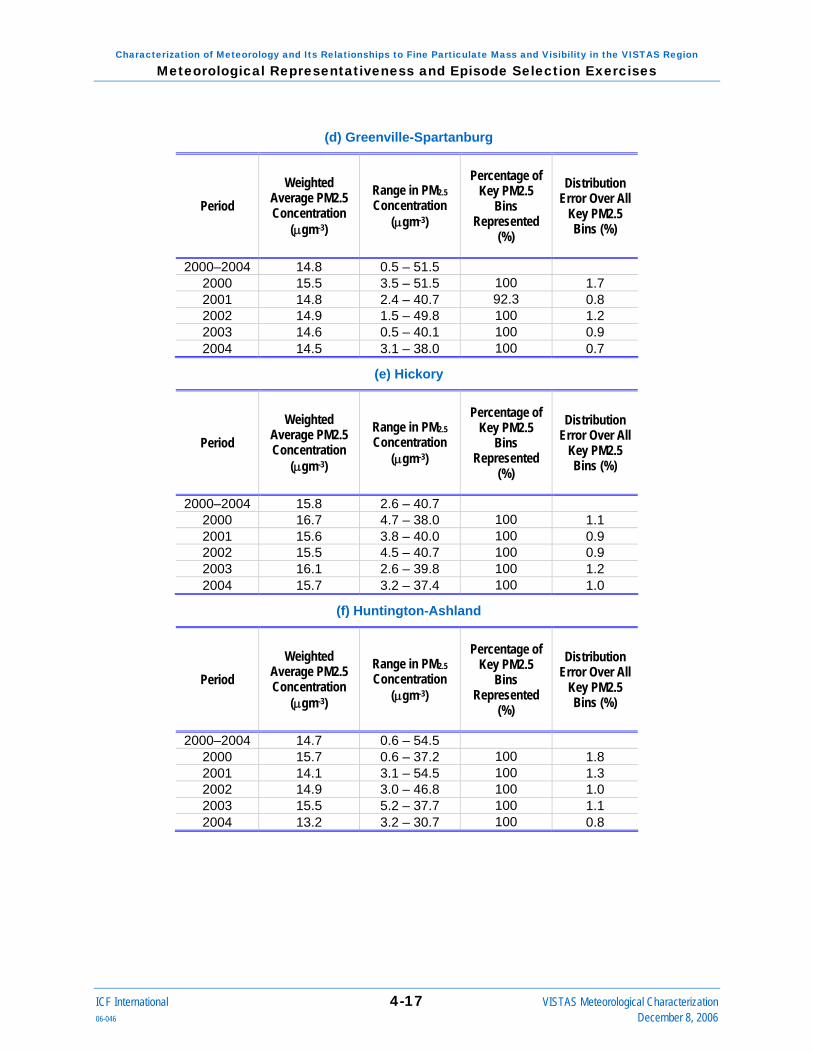
Characterization of Meteorology and Its Relationships to Fine Particulate Mass and Visibility in the VISTAS Region Meteorological Representativeness and Episode Selection Exercises
(d) Greenville-Spartanburg
Period Weighted
Average PM2.5 Concentration
(μgm-3)
Range in PM2.5 Concentration
(μgm-3)
Percentage of Key PM2.5
Bins Represented
(%)
Distribution Error Over All
Key PM2.5 Bins (%)
2000–2004 14.8 0.5 – 51.5 2000 15.5 3.5 – 51.5 100 1.7 2001 14.8 2.4 – 40.7 92.3 0.8 2002 14.9 1.5 – 49.8 100 1.2 2003 14.6 0.5 – 40.1 100 0.9 2004 14.5 3.1 – 38.0 100 0.7
(e) Hickory
Period Weighted
Average PM2.5 Concentration
(μgm-3)
Range in PM2.5 Concentration
(μgm-3)
Percentage of Key PM2.5
Bins Represented
(%)
Distribution Error Over All
Key PM2.5 Bins (%)
2000–2004 15.8 2.6 – 40.7 2000 16.7 4.7 – 38.0 100 1.1 2001 15.6 3.8 – 40.0 100 0.9 2002 15.5 4.5 – 40.7 100 0.9 2003 16.1 2.6 – 39.8 100 1.2 2004 15.7 3.2 – 37.4 100 1.0
(f) Huntington-Ashland
Period Weighted
Average PM2.5 Concentration
(μgm-3)
Range in PM2.5 Concentration
(μgm-3)
Percentage of Key PM2.5
Bins Represented
(%)
Distribution Error Over All
Key PM2.5 Bins (%)
2000–2004 14.7 0.6 – 54.5 2000 15.7 0.6 – 37.2 100 1.8 2001 14.1 3.1 – 54.5 100 1.3 2002 14.9 3.0 – 46.8 100 1.0 2003 15.5 5.2 – 37.7 100 1.1 2004 13.2 3.2 – 30.7 100 0.8
ICF International 4-17 VISTAS Meteorological Characterization 06-046 December 8, 2006

Characterization of Meteorology and Its Relationships to Fine Particulate Mass and Visibility in the VISTAS Region Meteorological Representativeness and Episode Selection Exercises
(g) Jackson
Period Weighted
Average PM2.5 Concentration
(μgm-3)
Range in PM2.5 Concentration
(μgm-3)
Percentage of Key PM2.5
Bins Represented
(%)
Distribution Error Over All
Key PM2.5 Bins (%)
2000–2004 13.7 1.8 – 45.3 2000 14.0 3.2 – 41.4 100 1.1 2001 13.3 1.8 – 40.3 100 1.5 2002 13.0 1.8 – 45.3 100 2.0 2003 13.5 4.5 – 31.5 100 0.7 2004 13.6 2.3 – 33.6 100 2.0
(h) Kingsport-Bristol
Period Weighted
Average PM2.5 Concentration
(μgm-3)
Range in PM2.5 Concentration
(μgm-3)
Percentage of Key PM2.5
Bins Represented
(%)
Distribution Error Over All
Key PM2.5 Bins (%)
2000–2004 14.8 1.9 – 49.2 2000 15.8 4.3 – 43.0 100 1.8 2001 14.6 3.2 – 45.7 100 1.4 2002 14.0 2.6 – 37.5 100 0.8 2003 14.3 1.9 – 49.2 100 1.5 2004 14.2 3.8 – 37.7 100 1.5
(i) Louisville
Period Weighted
Average PM2.5 Concentration
(μgm-3)
Range in PM2.5 Concentration
(μgm-3)
Percentage of Key PM2.5
Bins Represented
(%)
Distribution Error Over All
Key PM2.5 Bins (%)
2000–2004 17.1 3.3 – 100.6 2000 17.4 3.5 – 54.7 100 1.5 2001 17.3 100 3.5 – 53.2 0.9 2002 17.7 4.1 – 100.6 100 1.0 2003 3.5 – 55.7 91.7 0.9 16.4 2004 15.9 3.3 – 45.8 75 1.2
ICF International 4-18 VISTAS Meteorological Characterization 06-046 December 8, 2006

Characterization of Meteorology and Its Relationships to Fine Particulate Mass and Visibility in the VISTAS Region Meteorological Representativeness and Episode Selection Exercises
(j) Macon
Period Weighted
Average PM2.5 Concentration
(μgm-3)
Range in PM2.5 Concentration
(μgm-3)
Percentage of Key PM2.5
Bins Represented
(%)
Distribution Error Over All
Key PM2.5 Bins (%)
2000–2004 16.1 1.6 – 56.2 2000 16.8 3.8 – 56.2 100 2.1 2001 15.9 1.6 – 39.7 100 1.4 2002 15.2 4.3 – 41.0 100 1.2 2003 15.2 3.5 – 36.3 100 1.6 2004 16.2 4.0 – 43.8 100 1.7
(k) Memphis
Period Weighted
Average PM2.5 Concentration
(μgm-3)
Range in PM2.5 Concentration
(μgm-3)
Percentage of Key PM2.5
Bins Represented
(%)
Distribution Error Over All
Key PM2.5 Bins (%)
2000–2004 14.2 1.1 – 50.0 2000 15.2 1.1 – 50.0 100 1.6 2001 13.8 2.7 – 41.3 100 0.9 2002 13.8 3.6 – 49.4 91.7 0.8 2003 14.0 3.2 – 38.0 100 0.7 2004 13.8 3.1 – 38.2 91.7 1.6
(l) Montgomery
Period Weighted
Average PM2.5 Concentration
(μgm-3)
Range in PM2.5 Concentration
(μgm-3)
Percentage of Key PM2.5
Bins Represented
(%)
Distribution Error Over All
Key PM2.5 Bins (%)
2000–2004 14.7 0.4 – 52.1 2000 16.1 0.4 – 52.1 100 2.4 2001 13.7 0.6 – 38.8 100 1.4 2002 14.9 3.5 – 39.4 100 0.7 2003 14.2 5.1 – 42.8 90 1.3 2004 14.4 5.3 – 45.0 100 1.8
ICF International 4-19 VISTAS Meteorological Characterization 06-046 December 8, 2006
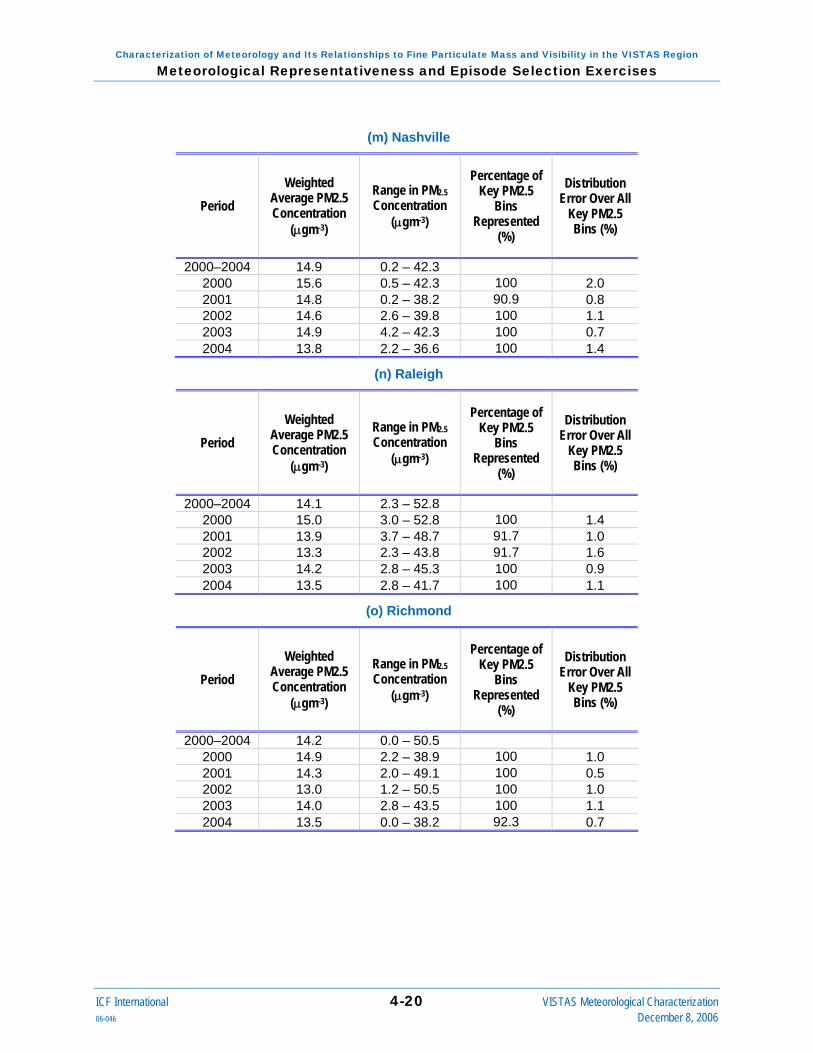
Characterization of Meteorology and Its Relationships to Fine Particulate Mass and Visibility in the VISTAS Region Meteorological Representativeness and Episode Selection Exercises
(m) Nashville
Period Weighted
Average PM2.5 Concentration
(μgm-3)
Range in PM2.5 Concentration
(μgm-3)
Percentage of Key PM2.5
Bins Represented
(%)
Distribution Error Over All
Key PM2.5 Bins (%)
2000–2004 14.9 0.2 – 42.3 2000 15.6 0.5 – 42.3 100 2.0 2001 14.8 0.2 – 38.2 90.9 0.8 2002 14.6 2.6 – 39.8 100 1.1 2003 14.9 4.2 – 42.3 100 0.7 2004 13.8 2.2 – 36.6 100 1.4
(n) Raleigh
Period Weighted
Average PM2.5 Concentration
(μgm-3)
Range in PM2.5 Concentration
(μgm-3)
Percentage of Key PM2.5
Bins Represented
(%)
Distribution Error Over All
Key PM2.5 Bins (%)
2000–2004 14.1 2.3 – 52.8 2000 15.0 3.0 – 52.8 100 1.4 2001 13.9 3.7 – 48.7 91.7 1.0 2002 13.3 2.3 – 43.8 91.7 1.6 2003 14.2 2.8 – 45.3 100 0.9 2004 13.5 2.8 – 41.7 100 1.1
(o) Richmond
Period Weighted
Average PM2.5 Concentration
(μgm-3)
Range in PM2.5 Concentration
(μgm-3)
Percentage of Key PM2.5
Bins Represented
(%)
Distribution Error Over All
Key PM2.5 Bins (%)
2000–2004 14.2 0.0 – 50.5 2000 14.9 2.2 – 38.9 100 1.0 2001 14.3 2.0 – 49.1 100 0.5 2002 13.0 1.2 – 50.5 100 1.0 2003 14.0 2.8 – 43.5 100 1.1 2004 13.5 0.0 – 38.2 92.3 0.7
ICF International 4-20 VISTAS Meteorological Characterization 06-046 December 8, 2006

Characterization of Meteorology and Its Relationships to Fine Particulate Mass and Visibility in the VISTAS Region Meteorological Representativeness and Episode Selection Exercises
(p) Savannah
Period Weighted
Average PM2.5 Concentration
(μgm-3)
Range in PM2.5 Concentration
(μgm-3)
Percentage of Key PM2.5
Bins Represented
(%)
Distribution Error Over All
Key PM2.5 Bins (%)
2000–2004 14.0 3.2 – 55.3 2000 14.7 4.7 – 44.5 100 2.3 2001 14.9 3.2 – 55.3 100 1.4 2002 12.8 3.9 – 30.1 100 1.5 2003 13.5 4.1 – 49.6 88.9 0.6 2004 13.4 4.7 – 40.2 100 2.1
The weighted average PM2.5 values tend to be highest for 2000. Otherwise the values are fairly similar for all years, with some variations. The range in PM2.5, which is not normalized for meteorology, is also similar for each of the five years. Figure 4-6 shows the year by year tendencies in weighted average PM2.5 and daily maximum 24-hour average PM2.5, for each of the STN sites. For most sites, there is no apparent trend, especially for the meteorologically adjusted (weighted average) values. This indicates that PM2.5 concentrations in the urban areas have neither increased nor decreased during the five-year period.
ICF International 4-21 VISTAS Meteorological Characterization 06-046 December 8, 2006

Characterization of Meteorology and Its Relationships to Fine Particulate Mass and Visibility in the VISTAS Region Meteorological Representativeness and Episode Selection Exercises
Figure 4-6. Year-by-Year Tendencies in Weighted Average PM2.5 and Daily Maximum 24-hour Average PM2.5
(a) Birmingham
Weighted Average PM2.5: Birmingham
0
5
10
15
20
25
2000 2001 2002 2003 2004
ugm
-3
Daily Maximum PM2.5: Birmingham
0
20
40
60
80
2000 2001 2002 2003 2004
ugm
-3
ICF International 4-22 VISTAS Meteorological Characterization 06-046 December 8, 2006

Characterization of Meteorology and Its Relationships to Fine Particulate Mass and Visibility in the VISTAS Region Meteorological Representativeness and Episode Selection Exercises
(b) Charlotte
Weighted Average PM2.5: Charlotte
0
5
10
15
20
25
2000 2001 2002 2003 2004
ugm
-3
Daily Maximum PM2.5: Charlotte
0
20
40
60
80
2000 2001 2002 2003 2004
ugm
-3
ICF International 4-23 VISTAS Meteorological Characterization 06-046 December 8, 2006

Characterization of Meteorology and Its Relationships to Fine Particulate Mass and Visibility in the VISTAS Region Meteorological Representativeness and Episode Selection Exercises
(c) Chattanooga
Weighted Average PM2.5: Chattanooga
0
5
10
15
20
25
2000 2001 2002 2003 2004
ugm
-3
Daily Maximum PM2.5: Chattanooga
0
20
40
60
80
2000 2001 2002 2003 2004
ugm
-3
ICF International 4-24 VISTAS Meteorological Characterization 06-046 December 8, 2006

Characterization of Meteorology and Its Relationships to Fine Particulate Mass and Visibility in the VISTAS Region Meteorological Representativeness and Episode Selection Exercises
(d) Greenville-Spartanburg
Weighted Average PM2.5: Greenville-Spartanburg
0
5
10
15
20
25
2000 2001 2002 2003 2004
ugm
-3
Daily Maximum PM2.5: Greenville-Spartanburg
0
20
40
60
80
2000 2001 2002 2003 2004
ugm
-3
ICF International 4-25 VISTAS Meteorological Characterization 06-046 December 8, 2006

Characterization of Meteorology and Its Relationships to Fine Particulate Mass and Visibility in the VISTAS Region Meteorological Representativeness and Episode Selection Exercises
(e) Hickory
Weighted Average PM2.5: Hickory
0
5
10
15
20
25
2000 2001 2002 2003 2004
ugm
-3
Daily Maximum PM2.5: Hickory
0
20
40
60
80
2000 2001 2002 2003 2004
ugm
-3
ICF International 4-26 VISTAS Meteorological Characterization 06-046 December 8, 2006

Characterization of Meteorology and Its Relationships to Fine Particulate Mass and Visibility in the VISTAS Region Meteorological Representativeness and Episode Selection Exercises
(f) Huntington-Ashland
Weighted Average PM2.5: Huntington-Ashland
0
5
10
15
20
25
2000 2001 2002 2003 2004
ugm
-3
Daily Maximum PM2.5: Huntington-Ashland
0
20
40
60
80
2000 2001 2002 2003 2004
ugm
-3
ICF International 4-27 VISTAS Meteorological Characterization 06-046 December 8, 2006

Characterization of Meteorology and Its Relationships to Fine Particulate Mass and Visibility in the VISTAS Region Meteorological Representativeness and Episode Selection Exercises
(g) Jackson
Weighted Average PM2.5: Jackson
0
5
10
15
20
25
2000 2001 2002 2003 2004
ugm
-3
Daily Maximum PM2.5: Jackson
0
20
40
60
80
2000 2001 2002 2003 2004
ugm
-3
ICF International 4-28 VISTAS Meteorological Characterization 06-046 December 8, 2006

Characterization of Meteorology and Its Relationships to Fine Particulate Mass and Visibility in the VISTAS Region Meteorological Representativeness and Episode Selection Exercises
(h) Kingsport
Weighted Average PM2.5: Kingsport-Bristol
0
5
10
15
20
25
2000 2001 2002 2003 2004
ugm
-3
Daily Maximum PM2.5: Kingsport-Bristol
0
20
40
60
80
2000 2001 2002 2003 2004
ugm
-3
ICF International 4-29 VISTAS Meteorological Characterization 06-046 December 8, 2006
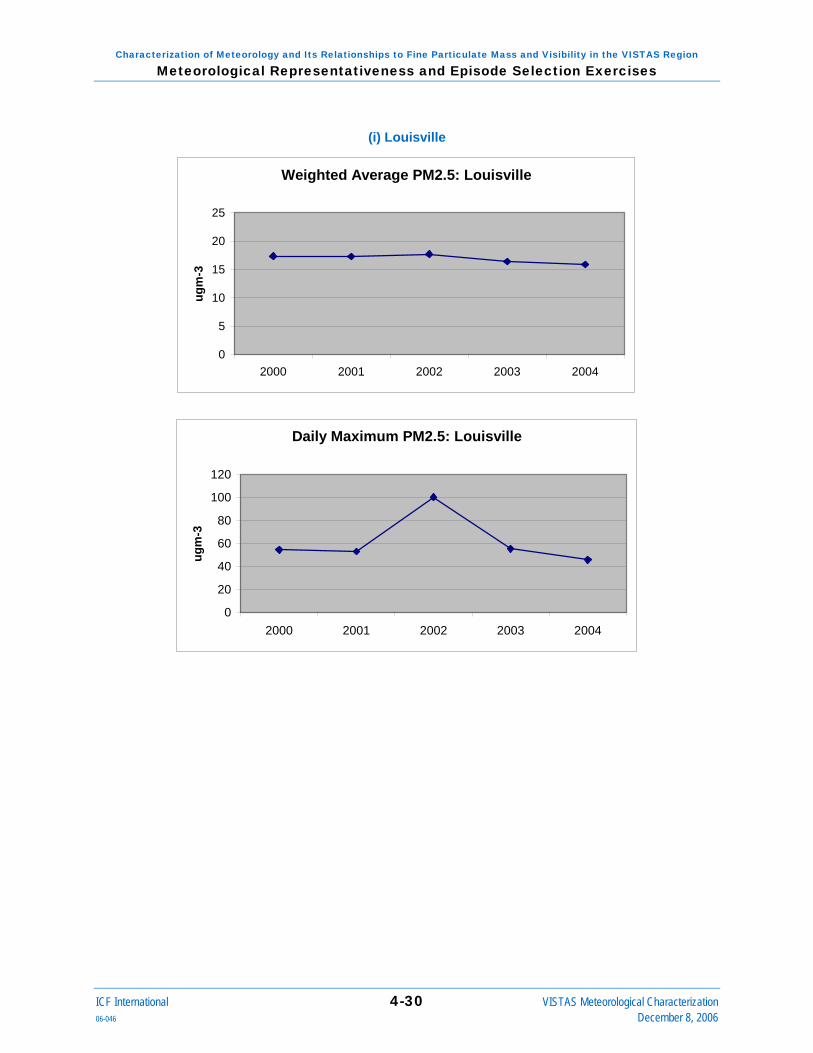
Characterization of Meteorology and Its Relationships to Fine Particulate Mass and Visibility in the VISTAS Region Meteorological Representativeness and Episode Selection Exercises
(i) Louisville
Weighted Average PM2.5: Louisville
0
5
10
15
20
25
2000 2001 2002 2003 2004
ugm
-3
Daily Maximum PM2.5: Louisville
0
20
40
60
80
100
120
2000 2001 2002 2003 2004
ugm
-3
ICF International 4-30 VISTAS Meteorological Characterization 06-046 December 8, 2006

Characterization of Meteorology and Its Relationships to Fine Particulate Mass and Visibility in the VISTAS Region Meteorological Representativeness and Episode Selection Exercises
(j) Macon
Weighted Average PM2.5: Macon
0
5
10
15
20
25
2000 2001 2002 2003 2004
ugm
-3
Daily Maximum PM2.5: Macon
0
20
40
60
80
2000 2001 2002 2003 2004
ugm
-3
ICF International 4-31 VISTAS Meteorological Characterization 06-046 December 8, 2006

Characterization of Meteorology and Its Relationships to Fine Particulate Mass and Visibility in the VISTAS Region Meteorological Representativeness and Episode Selection Exercises
(k) Memphis
Weighted Average PM2.5: Memphis
0
5
10
15
20
25
2000 2001 2002 2003 2004
ugm
-3
Daily Maximum PM2.5: Memphis
0
20
40
60
80
2000 2001 2002 2003 2004
ugm
-3
ICF International 4-32 VISTAS Meteorological Characterization 06-046 December 8, 2006
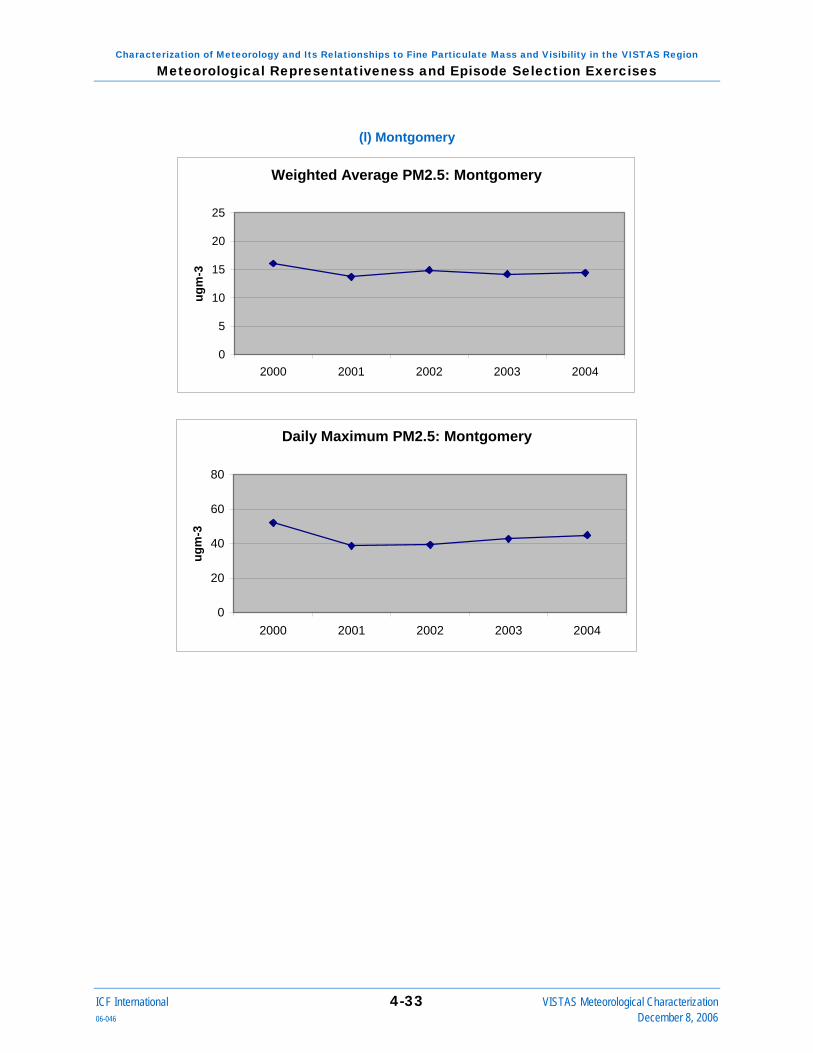
Characterization of Meteorology and Its Relationships to Fine Particulate Mass and Visibility in the VISTAS Region Meteorological Representativeness and Episode Selection Exercises
(l) Montgomery
Weighted Average PM2.5: Montgomery
0
5
10
15
20
25
2000 2001 2002 2003 2004
ugm
-3
Daily Maximum PM2.5: Montgomery
0
20
40
60
80
2000 2001 2002 2003 2004
ugm
-3
ICF International 4-33 VISTAS Meteorological Characterization 06-046 December 8, 2006

Characterization of Meteorology and Its Relationships to Fine Particulate Mass and Visibility in the VISTAS Region Meteorological Representativeness and Episode Selection Exercises
(m) Nashville
Weighted Average PM2.5: Nashville
0
5
10
15
20
25
2000 2001 2002 2003 2004
ugm
-3
Daily Maximum PM2.5: Nashville
0
20
40
60
80
2000 2001 2002 2003 2004
ugm
-3
ICF International 4-34 VISTAS Meteorological Characterization 06-046 December 8, 2006

Characterization of Meteorology and Its Relationships to Fine Particulate Mass and Visibility in the VISTAS Region Meteorological Representativeness and Episode Selection Exercises
(n) Raleigh
Weighted Average PM2.5: Raleigh
0
5
10
15
20
25
2000 2001 2002 2003 2004
ugm
-3
Daily Maximum PM2.5: Raleigh
0
20
40
60
80
2000 2001 2002 2003 2004
ugm
-3
ICF International 4-35 VISTAS Meteorological Characterization 06-046 December 8, 2006

Characterization of Meteorology and Its Relationships to Fine Particulate Mass and Visibility in the VISTAS Region Meteorological Representativeness and Episode Selection Exercises
(o) Richmond
Weighted Average PM2.5: Richmond
0
5
10
15
20
25
2000 2001 2002 2003 2004
ugm
-3
Daily Maximum PM2.5: Richmond
0
20
40
60
80
2000 2001 2002 2003 2004
ugm
-3
ICF International 4-36 VISTAS Meteorological Characterization 06-046 December 8, 2006

Characterization of Meteorology and Its Relationships to Fine Particulate Mass and Visibility in the VISTAS Region Meteorological Representativeness and Episode Selection Exercises
(p) Savannah
Weighted Average PM2.5: Savannah
0
5
10
15
20
25
2000 2001 2002 2003 2004
ugm
-3
Daily Maximum PM2.5: Savannah
0
20
40
60
80
2000 2001 2002 2003 2004
ugm
-3
With few exceptions, the key bins for PM2.5 are represented for all of the years. Again, this is expected since we are considering full year periods, each of which represents one fifth of the multi-year period that is used to determine the key bins.
The distribution error ranges from approximately 0.5 to 2.5 and quantifies how well the frequency distribution of days among the bins matches that for the full baseline period. No one year stands out as being most typical of the period for a majority of the sites. The distribution error over all key bins is lowest for 2002 for Chattanooga, Hickory, Kingsport-Bristol, Macon, and Montgomery, and close to the lowest for several other sites. Overall, 2000 is the year with the least representative distribution. As for the IMPROVE sites, the results vary by site.
For example, for Charlotte (Table 4-2b), the weighted PM2.5 value for 2002 is close to the average for the full baseline period. The maximum concentration occurred during this year, but the range in PM2.5 is typical of the other baseline years. The distribution error is slightly larger than for the other years in the period, except for 2000. The year 2001 appears to be the most typical year.
ICF International 4-37 VISTAS Meteorological Characterization 06-046 December 8, 2006

Characterization of Meteorology and Its Relationships to Fine Particulate Mass and Visibility in the VISTAS Region Meteorological Representativeness and Episode Selection Exercises
For Chattanooga (Table 4-2c), the weighted average PM2.5 value for 2002 is lower than the average for the full baseline period and the lower values are also reflected in the range. Nevertheless, the frequency of conditions was normal and the distribution error is the lowest overall (along with that for 2004).
For Louisville (Table 4-2i), the weighted average PM2.5 value for 2002 is slightly higher than the average for the full baseline period and the range indicates that there was at least one very high daily value (greater than 100 μgm-3) recorded during 2002. The distribution error is among the lowest, indicating a typical frequency of meteorological scenarios.
For Macon (Table 4-2j), the weighted average PM2.5 value for 2002 is lower than the average for the full baseline period and the range is similar to that for the other years with the exception of 2002. The distribution error is the lowest, over all the years considered.
For the urban areas, the year 2000 seems to be the least representative year, and 2002 is as good as or better than most of the others for most sites. Consequently, 2002 is a representative year for most sites, but the specific implications of using 2002 as the model baseline year vary by site.
4.2.3. SEARCH Sites Table 4-3 summarizes and compares 2000–2004, and each individual year within this period for the SEARCH sites. The summary metrics included in this table are the weighted average PM2.5 concentration, range in PM2.5 concentration, percentage of key PM2.5 bins represented (considering all classes), and the relative distribution of days among the key PM2.5 bins for all categories (distribution error).
Table 4-3. Summary of PM2.5 and Meteorological Characteristics for the 2000-2004 Analysis Period: SEARCH Sites.
(a) Atlanta (Jefferson St.)
Period Weighted
Average PM2.5 Concentration
(μgm-3)
Range in PM2.5 Concentration
(μgm-3)
Percentage of Key PM2.5
Bins Represented
(%)
Distribution Error Over All
Key PM2.5 Bins (%)
2000–2004 16.6 1.1 – 66.1 2000 16.9 3.7 – 62.6 100 1.8 2001 16.4 2.2 – 66.1 100 0.9 2002 16.3 3.7 – 40.2 91.7 0.8 2003 16.2 1.5 – 47.0 100 1.0 2004 16.8 1.1 – 49.5 100 1.7
ICF International 4-38 VISTAS Meteorological Characterization 06-046 December 8, 2006

Characterization of Meteorology and Its Relationships to Fine Particulate Mass and Visibility in the VISTAS Region Meteorological Representativeness and Episode Selection Exercises
(b) Yorkville
Period Weighted
Average PM2.5 Concentration
(μgm-3)
Range in PM2.5 Concentration
(μgm-3)
Percentage of Key PM2.5
Bins Represented
(%)
Distribution Error Over All
Key PM2.5 Bins (%)
2000–2004 13.6 0.7 – 65.2 2000 14.5 2.3 – 65.2 100 1.5 2001 13.2 2.5 – 54.4 100 0.7 2002 13.2 2.6 – 34.8 100 0.6 2003 12.0 2.2 – 43.0 91.7 1.0 2004 13.4 0.7 – 39.5 91.7 0.4
(c) Birmingham
Period Weighted
Average PM2.5 Concentration
(μgm-3)
Range in PM2.5 Concentration
(μgm-3)
Percentage of Key PM2.5
Bins Represented
(%)
Distribution Error Over All
Key PM2.5 Bins (%)
2000–2004 17.9 2.8 – 75.2 2000 18.3 3.8 – 66.4 100 2.3 2001 17.2 3.3 – 48.9 100 1.1 2002 17.5 3.9 – 45.3 100 0.9 2003 16.8 2.8 – 45.0 90.9 1.4 2004 18.0 3.2 – 75.2 100 1.4
(d) Centreville
Period Weighted
Average PM2.5 Concentration
(μgm-3)
Range in PM2.5 Concentration
(μgm-3)
Percentage of Key PM2.5
Bins Represented
(%)
Distribution Error Over All
Key PM2.5 Bins (%)
2000–2004 12.9 1.2 – 54.4 2000 13.3 3.0 – 54.4 100 2.1 2001 12.4 1.2 – 34.9 100 0.9 2002 13.1 2.9 – 48.6 91.7 1.4 2003 12.3 1.8 – 39.5 91.7 0.6 2004 12.8 2.6 – 40.8 91.7 0.8
ICF International 4-39 VISTAS Meteorological Characterization 06-046 December 8, 2006

Characterization of Meteorology and Its Relationships to Fine Particulate Mass and Visibility in the VISTAS Region Meteorological Representativeness and Episode Selection Exercises
(e) Pensacola
Period Weighted
Average PM2.5 Concentration
(μgm-3)
Range in PM2.5 Concentration
(μgm-3)
Percentage of Key PM2.5
Bins Represented
(%)
Distribution Error Over All
Key PM2.5 Bins (%)
2000–2004 12.8 1.2 – 52.5 2000 12.6 3.4 – 45.5 100 2.0 2001 13.1 2.6 – 52.5 100 0.9 2002 13.2 3.3 – 40.7 100 1.4 2003 12.5 1.6 – 41.7 90.9 1.1 2004 12.4 1.2 – 40.7 100 0.9
(f) Outlying Landing Field
Period Weighted
Average PM2.5 Concentration
(μgm-3)
Range in PM2.5 Concentration
(μgm-3)
Percentage of Key PM2.5
Bins Represented
(%)
Distribution Error Over All
Key PM2.5 Bins (%)
2000–2004 11.8 0.7 – 130.9 2000 12.4 0.7 – 130.9 100 2.6 2001 11.1 2.4 – 32.9 100 1.1 2002 11.3 2.3 – 38.3 100 1.8 2003 11.5 2.2 – 32.6 100 1.7 2004 11.7 2.3 – 44.8 100 1.6
(g) Gulfport
Period Weighted
Average PM2.5 Concentration
(μgm-3)
Range in PM2.5 Concentration
(μgm-3)
Percentage of Key PM2.5
Bins Represented
(%)
Distribution Error Over All
Key PM2.5 Bins (%)
2000–2004 11.4 0.3 – 44.0 2000 11.0 0.3 – 44.0 100 1.4 2001 11.4 2.3 – 41.4 100 1.2 2002 11.4 2.8 – 31.9 100 1.3 2003 11.6 2.7 – 30.1 100 0.6 2004 11.5 1.6 – 43.5 100 1.6
ICF International 4-40 VISTAS Meteorological Characterization 06-046 December 8, 2006

Characterization of Meteorology and Its Relationships to Fine Particulate Mass and Visibility in the VISTAS Region Meteorological Representativeness and Episode Selection Exercises
(h) Oak Grove
Period Weighted
Average PM2.5 Concentration
(μgm-3)
Range in PM2.5 Concentration
(μgm-3)
Percentage of Key PM2.5
Bins Represented
(%)
Distribution Error Over All
Key PM2.5 Bins (%)
2000–2004 11.8 1.5 – 90.1 2000 11.9 2.5 – 41.4 100 2.2 2001 11.8 2.3 – 90.1 100 0.7 2002 11.4 2.2 – 67.1 100 1.3 2003 11.5 1.5 – 43.9 100 0.8 2004 11.6 2.2 – 37.2 100 0.6
For the inland sites the weighted average PM2.5 values tend to be highest for 2000, lower for 2001-2003, and then high again for 2004. For the coastal sites, the values are fairly similar for all years, with some variations. The range in PM2.5 indicates that the highest values were recorded early during the five-year period. Figure 4-7 shows the year by year tendencies in weighted average PM2.5 and daily maximum 24-hour average PM2.5 for each of the SEARCH sites. For most sites, there is no apparent trend in the meteorologically adjusted (weighted average) values. The maximum values follow the tendency described above.
ICF International 4-41 VISTAS Meteorological Characterization 06-046 December 8, 2006

Characterization of Meteorology and Its Relationships to Fine Particulate Mass and Visibility in the VISTAS Region Meteorological Representativeness and Episode Selection Exercises
Figure 4-7. Year-by-Year Tendencies in Weighted Average PM2.5 and Daily Maximum 24-hour Average PM2.5 for Each of the SEARCH Sites.
(a) Atlanta
Weighted Average PM2.5: Atlanta
0
5
10
15
20
25
2000 2001 2002 2003 2004
ugm
-3
Daily Maximum PM2.5: Atlanta
0
20
40
60
80
2000 2001 2002 2003 2004
ugm
-3
ICF International 4-42 VISTAS Meteorological Characterization 06-046 December 8, 2006

Characterization of Meteorology and Its Relationships to Fine Particulate Mass and Visibility in the VISTAS Region Meteorological Representativeness and Episode Selection Exercises
(b) Yorkville
Weighted Average PM2.5: Yorkville
0
5
10
15
20
25
2000 2001 2002 2003 2004
ugm
-3
Daily Maximum PM2.5: Yorkville
0
20
40
60
80
2000 2001 2002 2003 2004
ugm
-3
ICF International 4-43 VISTAS Meteorological Characterization 06-046 December 8, 2006

Characterization of Meteorology and Its Relationships to Fine Particulate Mass and Visibility in the VISTAS Region Meteorological Representativeness and Episode Selection Exercises
(c) Birmingham
Weighted Average PM2.5: Birmingham
0
5
10
15
20
25
2000 2001 2002 2003 2004
ugm
-3
Daily Maximum PM2.5: Birmingham
0
20
40
60
80
2000 2001 2002 2003 2004
ugm
-3
ICF International 4-44 VISTAS Meteorological Characterization 06-046 December 8, 2006

Characterization of Meteorology and Its Relationships to Fine Particulate Mass and Visibility in the VISTAS Region Meteorological Representativeness and Episode Selection Exercises
(d) Centreville
Weighted Average PM2.5: Centreville
0
5
10
15
20
25
2000 2001 2002 2003 2004
ugm
-3
Daily Maximum PM2.5: Centreville
0
20
40
60
80
2000 2001 2002 2003 2004
ugm
-3
ICF International 4-45 VISTAS Meteorological Characterization 06-046 December 8, 2006

Characterization of Meteorology and Its Relationships to Fine Particulate Mass and Visibility in the VISTAS Region Meteorological Representativeness and Episode Selection Exercises
(e) Pensacola
Weighted Average PM2.5: Pensacola
0
5
10
15
20
25
2000 2001 2002 2003 2004
ugm
-3
Daily Maximum PM2.5: Pensacola
0
20
40
60
80
2000 2001 2002 2003 2004
ugm
-3
ICF International 4-46 VISTAS Meteorological Characterization 06-046 December 8, 2006

Characterization of Meteorology and Its Relationships to Fine Particulate Mass and Visibility in the VISTAS Region Meteorological Representativeness and Episode Selection Exercises
(f) OLF
Weighted Average PM2.5: OLF
0
5
10
15
20
25
2000 2001 2002 2003 2004
ugm
-3
Daily Maximum PM2.5: OLF
020406080
100120140
2000 2001 2002 2003 2004
ugm
-3
ICF International 4-47 VISTAS Meteorological Characterization 06-046 December 8, 2006

Characterization of Meteorology and Its Relationships to Fine Particulate Mass and Visibility in the VISTAS Region Meteorological Representativeness and Episode Selection Exercises
(g) Gulfport
Weighted Average PM2.5: Gulfport
0
5
10
15
20
25
2000 2001 2002 2003 2004
ugm
-3
Daily Maximum PM2.5: Gulfport
0
20
40
60
80
2000 2001 2002 2003 2004
ugm
-3
ICF International 4-48 VISTAS Meteorological Characterization 06-046 December 8, 2006

Characterization of Meteorology and Its Relationships to Fine Particulate Mass and Visibility in the VISTAS Region Meteorological Representativeness and Episode Selection Exercises
(h) Oak Grove
Weighted Average PM2.5: Oak Grove
0
5
10
15
20
25
2000 2001 2002 2003 2004
ugm
-3
Daily Maximum PM2.5: Oak Grove
0
20
40
60
80
100
120
2000 2001 2002 2003 2004
ugm
-3
With few exceptions, the key bins for PM2.5 are represented for all of the years. The distribution error ranges from approximately 0.5 to 2.5 and quantifies how well the frequency distribution of days among the bins matches that for the full baseline period. The distribution error over all key bins is lowest for 2002 for Atlanta, Yorkville, and Birmingham. Overall, 2000 is the year with the least representative distribution.
For Atlanta (Table 4-3a), the weighted PM2.5 value for 2002 is close to the average for the full baseline period. The range reflects a lower maximum value than for the other years and not all key bins are represented. Nevertheless, the distribution error is the lowest among all years considered.
For Birmingham (Table 4-3c), the weighted average PM2.5 value for 2002 is also close to the average for the full baseline period, and the range is typical for the middle years. The distribution error is the lowest overall.
For the SEARCH sites, 2002 does not include some of the higher values of the other years but other indicators suggest that this is a representative year for the SEARCH sites.
ICF International 4-49 VISTAS Meteorological Characterization 06-046 December 8, 2006

Characterization of Meteorology and Its Relationships to Fine Particulate Mass and Visibility in the VISTAS Region Meteorological Representativeness and Episode Selection Exercises
4.3. Selection Subset Episodes for Model-Based Sensitivity Analysis The CART results were also used in selecting subset periods of 2002 for PM2.5 modeling and sensitivity analysis. The episode selection methods are presented in this section and the key question of “How well do subset modeling periods chosen by VISTAS for emission sensitivity analysis capture the range of relationships between meteorology and air quality for each site of interest and for the VISTAS region?” is examined.
4.3.1. Episode Selection The goal of this exercise was to identify two approximate month-long subset periods of 2002 to represent the conditions and concentration levels associated with high PM2.5 events in as many areas as possible throughout the VISTAS region. The two periods were also to represent both winter and summer types of regimes. The primary focus of this exercise was PM2.5; however, information about ozone was also included in the final stages of the analysis. Because the selected episode periods were potentially to be used for PM2.5 modeling of urban areas, we considered only the results for the STN and SEARCH sites. The episode selection methodology is outlined below.
First we prepared color-coded charts of daily PM2.5 concentrations for each STN and SEARCH site and identified (primarily visually) winter and summer periods with a range of high and low concentrations for as many sites as possible. We also used the episode selection tool to identify periods that sample a range of key conditions for selected groups of areas.
We then input these dates into the CART-based meteorological characterization tool and used the summaries provided by the tool to assess and compare the representativeness of the periods with respect to frequent (key) meteorological conditions, annual average PM2.5 (and ozone) concentrations, and speciation. We considered all of the VISTAS STN and SEARCH areas, but gave more attention to those with the higher PM2.5 design values.
The analysis components included several characterization metrics that focused on how well the weighted annual average and range of PM2.5 concentrations represent these same metrics for the full baseline period, and the degree to which the key PM2.5 bins are represented by the identified periods. We also compared the compositional averages for the identified days with those for the baseline periods. Finally, we examined the range and frequency of occurrence of wind directions at the surface and 850 mb levels relative to a longer period of record.
The winter period was selected first. From three candidate winter periods, the period 19 November–20 December 2002 was selected to best capture the PM2.5 concentrations (especially for the sites with the higher PM2.5 design values) and the key high PM2.5 CART bins. The wind directions for this period also represented the average wintertime distribution slightly better than the other two candidates, for several locations.
Seven candidate summertime periods were then reviewed with respect to representing the summer conditions for the baseline period and complementing the selected wintertime period in representing the annual range of conditions of the baseline period. The summertime period 3 June–10 July 2002 was selected. When this period is combined with the wintertime period, optimum representation of the key bins (for all categories) and the distribution of days among the key bins are achieved. The distribution of wind directions for high PM days is also representative of the longer period. Finally, the period includes high ozone days for the areas
ICF International 4-50 VISTAS Meteorological Characterization 06-046 December 8, 2006
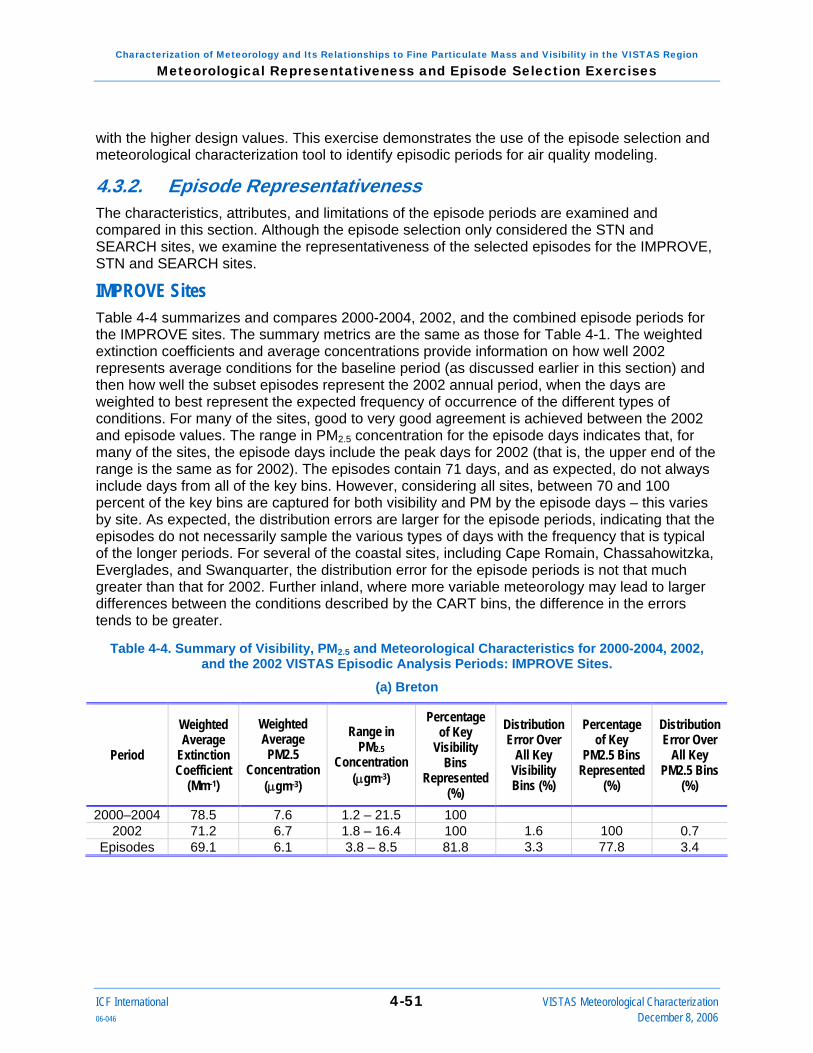
Characterization of Meteorology and Its Relationships to Fine Particulate Mass and Visibility in the VISTAS Region Meteorological Representativeness and Episode Selection Exercises
with the higher design values. This exercise demonstrates the use of the episode selection and meteorological characterization tool to identify episodic periods for air quality modeling.
4.3.2. Episode Representativeness The characteristics, attributes, and limitations of the episode periods are examined and compared in this section. Although the episode selection only considered the STN and SEARCH sites, we examine the representativeness of the selected episodes for the IMPROVE, STN and SEARCH sites.
IMPROVE Sites Table 4-4 summarizes and compares 2000-2004, 2002, and the combined episode periods for the IMPROVE sites. The summary metrics are the same as those for Table 4-1. The weighted extinction coefficients and average concentrations provide information on how well 2002 represents average conditions for the baseline period (as discussed earlier in this section) and then how well the subset episodes represent the 2002 annual period, when the days are weighted to best represent the expected frequency of occurrence of the different types of conditions. For many of the sites, good to very good agreement is achieved between the 2002 and episode values. The range in PM2.5 concentration for the episode days indicates that, for many of the sites, the episode days include the peak days for 2002 (that is, the upper end of the range is the same as for 2002). The episodes contain 71 days, and as expected, do not always include days from all of the key bins. However, considering all sites, between 70 and 100 percent of the key bins are captured for both visibility and PM by the episode days – this varies by site. As expected, the distribution errors are larger for the episode periods, indicating that the episodes do not necessarily sample the various types of days with the frequency that is typical of the longer periods. For several of the coastal sites, including Cape Romain, Chassahowitzka, Everglades, and Swanquarter, the distribution error for the episode periods is not that much greater than that for 2002. Further inland, where more variable meteorology may lead to larger differences between the conditions described by the CART bins, the difference in the errors tends to be greater.
Table 4-4. Summary of Visibility, PM2.5 and Meteorological Characteristics for 2000-2004, 2002, and the 2002 VISTAS Episodic Analysis Periods: IMPROVE Sites.
(a) Breton
Period
Weighted Average
Extinction Coefficient
(Mm-1)
Weighted Average PM2.5
Concentration (μgm-3)
Range in PM2.5
Concentration (μgm-3)
Percentage of Key
Visibility Bins
Represented (%)
Distribution Error Over
All Key Visibility Bins (%)
Percentage of Key
PM2.5 Bins Represented
(%)
Distribution Error Over
All Key PM2.5 Bins
(%)
2000–2004 78.5 7.6 1.2 – 21.5 100 2002 71.2 6.7 1.8 – 16.4 100 1.6 100 0.7
Episodes 69.1 6.1 3.8 – 8.5 81.8 3.3 77.8 3.4
ICF International 4-51 VISTAS Meteorological Characterization 06-046 December 8, 2006
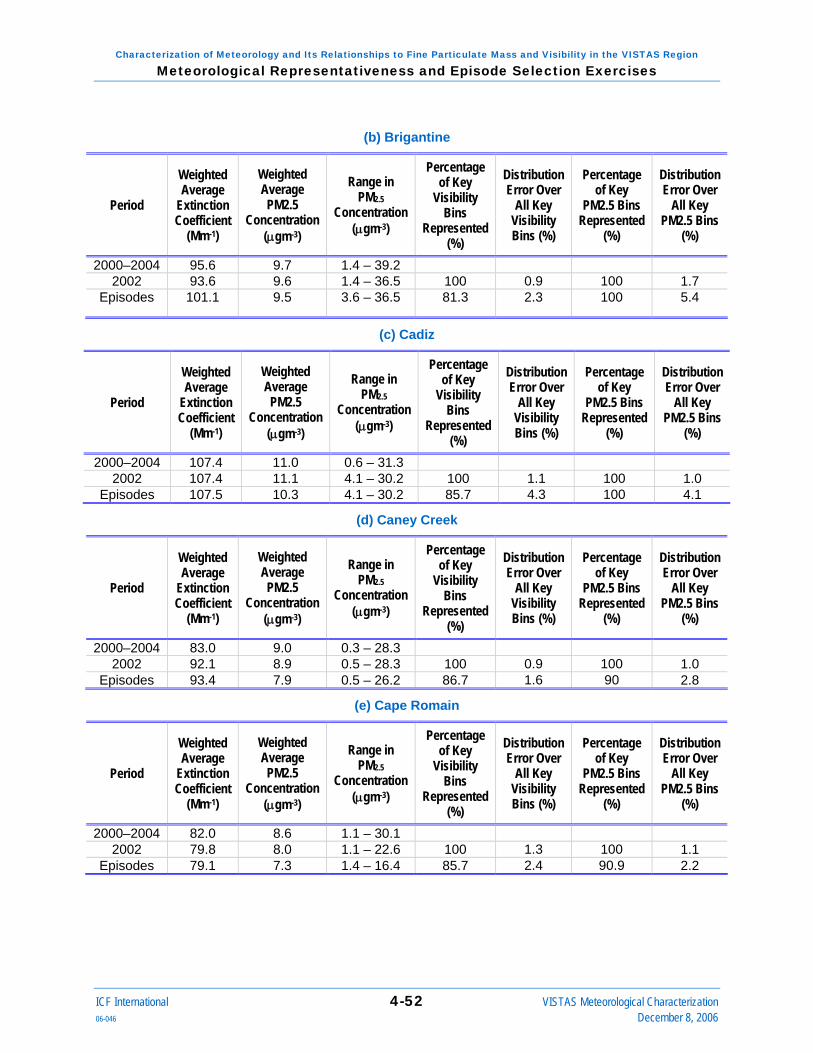
Characterization of Meteorology and Its Relationships to Fine Particulate Mass and Visibility in the VISTAS Region Meteorological Representativeness and Episode Selection Exercises
(b) Brigantine
Period
Weighted Average
Extinction Coefficient
(Mm-1)
Weighted Average PM2.5
Concentration (μgm-3)
Range in PM2.5
Concentration (μgm-3)
Percentage of Key
Visibility Bins
Represented (%)
Distribution Error Over
All Key Visibility Bins (%)
Percentage of Key
PM2.5 Bins Represented
(%)
Distribution Error Over
All Key PM2.5 Bins
(%)
2000–2004 95.6 9.7 1.4 – 39.2 2002 93.6 9.6 1.4 – 36.5 100 0.9 100 1.7
Episodes 101.1 9.5 3.6 – 36.5 81.3 2.3 100 5.4
(c) Cadiz
Period
Weighted Average
Extinction Coefficient
(Mm-1)
Weighted Average PM2.5
Concentration (μgm-3)
Range in PM2.5
Concentration (μgm-3)
Percentage of Key
Visibility Bins
Represented (%)
Distribution Error Over
All Key Visibility Bins (%)
Percentage of Key
PM2.5 Bins Represented
(%)
Distribution Error Over
All Key PM2.5 Bins
(%)
2000–2004 107.4 11.0 0.6 – 31.3 2002 107.4 11.1 4.1 – 30.2 100 1.1 100 1.0
Episodes 107.5 10.3 4.1 – 30.2 85.7 4.3 100 4.1
(d) Caney Creek
Period
Weighted Average
Extinction Coefficient
(Mm-1)
Weighted Average PM2.5
Concentration (μgm-3)
Range in PM2.5
Concentration (μgm-3)
Percentage of Key
Visibility Bins
Represented (%)
Distribution Error Over
All Key Visibility Bins (%)
Percentage of Key
PM2.5 Bins Represented
(%)
Distribution Error Over
All Key PM2.5 Bins
(%)
2000–2004 83.0 9.0 0.3 – 28.3 2002 92.1 8.9 0.5 – 28.3 100 0.9 100 1.0
Episodes 93.4 7.9 0.5 – 26.2 86.7 1.6 90 2.8
(e) Cape Romain
Period
Weighted Average
Extinction Coefficient
(Mm-1)
Weighted Average PM2.5
Concentration (μgm-3)
Range in PM2.5
Concentration (μgm-3)
Percentage of Key
Visibility Bins
Represented (%)
Distribution Error Over
All Key Visibility Bins (%)
Percentage of Key
PM2.5 Bins Represented
(%)
Distribution Error Over
All Key PM2.5 Bins
(%)
2000–2004 82.0 8.6 1.1 – 30.1 2002 79.8 8.0 1.1 – 22.6 100 1.3 100 1.1
Episodes 79.1 7.3 1.4 – 16.4 85.7 2.4 90.9 2.2
ICF International 4-52 VISTAS Meteorological Characterization 06-046 December 8, 2006

Characterization of Meteorology and Its Relationships to Fine Particulate Mass and Visibility in the VISTAS Region Meteorological Representativeness and Episode Selection Exercises
(f) Chassahowitzka
Period
Weighted Average
Extinction Coefficient
(Mm-1)
Weighted Average PM2.5
Concentration (μgm-3)
Range in PM2.5
Concentration (μgm-3)
Percentage of Key
Visibility Bins
Represented (%)
Distribution Error Over
All Key Visibility Bins (%)
Percentage of Key
PM2.5 Bins Represented
(%)
Distribution Error Over
All Key PM2.5 Bins
(%)
2000–2004 89.5 8.7 2.1 – 24.7 2002 86.5 8.2 2.5 – 17.7 100 1.1 100 1.6
Episodes 87.3 7.7 3.1 – 12.6 91.7 2.7 100 1.8
(g) Cohutta
Period
Weighted Average
Extinction Coefficient
(Mm-1)
Weighted Average PM2.5
Concentration (μgm-3)
Range in PM2.5
Concentration (μgm-3)
Percentage of Key
Visibility Bins
Represented (%)
Distribution Error Over
All Key Visibility Bins (%)
Percentage of Key
PM2.5 Bins Represented
(%)
Distribution Error Over
All Key PM2.5 Bins
(%)
2000–2004 95.6 10.7 1.2 – 44.4 2002 95.4 10.6 2.2 – 44.4 100 1.2 100 1.3
Episodes 90.8 10.6 3.9 – 44.4 100 2.4 87.5 2.6
(h) Dolly Sods
Period
Weighted Average
Extinction Coefficient
(Mm-1)
Weighted Average PM2.5
Concentration (μgm-3)
Range in PM2.5
Concentration (μgm-3)
Percentage of Key
Visibility Bins
Represented (%)
Distribution Error Over
All Key Visibility Bins (%)
Percentage of Key
PM2.5 Bins Represented
(%)
Distribution Error Over
All Key PM2.5 Bins
(%)
2000–2004 86.0 9.4 0.4 – 37.2 2002 79.1 8.7 1.3 – 37.2 100 1.0 100 0.9
Episodes 81.6 8.2 2.1 – 37.2 100 3.3 100 4.9
(i) Everglades
Period
Weighted Average
Extinction Coefficient
(Mm-1)
Weighted Average PM2.5
Concentration (μgm-3)
Range in PM2.5
Concentration (μgm-3)
Percentage of Key
Visibility Bins
Represented (%)
Distribution Error Over
All Key Visibility Bins (%)
Percentage of Key
PM2.5 Bins Represented
(%)
Distribution Error Over
All Key PM2.5 Bins
(%)
2000–2004 63.4 6.5 1.1 – 34.4 2002 61.8 6.3 1.4 – 23.4 100 1.0 100 1.3
Episodes 69.1 6.6 1.4 – 23.4 81.8 2.5 88.9 1.9
ICF International 4-53 VISTAS Meteorological Characterization 06-046 December 8, 2006
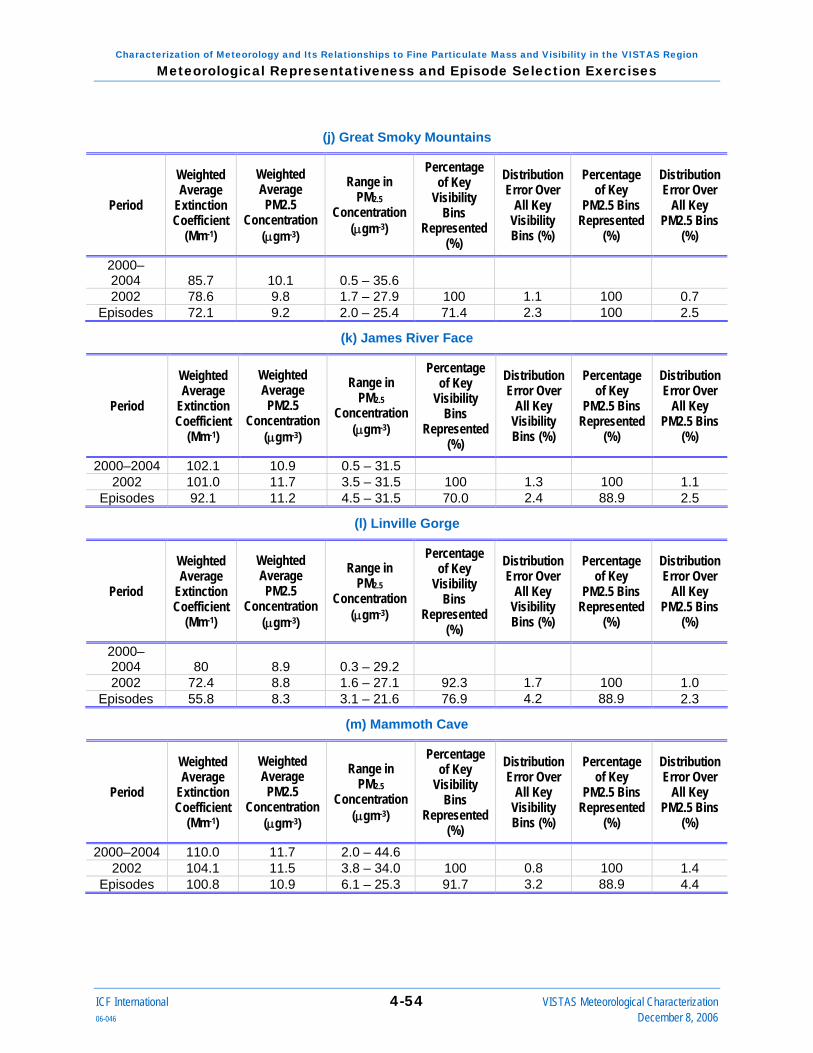
Characterization of Meteorology and Its Relationships to Fine Particulate Mass and Visibility in the VISTAS Region Meteorological Representativeness and Episode Selection Exercises
(j) Great Smoky Mountains
Period
Weighted Average
Extinction Coefficient
(Mm-1)
Weighted Average PM2.5
Concentration (μgm-3)
Range in PM2.5
Concentration (μgm-3)
Percentage of Key
Visibility Bins
Represented (%)
Distribution Error Over
All Key Visibility Bins (%)
Percentage of Key
PM2.5 Bins Represented
(%)
Distribution Error Over
All Key PM2.5 Bins
(%)
2000–2004 85.7 10.1 0.5 – 35.6
2002 78.6 9.8 1.7 – 27.9 100 1.1 100 0.7 Episodes 72.1 9.2 2.0 – 25.4 71.4 2.3 100 2.5
(k) James River Face
Period
Weighted Average
Extinction Coefficient
(Mm-1)
Weighted Average PM2.5
Concentration (μgm-3)
Range in PM2.5
Concentration (μgm-3)
Percentage of Key
Visibility Bins
Represented (%)
Distribution Error Over
All Key Visibility Bins (%)
Percentage of Key
PM2.5 Bins Represented
(%)
Distribution Error Over
All Key PM2.5 Bins
(%)
2000–2004 102.1 10.9 0.5 – 31.5 2002 101.0 11.7 3.5 – 31.5 100 1.3 100 1.1
Episodes 92.1 11.2 4.5 – 31.5 70.0 2.4 88.9 2.5
(l) Linville Gorge
Period
Weighted Average
Extinction Coefficient
(Mm-1)
Weighted Average PM2.5
Concentration (μgm-3)
Range in PM2.5
Concentration (μgm-3)
Percentage of Key
Visibility Bins
Represented (%)
Distribution Error Over
All Key Visibility Bins (%)
Percentage of Key
PM2.5 Bins Represented
(%)
Distribution Error Over
All Key PM2.5 Bins
(%)
2000–2004 80 8.9 0.3 – 29.2
2002 72.4 8.8 1.6 – 27.1 92.3 1.7 100 1.0 Episodes 55.8 8.3 3.1 – 21.6 76.9 4.2 88.9 2.3
(m) Mammoth Cave
Period
Weighted Average
Extinction Coefficient
(Mm-1)
Weighted Average PM2.5
Concentration (μgm-3)
Range in PM2.5
Concentration (μgm-3)
Percentage of Key
Visibility Bins
Represented (%)
Distribution Error Over
All Key Visibility Bins (%)
Percentage of Key
PM2.5 Bins Represented
(%)
Distribution Error Over
All Key PM2.5 Bins
(%)
2000–2004 110.0 11.7 2.0 – 44.6 2002 104.1 11.5 3.8 – 34.0 100 0.8 100 1.4
Episodes 100.8 10.9 6.1 – 25.3 91.7 3.2 88.9 4.4
ICF International 4-54 VISTAS Meteorological Characterization 06-046 December 8, 2006

Characterization of Meteorology and Its Relationships to Fine Particulate Mass and Visibility in the VISTAS Region Meteorological Representativeness and Episode Selection Exercises
(n) Mingo
Period
Weighted Average
Extinction Coefficient
(Mm-1)
Weighted Average PM2.5
Concentration (μgm-3)
Range in PM2.5
Concentration (μgm-3)
Percentage of Key
Visibility Bins
Represented (%)
Distribution Error Over
All Key Visibility Bins (%)
Percentage of Key
PM2.5 Bins Represented
(%)
Distribution Error Over
All Key PM2.5 Bins
(%)
2000–2004 94.7 11.5 2.4 – 50.0 2002 80.9 9.1 3.1 – 15.4 100 1.2 100 2.4
Episodes NA NA NA NA NA NA NA
(o) Okefenokee
Period
Weighted Average
Extinction Coefficient
(Mm-1)
Weighted Average PM2.5
Concentration (μgm-3)
Range in PM2.5
Concentration (μgm-3)
Percentage of Key
Visibility Bins
Represented (%)
Distribution Error Over
All Key Visibility Bins (%)
Percentage of Key
PM2.5 Bins Represented
(%)
Distribution Error Over
All Key PM2.5 Bins
(%)
2000–2004 86.7 9.1 2.2 – 42.9 2002 88.9 9.5 2.9 – 30.1 100 1.0 100 0.7
Episodes 80.2 8.3 2.9 – 28.3 100 2.3 90 2.6
(p) Shenandoah
Period
Weighted Average
Extinction Coefficient
(Mm-1)
Weighted Average PM2.5
Concentration (μgm-3)
Range in PM2.5
Concentration (μgm-3)
Percentage of Key
Visibility Bins
Represented (%)
Distribution Error Over
All Key Visibility Bins (%)
Percentage of Key
PM2.5 Bins Represented
(%)
Distribution Error Over
All Key PM2.5 Bins
(%)
2000–2004 95.2 9.3 0.1 – 33.9 2002 99.0 9.6 0.8 – 29.8 100 2.2 100 1.8
Episodes 88.0 8.3 2.7 – 26.1 100 3.9 88.9 3.5
(q) Shining Rock
Period
Weighted Average
Extinction Coefficient
(Mm-1)
Weighted Average PM2.5
Concentration (μgm-3)
Range in PM2.5
Concentration (μgm-3)
Percentage of Key
Visibility Bins
Represented (%)
Distribution Error Over
All Key Visibility Bins (%)
Percentage of Key
PM2.5 Bins Represented
(%)
Distribution Error Over
All Key PM2.5 Bins
(%)
2000–2004 75.1 7.8 0.2 – 57.6 2002 65.0 8.1 0.4 – 23.2 100 1.3 100 1.2
Episodes 47.8 10.8 2.8 – 21.0 81.8 3.6 77.8 1.9
ICF International 4-55 VISTAS Meteorological Characterization 06-046 December 8, 2006

Characterization of Meteorology and Its Relationships to Fine Particulate Mass and Visibility in the VISTAS Region Meteorological Representativeness and Episode Selection Exercises
(r) Sipsey
Period
Weighted Average
Extinction Coefficient
(Mm-1)
Weighted Average PM2.5
Concentration (μgm-3)
Range in PM2.5
Concentration (μgm-3)
Percentage of Key
Visibility Bins
Represented (%)
Distribution Error Over
All Key Visibility Bins (%)
Percentage of Key
PM2.5 Bins Represented
(%)
Distribution Error Over
All Key PM2.5 Bins
(%)
2000–2004 100.8 11.1 1.6 – 36.3 2002 95.9 10.8 4.4 – 29.0 100 1.2 100 1.2
Episodes 87.6 10.5 5.5 – 20.8 91.7 2.5 100 4.1
(s) St. Marks
Period
Weighted Average
Extinction Coefficient
(Mm-1)
Weighted Average PM2.5
Concentration (μgm-3)
Range in PM2.5
Concentration (μgm-3)
Percentage of Key
Visibility Bins
Represented (%)
Distribution Error Over
All Key Visibility Bins (%)
Percentage of Key
PM2.5 Bins Represented
(%)
Distribution Error Over
All Key PM2.5 Bins
(%)
2000–2004 77.9 8.5 1.5 – 31.9 2002 79.2 8.1 2.3 – 21.4 100 1.0 100 1.7
Episodes 64.5 6.8 2.4 – 15.7 91.7 3.2 77.8 3.8
(t) Swanquarter
Period
Weighted Average
Extinction Coefficient
(Mm-1)
Weighted Average PM2.5
Concentration (μgm-3)
Range in PM2.5
Concentration (μgm-3)
Percentage of Key
Visibility Bins
Represented (%)
Distribution Error Over
All Key Visibility Bins (%)
Percentage of Key
PM2.5 Bins Represented
(%)
Distribution Error Over
All Key PM2.5 Bins
(%)
2000–2004 81.8 7.9 0.6 – 27.0
2002 79.3 8.1 1.8 – 22.2 100 1.3 100 1.9 Episodes 65.8 7.0 2.2 – 22.2 83.3 2.3 75 2.4
(u) Upper Buffalo
Period
Weighted Average
Extinction Coefficient
(Mm-1)
Weighted Average PM2.5
Concentration (μgm-3)
Range in PM2.5
Concentration (μgm-3)
Percentage of Key
Visibility Bins
Represented (%)
Distribution Error Over
All Key Visibility Bins (%)
Percentage of Key
PM2.5 Bins Represented
(%)
Distribution Error Over
All Key PM2.5 Bins
(%)
2000–2004 73.4 8.6 0.1 – 30.0 2002 79.2 9.2 1.7 – 27.1 100 1.0 100 1.6
Episodes 78.2 8.3 3.5 – 26.0 92.3 2.8 88.9 3.2
Some additional plots are provided to characterize the overall representativeness of the urban-PM2.5-based episode periods for selected example sites, namely Cape Romain, Great Smoky
ICF International 4-56 VISTAS Meteorological Characterization 06-046 December 8, 2006

Characterization of Meteorology and Its Relationships to Fine Particulate Mass and Visibility in the VISTAS Region Meteorological Representativeness and Episode Selection Exercises
Mountains, and Mammoth Cave. Figure 4-8 compares the average concentration of the PM species for the three time periods, 2000-2004, 2002, and 1 June – 10 July and 19 November – 19 December, 2002 (the combined subset episode periods). Figure 4-9 examines and compares the distribution of surface wind direction, by wind direction quadrant, for the three sets of dates.
Figure 4-8. Comparison of Species Concentrations (μgm-3) for Sulfate (SO4), Nitrate (NO3), Organic Carbon (OC), Elemental Carbon (EC) and Ammonium (NH4) for 2000-2004, 2002, and 2002
VISTAS Episode Periods: IMPROVE Sites.
(a) Cape Romain
0
1
2
3
4
5
6
7
8
SO4 NO3 OC EC NH4
2000-2004 2002 Episodes
µg
m-3
0
1
2
3
4
5
6
7
8
SO4 NO3 OC EC NH4
2000-2004 2002 Episodes
µg
m-3
ICF International 4-57 VISTAS Meteorological Characterization 06-046 December 8, 2006

Characterization of Meteorology and Its Relationships to Fine Particulate Mass and Visibility in the VISTAS Region Meteorological Representativeness and Episode Selection Exercises
(b) Great Smoky Mountains
0
1
2
3
4
5
6
7
8
SO4 NO3 OC EC NH4
2000-2004 2002 Episodes
µg
m-3
0
1
2
3
4
5
6
7
8
SO4 NO3 OC EC NH4
2000-2004 2002 Episodes
µg
m-3
(c) Mammoth Cave
0
1
2
3
4
5
6
7
8
SO4 NO3 OC EC NH4
2000-2004 2002 Episodes
µg
m-3
0
1
2
3
4
5
6
7
8
SO4 NO3 OC EC NH4
2000-2004 2002 Episodes
µg
m-3
ICF International 4-58 VISTAS Meteorological Characterization 06-046 December 8, 2006

Characterization of Meteorology and Its Relationships to Fine Particulate Mass and Visibility in the VISTAS Region Meteorological Representativeness and Episode Selection Exercises
Figure 4-9. Distribution of Surface Wind Directions by Quadrant for 2000-2004, 2002, and 2002 VISTAS Episode Periods: IMPROVE Sites.
(a) Cape Romain
0
10
20
30
40
50
60
NE SE SW NW
Wind Direction Quadrant
Perc
ent o
f Day
s (%
)
2000-20042002Episodes
(b) Great Smoky Mountains
0
10
20
30
40
50
60
NE SE SW NW
Wind Direction Quadrant
Perc
ent o
f Day
s (%
)
2000-20042002Episodes
ICF International 4-59 VISTAS Meteorological Characterization 06-046 December 8, 2006

Characterization of Meteorology and Its Relationships to Fine Particulate Mass and Visibility in the VISTAS Region Meteorological Representativeness and Episode Selection Exercises
(c) Mammoth Cave
0
10
20
30
40
50
60
NE SE SW NW
Wind Direction Quadrant
Perc
ent o
f Day
s (%
)
2000-20042002Episodes
For Cape Romain (Figure 4-8a), the average concentrations for all species are very similar for all three periods. The subset periods match the averages for 2002 very closely. The distributions of wind directions (Figure 4-9a) for the three periods also agree very well, with fewer occurrences of northeasterly winds for the episodes, than the longer periods.
For GSM (Figure 4-8b), both 2002 and the episodes have slightly higher sulfate concentrations than the full baseline period, and 2002, on average, has slightly lower organic carbon. The distributions of wind directions (Figure 4-9b) for the three periods agree quite well. 2002 has a higher percentage of days with southeasterly winds and a lower percentage of days with southwesterly winds than the full period. The distribution for the episode periods follows that for 2002 fairly closely.
For Mammoth Cave (Figure 4-8c), the episode days have, on average, slightly lower sulfate and slightly higher nitrate and organic carbon concentrations than both 2002 and the full baseline period, which are very well matched in terms of average concentrations. The episodes also have a greater percentage of days with southeasterly winds and a lesser percentage of days with northwesterly winds than the longer periods (Figure 4-9c).
STN Sites Table 4-5 summarizes and compares 2000-2004, 2002, and the combined episode periods for the STN sites. The summary metrics are the same as those for Table 4-2. The weighted average PM2.5 concentrations provide information on how well 2002 represents average conditions for the baseline period (as discussed earlier in this section) and then how well the subset episodes represent the 2002 annual period, when the days are weighted to best represent expected frequency of occurrence of the different types of conditions.
ICF International 4-60 VISTAS Meteorological Characterization 06-046 December 8, 2006

Characterization of Meteorology and Its Relationships to Fine Particulate Mass and Visibility in the VISTAS Region Meteorological Representativeness and Episode Selection Exercises
Table 4-5. Summary of PM2.5 and Meteorological Characteristics for 2000-2004, 2002, and the 2002 VISTAS Episodic Analysis Periods: STN Sites.
(a) Birmingham
Period Weighted
Average PM2.5 Concentration
(μgm-3)
Range in PM2.5 Concentration
(μgm-3)
Percentage of Key PM2.5
Bins Represented
(%)
Distribution Error Over
All Key PM2.5 Bins
(%)
2000–2004 18.8 0.4 - 71.3 2002 17.8 4.2 - 47.8 100 1.1
Episodes 18.8 7.1 – 41.5 100 3.5
(b) Charlotte
Period Weighted
Average PM2.5 Concentration
(μgm-3)
Range in PM2.5 Concentration
(μgm-3)
Percentage of Key PM2.5
Bins Represented
(%)
Distribution Error Over All
Key PM2.5 Bins (%)
2000–2004 14.7 2.3 – 45.2 2002 14.4 3.2 – 45.2 100 1.6
Episodes 14.7 3.8 – 34.5 100 3.2
(c) Chattanooga
Period Weighted
Average PM2.5 Concentration
(μgm-3)
Range in PM2.5 Concentration
(μgm-3)
Percentage of Key PM2.5
Bins Represented
(%)
Distribution Error Over All
Key PM2.5 Bins (%)
2000–2004 15.6 2.5 – 48.6 2002 14.5 4.2 – 31.3 100 1.1
Episodes 13.5 4.3 – 31.3 90 3.9
(d) Greenville-Spartanburg
Period Weighted
Average PM2.5 Concentration
(μgm-3)
Range in PM2.5 Concentration
(μgm-3)
Percentage of Key PM2.5
Bins Represented
(%)
Distribution Error Over All
Key PM2.5 Bins (%)
2000–2004 14.8 0.5 – 51.5 2002 14.9 1.5 – 49.8 100 1.2
Episodes 15.7 4.5 – 37.3 42.3 1.9
ICF International 4-61 VISTAS Meteorological Characterization 06-046 December 8, 2006
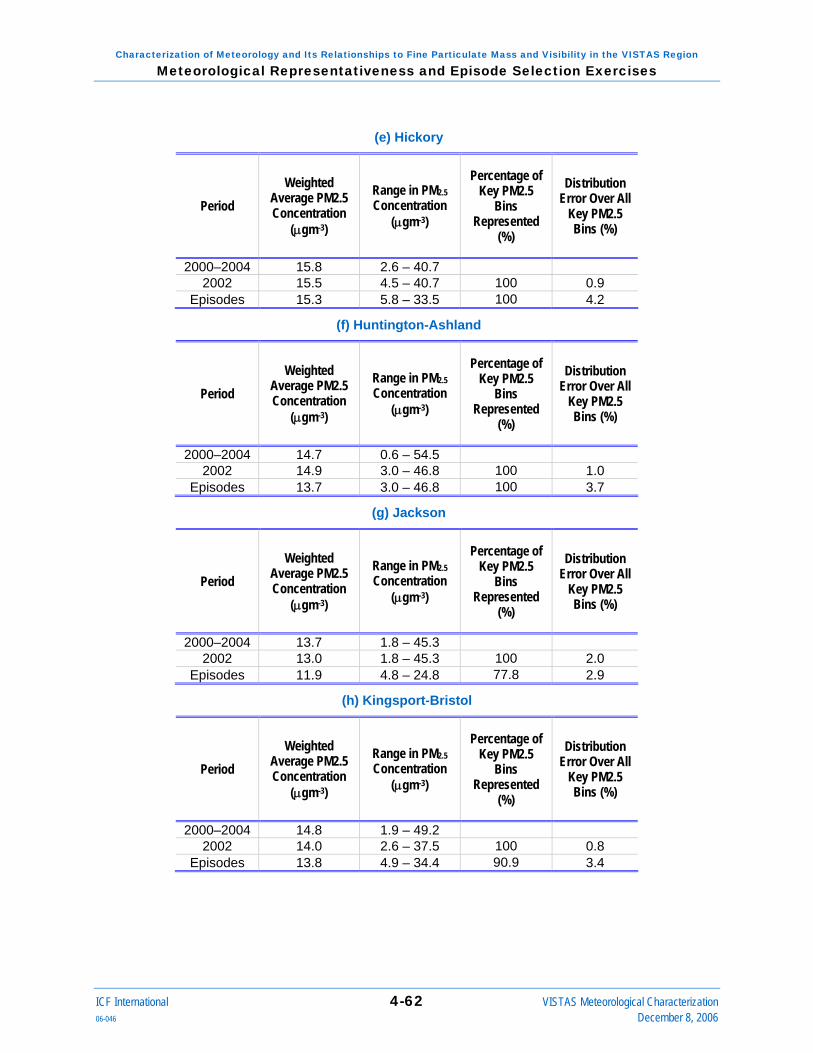
Characterization of Meteorology and Its Relationships to Fine Particulate Mass and Visibility in the VISTAS Region Meteorological Representativeness and Episode Selection Exercises
(e) Hickory
Period Weighted
Average PM2.5 Concentration
(μgm-3)
Range in PM2.5 Concentration
(μgm-3)
Percentage of Key PM2.5
Bins Represented
(%)
Distribution Error Over All
Key PM2.5 Bins (%)
2000–2004 15.8 2.6 – 40.7 2002 15.5 4.5 – 40.7 100 0.9
Episodes 15.3 5.8 – 33.5 100 4.2
(f) Huntington-Ashland
Period Weighted
Average PM2.5 Concentration
(μgm-3)
Range in PM2.5 Concentration
(μgm-3)
Percentage of Key PM2.5
Bins Represented
(%)
Distribution Error Over All
Key PM2.5 Bins (%)
2000–2004 14.7 0.6 – 54.5 2002 14.9 3.0 – 46.8 100 1.0
Episodes 13.7 3.0 – 46.8 100 3.7
(g) Jackson
Period Weighted
Average PM2.5 Concentration
(μgm-3)
Range in PM2.5 Concentration
(μgm-3)
Percentage of Key PM2.5
Bins Represented
(%)
Distribution Error Over All
Key PM2.5 Bins (%)
2000–2004 13.7 1.8 – 45.3 2002 13.0 1.8 – 45.3 100 2.0
Episodes 11.9 4.8 – 24.8 77.8 2.9
(h) Kingsport-Bristol
Period Weighted
Average PM2.5 Concentration
(μgm-3)
Range in PM2.5 Concentration
(μgm-3)
Percentage of Key PM2.5
Bins Represented
(%)
Distribution Error Over All
Key PM2.5 Bins (%)
2000–2004 14.8 1.9 – 49.2 2002 14.0 2.6 – 37.5 100 0.8
Episodes 13.8 4.9 – 34.4 90.9 3.4
ICF International 4-62 VISTAS Meteorological Characterization 06-046 December 8, 2006

Characterization of Meteorology and Its Relationships to Fine Particulate Mass and Visibility in the VISTAS Region Meteorological Representativeness and Episode Selection Exercises
(i) Louisville
Period Weighted
Average PM2.5 Concentration
(μgm-3)
Range in PM2.5 Concentration
(μgm-3)
Percentage of Key PM2.5
Bins Represented
(%)
Distribution Error Over All
Key PM2.5 Bins (%)
2000–2004 17.1 3.3 – 100.6 2002 17.7 4.1 – 100.6 100 1.0
Episodes 18.2 7.1 – 100.6 91.7 3.9
(j) Macon
Period Weighted
Average PM2.5 Concentration
(μgm-3)
Range in PM2.5 Concentration
(μgm-3)
Percentage of Key PM2.5
Bins Represented
(%)
Distribution Error Over All
Key PM2.5 Bins (%)
2000–2004 16.1 2002 15.2 4.3 – 41.0 100 1.2
Episodes 13.6 5.2 – 29.3 88.9 3.0
(k) Memphis
Period Weighted
Average PM2.5 Concentration
(μgm-3)
Range in PM2.5 Concentration
(μgm-3)
Percentage of Key PM2.5
Bins Represented
(%)
Distribution Error Over All
Key PM2.5 Bins (%)
2000–2004 14.2 1.1 – 50.0 2002 13.8 3.6 – 49.4 91.7 0.8
Episodes 14.5 3.9 – 36.4 75 3.0
(l) Montgomery
Period Weighted
Average PM2.5 Concentration
(μgm-3)
Range in PM2.5 Concentration
(μgm-3)
Percentage of Key PM2.5
Bins Represented
(%)
Distribution Error Over All
Key PM2.5 Bins (%)
2000–2004 14.7 0.4 – 52.1
2002 14.9 3.5 – 39.4 100 0.7
Episodes 13.9 6.5 – 28.9 90 2.4
ICF International 4-63 VISTAS Meteorological Characterization 06-046 December 8, 2006
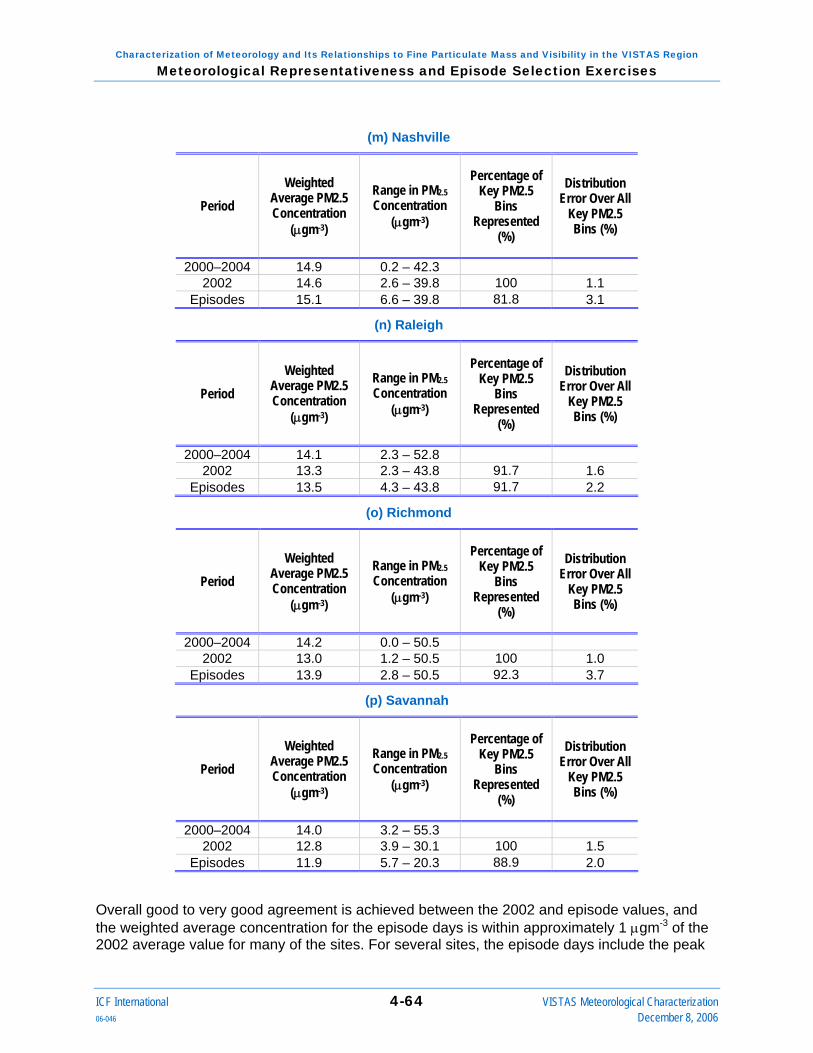
Characterization of Meteorology and Its Relationships to Fine Particulate Mass and Visibility in the VISTAS Region Meteorological Representativeness and Episode Selection Exercises
(m) Nashville
Period Weighted
Average PM2.5 Concentration
(μgm-3)
Range in PM2.5 Concentration
(μgm-3)
Percentage of Key PM2.5
Bins Represented
(%)
Distribution Error Over All
Key PM2.5 Bins (%)
2000–2004 14.9 0.2 – 42.3 2002 14.6 2.6 – 39.8 100 1.1
Episodes 15.1 6.6 – 39.8 81.8 3.1
(n) Raleigh
Period Weighted
Average PM2.5 Concentration
(μgm-3)
Range in PM2.5 Concentration
(μgm-3)
Percentage of Key PM2.5
Bins Represented
(%)
Distribution Error Over All
Key PM2.5 Bins (%)
2000–2004 14.1 2.3 – 52.8 2002 13.3 2.3 – 43.8 91.7 1.6
Episodes 13.5 4.3 – 43.8 91.7 2.2
(o) Richmond
Period Weighted
Average PM2.5 Concentration
(μgm-3)
Range in PM2.5 Concentration
(μgm-3)
Percentage of Key PM2.5
Bins Represented
(%)
Distribution Error Over All
Key PM2.5 Bins (%)
2000–2004 14.2 0.0 – 50.5 2002 13.0 1.2 – 50.5 100 1.0
Episodes 13.9 2.8 – 50.5 92.3 3.7
(p) Savannah
Period Weighted
Average PM2.5 Concentration
(μgm-3)
Range in PM2.5 Concentration
(μgm-3)
Percentage of Key PM2.5
Bins Represented
(%)
Distribution Error Over All
Key PM2.5 Bins (%)
2000–2004 14.0 3.2 – 55.3 2002 12.8 3.9 – 30.1 100 1.5
Episodes 11.9 5.7 – 20.3 88.9 2.0
Overall good to very good agreement is achieved between the 2002 and episode values, and the weighted average concentration for the episode days is within approximately 1 μgm-3 of the 2002 average value for many of the sites. For several sites, the episode days include the peak
ICF International 4-64 VISTAS Meteorological Characterization 06-046 December 8, 2006
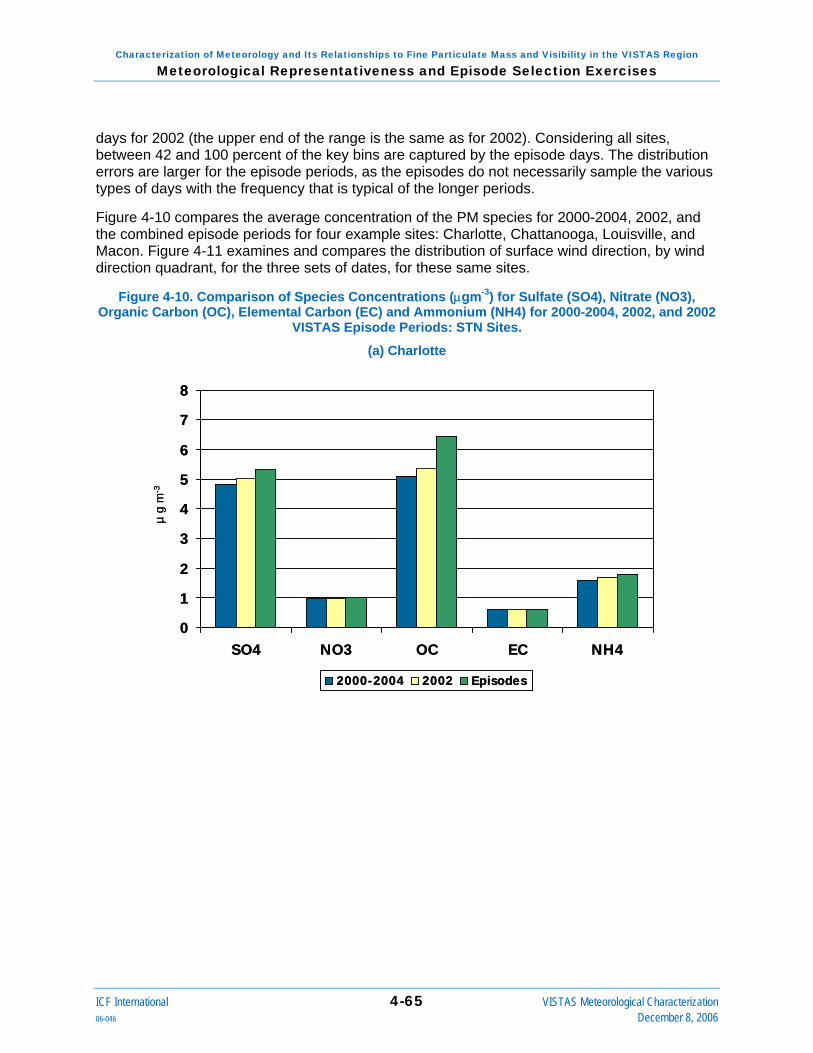
Characterization of Meteorology and Its Relationships to Fine Particulate Mass and Visibility in the VISTAS Region Meteorological Representativeness and Episode Selection Exercises
days for 2002 (the upper end of the range is the same as for 2002). Considering all sites, between 42 and 100 percent of the key bins are captured by the episode days. The distribution errors are larger for the episode periods, as the episodes do not necessarily sample the various types of days with the frequency that is typical of the longer periods.
Figure 4-10 compares the average concentration of the PM species for 2000-2004, 2002, and the combined episode periods for four example sites: Charlotte, Chattanooga, Louisville, and Macon. Figure 4-11 examines and compares the distribution of surface wind direction, by wind direction quadrant, for the three sets of dates, for these same sites.
Figure 4-10. Comparison of Species Concentrations (μgm-3) for Sulfate (SO4), Nitrate (NO3), Organic Carbon (OC), Elemental Carbon (EC) and Ammonium (NH4) for 2000-2004, 2002, and 2002
VISTAS Episode Periods: STN Sites.
(a) Charlotte
0
1
2
3
4
5
6
7
8
SO4 NO3 OC EC NH4
2000-2004 2002 Episodes
µg
m-3
0
1
2
3
4
5
6
7
8
SO4 NO3 OC EC NH4
2000-2004 2002 Episodes
µg
m-3
ICF International 4-65 VISTAS Meteorological Characterization 06-046 December 8, 2006
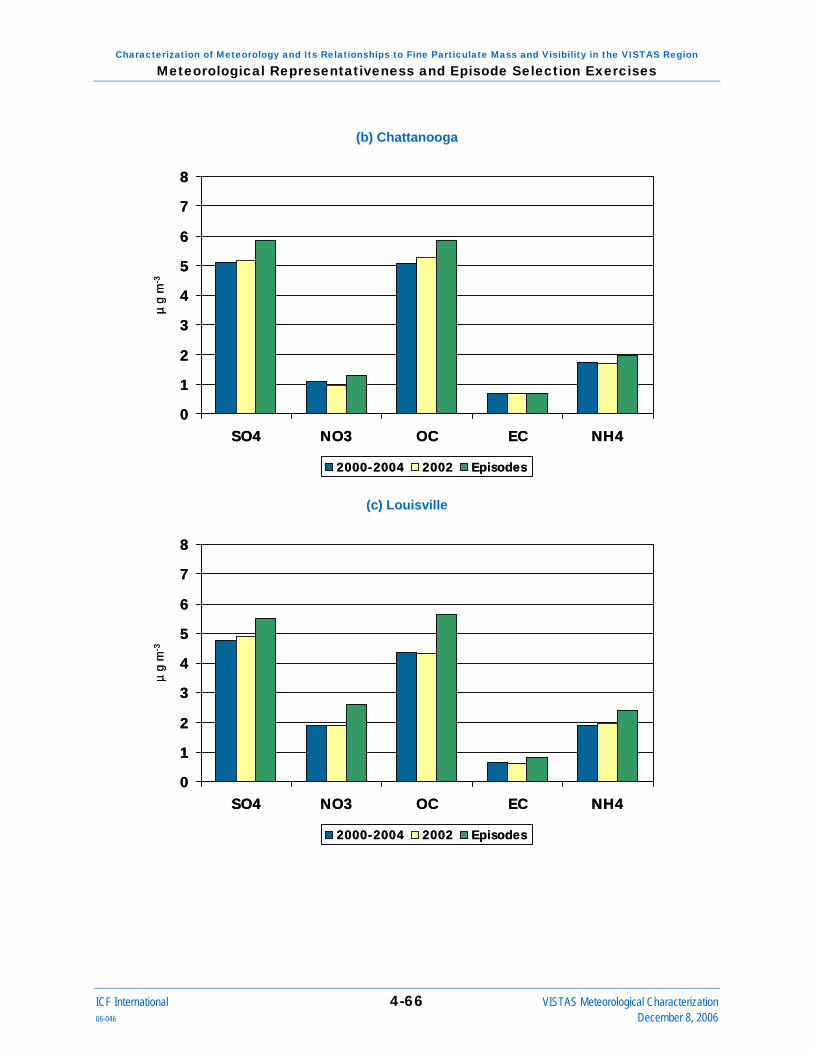
Characterization of Meteorology and Its Relationships to Fine Particulate Mass and Visibility in the VISTAS Region Meteorological Representativeness and Episode Selection Exercises
(b) Chattanooga
0
1
2
3
4
5
6
7
8
SO4 NO3 OC EC NH4
2000-2004 2002 Episodes
µg
m-3
0
1
2
3
4
5
6
7
8
SO4 NO3 OC EC NH4
2000-2004 2002 Episodes
µg
m-3
(c) Louisville
0
1
2
3
4
5
6
7
8
SO4 NO3 OC EC NH4
2000-2004 2002 Episodes
µg
m-3
0
1
2
3
4
5
6
7
8
SO4 NO3 OC EC NH4
2000-2004 2002 Episodes
µg
m-3
ICF International 4-66 VISTAS Meteorological Characterization 06-046 December 8, 2006

Characterization of Meteorology and Its Relationships to Fine Particulate Mass and Visibility in the VISTAS Region Meteorological Representativeness and Episode Selection Exercises
(d) Macon
0
1
2
3
4
5
6
7
8
SO4 NO3 OC EC NH4
2000-2004 2002 Episodes
µg
m-3
0
1
2
3
4
5
6
7
8
SO4 NO3 OC EC NH4
2000-2004 2002 Episodes
µg
m-3
Figure 4-11. Distribution of Surface Wind Directions by Quadrant for 2000-2004, 2002, and 2002 VISTAS Episode Periods: STN Sites.
(a) Charlotte
0
10
20
30
40
50
60
NE SE SW NW
Wind Direction Quadrant
Perc
ent o
f Day
s (%
)
2000-20042002Episodes
ICF International 4-67 VISTAS Meteorological Characterization 06-046 December 8, 2006

Characterization of Meteorology and Its Relationships to Fine Particulate Mass and Visibility in the VISTAS Region Meteorological Representativeness and Episode Selection Exercises
(b) Chattanooga
0
10
20
30
40
50
60
NE SE SW NW
Wind Direction Quadrant
Perc
ent o
f Day
s (%
)
2000-20042002Episodes
(c) Louisville
0
10
20
30
40
50
60
NE SE SW NW
Wind Direction Quadrant
Perc
ent o
f Day
s (%
)
2000-20042002Episodes
ICF International 4-68 VISTAS Meteorological Characterization 06-046 December 8, 2006

Characterization of Meteorology and Its Relationships to Fine Particulate Mass and Visibility in the VISTAS Region Meteorological Representativeness and Episode Selection Exercises
(d) Macon
0
10
20
30
40
50
60
NE SE SW NW
Wind Direction Quadrant
Perc
ent o
f Day
s (%
)
2000-20042002Episodes
Average concentrations for sulfate and organic carbon are higher for 2002, compared to the baseline period, and even higher for the episode periods for Charlotte (Figure 4-10a). There area also differences in the distribution of wind directions among the three periods (Figure 4-11a). Both 2002 and the episode periods show a lesser proportion of southwesterly winds than the baseline period. The 2002 annual period makes up for this with winds from the northeast, and the episodes make up for this with winds from the southeast.
For Chattanooga (Figure 4-10b), the episode periods have higher average species concentrations for sulfate, organic carbon, and, to some extent, nitrate and ammonium, than the longer periods. They are also characterized by a greater proportion of southeasterly and a less proportion of southwesterly winds than the longer periods (Figure 4-11b).
Similarly, for Louisville (Figure 4-10c), the episode periods have higher average species concentrations for all species than the longer periods. In this case, a lower fraction of the days have northwesterly winds (Figure 4-11c).
For Macon (Figure 4-10d), 2002 is characterized by higher average sulfate than the baseline period and the episode days have higher organic carbon concentrations than both 2002 and the full baseline period. The episode days have a greater percentage of days with northwesterly winds compared to the longer periods (Figure 4-11d). Differences in the wind direction distributions between 2002 and the full baseline period are relatively small.
SEARCH Sites Table 4-6 summarizes and compares 2000-2004, 2002, and the combined episode periods for the STN sites. The summary metrics are the same as those for Table 4-2.
ICF International 4-69 VISTAS Meteorological Characterization 06-046 December 8, 2006

Characterization of Meteorology and Its Relationships to Fine Particulate Mass and Visibility in the VISTAS Region Meteorological Representativeness and Episode Selection Exercises
Table 4-6. Summary of PM2.5 and Meteorological Characteristics for 2000-2004, 2002, and the 2002 VISTAS Episodic Analysis Periods: SEARCH Sites.
(a) Atlanta (Jefferson St.)
Period Weighted
Average PM2.5 Concentration
(μgm-3)
Range in PM2.5 Concentration
(μgm-3)
Percentage of Key PM2.5
Bins Represented
(%)
Distribution Error Over All
Key PM2.5 Bins (%)
2000–2004 16.6 1.1 – 66.1 2002 16.3 3.7 – 40.2 91.7 0.8
Episodes 17.2 5.0 – 40.2 91.7 3.0
(b) Yorkville
Period Weighted
Average PM2.5 Concentration
(μgm-3)
Range in PM2.5 Concentration
(μgm-3)
Percentage of Key PM2.5
Bins Represented
(%)
Distribution Error Over All
Key PM2.5 Bins (%)
2000–2004 13.6 0.7 – 65.2 2002 13.2 2.6 – 34.8 100 0.6
Episodes 13.6 3.8 – 34.8 91.7 1.9
(c) Birmingham
Period Weighted
Average PM2.5 Concentration
(μgm-3)
Range in PM2.5 Concentration
(μgm-3)
Percentage of Key PM2.5
Bins Represented
(%)
Distribution Error Over All
Key PM2.5 Bins (%)
2000–2004 17.9 2.8 – 75.2 2002 17.5 3.9 – 45.3 100 0.9
Episodes 18.5 5.5 – 41.2 90.9 3.0
(d) Centreville
Period Weighted
Average PM2.5 Concentration
(μgm-3)
Range in PM2.5 Concentration
(μgm-3)
Percentage of Key PM2.5
Bins Represented
(%)
Distribution Error Over All
Key PM2.5 Bins (%)
2000–2004 12.9 1.2 – 54.4 2002 13.1 2.9 – 48.6 91.7 1.4
Episodes 11.8 4.1 – 39.7 75 2.7
ICF International 4-70 VISTAS Meteorological Characterization 06-046 December 8, 2006
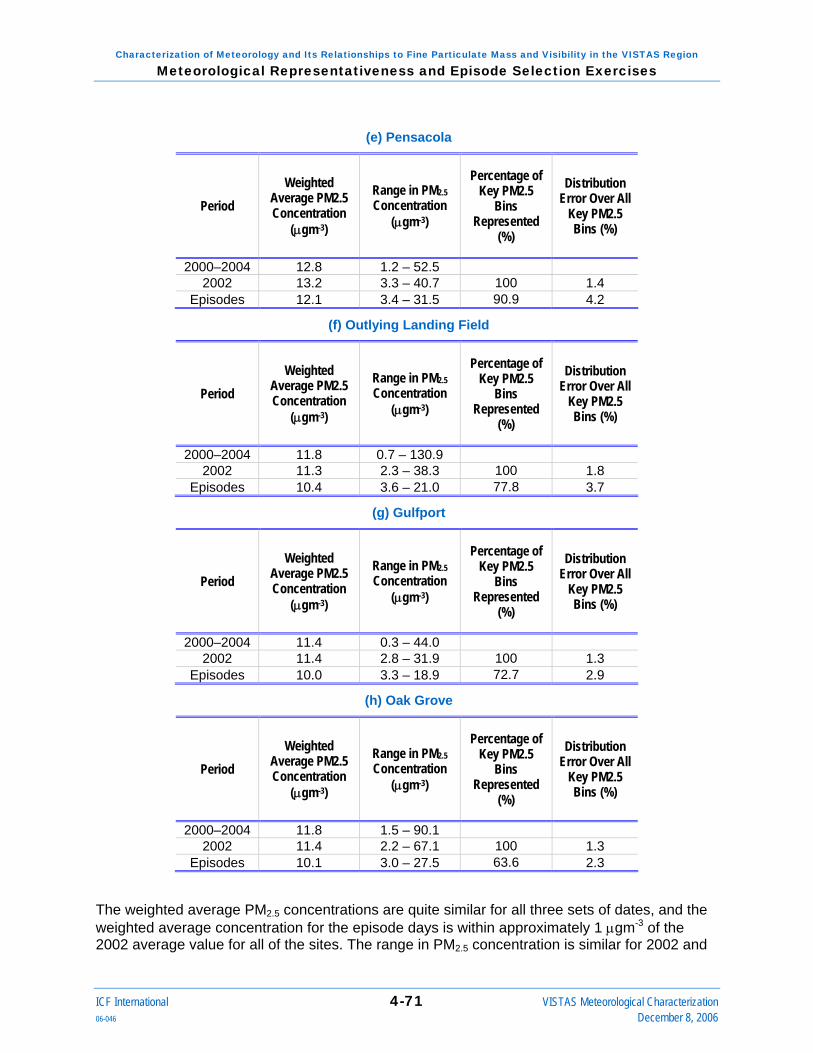
Characterization of Meteorology and Its Relationships to Fine Particulate Mass and Visibility in the VISTAS Region Meteorological Representativeness and Episode Selection Exercises
(e) Pensacola
Period Weighted
Average PM2.5 Concentration
(μgm-3)
Range in PM2.5 Concentration
(μgm-3)
Percentage of Key PM2.5
Bins Represented
(%)
Distribution Error Over All
Key PM2.5 Bins (%)
2000–2004 12.8 1.2 – 52.5 2002 13.2 3.3 – 40.7 100 1.4
Episodes 12.1 3.4 – 31.5 90.9 4.2
(f) Outlying Landing Field
Period Weighted
Average PM2.5 Concentration
(μgm-3)
Range in PM2.5 Concentration
(μgm-3)
Percentage of Key PM2.5
Bins Represented
(%)
Distribution Error Over All
Key PM2.5 Bins (%)
2000–2004 11.8 0.7 – 130.9 2002 11.3 2.3 – 38.3 100 1.8
Episodes 10.4 3.6 – 21.0 77.8 3.7
(g) Gulfport
Period Weighted
Average PM2.5 Concentration
(μgm-3)
Range in PM2.5 Concentration
(μgm-3)
Percentage of Key PM2.5
Bins Represented
(%)
Distribution Error Over All
Key PM2.5 Bins (%)
2000–2004 11.4 0.3 – 44.0 2002 11.4 2.8 – 31.9 100 1.3
Episodes 10.0 3.3 – 18.9 72.7 2.9
(h) Oak Grove
Period Weighted
Average PM2.5 Concentration
(μgm-3)
Range in PM2.5 Concentration
(μgm-3)
Percentage of Key PM2.5
Bins Represented
(%)
Distribution Error Over All
Key PM2.5 Bins (%)
2000–2004 11.8 1.5 – 90.1 2002 11.4 2.2 – 67.1 100 1.3
Episodes 10.1 3.0 – 27.5 63.6 2.3
The weighted average PM2.5 concentrations are quite similar for all three sets of dates, and the weighted average concentration for the episode days is within approximately 1 μgm-3 of the 2002 average value for all of the sites. The range in PM2.5 concentration is similar for 2002 and
ICF International 4-71 VISTAS Meteorological Characterization 06-046 December 8, 2006
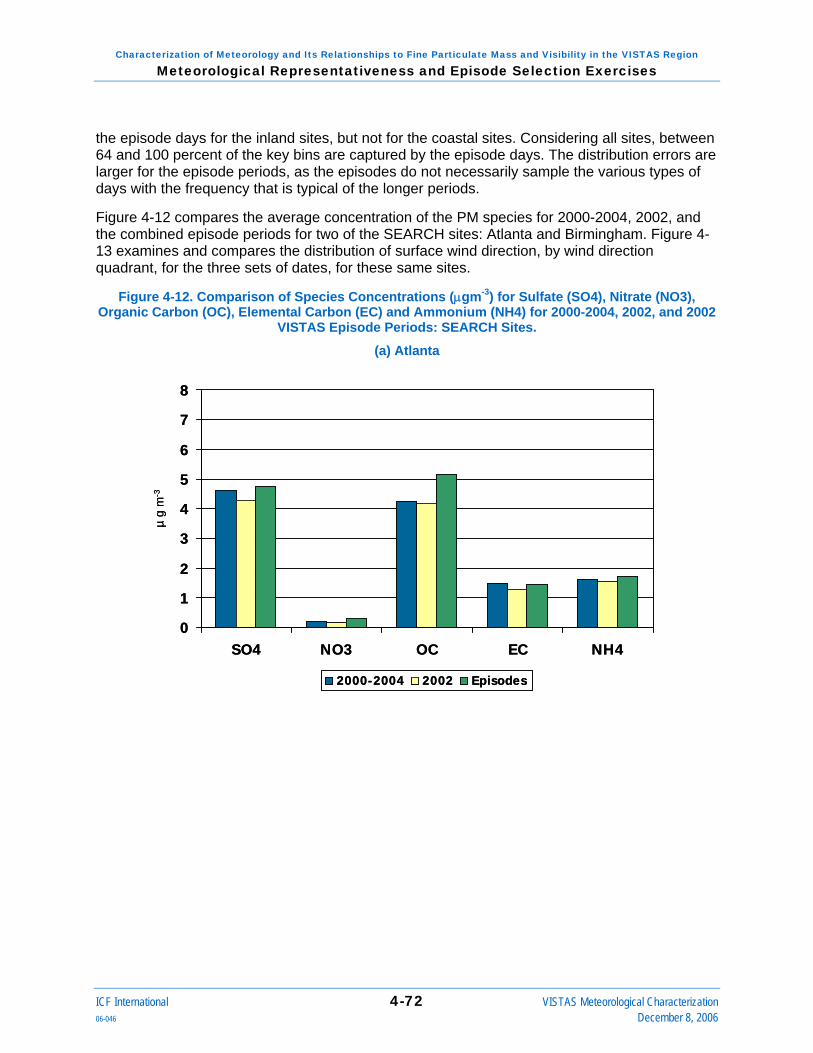
Characterization of Meteorology and Its Relationships to Fine Particulate Mass and Visibility in the VISTAS Region Meteorological Representativeness and Episode Selection Exercises
the episode days for the inland sites, but not for the coastal sites. Considering all sites, between 64 and 100 percent of the key bins are captured by the episode days. The distribution errors are larger for the episode periods, as the episodes do not necessarily sample the various types of days with the frequency that is typical of the longer periods.
Figure 4-12 compares the average concentration of the PM species for 2000-2004, 2002, and the combined episode periods for two of the SEARCH sites: Atlanta and Birmingham. Figure 4-13 examines and compares the distribution of surface wind direction, by wind direction quadrant, for the three sets of dates, for these same sites.
Figure 4-12. Comparison of Species Concentrations (μgm-3) for Sulfate (SO4), Nitrate (NO3), Organic Carbon (OC), Elemental Carbon (EC) and Ammonium (NH4) for 2000-2004, 2002, and 2002
VISTAS Episode Periods: SEARCH Sites.
(a) Atlanta
0
1
2
3
4
5
6
7
8
SO4 NO3 OC EC NH4
2000-2004 2002 Episodes
µg
m-3
0
1
2
3
4
5
6
7
8
SO4 NO3 OC EC NH4
2000-2004 2002 Episodes
µg
m-3
ICF International 4-72 VISTAS Meteorological Characterization 06-046 December 8, 2006

Characterization of Meteorology and Its Relationships to Fine Particulate Mass and Visibility in the VISTAS Region Meteorological Representativeness and Episode Selection Exercises
(b) Birmingham
0
1
2
3
4
5
6
7
8
SO4 NO3 OC EC NH4
2000-2004 2002 Episodes
µg
m-3
0
1
2
3
4
5
6
7
8
SO4 NO3 OC EC NH4
2000-2004 2002 Episodes
µg
m-3
Figure 4-13. Distribution of Surface Wind Directions by Quadrant for 2000-2004, 2002, and 2002 VISTAS Episode Periods: SEARCH Sites.
(a) Atlanta
0
10
20
30
40
50
60
NE SE SW NW
Wind Direction Quadrant
Perc
ent o
f Day
s (%
)
2000-20042002Episodes
ICF International 4-73 VISTAS Meteorological Characterization 06-046 December 8, 2006
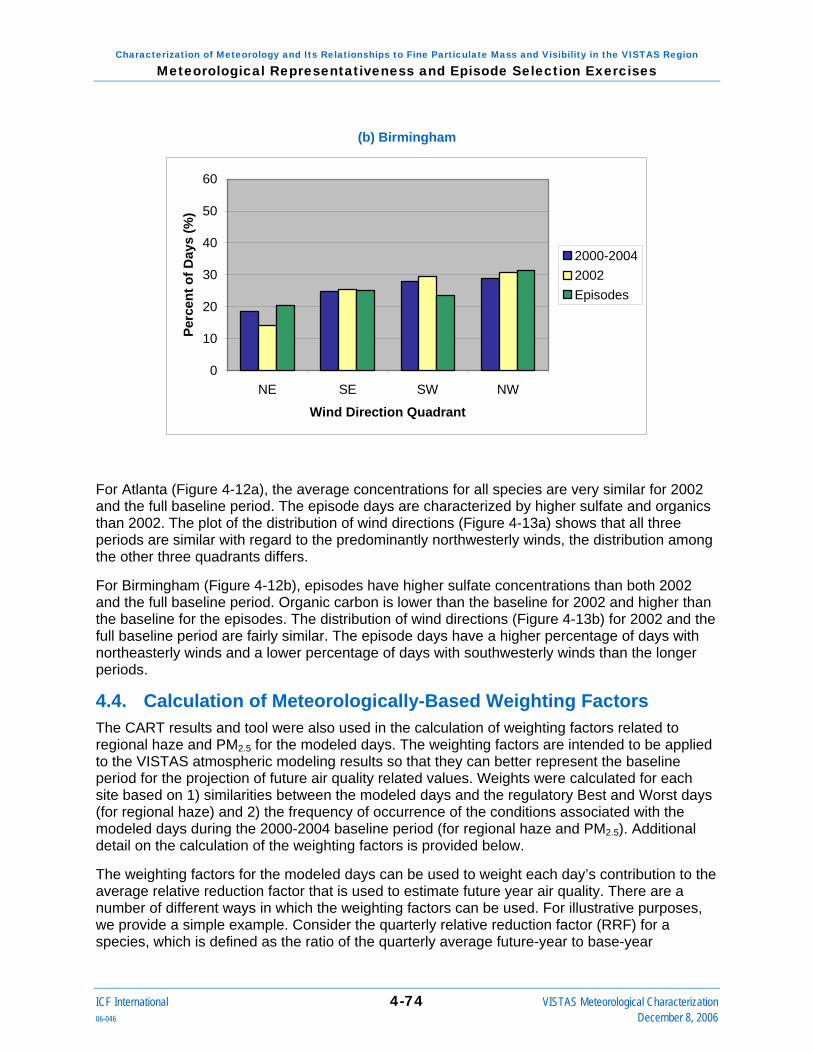
Characterization of Meteorology and Its Relationships to Fine Particulate Mass and Visibility in the VISTAS Region Meteorological Representativeness and Episode Selection Exercises
(b) Birmingham
0
10
20
30
40
50
60
NE SE SW NW
Wind Direction Quadrant
Perc
ent o
f Day
s (%
)
2000-20042002Episodes
For Atlanta (Figure 4-12a), the average concentrations for all species are very similar for 2002 and the full baseline period. The episode days are characterized by higher sulfate and organics than 2002. The plot of the distribution of wind directions (Figure 4-13a) shows that all three periods are similar with regard to the predominantly northwesterly winds, the distribution among the other three quadrants differs.
For Birmingham (Figure 4-12b), episodes have higher sulfate concentrations than both 2002 and the full baseline period. Organic carbon is lower than the baseline for 2002 and higher than the baseline for the episodes. The distribution of wind directions (Figure 4-13b) for 2002 and the full baseline period are fairly similar. The episode days have a higher percentage of days with northeasterly winds and a lower percentage of days with southwesterly winds than the longer periods.
4.4. Calculation of Meteorologically-Based Weighting Factors The CART results and tool were also used in the calculation of weighting factors related to regional haze and PM2.5 for the modeled days. The weighting factors are intended to be applied to the VISTAS atmospheric modeling results so that they can better represent the baseline period for the projection of future air quality related values. Weights were calculated for each site based on 1) similarities between the modeled days and the regulatory Best and Worst days (for regional haze) and 2) the frequency of occurrence of the conditions associated with the modeled days during the 2000-2004 baseline period (for regional haze and PM2.5). Additional detail on the calculation of the weighting factors is provided below.
The weighting factors for the modeled days can be used to weight each day’s contribution to the average relative reduction factor that is used to estimate future year air quality. There are a number of different ways in which the weighting factors can be used. For illustrative purposes, we provide a simple example. Consider the quarterly relative reduction factor (RRF) for a species, which is defined as the ratio of the quarterly average future-year to base-year
ICF International 4-74 VISTAS Meteorological Characterization 06-046 December 8, 2006

Characterization of Meteorology and Its Relationships to Fine Particulate Mass and Visibility in the VISTAS Region Meteorological Representativeness and Episode Selection Exercises
simulated species concentration. Assume that the quarterly average value is based on two modeled days.
The unweighted RRF is equal to (C1f + C2f)/(C1b + C2b) where C1 and C2 are the simulated concentrations for days 1 and 2, and the subscripts f and b refer to the future and base scenarios.
If the days are assigned weighting factors of w1 and w2, the weighted RRF becomes (w1 ⋅ C1f + w2 ⋅ C2f)/(w1 ⋅ C1b + w2 ⋅ C2b).
The weighting factors are available in Excel format.
4.4.1. Annual Weighting Factors for Regional Haze Two approaches were used to calculate the weighting factors for regional haze. Both relied on the identification of the 20 percent “Best” and “Worst” visibility days for the period 2000-2004, using the IMPROVE methodology in which extinction coefficient is calculated as discussed in Section 2 of this report but using a monthly average f(rh) rather than a daily f(rh), as applied in this study. Only days with data were considered eligible for weighting. Days with data that are similar to one or more of the IMPROVE-method Best or Worst days (also referred to as the regulatory Best and Worst days) were assigned weighting factors. A day was considered to be similar to a Best or Worst day if it was assigned to the same CART bin as a Best or Worst day. Weighting factors were calculated separately for Best days and Worst days, and the set of days representing Best days is mutually exclusive from the set of days representing Worst days.
In the first approach, a weighting factor was assigned to each similar day based on both the overall frequency of occurrence of meteorological conditions (the total number of days in the CART bin) as well as the number of regulatory Best or Worst days in each bin.
In the second approach, the weighting factors were based only on the number of Best or Worst days in each bin.
Meteorological Frequency and Best/Worst Based Weighting Factors We calculated weighting factors for each of the 21 IMPROVE sites for all 2002 dates for which there were valid visibility data for the site in question. Weighting factors for use in the Best days and Worst days assessments were calculated separately.
In calculating the weighting factors, we relied on the CART analysis results and used the bins and the number of days within each bin to define the meteorological and air quality conditions and their frequency of occurrence. Weights were assigned to each bin based on the total number of days in the bin and the number of Best (or Worst) days in the bin from a list of the 20% Best (B) (or 20% Worst (W)) days provided by VISTAS. The process consists of seven steps, as follows:
1) Each CART bin containing one or more B (or W) days is identified and the number of B (or W) days in the bin is counted (#B (or #W)).
2) Each CART bin is assigned a weight equal to the total number of days in the bin divided by the total number of days included in the CART analysis (T/TT).
ICF International 4-75 VISTAS Meteorological Characterization 06-046 December 8, 2006

Characterization of Meteorology and Its Relationships to Fine Particulate Mass and Visibility in the VISTAS Region Meteorological Representativeness and Episode Selection Exercises
3) Each CART bin containing one or more B (or W) day is assigned a second weighting factor equal to #B (or #W) divided by the total number of B (or W) days included in the analysis (B/TB (or W/TW)).
4) Each bin containing one or more of the selected days is identified and a bin weight (binwt) is calculated as the product of the two weighting factors above, T/TT and B/TB (or W/TW), divided by the sum of each term over all bins represented by one or more selected days.
5) Binwt is then normalized to account for unrepresented bins, giving an adjusted bin weight (adjbinwt). For all bins containing at least one B (or W) day and at least one selected day, adjbinwt sums to 1.
6) Adjbinwt is divided by the number of selected days within each bin to give the final weighting factor for that bin (Day Wt).
7) Day Wt is assigned to the relevant dates based on each date’s bin classification.
Days were only assigned weights if the extinction coefficients were within the ranges appropriate to the Best or Worst classification categories. For the Best days, these are Categories 1 and 2 (Category 1 represents the 20 percent best days using daily extinction and f(rh) values; Category 2 was also considered). For the Worst days, these are Categories 3, 4, and 5 (Categories 4 and 5 combined represent the 20 percent worst days using daily extinction and f(rh) values and Category 3 is the neighboring category). For bins containing both B and W days, certain days were assigned factors to represent Best days and other days were assigned factors to represent Worst days.
The weighting factors accommodate the use of more than just the Best and Worst days in the future projection of regional haze by including similar days to the Best and Worst days in the calculations. The weighting factors for the Best and Worst days only provide an improved representation of the frequency of occurrence of the conditions associated with the Best and Worst days, considering the full baseline period.
Best/Worst Only Based Weighting Factors This is a simplified version of the approach described in the previous section. It considers only the number of Best or Worst days in a bin. Again, we calculated weighting factors for each of the 21 IMPROVE sites for all 2002 dates for which there were valid visibility data for the site in question. Weighting factors for use in the Best days and Worst days assessments were calculated separately
In calculating the weighting factors, we relied on the CART analysis results to identify days with similar conditions to the regulatory Best and Worst days. Weights were assigned to each bin based on the number of B (or W) days in the bin from a list of the 20% Best (B) (or 20% Worst (W)) days provided by VISTAS. The process consists of five steps, as follows:
1) Each CART bin containing one or more B (or W) days is identified and the number of B (or W) days in the bin is counted (#B (or #W)).
2) Each CART bin containing one or more B (or W) day and one or more of the selected days is assigned a weight (binwt) equal to #B (or #W) divided by the total number of B (or W) days included in the analysis (B/TB (or W/TW)).
ICF International 4-76 VISTAS Meteorological Characterization 06-046 December 8, 2006

Characterization of Meteorology and Its Relationships to Fine Particulate Mass and Visibility in the VISTAS Region Meteorological Representativeness and Episode Selection Exercises
3) Binwt is then normalized to account for unrepresented bins, giving an adjusted bin weight (adjbinwt). For all bins containing at least one B (or W) day and at least one selected day, adjbinwt sums to 1.
4) Adjbinwt is divided by the number of selected days within each bin to give the final weighting factor for that bin (Day Wt).
5) Day Wt is assigned to the relevant dates based on each date’s bin classification.
As for the first approach, days were only assigned weights if the extinction coefficients were within the ranges appropriate to the Best or Worst classification categories.
The weighting factors accommodate the use of more than just the Best and Worst days in the future projection of regional haze by including similar days to the Best and Worst days in the calculations. These weighting factors take into account the number of Best and Worst days in a bin, however, they do not account for the overall frequency of occurrence of the conditions associated with the Best and Worst days, considering the full baseline period.
4.4.2. Episodic Weighting Factors for PM2.5 For PM2.5, weighting factors were calculated for each day of the two subset episode periods 1 June – 10 July and 19 November – 19 December, 2002, and for each STN and SEARCH site. These factors were based on the frequency of occurrence of the air quality/meteorological conditions represented by the episode day (based on the total number of days in the CART bin to which the day is assigned). All episode days with data were considered eligible for weighting.
In calculating the weighting factors, we relied on the CART analysis results and used the bins and the number of days within each bin to define the meteorological and air quality conditions and their frequency of occurrence. Weights were assigned to each bin based on the total number of days in the bin. The process consists of four steps, as follows:
1) Each CART bin containing one or more of the episode days is assigned a weight (binwt) equal to the total number of days in the bin divided by the total number of days included in the CART analysis (T/TT).
2) Binwt is normalized to account for unrepresented bins, giving an adjusted bin weight (adjbinwt). For all bins containing at least one episode day, adjbinwt sums to 1.
3) Adjbinwt for each bin is divided by the number of episode days within the bin to give the final weighting factor for that bin (Day Wt).
4) Day Wt is assigned to the episode dates based on each date’s bin classification.
The weighting factors are expected to provide an improved representation of the frequency of occurrence of the conditions associated with the full baseline period.
ICF International 4-77 VISTAS Meteorological Characterization 06-046 December 8, 2006

Characterization of Meteorology and Its Relationships to Fine Particulate Mass and Visibility in the VISTAS Region Meteorological Representativeness and Episode Selection Exercises
This page deliberately left blank.
ICF International 4-78 VISTAS Meteorological Characterization 06-046 December 8, 2006

5. Key Findings and Implications for VISTAS Air Quality Modeling
The CART results provide insight into the relationships between meteorology, PM2.5, and visibility that are important to atmospheric modeling. Some key findings are summarized in this section.
CART Application The application of CART included several sensitivity tests involving variations to the input dataset. Comparison of the results from the application of CART with and without PM2.5 input data demonstrates that including PM2.5 is important to classification accuracy. This result indicates that regional buildup and transport of fine particles and related precursor species influences regional visibility and PM2.5 concentrations. Overall, better classification accuracy for PM2.5, compared to extinction coefficient, especially for the IMPROVE sites, indicates that the relationships between the input parameters and the characteristic parameter are better defined for PM2.5 at these sites. This is possibly due the more complex role of moisture in determining light extinction – affecting both particle formation and the contribution of sulfate and nitrate particle species to light extinction. For both visibility and PM2.5, moisture is an important input to CART, and some information about moisture is needed in order to achieve good classification. We found daily average relative humidity to be the most effective form of the moisture parameter.
Parameter Importance The CART results indicate that temperature, wind speed, and relative humidity are key meteorological parameters that distinguish days with different fine particle mass and visibility values in the southeastern U.S. Considering visibility for the IMPROVE sites, the most important parameters include: relative humidity, prior day PM2.5 concentrations at potential upwind monitoring sites, 850 mb temperature, surface temperature (reflecting seasonal differences), and wind speed (both near the surface and aloft). For PM2.5 relative humidity is less important, but the list of important parameters is similar. One key difference when comparing parameter importance for the inland, coastal, and mountain sites is that relative humidity and persistence (which, for coastal sites, represents a sea or gulf breeze) are more important for the coastal sites, compared to the inland and mountain sites. The temperature parameters are most important for the mountain sites. Wind directions are not used frequently enough in the CART trees to be considered important parameters to the overall classification, but they are often used near the end of the CART pathways to distinguish poor visibility and high PM2.5 days.
For PM2.5 for the STN and SEARCH sites, the most important parameters include: prior day PM2.5 concentrations, 850 mb temperature, surface temperature, and wind speed (both near the surface and aloft). Relative humidity is also important for the coastal SEARCH sites.
These results vary by site, although, there are similarities among the sites within similar geographical features. An assessment of the meteorological inputs for air quality modeling should emphasize good representation of these key parameters.
Site Groupings The CART-derived parameter importance results were used to examine potential site groupings. We identified similarities in the important parameters for the analysis sites and attributed these to similarities in the mechanisms influencing air quality at these sites. In general, the CART-derived groupings, which are based on parameter importance, are also supported by similarities in location and geography. The groupings for the IMPROVE sites are different for visibility versus PM2.5. These groupings may provide the basis for assessing model performance and
ICF International 5-1 VISTAS Meteorological Characterization 06-046 December 8, 2006

Characterization of Meteorology and Its Relationships to Fine Particulate Mass and Visibility in the VISTAS Region Key Findings and Implications for VISTAS Air Quality Modeling
understanding the reasons for model performance problems. The grouping may also aid the interpretation of differences in the effectiveness of air quality measures across the monitoring sites and regions.
CART Classification Results CART also provides insight into the types of conditions that, based on their frequency of occurrence over a multi-year period, should be represented in an assessment of air quality responses to emissions changes. Poor visibility and high PM2.5 days are grouped into bins that are characterized by different meteorological and prior-day air quality conditions. While there are similarities in the conditions that describe the key (most populated) bins, there are also some important differences that relate directly to source-receptor relationships and potentially control strategy effectiveness.
One of the more notable differences among the key poor visibility and high PM2.5 bins is wind direction, especially surface wind direction. Wind direction, however, does not have a high parameter importance ranking. For many of the cases we examined, this is primarily because wind direction was used in the outermost (lowest) branches of the CART tree, such that days with similar features in many respects were separated into different bins (characterized by different extinction or PM2.5 values) according to wind direction. Thus, wind direction can be important, but only in differentiating a small number of days. For several sites, large differences in average temperature among the key bins indicate that the regimes vary with season. Other differences include prior day PM2.5 concentration, relative humidity, stability, and degree of persistence (indicating a sea or gulf breeze) for the coastal sites. The differences in the individual parameters combine to represent the different regimes, and there are multiple regimes associated with poor visibility and high PM2.5 for all of the areas of interest. The differences among the key bins emphasize the need to include days that represent the different types of meteorological conditions that accompany poor visibility and high PM events in any model-based air quality planning exercise.
The CART analyses also provide insight into PM2.5 composition for different (key) types of poor visibility days and high PM2.5 days. In general, analysis of the compositional characteristics for the key bins for the 20 percent haziest days for the IMPROVE sites within the VISTAS region indicates that, on average, ammonium sulfate and organic carbon are the two most important contributors to poor visibility and that their relative contributions vary by site, by bin, and with meteorology. For the inland IMPROVE sites, ammonium sulfate is the dominant contributor. For the coastal IMPROVE sites the contributions from ammonium sulfate and organic carbon on the poor visibility days are more comparable than at the interior sites. As for visibility, the high PM2.5 concentration bins are distinguished from the lower concentration bins by higher sulfate and organic matter concentrations.
The STN compositional charts show a much larger proportional contribution from organic matter compared to those for the IMPROVE sites, especially for the higher PM2.5 bins. This is in part due to differences between the IMPROVE and STN measurement techniques for organic carbon. With the higher values for organics, the dominant species varies by bin, much more so than for the IMPROVE sites. These variations are attributable to differences in meteorology as well as regional pollutant transport.
The compositional charts for the PM2.5 for the SEARCH sites also show a much larger proportional contribution from organics than the IMPROVE charts, especially for the higher
ICF International 5-2 VISTAS Meteorological Characterization 06-046 December 8, 2006

Characterization of Meteorology and Its Relationships to Fine Particulate Mass and Visibility in the VISTAS Region Key Findings and Implications for VISTAS Air Quality Modeling
PM2.5 bins. The relative ranking of the species contributions is similar to that for the STN sites. A comparison of the compositional averages for Birmingham using the STN and SEARCH data, shows that the organic matter and overall PM2.5 values are higher in the STN data, but that the tendency for organic matter to be the dominant species appears in both sets of results for the more urban sites.
Simulation Period Representativeness The 2002 annual simulation period includes days that capture the general meteorological characteristics associated with a range of visibility at the IMPROVE sites and represents well the typical frequency of occurrence of these conditions. However, somewhat lower than average concentrations and average extinction coefficients characterize 2002 for some sites. PM2.5 values for the STN and SEARCH sites are also lower than average compared to other years within the baseline period. There is no apparent trend in the meteorologically adjusted (weighted average) annual average values of PM2.5 for the STN and SEARCH sites.
While it is not expected that any single year will be typical or representative for all areas of the Class I and urban areas of interest, the CART results enhance the understanding of how well the 2002 simulation period represents each area and this will allow VISTAS to use and interpret their air quality modeling results appropriately.
Two subset episode periods from 2002, comprising a total of 71 days, were selected to represent the conditions and concentration levels associated with high PM2.5 events in as many areas as possible throughout the VISTAS region. These include a summer episode (1 June – 10 July) and a winter episode (19 November – 19 December, 2002). For many of the sites, the summer period includes the peak days for 2002. As expected, the episode periods, do not include days from all of the key bins for all sites. Considering all sites, between approximately 40 and 100 percent of the key bins are included by the episode days – this varies by site. The distribution errors are larger for the episode periods, compared to the annual periods, indicating that the episodes do not sample the different regimes with the frequency that is typical of the longer periods.
Weighting Factors The CART results and tool were also used in the calculation of weighting factors for both regional haze and PM2.5 for the annual and episodic modeled days. The weighting factors were intended to improve the ability of the modeling results for 2002 and the subset periods to represent the full baseline period. The weighting factors for regional haze were calculated based on similarities between the modeled days and the regulatory 20% Best and 20% Worst days and the frequency of occurrence of the conditions associated with the modeled days during the 2000-2004 baseline period. The weighting factors for PM2.5 were based on the frequency of occurrence of the meteorological conditions.
The weighting factors are intended to be applied to the VISTAS atmospheric modeling results so that they can better represent the baseline period for the projection of future air quality related values. In this manner, application of CART has improved the understanding of the conditions contributing to elevated PM2.5 and poor visibility in the southeastern states and has provided the basis for the enhanced analysis and interpretation of atmospheric modeling results.
ICF International 5-3 VISTAS Meteorological Characterization 06-046 December 8, 2006

Characterization of Meteorology and Its Relationships to Fine Particulate Mass and Visibility in the VISTAS Region Key Findings and Implications for VISTAS Air Quality Modeling
This page deliberately left blank.
ICF International 5-4 VISTAS Meteorological Characterization 06-046 December 8, 2006

6. References ARA. 2005. SEARCH website available by Atmospheric Research Associates at
http://www.atmospheric-research.com/studies/SEARCH/
Brieman, L., J. H. Friedman, R. A. Olshen, and C. J. Stone. 1984. Classification and Regression Trees. Wadsworth, Belmont, California.
CIRA. 2005. VIEWS website available at, http://vista.cira.colostate.edu/views/
Cox, W. M. and S. Chu, 1996. Assessment of interannual ozone variation in urban areas from a climatological perspective. Atmos. Environ., 30(14), 2615-2625.
Deuel, H. P., and S. G. Douglas. 1998. “Episode Selection for the Integrated Analysis of Ozone, Visibility, and Acid Deposition for the Southern Appalachian Mountains.” ICF/Systems Applications International, Inc., San Rafael, California (SYSAPP-98/07r1).
Douglas, S. G., J. B. Mangahas, A. B. Hudischewskyj, G. L. Glass, and W. S. Hartley, 2003. “Examination of Inter-Variable Relationships and Implications for Modeling Episode Selection Using the 1999/2000 SEARCH Database”, ICF/Systems Applications International, Inc., San Rafael, California (03-060).
Douglas, S. G., J. B. Mangahas, A. B. Hudischewskyj, and J. L. Haney, 2004. “The Development of PM2.5 Forecasting Tools for Selected Cities in the MARAMA Region,” ICF/Systems Applications International, 101 Lucas Valley Rd., Suite 260, San Rafael California 94903, (04-046).
Eder, B. K., J. M. Davis, P. Bloomfield, 1993. A characterization of the spatiotemporal variability of non-urban ozone concentrations over the eastern United States. Atmos. Environ., 27A, 2645-2668.
EPA. 2001. Guidance for Demonstrating Attainment of Air Quality Goals for PM2.5 and Regional Haze. Draft.
EPA, 2004. Procedures for Estimating Future PM2.5 Values for the CAIR Final Rule by Application of the (Revised) Speciated Modeled Attainment Test. Available at http://www.epa.gov.
EPA. 2005. Aerometric Information Retrieval System database available at http://www.epa.gov.
NCDC. 2005. National Climatic Data Center website available at http://www.ncdc.noaa.gov/oa/ncdc.html.
Regional Haze Regulations; Final Rule. 1999: Federal Register, 64, 35713-35774. Steinberg, Dan, and Phillip Colla. CART—Classification and /regression Trees. San Diego, CA:
Salford Systems, 1997.
ICF International 6-1 VISTAS Meteorological Characterization 06-046 December 8, 2006

Characterization of Meteorology and Its Relationships to Fine Particulate Mass and Visibility in the VISTAS Region References
This page deliberately left blank.
ICF International 6-2 VISTAS Meteorological Characterization 06-046 December 8, 2006

Appendix: Comparison of Results for the STN and SEARCH Birmingham Sites Two CART analyses were conducted for Birmingham. Both analyses used PM2.5 data for the North Birmingham monitoring site. For the first analysis, the PM2.5 data were based on STN measurements and the surface meteorological inputs were based on data from the nearby NWS monitoring site. For the second analysis, the SEARCH data were used to prescribe both the PM2.5 and surface meteorological inputs. In both cases, upper-air meteorological data from the nearby NWS measurement site were used. PM2.5 data are available for both sites for the entire 2000-2004 period. The analysis using the SEARCH data includes one additional year of speciated data (for the year 2000). In this appendix, we compare the results and inferences for the two Birmingham analyses for PM2.5.
Comparative Analysis CART classification accuracy for PM2.5 is very similar for the two analyses—78.5 percent for the STN analysis and 77.1 percent for the SEARCH analysis. The relative importance of the input parameters in constructing the CART classification tree is also very similar for the two analyses, as displayed in Figures A-1 and A-2. Prior-day PM concentrations, surface wind speed, prior-day 700 mb wind speed, relative humidity, and stability are, in order, the five most important parameters for the STN analysis. These same five parameters along with 850 mb wind speed are most important for the SEARCH analysis. The order of importance is roughly the same, with 850 mb wind speed surpassing relative humidity in relative importance for the SEARCH analysis.
Figure A-1. Parameter Importance for the CART PM2.5 Analysis: Birmingham STN Site.
0 20 40 60 80 100
Clouds
Avg 850 mb w ind direction
Avg 850 mb w ind speed
Yesterday's 700 mb w ind direction (PM)
Yesterday's 700 mb w ind speed (PM)
700 mb height difference
Stability
Avg 850 mb temp
Rain
Max surface pressure
Persistence
Surface w ind direction
Surface w ind speed
Relative humidity at noon
Avg surface temp
Regional avg of yesterday's max PM
ICF International A-1 VISTAS Meteorological Characterization 06-046 December 8, 2006

Characterization of Meteorology and Its Relationships to Fine Particulate Mass and Visibility in the VISTAS Region Appendix: Comparison of Results for the STN and SEARCH Birmingham Sites
Figure A-2. Parameter Importance for the CART PM2.5 Analysis: Birmingham SEARCH Site.
0 20 40 60 80 100
Clouds
Avg 850 mb w ind direction
Avg 850 mb w ind speed
Yesterday's 700 mb w ind direction (PM)
Yesterday's 700 mb w ind speed (PM)
700 mb height difference
Stability
Avg 850 mb temp
Rain
Max surface pressure
Persistence
Surface w ind direction
Surface w ind speed
Relative humidity
Avg surface temp
Regional avg of yesterday's max PM
A more detailed look at the CART classification trees confirms that analysis results are similar, with respect to the conditions leading to high PM2.5 and, in CART terms, the high PM2.5 classification bins. However, the CART tree developed using the SEARCH data has more bins than that developed using the STN data (32 versus 26).
The CART input data for the two analyses are summarized in Tables A-1 and A-2. These tables present the average value of each input parameter for each PM2.5 classification category for the Birmingham STN and SEARCH datasets. The four PM2.5 categories are defined by the 70, 90, and 97 percentile values of PM2.5 mass, which are slightly different for the two sites. For the STN site, the ranges for Categories 1 through 4 are <22.5, 22.5-32.5, 32.5-40 and ≥ 40 μgm-3. For the SEARCH site, the ranges are <20, 20-30, 30-37.5 and ≥ 37.5 μgm-3.
ICF International A-2 VISTAS Meteorological Characterization 06-046 December 8, 2006
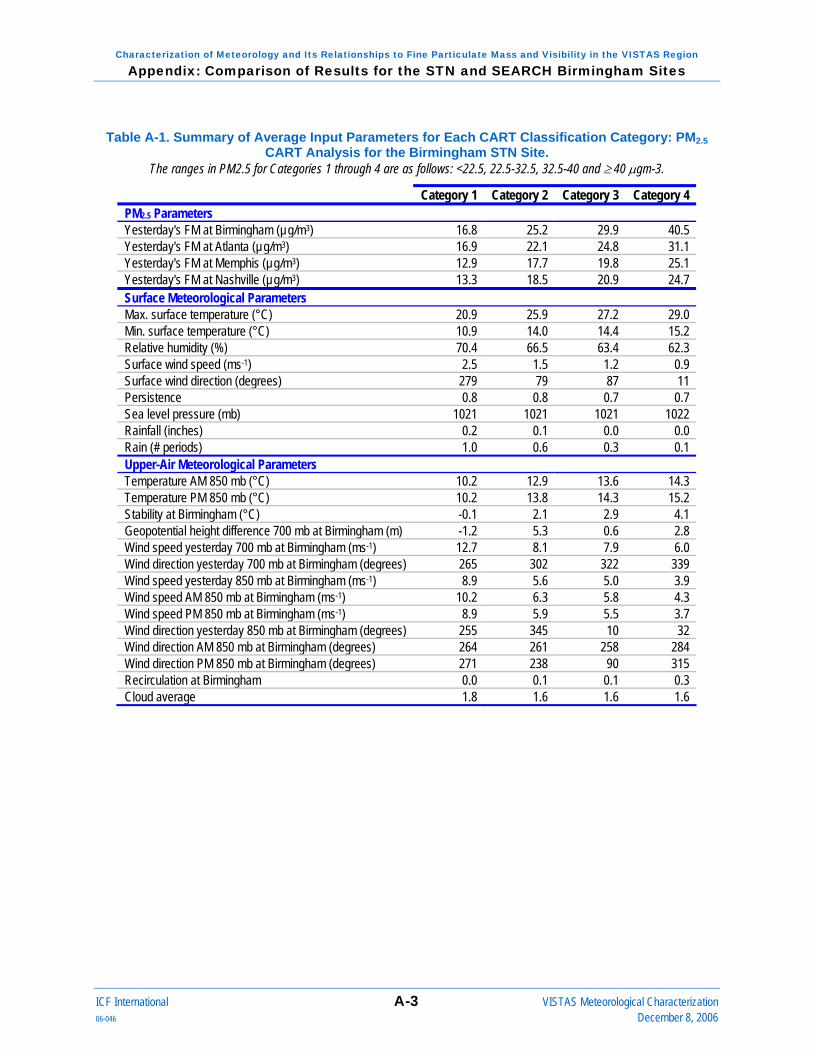
Characterization of Meteorology and Its Relationships to Fine Particulate Mass and Visibility in the VISTAS Region Appendix: Comparison of Results for the STN and SEARCH Birmingham Sites
Table A-1. Summary of Average Input Parameters for Each CART Classification Category: PM2.5 CART Analysis for the Birmingham STN Site.
The ranges in PM2.5 for Categories 1 through 4 are as follows: <22.5, 22.5-32.5, 32.5-40 and ≥ 40 μgm-3.
Category 1 Category 2 Category 3 Category 4 PM2.5 Parameters Yesterday's FM at Birmingham (µg/m3) 16.8 25.2 29.9 40.5 Yesterday's FM at Atlanta (µg/m3) 16.9 22.1 24.8 31.1 Yesterday's FM at Memphis (µg/m3) 12.9 17.7 19.8 25.1 Yesterday's FM at Nashville (µg/m3) 13.3 18.5 20.9 24.7 Surface Meteorological Parameters Max. surface temperature (°C) 20.9 25.9 27.2 29.0 Min. surface temperature (°C) 10.9 14.0 14.4 15.2 Relative humidity (%) 70.4 66.5 63.4 62.3 Surface wind speed (ms-1) 2.5 1.5 1.2 0.9 Surface wind direction (degrees) 279 79 87 11 Persistence 0.8 0.8 0.7 0.7 Sea level pressure (mb) 1021 1021 1021 1022 Rainfall (inches) 0.2 0.1 0.0 0.0 Rain (# periods) 1.0 0.6 0.3 0.1 Upper-Air Meteorological Parameters Temperature AM 850 mb (°C) 10.2 12.9 13.6 14.3 Temperature PM 850 mb (°C) 10.2 13.8 14.3 15.2 Stability at Birmingham (°C) -0.1 2.1 2.9 4.1 Geopotential height difference 700 mb at Birmingham (m) -1.2 5.3 0.6 2.8 Wind speed yesterday 700 mb at Birmingham (ms-1) 12.7 8.1 7.9 6.0 Wind direction yesterday 700 mb at Birmingham (degrees) 265 302 322 339 Wind speed yesterday 850 mb at Birmingham (ms-1) 8.9 5.6 5.0 3.9 Wind speed AM 850 mb at Birmingham (ms-1) 10.2 6.3 5.8 4.3 Wind speed PM 850 mb at Birmingham (ms-1) 8.9 5.9 5.5 3.7 Wind direction yesterday 850 mb at Birmingham (degrees) 255 345 10 32 Wind direction AM 850 mb at Birmingham (degrees) 264 261 258 284 Wind direction PM 850 mb at Birmingham (degrees) 271 238 90 315 Recirculation at Birmingham 0.0 0.1 0.1 0.3 Cloud average 1.8 1.6 1.6 1.6
ICF International A-3 VISTAS Meteorological Characterization 06-046 December 8, 2006

Characterization of Meteorology and Its Relationships to Fine Particulate Mass and Visibility in the VISTAS Region Appendix: Comparison of Results for the STN and SEARCH Birmingham Sites
Table A-2. Summary of Average Input Parameters for Each CART Classification Category: PM2.5 CART Analysis for the Birmingham SEARCH Site.
The ranges in PM2.5 for Categories 1 through 4 are as follows: <20, 20-30, 30-37.5 and ≥ 37.5 μgm-3.
Category 1 Category 2 Category 3 Category 4 PM2.5 Parameters Yesterday's FM at Birmingham (µg/m3) 16.5 24.1 29.5 38.2 Yesterday's FM at Atlanta (µg/m3) 16.7 21.6 23.7 30.8 Yesterday's FM at Memphis (µg/m3) 12.7 17.0 19.9 23.3 Yesterday's FM at Nashville (µg/m3) 13.2 17.5 20.6 23.4 Surface Meteorological Parameters Max. surface temperature (°C) 21.6 26.0 27.5 28.4 Min. surface temperature (°C) 11.5 14.3 13.9 14.7 Relative humidity (%) 70.9 66.4 63.0 62.3 Surface wind speed (ms-1) 1.8 1.3 1.0 0.8 Surface wind direction (degrees) 247 73 18 345 Persistence 0.8 0.8 0.7 0.7 Station pressure (mb) 998 998 998 1000 Rainfall (inches) 0.2 0.1 0.0 0.0 Rain (# periods) 1.0 0.6 0.4 0.3 Upper-Air Meteorological Parameters Temperature AM 850 mb (°C) 10.2 12.5 13.0 13.9 Temperature PM 850 mb (°C) 10.3 13.2 13.9 14.7 Stability at Birmingham (°C) -0.3 2.1 3.1 3.5 Geopotential height difference 700 mb at Birmingham (m) -1.7 5.2 2.3 5.1 Wind speed yesterday 700 mb at Birmingham (ms-1) 12.8 8.7 7.7 6.9 Wind direction yesterday 700 mb at Birmingham (degrees) 265 298 307 329 Wind speed yesterday 850 mb at Birmingham (ms-1) 9.1 5.9 4.6 4.5 Wind speed AM 850 mb at Birmingham (ms-1) 10.3 6.6 5.6 5.0 Wind speed PM 850 mb at Birmingham (ms-1) 8.9 6.3 5.5 4.3 Wind direction yesterday 850 mb at Birmingham (degrees) 252 345 349 14 Wind direction AM 850 mb at Birmingham (degrees) 264 251 283 243 Wind direction PM 850 mb at Birmingham (degrees) 273 219 321 270 Recirculation at Birmingham 0.02 0.08 0.13 0.28 Cloud average 1.8 1.6 1.6 1.5
The values and variations in the PM2.5 related parameters among the classification categories are very similar for the two datasets.
The surface meteorological parameters are also very similar, with some exceptions for the surface wind directions. For the STN analysis, the Category 3 surface wind directions are easterly, on average. For the SEARCH analysis, they are north-northeasterly. For the STN analysis, the Category 4 surface wind directions are north-northeasterly, on average. For the SEARCH analysis, they are north-northwesterly. In both cases, the surface winds have a northerly component on the highest PM2.5 days. The westerly component is more pronounced in the SEARCH data summary.
The average values and tendencies for the upper-air parameters are also very similar, with the exception of the 850 mb wind directions for the two highest categories. Again the SEARCH data summary shows a more pronounce westerly component at higher concentrations, especially at the
ICF International A-4 VISTAS Meteorological Characterization 06-046 December 8, 2006
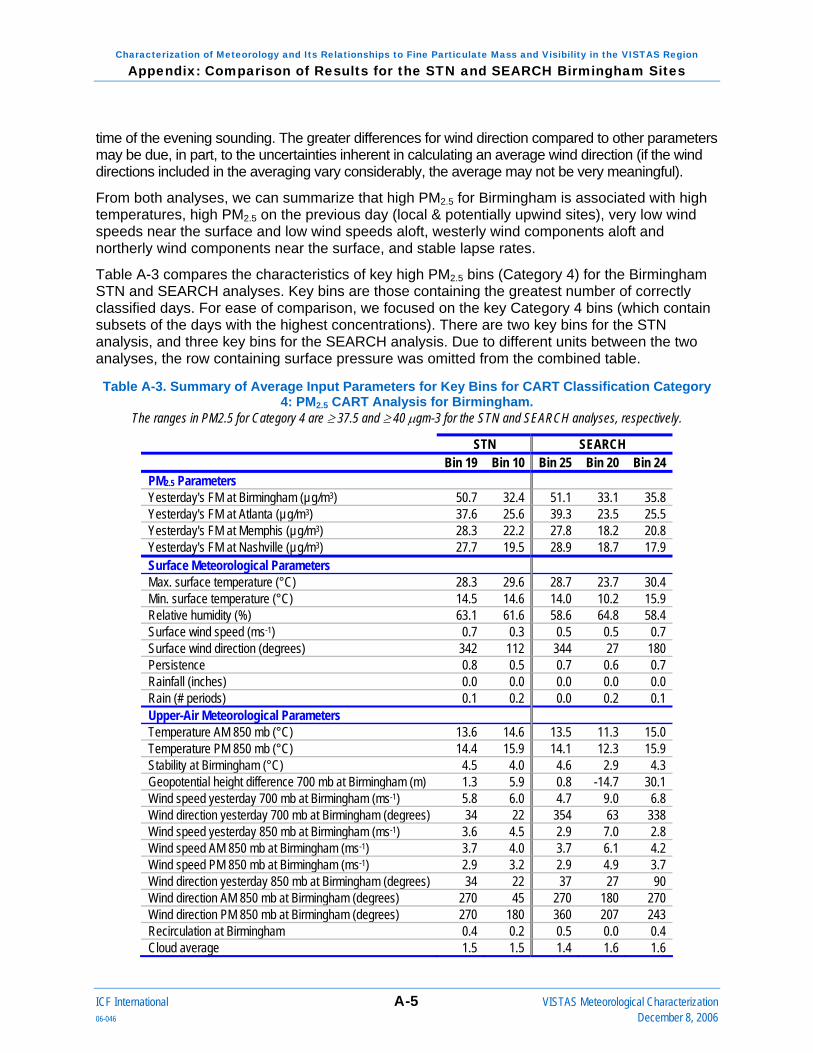
Characterization of Meteorology and Its Relationships to Fine Particulate Mass and Visibility in the VISTAS Region Appendix: Comparison of Results for the STN and SEARCH Birmingham Sites
time of the evening sounding. The greater differences for wind direction compared to other parameters may be due, in part, to the uncertainties inherent in calculating an average wind direction (if the wind directions included in the averaging vary considerably, the average may not be very meaningful).
From both analyses, we can summarize that high PM2.5 for Birmingham is associated with high temperatures, high PM2.5 on the previous day (local & potentially upwind sites), very low wind speeds near the surface and low wind speeds aloft, westerly wind components aloft and northerly wind components near the surface, and stable lapse rates.
Table A-3 compares the characteristics of key high PM2.5 bins (Category 4) for the Birmingham STN and SEARCH analyses. Key bins are those containing the greatest number of correctly classified days. For ease of comparison, we focused on the key Category 4 bins (which contain subsets of the days with the highest concentrations). There are two key bins for the STN analysis, and three key bins for the SEARCH analysis. Due to different units between the two analyses, the row containing surface pressure was omitted from the combined table.
Table A-3. Summary of Average Input Parameters for Key Bins for CART Classification Category 4: PM2.5 CART Analysis for Birmingham.
The ranges in PM2.5 for Category 4 are ≥ 37.5 and ≥ 40 μgm-3 for the STN and SEARCH analyses, respectively.
STN SEARCH Bin 19 Bin 10 Bin 25 Bin 20 Bin 24 PM2.5 Parameters Yesterday's FM at Birmingham (µg/m3) 50.7 32.4 51.1 33.1 35.8 Yesterday's FM at Atlanta (µg/m3) 37.6 25.6 39.3 23.5 25.5 Yesterday's FM at Memphis (µg/m3) 28.3 22.2 27.8 18.2 20.8 Yesterday's FM at Nashville (µg/m3) 27.7 19.5 28.9 18.7 17.9 Surface Meteorological Parameters Max. surface temperature (°C) 28.3 29.6 28.7 23.7 30.4 Min. surface temperature (°C) 14.5 14.6 14.0 10.2 15.9 Relative humidity (%) 63.1 61.6 58.6 64.8 58.4 Surface wind speed (ms-1) 0.7 0.3 0.5 0.5 0.7 Surface wind direction (degrees) 342 112 344 27 180 Persistence 0.8 0.5 0.7 0.6 0.7 Rainfall (inches) 0.0 0.0 0.0 0.0 0.0 Rain (# periods) 0.1 0.2 0.0 0.2 0.1 Upper-Air Meteorological Parameters Temperature AM 850 mb (°C) 13.6 14.6 13.5 11.3 15.0 Temperature PM 850 mb (°C) 14.4 15.9 14.1 12.3 15.9 Stability at Birmingham (°C) 4.5 4.0 4.6 2.9 4.3 Geopotential height difference 700 mb at Birmingham (m) 1.3 5.9 0.8 -14.7 30.1 Wind speed yesterday 700 mb at Birmingham (ms-1) 5.8 6.0 4.7 9.0 6.8 Wind direction yesterday 700 mb at Birmingham (degrees) 34 22 354 63 338 Wind speed yesterday 850 mb at Birmingham (ms-1) 3.6 4.5 2.9 7.0 2.8 Wind speed AM 850 mb at Birmingham (ms-1) 3.7 4.0 3.7 6.1 4.2 Wind speed PM 850 mb at Birmingham (ms-1) 2.9 3.2 2.9 4.9 3.7 Wind direction yesterday 850 mb at Birmingham (degrees) 34 22 37 27 90 Wind direction AM 850 mb at Birmingham (degrees) 270 45 270 180 270 Wind direction PM 850 mb at Birmingham (degrees) 270 180 360 207 243 Recirculation at Birmingham 0.4 0.2 0.5 0.0 0.4 Cloud average 1.5 1.5 1.4 1.6 1.6
ICF International A-5 VISTAS Meteorological Characterization 06-046 December 8, 2006

Characterization of Meteorology and Its Relationships to Fine Particulate Mass and Visibility in the VISTAS Region Appendix: Comparison of Results for the STN and SEARCH Birmingham Sites
For the STN analysis, the PM2.5 concentration for Category 4 is greater than or equal to 40 μgm-
3. Bin 19 is distinguished by a much higher prior-day value PM2.5 concentration than Bin 10. The temperature and humidity characteristics of the two bins are similar. Both key bins are characterized by very low surface wind speeds, but different surface wind directions. Surface winds are southeasterly for Bin 10 and northwesterly for Bin 19. Upper-level wind speeds are lower (slightly) for Bin 19. Upper-level wind directions are northeasterly to southerly for Bin 10, and primarily westerly (on the current day) for Bin 19.
For the SEARCH analysis, the PM2.5 concentration for Category 4 is greater than or equal to 37.5 μgm-3. Bin 25 is distinguished by a much higher prior-day value PM2.5 concentration, and in this regard is similar to Bin 19 from the STN analysis. Bin 20 is distinguished by lower temperatures and slightly higher relative humidity than the other two SEARCH Category 4 bins. All three key bins are characterized by very low surface wind speeds, but surface wind directions differ among the three bins. Surface winds are northeasterly for Bin 20, southerly for Bin 24, and northwesterly for Bin 25. Upper-level wind speeds are lowest (in general) for Bin 25 and highest for Bin 20. Upper-level winds (current day) are southerly to southwesterly for Bin 20, westerly to southwesterly for Bin 24 and westerly to northerly for Bin 25.
If we compare the STN and SEARCH results, we find that Bin 19 from the STN analysis is similar in many respects to Bin 25 from the SEARCH analysis. Key similarities (that also distinguish these bins from other Category 4 bins within their respective analyses) include very high PM2.5 concentration on the prior day, northwesterly surface winds, low wind speeds aloft, and a transition from northeasterly to westerly winds aloft from the prior day to the morning of the current day. Bin 10 from the STN analysis has some features in common with Bin 20 of the SEARCH analysis and some features in common with Bin 24 of the SEARCH analysis. For example, Bins 10 (STN) and 24 (SEARCH) both have, on average, southerly wind components aloft during the afternoon hours of the current day. In some cases, the combined characteristics of SEARCH Bins 20 and 24 seem to represent Bin 10 (STN). For example, the surface wind directions for SEARCH Bins 20 and 24 (northeasterly and southerly) when combined give a resultant wind direction similar to that for STN Bin 10 (southeasterly). It is interesting that for all of the Category 4 bins for both analyses, the prior-day 850 mb winds are from the northeast.
In summary, both CART analyses separate the days with very high prior-day concentrations and northwesterly to northerly winds from the remaining Category 4 days. The analysis using the SEARCH data appears to further divide the remaining days into two groups that are distinguished by temperature, relative humidity, surface and upper-air wind directions, and upper-air wind speeds. We have not explored the reasons for this additional and apparently meaningful segregation, but possible reasons include use of collocated surface meteorological data (for the SEARCH analysis) or that differences between the measurement techniques lead to the identification of different relationships between the PM2.5 values and the other input parameters.
As part of our analysis, we also examined PM2.5 composition for key bins corresponding to each Birmingham analysis. Figures A-3 and A-4 show the average composition for all key PM2.5 bins for the STN and SEARCH analysis, respectively. Note that the scales are different.
ICF International A-6 VISTAS Meteorological Characterization 06-046 December 8, 2006

Characterization of Meteorology and Its Relationships to Fine Particulate Mass and Visibility in the VISTAS Region Appendix: Comparison of Results for the STN and SEARCH Birmingham Sites
Figure A-3. Average Elemental Carbon (EC), Nitrate (NO3), Organic Matter (OM), and Sulfate (SO4) Concentrations (μgm-3) for Key PM2.5 Bins for All CART Classification Categories:
Birmingham STN Site.
Birmingham Key PM Bins: Component Averages
0.00
4.00
8.00
12.00
16.00
20.00
24.00
4 (417) 8 (193) 24 (97) 2 (38) 25 (27) 6 (24) 11 (45) 26 (7) 19 (23) 10 (11)
Class 1 Class 2 Class 3 Class 4
Bin No. (No. of Correctly Classified Days)
Avg.
Con
c. (µ
g/m
3)
ECNO3OMSO4
Figure A-4. Average Elemental Carbon (EC), Nitrate (NO3), Organic Matter (OM), and Sulfate (SO4) Concentrations (μgm-3) for Key PM2.5 Bins for All CART Classification Categories:
Birmingham SEARCH Site.
Birmingham SEARCH Key PM Bins: Component Averages
0.00
4.00
8.00
12.00
16.00
20.00
5 (568) 9 (213) 27 (137) 4 (53) 31 (47) 28 (24) 10 (22) 14 (29) 25 (24) 20 (9) 24 (7)
Class 1 Class 2 Class 3 Class 4
Bin No. (No. of Correctly Classified Days)
Avg.
Con
c. (µ
g/m
3)
ECNO3OMSO4
A comparison of the compositional averages for Birmingham using the STN (Figure A-3) and SEARCH (Figure A-4) data shows that the organic matter and overall PM2.5 values are higher in the STN data, but that the tendency for organic matter to be the dominant species appears in both sets of results. For all key Category 4 PM2.5 bins (for both the STN and SEARCH analysis), organic matter is the dominant species. However, the relative proportion of the species concentrations is different for each bin. This may be due to the differences in the average wind directions. As noted earlier, we found that all of the key bins are characterized by very low surface wind speeds, but, on average, the days within the bins have different wind directions. The similarities in the average parameter values noted earlier for Bins 19 (STN) and 25 (SEARCH) are not apparent in the relative values of the average species concentrations.
ICF International A-7 VISTAS Meteorological Characterization 06-046 December 8, 2006
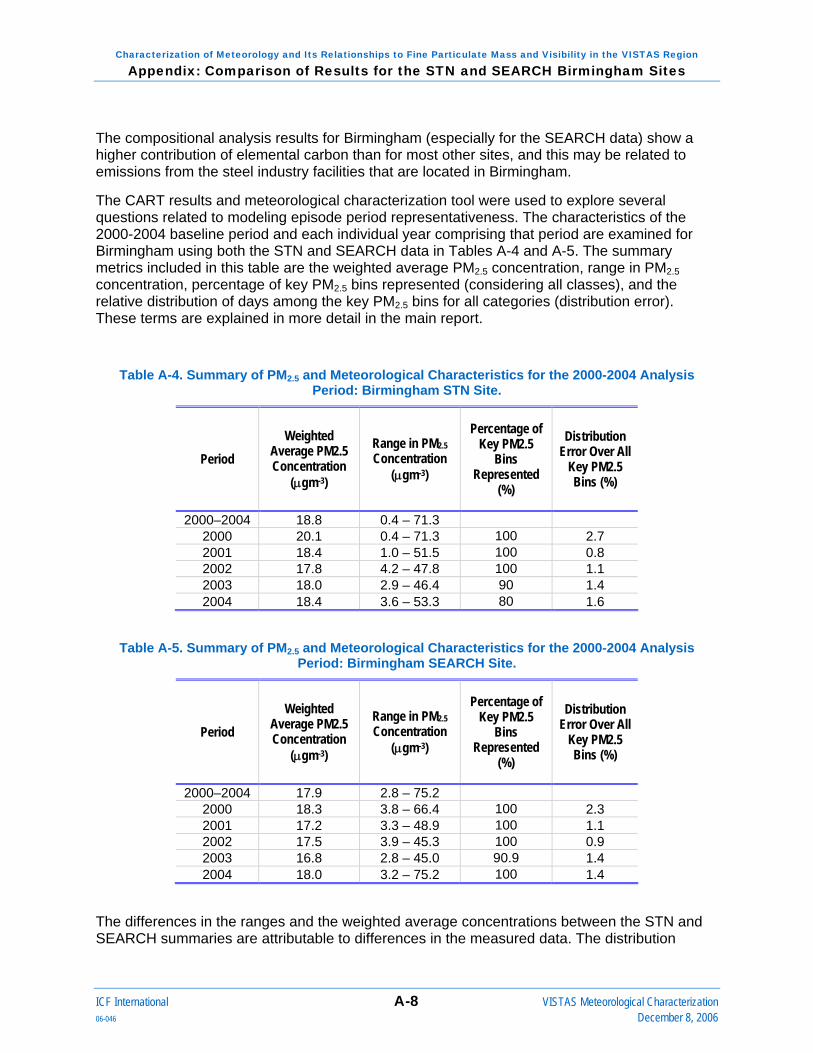
Characterization of Meteorology and Its Relationships to Fine Particulate Mass and Visibility in the VISTAS Region Appendix: Comparison of Results for the STN and SEARCH Birmingham Sites
The compositional analysis results for Birmingham (especially for the SEARCH data) show a higher contribution of elemental carbon than for most other sites, and this may be related to emissions from the steel industry facilities that are located in Birmingham.
The CART results and meteorological characterization tool were used to explore several questions related to modeling episode period representativeness. The characteristics of the 2000-2004 baseline period and each individual year comprising that period are examined for Birmingham using both the STN and SEARCH data in Tables A-4 and A-5. The summary metrics included in this table are the weighted average PM2.5 concentration, range in PM2.5 concentration, percentage of key PM2.5 bins represented (considering all classes), and the relative distribution of days among the key PM2.5 bins for all categories (distribution error). These terms are explained in more detail in the main report.
Table A-4. Summary of PM2.5 and Meteorological Characteristics for the 2000-2004 Analysis Period: Birmingham STN Site.
Period Weighted
Average PM2.5 Concentration
(μgm-3)
Range in PM2.5 Concentration
(μgm-3)
Percentage of Key PM2.5
Bins Represented
(%)
Distribution Error Over All
Key PM2.5 Bins (%)
2000–2004 18.8 0.4 – 71.3 2000 20.1 0.4 – 71.3 100 2.7 2001 18.4 1.0 – 51.5 100 0.8 2002 17.8 4.2 – 47.8 100 1.1 2003 18.0 2.9 – 46.4 90 1.4 2004 18.4 3.6 – 53.3 80 1.6
Table A-5. Summary of PM2.5 and Meteorological Characteristics for the 2000-2004 Analysis Period: Birmingham SEARCH Site.
Period Weighted
Average PM2.5 Concentration
(μgm-3)
Range in PM2.5 Concentration
(μgm-3)
Percentage of Key PM2.5
Bins Represented
(%)
Distribution Error Over All
Key PM2.5 Bins (%)
2000–2004 17.9 2.8 – 75.2 2000 18.3 3.8 – 66.4 100 2.3 2001 17.2 3.3 – 48.9 100 1.1 2002 17.5 3.9 – 45.3 100 0.9 2003 16.8 2.8 – 45.0 90.9 1.4 2004 18.0 3.2 – 75.2 100 1.4
The differences in the ranges and the weighted average concentrations between the STN and SEARCH summaries are attributable to differences in the measured data. The distribution
ICF International A-8 VISTAS Meteorological Characterization 06-046 December 8, 2006

Characterization of Meteorology and Its Relationships to Fine Particulate Mass and Visibility in the VISTAS Region Appendix: Comparison of Results for the STN and SEARCH Birmingham Sites
errors, however, vary similarly among the years for the two datasets. This indicates that in both CART analyses, the days are similarly distributed among the key bins. The results for both analyses suggest that 2002 is one of the more representative years for Birmingham.
The characteristics, attributes, and limitations of the combined VISTAS episode periods (1 June – 10 July and 19 November – 19 December, 2002) for PM2.5 for Birmingham are examined and compared in Table A-6 and A-7 for the STN and SEARCH analyses, respectively. The summary metrics are the same as those for Tables A-4 and A-5.
Table A-6. Summary of PM2.5 and Meteorological Characteristics for 2000-2004, 2002, and the 2002
VISTAS Episodic Analysis Periods: Birmingham STN Site.
Period Weighted
Average PM2.5 Concentration
(μgm-3)
Range in PM2.5 Concentration
(μgm-3)
Percentage of Key PM2.5
Bins Represented
(%)
Distribution Error Over
All Key PM2.5 Bins
(%)
2000–2004 18.8 0.4 – 71.3 2002 17.8 4.2 – 47.8 100 1.1
Episodes 18.8 7.1 – 41.5 100 3.5
Table A-7. Summary of PM2.5 and Meteorological Characteristics for 2000-2004, 2002, and the 2002 VISTAS Episodic Analysis Periods: Birmingham SEARCH Site.
Period Weighted
Average PM2.5 Concentration
(μgm-3)
Range in PM2.5 Concentration
(μgm-3)
Percentage of Key PM2.5
Bins Represented
(%)
Distribution Error Over All
Key PM2.5 Bins (%)
2000–2004 17.9 2.8 – 75.2 2002 17.5 3.9 – 45.3 100 0.9
Episodes 18.5 5.5 – 41.2 90.9 3.0
In both cases, the weighted average concentration for the episode days is 1 μgm-3 higher than the 2002 average value and the episode days include at least one high PM2.5 day but not the peak day for 2002. The distribution errors are similar for the two analyses and the larger errors for the episode periods indicate that the episodes do not sample the various types of days with the frequency that is typical of 2002 and multi-year periods.
Finally, to characterize the overall representativeness of the urban-PM2.5-based episode periods, Figure A-5 compares the average concentration of the PM species for 2000-2004, 2002, and the combined subset episode periods.
ICF International A-9 VISTAS Meteorological Characterization 06-046 December 8, 2006
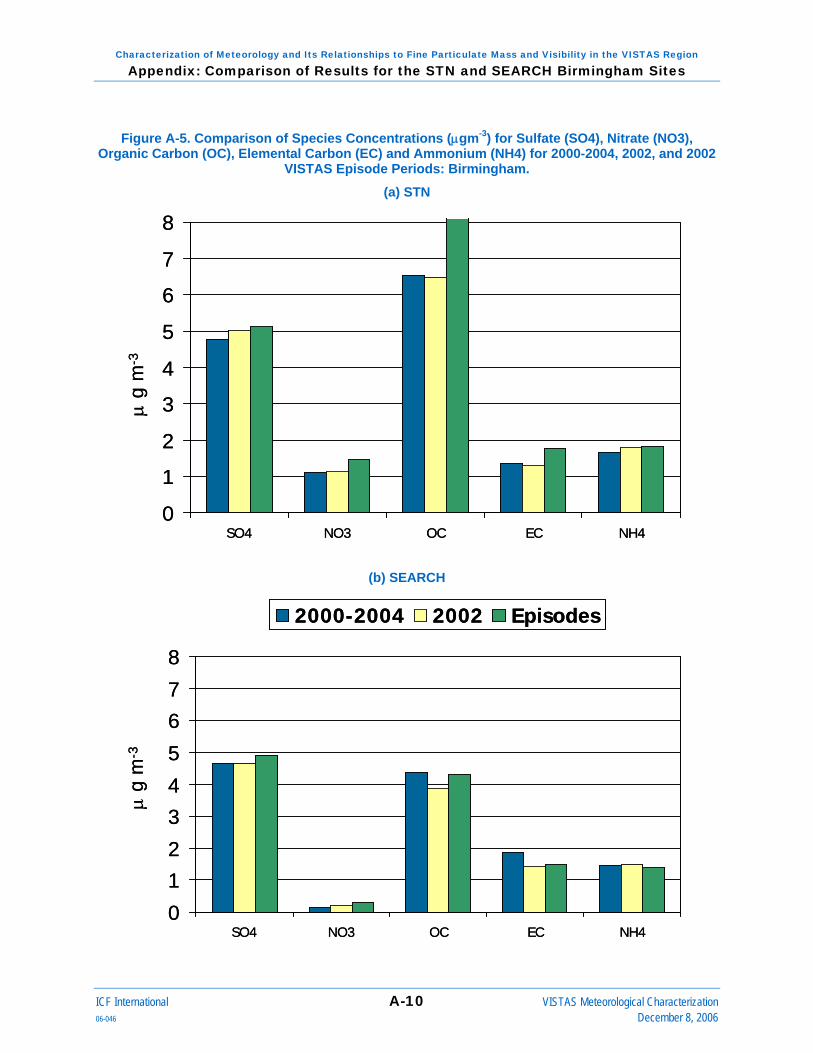
Characterization of Meteorology and Its Relationships to Fine Particulate Mass and Visibility in the VISTAS Region Appendix: Comparison of Results for the STN and SEARCH Birmingham Sites
Figure A-5. Comparison of Species Concentrations (μgm-3) for Sulfate (SO4), Nitrate (NO3), Organic Carbon (OC), Elemental Carbon (EC) and Ammonium (NH4) for 2000-2004, 2002, and 2002
VISTAS Episode Periods: Birmingham.
(a) STN
μg
m-3
0
1
2
3
4
5
6
7
8
SO4 NO3 OC EC NH4
μg
m-3
0
1
2
3
4
5
6
7
8
SO4 NO3 OC EC NH4
(b) SEARCH
μg
m-3
0
12
34
5
67
8
SO4 NO3 OC EC NH4
2000-2004 2002 Episodes
μg
m-3
0
12
34
5
67
8
SO4 NO3 OC EC NH4
2000-2004 2002 Episodes
ICF International A-10 VISTAS Meteorological Characterization 06-046 December 8, 2006

Characterization of Meteorology and Its Relationships to Fine Particulate Mass and Visibility in the VISTAS Region Appendix: Comparison of Results for the STN and SEARCH Birmingham Sites
For both datasets, the average concentrations for all species for 2002 are similar to those for the full period. Using the STN data (Figure A-5a), the episodes have higher organic carbon and slightly higher sulfate, nitrate and elemental carbon concentrations than both 2002 and the full period. Using the SEARCH data, (Figure A-5b), the episodes have slightly higher sulfate concentrations than both 2002 and the full baseline period. Note that we used two methods for the calculation of the average species concentrations for the episodes, first we used all data and then we recalculated using only data for those days with both STN and SEARCH data. Results for the second method are shown in the plots, but the conclusions are the same for both methods. The representativeness of the concentration characteristics of the episode days differs between the two datasets.
Summary of Findings In summary, there are differences in the measured PM2.5 and species concentrations between the STN and SEARCH datasets for Birmingham. Despite the differences in the PM2.5 concentrations, the variation in the average characteristics of the days within percentage-based PM2.5 classification categories is similar between the two datasets. Consequently, the STN and SEARCH CART analyses for Birmingham are similar with respect to classification accuracy, relative importance of the input parameters, and the overall conditions leading to the high PM2.5 classification bins.
Both CART analyses separate the days with very high prior-day concentrations and northwesterly to northerly winds from the remaining high PM2.5 days. The analysis using the SEARCH data provides some additional detail and further divides the remaining days into two groups with different physical characteristics. Use of collocated surface meteorological data in the SEARCH analysis may allow CART to better detect the relationships between the PM2.5 values and the meteorological parameters, or the SEARCH PM2.5 measurement techniques may be better in tune with the effects of meteorology.
The concentration characteristics of the key bins for the STN and SEARCH analysis are consistent in that organic matter tends to be the dominant species in both sets of results. The relative species concentrations, however, vary among the key bins and between the two analyses.
For both analyses, the 2002 and subset episode days are similarly distributed among the key bins and the results for both analyses suggest that 2002 is one of the more meteorologically representative years for Birmingham, considering the period 2000-2004. The representativeness of the concentration characteristics of the episode days differs between the two datasets.
ICF International A-11 VISTAS Meteorological Characterization 06-046 December 8, 2006
Characterization of Meteorology and Its Relationships to Fine Particulate Mass and Visibility in the VISTAS Region Appendix: Comparison of Results for the STN and SEARCH Birmingham Sites
This page deliberately left blank.
ICF International A-12 VISTAS Meteorological Characterization 06-046 December 8, 2006