Appendix P4 Preliminary Texas Evaporation Trends Report
25
1 Appendix P4 Preliminary Texas Evaporation Trends Report By Richard Dixon and Stacy Bray December 10, 2010
Transcript of Appendix P4 Preliminary Texas Evaporation Trends Report

1
Appendix P4 Preliminary Texas Evaporation Trends
Report
By Richard Dixon and Stacy Bray December 10, 2010

2
Table of Contents
Introduction and Purpose ............................................................................................................................. 3
Introduction to Evaporation ......................................................................................................................... 3
Texas Climate ................................................................................................................................................ 5
The Physical State of Texas ......................................................................................................................... 10
Big Bend Country .................................................................................................................................... 12
The Gulf Coast ......................................................................................................................................... 12
The Hill Country ...................................................................................................................................... 12
The Panhandle ........................................................................................................................................ 13
Pineywoods ............................................................................................................................................. 13
The Prairies and Lakes ............................................................................................................................. 14
South Texas Plains ................................................................................................................................... 14
Evaporation Data ........................................................................................................................................ 14
Data Methods ............................................................................................................................................. 15
Results ......................................................................................................................................................... 16
Summary of Results Statewide ............................................................................................................... 17
Summary of Results by Region ............................................................................................................... 18
Conclusion ................................................................................................................................................... 22
Works Cited ................................................................................................................................................. 24

3
Introduction and Purpose The purpose of this preliminary report is to examine evaporation data from the Texas
Water Development Board using the 1 degree quadrangle in Texas. Quadrangles are the
smallest area for evaporation data calculated in 1 degree latitude and 1 degree longitude (Texas
Water Development Board n.d.). The data for the quadrangle in Texas was collected by the
Texas Water Development Board from the National Weather Service (NWS) and National
Climatic Data Center (NCDC) (Texas Water Development Board n.d.). The quadrangle data is
comprised of monthly and annual gross evaporation data from 1954 to 2007 (Texas Water
Development Board n.d.). The data collected is an evaporation rate in the form of a ratio by
which the change occurs from liquid to vapor (Purdue 2010).
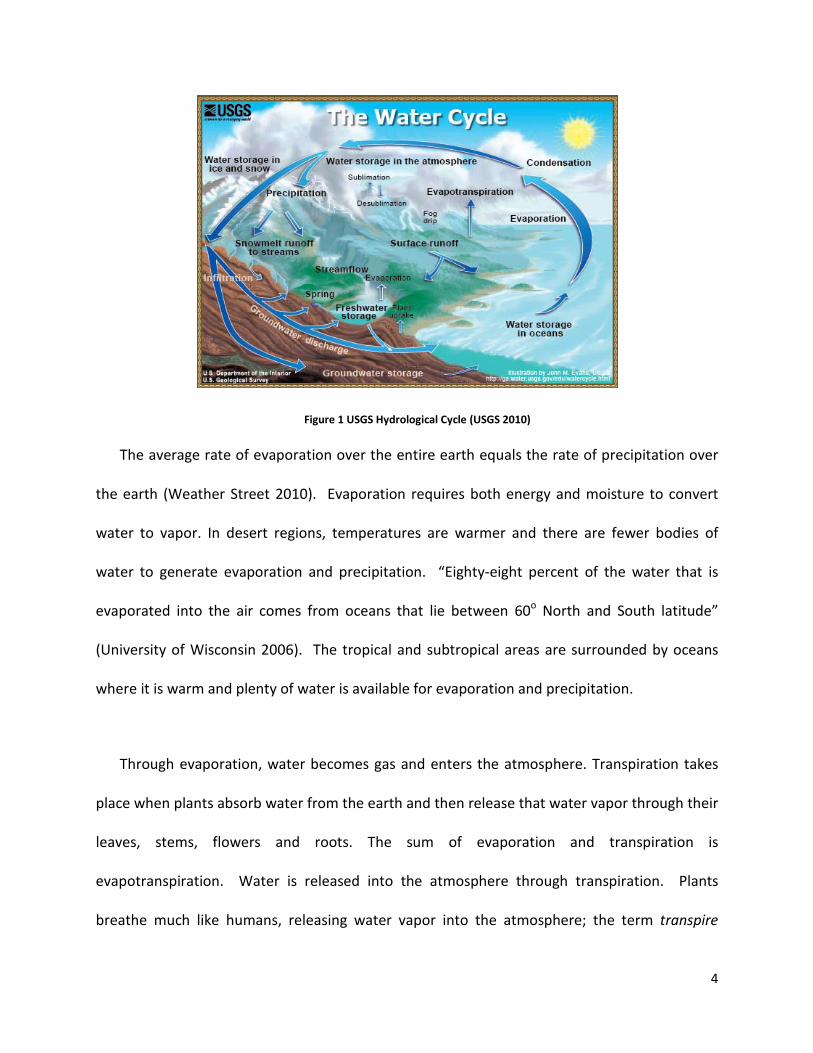
Introduction to Evaporation Matter on Earth exists in three states: solid, liquid and gas. The hydrologic (water) cycle
is matter changing between these three states in the atmosphere, land and the bodies of water
on Earth. The hydrologic cycle has no beginning or end as it recycles itself through evaporation
and is redistributed on Earth as precipitation. Evaporation is the stage wherein water becomes
gas by a form of energy, for example the heat of the sun. When air is hot, dry or during windy
conditions, evaporation is the greatest. When the air is cooler with calm winds and humid
conditions, evaporation will be at its lowest.
4
The average rate of evaporation over the entire earth equals the rate of precipitation over
the earth (Weather Street 2010). Evaporation requires both energy and moisture to convert
water to vapor. In desert regions, temperatures are warmer and there are fewer bodies of
water to generate evaporation and precipitation. “Eighty-eight percent of the water that is
evaporated into the air comes from oceans that lie between 60o North and South latitude”
(University of Wisconsin 2006). The tropical and subtropical areas are surrounded by oceans
where it is warm and plenty of water is available for evaporation and precipitation.
Through evaporation, water becomes gas and enters the atmosphere. Transpiration takes
place when plants absorb water from the earth and then release that water vapor through their
leaves, stems, flowers and roots. The sum of evaporation and transpiration is
evapotranspiration. Water is released into the atmosphere through transpiration. Plants
breathe much like humans, releasing water vapor into the atmosphere; the term transpire
Figure 1 USGS Hydrological Cycle (USGS 2010)

5
comes from the Latin root spire, which means to breathe. Transpiration rates depend on a
number of factors, including energy, precipitation, soil type, wind, topography, temperature
and humidity (Georgia USGS 2010).
Texas Climate The Texas climate is as diverse as the topography of the state, with each season
experiencing a contrast in temperature and precipitation. Precipitation during Texas winters
decreases and is normally drier as compared to spring when there is increased rain and
humidity. The Gulf of Mexico increases the movement of heat and moisture throughout the
state. During the winter, typically more rain will fall than will be evaporated, allowing a greater
supply of moisture.
Figure 2 Average Annual Texas Precipitation (1971 to 2000) (State of Texas Comptroller n.d.)

6
In the winter, West Texas is drier than other parts of the state. Evaporation decreases
because there is less heat energy and the sun is at a lower angle. Wind increases evaporation
rates, but winds do not overcome the lower level of solar insolation. Cloud cover further
decreases solar insolation, thereby lowering evaporation rates. Transpiration decreases
dramatically because most plant life during the winter is either dead or dormant.
During the summer, temperatures are hot and dry and with a limited supply of
moisture, evaporation rates increase. When summer brings rain the surface temperatures cool
because the air mass is colder. The convective summer storms create an inflow and outflow of
air masses. The inflow air mass is the warm, humid surface air. It is relatively buoyant and
flows upward into the storm. Cooler air flows downward into the outflow. A primary reason
storms tend to “pulse” is that the outflow, or cooler air, replaces the surface air stabilizing the
atmosphere. Once the storm loses its inflow – which is the source of its energy and moisture –
it starts to collapse.

7
Figure 3 Texas Annual Mean Temperature 1961 to 1990 (SECO - Texas Comptroller 1994)
The terrain in Texas is rougher and the climate drier in the western portion of the state.
The southern portion of the state is more humid and the terrain flatter towards the Gulf Coast.
To further define Texas climates, the Koppen Climate Classification System map shows the
definition between tropical climates and drier climates.

8
Figure 4 North-American Koppen Map (Wikipedia 2007)
The Koppen Climate Classification System was developed by Wladimir Koppen in the
1800’s and modified throughout the years. The Koppen system is a complex modeling system
that classifies climates according to temperature, rainfall and geographical locations. The
Koppen Climate Classification is an identification system that uses letters to define various
climates. There are 24 subcategories within the six major categories listed below.
1) A – Tropical 2) B – Deserts 3) C – Mesothermal or Mild Mid Latitudes 4) D – Continental or Severe Mid Latitudes 5) E – Polar 6) H – Highlands (this was added later)
(Gabler, Petersen and Trapasso 2008)
Texas is located mostly in the C Category of the Koppen Classification System Model,
where the Gulf of Mexico brings warm and moist wind in from the south. In this classification,
the climate is tropical in nature with warm and humid summers and mild winters. In the

9
winter, low pressure systems move down from the North, bringing occasional severe cold
fronts. Convective thunderstorms are typical during the summer months. The general latitude
for the C category is between 30 - 50 degrees North or South of the equator. According to the
Koppen Classification System, West Texas falls in the B Category, which is dominated by dry
climates. In dry climates, the potential for evaporation and transpiration will exceed
precipitation. The general latitude for dry climates falls between 20 - 35 degrees North and
South of the equator.
According to historical and projected data from the Census Bureau, the population in
Texas will increase from 24.6 million inhabitants in 2010 to 33.3 million in 2030 (Census Bureau
2010). Texas is economically and culturally diverse and people are attracted to its mild climate.
Texas is home to three cities each with over 1 million inhabitants – Houston, Dallas and San
Antonio. Overall Texas is the 2nd largest state by population in the U.S. , behind California.
Texas has a favorable climate for food production and was ranked 2nd most productive
state in agriculture in 2001, accounting for 32% of crops grown in the United States (City-Data
2010). Texas leads the country in cotton production and is home to a diversity of other crops.
The large agricultural base demands large supplies of water for ranching and irrigating crops.
“Approximately 80% of the irrigated land is supplied with water pumped from wells” (City-Data
2010). The added population will make it difficult for Texas to have enough water for
agriculture, which represents more than three-fourths of the total land area of the state. An
additional factor involved in pumping water from wells, is that more than half of the wells use
natural gas as fuel, increasing irrigation costs as gas prices rise (City-Data 2010).

10
Figure 5 US and Texas Population Trend and Predictions (Census Bureau 2010)
The Physical State of Texas
Texas is located in the south central part of the United States, from Latitude 36 to 25
North to South and Longitude 93 to 106 East to West. Texas is the largest state in the lower 48,
and is second only to Alaska in land area. The total Texas land and water area totals 268,581
square miles. Although it is the second largest state in the US, Texas occupies only about 7% of
the total land of the country (Texas Almanac 2010). Beginning at sea level at the Gulf of
Mexico, elevation levels rise to over 8,000 feet in the Guadalupe Mountains in the western
0
50,000,000
100,000,000
150,000,000
200,000,000
250,000,000
300,000,000
350,000,000
400,000,000
US
Texas

11
portion of the state. Texas extends north in the high plains of the panhandle bordering
Oklahoma and New Mexico. To the south, the international border with Mexico and the Rio
Grande extend to the Gulf of Mexico. West Texas begins at El Paso, bordering New Mexico to
the west and Mexico to the south. East Texas, also known as the Pineywoods, borders Arkansas
to the North East and Louisiana directly to the east. There is a major gradient in precipitation
patterns across the state, with very wet conditions in the Eastern portion of the state and dry,
arid conditions in the Western portion.
Figure 6 Texas Geographical Regions (Texas Parks and Wildlife 2007)
Texas is divided into 7 regions for this document using the Texas Parks and WIlidlife
Geographic Regions: the Panhandle Plains, Big Bend Country, Hill Country, South Texas Plains,
Gulf Coast, Prairies and Lakes and Pineywoods. Defining the geographical regions of Texas is
challenging because there are many factors, such as natural features and the cultural and
political characteristics that divide the state according to spatial distribution. The seven

12
geographic regions of the state are expanded upon in the following section (Texas Parks and
Wildlife 2007).
Big Bend Country
The Big Bend Country in West Texas is made up of deserts, plateaus and Texas’ only
mountain range. Big Bend Country is hot and dry during the day and cool at night. The
mountains are cooler at the top where precipitation falls from the clouds. To the south of Big
Bend, the Rio Grande borders Mexico and is one of the longest rivers in North America. The Big
Bend region is named for the bend in the Rio Grande. The rainfall in this region ranges from 8-
20 inches per year. The average Net-Evaporation rate is between 52 - 68 inches.
Gulf Coast The Gulf Coast of South Texas is made up of marshes, estuaries, barrier islands and bays.
There is a great deal of water in the Gulf Coast Region because the area is flat and does not
drain well. In addition, there are many streams and rivers flowing to the Gulf. South of
Brownsville, the area extends to the Louisiana border. The Gulf Coast is home to myriad
species of plants and animals. The average rainfall for this region ranges from 40-60 inches per
year. The average Net Evaporation rate is between 16 - 28 inches.
Hill Country
The Hill Country is located in central Texas. As its name implies, the Hill Country is made
of rolling hills. There are several important geologic areas within the Hill Country, namely the
Edwards Plateau. The Edwards Plateau has many hidden caves, where fractures in the rock
allow water to seep into the aquifer. There are many springs in the Edwards Plateau region,

13
including the San Marcos Springs. The San Marcos Springs are located on the campus of Texas
State University at Aquarena Springs, where Glass Bottom Boats float over the San Marcos
Springs on Spring Lake. Enchanted Rock State Park is a central location within the Hill country,
and is known for its large granite domes, comprising one of the largest batholiths in the state.
The unique dome formations are also known for the minerals they contain. The rainfall for this
region ranges from 14 - 34 inches per year. The average Net Evaporation rate is between 16 -
32 inches.
Panhandle
The Panhandle is a narrow strip that resembles the handle of a pan. Oklahoma is just to
the north and New Mexico directly to the west. The area lies on a high, flat plateau and is
mostly flat grassland with few trees. The eastern side of the Panhandle contains more rolling
hills and increased rainfall. This region is unique because of the deep canyons it contains that
have been carved by rivers, such as the Palo Duro Canyon as well as Caprock Canyon. The
rainfall for the region ranges from 15 - 28 inches per year.
Pineywoods
The Pineywoods are named for the pines found in the region of East Texas. The terrain
is mostly rolling hills with wet bottomlands that grow hardwood trees like pines, elm, mesquite
and ash. The border to the east is mostly along the Louisiana border with a small area
bordering Arkansas in the North East portion of the state. The rainfall for the region ranges
from 40 - 52 inches per year. The average Net-Evaporation rate is between 16 - 32 inches.

14
Prairies and Lakes
The Prairies and Lakes region is in northern Texas. The fertile soil in this region has
brought farming and ranching to the area. This area is known for the dinosaurs found within a
dinosaur park in the Glen Rose area called Dinosaur Valley State Park, where a large collection
of dinosaur footprints can be found. The rainfall for the region ranges from 26 - 40 inches per
year. The average Net-Evaporation rate is about 41 inches.
South Texas Plains
The South Texas Plains is located to the south of the Hill Country and extends Southeast
to the Gulf. The area is fairly flat and dry with brush, grasses, mesquite and cacti. There are
some lakes in the region, including “resacas” or oxbows that were at one time part of the Rio
Grande River. The Rio Grande Valley is a subtropical environment and is very humid. Birds are
attracted to the area and it is a well known region for bird watching. The rainfall for the region
ranges from 20 - 32 inches per year. The average Net-Evaporation rate is between 16 - 28
inches.
Evaporation Data Evaporation data in Texas is not as readily available as precipitation data. The Texas
Water Development Board (TWDB) has gathered data from collection sites operated by both
the TWDB and the National Weather Service (NWS). Historical Evaporation data is available
from 1954 to 2007 and organized through quadrangle data maps. Studying and analyzing
evaporation data is important for calculating rain for crops and drinking water.

15
Evaporation data can be used for planning population centers, future water projections,
businesses, agriculture and municipal water management. As the state of Texas increases in
population there will be greater demands on the already limited water recourses.
Figure 2 TWDB Evaporation Quadrangles (Texas Water Development Board n.d.)
Data Methods TWDB has published evaporation data on its website and has the data available in
several formats: tables, columns, statistics, and graphs. There are a total of 92 quadrangles on
the map, covering the years from 1954 to 2007. A Quadrangle is the smallest evaporation area
to calculate, and its measurement size is 1 degree latitude by 1 degree longitude.

16
The evaporation data begins in 1954, not 1940 as does state precipitation data, because
the system of collection and equipment changed. The two methods generated vastly different
coefficients; therefore a decision was made to leave out evaporation rates prior to 1954.
The evaporation data from TWDB was used in SPSS Statistical software to determine the
trends. The average annual and seasonal evaporation rates were calculated for each grid and a
GIS map pinpointed the grids with the appropriate data. In analyzing evaporation data, it is
important to notice patterns and examine statistically significant changes in the Texas climate.
Analyzing statistical changes could point to patterns of significant trends.
Results Surface water is an area of major water loss through evaporation from rivers, lakes and
reservoirs, with weather being the chief variable. Knowing the crop evapotranspiration rates
allows farmers to apply the right amount of water to crops without wasting resources.
A simple technique to directly measure water evaporation involves the use of an
evaporation pan, which measures the interaction between solar radiation, temperature,
humidity and wind. Because this is a small scale model, it cannot be an exact replication of the
real data from the watershed, known as lake evaporation. Pan evaporation is proportional to
actual evaporation on lakes and other moist surfaces. For this report, the data is based on Pan
Evaporation and will be used for evaluating possible trends in Texas evaporation.
The pans used in pan evaporation data collection have had various designs and their results
have varied historically as seen in the TWDB data, partially due to changes in pan design.
Historically, the pan evaporation data has been used to estimate actual evaporation in non-

17
moist environments. The pan evaporation data was not intended for this purpose. Consistency
is needed in pan design and data collection for a precise historical trend analysis.
The GIS mapped data is used in the following analysis for each region related to Figure 8 to
show the quadrangles that are statistically significant. If the area is not statically significant the
maps in Figures 9 to 13 will show no data.
Figure 3 Statistically Significant Evaporation by Region
Summary of Results Statewide • Evaporation increases statewide in winter, whereas during the other seasons it
increases in the Panhandle and Gulf Coast.
• The annual GIS map in Figure 9 and the table in Figure 8 show a positive trend in the
Panhandle, Pineywoods and Gulf Coast regions, but a negative trend throughout the
rest of the state.

18
Summary of Results by Region • Panhandle region evaporation increased every season and the annual evaporation trend
also increased.
• The Big Bend region’s evaporation decreased every season with the exception of winter
when there were signs of positive and negative evaporation.
• The Hill Country region did not show signs of statistically significant changes in the
spring, with evaporation decreasing in the summer, and an increase in the winter and
mixed positive and negative results in the fall.
• The Prairies and Lakes region evaporation increased in the spring and winter with mixed
results in the fall, but evaporation was lower in the annual and summer data.
• The Pineywoods were annually statistically significant in all seasons except spring, which
contained both negative and positive results across the region.
• The Gulf Coast region overall was statistically significant with positive evaporation
throughout the seasons and annually.
• The South Texas region was statistically significant annually and during all seasons
except in Spring when both negative and positive results were achieved across the
region.

19
Figure 9 GIS Map – Annual Evaporation Historical Trend
Evaporation Trend Blue Trend Increase Red Trend Decrease

20
Evaporation Trend Blue Trend Increase Red Trend Decrease
Evaporation Trend Blue Trend Increase Red Trend Decrease
Figure 10 GIS Map – Fall Season Evaporation Trend Figure 11 GIS Map - Winter Season Evaporation Trend

21
Evaporation Trend Blue Trend Increase Red Trend Decrease
Evaporation Trend Blue Trend Increase Red Trend Decrease
Figure 12 GIS Map - Spring Season Evaporation Trend Figure 13 GIS Map - Summer Evaporation Trend

22
Conclusion There is a heated debate within the scientific and political fields over climate change.
Adding to the confusion, during extreme weather events people argue this as evidence of
global warming. Data supporting the factors of global warming with factual representation
presented in a format that is easily understood will bring a new understanding to this issue.
Figure 14 El Nino October 1997 (white represents warm water and purple cold water (NASA 1997)
Observed average global temperatures have increased over the past 50 years, although
pan evaporation rates have been decreasing in this time, thus leading to the pan evaporation
paradox (Shem, Jian and He 2003). Further study is needed to discern the reason that the pan
evaporation trend is moving in the opposite direction of what is expected from historical
temperatures. The study should include research into the impact of La Nina and El Nino on
climate. Collection of data for trend analysis should be processed the same way for each
observation and the same at every station.
Determining the rate through exactly the same methods during the observed dates is essential;
otherwise the data can become skewed. If the data is unreliable, the method of collection must

23
be reexamined to be consistent across the board, but if the data is reliable and the evaporation
paradox exists, it is difficult to explain the trend in the hydrological cycle (Shem, Jian and He
2003).

24
Works Cited Census Bureau. Quick Facts. 2010. http://quickfacts.census.gov/qfd/states/48000lk.html (accessed December 3, 2010).
City-Data. Texas Agriculture. 2010. http://www.city-data.com/states/Texas-Agriculture.html (accessed December 3, 2010).
Columbia University. The Climatic System. January 2007. http://eesc.columbia.edu/courses/ees/climate/lectures/radiation/heat_xfer.html (accessed December 5, 2010).
Gabler, Robert E, James F Petersen, and L Michael Trapasso. "Physical Geography." In Physical Geography, by Robert E Gabler, James F Petersen and L Michael Trapasso, 205. Thomas Brooks/Cole, 2008.
Georgia USGS. The Water Cycle: Evapotranspiration. December 2010. http://ga.water.usgs.gov/edu/watercycleevapotranspiration.html (accessed December 1, 2010).
McFarland, John. Water Fight in the Texas Panhandle . September 18, 2010. http://www.oilandgaslawyerblog.com/2010/09/water-fight-in-the-texas-panha.html (accessed December 8, 2010).
Merriam - Webster Dictionary. Dictionary. 2010. http://www.merriam-webster.com (accessed December 8, 2010).
NASA - National Aeronautics and Space Administration. Phases of Matter. September 9, 2010. http://www.grc.nasa.gov/WWW/K-12/airplane/state.html (accessed December 5, 2010).
NASA. Remote Sensing. October 17, 1992. http://rst.gsfc.nasa.gov/Sect8/Sect8_7.html (accessed December 10, 2010).
National Cotton Council in America. Frequently Asked Questions. March 2009. http://www.cotton.org/edu/faq/index.cfm (accessed December 8, 2010).
Purdue. Vapor Pressure. 2010. http://www.chem.purdue.edu/gchelp/liquids/vpress.html (accessed December 8, 2010).
River Systems Institute. History. http://www.rivers.txstate.edu/about/history.htm (accessed November 16, 2010).
SECO - Texas Comptroller. Texas Climate. 1994. http://www.seco.cpa.state.tx.us/publications/renewenergy/texasclimate.php (accessed December 1, 2010).

25
Shem, Willis, Jun Jian, and Yanping He. Intensification of the Atmospheric Hydrological Cycle Over the Past Century. Atlanta: Georgia Tech, 2003.
State of Texas Comptroller. Window on the State Government - Infrastructure Water. http://www.window.state.tx.us/specialrpt/tif/water.html#exhibit9 (accessed December 1, 2010).
Texas Almanac. Texas' Natural Environment. 2010. http://www.texasalmanac.com/environment/ (accessed December 3, 2010).
Texas Parks and Wild Life. Lone Star Land Steward Awards. June 15, 2010. http://www.tpwd.state.tx.us/landwater/land/private/lone_star_land_steward/ (accessed December 3, 2010).
Texas Parks and Wildlife. Learn about Texas Regions. February 9, 2007. http://www.tpwd.state.tx.us/kids/about_texas/regions/ (accessed December 3, 2010).
Texas Water Development Board. About Evaporation/Precipitation Data for Texas. http://midgewater.twdb.state.tx.us/Evaporation/evap2.html (accessed December 5, 2010).
Texas Water District Board TWDB. About Evaporation/Precipitation Data for Texas. http://midgewater.twdb.state.tx.us/Evaporation/evap2.html (accessed December 3, 2010).
The River Systems Institute. Overview. http://www.rivers.txstate.edu/about/overview.html (accessed November 15, 2010).
—. RSI Mission Statement. http://www.rivers.txstate.edu/about/mission.html (accessed Novemeber 15, 2010).
University of Wisconsin. The Physical Environment. 2006. http://www.uwsp.edu/geo/faculty/ritter/geog101/textbook/atmospheric_moisture/evaporation.html (accessed December 1, 2010).
Weather Street. Weather Questions. 2010. http://www.weatherquestions.com/What_is_evaporation.htm (accessed December 1, 2010).
Wikipedia. North American Koppen Map. October 12, 2007. http://en.wikipedia.org/wiki/File:North-America_Koppen_Map.png (accessed December 7, 2010).
—. Pan Evaporation. November 30, 2010. http://en.wikipedia.org/wiki/Pan_evaporation (accessed December 3, 2010).