Appendix M Hydraulic Transient Analysis - Barrie Hall/growth/Documents/Oct. 2013 - Water Stor... ·...
46
Water Storage and Distribution Master Plan City of Barrie October 2013 Final Project Number: TP110135 Appendices Appendix M Hydraulic Transient Analysis
Transcript of Appendix M Hydraulic Transient Analysis - Barrie Hall/growth/Documents/Oct. 2013 - Water Stor... ·...

Water Storage and Distribution Master Plan City of Barrie October 2013 Final
Project Number: TP110135 Appendices
Appendix M
Hydraulic Transient Analysis

600 Cochrane Drive, 5th Floor, Markham, Ontario L3R 5K3 Telephone: 905.475.7270 Fax: 905.475.5994 www.genivar.com
131-20095-00 Wednesday October 9th, 2013 Paul Smeltzer AMEC 3215 North Service Road Burlington, ON L7N 3G2 Re: Barrie System-Wide Transient Analysis
Dear Mr. Smeltzer,
GENIVAR Inc. (GENIVAR) is pleased to present the results of our System-Wide Transient Analysis of the Barrie water system. The analysis is an assessment of transient pressures experienced in the Barrie water system under a global power failure and recommendations on mitigating and removing their impact on the system. We trust this meet your requirements at this time. If you have any further questions, please do not hesitate to call.
Yours truly, GENIVAR Inc.
Jean-Luc Daviau, M.A.Sc., P.Eng Arash Alkozai Project Manager Hydraulic Modeller /aa

Barrie System-Wide Transient Analysis
GENIVAR i
Table of Contents
Transmittal Letter Table of Contents
1. INTRODUCTION ............................................................................................................................ 1
2. BARRIE WATER NETWORK ......................................................................................................... 1
3. MODEL DEVELOPMENT .............................................................................................................. 4
4. TRANSIENT ANALYSIS................................................................................................................. 4
4.1 Peak Hour Scenario .................................................................................................................... 5 4.1.1 Zone 1 ......................................................................................................................... 5 4.1.2 Zone 2N ..................................................................................................................... 11 4.1.3 Zone 3N ..................................................................................................................... 16 4.1.4 Zone 2S ..................................................................................................................... 19 4.1.5 Zone 3S ..................................................................................................................... 22
4.2 Min Hour Scenario .................................................................................................................... 25 4.2.1 Zone 1 ....................................................................................................................... 26 4.2.2 Zone 2N ..................................................................................................................... 30 4.2.3 Zone 3N ..................................................................................................................... 34 4.2.4 Zone 2S ..................................................................................................................... 36 4.2.5 Zone 3S ..................................................................................................................... 38
5. CONCLUSION AND RECOMMENDATIONS .............................................................................. 40
List of Tables
Table 1: Top Water Level (m) in each of the pressure zones in Barrie ....................................................... 2 Table 2: Water Supply Facilities .................................................................................................................. 3 Table 3: Water Storage Facilities ................................................................................................................. 4
List of Figures
Figure 1: The City of Barrie Water System consisting of Zones 1, 2N, 3N, 2S, and 3S. ............................. 1 Figure 2: Color-coded map of Transmission and distribution pipes in Barrie. ............................................. 2 Figure 3: Maximum Transient Pressures in Zone 1 under Peak Hour Scenario. ........................................ 7 Figure 4: Minimum Transient Pressures in Zone 1 under Peak Hour Scenario. ......................................... 7 Figure 5: Maximum and Minimum pressure envelops from Well #22 to Anne Res under Peak Hour. ....... 8 Figure 6: Maximum and Minimum pressure envelops from Well W_Tiffin to Anne Res under Peak Hour. 8 Figure 7: Maximum and Minimum pressure envelops from Well W_Perry to Anne Res under Peak Hour. 9 Figure 8: Maximum and Minimum pressure envelops from Well Herr to Anne Res under Peak Hour. ...... 9 Figure 9: Maximum and Minimum pressure envelops from Well Anne to Anne Res under Peak Hour. ... 10 Figure 10: Maximum and Minimum pressure envelops from Well Wood to Anne Res under Peak Hour. 10 Figure 11: Maximum Transient Pressures in Zone 2N under Peak Hour Scenario................................... 12 Figure 12: Maximum Transient Pressures in Zone 2N under Peak Hour Scenario................................... 12 Figure 13: Maximum and Minimum pressure envelops from Well P_Anne to Bayfield Res under Peak
Hour. ................................................................................................................................. 13 Figure 14: Maximum and Minimum pressure envelops from Well JSON to Bayfield Res under Peak Hour.13 Figure 15: Maximum and Minimum pressure envelops from Well Bwood to Bayfield Res under Peak
Hour. ................................................................................................................................. 14 Figure 16: Maximum and Minimum pressure envelops from BPS Res1-7 to Bayfield Res under Peak
Hour. ................................................................................................................................. 14
Barrie System-Wide Transient Analysis Table of Contents
GENIVAR ii
Figure 17: Maximum and Minimum pressure envelops from Codring BPS to Bayfield Res under Peak Hour. ................................................................................................................................. 15
Figure 18: Maximum and Minimum pressure envelops from Res 1-7 to Cording BPS under Peak Hour. 15 Figure 19: Maximum Transient Pressures in Zone 3N under Peak Hour Scenario................................... 17 Figure 20: Maximum Transient Pressures in Zone 3N under Peak Hour Scenario................................... 17 Figure 21: Maximum and Minimum pressure envelops from Leacock BPS to Ferndale Res under Peak
Hour. ................................................................................................................................. 18 Figure 22: Maximum and Minimum pressure envelops from Anne Res to Leacock BPS under Peak Hour.18 Figure 23: Maximum Transient Pressures in Zone 2S under Peak Hour Scenario. .................................. 20 Figure 24: Maximum Transient Pressures in Zone 2S under Peak Hour Scenario. .................................. 20 Figure 25: Maximum and Minimum pressure envelops from the Treatment Plant to Harvie Res under
Peak Hour. ........................................................................................................................ 21 Figure 26: Maximum and Minimum pressure envelops from Well #17_#18 to Harvie Res under Peak
Hour. ................................................................................................................................. 21 Figure 27: Maximum Transient Pressures in Zone 3S under Peak Hour Scenario. .................................. 23 Figure 28: Maximum Transient Pressures in Zone 3S under Peak Hour Scenario. .................................. 23 Figure 29: Maximum and Minimum pressure envelops from BigBay BPS to Zone 3S Res. under Peak
Hour .................................................................................................................................. 24 Figure 30: Maximum and Minimum pressure envelops from Harvie Res to BigBay BPS under Peak Hour.24 Figure 31: Maximum and Minimum pressure envelops from 3S BPS to Zone 3S Res under Peak Hour. 25 Figure 32: Maximum Transient Pressures in Zone 1 under Minimum Hour Scenario. .............................. 26 Figure 33: Maximum Transient Pressures in Zone 1 under Minimum Hour Scenario. .............................. 26 Figure 34: Maximum and Minimum pressure envelops from Well #22 to Anne Res under Min Hour. ...... 27 Figure 35: Maximum and Minimum pressure envelops from Well W_Tiffin to Anne Res under Min Hour.27 Figure 36: Maximum and Minimum pressure envelops from Well W_Perry to Anne Res under Min Hour.28 Figure 37: Maximum and Minimum pressure envelops from Well Herr to Anne Res under Min Hour. ..... 28 Figure 38: Maximum and Minimum pressure envelops from Well Anne to Anne Res under Min Hour. ... 29 Figure 39: Maximum Transient Pressures in Zone 2N under Minimum Hour Scenario. ........................... 30 Figure 40: Maximum Transient Pressures in Zone 2N under Minimum Hour Scenario. ........................... 30 Figure 41: Maximum and Minimum pressure envelops from Well P_Anne to Bayfield Res under Min
Hour. ................................................................................................................................. 31 Figure 42: Maximum and Minimum pressure envelops from Well JSON to Bayfield Res under Min Hour.31 Figure 43: Maximum and Minimum pressure envelops from Well Bwood to Bayfield Res under Min Hour.32 Figure 44: Maximum and Minimum pressure envelops from BPS Res1-7 to Bayfield Res under Min Hour.32 Figure 45: Maximum and Minimum pressure envelops from Codring BPS to Bayfield Res under Min
Hour. ................................................................................................................................. 33 Figure 46: Maximum and Minimum pressure envelops from Res 1-7 to Cording BPS under Min Hour. .. 33 Figure 47: Maximum Transient Pressures in Zone 2N under Minimum Hour Scenario. ........................... 34 Figure 48: Maximum Transient Pressures in Zone 3N under Minimum Hour Scenario. ........................... 34 Figure 49: Maximum and Minimum pressure envelops from Leacock BPS to Ferndale Res under Min
Hour. ................................................................................................................................. 35 Figure 50: Maximum and Minimum pressure envelops from Anne Res to Leacock BPS under Min Hour.35 Figure 51: Maximum Transient Pressures in Zone 2S under Minimum Hour Scenario. ........................... 36 Figure 52: Maximum Transient Pressures in Zone 2S under Minimum Hour Scenario . .......................... 36 Figure 53: Maximum and Minimum pressure envelops from the Treatment Plant to Harvie Res under Min
Hour. ................................................................................................................................. 37 Figure 54: Maximum and Minimum pressure envelops from Well #17_#18 to Harvie Res under Min Hour.37 Figure 55: Maximum Transient Pressures in Zone 3S under Minimum Hour Scenario. ........................... 38 Figure 56: Maximum Transient Pressures in Zone 3S under Minimum Hour Scenario. ........................... 38 Figure 57: Maximum and Minimum pressure envelops from BigBay BPS to Zone 3S Res under Min Hour.39 Figure 58: Maximum and Minimum pressure envelops from Harvie Res to BigBay BPS under Min Hour.39 Figure 59: Maximum and Minimum pressure envelops from 3S BPS to Zone 3S Res under Min Hour. .. 40

Barrie System-Wide Transient Analysis
GENIVAR 1
1. Introduction GENIVAR Inc. was retained by AMEC to conduct a system wide transient analysis of the water network in
the City of Barrie. The analysis is part of an assessment of the City’s water network to service future
populations up to the planning horizon of 2031. The analysis will consider existing transient mitigating
appurtenance of the water network and recommend any necessary protection for future scenarios.
2. Barrie Water Network The City of Barrie water supply is a multi-zonal network consisting of both surface water and ground water
supply. Until recently, groundwater was the only source of supply. In recent years the City has added a
surface water treatment plant to supplement the groundwater supply.
The City’s water network consists of zones 1 2N, 3N, 2S, and 3S as shown in Figure 1.
Figure 1: The City of Barrie Water System consisting of Zones 1, 2N, 3N, 2S, and 3S.

Barrie System-Wide Transient Analysis
GENIVAR 2
Zones 1, 2N, and 3N are supplied by groundwater while Zone 2S is supplied primarily by the surface
water treatment plant and Zone 3S is boosted from 2S. The Top Water Level (TWL) for each of the
zones is shown in Table 1.
Table 1: Top Water Level (m) in each of the pressure zones in Barrie
Zone TWL (m)
1 281.2
2N 324.4
3N 346.9
2S 308.0
3S 350.2
Pipe sizes in the network range from 50 mm to 1,200 mm. A color-coded map of pipe diameters in the
network is shown in Figure 2.
Figure 2: Color-coded map of Transmission and distribution pipes in Barrie.

Barrie System-Wide Transient Analysis
GENIVAR 3
As can be seen, the Barrie water system has a well interconnected network of transmission pipes mainly
connecting the supply facilities to storage tanks in the network. Table 2 and 3 summarize the supply
facilities and storage available in each zone. It should be noted that the table represents 2031 conditions
after zones have been re-aligned.
Table 2: Water Supply Facilities
Zone Water Supply Facilities
1 P_BAYVIEWPARK_1
1 W-WOOD_1
1 W_20_1
1 W_ANNE_1
1 W_CENT1_1
1 W_CENT2_1
1 W_HER1_1
1 W_HER2_1
1 W_JOHN_1
1 W_PERRY_1
1 W_TIFFIN_1
1 W_WELL#19_1
1 W_WELL#21_1
1 W_WELL#22_1
2N P_ANNE_2N
2N P_CODRING_2N
2N RES1-7-2N
2N W_BWOOD_2N
2N W_JSON1_2N
2S P_INNISFIL_2S
2S SWTP
2S W_17_2S
2S W_18_2S
2S W_HUR_2S
3N P_LEACOCK_3N
3S 3SBPS
3S P_BIGBAY_3S

Barrie System-Wide Transient Analysis
GENIVAR 4
Table 3: Water Storage Facilities
Zone Reservoir TWL (m)
1 RES1-7 281.2
1 R_ANNE_1 281.2
2N R_BAYFIELD_2N 324.4
2S R_HARVIE_2S 308.0
3N R_FERNDALE_3N 346.9
3S R_MAP_3S 350.2
3. Model Development The Barrie water model was imported into Bentley’s Hammer to conduct the transient analysis. Hammer
is a software that was originally developed by Environmental Hydraulics Group (EHG) which is now part
of GENIVAR. Two separate demand scenarios were created for the analysis: Minimum Hour (Min Hr)
and Peak Hour (Pk Hr). It is expected that the most sever transients occur during periods of low demand
where the majority of flows are concentrated in the transmission pipes and dissipative forces are minimal
or during the highest demand period where the most number of pumps are operating.
The analysis was conducted for the year 2031 where the flows in the system are the highest and
infrastructure upgrades (new pipes, zonal realignment, etc.) are in place.
4. Transient Analysis The transient scenarios modeled consist of simulating steady state conditions in the network for a period
of five (5) seconds followed by a sudden power failure affecting all the pumps that were ON during steady
state conditions. The power failure turns off power to the pumps and they start to spin slower with each
turn (depending on the pump inertia) until they fully stop. Transients can originate from a variety of
sources. However power failures provide a realistic approach to evaluating transient pressures
experienced in a system.
The immediate impact of power failure is a low pressure wave (downsurge) that originates from the pump
station and travels to the rest of the network. The downsurge gets reflected as a high pressure wave
(upsurge) coming back towards the pump station and the rest of the network. This process continues
until the waves are dissipated through friction losses or through reliefs provided by surge valves.
Depending on the location, the impact of the pressure waves could result in low pressures or high
pressures.

Barrie System-Wide Transient Analysis
GENIVAR 5
The results presented provide an overview of the maximum and minimum transient pressures
experienced in the zones as a result of a global power failure. The results also show the maximum and
minimum head profiles experienced along some of the major transmission mains in the system.
Pipes in the water network are designed to withstand steady state pressures of 100 psi (690 kPa). The
majority of them also have at least a 40% surge allowance for a total of 140 psi (965 kPa). Pressures
above this particularly in the distribution system is a concern since it can lead to pipe breaks, or leaks.
Pipes are also designed to take short-lived vacuum pressures. However, vacuum pressures increase the
risk of groundwater or solid intrusion through the pipe joints and in rare cases to pipe collapse.
4.1 Peak Hour Scenario
The peak demand scenario was simulated with a global power failure and the maximum and minimum
pressures experienced in the network for Zone 1 are shown in Figures 3 and 4. The results are
separated for each of the pressure zones in the network.
4.1.1 Zone 1
Maximum Pressures: The maximum pressures experienced in Zone 1 under transient conditions is below
140 psi with the majority of the Zone experiencing pressures between 80 psi (550 kPa) to 100 psi (690
kPa) as shown in Figure 3. Areas experiencing high pressures are near the discharge of pumping
stations and near the base of the zone where steady state pressures are typically high.
Minimum Pressures: The minimum pressures in Zone 1 under the simulated scenario are shown in
Figure 4. The results show that some areas of the zone do experience vacuum pressures particularly
near the pressure zone boundaries. The majority of the zone however experience minimum pressures in
the range of 40 psi (275 kPa) to 60 psi (415 kPa). There are also significant portions of the zone that
experiences pressures less than 20 psi. These are short-lived and not expected to impact supplied
pressures substantially.
Transmission Profiles: Pressure profiles are provided from the groundwater wells to the storage
reservoirs in Zone 1. The profiles are shown in Figures 5 to 10.
Well#22 to Anne Reservoir (Figure 5): The pressure envelops along this transmission main
shows that a short portion of the pipeline will undergo short-lived vacuum pressures near its discharge
point into the reservoir. The pressure wave reflecting from the reservoir is mostly dissipated and the
upsurge along the main is not much above what it experiences under steady state.
W_Tiffin to Anne Reservoir (Figure 6): The pressure envelop along this main also shows short-
lived vacuum pressures near its high point. The upsurge return wave is mainly dissipated and is only 5-8
psi (35 kPa – 55 kPa) greater than steady state conditions.

Barrie System-Wide Transient Analysis
GENIVAR 6
W_Perry to Anne Reservoir (Figure 7): The pressure envelop along this main also shows a short
vacuum near the reservoir but about a 10 psi (70 kPa) upsurge that is dissipated along its return.
Herr to Anne Reservoir (Figure 8): The is a long transmission pipe from the well to the reservoir.
The pressure profile shows localized upsurge pressures where other transmission mains join. Similar to
the other profiles in Zone1, there is a few hundred meters of pipe that experiences short-lived vacuum
pressures near the reservoir. The upsurge is between 5 – 30 psi (35 kPa – 205 kPa) above steady state
conditions.
Anne to Anne Reservoir (Figure 9): The pressure envelope shows vacuum pressures near the
reservoir with a 10 -15 psi (70 kPa – 105 kPa) upsurge. The surge pressures are quickly dissipated in the
network.
Wood to Anne Reservoir(Figure 10): The pressure envelope is similar to other profiles in Zone 1.
A short section of the main experiences vacuum pressures with an upsurge pressure of 10-15 psi (70 kPa
– 105 kPa) that is mainly dissipated by the time it returns to its origin.
The results on Zone 1 show that the transient pressures experienced are mild with no significant
downsurge or upsurge pressures experienced. The pressures are moderated by Anne Reservoir and the
well-looped network. The ground profiles along the transmission mains are also gently rising slopes that
are favorable from a transient perspective.

Barrie System-Wide Transient Analysis
GENIVAR 7
Figure 3: Maximum Transient Pressures in Zone 1 under Peak Hour Scenario.
Figure 4: Minimum Transient Pressures in Zone 1 under Peak Hour Scenario.

Barrie System-Wide Transient Analysis
GENIVAR 8
Figure 5: Maximum and Minimum pressure envelops from Well #22 to Anne Res under Peak Hour.
Figure 6: Maximum and Minimum pressure envelops from Well W_Tiffin to Anne Res under Peak Hour.

Barrie System-Wide Transient Analysis
GENIVAR 9
Figure 7: Maximum and Minimum pressure envelops from Well W_Perry to Anne Res under Peak Hour.
Figure 8: Maximum and Minimum pressure envelops from Well Herr to Anne Res under Peak Hour.

Barrie System-Wide Transient Analysis
GENIVAR 10
Figure 9: Maximum and Minimum pressure envelops from Well Anne to Anne Res under Peak Hour.
Figure 10: Maximum and Minimum pressure envelops from Well Wood to Anne Res under Peak Hour.

Barrie System-Wide Transient Analysis
GENIVAR 11
4.1.2 Zone 2N
Maximum Pressures: The maximum transient pressures experienced in Zone 2N are below 140 psi (965
kPa) as shown in Figure 11. The majority of the zone will experience surge pressures between 80 – 100
psi (555 kPa – 690 kPa). Some areas (particularly adjacent to Zone 1) will experience pressures
between 100 – 120 psi (690 kPa – 830 kPa).
Minimum Pressures: Most of the zone will have minimum pressures above vacuum pressure as shown in
Figure 12. The minimum pressure in the majority of the zone will range between 40 – 60 psi (275 kPa –
415 kPa). Some areas with low steady state pressures will experience pressures below 20 psi (140 kPa).
However this is short lived as the surge pressures are quickly dissipated in the network.
Transmission Profiles: Transmission profiles are provided from the groundwater wells and booster
stations to the Bayfield Reservoir.
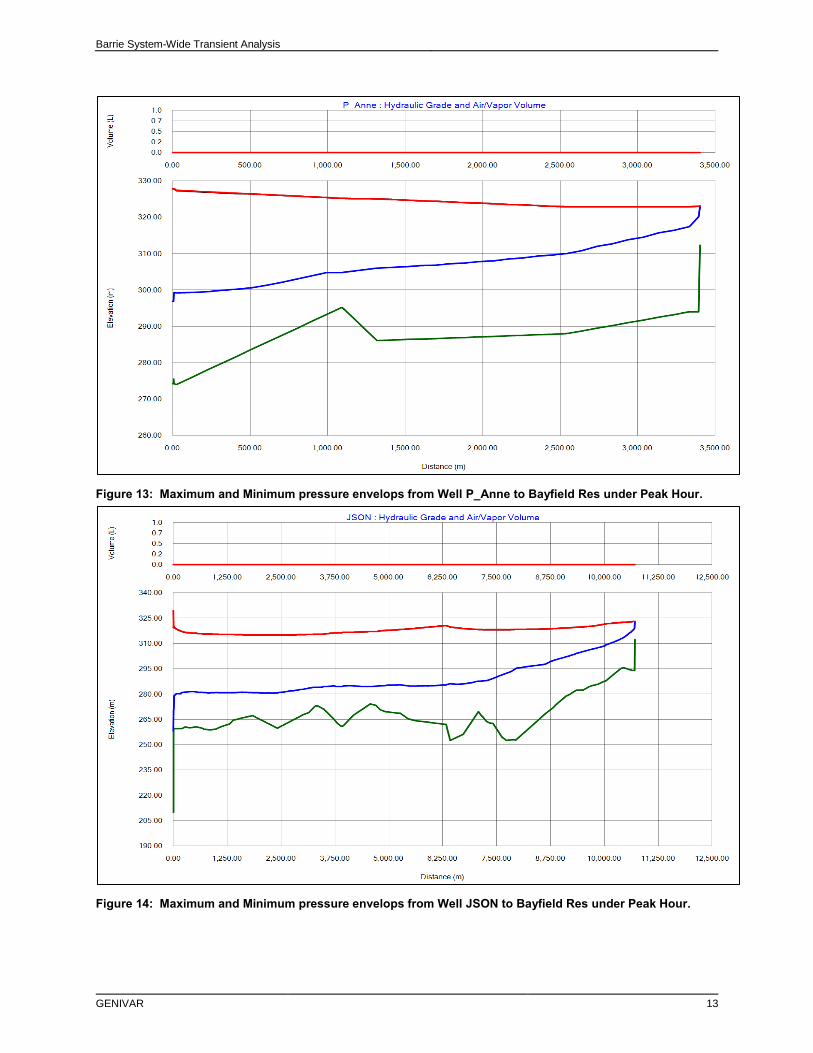
P_Anne to Bayfield Reservoir (Figure 13): The maximum and minimum pressure envelops along
this transmission main show a pressure drop of about 50 psi (345 kPa) during the initial downsurge.
However, the pressures remain above vacuum throughout the length of the watermain and surge is
quickly relieved by the suction and discharge side reservoirs.
JSON to Bayfield Reservoir (Figure 14): The maximum and minimum pressure envelops along
this watermain also show a 50 psi (345 kPa) downsurge, however pressures remain above vacuum all
throughout the pipeline. The surge is quickly dissipated and the returning upsurge is minimal.
Bwood to Bayfield Reservoir (Figure 15): The pressure envelop along this main is similar to other
profiles in Zone 2N and shows the pipeline pressure stays above vacuum and the upsurge is minimal.
Res-1-7 to Bayfield Reservoir (Figure 16): The transmission main does not experience vacuum
pressures and the upsurge pressure is lower than the initial stead state pressure. The pressure wave is
dissipated through the network and relief is provided by the suction and discharge side reservoirs.
Codring Discharge and Suction (Figures 17 and 18): The pressure profiles on the discharge and
suction sides of Codring booster station show that there is an initial downsurge of 50 psi (345 kPa) at the
discharge side while the suction side experiences an upsurge of 30 psi (205 kPa). The surge pressures
are quickly dissipated and return wave is minimal. Relief is provided by the storage reservoirs on the
suction and discharge side.

Barrie System-Wide Transient Analysis
GENIVAR 12
Figure 11: Maximum Transient Pressures in Zone 2N under Peak Hour Scenario.
Figure 12: Maximum Transient Pressures in Zone 2N under Peak Hour Scenario.
Barrie System-Wide Transient Analysis
GENIVAR 13
Figure 13: Maximum and Minimum pressure envelops from Well P_Anne to Bayfield Res under Peak Hour.
Figure 14: Maximum and Minimum pressure envelops from Well JSON to Bayfield Res under Peak Hour.

Barrie System-Wide Transient Analysis
GENIVAR 14
Figure 15: Maximum and Minimum pressure envelops from Well Bwood to Bayfield Res under Peak Hour.
Figure 16: Maximum and Minimum pressure envelops from BPS Res1-7 to Bayfield Res under Peak Hour.

Barrie System-Wide Transient Analysis
GENIVAR 15
Figure 17: Maximum and Minimum pressure envelops from Codring BPS to Bayfield Res under Peak Hour.
Figure 18: Maximum and Minimum pressure envelops from Res 1-7 to Cording BPS under Peak Hour.

Barrie System-Wide Transient Analysis
GENIVAR 16
4.1.3 Zone 3N
Maximum Pressures (Figure 19): The maximum transient pressures experienced in Zone 3N are below
140 psi (965 kPa). The majority of maximum transient pressures in the zone range between 60 to 100 psi
(415 kPa – 690 kPa). The maximum pressures are experienced near the discharge of the booster station
that supplies the zone.
Minimum Pressures (Figure 20): The minimum transient pressures experienced in the zone range
between 20 to 60 psi (140 - 415 kPa). Pressure in the entire zone stays above vacuum pressure during
the down surge.
Transmission Profiles: Transmission profiles are provided from the booster station to the Ferndale
Reservoir.
Leacock Booster to Ferndale Reservoir: The pressure envelope on the discharge and suction
side of Leacock PS is shown in Figures 21 and 22. The discharge side pressure envelop shows that
there is a 50 psi (345 kPa) drop in pressure during the initial down surge at the station. However, the
reflected upsurge is minimal and dissipates quickly. The suction side upsurge pressure is also about 50
psi (345 kPa) above steady state. This leads to a short-lived vacuum pressure throughout the suction
pipeline (from Anne Reservoir to Leacock PS). However, this is quickly relieved by the storage reservoir
and pressure is restored. The upsurge pressure experienced on the suction side is significant. However,
given the low steady state pressure, the overall pressure is still well below 140 psi (965 kPa) limit for most
pipelines.

Barrie System-Wide Transient Analysis
GENIVAR 17
Figure 19: Maximum Transient Pressures in Zone 3N under Peak Hour Scenario.
Figure 20: Maximum Transient Pressures in Zone 3N under Peak Hour Scenario.

Barrie System-Wide Transient Analysis
GENIVAR 18
Figure 21: Maximum and Minimum pressure envelops from Leacock BPS to Ferndale Res under Peak Hour.
Figure 22: Maximum and Minimum pressure envelops from Anne Res to Leacock BPS under Peak Hour.

Barrie System-Wide Transient Analysis
GENIVAR 19
4.1.4 Zone 2S
Maximum Pressures (Figure 23): The maximum transient pressures in Zone 2S varies significantly
depending on the location. Some areas near Wells #17 and #18 (currently Zone 1 wells but will be
transferred into 2S) experience pressures between 120 – 140 psi. Other high pressure areas are limited
to the areas near the boundary with Zone 1 (low lying areas). However, the majority of the zone
experiences pressures between 100 – 120 psi.
Minimum Pressures: Some areas of the Zone will go into vacuum pressures as shown in Figure 24. A
significant portion of the Zone will experience pressures below 20 psi and the rest of the district will have
minimum pressures varying between 40 to 60 psi. The low pressures are short lived as relief is provided
from Harvie reservoir.
Transmission Profiles: Transmission profiles are provided from the Plant, and ground water wells to the
Harvie Reservoir.
Plant to Harvie Reservoir: The maximum and minimum pressure envelops from the plant to
Harvie Reservoir is shown in Figure 25. The minimum envelop shows that there is about a 70 psi
downsurge associated with the power failure at plant leading to vacuum pressures in about a 1 km of the
pipeline. The upsurge from Harvie reservoir is minimal and only 20 psi greater than the steady state
pressures and the surge is quickly dissipated in the network.
Well #17_#18 to Harvie Reservoir: The maximum and minimum pressure envelops from
groundwater wells #17 and #18 are shown in Figure 26. The results show that about 2.5 km of this
pipeline will have full vacuum pressures under a power failure scenario. Because this pipeline has few
connections along its path, little relief is provided by the network. The resulting upsurge from Harvie
Reservoir is about 30 psi above steady state pressures. However the surge waves are quickly dissipated
by friction and relieved by the reservoir.

Barrie System-Wide Transient Analysis
GENIVAR 20
Figure 23: Maximum Transient Pressures in Zone 2S under Peak Hour Scenario.
Figure 24: Maximum Transient Pressures in Zone 2S under Peak Hour Scenario.

Barrie System-Wide Transient Analysis
GENIVAR 21
Figure 25: Maximum and Minimum pressure envelops from the Treatment Plant to Harvie Res under Peak Hour.
Figure 26: Maximum and Minimum pressure envelops from Well #17_#18 to Harvie Res under Peak Hour.

Barrie System-Wide Transient Analysis
GENIVAR 22
4.1.5 Zone 3S
Maximum Pressures (Figure 27): The maximum transient pressure in some of the low lying areas of
Zone 3S range between 120 – 140 psi. However, the majority of the maximum transient pressures in the
zone range between 60 to 80 psi.
Minimum Pressures (Figure 28): Some areas of the Zone experience minimum transient pressures less
than 20 psi. However, this is short lived and the pressure is restored by the reservoir.
Transmission Profiles: Transmission profiles are provided from the booster pumping stations to the Zone
3S Reservoir.
Big Bay BPS (Figures 29 and 30): The maximum and minimum pressure envelops show that the
maximum pressure envelop does not rise above steady state pressures. There is a 60 psi drop under the
downsurge, however the pressure stays well above vacuum. On the suction side of BigBay BPS, the
initial upsurge is 30 psi higher than steady state pressures. However, the steady state pressure is low
and thus even with the upsurge, the pressures are well below 140 psi. The suction pipe also goes into
short lived vacuum but is relieved quickly by the Harvie reservoir.
3SBPS (Figure 31): The maximum and minimum pressure envelops show that maximum
pressures do not go above steady state while minimum pressures stay well above vacuum.

Barrie System-Wide Transient Analysis
GENIVAR 23
Figure 27: Maximum Transient Pressures in Zone 3S under Peak Hour Scenario.
Figure 28: Maximum Transient Pressures in Zone 3S under Peak Hour Scenario.

Barrie System-Wide Transient Analysis
GENIVAR 24
Figure 29: Maximum and Minimum pressure envelops from BigBay BPS to Zone 3S Res. under Peak Hour
Figure 30: Maximum and Minimum pressure envelops from Harvie Res to BigBay BPS under Peak Hour.

Barrie System-Wide Transient Analysis
GENIVAR 25
Figure 31: Maximum and Minimum pressure envelops from 3S BPS to Zone 3S Res under Peak Hour.
4.2 Min Hour Scenario
The results for the Min Hour Scenario power failure is shown in Figures 32 to 59. The results are very
similar to the peak hour scenario results. The majority of transient pressures experienced are mild and
significant upsurge and downsurge events are short lived. High and low pressures are a concern in Wells
#17 and #18. The suction sides of booster stations also show greater pressures than steady state and go
into momentary vacuums. But the pressures are quickly restored by the presence of reservoirs.

Barrie System-Wide Transient Analysis
GENIVAR 26
4.2.1 Zone 1
Figure 32: Maximum Transient Pressures in Zone 1 under Minimum Hour Scenario.
Figure 33: Maximum Transient Pressures in Zone 1 under Minimum Hour Scenario.

Barrie System-Wide Transient Analysis
GENIVAR 27
Figure 34: Maximum and Minimum pressure envelops from Well #22 to Anne Res under Min Hour.
Figure 35: Maximum and Minimum pressure envelops from Well W_Tiffin to Anne Res under Min Hour.

Barrie System-Wide Transient Analysis
GENIVAR 28
Figure 36: Maximum and Minimum pressure envelops from Well W_Perry to Anne Res under Min Hour.
Figure 37: Maximum and Minimum pressure envelops from Well Herr to Anne Res under Min Hour.

Barrie System-Wide Transient Analysis
GENIVAR 29
Figure 38: Maximum and Minimum pressure envelops from Well Anne to Anne Res under Min Hour.
Barrie System-Wide Transient Analysis
GENIVAR 30
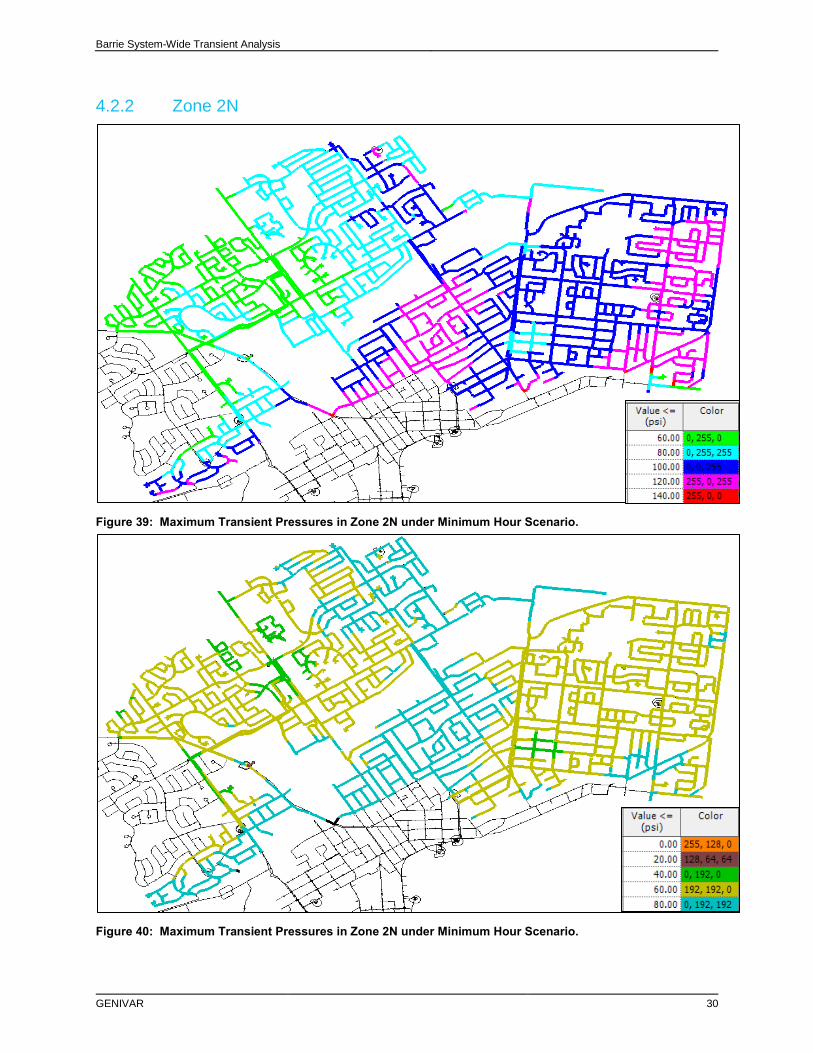
4.2.2 Zone 2N
Figure 39: Maximum Transient Pressures in Zone 2N under Minimum Hour Scenario.
Figure 40: Maximum Transient Pressures in Zone 2N under Minimum Hour Scenario.

Barrie System-Wide Transient Analysis
GENIVAR 31
Figure 41: Maximum and Minimum pressure envelops from Well P_Anne to Bayfield Res under Min Hour.
Figure 42: Maximum and Minimum pressure envelops from Well JSON to Bayfield Res under Min Hour.

Barrie System-Wide Transient Analysis
GENIVAR 32
Figure 43: Maximum and Minimum pressure envelops from Well Bwood to Bayfield Res under Min Hour.
Figure 44: Maximum and Minimum pressure envelops from BPS Res1-7 to Bayfield Res under Min Hour.

Barrie System-Wide Transient Analysis
GENIVAR 33
Figure 45: Maximum and Minimum pressure envelops from Codring BPS to Bayfield Res under Min Hour.
Figure 46: Maximum and Minimum pressure envelops from Res 1-7 to Cording BPS under Min Hour.

Barrie System-Wide Transient Analysis
GENIVAR 34
4.2.3 Zone 3N
Figure 47: Maximum Transient Pressures in Zone 2N under Minimum Hour Scenario.
Figure 48: Maximum Transient Pressures in Zone 3N under Minimum Hour Scenario.

Barrie System-Wide Transient Analysis
GENIVAR 35
Figure 49: Maximum and Minimum pressure envelops from Leacock BPS to Ferndale Res under Min Hour.
Figure 50: Maximum and Minimum pressure envelops from Anne Res to Leacock BPS under Min Hour.

Barrie System-Wide Transient Analysis
GENIVAR 36
4.2.4 Zone 2S
Figure 51: Maximum Transient Pressures in Zone 2S under Minimum Hour Scenario.
Figure 52: Maximum Transient Pressures in Zone 2S under Minimum Hour Scenario .

Barrie System-Wide Transient Analysis
GENIVAR 37
Figure 53: Maximum and Minimum pressure envelops from the Treatment Plant to Harvie Res under Min Hour.
Figure 54: Maximum and Minimum pressure envelops from Well #17_#18 to Harvie Res under Min Hour.
Barrie System-Wide Transient Analysis
GENIVAR 38
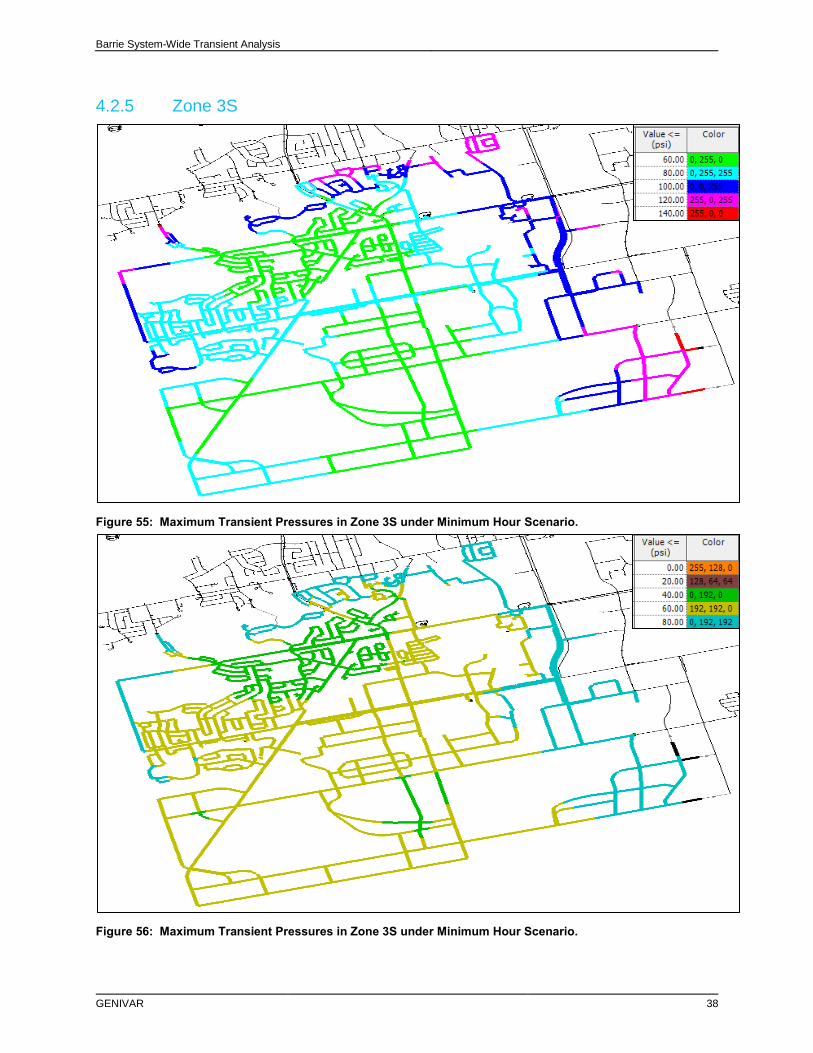
4.2.5 Zone 3S
Figure 55: Maximum Transient Pressures in Zone 3S under Minimum Hour Scenario.
Figure 56: Maximum Transient Pressures in Zone 3S under Minimum Hour Scenario.

Barrie System-Wide Transient Analysis
GENIVAR 39
Figure 57: Maximum and Minimum pressure envelops from BigBay BPS to Zone 3S Res under Min Hour.
Figure 58: Maximum and Minimum pressure envelops from Harvie Res to BigBay BPS under Min Hour.
Barrie System-Wide Transient Analysis
GENIVAR 40
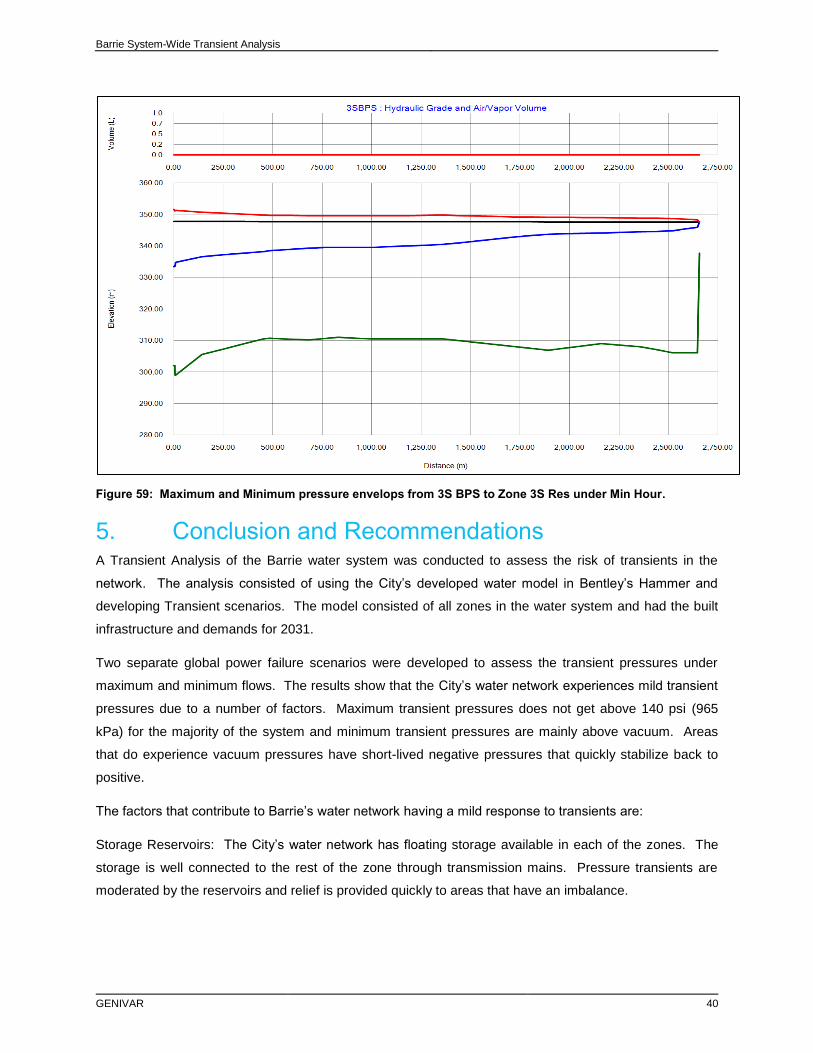
Figure 59: Maximum and Minimum pressure envelops from 3S BPS to Zone 3S Res under Min Hour.
5. Conclusion and Recommendations A Transient Analysis of the Barrie water system was conducted to assess the risk of transients in the
network. The analysis consisted of using the City’s developed water model in Bentley’s Hammer and
developing Transient scenarios. The model consisted of all zones in the water system and had the built
infrastructure and demands for 2031.
Two separate global power failure scenarios were developed to assess the transient pressures under
maximum and minimum flows. The results show that the City’s water network experiences mild transient
pressures due to a number of factors. Maximum transient pressures does not get above 140 psi (965
kPa) for the majority of the system and minimum transient pressures are mainly above vacuum. Areas
that do experience vacuum pressures have short-lived negative pressures that quickly stabilize back to
positive.
The factors that contribute to Barrie’s water network having a mild response to transients are:
Storage Reservoirs: The City’s water network has floating storage available in each of the zones. The
storage is well connected to the rest of the zone through transmission mains. Pressure transients are
moderated by the reservoirs and relief is provided quickly to areas that have an imbalance.

Barrie System-Wide Transient Analysis
GENIVAR 41
Ground Elevations: The pipe profiles shows in the Figures illustrate that the majority of transmission
mains have gently rising profiles that are well suited to prevent transient issues such as column
separation.
Transmission Network: The City’s transmission network is well-looped and interconnected. This allows
for quick dissipation of surge waves within the network. As the results illustrate, in most cases after the
initial significant downsurge, the reflected upsurge is minimal and by the time the reflected wave returns
to the supply source, it is dissipated.
There are however a few areas of concern that need to be visited in further detail.
Wells #17 and #18: These two wells are Zone 1 wells that are to be transferred to Zone 2S in the future
where it will pump directly to Harvie Res. as shown in Figures 26 and 54. The ground profile for the
transmission from the wells to the reservoir shows that the ground elevation rises above the height of the
discharge reservoir at its midway point. Under typical operations, the high point will have a pressure of
10-15 psi (70 -105 kPa). However, if the wells are turned off the reservoir does not have the hydraulic
gradeline to maintain a positive pressure throughout the pipeline. This will lead to column separation at
the high parts of the pipeline and upon restart of the pumps, it will lead to high pressures that can be
damaging to the pipeline and well pumps. The results of the power failure also shows that a large parts
of the transmission main go into full vacuum under a down surge. This can be rectified by installing
Combination Air Valves (CAVs) at the high points of the pipeline. Similarly soft-starters can be installed at
the pumps to reduce surges during pump starts.
Suction side of Booster Stations: The results show that significant upsurge and downsurge occurs on the
suction side of booster pumps. In many cases where the suction side is next to a reservoir, the surge is
quickly dampened. However, in Cording BPS, Leacock BPS and BigBay BPS, the suction pipeline
experiences pressure fluctuations that are excessive. These should be further analyzed for individual
stations and verified in the field. In cases where the infield pressure monitoring verifies the modeling
results, surge relief valves should be installed.
Other recommendations are general and are ‘rules of thumb’ that should be applied to any system to
reduce the risk of transients such as:
-Soft-starters on pumps
-Surge Relief/Anticipation valves at pumping stations
-Regular maintenance on Air Valves
-After a power failure, at least 5 minutes should be allowed to pass before pump re-start

Barrie System-Wide Transient Analysis
GENIVAR 42
-Pressure and flow from each of the supply points should be connected to the SCADA system so they
can monitored
-Pressure monitoring should be conducted at low and high areas of the zone where the results of
transient events are more prominent
-PRV valves should be regularly maintained to ensure they are functioning as designed and their set-
points checked in the field
-Maintenance work on reservoirs that require shutdown should be modeled to ensure the system is not
put on undue levels of risk