Appendix K Meat, Milk, and Egg Transfer Coefficients Support Document for Exposure Assessment and...
32
Technical Support Document for Exposure Assessment and Stochastic Analysis, FINAL, August, 2012 K-1 Appendix K Meat, Milk, and Egg Transfer Coefficients K.1 Chemical Transfer Coefficient (Tco) Derivation Methodology Meat, cow’s milk and eggs can become contaminated when food-producing animals inhale or ingest contaminated materials that then transfer into these food products. The transfer coefficients (Tco) presented in Tables K.1 and K.2 were derived from published studies investigating chemical concentrations in food products resulting from animal intake of the chemical. In most studies, the chemicals were mixed into the animal’s feed, although some studies investigated the bioaccumulation of chemicals from contaminated soil in poultry feed. The Tcos, expressed in day/kilogram (d/kg), represent the ratio of contaminant concentration in fresh weight animal product (in mg/kg, for example) to the daily intake of contaminant by the animal (in mg/day). Tcos were determined only for the main food-producing animal sources, including cow’s milk, eggs, and meat from cattle, pigs and chickens. The studies selected to estimate Tcos were usually of long enough duration to allow steady-state concentrations to be reached in milk-, meat- and egg-producing animals. Steady-state concentrations in the tissues are a function of the tissue elimination half- lives (MacLachlan and Bhula, 2008). Assuming a first-order process, an exposure duration that is five times greater than the tissue elimination half-life has been used to represent time to steady-state conditions (i.e., the ratio of the measured concentration at five half-lives to steady-state concentration is 0.968). Realistically, fast-growing animals used for food may never attain a true tissue steady- state for persistent organic chemicals due to the competing factors of growth, fattening and lactation (Fries, 1996; Hoogenboom, 2005). A steady-state concentration in food- producing animals will likely be reached more quickly than in humans due to these factors and may even show declining levels in fat during the fattening phase of the animals’ prior to slaughter (Fries, 1996). The most practical approach is to base the Tco on exposure studies that expose the animal for a majority of the animals’ life span up to or near marketable weight. The studies that followed tissue and milk contaminant levels during exposures over most of the animals’ productive lifespan have shown that a sufficient semblance of steady-state is reached during the productive life of lactating dairy cattle and laying hens, and in meat animals prior to slaughter. Default consumption rates of contaminated feed were used for estimating Tcos if no consumption data were provided in the primary studies. Usually, the food-producing animals in biotransfer studies were caged or treated similar to commercial farming practices. However, this exposure assessment document is primarily concerned with small farm or family farm situations in which the food-producing animals may be allowed to roam more freely than in commercial operations. This is particularly relevant for pigs and chickens. Free-range and organic farming will result in greater feed intake, slower
Transcript of Appendix K Meat, Milk, and Egg Transfer Coefficients Support Document for Exposure Assessment and...

Technical Support Document for Exposure Assessment and Stochastic Analysis, FINAL, August, 2012
K-1
Appendix K
Meat, Milk, and Egg Transfer Coefficients K.1 Chemical Transfer Coefficient (Tco) Derivation Methodology
Meat, cow’s milk and eggs can become contaminated when food-producing animals inhale or ingest contaminated materials that then transfer into these food products. The transfer coefficients (Tco) presented in Tables K.1 and K.2 were derived from published studies investigating chemical concentrations in food products resulting from animal intake of the chemical. In most studies, the chemicals were mixed into the animal’s feed, although some studies investigated the bioaccumulation of chemicals from contaminated soil in poultry feed. The Tcos, expressed in day/kilogram (d/kg), represent the ratio of contaminant concentration in fresh weight animal product (in mg/kg, for example) to the daily intake of contaminant by the animal (in mg/day). Tcos were determined only for the main food-producing animal sources, including cow’s milk, eggs, and meat from cattle, pigs and chickens.
The studies selected to estimate Tcos were usually of long enough duration to allow steady-state concentrations to be reached in milk-, meat- and egg-producing animals. Steady-state concentrations in the tissues are a function of the tissue elimination half-lives (MacLachlan and Bhula, 2008). Assuming a first-order process, an exposure duration that is five times greater than the tissue elimination half-life has been used to represent time to steady-state conditions (i.e., the ratio of the measured concentration at five half-lives to steady-state concentration is 0.968).
Realistically, fast-growing animals used for food may never attain a true tissue steady-state for persistent organic chemicals due to the competing factors of growth, fattening and lactation (Fries, 1996; Hoogenboom, 2005). A steady-state concentration in food-producing animals will likely be reached more quickly than in humans due to these factors and may even show declining levels in fat during the fattening phase of the animals’ prior to slaughter (Fries, 1996). The most practical approach is to base the Tco on exposure studies that expose the animal for a majority of the animals’ life span up to or near marketable weight. The studies that followed tissue and milk contaminant levels during exposures over most of the animals’ productive lifespan have shown that a sufficient semblance of steady-state is reached during the productive life of lactating dairy cattle and laying hens, and in meat animals prior to slaughter.
Default consumption rates of contaminated feed were used for estimating Tcos if no consumption data were provided in the primary studies. Usually, the food-producing animals in biotransfer studies were caged or treated similar to commercial farming practices. However, this exposure assessment document is primarily concerned with small farm or family farm situations in which the food-producing animals may be allowed to roam more freely than in commercial operations. This is particularly relevant for pigs and chickens. Free-range and organic farming will result in greater feed intake, slower
Technical Support Document for Exposure Assessment and Stochastic Analysis, FINAL, August, 2012
K-2
growth, and potentially greater contaminant exposure from range forage and soil ingestion (MacLachlan, 2010).
Specifically regarding poultry food products, the term “poultry” refers to a number of avian species that are food sources for humans. Due to the substantial human consumption of eggs and meat from chickens, the Tcos described here were exclusively based on data from chickens, laying hens (usually Leghorns) for the egg Tcos and usually meat chickens (broilers) for the meat Tcos. However, these values could also be reasonably applied to other home-raised avian species, such as turkeys and quail.
Compared to chickens and dairy cattle, fewer swine and beef cattle exposure studies could be found to estimate the biotransfer of ingested contaminants to muscle tissue. Rather than simply adopting the same cattle Tco values for swine when biotransfer data are lacking, contaminant transfer models are employed by OEHHA to estimate differences in chemical accumulation among livestock. For transfer of organic lipophilic chemicals, MacLachlan (2009) developed Physiologically Based Pharmacokinetic ( PBPK ) models to derive scaling factors that are used to assist the extrapolation of transfer studies, carried out most often on lactating dairy cows, to beef cattle and pigs. Given the estimated half-life (or extraction ratio for liver) of the chemical in the animal and the ratio of the chemical concentration in milk fat to body fat of dairy cows, the appropriate scaling factor can be selected and combined with the Tco derived from lactating dairy cattle to improve estimates of residues in beef cattle and pigs.
For metal Tcos, a metabolic weight adjustment can be made that accounts for differences in tissue transfer of chemicals in animals of different weight (i.e., a lower metabolic rate is expected in larger animals such as cattle compared to smaller animals such as swine, resulting in slower rates of transfer into tissues). A similar metabolic weight approach has been used to estimate the transfer of metals to dairy cattle from data in sheep (Crout et al., 2004). This adjustment is reasonable considering most of the metal compounds of interest have passive uptake and elimination processes and are subject to little or no metabolism.
The effect of metabolic weight is apparent when comparing the meat Tco values between chicken and cattle in Tables K-1 and K-2. Where published data were used to directly estimate individual chemical Tco values, the chicken Tcos were greater than cattle Tcos. For chemicals in which biotransfer could not be estimated from published reports in pigs, a default meat Tco was estimated with the following formula:
Pig Tcoi = (W0.75cow) / (W0.75
pig) x cow Tcoi Eq. K-1 Where: W0.75
cow = live-weight in kg of a cow to the 0.75 power W0.75
pig = live weight in kg of a pig to the 0.75 power Pig Tcoi = pig meat Tco for chemical i Cattle Tcoi = cow meat Tco for chemical i
Using average live weights of 500 kg for cattle and 60 kg for swine, the metabolic weight ratio adjustment is 4.8.
Technical Support Document for Exposure Assessment and Stochastic Analysis, FINAL, August, 2012
K-3
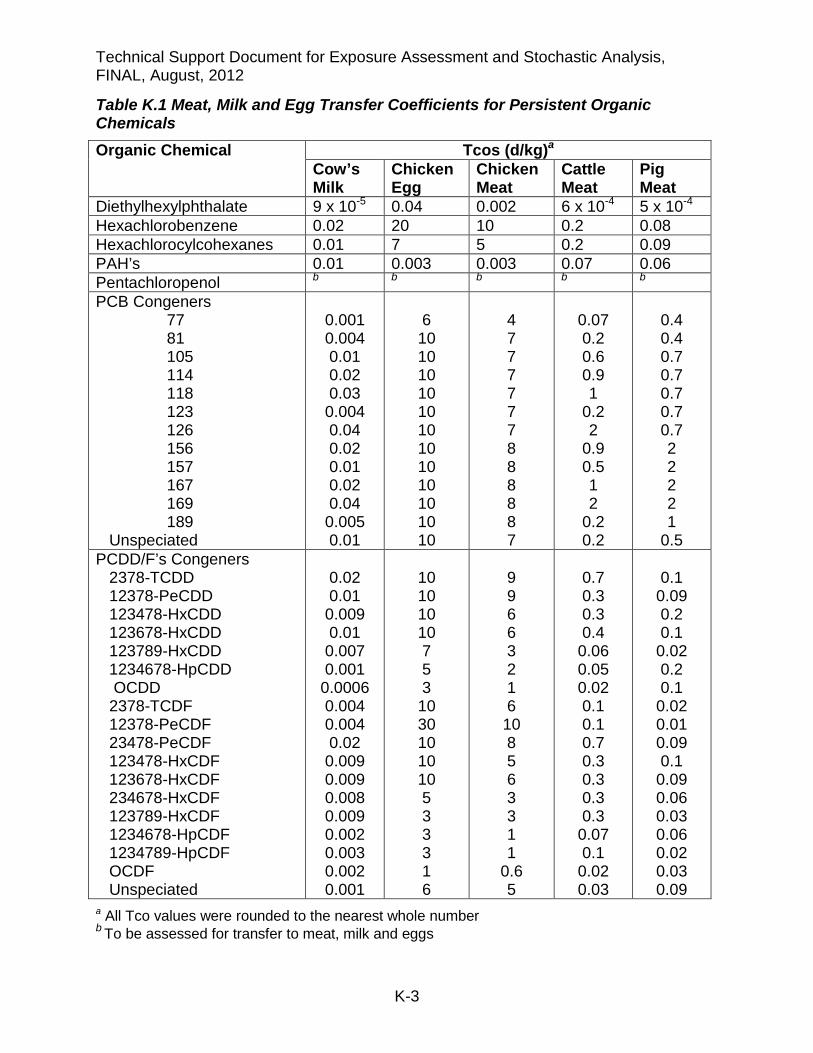
Table K.1 Meat, Milk and Egg Transfer Coefficients for Persistent Organic Chemicals Organic Chemical Tcos (d/kg)a
Cow’s Milk
Chicken Egg
Chicken Meat
Cattle Meat
Pig Meat
Diethylhexylphthalate 9 x 10⁻⁵ 0.04 0.002 6 x 10⁻⁴ 5 x 10⁻⁴ Hexachlorobenzene 0.02 20 10 0.2 0.08 Hexachlorocylcohexanes 0.01 7 5 0.2 0.09 PAH’s 0.01 0.003 0.003 0.07 0.06 Pentachloropenol b b b b b PCB Congeners 77 81 105 114 118 123 126 156 157 167 169 189 Unspeciated
0.001 0.004 0.01 0.02 0.03 0.004 0.04 0.02 0.01 0.02 0.04 0.005 0.01
6 10 10 10 10 10 10 10 10 10 10 10 10
4 7 7 7 7 7 7 8 8 8 8 8 7
0.07 0.2 0.6 0.9 1
0.2 2
0.9 0.5 1 2
0.2 0.2
0.4 0.4 0.7 0.7 0.7 0.7 0.7 2 2 2 2 1
0.5 PCDD/F’s Congeners 2378-TCDD 12378-PeCDD 123478-HxCDD 123678-HxCDD 123789-HxCDD 1234678-HpCDD OCDD 2378-TCDF 12378-PeCDF 23478-PeCDF 123478-HxCDF 123678-HxCDF 234678-HxCDF 123789-HxCDF 1234678-HpCDF 1234789-HpCDF OCDF Unspeciated
0.02 0.01 0.009 0.01 0.007 0.001
0.0006 0.004 0.004 0.02 0.009 0.009 0.008 0.009 0.002 0.003 0.002 0.001
10 10 10 10 7 5 3 10 30 10 10 10 5 3 3 3 1 6
9 9 6 6 3 2 1 6 10 8 5 6 3 3 1 1
0.6 5
0.7 0.3 0.3 0.4
0.06 0.05 0.02 0.1 0.1 0.7 0.3 0.3 0.3 0.3
0.07 0.1
0.02 0.03
0.1
0.09 0.2 0.1
0.02 0.2 0.1
0.02 0.01 0.09 0.1
0.09 0.06 0.03 0.06 0.02 0.03 0.09
a All Tco values were rounded to the nearest whole number b To be assessed for transfer to meat, milk and eggs
Technical Support Document for Exposure Assessment and Stochastic Analysis, FINAL, August, 2012
K-4
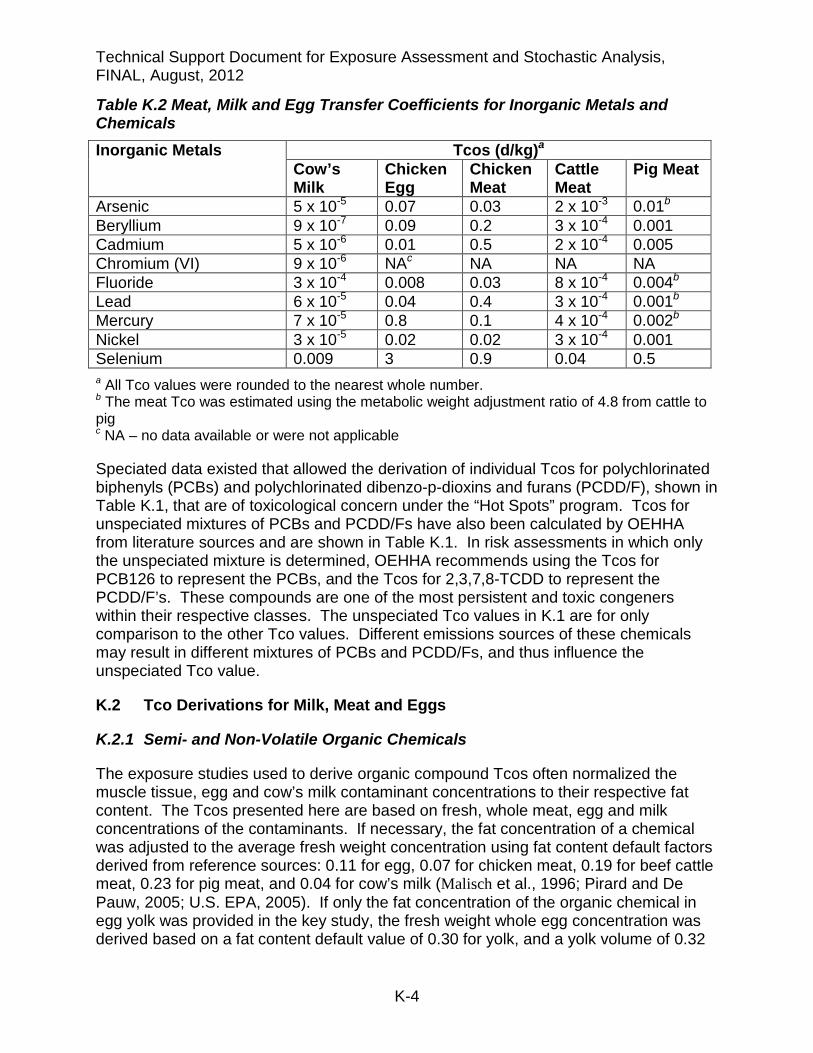
Table K.2 Meat, Milk and Egg Transfer Coefficients for Inorganic Metals and Chemicals
Inorganic Metals Tcos (d/kg)a Cow’s Milk
Chicken Egg
Chicken Meat
Cattle Meat
Pig Meat
Arsenic 5 x 10⁻⁵ 0.07 0.03 2 x 10⁻³ 0.01b Beryllium 9 x 10⁻⁷ 0.09 0.2 3 x 10⁻⁴ 0.001 Cadmium 5 x 10⁻⁶ 0.01 0.5 2 x 10⁻⁴ 0.005 Chromium (VI) 9 x 10⁻⁶ NAc NA NA NA Fluoride 3 x 10⁻⁴ 0.008 0.03 8 x 10⁻⁴ 0.004b Lead 6 x 10⁻⁵ 0.04 0.4 3 x 10⁻⁴ 0.001b Mercury 7 x 10⁻⁵ 0.8 0.1 4 x 10⁻⁴ 0.002b Nickel 3 x 10⁻⁵ 0.02 0.02 3 x 10⁻⁴ 0.001 Selenium 0.009 3 0.9 0.04 0.5 a All Tco values were rounded to the nearest whole number. b The meat Tco was estimated using the metabolic weight adjustment ratio of 4.8 from cattle to pig c NA – no data available or were not applicable
Speciated data existed that allowed the derivation of individual Tcos for polychlorinated biphenyls (PCBs) and polychlorinated dibenzo-p-dioxins and furans (PCDD/F), shown in Table K.1, that are of toxicological concern under the “Hot Spots” program. Tcos for unspeciated mixtures of PCBs and PCDD/Fs have also been calculated by OEHHA from literature sources and are shown in Table K.1. In risk assessments in which only the unspeciated mixture is determined, OEHHA recommends using the Tcos for PCB126 to represent the PCBs, and the Tcos for 2,3,7,8-TCDD to represent the PCDD/F’s. These compounds are one of the most persistent and toxic congeners within their respective classes. The unspeciated Tco values in K.1 are for only comparison to the other Tco values. Different emissions sources of these chemicals may result in different mixtures of PCBs and PCDD/Fs, and thus influence the unspeciated Tco value.
K.2 Tco Derivations for Milk, Meat and Eggs
K.2.1 Semi- and Non-Volatile Organic Chemicals
The exposure studies used to derive organic compound Tcos often normalized the muscle tissue, egg and cow’s milk contaminant concentrations to their respective fat content. The Tcos presented here are based on fresh, whole meat, egg and milk concentrations of the contaminants. If necessary, the fat concentration of a chemical was adjusted to the average fresh weight concentration using fat content default factors derived from reference sources: 0.11 for egg, 0.07 for chicken meat, 0.19 for beef cattle meat, 0.23 for pig meat, and 0.04 for cow’s milk (Malisch et al., 1996; Pirard and De Pauw, 2005; U.S. EPA, 2005). If only the fat concentration of the organic chemical in egg yolk was provided in the key study, the fresh weight whole egg concentration was derived based on a fat content default value of 0.30 for yolk, and a yolk volume of 0.32
Technical Support Document for Exposure Assessment and Stochastic Analysis, FINAL, August, 2012
K-5
for the whole egg. If the study determined the fat content in food products, these were used for adjustment to fresh weight concentration in lieu of the default values.
For chicken meat, organic chemical content in skin was usually not included by the studies, although skin has a higher fat content and is often consumed with the meat. This would suggest that the skin could have a higher contaminant content than the muscle tissue. Due to lack of skin chemical concentration data and potential loss or destruction of organic chemicals in skin when the meat is cooked, the concentration of chemical in skin was considered similar to the concentration of a chemical in muscle for Tco derivation.
In general, extensive bioaccumulation of persistent, organic chemicals is not as great in either beef or dairy cattle as might be expected, even though beef cattle have no major fat excretion pathway as dairy cattle do with milk production (McLachlan, 1996). This finding is a result of the short life spans and rapid growth dilution that is characteristic of modern animal husbandry. A beef cow develops 100-150 kg of fat in which to deposit the chemical that it absorbs over its 1.5-year life. While a milk cow might excrete its absorbed contaminant in 300 kg of milk fat over the same period, it consumes more feed (and contaminant) in this time. Hence, the chemical concentrations in milk fat were not always much lower compared to beef fat (McLachlan, 1996; RTI, 2005).
Interestingly, the lower-than-expected bioaccumulation of persistent, hydrophobic chemicals in cow’s milk does not translate to human milk (McLachlan, 1996). Persistent, organic chemicals tend to bioaccumulate in human milk by an order of magnitude greater than in cow’s milk, presuming similar chemical concentrations in the diet on a mg/kg basis. This pronounced difference in bioaccumulation is due to a more limited capability of humans to excrete these chemicals. In addition, the extent of contaminant absorption from food in the human digestive tract may be greater. For example, nursing human infants absorb over 95% of PCBs and most PCDD/Fs while absorption in cows for these same compounds averages closer to 80%.
K.2.1.1 Diethylhexylphthalate (DEHP)
At high concentrations (1% DEHP in feed), Tcos for chicken eggs and breast muscle were estimated by OEHHA to be 0.04 and 0.002 d/kg (Ishida et al., 1981; Ishida, 1993). The low transfer values for DEHP relative to other organic chemicals are likely due to rapid metabolism and excretion of DEHP in the chicken.
In dairy cattle, DEHP was observed to be extensively metabolized prior to secretion into the milk (Bluthgen and Ruoff, 1998). OEHHA surmised that much of the metabolism begins in the rumen, where DEHP ester-bond cleavage would occur. Consequently, steady-state is reached in about 7 days and a low milk Tco of 9 x 10⁻⁵ d/kg was calculated by OEHHA. Cessation of DEHP administration resulted in nearly undetectable milk levels within 3 days post-exposure. No data could be found regarding residue levels of DEHP in cattle muscle, so a Tco of 4 x 10⁻⁴ d/kg was estimated after adjusting for the average fat content difference between cow’s milk and cattle muscle. PBPK modeling by MacLachlan (2009) observed a ratio of about 1.5 for residues of
Technical Support Document for Exposure Assessment and Stochastic Analysis, FINAL, August, 2012
K-6
highly metabolized lipophilic compounds, such as DEHP, in body fat of non-lactating cows and steers to the same compound in body fat of lactating dairy cows. Thus, the Tco of 4 x 10⁻⁴ d/kg was increased by a factor of 1.5 to arrive at a Tco of 6 x 10⁻⁴ d/kg for DEHP in meat of beef cattle.
Bioaccumulation data are lacking for DEHP in pigs. Thus, a scaling factor by MacLachlan (2009) was applied for the transfer of lipophilic xenobiotics from lactating cattle to other livestock species. For chemicals such as DEHP that are extensively metabolized in the animal and have a short half-life (t1/2 <5.8 d in lactating cows), the ratio of simulated residues in the body fat of pigs to the body fat of lactating dairy cows was essentially equal to 1. Therefore, the dairy cattle muscle Tco determined above (4 x 10⁻⁴ d/kg) was only adjusted for the difference in muscle fat content in pig to beef cattle (ratio = 1.2) to arrive at a default Tco of 5 x 10⁻⁴ d/kg for pig meat.
K.2.1.2 Hexachlorobenzene (HCB)
HCB in the atmosphere is predicted to be predominantly in the vapor phase (Lane et al., 1992). However, due to the extreme persistence of HCB and other chlorinated organic compounds in the environment, deposition and accumulation of non-volatile forms of these organics onto crops, soil and sediment are significant pathways of exposure (Eisenreich et al., 1981; Kelly et al., 1991; Douben et al., 1997; Horstmann and McLachlan, 1998).
In dairy cattle, two studies recorded nearly identical cow’s milk HCB Tcos of 0.015-0.016 d/kg with 60-70 days of exposure (Fries and Marrow, 1976; Firestone et al., 1979). The data suggested near steady-state levels in milk were attained with this duration of exposure. A higher Tco of 0.030 d/kg was recorded in pregnant dairy cattle after about 8 months of exposure (Vreman et al., 1980). Steady-state was reached in milk of the pregnant dairy cattle after about 5 months. The average HCB Tco from these three studies is 0.02 d/kg.
In his review, Kan (1978) provided bioaccumulation data from which to calculate Tcos for HCB. The Tco for egg and chicken muscle were estimated at 16 and 13 d/kg, respectively.
In beef cattle, steady-state levels of HCB were at or near attainment in subcutaneous fat following ten weeks of exposure in the feed (Dingle and Palmer, 1977; RTI, 2005). A muscle Tco estimated from this study was 0.090 d/kg. Exposure to HCB in dairy cattle provided similar Tco values. A muscle Tco of 0.070 d/kg was calculated from HCB concentrations in body fat of lactating dairy cattle following 60 day exposure in the feed (Fries and Marrow, 1976). An eight-month HCB exposure in dairy cattle resulted in a muscle Tco of 0.16 d/kg (Vreman et al., 1980). Because the Vreman study provided a considerably longer exposure overall for cattle, the Tco was based on this study. The PBPK-based scaling factor data by MacLachlan (2009) was applied to estimate the transfer of HCB from lactating cattle to body fat of steers. Using data supplied by Fries and Marrow (1976), a slow elimination half-life of HCB in lactating dairy cattle (average: 50 days) and a small ratio for milk fat concentration over body fat concentration at
Technical Support Document for Exposure Assessment and Stochastic Analysis, FINAL, August, 2012
K-7
steady state (0.04) suggests that the PBPK-generated ratio of simulated HCB level in body fat of steers to body fat of lactating dairy cows would be about 1.5. The final default beef Tco is 0.24 d/kg (0.16 d/kg x 1.5)
No data for HCB accumulation in pig muscle tissue could be found. Therefore, a PBPK-based scaling factor was also applied to estimate the transfer of HCB from lactating cattle to pigs (MacLachlan, 2009). The PBPK model results generated a ratio of 0.5 for the simulated HCB level in body fat of pigs to body fat of lactating dairy cows. The final default pig Tco is 0.08 d/kg (0.16 d/kg x 0.5)
K.2.1.3 Hexachlorocyclohexanes (HCH)
HCH Tcos of 7.3 d/kg for egg and 5.1 d/kg for chicken meat were calculated from contaminated feed data provided by Kan (1978) and Szokolay et al. (1977). The beta-isomer tended to have roughly 10-fold greater bioaccumulation in poultry egg and muscle than the other major isomers (i.e., alpha and gamma isomers), but is generally found to a lesser extent in the environment. Hence, the Tcos represent a mean of the three major HCH isomers. MacLachlan (2008) developed a model that adequately reproduced the pattern of lindane (gamma-HCH) residue levels in fat and eggs of hens consuming contaminated feed. Utilizing the authors’ data, the egg and muscle Tcos at steady-state were estimated to be 1.3 and 1.5 d/kg, respectively. These lindane Tcos were similar to those calculated from data by Kan (1978) and Szokolay et al. (1977) for eggs, 1.7 and 4.2 d/kg, respectively, and in muscle, 1.8 and 1.2 d/kg, respectively.
As in eggs and meat, the major isomers of HCH (alpha-, beta-, and gamma-HCH) had different patterns of accumulation in cow’s milk. The beta isomer has the largest transfer factor, 0.025 d/kg, but generally is in the smallest proportion relative to the other 2 major isomers found in the environment (van den Hoek et al., 1975; Vreman et al., 1976; Vreman et al., 1980). Average Tco values for the alpha- and gamma- (Lindane) isomers were 0.0054 and 0.0014 d/kg, respectively (Williams and Mills, 1964; van den Hoek et al., 1975; Vreman et al., 1980; Surendra Nath et al., 2000). An average Tco for these three HCH isomers is 0.011 d/kg. Surendra Nath et al. (2000) provided data for the industrial grade HCH isomer mixture resulting in a Tco of 0.003 d/kg. The HCH mixture contained 21% gamma-HCH, but further speciation data were not included.
Vreman et al. (1980) fed dairy cows diets containing alpha- and beta-HCH for up to eight months. The calculated muscle Tcos were 0.045 and 0.19 d/kg for alpha- and beta-HCH, respectively. For lindane (gamma-HCH), a Tco of 0.027 d/kg was calculated from a different study following 12-week exposure in non-lactating dairy cattle (Claborn et al., 1960).
We applied a scaling factor by MacLachlan (2009) to estimate the transfer of HCHs from lactating cattle to beef cattle. Using data supplied by Vreman et al. (1980) that showed a cow’s milk elimination half-life of 9-19 days for alpha- and beta-HCH, and the data by van den Hoek et al. (1975) that showed similar levels of HCH isomers in milk fat and body fat, the PBPK-generated ratio of simulated HCH levels in body fat of steers to body fat of lactating dairy cows is approximately 2. We multiplied the alpha- and beta-
Technical Support Document for Exposure Assessment and Stochastic Analysis, FINAL, August, 2012
K-8
HCH Tcos of 0.045 and 0.19 d/kg, respectively, which were determined in dairy cattle by the scaling factor of 2. The gamma-HCH Tco remained unchanged since non-lactating cows and steers have similar steady state HCH levels in body fat. The average Tco for these three isomers is 0.17 d/kg and is the recommended Tco for beef cattle.
No data for HCH accumulation in pig muscle tissue could be found, so we used a scaling factor by MacLachlan (2009) to estimate the transfer of HCHs from lactating cattle to pigs. Based on the HCH half-lives and milk fat to body fat ratios in dairy cattle discussed above, the PBPK-generated ratio of simulated HCH levels in body fat of pigs to body fat of lactating dairy cows is very close, or slightly greater, than 1. Thus, Tcos of the three isomers in lactating and non-lactating dairy cows were averaged by us and used as the default for pig meat (0.045 + 0.19 + 0.027 d/kg / 3 = 0.087 d/kg).
K.2.1.4 Polycyclic Aromatic Hydrocarbons (PAH)
Although there are a considerable number of studies investigating PAH exposure in the environment, there are surprisingly few studies that provide reliable data for estimating Tcos in food-producing animals. Exposure of fish, poultry and dairy cattle to a mixture of PAHs results in the presence of mainly low molecular weight PAHs (i.e., three or four cyclic rings) in the fat of meat and milk (Meador et al., 1995; Grova et al., 2000; Grova et al., 2002; Schaum et al., 2003; Lutz et al., 2006). Many of the high molecular weight PAHs with five or more cyclic rings, such as benzo[a]pyrene (BaP), are known carcinogens or possible carcinogens. Bioaccumulation of PAHs declines with increasing number of aromatic rings and the associated increase in Kow, likely due to both lower gut assimilation efficiency and increased metabolism rate. Another factor appears to be that lower levels of the larger carcinogenic PAHs contaminate pastures and feed compared to the smaller PAHs, often resulting in animal milk and tissue concentrations below the detection limits of analysis equipment (EC, 2002). For example, Muhlemann et al. (2006) found that the larger carcinogenic PAHs in contaminated feed comprised only 8.3% of total PAHs, while the smaller PAHs of four rings or less contributed most of the remaining fraction.
Broiler chickens fed a diet containing low levels of PAHs found in de-inking paper sludge did not exhibit increased PAH levels in abdominal fat for nearly all carcinogenic PAHs examined (Beauchamp et al., 2002). However, the low molecular weight PAHs fluoranthene and pyrene showed increasing levels in abdominal fat with increasing levels of PAHs from paper sludge in the diet of broilers. The carcinogenic potential of these PAHs are undetermined, due to inadequate evidence of carcinogenicity in animals. The calculated broiler muscle Tco for total PAHs was 0.003 d/kg (due mainly to accumulation of pyrene and fluoranthene), and the individual PAH Tcos for pyrene and fluoranthene were 0.1 and 0.04 d/kg, respectively. The total PAH Tco of 0.003 d/kg was chosen as a poultry muscle default value for PAHs, as Tcos for the larger carcinogenic PAHs would likely not surpass this value. No data could be found for PAH accumulation in eggs. Thus, the poultry muscle Tco was also applied to the egg Tco.
Technical Support Document for Exposure Assessment and Stochastic Analysis, FINAL, August, 2012
K-9
The presence of PAHs in milk and milk products suggests that these foods can represent a significant part of human intake of PAHs (Schaum et al., 2003). Among PAHs, the lightest and least lipophilic ones, such as naphthalene, phenanthrene, fluoranthene and pyrene, are detected in the greatest amounts in milk from farms exposed to airborne PAHs (Grova et al., 2000; Grova et al., 2002; Cavret et al., 2005; Lutz et al., 2006). Higher molecular weight PAHs with more than four rings, including possible carcinogens or known carcinogens such as BaP, chrysene and benz[a]anthracene, have been largely undetectable in cow’s milk. Of the larger carcinogenic and possibly carcinogenic PAHs, only benz[a]anthracene was detected in tank milk (pooled milk from many cows) sampled near several potential contamination sources (Grova et al., 2002). Levels of this PAH in milk fat ranged from 1.9-2.2 ng/g in milk fat (approximately 0.08-0.09 ng/g in whole milk).
Based on the pasture grass concentrations and corresponding cow’s milk concentrations of the three most abundant PAHs (phenanthrene, anthracene, and pyrene) from 10 rural and urban farms investigated by Grova et al. (2000), the range of PAH Tco values in milk were 0.02 to 0.002 d/kg. However, some assumptions were made to arrive at this estimate, including pasture grass as the only source of ingested PAHs, and intake of pasture grass ranged between 10 to 100% of the cow’s diet.
A cow’s milk Tco range of 0.002 to 2 x 10⁻⁵ d/kg for total PAHs was calculated by OEHHA from the risk assessment by Muhlemann et al. (2006), based on measurement of total PAHs (roughly 19 PAHs measured) in contaminated feed. Although BaP consisted of only 1.5% of total PAHs, the calculated Tco was within an expected range of 0.013-0.00013 d/kg for BaP. We chose a cow’s milk Tco of 0.01 d/kg for total PAHs based primarily on the high-end accumulation of BaP in cow’s milk from Muhlemann et al. The recommended Tco is also within the range of 0.02 to 0.002 d/kg estimated for PAHs from data published by Grova et al. (2000).
No data could be found regarding residue levels of PAHs in cattle muscle. The ratio of simulated PAH residues in body fat of steers to body fat of lactating dairy cows for extensively metabolized lipophilic compounds is about 1.4, based on PBPK modeling (MacLachlan, 2009). Assuming equal PAH concentrations in milk fat and body fat of dairy cattle, and application of a scaling factor of 1.4 for dairy cattle to steers, we calculated a default beef Tco for PAHs of 0.067 d/kg (0.01 d/kg x 0.19/0.04 x 1.4).
Accumulation data are also lacking for PAHs in pigs. Using the assumptions from MacLachlan (2009) for transfer of extensively metabolized lipophilic compounds to body fat in livestock, the ratio of PAHs in body fat of pigs to dairy cattle is close to 1. Based on a milk Tco of 0.01 d/kg, adjusting for fat content in pig meat and a scaling factor of 1, we calculate a default pig meat Tco of 0.058 d/kg (0.01 d/kg x 0.23/0.04 x 1).
Technical Support Document for Exposure Assessment and Stochastic Analysis, FINAL, August, 2012
K-10
K.2.1.5 Polychlorinated Biphenyls (PCB)
Specific congener Tcos are recommended due to variation in absorption and metabolism of PCBs in dairy cattle, and also due to the degree of chlorination and the position of the chlorine atoms. Some PCBs are transferred effectively unchanged from grass to milk and dairy products (e.g. PCBs 118, 138, 153, 180), with the cow acting as an efficient conduit to humans, while others (e.g. PCBs 52, 101, 149) are largely removed from the environment and the human food chain if ingested by the dairy cow because they are readily metabolized by the cow (Thomas et al., 1999b). Tcos for individual PCB congeners were estimated from published data and are presented in Table K-1 (Slob et al., 1995; Thomas et al., 1998; Thomas et al., 1999a; Kerst et al., 2004; Huwe and Smith, 2005). Kerst et al. (2004) provided TEQ-adjusted data from which a Tco (WHO-TEQ) of 0.014 d/kg was estimated for unspeciated PCBs.
In dairy cattle, Willett et al. (1990) reviewed early studies that examined the transfer of Aroclor 1254 applied to feed to cow’s milk. Tcos of 0.008 to 0.009 d/kg were obtained with doses ranging from 3.5-200 mg/d and exposures ranging from 60-107 days. A cow’s milk Tco of 0.01 d/kg for unspeciated PCBs from data by Thomas et al. (1999a) was calculated for the sum of 28 PCB congeners found both in feed and the milk.
Only one study could be found that allowed development of poultry meat Tcos for a limited number of individual PCB congeners. Pirard and De Pauw (2005) determined bioconcentration factors for coplanar-PCBs (PCBs 77, 81, 126, 169) in chicken breast muscle. Traag et al. (2006) provided bioconcentration data in abdominal chicken fat for all PCBs but exposure lasted only seven days. Because steady-state was not attained, Tcos could not be reliably determined. However, the data do indicate that based on the number of chlorines, the coplanar-PCBs are similarly, or more, bioaccumulative in fat compared to the other PCB congeners with the same number of chlorines. Thus, Tcos for the non-coplanar PCB congeners in Table K-1 were based on the co-planar PCBs with the same number of chlorines.
No reliable data could be found for developing individual congener Tcos for chicken eggs. Thus, the muscle Tcos for individual PCB congeners were also used for eggs, following adjustment for the higher fat content of eggs (11%) compared to muscle (7%).
A general PCB egg Tco of 6.7 d/kg was calculated from a laboratory study in which seven reference congeners (only one of which (#118) is listed in Table K-1) were spiked in the diet of hens (De Vos et al., 2005). Because none of the more bioaccumulative co-planar PCBs were investigated in this study, the co-planar PCB Tco of 10 d/kg was used for unspeciated PCBs. Numerous unspeciated PCB feed-to-muscle tissue studies have been published in chickens, resulting in a range of Tco values of 2.5 to 7.7 d/kg (Hansen et al., 1983; De Vos et al., 2003; Maervoet et al., 2004; De Vos et al., 2005; Pirard and De Pauw, 2005). A Tco of 7 d/kg for unspeciated PCBs was selected as the default value to reflect the median Tco of the individual congeners listed in Table K-1, and because this value is within the range of Tcos for unspeciated PCBs.
Technical Support Document for Exposure Assessment and Stochastic Analysis, FINAL, August, 2012
K-11
No reliable data could be found that estimated transfer of PCBs consumed in food to body fat of beef cattle. In dairy cattle, Willett et al. (1990) reviewed early experiments that examined the transfer of Aroclor 1254 from feed to adipose tissue. Fresh weight dairy beef Tcos of 0.013 to 0.027 d/kg were obtained for doses ranging from 10-200 mg/d with 60 day exposures. In another study, a beef Tco of 0.024 d/kg was calculated for dairy cattle following 14-week consumption of PCBs that naturally contaminated pastures (Thomas et al., 1999a).
On a fat weight basis, Thomas et al. (1999b) observed that not only are the PCB concentrations in body fat and milk fat similar, but that the congener patterns were similar as well. Thus, even though comprehensive congener-specific data are lacking for PCBs in muscle, congener-specific beef Tcos can be estimated from the cow’s milk Tco data by adjusting for the greater fat content in muscle tissue (19%) compared to the milk fat content (4%).
We applied a PBPK-generated scaling factor developed by MacLachlan (2009) to estimate the transfer of PCBs from body fat of lactating cattle to body fat of beef cattle. Using data by Huwe and Smith (2005) that found a cow’s milk half-life of 39-196 days for some co-planar PCBs, and the data by Thomas et al. (1999b) that showed similar levels of PCBs in milk fat and body fat, the ratio of simulated co-planar PCB levels in body fat of steers to body fat of lactating dairy cows is approximately 10. We multiplied the scaling factor of 10 by the PCB milk Tcos in Table K-1 following adjustment for differences in fat content between milk and beef to generate Tcos for beef.
In swine, Arochlor 1254 was added to feed for 6 months resulting in an unspeciated PCB Tco of 0.52 d/kg (Hansen et al., 1983). Speciated Tcos for 16 PCBs could be determined from the data, although only one PCB (#118) is currently listed in Table K-1. Thus, Tcos for individual PCBs in Table K-1 were based on the highest calculated PCB Tco with the same number of chlorines from the Hansen et al. study.
K.2.1.6 Polychlorinated Dibenzo-p-Dioxins and Furans (PCDD/F)
Numerous studies have investigated the feed-to-cow’s milk transfer of PCDD/Fs. Several of these studies were conducted in the field near municipal solid waste incinerators, or estimated the mass balance of PCDD/F intake resulting from exposure to background or elevated levels of PCDD/Fs in pasture and soil (McLachlan et al., 1990; Slob et al., 1995; Schuler et al., 1997b; McLachlan and Richter, 1998; Lorber et al., 2000). These types of studies likely represent the best data for developing individual congener and overall unspeciated transfer factors of PCDD/Fs from “Hot Spots” facilities. Averaged congener Tco values were estimated from these data and are presented in Table K-1.
The milk Tco decreases by an order of magnitude or more for some of the higher chlorinated PCDD/Fs. This trend agrees with models showing that the percent transfer of chemical from feed to milk decreases for compounds with log Kow larger than about 6.5 (McLachlan, 1996). This reduced absorption is attributed to the presence of an aqueous resistance that limits diffusion of very hydrophobic compounds through the
Technical Support Document for Exposure Assessment and Stochastic Analysis, FINAL, August, 2012
K-12
intestinal wall. Thus, a Tco for total PCDD/Fs (unspeciated PCDD/Fs) has not been pursued by researchers in their exposure studies. Nevertheless, a Tco for unspeciated dioxin-like PCDD/Fs of 0.001 d/kg can be calculated from the data by McLachlan et al. (1990).
Several studies provided data from which Tcos could be estimated for individual PCDD/F congeners found in eggs and chicken meat. For eggs, transfer factor data were derived from three studies in which feed was mixed with soil environmentally contaminated with PCDD/Fs (Petreas et al., 1991; Stephens et al., 1995; Schuler et al., 1997a), and one study of feed contaminated with fly ash (Pirard and De Pauw, 2006). Individual congener Tcos among the studies were similar, often within a factor of five between values. An average Tco was calculated for each congener from the four studies and is shown in Table K-1.
Many of the same studies in chickens also estimated accumulation values for the sum of all PCDD/F congeners, or unspeciated PCDD/Fs, in eggs and meat. In egg, four studies in free-range and laboratory chickens exposed to contaminated soil provided an average Tco of 5.5 d/kg (range: 1.9 to 13.1 d/kg) for unspeciated PCDD/Fs (Petreas et al., 1991; Stephens et al., 1995; Malisch et al., 1996; Schuler et al., 1997a). In chicken muscle, three contaminated feed or soil studies provided accumulation data from which an average Tco of 4.6 d/kg (range: 1.0 to 7.6 d/kg) was calculated (Stephens et al., 1995; Iben et al., 2003; Pirard and De Pauw, 2005).
For the controlled laboratory feed-to-egg studies in which PCDD/Fs in fly ash or oil were added to feed (i.e., no contaminated soil was added to the diet), egg Tcos ranged from 8.5 to 17 d/kg with a mean of 12 d/kg (Pirard and De Pauw, 2005; 2006; Van Eijkeren et al., 2006).
For field studies, calculated egg Tcos of free-foraging chickens in various regions with PCDD/F-contaminated soil showed greater variation and was higher (Schuler et al., 1997a; Harnly et al., 2000; Hoogenboom et al., 2006). The Tcos ranged from 12 to 37 d/kg with an average of 23 d/kg. An assumption was made that the PDCC/F source for the free-foraging hens was contaminated soil, and that the soil ingestion rate was 10 g soil/day. There is general support among researchers for this soil ingestion rate by free-foraging chickens (De Vries et al., 2006). The larger egg Tco in field studies compared to controlled laboratory studies may be a result of free-foraging chickens consuming soil organisms and herbs and grass which may also be contaminated. However, greater bioavailability of soil PCDD/Fs in the field, or a higher soil ingestion rate than predicted may also play a role in a larger egg Tco under field conditions.
Overall, the range of mean values for these three types of studies is not large (within a factor of 10), considering the different sources of PCDD/Fs that the poultry were exposed to. A grand mean from the three types of exposure studies (contaminated soil field study, controlled contaminated soil study and contaminated feed study) is 13 d/kg (3.6 + 23 + 12 d/kg / 3), which we recommend as the default egg Tco for PCDD/Fs.
Technical Support Document for Exposure Assessment and Stochastic Analysis, FINAL, August, 2012
K-13
For edible muscle tissue (usually thigh or breast tissue), TEQ-adjusted Tcos could be calculated from several studies that investigated PCDD/F concentrations in chickens given contaminated feed. In a controlled laboratory study in which 10% of the diet was PCDD/F-contaminated soil, a Tco of 7.4 d/kg was calculated (Stephens et al., 1995). In three contaminated feed studies where PCDD/Fs in oil or fly ash were added to diet, similar Tcos of 8.6, 9.0 and 4.1 d/kg were calculated (Iben et al., 2003; Pirard and De Pauw, 2005; 2006).
Congener-specific data for development of beef Tcos were not as comprehensive as that for development of cow’s milk Tcos. Two long-term pentachlorophenol (PCP) feeding studies in dairy cattle determined body fat concentrations for several PCDD/F congeners (1, 2, 3, 6, 7, 8- and 1, 2, 3, 7, 8, 9-HxCDD, 1, 2, 3, 4, 6, 7, 8-HpCDD, OCDD, 1, 2, 3, 4, 6, 7, 8-HpCDF, and OCDF) that were contaminants in the PCP formulation (Firestone et al., 1979; Parker et al., 1980). Beef Tcos based on dairy cattle for the other congeners and unspeciated PCDD/Fs were estimated with the assumption that the fat concentration is similar in milk and beef, and were adjusted upward to account for the greater fat content in muscle tissue (19%) compared to the fat content in milk (4%). As noted above, the concentration of PCBs in milk fat and body fat have been shown to be similar in exposure studies (Thomas et al., 1999b). We then applied scaling factors by MacLachlan (2009) to estimate the transfer of PCDD/Fs from body fat of lactating cattle to body fat of beef cattle. Data by Huwe and Smith (2005) found that half-lives were mostly 30-50 days for the PCDD/Fs; the major exceptions were OCDF (t1/2 = 14 days) and OCDD (t1/2 = 72.6 days). A ratio of 7 is estimated for the simulated PCDD/F levels in body fat of steers to body fat of lactating dairy cows for most PCDD/Fs. A ratio of 4 was estimated for OCDF and a ratio of 10 was estimated for OCDD.
Pig Tcos for individual and unspeciated PCDD/Fs in Table K-1 were estimated from a comprehensive study in which PCDD/Fs were added to the diet in feed of pigs during the 12-week fattening period (Spitaler et al., 2005). This exposure period represents the last 12-weeks prior to slaughter in the typical 6-month life of a pig. Notably, the researchers did not observe a reduction of residues due to roasting of the meat.
K.2.2 Tcos for Inorganic Metals and Chemicals
The studies used to derive inorganic metal Tcos listed in Table K-2 usually presented data as fresh weight concentrations in muscle, milk and eggs. Occasionally, dry weight concentrations were reported. Unless the study noted the water content of the food source, default factors of 0.87 for cow’s milk, 0.35 for chicken egg, 0.25 for chicken meat, and 0.30 for beef and pork were used for adjusting to fresh weight concentration (USDA, 1975).
Biotransfer studies for pig muscle could not be found for most of the metals. As noted in the beginning of this appendix, biotransfer data in cattle were more abundant. Where specific metal biotransfer data were missing in pigs but present in cattle, the pig meat Tco was estimated using a simple metabolic weight adjustment from cattle to pig as shown in Eq. K-1.
Technical Support Document for Exposure Assessment and Stochastic Analysis, FINAL, August, 2012
K-14
In general, low concentrations of inorganic metals are transferred from contaminated feed to muscle tissue, cow’s milk and eggs and are not as great a concern relative to other potential sources of heavy metals in multipathway exposures. However, many of the inorganic metals such as cadmium, lead and mercury tend to accumulate over time in organs, particularly kidney and liver. Thus, frequent consumption of organs from exposed food animals may present a much greater toxic hazard to humans than consumption of the meat. Cadmium is of particular concern due to its relatively high toxicity and high potential for accumulation in the kidney and liver. Kidney and liver-specific Tcos for cadmium and a few other metals are presented in the text below for some of these food-producing animals only for comparison purposes. Tcos for accumulation in bone for some of the metals (i.e., lead) are also noted or calculated for some of the food products.
Another toxicological concern is that chickens can convert some of the ingested inorganic mercury in controlled feeding studies to methyl mercury, which is then found primarily in the poultry meat and egg white (Kiwimae et al., 1969). The inorganic mercury Tcos for poultry meat and eggs in Table K-2 represents total mercury, although some will be present as organic methyl mercury. Because methyl mercury is not emitted from facilities (i.e., only inorganic or elemental mercury is emitted), it is not accounted for in health risk assessments. However, Tcos for methyl mercury were calculated by OEHHA and presented in Section K.2.2.7 only for comparison to the inorganic mercury Tcos.
K.2.2.1 Arsenic
Only one study could be located that recorded a measurable increase of arsenic in cow’s milk following dairy cattle consumption of contaminated feed. We calculated a Tco of 5 x 10⁻⁵ d/kg from data in dairy cattle exposed to As(III) as arsenic trioxide for 15-28 months (Vreman et al., 1986).
In poultry, organic arsenic compounds are an approved dietary supplement that can result in increased levels of total arsenic in meat and eggs (Lasky et al., 2004). Both organic and inorganic forms of arsenic are found in poultry, with inorganic forms more toxic than organic forms. Analysis of poultry and meat samples indicates that about 65% of total arsenic is in the inorganic form.
We calculated a Tco of 0.07 d/kg for total arsenic in eggs from hens fed a diet containing arsenic trioxide (Holcman and Stibilj, 1997). In muscle, total arsenic Tcos of 0.06 and 0.02 d/kg were determined in chickens from two studies following addition of arsenic trioxide to feed (Overby and Frost, 1962; Vadnjal et al., 1997). The proportion of arsenic in the inorganic form was not determined. In drinking water, soluble As(V) was added to the water resulting in a total arsenic Tco of 0.2 d/kg in muscle of broiler chickens (Pizarro et al., 2004). However, only 10% of arsenic in muscle was in the inorganic form. Over 50% was present as dimethylarsinic acid, which is considered a methylation detoxification pathway for arsenic. Thus, the inorganic arsenic Tco was 0.02 d/kg. We calculated an average muscle Tco of 0.03 d/kg from the three studies for transfer of arsenic from diet to chicken meat.

Technical Support Document for Exposure Assessment and Stochastic Analysis, FINAL, August, 2012
K-15
In beef cattle, Vreman et al. (1988) administered arsenic trioxide in the feed for 143 days to 16 bulls at about 12.5 mg/d resulting in a muscle Tco of 2.4 x 10⁻³ d/kg. The same Tco was calculated from data by Ham et al. (1949) that dosed adult steers daily with 270 mg arsenic trioxide for 201 days. In another study in steers, Bruce et al. (2003) estimated the daily intake of arsenic from grazing pasture grass, ingesting dust adhering to pasture, and direct ingestion of soil in an area contaminated with arsenic-laced mine tailings. Based on the daily intake and muscle concentration of arsenic at sacrifice after 237 days of exposure, a Tco of 2.8 x 10⁻⁴ d/kg was derived. We calculated an average muscle Tco of 1.7 x 10⁻³ d/kg from these three studies, which we recommend as the default value for beef cattle. Long-term arsenic feeding studies have also been conducted in lactating dairy cows. A slightly lower muscle Tco of 7.1 x 10⁻⁴ d/kg was calculated from these studies (Peoples, 1964; Vreman et al., 1986).
Arsenic exposure in beef and dairy cattle has not shown tissue-specific sequestering in liver or kidney, unlike some of the inorganic metals (e.g., cadmium, lead, and mercury). Similar Tcos were estimated for muscle, liver and kidney (Ham et al., 1949; Peoples, 1964; Vreman et al., 1988).
K.2.2.2 Beryllium
No inorganic beryllium accumulation studies could be found in the literature for poultry. Thus, we calculated poultry egg and meat Tcos for beryllium based on the average Tco value of the other “Hot Spots” divalent, cationic metals in Table K-2 (i.e., cadmium, lead, inorganic mercury, and nickel) providing beryllium Tcos for egg and muscle of 0.09 and 0.2 d/kg, respectively.
No multiple day inorganic beryllium exposure studies have been conducted in cattle or swine. In a single bolus study, Ng (1982) estimated a cow’s milk Tco of 9.1 x 10⁻⁷ d/kg based on recovery of radiolabeled beryllium chloride given to dairy cattle. For beef, we determined a beryllium Tco of 3 x 10⁻⁴ d/kg based on the average Tco value of the divalent, cationic metals cadmium, lead, and inorganic mercury. Beef Tcos for these three metals were determined directly from published studies. A default pork Tco was determined by us by the same method as that used for beef, resulting in a pig meat Tco of 1 x 10⁻³ d/kg.
K.2.2.3 Cadmium
Very low accumulation of cadmium occurs in cow’s milk, and concentrations of cadmium in cow’s milk are often below the detection limit. In his review, Stevens (1991) estimated an average Tco of 1.3 x 10⁻⁶ d/kg in cow’s milk from two long-term cadmium exposure studies by Vreman et al. (1986). More recently, we estimated a milk Tco of 1.3 x 10⁻⁵ d/kg from exposure data in a single cow exposed to cadmium for 77 days (Mehennaoui et al., 1999). The average Tco from the three exposure studies is 5 x 10⁻⁶ d/kg, which we recommend as a default Tco.
Numerous cadmium accumulation studies have been conducted in poultry. Similar to cow’s milk, very low accumulation of cadmium occurred in hen’s eggs with exposure in
Technical Support Document for Exposure Assessment and Stochastic Analysis, FINAL, August, 2012
K-16
feed; the levels of cadmium in eggs are sometimes below the detection limit. We calculated an average egg Tco of 0.01 d/kg from the best available data (Leach et al., 1979; Sharma et al., 1979; Hinesly et al., 1985). In muscle, we determined cadmium Tcos in exposed chickens ranging from 0.2 to 1 d/kg (Leach et al., 1979; Sharma et al., 1979; Hinesly et al., 1985; Pribilincova et al., 1995; Bokori et al., 1996). The average value from these studies was 0.5 d/kg, which we recommend as the Tco.
Similar cadmium Tcos in muscle of dairy and beef cattle have been observed in long-term feeding studies lasting 3.5 to 28 months. We calculated an average Tco of 2.0 x 10⁻⁴ d/kg with a range of 1.2 – 3.2 x 10⁻⁴ d/kg (Johnson et al., 1981; Vreman et al., 1986; 1988). A muscle Tco of 6.5 x 10⁻⁵ d/kg was obtained from a feeding study by Lamphere et al. (1984) describing cadmium body burden in calves exposed for 60 days. However, the short exposure duration only during growth of the animal may result in an underestimation of the Tco compared to exposure to adulthood.
Cadmium accumulates to a much greater extent in some organs compared to muscle tissue. In poultry, exposure studies suggest that cadmium accumulation in the kidney and liver increases with increasing exposure duration and may not attain a steady-state concentration. Eighty-week exposure to cadmium in chickens resulted in a Tco of 800 d/kg in the kidney and 70 d/kg in the liver (Hinesly et al., 1985). In dairy and beef cattle, cadmium Tcos for liver and kidney did not vary greatly even though exposure durations varied. Average calculated Tcos were about 0.03 d/kg (range: 0.01 to 0.048 d/kg) for liver, and 0.1 d/kg (range: 0.09 to 0.19 d/kg) for kidney (Sharma et al., 1979; Sharma et al., 1982; Vreman et al., 1986; 1988).
Only one study could be found that measured cadmium muscle levels in pigs following exposure to cadmium in feed. Cousins et al. (1973) only found measurable cadmium levels in skeletal muscle at the highest of four doses tested (1350 ppm) following a six-week exposure, but this level caused severe toxicity. More accurate estimates of muscle uptake were found in heart tissue, which exhibited increased tissue concentration with increasing dose and may represent the upper end of the cadmium concentration found in skeletal muscle. The average Tco we calculated in heart muscle was 0.0051 d/kg. In the liver and kidneys of pigs, cadmium Tcos as high as 0.48 and 2.53 d/kg, respectively, were calculated from a study by Sharma et al. (1979).
K.2.2.4 Chromium (Hexavalent)
Only a portion of ingested hexavalent chromium (Cr(VI)), perhaps 1-2%, is expected to be systemically absorbed in the hexavalent form due to rapid reduction to the less soluble and less toxic trivalent chromium in the acidic environment of the stomach (Costa, 1997; NTP, 2008). Trivalent chromium (Cr(III)) is an essential micronutrient, but no cancer potency or noncancer reference exposure level is currently available for this form of chromium. Cr(VI) that is absorbed can then be actively transported into all cells and tissues of the body in place of anions, such as phosphates. Once inside the cell, the Cr(VI) is reduced to various unstable reactive intermediates and, finally, stable Cr(III) is ultimately formed inside the cell.
Technical Support Document for Exposure Assessment and Stochastic Analysis, FINAL, August, 2012
K-17
Current analytical procedures cannot differentiate between the oxidation states of chromium in biological tissues (NTP, 2008). However, it has been advocated that any Cr(VI) transported into meat and eggs would be converted to the more stable Cr(III) form and would presumably not pose a risk for human consumption (Chundawat and Sood, 2005). Based on these findings no Cr(VI) Tco is currently recommended by OEHHA for meat and eggs.
However, a similar situation may not be the case for cow’s milk. Lameiras et al. (1998) found Cr(VI) in cow’s milk, which was 25-50% of total chromium. In whole milk, the average total chromium concentration was 2.70 ug/L (range: 1.42-5.70 ug/L) and the average Cr(VI) concentration was 0.68 ug/L (range: 0.20-1.20 ug/L). No multiple day Cr(VI) exposure studies in dairy cattle could be found in the literature. Following a single oral dose of radiolabeled sodium chromate (Na2CrO4), Van Bruwaene et al. (1984) calculated a steady-state cow’s milk Tco of 1.0 x 10⁻⁵ d/kg for total chromium. Stevens (1991) estimated a similar Tco of 1.4 x 10⁻⁵ d/kg from the same data based on a half-life of 26 days for total chromium in cow’s milk. These studies did not attempt to estimate the proportion of total chromium that was secreted as Cr(VI) into milk.
Multiplying the Stevens total chromium Tco by the fraction of total chromium that is Cr(VI) in normal milk (1.4 x 10⁻⁵ d/kg x 0.68/2.70 ug/L) provided a modified Tco of 3.5 x 10⁻⁶ d/kg. Until valence-speciated cow’s milk data are available from Cr(VI) exposure studies, we chose a midpoint Tco value between the Stevens Tco and this modified Tco adjusted for Cr(VI) content in normal milk (8.75 x 10⁻⁶ d/kg) as a health-protective cow’s milk default value for Cr(VI).
K.2.2.5 Fluoride
In a series of long-term exposure studies on fluorides’ effect on milk production, the fluoride concentration in the milk of dairy cows given fluoride in feed resulted in an estimated cow’s milk Tco of 0.0003 d/kg (Stoddard et al., 1963; Harris et al., 1964).
Fluoride in the diet of hens resulted in very low accumulation of fluoride in muscle, and yolk and albumin of eggs (Hahn and Guenter, 1986). We calculated a Tco in whole eggs of 0.008 d/kg from the exposure data. Considerably greater accumulation occurs in egg shell. Muscle accumulation in the fluoride-exposed hens resulted in a Tco of 0.03 d/kg.
Specific data concerning accumulation of fluoride in the skeletal muscle tissue of exposed cattle could not be found. However, in cases of high fluoride intake, fluoride levels in the soft tissue (i.e., brain, liver, kidney, pancreas, intestines, etc.) are reported to increase only two or three times the normal value in meat producing animals. Fluoride does not accumulate in the edible portions of the animal (Suttie et al., 1958; Shupe et al., 1964). However, considerably greater accumulation of fluoride occurred in bone. In heart tissue, we calculated a fluoride Tco of 8.4 x 10⁻⁴ d/kg for Holstein cows fed fluoride-contaminated rations for 5.5 years, which we recommend as the default muscle Tco for range cattle (Suttie et al., 1958). It is assumed that similar
Technical Support Document for Exposure Assessment and Stochastic Analysis, FINAL, August, 2012
K-18
pharmacokinetic properties, and similar Tcos, occur for fluoride in both skeletal and heart muscle tissue.
K.2.2.6 Lead
Only three contaminated feed studies observed measurable levels of lead in milk from both control and exposed dairy cows. Based on data from a 15-28 month lead exposure study of dairy cows kept indoors, a cow’s milk Tco of 2.6 x 10⁻⁵ d/kg was calculated (Vreman et al., 1986). A three-month outdoor lead exposure study by the same researchers produced a Tco of 5.4 x 10⁻⁵ d/kg. Stating that the half-life of lead in dairy cows is about 45 days, Stevens (1991) adjusted the Tco of the three-month outdoor study to 7.1 x 10⁻⁵ d/kg. However, Willett et al. (1994) observed that steady-state was attained in cow’s milk after only 14 days of a 49-day lead exposure study, generating a Tco of 7.9 x 10⁻⁵ d/kg. Using the steady-state-corrected Tco by Stevens (1991) for the outdoor Vreman study, we recommend an average Tco of 5.9 x 10⁻⁵ d/kg from these three studies.
An average Tco of 0.4 d/kg in muscle was calculated by OEHHA for lead in broiler chicks fed contaminated feed for 20 days (Stoddard et al., 1963; Harris et al., 1964; Latta and Donaldson, 1986a; 1986b). For comparison, a roughly 10-fold higher Tco was calculated for lead in kidney. However, lead tends to accumulate most in bone, generating a Tco of 70 d/kg. Lead in bone is not expected to be a problem, unless contaminated bone is ground into bone meal and fed to animals. Accumulation of lead in eggs was very low, generating a Tco of 0.04 d/kg (Meluzzi et al., 1996).
Vreman et al. (1988) administered lead acetate in feed to young bulls for 143 days during the fattening period. The resulting muscle Tco was 2.7 x 10⁻⁴ d/kg. A slightly lower muscle Tco of 6.7 x 10⁻⁵ d/kg in lactating dairy cows fed lead mixed with their feed (Vreman et al., 1986).
Roughly 10- to 100-fold greater accumulation of lead occurs in the kidney and liver of cattle compared to their muscle tissue. We calculated Tcos of 4.8 x10⁻³ and 1.4 x 10⁻² d/kg for liver and kidney, respectively, in the bulls from the Vreman et al. (1988) study. In addition to liver and kidney, lead was also found to accumulate in bone. In a three-month feeding study in dairy cattle, a bone Tco of 0.02 d/kg was calculated from the data by Sharma et al. (1982). In one of the few biotransfer studies conducted in pigs, a liver Tco of 1.4 x 10⁻² d/kg was recorded in pigs fed diets containing either 5 or 25 ppm lead acetate for 90 days (Sharma and Street, 1980).
K.2.2.7 Inorganic Mercury
Addition of inorganic mercury (Hg(II)) to the feed of hens for 140 days resulted in a muscle tissue Tco of 0.1 d/kg (Kiwimae et al., 1969). However, some Hg(II) was converted to methyl mercury (MeHg) in the chickens, resulting in a muscle Tco of 0.09 d/kg for MeHg. When only MeHg is added to the diet in prolonged feeding studies, an average Tco of 10 d/kg was calculated with virtually all the mercury in the muscle as MeHg (Kiwimae et al., 1969; Soares et al., 1973; Hilmy et al., 1978). Some Hg(II) added
Technical Support Document for Exposure Assessment and Stochastic Analysis, FINAL, August, 2012
K-19
to feed is also endogenously methylated in the hens and transported to the eggs. Addition of Hg(II) to the feed of hens for 140 days resulted in a calculated egg Tco of 0.8 d/kg for total mercury, and 0.5 d/kg for MeHg (Kiwimae et al., 1969). An average egg Tco of 11 d/kg was calculated when only MeHg was added to feed (Scott et al., 1975; Hilmy et al., 1978).
Vreman et al. (1986) observed a small, but statistically insignificant increase in mercury in cow’s milk with exposure of dairy cattle to inorganic mercury in feed for 15-28 months. The Tco range was 7 to 40 x 10-5 d/kg with an average of 2 x 10⁻⁴ d/kg. Stevens (1991) calculated Tcos of 9.2 x 10⁻⁶ and 1.3 x 10⁻⁵ d/kg from oral single bolus studies of radiolabeled inorganic mercury by Mullen et al. (1975) and Potter et al. (1972). The steady-state Tcos were calculated by use of study-specific half-lives of 1.2 (Potter et al., 1972) or 5.5 days (Mullen et al., 1975) for mercury. We calculated an average Tco of 7 x 10⁻⁵ d/kg from the three studies, which we recommend for transfer of inorganic mercury to cow’s milk.
Similar to cow’s milk, only a small, but statistically insignificant increase in inorganic mercury could be measured in muscle tissue following long-term exposure of dairy and beef cattle to soluble mercury (Vreman et al., 1986; 1988). Calculated maximum muscle Tco values from these two studies were 6.7-18 x 10-4 d/kg, but we lack confidence in this value due to the detection limit of these studies. To calculate the biotransfer of ingested mercury to muscle, Stevens (1992) relied on three oral bolus dose studies that determined the half-life of inorganic mercury in blood of dairy cattle (Potter et al., 1972; Ansari et al., 1973; Mullen et al., 1975). Operating on a reasonable assumption that muscle is a well-perfused tissue and shares the same kinetic compartment as blood, Stevens calculated an average muscle Tco of 3.5 x 10⁻⁴ d/kg (range: 1.8-4.4 x 10⁻⁴ d/kg). This value is comparable with the Tcos estimated from the Vreman studies, which we recommend as the point estimate Tco for inorganic mercury in beef.
Although it is not anticipated that human exposure to methyl mercury via cow’s milk and beef would be a significant pathway (e.g., as compared to fish), biotransfer information is included here for completeness. There are few published data that investigated ruminant methylmercury uptake and accumulation. However, background exposure and accumulation of inorganic and methylmercury in meat products are reported to be very low (U.S. EPA, 1997). In their risk assessment guidelines, U.S. EPA (2005) suggests that only 13% of total mercury in ruminants is present as methylmercury, an indication that ruminants have little exposure to methylmercury.
In vitro, cow rumen microflora does not methylate added inorganic mercury (as HgCl2) to methylmercury (Kozak and Forsberg, 1979). On the other hand, rumen microflora was found to demethylate up to 40% of added methylmercury to elemental (Hg0), or metallic, mercury, which would then be presumably excreted with little or no absorption. This finding suggests that ruminants can detoxify some of the ingested methylmercury.
Stevens (1991) estimated that the Tco for methylmercury in cow’s milk is roughly one order of magnitude greater than that for inorganic mercury (i.e., 7 x 10⁻⁴ d/kg). His
Technical Support Document for Exposure Assessment and Stochastic Analysis, FINAL, August, 2012
K-20
finding was based on a study by Neathery et al. (1974), in which two dairy cows were given a bolus dose of radiolabeled methylmercuric chloride and followed for the appearance of label in milk for 14 days. A milk excretion half-life of 6 days was calculated from the data. It was suspected that the lipophilic nature of methyl mercury resulted in its accumulation in milk fat. Of the labeled methylmercury that was absorbed, 72% of the total body burden was found in muscle tissue 15 days after the single bolus dose. However, there are insufficient data to estimate the biotransfer of ingested methylmercury in cattle and pigs with chronic exposure.
K.2.2.8 Nickel
Only two studies were found in the literature that attempted to estimate the nickel concentration in cow’s milk following 1.5 to 2 month exposure of the dairy cattle to inorganic nickel-contaminated feed (Archibald, 1949; O'Dell et al., 1970). Neither study used analysis methods that were sensitive enough to record measurable increases of nickel in the cow’s milk. Stevens (1991) used the maximum value approach by dividing the detection limit (0.1 ppm) of the studies by two, arriving at an average cow’s milk Tco of 2.7 x 10⁻⁵ d/kg. Until more sensitive studies are conducted, we recommend this Tco as the default value for inorganic nickel.
Limited data for nickel indicate low accumulation of this metal occurs in eggs and tissues of chickens (Ling and Leach, 1979; Meluzzi et al., 1996). We calculated Tcos of 0.02 d/kg for both eggs and muscle tissue of hens fed inorganic nickel mixed in their diet. As with other inorganic metals, greatest nickel accumulation occurred in the kidney (Tco = 0.68 d/kg), resulting in a Tco over 30-fold higher than that found in muscle or eggs.
No adequate studies investigating biotransfer of ingested inorganic nickel to beef or pork could be located. As with the approach used for beryllium, we determined a beef Tco based on an average of the three divalent cationic metal Tcos (i.e., cadmium, lead and inorganic mercury) that had sufficient biotransfer data available in the literature. The resulting beef Tco was 3 x 10⁻⁴ d/kg. We then developed a pig meat Tco of 0.001 d/kg based on the cow-to-pig metabolic weight ratio adjustment (Eq. K-1). OEHHA recognizes that these Tcos developed for beef and pork are more uncertain than would be desirable. However, the data available in other food-producing animals and similar Tcos developed for other cationic metal contaminants indicates the nickel muscle Tco is likely not underestimated in cattle and pigs.
K.2.2.9 Selenium
The selenium concentration in milk tends to increase as intake of selenium increases from about 2 to 6 mg/day (Fisher et al., 1980; Maus et al., 1980; Beale et al., 1990). Secretion of selenium into milk then appears to reach a temporary limit when selenium intake is about 6 to 12 mg/day. The mammary gland is either limited in the limited amount of selenium it can secrete into milk, or, more likely, the net absorption of selenium from the gut is controlled in the face of increased selenium intake. Only when selenium intake increases above 50-100 mg/day does the ability of the protection
Technical Support Document for Exposure Assessment and Stochastic Analysis, FINAL, August, 2012
K-21
mechanism become exceeded, resulting in selenium toxicity and increased selenium concentration in milk. We calculated a Tco of 0.009 d/kg based on the average value for studies that supplemented feed with 6 mg/d selenium or less.
Optimum levels of selenium in the diet of poultry are about 0.1 to 0.2 ppm (Arnold et al., 1973; Moksnes and Norheim, 1982). Concentrations of selenium above 3 ppm may result in toxicity. At concentrations of 1 to 9 ppm selenite in the feed, we calculated an average egg Tco of 3 d/kg (Arnold et al., 1973; Ort and Latshaw, 1978; Moksnes and Norheim, 1982; Davis and Fear, 1996). In broiler chicks, an average Tco of 0.9 d/kg for muscle was calculated (Moksnes and Norheim, 1982; Echevarria et al., 1988a; 1988b). Laying hens had a lower Tco of 0.4 d/kg for muscle tissue, possibly due to eggs acting as an elimination pathway for selenium (Arnold et al., 1973; Ort and Latshaw, 1978; Moksnes and Norheim, 1982). Thus, the muscle Tco for selenium is based on the findings in meat (broiler) chickens.
In beef cattle, groups of calves were fed sodium selenite in a milk replacer at concentrations of 0.2 to 5 ppm for six weeks (Jenkins and Hidiroglou, 1986). We calculated an average muscle Tco of 6.6 x 10⁻² d/kg from the exposure data. In another study, inorganic selenium was intraruminally administered in beef cows through two soluble-glass boluses to slowly release Se over approximately 11 months (Hidiroglou et al., 1987). We calculated a Tco of 7.1 x 10⁻³ d/kg in the muscle tissue. The average muscle Tco from the two studies is 0.037 d/kg, which we recommend as the default selenium transfer factor. Jenkins and Hidiroglou (1986) also observed greater accumulation of selenium in the liver and kidney cattle compared to muscle, resulting in calculated Tcos of 2.7 and 0.25 d/kg, respectively.
In pigs, selenium muscle concentrations have been measured following unsupplemented intake or supplementation of selenium in diets. No studies could be located that estimated tissue levels of selenium following prolonged intake of toxic or near-toxic levels of selenium. Using a study by Ku et al. (1972), we calculated an average muscle Tco of 0.61 d/kg in groups of adult pigs that had been fed diets containing selenium at levels ranging from 0.027 to 0.493 ppm. A positive correlation between selenium level in the diet and muscle concentration was observed. Using another study, which exposed pigs to diets containing 0.78-0.88 ppm selenium during the growth phase, we calculated a muscle Tco of 0.35 d/kg in pigs at market weight (Jenkins and Winter, 1973).
Similar to the phenomena observed in dairy cattle, supplementation of pig diets with selenium (0.1 to 1.0 ppm) did not always result in an increase in tissue selenium levels. Tcos based on these studies are as much as 10-fold lower compared to Tcos calculated from baseline levels of selenium found in feed (Groce et al., 1971). However, it is not known if this protective mechanism also operates at higher selenium levels in feed that may produce toxic effects in pigs. Thus, we recommend a default pig Tco based on the average Tco (0.48 d/kg) determined using Ku et al. (1972) and Jenkins and Winter (1973), which covered a range of baseline selenium intakes in feed from 0.027 to 0.88 ppm.
Technical Support Document for Exposure Assessment and Stochastic Analysis, FINAL, August, 2012
K-22
K.3 References
Ansari MS, Miller WJ, Gentry RP, Neathery MW and Stake PE (1973). Tissue 203 Hg distribution in young Holstein calves after single tracer oral doses in organic and inorganic forms. J Anim Sci 36(2): 415-9.
Archibald JG (1949). Nickel in cow’s milk. J Dairy Sci 32: 877-80.
Arnold RL, Olson OE and Carlson CW (1973). Dietary selenium and arsenic additions and their effects on tissue and egg selenium. Poult Sci 52: 847-54.
Beale AM, Fasulo DA and Craigmill AL (1990). Effects of oral and parenteral selenium supplements on residues in meat, milk and eggs. Rev Environ Contam Toxicol 115: 125-50.
Beauchamp CJ, Boulanger R, Matte J and Saint-Laurent G (2002). Examination of the contaminants and performance of animals fed and bedded using de-inking paper sludge. Arch Environ Contam Toxicol 42(4): 523-8.
Bluthgen A and Ruoff U (1998). Carry-over of diethylhexylphthalate and aromatic nitro compounds into milk of lactating cows. Third Karlsruhe Nutrition Symposium European Research towards Safer and Better Food.Review and Transfer Congress, Congress Centre, Karlsruhe, Germany, October 18-20, 1998. pp. 25-32.
Bokori J, Fekete S, Glavits R, Kadar I, Koncz J and Kovari L (1996). Complex study of the physiological role of cadmium. IV. Effects of prolonged dietary exposure of broiler chickens to cadmium. Acta Vet Hung 44(1): 57-74.
Bruce SL, Noller BN, Grigg AH, Mullen BF, Mulligan DR, Ritchie PJ, Currey N and Ng JC (2003). A field study conducted at Kidston Gold Mine, to evaluate the impact of arsenic and zinc from mine tailing to grazing cattle. Toxicol Lett 137(1-2): 23-34.
Cavret S, Feidt C, Le Roux Y and Laurent F (2005). Short communication: Study of mammery epithelial role in polycyclic aromatic hydrocarbons transfer to milk. J Dairy Sci 88(1): 67-70.
Chundawat RS and Sood PP (2005). Vitamins deficiency in developing chick during chromium intoxication and protection thereof. Toxicology 211(1-2): 124-31.
Claborn HV, Radeleff RD and Bushland RC. (1960). Pesticide Residues in Meat and Milk. A Research Report. ARS-33-63. Prepared by U.S. Department of Agriculture, Agriculture Research Service. pp. 1-46.
Costa M (1997). Toxicity and carcinogenicity of Cr(VI) in animal models and humans. Crit Rev Toxicol 27(5): 431-42.
Technical Support Document for Exposure Assessment and Stochastic Analysis, FINAL, August, 2012
K-23
Cousins RJ, Barber AK and Trout JR (1973). Cadmium toxicity in growing swine. J Nutr 103(7): 964-72.
Crout NMJ, Beresford NA, Dawson JM, Soar J and Mayes RW (2004). The transfer of 73As, 109Cd and 203Hg to the milk and tissues of dairy cattle. J Agric Sci 142: 203-12.
Davis RH and Fear J (1996). Incorporation of selenium into egg proteins from dietary selenite. Br Poult Sci 37(1): 197-211.
De Vos S, Maervoet J, Schepens P and De Schrijver R (2003). Polychlorinated biphenyls in broiler diets: their digestibility and incorporation in body tissues. Chemosphere 51(1): 7-11.
De Vos S, Verschueren D and De Schrijver R (2005). Digestibility, retention and incorporation of low-level dietary PCB contents in laying hens. Chemosphere 58(11): 1553-62.
De Vries M, Kwakkel RP and Kijistra A (2006). Dioxins in organic eggs: a review. Njas-Wageningen J Life Sci 54(2): 207-21.
Dingle JHP and Palmer WA (1977). Residues of hexachlorobenzene in subcutaneous and butter fat of cattle. Aust J Exp Agric Animal Husb 17: 712-17.
Douben PE, Alcock RE and Jones KC (1997). Congener specific transfer of PCDD/Fs from air to cows' milk: an evaluation of current modelling approaches. Environ Pollut 95(3): 333-44.
EC. (2002). Opinion of the Scientific Committee on Food on the Risk to Human Health of Polycyclic Aromatic Hydrocarbons in Food. European Commission, Health and Consumer Protection Directorate-General. SCF/CS/CNTM/PAH/29 Final. Available online at: http://europa.eu.int/comm/food/fs/sc/scf/out153_en.pdf.
Echevarria MG, Henry PR, Ammerman CB, Rao PV and Miles RD (1988a). Estimation of the relative bioavailability of inorganic selenium sources for poultry. 1. Effect of time and high dietary selenium on tissue selenium uptake. Poult Sci 67(9): 1295-301.
Echevarria MG, Henry PR, Ammerman CB, Rao PV and Miles RD (1988b). Estimation of the relative bioavailability of inorganic selenium sources for poultry. 2. Tissue uptake of selenium from high dietary selenium concentrations. Poult Sci 67(11): 1585-92.
Eisenreich SJ, Looney BB and Thornton JD (1981). Airborne organic contaminants in the Great Lakes ecosystem. Environ Sci Technol 15: 30-38.
Firestone D, Clower M, Jr., Borsetti AP, Tseke RH and Long PE (1979). Polychlorodibenzo-p-dioxin and pentachlorophenol residues in milk and blood of cows fed technical pentachlorophenol. J Agric Food Chem 27(6): 1171-7.
Technical Support Document for Exposure Assessment and Stochastic Analysis, FINAL, August, 2012
K-24
Fisher LJ, Hoogendoorn C and Montemurro J (1980). The effect of added dietary selenium on the selenium content of milk, urine and feces. Can J Anim Sci 60: 79-86.
Fries GF (1996). A model to predict concentrations of lipophilic chemicals in growing pigs. Chemosphere 32(3): 443-51.
Fries GF and Marrow GS (1976). Hexachlorobenzene retention and excretion by dairy cows. J Dairy Sci 59(3): 475-80.
Groce AW, Miller ER, Keahey KK, Ullrey DE and Ellis DJ (1971). Selenium supplementation of practical diets for growing-finishing swine. J Anim Sci 32(5): 905-11.
Grova N, Feidt C, Crepineau C, Laurent C, Lafargue PE, Hachimi A and Rychen G (2002). Detection of polycyclic aromatic hydrocarbon levels in milk collected near potential contamination sources. J Agric Food Chem 50(16): 4640-2.
Grova N, Laurent C, Feidt C, Rychen G, Laurent F and Lichtfouse E (2000). Gas chromatography-mass spectrometry study of polycyclic aromatic hydrocarbons in grass and milk from urban and rural farms. Eur J Mass Spectrometry 6(5): 457-460.
Hahn PH and Guenter W (1986). Effect of dietary fluoride and aluminum on laying hen performance and fluoride concentration in blood, soft tissue, bone, and egg. Poult Sci 65(7): 1343-9.
Ham WE, Kline EA and Ensminger ME (1949). Residual arsenic and strychnine in the tissues of drug-treated cattle. Am J Vet Res 10(35): 150-3.
Hansen LG, Tuinstra LG, Kan CA, Strik JJ and Koeman JH (1983). Accumulation of chlorobiphenyls in chicken fat and liver after feeding Aroclor 1254 directly or fat from swine fed Aroclor 1254. J Agric Food Chem 31(2): 254-60.
Harnly ME, Petreas MX, Flattery J and Goldman LR (2000). Polychlorinated dibenzo-p-dioxin and polychlorinated dibenzofuran contamination in soil and home-produced chicken eggs near pentachlorophenol sources. Environ Sci Technol 34(7): 1143-9.
Harris LE, Raleigh RJ, Stoddard GE, Greenwood DA, Shupe JL and Nielsen HM (1964). Effects of fluorine on dairy cattle. III. Digestion and metabolism trials. J Anim Sci 23: 537-46.
Hidiroglou M, Proulx J and Jolette J (1987). Effect of intraruminally administered, selenium soluble-glass boluses on selenium status in cows and their calves. J Anim Sci 65(3): 815-20.
Hilmy MI, Rahim SA, Abbas AH and Taka RY (1978). Toxicity of organic mercury in sheep and hens. Clin Toxicol 12(4): 445-56.
Hinesly TD, Hansen LG, Bray DJ and Redborg KE (1985). Transfer of sludge-borne cadmium through plants to chickens. J Agric Food Chem 33(2): 173-80.
Technical Support Document for Exposure Assessment and Stochastic Analysis, FINAL, August, 2012
K-25
Holcman A and Stibilj V (1997). Arsenic residues in eggs from laying hens fed with a diet containing arsenic (III) oxide. Arch Environ Contam Toxicol 32(4): 407-10.
Hoogenboom LA, Kan CA, Zeilmaker MJ, Van Eijkeren J and Traag WA (2006). Carry-over of dioxins and PCBs from feed and soil to eggs at low contamination levels-- influence of mycotoxin binders on the carry-over from feed to eggs. Food Addit Contam 23(5): 518-27.
Hoogenboom LAP (2005). Behavior of polyhalogenated and polycyclic aromatic hydrocarbons in food-producing animals. Rev Food Nutr Toxicity 2: 269-99.
Horstmann M and McLachlan MS (1998). Atmospheric deposition of semivolatile organic compounds to two forest canopies. Atmos Environ 32(10): 1799-1809.
Huwe JK and Smith DJ (2005). Laboratory and on-farm studies on the bioaccumulation and elimination of dioxins from a contaminated mineral supplement fed to dairy cows. J Agric Food Chem 53(6): 2362-70.
Iben C, Bohm J, Tausch H, Leibetseder J and Luf W (2003). Dioxin residues in the edible tissue of broiler chicken. J Anim Physiol Anim Nutr (Berl) 87(3-4): 142-8.
Ishida M (1993). Reduction of phthalate in chicken eggs, liver and meat by several cooking methods. J Food Hyg Soc Japan 34(6): 529-31.
Ishida M, Suyama K and Adachi S (1981). Occurrence of dibutyl and di(2-ethylhexyl) phthalate in chicken eggs. J Agric Food Chem 29(1): 72-4.
Jenkins KJ and Hidiroglou M (1986). Tolerance of the preruminant calf for selenium in milk replacer. J Dairy Sci 69(7): 1865-70.
Jenkins KJ and Winter KA (1973). Effects of selenium supplementation of naturally high selenium swine rations on tissue levels of the element. Can J Anim Sci 53: 561-67.
Johnson DE, Kienholz EW, Baxter JC, Spangler E and Ward GM (1981). Heavy metal retention in tissues of cattle fed high cadmium sewage sludge. J Anim Sci 52(1): 108-14.
Kan CA (1978). Accumulation of organochlorine pesticides in poultry: a review. J Agric Food Chem 26(5): 1051-5.
Kelly TJ, Czuczwa JM, Sticksel PR, Sticksel PR, Sverdrup GM, Koval PJ and Hodanbosi RF (1991). Atmospheric and tributary inputs of toxic substances to Lake Erie. J Great Lakes Res 17(4): 504-16.
Kerst M, Waller U, Reifenhauser W and Korner W (2004). Carry-over rates of dioxin-like PCB from grass to cow’s milk. Organohalogen Compd 66: 2440-4.

Technical Support Document for Exposure Assessment and Stochastic Analysis, FINAL, August, 2012
K-26
Kiwimae A, Swensson A, Ulfvarson U and Westoo G (1969). Methylmercury compounds in eggs from hens after oral administration of mercury compounds. J Agric Food Chem 17(5): 1014-6.
Kozak S and Forsberg CW (1979). Transformation of mercuric chloride and methylmercury by the rumen microflora. Appl Environ Microbiol 38(4): 626-36.
Ku PK, Ely WT, Groce AW and Ullrey DE (1972). Natural dietary selenium, -tocopherol and effect on tissue selenium. J Anim Sci 34(2): 208-11.
Lameiras J, Soares ME, Bastos ML and Ferreira M (1998). Quantification of total chromium and hexavalent chromium in UHT milk by ETAAS. Analyst 123(10): 2091-5.
Lamphere DN, Dorn CR, Reddy CS and Meyer AW (1984). Reduced cadmium body burden in cadmium-exposed calves fed supplemental zinc. Environ Res 33(1): 119-29.
Lane DA, Johnson ND, Hanely MJ, Schroeder WH and Ord DT (1992). Gas-and particle-phase concentrations of alpha-hexachlorocyclohexane, gamma-hexachlorocyclohexane, and hexachlorobenzene in Ontario air. Environ Sci Technol 26(1): 126-33.
Lasky T, Sun W, Kadry A and Hoffman MK (2004). Mean total arsenic concentrations in chicken 1989-2000 and estimated exposures for consumers of chicken. Environ Health Perspect 112(1): 18-21.
Latta DM and Donaldson WE (1986a). Lead toxicity in chicks: interactions with dietary methionine and choline. J Nutr 116(8): 1561-8.
Latta DM and Donaldson WE (1986b). Modification of lead toxicity and organ distribution by dietary sulfur amino acids in chicks (Gallus domesticus). Comp Biochem Physiol C 84(1): 101-4.
Leach RM, Jr., Wang KW and Baker DE (1979). Cadmium and the food chain: the effect of dietary cadmium on tissue composition in chicks and laying hens. J Nutr 109(3): 437-43.
Ling JR and Leach RM, Jr. (1979). Studies on nickel metabolism: interaction with other mineral elements. Poult Sci 58(3): 591-6.
Lorber M, Fries G, Winters D, Ferrario J and Byrne C (2000). A study of the mass balance of dioxins and furans in lactating cows in background conditions. Part 2: Mass balance and bioconcentration factors. Organohalogen Compd 46: 326-9.
Lutz S, Feidt C, Monteau F, Rychen G, Le Bizec B and Jurjanz S (2006). Effect of exposure to soil-bound polycyclic aromatic hydrocarbons on milk contaminations of parent compounds and their monohydroxylated metabolites. J Agric Food Chem 54(1): 263-8.
Technical Support Document for Exposure Assessment and Stochastic Analysis, FINAL, August, 2012
K-27
MacLachlan DJ (2008). Transfer of fat-soluble pesticides from contaminated feed to poultry tissues and eggs. Br Poult Sci 49(3): 290-8.
MacLachlan DJ (2009). Influence of physiological status on residues of lipophilic xenobiotics in livestock. Food Addit Contam Part A Chem Anal Control Expo Risk Assess 26(5): 692-712.
MacLachlan DJ (2010). Physiologically based pharmacokinetic (PBPK) model for residues of lipophilic pesticides in poultry. Food Addit Contam Part A Chem Anal Control Expo Risk Assess 27(3): 302-14.
MacLachlan DJ and Bhula R (2008). Estimating the residue transfer of pesticides in animal feedstuffs to livestock tissues, milk and eggs: a review. Aust J Experimental Agric 48(5): 589-98.
Maervoet J, Chu SG, De Vos S, Covaci A, Voorspoels S, De Schrijver R and Schepens P (2004). Accumulation and tissue distribution of selected polychlorinated biphenyl congeners in chickens. Chemosphere 57(1): 61-6.
Malisch R, Schmid P, Frommberger R and Furst P (1996). Results of a quality control study of different analytical methods for determination of PCDD in egg samples. Chemosphere 32(1): 31-44.
Maus RW, Martz FA, Belyea RL and Weiss MF (1980). Relationship of dietary selenium to selenium in plasma and milk from dairy cows. J Dairy Sci 63(4): 532-7.
McLachlan M and Richter W (1998). Uptake and transfer of PCDDs by cattle fed naturally contaminated feedstuffs and feed contaminated as a result of sewage sludge application: 1. Lactating cows. J Agric Food Chem 46(3): 1166-72.
McLachlan M, Thoma H, Reissinger M and Hutzinger O (1990). PCDD/F in an agricultural food chain. Part 1: PCDD/F mass balance of a lactating cow. Chemosphere 20(7-9): 1013-20.
McLachlan MS (1996). Bioaccumulation of hydrophobic chemicals in agricultural food chains. Environ Sci Technol 30(1): 252-9.
Meador JP, Stein JE, Reichert WL and Varanasi U (1995). Bioaccumulation of polycyclic aromatic hydrocarbons by marine organisms. Rev Environ Contam Toxicol 143: 79-165.
Mehennaoui S, Delacroix-Buchet A, Duche A, Enriquez B, Kolf-Clauw M and Milhaud G (1999). Comparative study of cadmium transfer in ewe and cow milks during rennet and lactic curds preparation. Arch Environ Contam Toxicol 37(3): 389-95.
Meluzzi A, Simoncini F, Sirri F, Vandi L and Giordani G (1996). Feeding hens diets supplemented with heavy metals (chromium, nickel and lead). Archiv fuer Gefluegelkunde 60(3): 119-25.
Technical Support Document for Exposure Assessment and Stochastic Analysis, FINAL, August, 2012
K-28
Moksnes K and Norheim G (1982). Selenium concentrations in tissues and eggs of growing and laying chickens fed sodium selenite at different levels. Acta Vet Scand 23(3): 368-79.
Muhlemann M, Sieber R, Schallibaum M and Zoller O (2006). Polycyclic aromatic hydrocarbons in Swiss dry feed for dairy cattle and contamination resulting in milk and meat - a risk assessment. Mitt Lebensm Hyg 97: 121-39.
Mullen AL, Stanley RE, Lloyd SR and Moghissi AA (1975). Absorption, distribution and milk secretion of radionuclides by the dairy cow IV. Inorganic radiomercury. Health Phys 28: 685-91.
Neathery MW, Miller WJ, Gentry RP, Stake PE and Blackmon DM (1974). Cadmium-109 and methyl mercury-203 metabolism, tissue distribution, and secretion into milk of cows. J Dairy Sci 57(10): 1177-83.
Ng YC (1982). A review of transfer factors for assessing the dose from radionuclides in agricultural products. Nucl Safety 23(1): 57-71.
NTP (2008). NTP Technical Report on the Toxicology and Carcinogenesis Studies of Sodium Dichromate Dihydrate (CAS NO. 7789-12-0) in F344/N Rats and B6C3F1 Mice (Drinking Water Studies). NTP TR 546, NIH Publication No. 08-5887, National Toxicology Program, Research Triangle Park, NC. Online at: http://ntp.niehs.nih.gov.
O'Dell GD, Miller WJ, King WA, Ellers JC and Jurecek H (1970). Effect of nickel supplementation on production and composition of milk. J Dairy Sci 53(11): 1545-8.
Ort JF and Latshaw JD (1978). The toxic level of sodium selenite in the diet of laying chickens. J Nutr 108(7): 1114-20.
Overby LR and Frost DV (1962). Nonretention by the chicken of the arsenic in tissues of swine fed arsanilic acid. Toxicol Appl Pharmacol 4: 745-51.
Parker CE, Jones WA, Matthews HB, McConnell EE and Hass JR (1980). The chronic toxicity of technical and analytical pentachlorophenol in cattle. II. Chemical analyses of tissues. Toxicol Appl Pharmacol 55(2): 359-69.
Peoples SA (1964). Arsenic toxicity in cattle. Ann N Y Acad Sci 111: 644-9.
Petreas MX, Goldman LR, Hayward DG, Chang RR, Flattery JJ, Wiesmuller T and Stephens RD (1991). Biotransfer and bioaccumulation of PCDD/PCDFs from soil: Controlled exposure studies of chickens. Chemosphere 23(11-12): 1731-41.
Pirard C and De Pauw E (2005). Uptake of polychlorodibenzo-p-dioxins, polychlorodibenzofurans and coplanar polychlorobiphenyls in chickens. Environ Int 31(4): 585-91.
Technical Support Document for Exposure Assessment and Stochastic Analysis, FINAL, August, 2012
K-29
Pirard C and De Pauw E (2006). Toxicokinetic study of dioxins and furans in laying chickens. Environ Int 32(4): 466-9.
Pizarro I, Gomez MM, Fodor P, Palacios MA and Camara C (2004). Distribution and biotransformation of arsenic species in chicken cardiac and muscle tissues. Biol Trace Elem Res 99(1-3): 129-43.
Potter GD, McIntyre DR and Vattuone GM (1972). Metabolism of 203 Hg administered as HgCl 2 in the dairy cow and calf. Health Phys 22(1): 103-6.
Pribilincova J, Maretta M, Janotikova I and Marettova E (1995). The effect of cadmium treatment on breeding hens and cocks and early viability of their chickens. Vet Med (Praha) 40(11): 353-7.
RTI. (2005). Research Triangle Institute. Methodology for predicting cattle biotransfer factors. RTI Project Number 08860.002.015, Research Triangle Institute, Research Triangle Park, NC, USA.
Schaum J, Schuda L, Wu C, Sears R, Ferrario J and Andrews K (2003). A national survey of persistent, bioaccumulative, and toxic (PBT) pollutants in the United States milk supply. J Expo Anal Environ Epidemiol 13(3): 177-86.
Schuler F, Schmid P and Schlatter C (1997a). The transfer of polychlorinated dibenzo-p-dioxins and dibenzofurans from soil into eggs of foraging chicken. Chemosphere 34(4): 711-8.
Schuler F, Schmid P and Schlatter C (1997b). Transfer of airborne polychlorinated dibenzo-p-dioxins and dibenzofurans into dairy milk. J Agric Food Chem 45(10): 4162-7.
Scott ML, Zimmermann JR, Marinsky S, Mullenhoff PA, Rumsey GL and Rice RW (1975). Effects of PCBs, DDT, and mercury compounds upon egg production, hatchability and shell quality in chickens and Japanese quail. Poult Sci 54(2): 350-68.
Sharma RP and Street JC (1980). Public health aspects of toxic heavy metals in animal feeds. J Am Vet Med Assoc 177(2): 149-53.
Sharma RP, Street JC, Shupe JL and Bourcier DR (1982). Accumulation and depletion of cadmium and lead in tissues and milk of lactating cows fed small amounts of these metals. J Dairy Sci 65(6): 972-9.
Sharma RP, Street JC, Verma MP and Shupe JL (1979). Cadmium uptake from feed and its distribution to food products of livestock. Environ Health Perspect 28: 59-66.
Shupe JL, Miner ML and Greenwood DA (1964). Clinical and pathological aspects of fluorine toxicosis in cattle. Ann N Y Acad Sci 111: 618-37.
Technical Support Document for Exposure Assessment and Stochastic Analysis, FINAL, August, 2012
K-30
Slob W, Olling M, Derks HJ and de Jong AP (1995). Congener-specific bioavailability of PCDD/Fs and coplanar PCBs in cows: laboratory and field measurements. Chemosphere 31(8): 3827-38.
Soares JH, Miller D, Lagally H, Stillings BR, Bauersfeld P and Cuppett S (1973). The comparative effect of oral ingestion of methyl mercury on chicks and rats. Poult Sci 52(452-8).
Spitaler M, Iben C and Tausch H (2005). Dioxin residues in the edible tissue of finishing pigs after dioxin feeding. J Anim Physiol Anim Nutr (Berl) 89(3-6): 65-71.
Stephens RD, Petreas MX and Hayward DG (1995). Biotransfer and bioaccumulation of dioxins and furans from soil: chickens as a model for foraging animals. Sci Total Environ 175(3): 253-73.
Stevens JB (1991). Disposition of toxic metals in the agricultural food chain: 1. Steady-state bovine milk biotransfer factors. Environ Sci Technol 25(7): 1289-94.
Stevens JB (1992). Disposition of toxic metals in the agricultural food chain. 2. Steady-state bovine tissue biotransfer factors. Environ Sci Technol 26(10): 1915-21.
Stoddard GE, Bateman GQ, Harris LE and Shupe JLGDA (1963). Effects of fluorine on dairy cattle. IV. Milk production. J Dairy Sci 46(7): 720-6.
Surendra Nath B, Unnikrishnan V, Preeja CN and Rama Murthy MK (2000). A study on the transfer of organochlorine pesticide residues from the feed of the cattle into their milk. Pesticide Res J 12(1): 68-73.
Suttie JW, Phillips PH and Miller RF (1958). Studies of the effects of dietary sodium fluoride on dairy cows. III. Skeletal and soft tissue fluorine deposition and fluorine toxicosis. J Nutr 65(2): 293-304.
Szokolay A, Madaric A and Uhnak J (1977). Relative cumulation of beta-BHC in ecological and biological system. J Environ Sci Health B 12(3): 193-212.
Thomas GO, Sweetman AJ and Jones KC (1999a). Input-output balance of polychlorinated biphenyls in a long-term study of lactating dairy cows. Environ Sci Technol 33(1): 104-12.
Thomas GO, Sweetman AJ and Jones KC (1999b). Metabolism and body-burden of PCBs in lactating dairy cows. Chemosphere 39(9): 1533-44.
Thomas GO, Sweetman AJ, Lohmann R and Jones KC (1998). Derivation and field testing of air-milk and feed-milk transfer factors for PCBs. Environ Sci Technol 32(22): 3522-8.
Technical Support Document for Exposure Assessment and Stochastic Analysis, FINAL, August, 2012
K-31
Traag WA, Kan CA, van der Weg G, Onstenk C and Hoogenboom LA (2006). Residues of dioxins (PCDD/Fs) and PCBs in eggs, fat and livers of laying hens following consumption of contaminated feed. Chemosphere 65(9): 1518-25.
U.S. EPA. (1997). Mercury Study Report to Congress Volume III: Fate and Transport of Mercury in the Environment, Chapter 3, Measured Concentrations. . U.S. Environmental Protection Agency, EPA-452/R-97-005.
U.S. EPA. (2005). Human Health Risk Assessment Protocol for Hazardous Waste Combustion Facilities. U.S. Environmental Protection Agency, Office of Solid Waste, EPA 530-R-05-006. Online at: www.epa.gov/osw.
USDA. (1975). Composition of Foods: Raw, Processed, Prepared. Agriculture Handbook No. 8, U.S. Department of Agriculture.
Vadnjal R, Stibilj V, Holcman A and Dermelj M (1997). Distribution of selenium and iodine in the tissues of laying hens fed with As2O3 added to the diet. Zootehnika 70: 195-200.
Van Bruwaene R, Gerber GB, Kirchmann R, Colard J and Van Kerkom J (1984). Metabolism of 51Cr, 54Mn, 59Fe and 60Co in lactating dairy cows. Health Phys 46(5): 1069-82.
van den Hoek J, Salverda MH and Tuinstra LGMT (1975). The excretion of six organochlorine pesticides into the milk of the dairy cow after oral administration. Neth Milk Dairy J 29: 66-78.
Van Eijkeren JC, Zeilmaker MJ, Kan CA, Traag WA and Hoogenboom LA (2006). A toxicokinetic model for the carry-over of dioxins and PCBs from feed and soil to eggs. Food Addit Contam 23(5): 509-17.
Vreman K, Poortvliet LJ and van den Hoek J (1980). Transfer of organochlorine pesticides from feed into the milk and body fat of cows. Long-term experiment with intake at low levels. Neth Milk Dairy J 34: 87-105.
Vreman K, Tuinstra LGMT, Van den Hoek J, Bakker J, Roos AH, de Visser H and Westerhuis JH (1976). Aldrin, heptachlor and beta-hexachlorocyclohexane to dairy cows at three oral dosages. 1. Residues in milk and body fat of cows early and late in lactation. Neth J Agric Sci 24: 197-207.
Vreman K, van der Veen NG, van Der Molen EJ and de Ruig WG (1986). Transfer of cadmium, lead, mercury and arsenic from feed into milk and various tissues of dairy cows: chemical and pathological data. Neth J Agric Sci 34: 129-44.
Vreman K, Van der Veen NG, Van Der Molen EJ and De Ruig WG (1988). Transfer of cadmium, lead, mercury and arsenic from feed into tissues of fattening bulls: chemical and pathological data. Neth J Agric Sci 36: 327-38.
Technical Support Document for Exposure Assessment and Stochastic Analysis, FINAL, August, 2012
K-32
Willett LB, Blanford JJ, Becker CJ and Bromund RH. (1994). Distribution of Lead in Lactating Cows. 145. Special circular-Ohio Agricultural Research and Development Center, OARDC Dairy Science, pp. 9-11.
Willett LB, Liu TT and Fries GF (1990). Reevaluation of polychlorinated biphenyl concentrations in milk and body fat of lactating cows. J Dairy Sci 73(8): 2136-42.
Williams S and Mills PA (1964). Residues in milk of cows fed rations containing low concentrations of five chlorinated hydrocarbon pesticides. J A O A C 47(6): 1124-8.