
Appendix I Seismic Analysis - Microsoft...The locations of the CFJ Mine, Dam I, and the portable...
24
Report of the Expert Panel on the Technical Causes of the Failure of Feijão Dam I Appendix I Seismic Analysis December 2019
Transcript of Appendix I Seismic Analysis - Microsoft...The locations of the CFJ Mine, Dam I, and the portable...
Report of the Expert Panel on the Technical Causes of the Failure of Feijão Dam I
Appendix I
Seismic Analysis
December 2019

Report of the Expert Panel on the Technical Causes of the Failure of Feijão Dam I
Appendix I – Seismic Analysis
i
TABLE OF CONTENTS
1. INTRODUCTION ...............................................................................................................1
2. SOURCES OF DATA .........................................................................................................1
2.1 Permanent Seismograph Stations................................................................................1
2.2 Portable Monitoring Stations ......................................................................................2
2.3 Time of Failure of Dam I ............................................................................................4
3. ANALYSIS AND INTERPRETATION OF DATA ...........................................................5
3.1 Permanent Seismograph Stations................................................................................5
3.1.1 Evaluation of Potential Blasting Events ......................................................10
3.1.2 Potential Effect of Pre-Failure Blasting at CFJ ...........................................16
3.1.3 Comparison with Data Recorded during DHP 15 Installation ....................16
3.2 Portable Monitoring Stations ....................................................................................20
4. CONCLUSIONS................................................................................................................21
LIST OF FIGURES
Figure 1: General Configuration of VL Permanent Seismograph Stations .............................2
Figure 2: Locations of Dam I, CFJ Mine, FJAO Seismograph Station, and Portable
Monitoring Stations .................................................................................................4
Figure 3: FJAO Seismograph Data for 10:00 to 14:00 Local Time on January 25, 2019.......6
Figure 4: FJAO Seismograph Data for 12:27 to 12:35 Local Time on January 25, 2019.......7
Figure 5: FJAO Seismograph Data for Event 1 on January 25, 2019 .....................................8
Figure 6: FJAO Seismograph Data for Event 2 on January 25, 2019 .....................................9
Figure 7: FJAO Seismograph Data from 14:56 to 14:57 Local Time on January 7, 2019 ...11
Figure 8: FJAO Seismograph Data from 11:28:30 to 11:29:30 Local Time on January
10, 2019..................................................................................................................12
Figure 9: FJAO Seismograph Data from 12:28 to 12:29 Local Time on January 14,
2019........................................................................................................................13
Figure 10: FJAO Seismograph Data from 13:21 to 13:22 Local Time on January 22,
2019........................................................................................................................14
Figure 11: Cross-Correlation Functions ..................................................................................15
Figure 12: FJAO Seismograph Data from 13:00 to 16:00 Local Time on June 11, 2018.......18
Figure 13: FJAO Seismograph Data from 13:45 to 13:47 Local Time on June 11, 2018.......19

Report of the Expert Panel on the Technical Causes of the Failure of Feijão Dam I
Appendix I – Seismic Analysis
ii
Figure 14: Comparison of Event 1 on January 25, 2019 with event on June 11, 2018 ...........20
LIST OF TABLES
Table 1: Locations of CFJ Mine, Dam I, and Permanent Seismograph Stations ...................1
Table 2: Locations of CFJ Mine, Dam I, and Portable Monitoring Stations .........................3
Table 3: Blasts at CFJ from January 7 to 22, 2019, as Documented on Available Firing
Plans .......................................................................................................................10
Table 4: Peak Particle Velocity Associated with Blasting Events .......................................16

Report of the Expert Panel on the Technical Causes of the Failure of Feijão Dam I
Appendix I – Seismic Analysis
1
1. INTRODUCTION
This Appendix reviews data from permanent seismograph stations and portable monitoring
stations in proximity to Vale S.A.’s (“Vale”) Córrego do Feijão Mine Dam I (“Dam I”) in
Brumadinho, Brazil. The objective in gathering these data was to understand the characteristics
of recorded ground vibrations proximate to Dam I at or around the time of the failure of the dam
on January 25, 2019. This Appendix presents: (i) the sources of data reviewed, (ii) analyses and
interpretations of the data, and (iii) conclusions.
2. SOURCES OF DATA
2.1 Permanent Seismograph Stations
The data reviewed were recorded at four permanent seismograph stations: (i) Feijão (“FJAO”), (ii)
Água Limpa (“AGLP”), (iii) Bom Sucesso (“BSCB”), and (iv) Diamantina (“DIAM”). FJAO and
AGLP are stations in the Vale seismograph network (“VL”); BSCB and DIAM are stations in the
Brazilian seismograph network (“BL”). The locations of the Córrego do Feijão mine (“CFJ
Mine”), Dam I, and each seismograph station are presented in Table 1. The distance from each
seismograph station to the approximate center of: (i) Dam I, and (ii) the CFJ Mine also is shown
in Table 1.
Table 1: Locations of CFJ Mine, Dam I, and Permanent Seismograph Stations
Feature Coordinates Calculated Distance
to Dam I
(m)
Calculated Distance
to CFJ Mine
(m)
Northing
(m)
Easting
(m)
CFJ Mine1 7,776,519.4 591,123.6 1,662 -
Dam I2 7,775,080.0 591,955.0 - 1,662
FJAO3 7,777,215.3 590,951.6 2,359 717
AGLP3 7,794,390.1 685,476.6 95,494 96,030
BSCB4 7,678,011.3 524,579.5 118,160 118,878
DIAM4 7,976,637.9 641,121.0 207,468 206,270
The review focused on analyzing and interpreting data from FJAO because of its proximity to the
CFJ Mine and Dam I. The other three stations are at least 40 times further away from Dam I. For
1 Approximate center of the excavation (Figure 2). 2 Approximate center of the dam (Figure 2). 3 VALE Seismological Network (June 18, 2018) (“Vale Seismological Network Documents”). 4 Rede Sismográfica Brasileira. (2019). Map of seismograph stations in Brazil. Retrieved from
http://www.rsbr.gov.br/
Report of the Expert Panel on the Technical Causes of the Failure of Feijão Dam I
Appendix I – Seismic Analysis
2
this reason, vibrations recorded at FJAO are more representative of those likely to have been
experienced at Dam I.
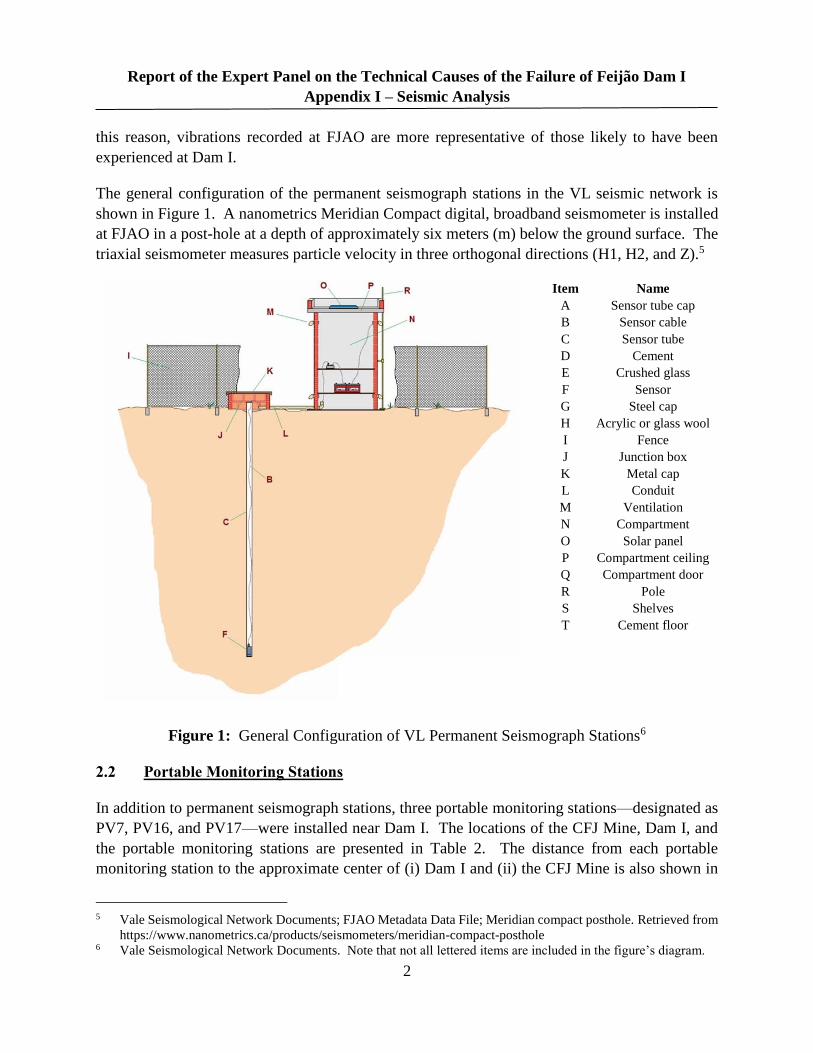
The general configuration of the permanent seismograph stations in the VL seismic network is
shown in Figure 1. A nanometrics Meridian Compact digital, broadband seismometer is installed
at FJAO in a post-hole at a depth of approximately six meters (m) below the ground surface. The
triaxial seismometer measures particle velocity in three orthogonal directions (H1, H2, and Z).5
Item Name
A Sensor tube cap
B Sensor cable
C Sensor tube
D Cement
E Crushed glass
F Sensor
G Steel cap
H Acrylic or glass wool
I Fence
J Junction box
K Metal cap
L Conduit
M Ventilation
N Compartment
O Solar panel
P Compartment ceiling
Q Compartment door
R Pole
S Shelves
T Cement floor
Figure 1: General Configuration of VL Permanent Seismograph Stations6
2.2 Portable Monitoring Stations
In addition to permanent seismograph stations, three portable monitoring stations—designated as
PV7, PV16, and PV17—were installed near Dam I. The locations of the CFJ Mine, Dam I, and
the portable monitoring stations are presented in Table 2. The distance from each portable
monitoring station to the approximate center of (i) Dam I and (ii) the CFJ Mine is also shown in
5 Vale Seismological Network Documents; FJAO Metadata Data File; Meridian compact posthole. Retrieved from
https://www.nanometrics.ca/products/seismometers/meridian-compact-posthole 6 Vale Seismological Network Documents. Note that not all lettered items are included in the figure’s diagram.

Report of the Expert Panel on the Technical Causes of the Failure of Feijão Dam I
Appendix I – Seismic Analysis
3
Table 2. Figure 2 shows the location of the FJAO seismograph station and the three portable
monitoring stations relative to Dam I and the CFJ Mine.
Table 2: Locations of CFJ Mine, Dam I, and Portable Monitoring Stations
Feature Coordinates Calculated Distance
to Dam I
(m)
Calculated Distance
to CFJ Mine (m) Northing
(m)
Easting
(m)
CFJ Mine7 7,776,519.4 591,123.6 1,662 -
Dam I8 7,775,080.0 591,955.0 - 1,662
PV79 7,773,211.0 591,754.0 1,880 3,368
PV169 7,775,093.0 591,524.0 431 1,482
PV179 7,774,969.0 592,066.0 157 1,814
The portable monitoring stations have three sensors mounted in orthogonal directions (transverse,
longitudinal, and vertical) to record ground vibrations and a microphone to record air-borne noise.
Unlike the permanent seismograph stations that record continuously, the portable monitoring
stations are set to trigger (i.e., begin recording) once the velocity of ground vibrations exceeds 5
×10-4 meters per second (m/s).10
7 Approximate center of the excavation (Figure 2). 8 Approximate center of the dam (Figure 2). 9 Seismographic Monitoring Technical Report, Córrego do Feijão Mine Region (Vale 2019) (“Vale Seismographic
Monitoring Report”). 10 Vale Seismographic Monitoring Report.

Report of the Expert Panel on the Technical Causes of the Failure of Feijão Dam I
Appendix I – Seismic Analysis
4
Figure 2: Locations of Dam I, CFJ Mine, FJAO Seismograph Station, and Portable Monitoring
Stations11
2.3 Time of Failure of Dam I
For comparison with the seismograph data, this Appendix relies on video analysis to identify the
time of the failure of Dam I. The first visible indication of failure occurs at 12:28:21:90 local time
on January 25, 2019 (Appendix D). As described in Appendix D, the time of initiation of the
failure used herein has been subtracted by one second to account for the time difference between
the time stamp of the video camera and Coordinated Universal Time (UTC), adjusted to local time
(UTC -2).12
11 Google Earth. (n.d.). Retrieved June 1, 2018. Text added by authors. 12 According to a report issued by the University of São Paulo, the time at the FJAO seismograph station is
synchronized via the Global Positioning System (GPS) and is accurate within approximately one microsecond.
Seismographic Network of the Iron Quadrangle: Seismological Monitoring, Center of Seismology, University of
São Paulo (February 2019) (“USP Seismographic Network for the Iron Quadrangle Report”).
Report of the Expert Panel on the Technical Causes of the Failure of Feijão Dam I
Appendix I – Seismic Analysis
5
3. ANALYSIS AND INTERPRETATION OF DATA
3.1 Permanent Seismograph Stations
Data from the FJAO seismograph station was provided in miniSEED file format. Additional
metadata was provided to define the sensor characteristics, such as sensitivity. The raw sensor
output was converted to ground velocity prior to interpretation by: (i) detrending each time series,
(ii) using the instrument sensitivity to calculate the ground velocity in m/s, and (iii) applying a
high-pass filter with a corner frequency of 1 hertz (Hz) to remove low-frequency noise.
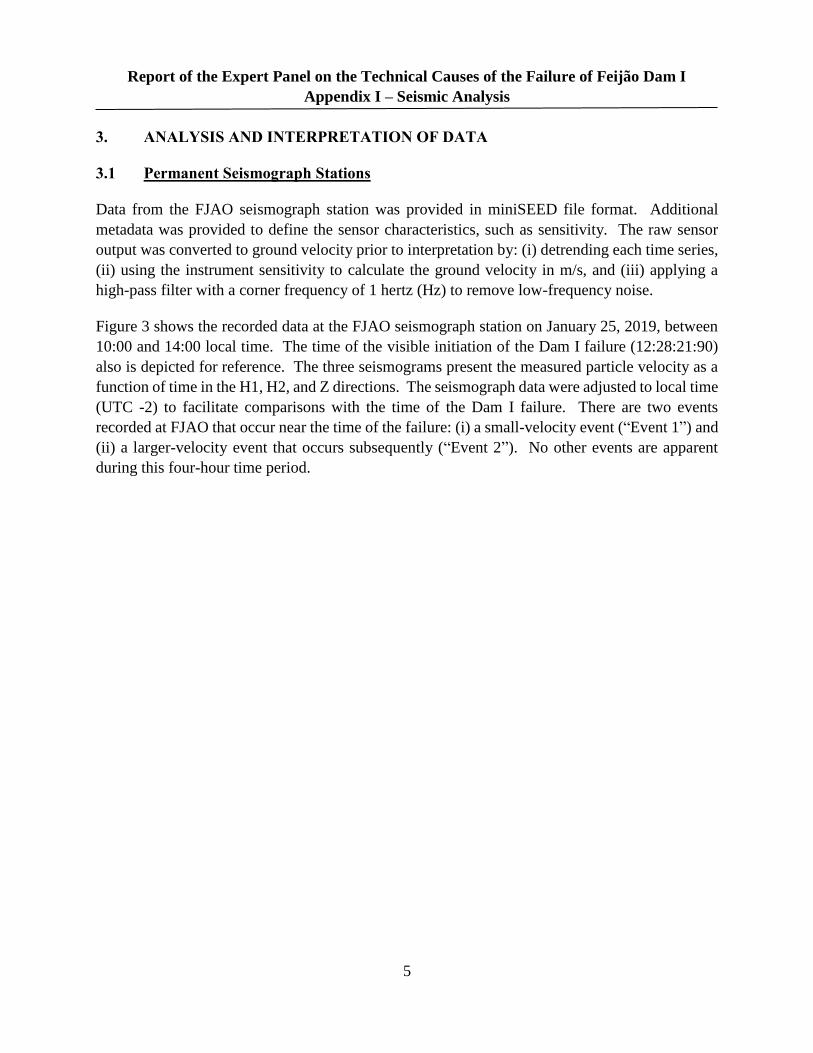
Figure 3 shows the recorded data at the FJAO seismograph station on January 25, 2019, between
10:00 and 14:00 local time. The time of the visible initiation of the Dam I failure (12:28:21:90)
also is depicted for reference. The three seismograms present the measured particle velocity as a
function of time in the H1, H2, and Z directions. The seismograph data were adjusted to local time
(UTC -2) to facilitate comparisons with the time of the Dam I failure. There are two events
recorded at FJAO that occur near the time of the failure: (i) a small-velocity event (“Event 1”) and
(ii) a larger-velocity event that occurs subsequently (“Event 2”). No other events are apparent
during this four-hour time period.

Report of the Expert Panel on the Technical Causes of the Failure of Feijão Dam I
Appendix I – Seismic Analysis
6
Figure 3: FJAO Seismograph Data for 10:00 to 14:00 Local Time on January 25, 2019
Figure 4 depicts the seismograms plotted on an expanded time scale from 12:27:00 to 12:35:00
local time. Event 1 appears to initiate prior to the first visible indication of the initiation of the
Dam I failure as established by the video analysis, and Event 2 occurs approximately six minutes
after the initiation of the failure.
Report of the Expert Panel on the Technical Causes of the Failure of Feijão Dam I
Appendix I – Seismic Analysis
7
Figure 4: FJAO Seismograph Data for 12:27 to 12:35 Local Time on January 25, 2019
Figures 5 and 6 are expanded plots of Events 1 and 2, respectively, to enable additional details to
be seen for each event. Event 1 initiated at approximately 12:27:54 local time with a duration of
approximately six minutes, and the peak velocity (recorded on H2) is approximately 9 × 10⁻⁵ m/s.
Event 1 appears to consist of two subevents – an initial subevent at 12:27:54 that had a duration
of approximately 16 seconds, followed by a second, continuous event at approximately 12:28:10
local time. Event 2 initiated at approximately 12:34:17 local time with a shorter duration of
approximately 10 to 20 seconds and a larger velocity (recorded on H2) of approximately 3 × 10⁻³
m/s.

Report of the Expert Panel on the Technical Causes of the Failure of Feijão Dam I
Appendix I – Seismic Analysis
8
Figure 5: FJAO Seismograph Data for Event 1 on January 25, 2019

Report of the Expert Panel on the Technical Causes of the Failure of Feijão Dam I
Appendix I – Seismic Analysis
9
Figure 6: FJAO Seismograph Data for Event 2 on January 25, 2019
Neither event displays the characteristics of a natural earthquake in terms of duration, frequency
content, or other waveform properties, which is supported by reports from the University of São
Paulo.13 Furthermore, in a report issued following the failure, the University of Brasilia found no
earthquake activity occurred on January 25, 2019 within 100 kilometers (km) of Dam I.14
13 Revised Bulletin from the Station Records of Vale’s Seismographic Network, Institute of Astronomy, Geophysics
and Atmospheric Sciences, University of São Paulo (January 28, 2019) (“USP Bulletin on Vale’s Seismographic
Network”); USP Seismographic Network for the Iron Quadrangle Report. 14 Seismic Bulletin: Seismic Activity in the Brumadinho Region for the Last Six Months, Institute of
Geoscience/Seismological Observatory, University of Brasília (January 29, 2019).
Report of the Expert Panel on the Technical Causes of the Failure of Feijão Dam I
Appendix I – Seismic Analysis
10
The peak velocity for Event 1 was significantly less than the minimum safe levels of ground
vibration required to reduce the potential for threshold damage in residential structures, which
range from approximately 1.5 × 10⁻² m/s to 5 × 10⁻² m/s.15 As further set out in a report from the
University of São Paulo, the calculated response spectra for Event 1 are less than those calculated
for various events recorded at FJAO on or before January 25, 2019, including natural
earthquakes.16 Accordingly, it appears that Dam I was subjected to seismic excitation greater than
Event 1 on various occasions prior to the failure.
3.1.1 Evaluation of Potential Blasting Events
To evaluate whether Events 1 and 2 may be associated with blasting events at CFJ, the
characteristics of Events 1 and 2 were compared with data recorded at FJAO on four prior dates:
January 7, 2019, January 10, 2019, January 14, 2019, and January 22, 2019. These four dates were
selected because firing plans indicate that blasts occurred at CFJ on these days at the times shown
in Table 3. Firing plans (“planos de fogo”) are records maintained by Vale that document the time
and location of a blast, the number and configuration of holes for explosives, and the mass of
explosives used.
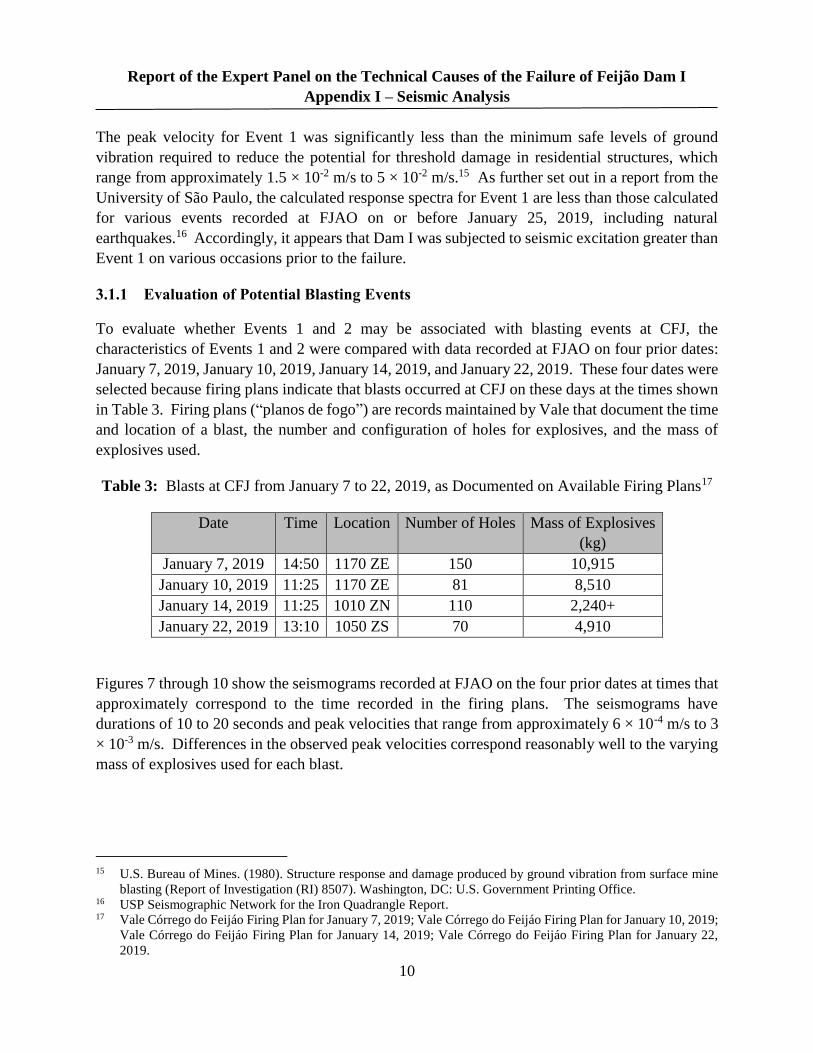
Table 3: Blasts at CFJ from January 7 to 22, 2019, as Documented on Available Firing Plans17
Date Time Location Number of Holes Mass of Explosives
(kg)
January 7, 2019 14:50 1170 ZE 150 10,915
January 10, 2019 11:25 1170 ZE 81 8,510
January 14, 2019 11:25 1010 ZN 110 2,240+
January 22, 2019 13:10 1050 ZS 70 4,910
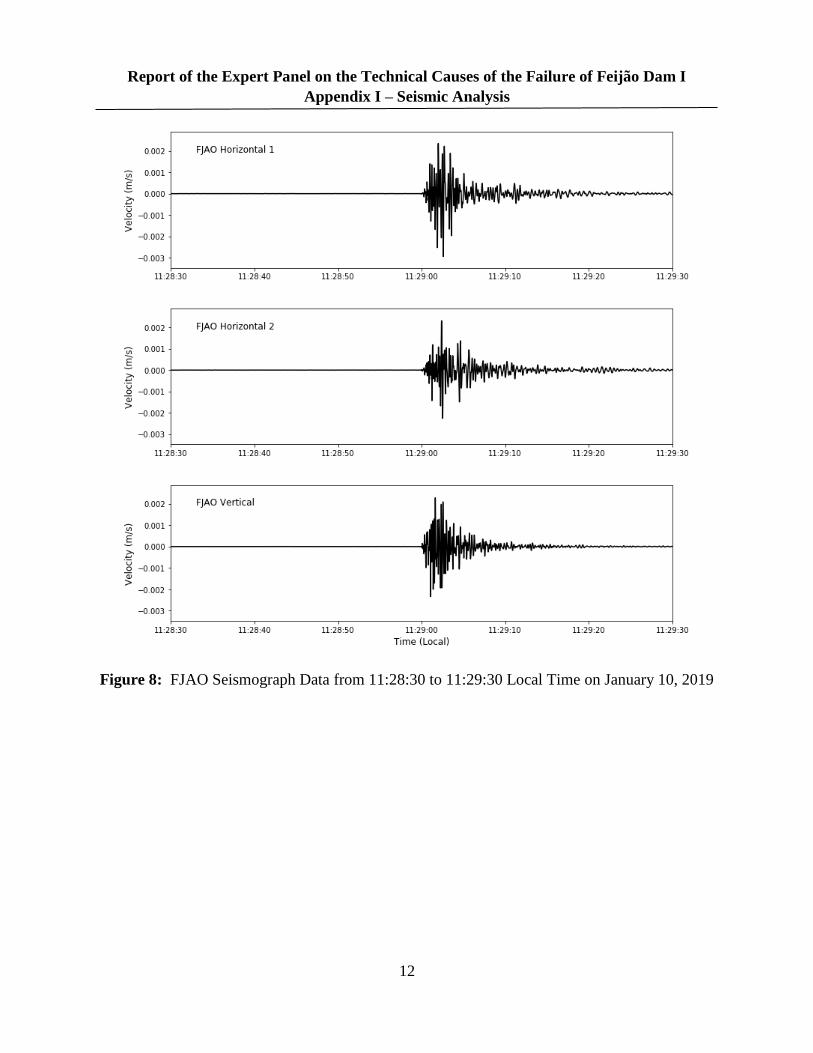
Figures 7 through 10 show the seismograms recorded at FJAO on the four prior dates at times that
approximately correspond to the time recorded in the firing plans. The seismograms have
durations of 10 to 20 seconds and peak velocities that range from approximately 6 × 10⁻⁴ m/s to 3
× 10-3 m/s. Differences in the observed peak velocities correspond reasonably well to the varying
mass of explosives used for each blast.
15 U.S. Bureau of Mines. (1980). Structure response and damage produced by ground vibration from surface mine
blasting (Report of Investigation (RI) 8507). Washington, DC: U.S. Government Printing Office. 16 USP Seismographic Network for the Iron Quadrangle Report. 17 Vale Córrego do Feijáo Firing Plan for January 7, 2019; Vale Córrego do Feijáo Firing Plan for January 10, 2019;
Vale Córrego do Feijáo Firing Plan for January 14, 2019; Vale Córrego do Feijáo Firing Plan for January 22,
2019.

Report of the Expert Panel on the Technical Causes of the Failure of Feijão Dam I
Appendix I – Seismic Analysis
11
Figure 7: FJAO Seismograph Data from 14:56 to 14:57 Local Time on January 7, 2019
Report of the Expert Panel on the Technical Causes of the Failure of Feijão Dam I
Appendix I – Seismic Analysis
12
Figure 8: FJAO Seismograph Data from 11:28:30 to 11:29:30 Local Time on January 10, 2019

Report of the Expert Panel on the Technical Causes of the Failure of Feijão Dam I
Appendix I – Seismic Analysis
13
Figure 9: FJAO Seismograph Data from 12:28 to 12:29 Local Time on January 14, 2019

Report of the Expert Panel on the Technical Causes of the Failure of Feijão Dam I
Appendix I – Seismic Analysis
14
Figure 10: FJAO Seismograph Data from 13:21 to 13:22 Local Time on January 22, 2019
A comparison of Event 1 (Figure 5) with the seismograms in Figures 7 through 10 reveals that
Event 1 had a much lower peak velocity (9 × 10⁻⁵ m/s) than the recorded blasts from the four prior
dates. Based on this comparison, it can be concluded that Event 1 was not a blast. In addition, it
appears that Dam I was subjected to various seismic events of a higher peak velocity than Event 1
in the form of the blasts, as shown above, on various occasions prior to January 25, 2019.
Qualitatively, Event 2 (Figure 6) had a very similar duration (10 to 20 seconds) and peak velocity
(3 × 10⁻³ m/s) to the blasts recorded on the four prior dates (Figures 7 through 10), and therefore,
Event 2 is likely the result of a blast. To confirm this interpretation, Event 2 was compared with
the blasts on the four prior dates quantitatively by calculating the cross-correlation function
between each pair of seismograms. Figure 11 presents a matrix of plots showing the results. Along
the diagonal of the matrix are the cross-correlation functions of each seismogram with itself; thus,
the maximum correlation is 1.0. The off-diagonal plots show cross-correlation functions between

Report of the Expert Panel on the Technical Causes of the Failure of Feijão Dam I
Appendix I – Seismic Analysis
15
different days. The well-defined peak in each of the off-diagonal plots indicates that the two
seismograms are correlated, confirming the interpretation that Event 2 is the result of a blast.
Figure 11: Cross-Correlation Functions
The firing plans for January 25, 2019, indicate that blasts occurred at 12:00 and 13:33 local time,
but no significant ground vibrations were recorded at FJAO at either time.18 As shown in Figure
6, Event 2 occurred at 12:34:17 local time.
18 Vale Córrego do Feijáo Firing Plans for January 25, 2019.

Report of the Expert Panel on the Technical Causes of the Failure of Feijão Dam I
Appendix I – Seismic Analysis
16
3.1.2 Potential Effect of Pre-Failure Blasting at CFJ
In order to consider the potential effect of the blasting occurring at CFJ mine on Dam I, peak cyclic
shear strain associated with each of the blast events recorded at FJAO on the five dates referenced
above (including Event 2 on January 25, 2019) were calculated using the following formula:
Cyclic shear strain = Resultant peak particle velocity / Shear wave velocity
For each blast event the resultant peak particle velocity was calculated by conservatively assuming
that the peak particle velocity for each individual component (H1, H2, and Z) occurred at the same
time. The shear wave velocity was conservatively assumed to be 100 m/s based on available shear
wave velocity profiles for tailings at Dam I (see Appendix E). The corresponding values of cyclic
shear strain for each of the blasting events range from approximately 1 × 10⁻³ to 5 × 10⁻³ percent.
These values are roughly an order of magnitude less than the (minimum) threshold shear strain of
3 × 10⁻² percent for soils suggested by Dobry and Abdoun (2015).19
Table 4: Peak Particle Velocity Associated with Blasting Events
3.1.3 Comparison with Data Recorded during DHP 15 Installation
On June 11, 2018, DHP 15 was installed near the toe of Dam I. Between approximately 8:20 and
12:00 local time, a borehole was advanced using a tricone bit. Beginning at 13:00 local time,
casing was installed in the borehole. Sometime between approximately 14:00 and 16:30 local
time, a discharge of water and fines was observed approximately 15 m from and 7 m higher than
19 Dobry, R., & Abdoun, T. (2015). Cyclic shear strain needed for liquefaction triggering and assessment of
overburden pressure factor K Journal of Geotechnical and Geoenvironmental Engineering, 141(11).
Peak Particle Velocity (m/s)
Date
Local
Time H1 H2 Z Resultant
Cyclic Shear
Strain (%)
7-Jan-19 14:56:26 2.73E-03 1.85E-03 2.18E-03 3.95E-03 3.95E-03
10-Jan-19 11:29:00 2.94E-03 2.31E-03 2.34E-03 4.41E-03 4.41E-03
14-Jan-19 12:28:18 6.06E-04 9.70E-04 8.65E-04 1.43E-03 1.43E-03
22-Jan-19 13:21:26 7.69E-04 7.68E-04 5.72E-04 1.23E-03 1.23E-03
25-Jan-19 12:34:17 1.69E-03 3.05E-03 1.79E-03 3.92E-03 3.92E-03

Report of the Expert Panel on the Technical Causes of the Failure of Feijão Dam I
Appendix I – Seismic Analysis
17
where DHP 15 was being installed. As soon as the discharge was noticed, drilling activities were
stopped.20 Small but rapid deformations in the dam were detected by the ground-based radar
between 13:53 and 15:16 local time as recorded by the computer to which the radar was connected,
as discussed in Appendix D.
The data recorded at FJAO on June 11, 2018 was reviewed to compare measured ground vibrations
on the day of the DHP 15 installation with those recorded on January 25, 2019. The only event
observed between 8:00 and 16:00 local time that exceeded ambient noise levels occurred at
approximately 13:46 local time. Figure 12 shows the data recorded at FJAO between 13:00 and
16:00 local time. The event that occurs at approximately 13:46 local time has a peak velocity of
approximately 7 × 10⁻⁵ m/s. Figure 13 shows an expanded view of the event that indicates the
duration was approximately 25 seconds.
The event on June 11, 2018 was compared with Event 1 on January 25, 2019 to evaluate whether
there are similarities between the seismograph records of the two events. The event on June 11,
2018 had a similar peak velocity to Event 1 on January 25, 2019. The duration was much shorter
compared to the total duration of Event 1. However, as shown in Figure 14, the duration of the
event on June 11, 2018 was similar to the duration of the initial subevent associated with Event 1.
Both events were small in velocity and significantly smaller than blasting events that occurred at
the dam on prior occasions.
20 See Appendix A for more details on the DHP 15 incident.

Report of the Expert Panel on the Technical Causes of the Failure of Feijão Dam I
Appendix I – Seismic Analysis
18
Figure 12: FJAO Seismograph Data from 13:00 to 16:00 Local Time on June 11, 2018

Report of the Expert Panel on the Technical Causes of the Failure of Feijão Dam I
Appendix I – Seismic Analysis
19
Figure 13: FJAO Seismograph Data from 13:45 to 13:47 Local Time on June 11, 2018

Report of the Expert Panel on the Technical Causes of the Failure of Feijão Dam I
Appendix I – Seismic Analysis
20
Figure 14: Comparison of Event 1 on January 25, 2019 with event on June 11, 2018
3.2 Portable Monitoring Stations
According to documentation, ground vibrations at the three portable monitoring stations did not
exceed their trigger level of 5 × 10⁻⁴ m/s on January 25, 2019, and thus, no data was recorded.21
The observation that ground vibrations did not exceed 5 × 10⁻⁴ m/s is consistent with the review
of the data:
• PV7 is located in Comunidade de Feijão at a distance of 3,368 m from CFJ. Peak velocity
has been shown to be proportional to 𝐷−1.54 where 𝐷 is distance from a blast.22 Thus, the
estimated peak velocity at PV7 due to Event 2 is approximately 3 × 10⁻⁴ m/s, which is less
than the trigger level of the instrument.
• PV16 is at the crest of Dam VI at CFJ, 1,482 m from the center of the excavation. Although
the estimated peak velocity at this distance exceeds the trigger level of the instrument, the
instrument is located on the crest of Dam VI, which may have reduced the peak velocity.
• PV17 was at the crest of Dam I and likely was destroyed during the failure.
21 Vale Seismographic Monitoring Report. 22 Dowding, C.H. (1985). Blast vibration monitoring and control. Englewood Cliffs, NJ: Prentice-Hall.
Report of the Expert Panel on the Technical Causes of the Failure of Feijão Dam I
Appendix I – Seismic Analysis
21
4. CONCLUSIONS
The following conclusions were reached based on the review, analysis, and interpretation of the
seismograph data for the permanent FJAO station on January 25, 2019, and for four prior dates,
and documentation on three portable monitoring stations at or near CFJ:
• The ground vibrations recorded at FJAO on January 25, 2019 do not have the
characteristics of a natural earthquake, which is confirmed by evaluations by the University
of São Paulo and University of Brasilia.
• Low-velocity ground vibrations (Event 1) were observed at FJAO approximately 28
seconds before the failure of Dam I was observed. Event 1 does not present the
characteristics of a blast based on comparisons with known blasting events on four prior
dates in January 2019. The peak velocity of Event 1 (9 × 10⁻⁵ m/s) was very small. For
comparison, safe levels of ground vibration for residential structures generally ranged from
approximately 1.5 × 10⁻² m/s to 5 × 10⁻² m/s.
• Event 2 on January 25, 2019 is consistent with a blast based on a comparison with the
known blasting events on four prior dates. Event 2 occurred approximately six minutes
after the initiation of the failure was observed and had a peak velocity of 3 × 10⁻³ m/s.
• Peak cyclic shear strain range associated with blasting events at the CFJ mining pit range
from approximately 1 × 10⁻³ to 5 × 10⁻³ percent, which are roughly an order of magnitude
less than the (minimum) threshold shear strain of 3 × 10⁻² percent.
• An event was observed on June 11, 2018 during the drilling incident at DHP 15 that had a
similar velocity to the peak velocity of Event 1 on January 25, 2019. The June 11 event
also had a similar duration to the initial subevent taking place within Event 1.


![ldlt M @)&^.)%.)$ OlGhlgol/Ë cWoog ;+:yfg cGtu {t k 'Nrf ... · sf]6fdf cfj ]bg lbg rfxg ] cfj ]bsx?n ] cfj ]bg ubf { sf ]6f tk {m af6 }Online Form clgjfo{ eg {' kg ]{5 . sf]6fsf](https://static.fdocuments.us/doc/165x107/5e2223fca2068b47540e4759/ldlt-m-olghlgol-cwoog-yfg-cgtu-t-k-nrf-sf6fdf-cfj-bg.jpg)
