APPENDIX G AIR QUALITY ANALYSISG-2 P:\SWB1001A\Appendices\Appendix Slipsheets\Appendix G...
158
LSA ASSOCIATES, INC. ADMINISTRATIVE DRAFT PROGRAM EIR JUNE 2011 SHIPYARD SEDIMENT REMEDIATION PROJECT SAN DIEGO BAY P:\SWB1001A\Appendices\Appendix Slipsheets\Appendix G slipsheet.doc G-1 APPENDIX G AIR QUALITY ANALYSIS
Transcript of APPENDIX G AIR QUALITY ANALYSISG-2 P:\SWB1001A\Appendices\Appendix Slipsheets\Appendix G...

L S A A S S O C I A T E S , I N C . A D M I N I S T R A T I V E D R A F T P R O G R A M E I R J U N E 2 0 1 1 S H I P Y A R D S E D I M E N T R E M E D I A T I O N P R O J E C T S A N D I E G O B A Y
P:\SWB1001A\Appendices\Appendix Slipsheets\Appendix G slipsheet.doc G-1
APPENDIX G
AIR QUALITY ANALYSIS

A D M I N I S T R A T I V E D R A F T P R O G R A M E I R L S A A S S O C I A T E S , I N C . S H I P Y A R D S E D I M E N T R E M E D I A T I O N P R O J E C T J U N E 2 0 1 1 S A N D I E G O B A Y
P:\SWB1001A\Appendices\Appendix Slipsheets\Appendix G slipsheet.doc G-2
Page Intentionally Left Blank

A I R Q U A L I T Y A N A L Y S I S
SHIPYARD SEDIMENT REMEDIATION PROJECT
CALIFORNIA REGIONAL WATER QUALITY CONTROL BOARD
SAN DIEGO REGION
May 2011
A I R Q U A L I T Y A N A L Y S I S
SHIPYARD SEDIMENT REMEDIATION PROJECT
CALIFORNIA REGIONAL WATER QUALITY CONTROL BOARD
SAN DIEGO REGION
Prepared for:
Craig L. Carlisle, PG, CEG San Diego Water Board
9174 Sky Park Court, Suite 100 San Diego, California 92123-4353
Prepared by:
LSA Associates, Inc. 20 Executive Park, Suite 200
Irvine, California 92614 (949) 553-0666
LSA Project No. SWB1001A
May 2011

L S A A S S O C I A T E S , I N C . A I R Q U A L I T Y A N A L Y S I S M A Y 2 0 1 1 S H I P Y A R D S E D I M E N T R E M E D I A T I O N P R O J E C T S A N D I E G O R E G I O N A L W A T E R Q U A L I T Y C O N T R O L B O A R D
R:\SWB1001A\Air\AQ and GHG-Rev.doc (6/2/2011) i
TABLE OF CONTENTS
1.0 EXECUTIVE SUMMARY ............................................................................................................. 1 2.0 PROJECT DESCRIPTION.............................................................................................................. 2
2.1 INTRODUCTION..................................................................................................................... 2 2.2 PROJECT LOCATION............................................................................................................. 2 2.3 PROJECT SETTING AND SITE DESCRIPTION................................................................... 4 2.4 PROJECT BACKGROUND................................................................................................... 11 2.5 PROJECT GOALS AND OBJECTIVES................................................................................ 12 2.6 PROJECT CHARACTERISTICS........................................................................................... 13
2.6.1 Dredging and Capping Operations ............................................................................. 14 2.6.2 Onshore Dewatering and Treatment........................................................................... 15 2.6.3 Transportation and Disposal....................................................................................... 15
3.0 SETTING....................................................................................................................................... 18 3.1 REGIONAL AIR QUALITY.................................................................................................. 18
3.1.1 Climate/Meteorology.................................................................................................. 21 3.1.2 Description of Global Climate Change and Its Sources ............................................. 22 3.1.3 Air Pollution Constituents and Attainment Status...................................................... 28
3.2 LOCAL AIR QUALITY ......................................................................................................... 30 3.3 REGULATORY SETTINGS .................................................................................................. 32
3.3.1 Federal Regulations/Standards ................................................................................... 32 3.3.2 State Regulations/Standards ....................................................................................... 33 3.3.3 Regional Air Quality Planning Framework................................................................ 37 3.3.4 Regional Air Quality Management Plan .................................................................... 37
4.0 METHODOLOGY ........................................................................................................................ 38 4.1 THRESHOLDS OF SIGNIFICANCE .................................................................................... 38
4.1.1 Criteria Pollutants with Regional Effects ................................................................... 38 4.1.2 Local Microscale Concentrations Standards .............................................................. 39 4.1.3 Health Risk Assessment Thresholds .......................................................................... 39
4.2 GREENHOUSE GAS EMISSIONS/GLOBAL CLIMATE CHANGE.................................. 40 5.0 IMPACTS AND MITIGATION.................................................................................................... 44
5.1 CONSTRUCTION IMPACTS................................................................................................ 44 5.1.1 Equipment Exhaust and Related Construction Activities .......................................... 44 5.1.2 Fugitive Dust .............................................................................................................. 45 5.1.3 Odors .......................................................................................................................... 45
5.2 LONG-TERM PROJECT-RELATED EMISSIONS IMPACTS............................................ 46 5.2.1 CO Hot-Spot Analysis................................................................................................ 46
L S A A S S O C I A T E S , I N C . A I R Q U A L I T Y A N A L Y S I S M A Y 2 0 1 1 S H I P Y A R D S E D I M E N T R E M E D I A T I O N P R O J E C T S A N D I E G O R E G I O N A L W A T E R Q U A L I T Y C O N T R O L B O A R D
R:\SWB1001A\Air\AQ and GHG-Rev.doc (6/2/2011) ii
5.3 HEALTH RISK ASSESSMENT ............................................................................................ 46 5.3.1 Carcinogenic and Chronic Project-Related Emission Impacts................................... 48 5.3.2 Acute Emission Impacts ............................................................................................. 49 5.3.3 Conclusion.................................................................................................................. 49
5.4 GLOBAL CLIMATE CHANGE/GREENHOUSE GAS EMISSIONS.................................. 50 5.4.1 Global Climate Change/Greenhouse Gas Emissions – Construction GHG Emissions52 5.4.2 Global Climate Change/GHG Impact Analysis.......................................................... 52
5.5 AIR QUALITY MANAGEMENT PLAN CONSISTENCY.................................................. 53 5.6 MITIGATION MEASURES................................................................................................... 53
5.6.1 Construction Impacts.................................................................................................. 53 5.6.2 Project Operations ...................................................................................................... 55
5.7 CUMULATIVE IMPACTS .................................................................................................... 55 6.0 REFERENCES .............................................................................................................................. 56 FIGURES
Figure 1: Project Location Map.............................................................................................................. 3 Figure 2: Potential Sediment Staging Locations Index .......................................................................... 5 Figure 3: Potential Sediment Staging Area 1 ......................................................................................... 6 Figure 4: Potential Sediment Staging Area 2 ......................................................................................... 7 Figure 5: Potential Sediment Staging Area 3 ......................................................................................... 8 Figure 6: Potential Sediment Staging Area 4 ......................................................................................... 9 Figure 7: Potential Sediment Staging Area 5 ....................................................................................... 10 Figure 8: Potential Truck Haul Routes................................................................................................. 16 TABLES
Table A: Ambient Air Quality Standards ............................................................................................. 19 Table B: Summary of Health Effects of the Major Criteria Air Pollutants .......................................... 21 Table C: Global Warming Potential of Greenhouse Gases .................................................................. 24 Table D: Attainment Status of Criteria Pollutants in the San Diego Air Basin.................................... 28 Table E: Ambient Air Quality Monitored in San Diego ...................................................................... 31 Table F: Construction Emissions by Task (lb/day) .............................................................................. 44 Table G: Peak Daily Construction Emissions (lbs/day) ....................................................................... 45 Table H: Health Risk Levels from Project Haul Traffic Using 28th Street and Boston Avenue to
Access I-5 .................................................................................................................................... 49 Table I: Health Risk Levels from Project Haul Traffic Using Harbor Drive and Civic Center Drive
to Access I-5 ................................................................................................................................ 49 Table J: Health Risk Levels from Project Haul Traffic Using 32nd Street and Bay Marina Drive to
Access I-5 .................................................................................................................................... 49

L S A A S S O C I A T E S , I N C . A I R Q U A L I T Y A N A L Y S I S M A Y 2 0 1 1 S H I P Y A R D S E D I M E N T R E M E D I A T I O N P R O J E C T S A N D I E G O R E G I O N A L W A T E R Q U A L I T Y C O N T R O L B O A R D
R:\SWB1001A\Air\AQ and GHG-Rev.doc (6/2/2011) iii
APPENDICES
A: CONSTRUCTION EMISSION CALCULATIONS B: HEALTH RISK ASSESSMENT

L S A A S S O C I A T E S , I N C . A I R Q U A L I T Y A N A L Y S I S M A Y 2 0 1 1 S H I P Y A R D S E D I M E N T R E M E D I A T I O N P R O J E C T S A N D I E G O R E G I O N A L W A T E R Q U A L I T Y C O N T R O L B O A R D
R:\SWB1001A\Air\AQ and GHG-Rev.doc (6/2/2011) 1
1.0 EXECUTIVE SUMMARY
LSA Associates, Inc. (LSA) was retained to prepare an air quality study for the proposed dredging of sediments adjacent to shipyards in the San Diego Bay, and the upland treatment of dredged sediments located at potential sites in the Cities of San Diego and National City, California. The air quality study provides a discussion of the proposed project, the physical setting of the project area, and the regulatory framework for air quality. The report provides data on existing air quality, evaluates potential air quality impacts associated with the proposed project, and identifies mitigation measures recommended for potentially significant impacts. Emissions generated during construction of the Shipyard Sediment Remediation Project. (proposed project) would exceed the City of San Diego’s oxides of nitrogen (NOX) threshold. Compliance with the San Diego Air Pollution Control District’s (SDAPCD) Rules and Regulations during construction will reduce construction-related air quality impacts from fugitive dust emissions and construction equipment emissions. However, these emissions would remain significant and unavoidable. The proposed project would not result in any long-term on-site stationary sources and would have a minimal change in the off-site vehicle trips. The project’s long-term air quality impacts would be less than significant because there would be no increase in stationary or mobile source emissions. Because the proposed project would have little to no change in off-site vehicle trips, no significant CO contributions would occur in the project vicinity. A health risk assessment shows that no existing resident will be exposed to a significant health risk from diesel haul truck emissions. The potential of the project to affect global climate change is also discussed. Short-term construction and long-term operational emissions of the principal greenhouse gases (GHGs), including carbon dioxide (CO2) and methane (CH4), are quantified, and significance relative to Assembly Bill (AB) 32 is discussed. The evaluation was prepared in conformance with appropriate standards. Air quality data posted on the California Air Resources Board (ARB) and United States Environmental Protection Agency (EPA) websites are included to document the local air quality environment.

L S A A S S O C I A T E S , I N C . A I R Q U A L I T Y A N A L Y S I S M A Y 2 0 1 1 S H I P Y A R D S E D I M E N T R E M E D I A T I O N P R O J E C T S A N D I E G O R E G I O N A L W A T E R Q U A L I T Y C O N T R O L B O A R D
R:\SWB1001A\Air\AQ and GHG-Rev.doc (6/2/2011) 2
2.0 PROJECT DESCRIPTION
2.1 INTRODUCTION
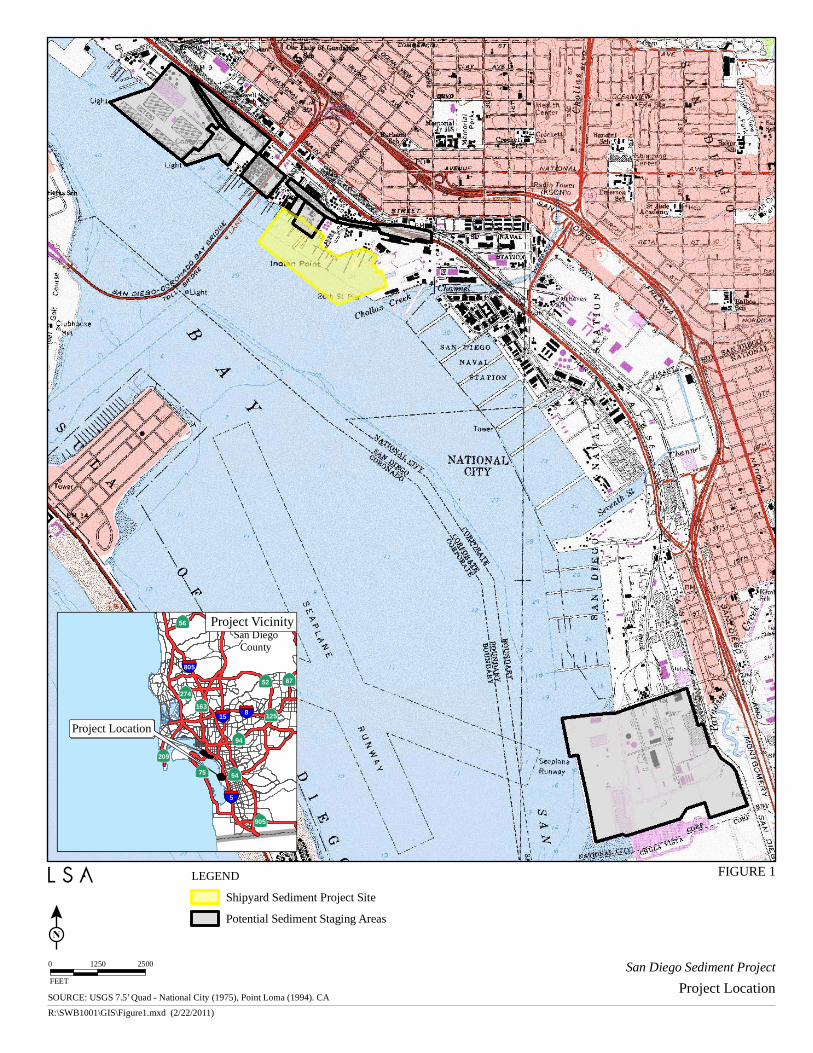
The proposed project is the dredging of sediment adjacent to the shipyards in the San Diego Bay, the dewatering, solidification and possible solidification of the dredged material on-shore, potential treatment of decanted water, and the transport of the removed material to an appropriate landfill for disposal. The purpose of the project is to implement a Tentative Cleanup and Abatement Order issued by the California Regional Water Quality Control Board, San Diego Region (hereinafter the San Diego Water Board). The San Diego Water Board is the Lead Agency under California Environmental Quality Act (CEQA) for the proposed project. The dredging will occur in an area of the Bay defined in the CAO. The San Diego Water Board is considering the use of one or more staging sites for the dewatering and treatment of the dredge, as further described below. The sediment removal footprint and the optional staging sites comprise the project site for the purpose of this study. 2.2 PROJECT LOCATION
The sediment removal site (Shipyard Sediment Site) is located along the eastern shore of central San Diego Bay, extending approximately from the Sampson Street Extension on the northwest to Chollas Creek on the southeast, and from the shoreline out to the San Diego Bay main shipping channel to the west, as shown in Figure 1. The project consists of marine sediments in the bottom bay waters that contain elevated levels of pollutants greater than San Diego Bay background conditions. This area is hereinafter collectively referred to as the “Shipyard Sediment Site.” The Shipyard Sediment Site is more specifically bounded by the waters of R.E. Staite facility on the north, the 28th Street Pier on the south, the open waters and shipways of San Diego Bay on the west, and the shorelines of two shipyard facilities on the east (the BAE Systems San Diego Ship Repair Facility [BAE Systems] and the National Steel and Shipbuilding Company Shipyard Facility [NASSCO]). The Shipyard Sediment Site encompasses 63 water acres (46 within the NASSCO leasehold and 17 within the BAE leasehold1) of the NASSCO and BAE Systems leaseholds. The removal of the marine sediments will require upland areas for dewatering, solidification and stockpiling of the materials, and potential treatment of decant waters prior to off-site disposal. Therefore, in addition to the open waters of the Shipyard Sediment Site, five upland areas have been identified by the San Diego Water Board as potential sediment staging areas. 1 Per the Exponent 2003 SI Report and the 2010 Tentative CAO.
SOURCE: USGS 7.5’ Quad - National City (1975), Point Loma (1994). CA
FIGURE 1
San Diego Sediment ProjectProject Location
0 1250 2500
FEET
LEGEND
Shipyard Sediment Project Site
Potential Sediment Staging Areas
R:\SWB1001\GIS\Figure1.mxd (2/22/2011)
Project LocationProject Location
San DiegoCounty
125
75
56
94
52 67
274
54
209
163
905
15 8
805
5
Project Vicinity

L S A A S S O C I A T E S , I N C . A I R Q U A L I T Y A N A L Y S I S M A Y 2 0 1 1 S H I P Y A R D S E D I M E N T R E M E D I A T I O N P R O J E C T S A N D I E G O R E G I O N A L W A T E R Q U A L I T Y C O N T R O L B O A R D
R:\SWB1001A\Air\AQ and GHG-Rev.doc (6/2/2011) 4
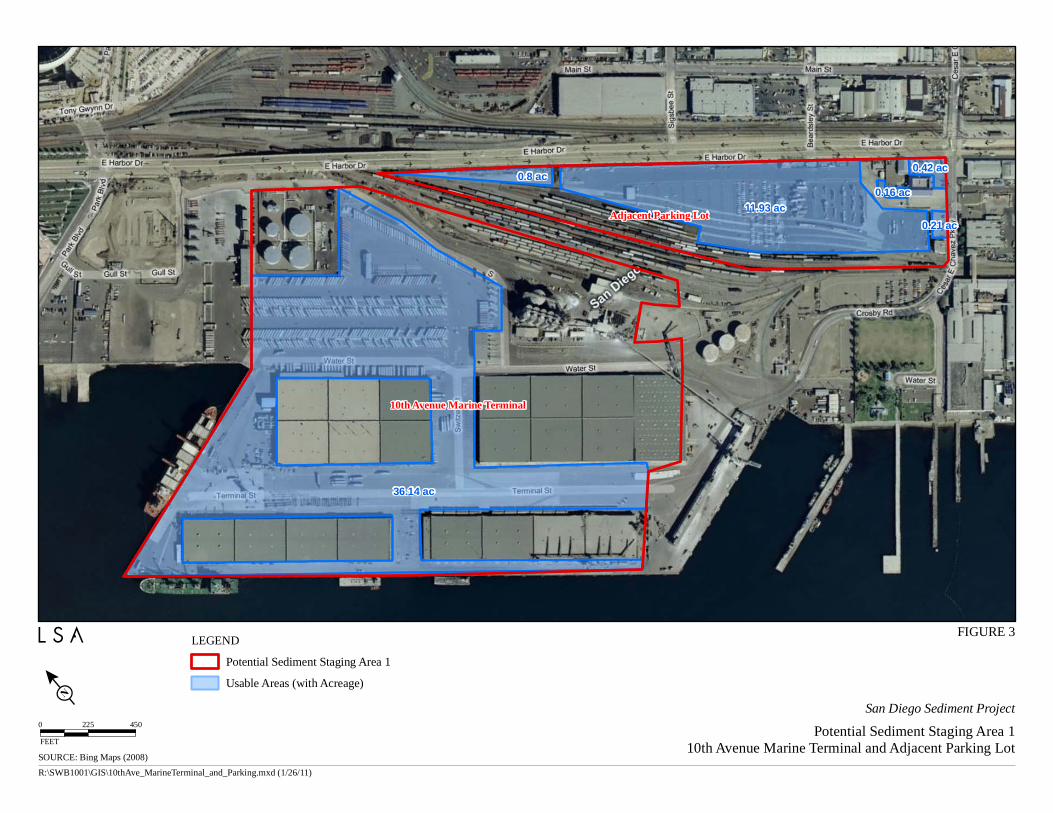
Each of the potential staging areas has more defined usable areas, which are illustrated in Figures 2 through 7 and further described below. • Staging Area 1: 10th Avenue Marine Terminal and Adjacent Parking (approximately
49.66 potentially usable acres).
• Staging Area 2: Commercial Berthing Pier and Parking Lots Adjacent to Coronado Bridge (approximately 11.66 potentially usable acres).
• Staging Area 3: SDG&E/BAE/BAE and NASSCO Parking Lot (approximately 7.27 potentially usable acres).
• Staging Area 4: NASSCO/NASSCO Parking and Parking Lot North of Harbor Drive (approximately 3.85 potentially usable acres).
• Staging Area 5: 24th Street Marine Terminal and Adjacent Parking Lots (approximately 145.31 potentially usable acres).
2.3 PROJECT SETTING AND SITE DESCRIPTION
The project site is under the planning jurisdiction of the San Diego Unified Port District (Port District) and is identified as District 4 in the certified Port Master Plan. The Port District is a special government entity, created in 1962 by the San Diego Unified Port District Act, California Harbors and Navigation Code, in order to manage San Diego Harbor and administer certain public lands along San Diego Bay. The Port District holds and manages as trust property on behalf of the People of the State of California, including the land occupied by NASSCO and BAE. The Port Master Plan water use designation within the limits of the proposed project is Industrial–Specialized Berthing. San Diego Bay is designated as a State Estuary under Section 1, Division 18 (commencing with Section 28000) of the Public Resources Code. The San Diego Bay shoreline between Sampson and 28th Streets is listed in the Federal Clean Water Act Section 303(d) List of Water Quality Limited Segments for elevated levels of copper, mercury, zinc, polynuclear aromatic hydrocarbons (PAHs), and polychlorinated biphenyls (PCBs) in the marine sediment. These pollutants impair the aquatic life, aquatic-dependent wildlife, and human health beneficial uses designated for San Diego Bay. The northeast boundary of the Shipyard Sediment Site occupies this shoreline. The principal structural components within the Shipyard Sediment Site include the concrete bulkheads, piers, and dry dock facilities associated with the two shipyard facilities. Bathymetry at the site varies substantially due to the presence of shipways, dry docks, and berths and ranges from -2 Mean Lower Low Water (MLLW) along the bulkheads to -70 feet MLLW at the BAE dry dock sump area.

5
12
1
2 3
4
3
3
3
SOURCE: Bing Maps (2008)
R:\SWB1001\GIS\Index_Map.mxd (2/23/2011)
FIGURE 2
San Diego Sediment ProjectPotential Sediment Staging Locations Index
0 1250 2500
FEET
LEGEND
Potential Sediment Staging Areas
36.14 ac
11.93 ac
0.8 ac0.42 ac
0.21 ac
0.16 ac
10th Avenue Marine Terminal
Adjacent Parking Lot
LEGEND
Potential Sediment Staging Area 1
Usable Areas (with Acreage)
SOURCE: Bing Maps (2008)
R:\SWB1001\GIS\10thAve_MarineTerminal_and_Parking.mxd (1/26/11)
FIGURE 3
San Diego Sediment Project
Potential Sediment Staging Area 110th Avenue Marine Terminal and Adjacent Parking Lot
0 225 450
FEET

2.77 ac
2.68 ac
2.59 ac
2.26 ac
0.79 ac
0.57 ac
Commercial Berthing Pier Area
Parking Lots Adjacent to Coronado Bridge
LEGEND
Potential Sediment Staging Area 2
Usable Areas (with Acreage)
SOURCE: Bing Maps (2008)
FIGURE 4
San Diego Sediment Project
Potential Sediment Staging Area 2Commercial Berthing Pier Area and Parking Lots Adjacent to Coronado Bridge
0 150 300
FEET
R:\SWB1001\GIS\CommercialBerthingArea_and_Parking.mxd (1/26/11)

0.9 ac
0.97 ac
0.95 ac
0.87 ac
0.37 ac
0.79 ac
0.72 ac
0.68 ac
0.54 ac
0.48 ac
BAE Leasehold
SDGE/BAE Leasehold Parking
SDGE Leasehold
SOURCE: Bing Maps (2008)
R:\SWB1001\GIS\SDGE_and_BAE_Leaseholds_and_Parking.mxd (1/26/11)
FIGURE 5
San Diego Sediment Project
Potential Sediment Staging Area 3SDG&E Leasehold/BAE Leasehold/BAE and NASSCO Parking
0 150 300
FEET
LEGEND
Potential Sediment Staging Area 3
Usable Areas (with Acreage)

1.35 ac
1.14 ac
0.95 ac
0.41 ac
NASSCO Parking and Parking Area North of Harbor Drive
SOURCE: Bing Maps (2008)
R:\SWB1001\GIS\NASSCO_and_Area_North_Harbor_Drive_Parking.mxd (1/26/11)
FIGURE 6
San Diego Sediment Project
Potential Sediment Staging Area 4NASSCO Parking and Parking Area North of Harbor Drive
0 100 200
FEET
LEGEND
Potential Sediment Staging Area 4
Usable Areas (with Acreage)

74.14 ac 31.99 ac
11 ac13.14 ac
3.69 ac 11.35 ac
24th Street Marine Terminal and Adjacent Parking Areas
SOURCE: Bing Maps (2008)
R:\SWB1001\GIS\24thSt_MarineTerminal.mxd (2/23/2011)
FIGURE 7
San Diego Sediment Project
Potential Sediment Staging Area 524th Street Marine Terminal and Adjacent Parking Areas
0 400 800
FEET
LEGEND
Potential Sediment Staging Area 5
Usable Areas (with Acreage)

L S A A S S O C I A T E S , I N C . A I R Q U A L I T Y A N A L Y S I S M A Y 2 0 1 1 S H I P Y A R D S E D I M E N T R E M E D I A T I O N P R O J E C T S A N D I E G O R E G I O N A L W A T E R Q U A L I T Y C O N T R O L B O A R D
R:\SWB1001A\Air\AQ and GHG-Rev.doc (6/2/2011) 11
The marine habitat within the Shipyard Sediment Site consists of 63 open water acres (46 within the NASSCO leasehold and 17 within the BAE leasehold) containing both vegetated and unvegetated subtidal soft bottom habitats, pier pilings, and bulkhead walls. The vegetated habitat species include sparse beds of eelgrass (Zostera marina). The entire extent of the Shipyard Sediment Site shoreline is artificially stabilized, generally consisting of a vertical sheet pile bulkhead and a seawall. The marine habitat types include vertical bulkhead walls and dock structures, vegetated and non-vegetated soft bottom subtidal habitats, and open water. These habitats support marine plants, invertebrates, and fishes. The five potential Staging Areas consist primarily of leasehold lands and associated parking areas in the immediate vicinity of the Shipyard Sediment Site. The actual usable areas within each potential Staging Area comprise open, paved portions that could be used for the dewatering, solidifying, and drying of the dredged marine sediments. Staging Areas 1 through 4 are located within the City of San Diego and are designated in the City’s General Plan as Mixed Use and Industrial Employment. Staging Area 5 is located approximately 3.5 miles from the shipyards and within the City of National City. It is currently designated in the City’s General Plan as Industrial–Tidelands Manufacturing, and is under the jurisdiction of the Port District. National City is currently updating its General Plan; the proposed land use designation for Staging Area 5 in the updated General Plan is “San Diego Unified Port District,” indicating that land uses are governed by the San Diego Port Master Plan. The currently adopted (1996) combined General Plan/zoning map identifies an overlay zone in Staging Area 5 as subject to the “Unified Port District” overlay zone, also indicating that land uses are governed by the San Diego Port Master Plan. 2.4 PROJECT BACKGROUND
The California Regional Water Quality Control Board (RWQCB), San Diego Region, hereinafter referred to as the San Diego Water Board, alleges that several agencies and/or parties caused or permitted the discharge of waste to the Shipyard Sediment Site resulting in the accumulation of waste in the marine sediment. The contaminated marine sediment has caused conditions of contamination or nuisance in San Diego Bay that adversely affect aquatic life, aquatic-dependent wildlife, human health, and San Diego Bay beneficial uses. The San Diego Water Board determined that issuance of a Cleanup and Abatement Order (CAO) was the appropriate regulatory tool to use for correcting the impairment at the Shipyard Sediment Site. CAOs are issued under the authority of the California Water Code (Section 13304). As defined in the State Water Board’s Water Quality Enforcement Policy (adopted November 17, 2009), “CAOs may be issued to any person who has discharged or discharges waste into State waters in violation of any waste discharge requirement or other order or prohibition issued by a Regional Water Board or the State Water Board, or who has caused or permitted, causes or permits, or threatens to cause or permit any waste to be discharged or deposited

L S A A S S O C I A T E S , I N C . A I R Q U A L I T Y A N A L Y S I S M A Y 2 0 1 1 S H I P Y A R D S E D I M E N T R E M E D I A T I O N P R O J E C T S A N D I E G O R E G I O N A L W A T E R Q U A L I T Y C O N T R O L B O A R D
R:\SWB1001A\Air\AQ and GHG-Rev.doc (6/2/2011) 12
where it is, or probably will be, discharged into the waters of the State and creates, or threatens to create, a condition of pollution or nuisance (discharger). The CAO requires the discharger to clean up the waste or abate the effects of the waste, or both, or, in the case of threatened pollution or nuisance, take other necessary remedial action, including, but not limited to, overseeing cleanup and abatement efforts.” A CAO requires dischargers to clean up the pollution to background levels or the best water quality that is reasonable. At a minimum, cleanup levels must fully support beneficial uses, unless the Regional Water Board allows a containment zone. The CAO determined that cleaning up to a background sediment quality level at the Shipyard Sediment Site is economically infeasible. Therefore, the CAO established alternative cleanup levels for the project that are the lowest technologically and economically achievable levels, as required under the California Code of Regulations Title 23 section 2550.4(e). These alternative levels are described below in the Project Characteristics section. This Program EIR addresses the cleanup project as identified in the Tentative Cleanup and Abatement Order No. R9-2011-0001, dated September 15, 2010. 2.5 PROJECT GOALS AND OBJECTIVES
The primary goal of the project is to improve water quality in San Diego Bay, consistent with the provisions of the Tentative CAO. The specific project objectives are:
• Protect the quality of the waters of San Diego Bay for use and enjoyment by the people of the state by executing a shipyard sediment clean-up project consistent with the provisions of Tentative CAO No. R9-2011-0001.
• Attain cleanup levels as included in the Tentative CAO No. R9-2011-0001 (judged to be technologically and economically feasible as defined in Section 2550.4 of Title 23 of the CCR, pursuant to Resolution No. 92-49).
• Remediate areas identified in Attachment 2 of Tentative CAO No. R9-2011-0001.
• Minimize adverse effects to aquatic life beneficial uses, including Estuarine Habitat (EST), Marine Habitat (MAR), and Migration of Aquatic Organisms (MIGR).
• Minimize adverse effects to aquatic-dependent wildlife beneficial uses, including Wildlife Habitat (WILD), Preservation of Biological Habitats of Special Significance (BIOL), and Rare, Threatened, or Endangered Species (RARE).
• Minimize adverse effects to human health beneficial uses, including Contact Water Recreation (REC-1), Non-contact Water Recreation (REC-2), Shellfish Harvesting (SHELL), and Commercial and Sport Fishing (COMM).
• Implement a clean-up plan that will have long-term effectiveness.

L S A A S S O C I A T E S , I N C . A I R Q U A L I T Y A N A L Y S I S M A Y 2 0 1 1 S H I P Y A R D S E D I M E N T R E M E D I A T I O N P R O J E C T S A N D I E G O R E G I O N A L W A T E R Q U A L I T Y C O N T R O L B O A R D
R:\SWB1001A\Air\AQ and GHG-Rev.doc (6/2/2011) 13
• Minimize adverse effects to the natural and built environment.
• Avoid or minimize adverse impacts to residential areas.
• Result in no long-term loss of use of shipyard and other San Diego Bay-dependent facilities.
• Minimize short-term loss of use of shipyard and other San Diego Bay-dependent facilities.
2.6 PROJECT CHARACTERISTICS
The project addressed in this Program EIR is the implementation of Tentative CAO No. R9-2011-000, which requires that remedial actions be implemented within the Shipyard Sediment Site. Remedial actions may include dredging, capping, and/or natural recovery depending upon a number of factors, including levels of contamination in the sediment and site accessibility. The CAO determined that dredging and disposal of sediments is the proposed remedy for approximately 15.2 acres of the site and is expected to generate approximately 143,400 cubic yards of contaminated marine sediment. The CAO also indicated that if cleanup criteria for chemical constituents of concern in the sediments cannot be attained by dredging (for example, contaminants extend more deeply than anticipated or there is an obstacle due to a hard substrate) some dredge areas may be capped in-place with sand. In addition to the 15.2 acres targeted for dredging, approximately 2.3 acres of the project site are inaccessible or under-pier areas that will be remediated by one or more methods other than dredging, most likely by sand capping. There are two scheduling options for completion of the remedial action. The first scheduling option is expected to take 2 to 2.5 years to complete. Under this option, the dredging operations would occur for 7 months of the year and would cease from April through August during the endangered California least tern breeding season. The second option is to implement the remedial plan with continuous dredging operations, which would be expected to take approximately 12.5 months to complete. This scenario assumes that the dewatering, solidification, and stockpiling of the materials would occur simultaneously and continuously with the dredging. Also assumed under this compressed schedule option is that dredging operations could proceed year-round, including during the breeding season of the endangered California least tern. Both scheduling options would be followed by a period of post-remedial monitoring. The preferred schedule will be determined during the final design phase. However, both schedule options are included in the analysis for the technical studies and Program EIR. The project includes the dredging and/or capping of the contaminated soils; vessel transport to shore; dewatering, stockpiling and testing of dredged materials at a landside staging

L S A A S S O C I A T E S , I N C . A I R Q U A L I T Y A N A L Y S I S M A Y 2 0 1 1 S H I P Y A R D S E D I M E N T R E M E D I A T I O N P R O J E C T S A N D I E G O R E G I O N A L W A T E R Q U A L I T Y C O N T R O L B O A R D
R:\SWB1001A\Air\AQ and GHG-Rev.doc (6/2/2011) 14
location; and truck transport of dredge materials to the appropriate landfill disposal facility. Each of these components is further described below. 2.6.1 Dredging and Capping Operations
The project involves environmental dredging which, unlike navigational or construction dredging, is performed specifically for the removal of contaminated sediment while minimizing the spread of contaminants to the surrounding environment during dredging operations. The proposed project includes the dredging and removal of approximately 143,400 cubic yards of contaminated sediment from the Shipyards Sediment Site. The cubic yard amount was identified in the CAO and includes a one-foot over-dredge assumption. Silt curtains and/or air curtains will be placed around the dredge area, including the dredge barges. The silt curtain will consist of a geotextiles fabric curtain with a floatation boom at the upper hem and ballast weights at the lower hem. The silt curtain will act as a physical barrier that will limit access to the portions of the site where the dredging operations are occurring. The silt curtain will also contain any re-suspended particles from migrating outside of the active dredging area. Air curtains have been used successfully during the removal operations on the St. Lawrence River in Massena, NY, and the KK River in Milwaukee, WS. These air curtains were used in conjunction with silt curtains to contain re-suspended sediment but specifically to enhance worker safety and allow barges to transit into and out of the work area without the need to open and close silt curtain gates. It is anticipated that the dredging would utilize a derrick barge equipped with a closed environmental bucket such as the Cable Arm® Environmental Clamshell in order to maintain water quality. The dredge material will be placed on material barges and transported with the help of tug boats to a landside staging area. All barges will be outfitted with a water recovery system to collect the water deposited on the barges during dredging operations; the objective is to ensure that no water collected during the operations reenters the Bay.
Due to the presence of infrastructure, such as piers and pilings, dredging is constrained in several locations within the project site. Therefore, contaminated areas under piers and pilings will be remedied through subaqueous, or in-situ, capping. In-situ capping is the placement of clean material on top of the contaminated sediment. The capping material is typically clean sand, silty to gravelly sand, and/or armoring material. Effective capping requires sufficient cap thickness, careful cap placement to avoid disturbance, and maintenance to ensure cap integrity from future disturbances. Sand capping would involve the transport of capping material to the site (possibly via truck or barge) and placement of the materials over contaminated sediment. The capping operations will require a materials barge outfitted with a stone slinger truck, hoppers, and conveyors to move and place the capping materials over the contaminated marine sediments.

L S A A S S O C I A T E S , I N C . A I R Q U A L I T Y A N A L Y S I S M A Y 2 0 1 1 S H I P Y A R D S E D I M E N T R E M E D I A T I O N P R O J E C T S A N D I E G O R E G I O N A L W A T E R Q U A L I T Y C O N T R O L B O A R D
R:\SWB1001A\Air\AQ and GHG-Rev.doc (6/2/2011) 15
2.6.2 Onshore Dewatering and Treatment
The proposed project requires a landside sediment management site with sufficient space and access to stockpile, dewater, and transport the removed dredge material. Although the exact area required for sediment management will be determined during the final design phase, it is estimated that 2 to 2.5 acres would be required. Five potential staging areas have been identified. The staging area will require site preparation and construction of a pad. The site will be graded and compacted (if necessary) and a sealing liner will be put in place. An asphalt pad will then be constructed. The drying area will be surrounded by k-rails and sealed with foam and impervious fabric to form a confined area. The dredged sediment, depending upon physical characteristics, will either be off-loaded from the materials barge by an excavator and put into dump trucks for placement in the staging area or treated with pozzilonics in the barge, then off-loaded into trucks for placement in the staging area for curing and sampling. In either event, the sediment will then be mixed with a cement-based reagent (pozzilonics) to accelerate the drying. The sediment will be spread out and rotated frequently to further accelerate the drying process. The drains located in the drying area will be isolated from the rest of the stormwater system at the site. If the excess water from the drying area does not meet industrial wastewater permit requirements, and cannot be discharged into the City sewage system, the water will be dealt with as contaminated waste and removed from the site by a licensed waste hauler. All collected water will be tested and disposed of in accordance with local, state, and federal requirements. After drying, soil sampling will be conducted and all dredged material will be loaded directly onto trucks for disposal at an approved upland landfill. 2.6.3 Transportation and Disposal
Once the dredge materials have been dried and tested, they will be loaded onto trucks for disposal at an approved landfill. For purposes of this project, it is assumed that 85 percent of the material will be transported from the staging area to Otay Landfill, approximately 15 miles southeast of the Shipyard Sediment Site. Trucks departing from potential Staging Areas 1 through 4 would access I-5 south via E. Harbor Drive and 28th Street; trucks departing from Staging Area 5 would access I-5 south either directly from Bay Marina Drive or from W. 32nd Street to Marina Way to Bay Marina Drive. The preferred route to Otay Landfill is via I-5 south to Highway 54 east, to I-805 south (Figure 8). Although the sediment is not known to be classified as California hazardous material, it will be tested upon removal and prior to disposal. It is assumed for the purposes of this study that up to 15 percent of the material will require transport to a Class III facility, most likely the Kettleman Hills Landfill in Kings County, California, near Bakersfield. Based on the excavation quantity of 143,400 cubic yards, and accounting for an additional 15 percent of

38.00
51.00 50.00
39.02
115.00
1
3
2
3
1
2
14
3
1
2
4
1
5
1
1
2 2
3
3
4
4
3
3
LEGEND
Census Tracts
Census Block Groups
Potential Sediment Staging Areas
Shipyard Sediment Project Site
Potential Haul Routes
SOURCE: Bing Maps (2008), U.S. Census Bureau (2000)
R:\SWB1001\GIS\Census_HaulRoutes_FIG8.mxd (3/31/2011)
FIGURE 8
San Diego Sediment ProjectStudy Area Census Tracts and Haul Routes
0 1000 2000
FEET

L S A A S S O C I A T E S , I N C . A I R Q U A L I T Y A N A L Y S I S M A Y 2 0 1 1 S H I P Y A R D S E D I M E N T R E M E D I A T I O N P R O J E C T S A N D I E G O R E G I O N A L W A T E R Q U A L I T Y C O N T R O L B O A R D
R:\SWB1001A\Air\AQ and GHG-Rev.doc (6/2/2011) 17
bulk material due to the dewatering and treatment process, it is estimated that up to 250 truck trips per week could be required over an approximately 12.5-month period to remove the material. These estimates are a worst-case scenario and will be finalized during the design phase.

L S A A S S O C I A T E S , I N C . A I R Q U A L I T Y A N A L Y S I S M A Y 2 0 1 1 S H I P Y A R D S E D I M E N T R E M E D I A T I O N P R O J E C T S A N D I E G O R E G I O N A L W A T E R Q U A L I T Y C O N T R O L B O A R D
R:\SWB1001A\Air\AQ and GHG-Rev.doc (06/2/2011) 18
3.0 SETTING
The project site is located within the Cities of San Diego and National City, an area within the San Diego Air Basin (Basin) that includes the entire San Diego County area. Air quality regulation in the Basin is administered by the San Diego Air Pollution Control District (SDAPCD). 3.1 REGIONAL AIR QUALITY
Both the State of California (State) and the Federal Government have established health-based ambient air quality standards (AAQS) for seven air pollutants. As shown in Table A, these pollutants include ozone (O3), Carbon Monoxide (CO), nitrogen dioxide (NO2), sulfur dioxide (SO2), coarse particulate matter with a diameter of 10 microns or less (PM10), fine particulate matter less than 2.5 microns in diameter (PM2.5), and lead. In addition, the State has set standards for sulfates, hydrogen sulfide, vinyl chloride, and visibility-reducing particles. These standards are designed to protect the health and welfare of the populace with a reasonable margin of safety. In addition to setting out primary and secondary AAQS, the State of California has established a set of episode criteria for O3, CO, NO2, SO2, and PM10. These criteria refer to episode levels representing periods of short-term exposure to air pollutants that actually threaten public health. Health effects are progressively more severe as pollutant levels increase from Stage One to Stage Three. An alert level is that concentration of pollutants at which initial stage control actions are to begin. An alert will be declared when any one of the pollutant alert levels is reached at any monitoring site and meteorological conditions are such that the pollutant concentrations can be expected to remain at these levels for 12 or more hours or to increase; or, in the case of oxidants, the situation is likely to recur within the next 24 hours unless control actions are taken. Pollutant alert levels: O3: 392 micrograms per cubic meter (µg/m3) (0.20 parts per million [ppm]), 1-hour
average.
CO: 17 milligrams per cubic meter (mg/m3) (15 ppm), 8-hour average.
NO2: 1,130 µg/m3 (0.6 ppm) 1-hour average; 282 µg/m3 (0.15 ppm) 24-hour average.
SO2: 800 µg/m3 (0.3 ppm), 24-hour average.
Particulates, measured as PM10: 350 µg/m3, 24-hour average.

L S A A S S O C I A T E S , I N C . A I R Q U A L I T Y A N A L Y S I S M A Y 2 0 1 1 S H I P Y A R D S E D I M E N T R E M E D I A T I O N P R O J E C T S A N D I E G O R E G I O N A L W A T E R Q U A L I T Y C O N T R O L B O A R D
R:\SWB1001A\Air\AQ and GHG-Rev.doc (6/2/2011) 19
Table A: Ambient Air Quality Standards
California Standards1 Federal Standards2 Pollutant
Averaging Time Concentration3 Method4 Primary3,5 Secondary3,6 Method7
1-Hour 0.09 ppm (180 μg/m3) —
Ozone (O3) 8-Hour 0.070 ppm
(137 μg/m3)
Ultraviolet Photometry 0.075 ppm
(147 μg/m3)
Same as Primary Standard
Ultraviolet Photometry
24-Hour 50 μg/m3 150 μg/m3 Respirable Particulate
Matter (PM10)
Annual Arithmetic
Mean 20 μg/m3
Gravimetric or Beta Attenuation —
Same as Primary Standard
Inertial Separation and Gravimetric
Analysis
24-Hour No Separate State Standard 35 μg/m3 Fine Particulate
Matter (PM2.5)
Annual Arithmetic
Mean 12 μg/m3 Gravimetric or Beta
Attenuation 15.0 μg/m3 Same as Primary
Standard
Inertial Separation and Gravimetric
Analysis
8-Hour 9.0 ppm (10 mg/m3) 9 ppm (10 mg/m3)
1-Hour 20 ppm (23 mg/m3) 35 ppm(40 mg/m3)None
Non-Dispersive Infrared Photometry
(NDIR) Carbon
Monoxide (CO) 8-Hour
(Lake Tahoe) 6 ppm (7 mg/m3)
Non-Dispersive Infrared Photometry
(NDIR) — — —
Annual Arithmetic
Mean
0.030 ppm (57 μg/m3)
53 ppb (100 μg/m3) (see footnote 8)
Same as Primary Standard Nitrogen
Dioxide (NO2)
1-Hour 0.18 ppm (339 μg/m3)
Gas Phase Chemiluminescence 100 ppb
(188 μg/m3) (see footnote 8)
None
Gas Phase Chemiluminescence
24-Hour 0.04 ppm (105 μg/m3) — —
3-Hour — — 0.5 ppm
(1300 μg/m3) (see footnote 9)
Sulfur Dioxide (SO2)
1-Hour 0.25 ppm (655 μg/m3)
Ultraviolet Fluorescence
75 ppb (196 μg/m3)
(see footnote 9) —
Spectrophotometry (Pararosaniline
Method)
30 Day Average 1.5 μg/m3 — — Calendar Quarter — 1.5 μg/m3
Lead10 Rolling 3-
Month Average11
—
Atomic Absorption
0.15 μg/m3
Same as Primary Standard
High-Volume Sampler and Atomic
Absorption
Visibility-Reducing Particles
8-Hour
Extinction coefficient of 0.23 per kilometer - visibility of ten miles or more (0.07-30
miles or more for Lake Tahoe) due to particles when relative humidity is less
than 70 percent. Method: Beta Attenuation and Transmittance through Filter Tape.
Sulfates 24-Hour 25 μg/m3 Ion ChromatographyHydrogen
Sulfide 1-Hour 0.03 ppm (42 μg/m3) Ultraviolet
Fluorescence Vinyl
Chloride10 24-Hour 0.01 ppm (26 μg/m3) Gas
Chromatography
No
Federal
Standards
Source: California Air Resources Board, September 8, 2010. Table footnotes are provided on the following page.

L S A A S S O C I A T E S , I N C . A I R Q U A L I T Y A N A L Y S I S M A Y 2 0 1 1 S H I P Y A R D S E D I M E N T R E M E D I A T I O N P R O J E C T S A N D I E G O R E G I O N A L W A T E R Q U A L I T Y C O N T R O L B O A R D
R:\SWB1001A\Air\AQ and GHG-Rev.doc (6/2/2011) 20
Footnotes for Table A: 1 California standards for ozone; carbon monoxide (except Lake Tahoe); sulfur dioxide (1- and 24-hour); nitrogen
dioxide; suspended particulate matter - PM10, PM2.5 and visibility reducing particles, are values that are not to be exceeded. All others are not to be equaled or exceeded. California ambient air quality standards are listed in the Table of Standards in Section 70200 of Title 17 of the California Code of Regulations.
2 National standards (other than ozone, particulate matter, and those based on annual averages or annual arithmetic mean) are not to be exceeded more than once a year. The ozone standard is attained when the fourth-highest eight-hour concentration in a year, averaged over three years, is equal to or less than the standard. For PM10, the 24-hour standard is attained when the expected number of days per calendar year with a 24-hour average concentration above 150 µg/m3 is equal to or less than one. For PM2.5, the 24-hour standard is attained when 98 percent of the daily concentrations, averaged over three years, are equal to or less than the standard. Contact the EPA for further clarification and current Federal policies.
3 Concentration expressed first in units in which it was promulgated. Equivalent units given in parentheses are based upon a reference temperature of 25°C and a reference pressure of 760 torr. Most measurements of air quality are to be corrected to a reference temperature of 25°C and a reference pressure of 760 torr; ppm in this table refers to ppm by volume, or micromoles of pollutant per mole of gas.
4 Any equivalent procedure which can be shown to the satisfaction of ARB to give equivalent results at or near the level of the air quality standard may be used.
5 National Primary Standards: The levels of air quality necessary, with an adequate margin of safety to protect the public health.
6 National Secondary Standards: The levels of air quality necessary to protect the public welfare from any known or anticipated adverse effects of a pollutant.
7 Reference method as described by the EPA. An “equivalent method” of measurement may be used but must have a “consistent relationship to the reference method” and must be approved by the EPA.
8 To attain this standard, the 3-year average of the 98th percentile of the daily maximum 1-hour average at each monitor within an area must not exceed 0.100 ppm (effective January 22, 2010). Note that the EPA standards are in units of parts per billion (ppb). California standards are in units of parts per million (ppm). To directly compare the national standards to the California standards, the units can be converted from ppb to ppm. In this case, the national standards of 53 ppb and 100 ppb are identical to 0.053 ppm and 0.100 ppm, respectively.
9 On June 2, 2010, the EPA established a new 1-hour SO2 standard, effective August 23, 2010, which is based on the 3-year average of the annual 99th percentile of 1-hour daily maximum concentrations. The EPA also proposed a new automated Federal Reference Method (FRM) using ultraviolet technology, but will retain the older pararosaniline methods until the new FRM has adequately permeated State monitoring networks. The EPA also revoked both the existing 24-hour SO2 standard of 0.14 ppm and the annual primary SO2 standard of 0.030 ppm, effective August 23, 2010. The secondary SO2 standard was not revised at this time; however, the secondary standard is undergoing a separate review by the EPA. Note that the new standard is in units of parts per billion (ppb). California standards are in units of parts per million (ppm). To directly compare the new primary national standard to the California standard, the units can be converted to ppm. In this case, the national standard of 75 ppb is identical to 0.075 ppm.
10 The ARB has identified lead and vinyl chloride as “toxic air contaminants” with no threshold level of exposure for adverse health effects determined. These actions allow for the implementation of control measures at levels below the ambient concentrations specified for these pollutants.
11 National lead standard, rolling 3-month average: final rule signed October 15, 2008. °C = degrees Celsius EPA = United States Environmental Protection Agency µg/m3 = micrograms per cubic meter mg/m3 = milligrams per cubic meter ppm = parts per million ppb = parts per billion
L S A A S S O C I A T E S , I N C . A I R Q U A L I T Y A N A L Y S I S M A Y 2 0 1 1 S H I P Y A R D S E D I M E N T R E M E D I A T I O N P R O J E C T S A N D I E G O R E G I O N A L W A T E R Q U A L I T Y C O N T R O L B O A R D
R:\SWB1001A\Air\AQ and GHG-Rev.doc (6/2/2011) 21
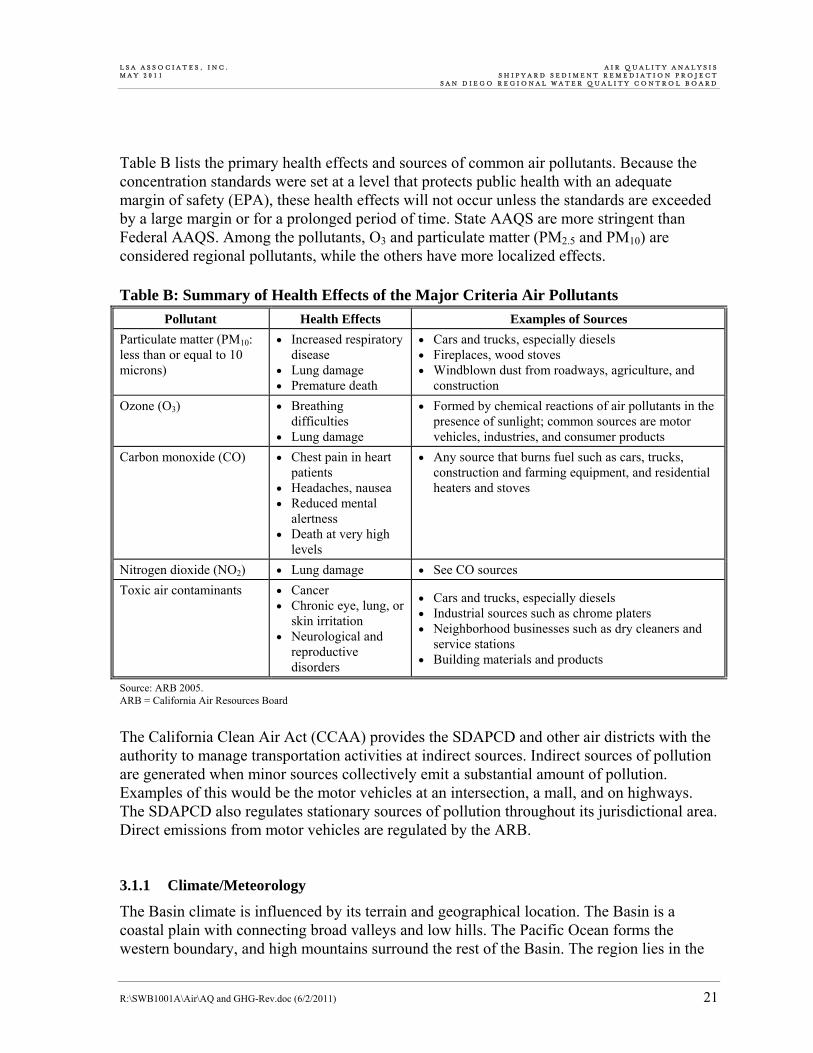
Table B lists the primary health effects and sources of common air pollutants. Because the concentration standards were set at a level that protects public health with an adequate margin of safety (EPA), these health effects will not occur unless the standards are exceeded by a large margin or for a prolonged period of time. State AAQS are more stringent than Federal AAQS. Among the pollutants, O3 and particulate matter (PM2.5 and PM10) are considered regional pollutants, while the others have more localized effects. Table B: Summary of Health Effects of the Major Criteria Air Pollutants
Pollutant Health Effects Examples of Sources
Particulate matter (PM10: less than or equal to 10 microns)
• Increased respiratory disease
• Lung damage • Premature death
• Cars and trucks, especially diesels • Fireplaces, wood stoves • Windblown dust from roadways, agriculture, and
construction Ozone (O3) • Breathing
difficulties • Lung damage
• Formed by chemical reactions of air pollutants in the presence of sunlight; common sources are motor vehicles, industries, and consumer products
Carbon monoxide (CO) • Chest pain in heart patients
• Headaches, nausea • Reduced mental
alertness • Death at very high
levels
• Any source that burns fuel such as cars, trucks, construction and farming equipment, and residential heaters and stoves
Nitrogen dioxide (NO2) • Lung damage • See CO sources Toxic air contaminants • Cancer
• Chronic eye, lung, or skin irritation
• Neurological and reproductive disorders
• Cars and trucks, especially diesels • Industrial sources such as chrome platers • Neighborhood businesses such as dry cleaners and
service stations • Building materials and products
Source: ARB 2005. ARB = California Air Resources Board
The California Clean Air Act (CCAA) provides the SDAPCD and other air districts with the authority to manage transportation activities at indirect sources. Indirect sources of pollution are generated when minor sources collectively emit a substantial amount of pollution. Examples of this would be the motor vehicles at an intersection, a mall, and on highways. The SDAPCD also regulates stationary sources of pollution throughout its jurisdictional area. Direct emissions from motor vehicles are regulated by the ARB. 3.1.1 Climate/Meteorology
The Basin climate is influenced by its terrain and geographical location. The Basin is a coastal plain with connecting broad valleys and low hills. The Pacific Ocean forms the western boundary, and high mountains surround the rest of the Basin. The region lies in the

L S A A S S O C I A T E S , I N C . A I R Q U A L I T Y A N A L Y S I S M A Y 2 0 1 1 S H I P Y A R D S E D I M E N T R E M E D I A T I O N P R O J E C T S A N D I E G O R E G I O N A L W A T E R Q U A L I T Y C O N T R O L B O A R D
R:\SWB1001A\Air\AQ and GHG-Rev.doc (6/2/2011) 22
semi-permanent high pressure zone of the eastern Pacific. The resulting climate is mild and tempered by cool ocean breezes.
The annual average temperature varies little throughout the Basin, ranging from the low to middle 60s, measured in degrees Fahrenheit. With a more pronounced oceanic influence, coastal areas show less variability in annual minimum and maximum temperatures than inland areas. The climatological station closest to the site monitoring temperature is the San Diego Airport Station.1 The annual average maximum temperature recorded between 1914 and 2010 at this station is 69.9°F, and the annual average minimum is 56.5°F. January is typically the coldest month in this area of the Basin. The majority of annual rainfall in the Basin occurs between November and April. Summer rainfall is minimal and generally limited to scattered thundershowers in coastal regions and slightly heavier showers in the eastern portion of the Basin along the coastal side of the mountains. The climatological station closest to the site that monitors precipitation is the San Diego Airport Station. Average rainfall measured at this station between 1979 and 2010 varied from 2.03 inches in January to 0.78 inch or less between April and October, with an average annual total of 10.18 inches. Patterns in monthly and yearly rainfall totals are unpredictable due to fluctuations in the weather. 3.1.2 Description of Global Climate Change and Its Sources
Global climate change is the observed increase in the average temperature of the Earth’s atmosphere and oceans along with other significant changes in climate (such as precipitation or wind) that last for an extended period of time. The term “global climate change” is often used interchangeably with the term “global warming,” but “global climate change” is preferred to “global warming” because it helps convey that there are other changes in addition to rising temperatures. Climate change refers to any change in measures of weather (such as temperature, precipitation, or wind) lasting for an extended period (decades or longer). Climate change may result from natural factors, such as changes in the sun’s intensity; natural processes within the climate system, such as changes in ocean circulation; or human activities, such as the burning of fossil fuels, land clearing, or agriculture. The primary observed effect of global climate change has been a rise in the average global tropospheric2 temperature of 0.36°F per decade, determined from meteorological measurements worldwide between 1990 and 2005. Climate change modeling shows that further warming could occur, which would induce additional changes in the global climate system during the current century. Changes to the global climate system, ecosystems, and the environment of California could include
1 Western Regional Climatic Center, at website wrcc.dri.edu, 2011. 2 The troposphere is the zone of the atmosphere characterized by water vapor, weather, winds, and decreasing
temperature with increasing altitude.
L S A A S S O C I A T E S , I N C . A I R Q U A L I T Y A N A L Y S I S M A Y 2 0 1 1 S H I P Y A R D S E D I M E N T R E M E D I A T I O N P R O J E C T S A N D I E G O R E G I O N A L W A T E R Q U A L I T Y C O N T R O L B O A R D
R:\SWB1001A\Air\AQ and GHG-Rev.doc (6/2/2011) 23
higher sea levels, drier or wetter weather, changes in ocean salinity, changes in wind patterns, or more energetic aspects of extreme weather, including droughts, heavy precipitation, heat waves, extreme cold, and increased intensity of tropical cyclones. Specific effects in California might include a decline in the Sierra Nevada snowpack, erosion of California’s coastline, and seawater intrusion in the Delta. Global surface temperatures have risen by 1.33°F ± 0.32°F over the last 100 years (1906 to 2005). The rate of warming over the last 50 years is almost double that over the last 100 years.1 The latest projections, based on state-of-the art climate models, indicate that temperatures in California are expected to rise 3–10.5°F by the end of the century.2 The prevailing scientific opinion on climate change is that “most of the warming observed over the last 50 years is attributable to human activities.”3 Increased amounts of CO2 and other GHGs are the primary causes of the human-induced component of warming. The observed warming effect associated with the presence of GHGs in the atmosphere (from either natural or human sources) is often referred to as the greenhouse effect.4 GHGs are present in the atmosphere naturally, are released by natural sources, or are formed from secondary reactions taking place in the atmosphere. The gases that are widely seen as the principal contributors to human-induced global climate change are:5 • CO2
• CH4
• Nitrous oxide (N2O)
• Hydrofluorocarbons (HFCs)
• Perfluorocarbons (PFCs)
• Sulfur Hexafluoride (SF6) Over the last 200 years, human activities have caused substantial quantities of GHGs to be released into the atmosphere. These extra emissions are increasing GHG concentrations in the atmosphere, and enhancing the natural greenhouse effect, which is believed to be causing global warming. While GHGs produced by human activities include naturally-occurring 1 Intergovernmental Panel on Climate Change (IPCC), 2007. Climate Change 2007: The Physical Science Basis.
Contribution of Working Group I to the Fourth Assessment Report of the IPCC. 2 California Climate Change Center, 2006. Our Changing Climate. Assessing the Risks to California. July. 3 Intergovernmental Panel on Climate Change (IPCC), Climate Change 2007: The Physical Science Basis,
http://www.ipcc.ch. 4 The temperature on Earth is regulated by a system commonly known as the “greenhouse effect.” Just as the glass in a
greenhouse lets heat from sunlight in and reduce the amount of heat that escapes, greenhouse gases like carbon dioxide, methane, and nitrous oxide in the atmosphere keep the Earth at a relatively even temperature. Without the greenhouse effect, the Earth would be a frozen globe; thus, although an excess of greenhouse gas results in global warming, the naturally occurring greenhouse effect is necessary to keep our planet at a comfortable temperature.
5 The greenhouse gases listed are consistent with the definition in Assembly Bill (AB) 32 (Government Code 38505), as discussed later in this section.

L S A A S S O C I A T E S , I N C . A I R Q U A L I T Y A N A L Y S I S M A Y 2 0 1 1 S H I P Y A R D S E D I M E N T R E M E D I A T I O N P R O J E C T S A N D I E G O R E G I O N A L W A T E R Q U A L I T Y C O N T R O L B O A R D
R:\SWB1001A\Air\AQ and GHG-Rev.doc (6/2/2011) 24
GHGs such as CO2, CH4, and N2O, some gases, like HFCs, PFCs, and SF6 are completely new to the atmosphere. Certain other gases, such as water vapor, are short-lived in the atmosphere as compared to these GHGs that remain in the atmosphere for significant periods of time, contributing to climate change in the long term. Water vapor is generally excluded from the list of GHGs because it is short-lived in the atmosphere and its atmospheric concentrations are largely determined by natural processes, such as oceanic evaporation. For the purposes of this Environmental Impact Report (EIR), the term “GHGs” will refer collectively to the six gases identified in the bulleted list provided above. These gases vary considerably in terms of Global Warming Potential (GWP), which is a concept developed to compare the ability of each GHG to trap heat in the atmosphere relative to another gas. The global warming potential is based on several factors, including the relative effectiveness of a gas to absorb infrared radiation and length of time that the gas remains in the atmosphere (“atmospheric lifetime”). The GWP of each gas is measured relative to CO2, the most abundant GHG. The definition of GWP for a particular GHG is the ratio of heat trapped by one unit mass of the GHG to the ratio of heat trapped by one unit mass of CO2 over a specified time period. GHG emissions are typically measured in terms of metric tons1 of “CO2 equivalents” (CO2e). Table C shows the GWPs for each type of GHG. For example, sulfur hexafluoride is 22,800 times more potent at contributing to global warming than carbon dioxide. Table C: Global Warming Potential of Greenhouse Gases
Gas Atmospheric Lifetime
(Years) Global Warming Potential (100-year Time
Horizon)
Carbon Dioxide (CO2) 50–200 1 Methane (CH4) 12 25 Nitrous Oxide (NOx) 114 298 HFC-23 270 14,800 HFC-134a 14 1,430 HFC-152a 1.4 124 PFC: Tetrafluoromethane (CF4)
50,000 7,390
PFC: Hexafluoromethane (C2F6)
10,000 12,200
Sulfur Hexafluoride (SF6) 3,200 22,800 Source: IPCC, 2007. Climate Change 2007: The Physical Science Basis. Contribution of Working Group I to the Fourth Assessment
Report of the IPCC. HFC = Hydrofluorocarbons IPCC = Intergovernmental Panel on Climate Change PFC = Perfluorocarbons
The following discussion summarizes the characteristics of the six primary GHGs. 1 A metric ton is equivalent to approximately 1.1 standard tons.
L S A A S S O C I A T E S , I N C . A I R Q U A L I T Y A N A L Y S I S M A Y 2 0 1 1 S H I P Y A R D S E D I M E N T R E M E D I A T I O N P R O J E C T S A N D I E G O R E G I O N A L W A T E R Q U A L I T Y C O N T R O L B O A R D
R:\SWB1001A\Air\AQ and GHG-Rev.doc (6/2/2011) 25
Carbon Dioxide. In the atmosphere, carbon generally exists in its oxidized form, as CO2. Natural sources of CO2 include the respiration (breathing) of humans, animals and plants, volcanic outgassing, decomposition of organic matter, and evaporation from the oceans. Human-caused sources of CO2 include the combustion of fossil fuels and wood, waste incineration, mineral production, and deforestation. The Earth maintains a natural carbon balance, and when concentrations of CO2 are upset, the system gradually returns to its natural state through natural processes. Natural changes to the carbon cycle work slowly, especially compared to the rapid rate at which humans are adding CO2 to the atmosphere. Natural removal processes, such as photosynthesis by land- and ocean-dwelling plant species, cannot keep pace with this extra input of human-made CO2, and consequently the gas is building up in the atmosphere. The concentration of CO2 in the atmosphere has risen approximately 30 percent since the late 1800s.1 In 2002, CO2 emissions from fossil fuel combustion accounted for approximately 98 percent of human-made CO2 emissions and approximately 84 percent of California’s overall GHG emissions (CO2e). The transportation sector accounted for California’s largest portion of CO2 emissions, with gasoline consumption making up the greatest portion of these emissions. Electricity generation was California’s second-largest category of GHG emissions. Methane. CH4 is produced when organic matter decomposes in environments lacking sufficient oxygen. Natural sources include wetlands, termites, and oceans. Anthropogenic sources include rice cultivation, livestock, landfills and waste treatment, biomass burning, and fossil fuel combustion (burning of coal, oil, natural gas, etc.). Decomposition occurring in landfills accounts for the majority of human-generated CH4 emissions in California, followed by enteric fermentation (emissions from the digestive processes of livestock).2 Agricultural processes such as manure management and rice cultivation are also significant sources of human-made CH4 in California. CH4 accounted for approximately 6 percent of gross climate change emissions (CO2e) in California in 2002.3 It is estimated that over 60 percent of global methane emissions are related to human-related activities.4 As with CO2, the major removal process of atmospheric CH4—a chemical breakdown in the atmosphere—cannot keep pace with source emissions, and CH4 concentrations in the atmosphere are increasing. Nitrous Oxide. N2O is produced naturally by a wide variety of biological sources, particularly microbial action in soils and water. Tropical soils and oceans account for the 1 California Environmental Protection Agency. 2006. Climate Action Team Report to Governor Schwarzenegger and the
Legislature. March. 2 California Air Resources Board, Greenhouse Gas Inventory Data - 1990 to 2004.
http://www.arb.ca.gov/cc/inventory/data/data.htm. Accessed November 2008. 3 Ibid. 4 IPCC, 2007. Climate Change 2007: The Physical Science Basis. Contribution of Working Group I to the Fourth
Assessment Report of the IPCC.

L S A A S S O C I A T E S , I N C . A I R Q U A L I T Y A N A L Y S I S M A Y 2 0 1 1 S H I P Y A R D S E D I M E N T R E M E D I A T I O N P R O J E C T S A N D I E G O R E G I O N A L W A T E R Q U A L I T Y C O N T R O L B O A R D
R:\SWB1001A\Air\AQ and GHG-Rev.doc (6/2/2011) 26
majority of natural source emissions. N2O is a product of the reaction that occurs between nitrogen and oxygen during fuel combustion. Both mobile and stationary combustion emit N2O, and the quantity emitted varies according to the type of fuel, technology, and pollution control device used, as well as maintenance and operating practices. Agricultural soil management and fossil fuel combustion are the primary sources of human-generated N2O emissions in California. N2O emissions accounted for nearly 7 percent of human-made GHG emissions (CO2e) in California in 2002. Hydrofluorocarbons, Perfluorocarbons, and Sulfur Hexafluoride. HFCs are primarily used as substitutes for ozone-depleting substances regulated under the Montreal Protocol.1 PFCs and SF6 are emitted from various industrial processes, including aluminum smelting, semiconductor manufacturing, electric power transmission and distribution, and magnesium casting. There is no aluminum or magnesium production in California; however, the rapid growth in the semiconductor industry, which is active in California, leads to greater use of PFCs. HFCs, PFCs, and SF6 accounted for about 3.5 percent of human-made GHG emissions (CO2e) in California in 2002.2 Emissions Sources and Inventories. An emissions inventory that identifies and quantifies the primary human-generated sources and sinks of GHGs is a well-recognized and useful tool for addressing climate change. This section summarizes the latest information on global, National, California, and local GHG emission inventories. However, because GHGs persist for a long time in the atmosphere (see previously referenced Table C), accumulate over time, and are generally well-mixed, their impact on the atmosphere and climate cannot be tied to a specific point of emission. Global Emissions. Worldwide emissions of GHGs in 2004 were 27 billion metric tons of CO2e per year.3 Global estimates are based on country inventories developed as part of programs of the United Nations Framework Convention on Climate Change (UNFCCC). United States Emissions. In 2008, the United States emitted approximately 7.0 billion metric tons of CO2e or approximately 25 tons per year per person. Of the six major sectors
1 The Montreal Protocol is an international treaty that was approved on January 1, 1989, and was designated to protect
the ozone layer by phasing out the production of several groups of halogenated hydrocarbons believed to be responsible for ozone depletion.
2 California Environmental Protection Agency. 2006. Climate Action Team Report to Governor Schwarzenegger and the Legislature. March.
3 Combined total of Annex I and Non-Annex I Country CO2eq emissions. United Nations Framework Convention on Climate Change (UNFCCC), 2007. Greenhouse Gas Inventory Data. Information available at http://unfccc.int/ghg_data/ghg_data_unfccc/time_series_annex_i/items/3814.php and http://maindb.unfccc.int/library/view_pdf.pl?url=http://unfccc.int/resource/docs/2005/sbi/eng/18a02.pdf.

L S A A S S O C I A T E S , I N C . A I R Q U A L I T Y A N A L Y S I S M A Y 2 0 1 1 S H I P Y A R D S E D I M E N T R E M E D I A T I O N P R O J E C T S A N D I E G O R E G I O N A L W A T E R Q U A L I T Y C O N T R O L B O A R D
R:\SWB1001A\Air\AQ and GHG-Rev.doc (6/2/2011) 27
nationwide— electric power industry, transportation, industry, agriculture, commercial, residential— the electric power industry and transportation sectors combined account for approximately 62 percent of the GHG emissions; the majority of the electrical power industry and all of the transportation emissions are generated from direct fossil fuel combustion. Between 1990 and 2006, total United States GHG emissions rose approximately 14.7 percent.1 State of California Emissions. According to California ARB emission inventory estimates, California emitted approximately 474 million metric tons of CO2e (MMTCO2e) emissions in 2008.2 This large number is due primarily to the sheer size of California compared to other states. By contrast, California has the fourth-lowest per-capita CO2 emission rate from fossil fuel combustion in the country, due to the success of its energy efficiency and renewable energy programs and commitments that have lowered the State’s GHG emissions rate of growth by more than half of what it would have been otherwise.3 The Cal/EPA Climate Action Team stated in its March 2006 report that the composition of gross climate change pollutant emissions in California in 2002 (expressed in terms of CO2e) was as follows: • CO2 accounted for 83.3 percent;
• CH4 accounted for 6.4 percent;
• N2O accounted for 6.8 percent; and
• HFCs, PFC, and SF6 accounted for 3.5 percent.4
The California ARB estimates that transportation is the source of approximately 38 percent of the State’s GHG emissions in 2004, followed by electricity generation (both in-State and out-of-State) at 23 percent, and industrial sources at 20 percent. The remaining sources of GHG emissions are residential and commercial activities at 9 percent, agriculture at 6 percent, high global warming potential gases at 3 percent, and recycling and waste at 1 percent.5
1 U.S. Environmental Protection Agency (EPA). 2010. The 2010 U.S. Greenhouse Gas Inventory Report.
http://www.epa.gov/climatechange/emissions/usinventoryreport.html. Accessed September 2010. 2 California Air Resources Board, Greenhouse Gas Inventory Data - 1990 to 2004.
http://www.arb.ca.gov/cc/inventory/data/data.htm. Accessed September 2010. 3 California Energy Commission (CEC), 2007. Inventory of California Greenhouse Gas Emissions and Sinks: 1990 to
2004 - Final Staff Report, publication # CEC-600-2006-013-SF, Sacramento, CA, December 22, 2006; and January 23, 2007, update to that report.
4 California Environmental Protection Agency. 2006. Climate Action Team Report to Governor Schwarzenegger and the Legislature. March.
5 California Air Resources Board (ARB), 2008. http://www.climatechange.ca.gov/inventory/index.html. September.

L S A A S S O C I A T E S , I N C . A I R Q U A L I T Y A N A L Y S I S M A Y 2 0 1 1 S H I P Y A R D S E D I M E N T R E M E D I A T I O N P R O J E C T S A N D I E G O R E G I O N A L W A T E R Q U A L I T Y C O N T R O L B O A R D
R:\SWB1001A\Air\AQ and GHG-Rev.doc (6/2/2011) 28
The California ARB is responsible for developing the California Greenhouse Gas Emission Inventory. This inventory estimates the amount of GHGs emitted to and removed from the atmosphere by human activities within the State of California and supports the AB 32 Climate Change Program. The California ARB’s current GHG emission inventory covers the years 1990–2004 and is based on fuel use, equipment activity, industrial processes, and other relevant data (e.g., housing, landfill activity, agricultural lands). The emission inventory estimates are based on the actual amount of all fuels combusted in the State, which accounts for over 85 percent of the GHG emissions within California. The California ARB staff has projected statewide unregulated GHG emissions for 2020, which represent the emissions that would be expected to occur in the absence of any GHG reduction actions, will be 596 MMT CO2e. GHG emissions from the transportation and electricity sectors as a whole are expected to increase, but remain at approximately 38 percent and 23 percent of total CO2e emissions, respectively. The industrial sector consists of large stationary sources of GHG emissions, and the percentage of the total 2020 emissions is projected to be 17 percent of total CO2e emissions. The remaining sources of GHG emissions in 2020 are high global warming potential gases at 8 percent, residential and commercial activities at 8 percent, agriculture at 5 percent, and recycling and waste at 1 percent.1 3.1.3 Air Pollution Constituents and Attainment Status
The ARB coordinates and oversees both State and Federal air pollution control programs in California. The ARB oversees activities of local air quality management agencies and maintains air quality monitoring stations throughout the State in conjunction with the EPA and local air districts. The ARB has divided the State into 15 air basins based on meteorological and topographical factors of air pollution. Data collected at these stations are used by the ARB and EPA to classify air basins as attainment, nonattainment, nonattainment-transitional, or unclassified, based on air quality data for the most recent 3 calendar years compared with the AAQS. Nonattainment areas are imposed with additional restrictions as required by the EPA. The air quality data are also used to monitor progress in attaining air quality standards. Table D lists the attainment status for the criteria pollutants in the Basin. Table D: Attainment Status of Criteria Pollutants in the San Diego Air Basin
Pollutant State Federal
O3 1-hour Serious Nonattainment N/A O3 8-hour Nonattainment Nonattainment
PM10 Nonattainment Attainment/Unclassified PM2.5 Nonattainment Attainment/Unclassified CO Attainment Attainment
1 Ibid.

L S A A S S O C I A T E S , I N C . A I R Q U A L I T Y A N A L Y S I S M A Y 2 0 1 1 S H I P Y A R D S E D I M E N T R E M E D I A T I O N P R O J E C T S A N D I E G O R E G I O N A L W A T E R Q U A L I T Y C O N T R O L B O A R D
R:\SWB1001A\Air\AQ and GHG-Rev.doc (6/2/2011) 29
Table D: Attainment Status of Criteria Pollutants in the San Diego Air Basin
Pollutant State Federal
NO2 Attainment Attainment/Unclassified SO2 Attainment Attainment
All others Attainment/Unclassified Attainment/Unclassified Source: ARB 2010 (http://www.arb.ca.gov/desig/desig.htm). ARB = California Air Resources Board CO = carbon monoxide N/A = not applicable NO2 = nitrogen dioxide O3 = ozone PM10 = particulate matter less than 10 microns in diameter PM2.5 = particulate matte less than 2.5 microns in diameter SO2 = sulfur dioxide
Ozone. O3 (smog) is formed by photochemical reactions between oxides of nitrogen and reactive organic gases (ROGs) rather than being directly emitted. O3 is a pungent, colorless gas typical of Southern California smog. Elevated O3 concentrations result in reduced lung function, particularly during vigorous physical activity. This health problem is particularly acute in sensitive receptors such as the sick, the elderly, and young children. O3 levels peak during summer and early fall. The entire Basin is designated as a serious nonattainment area for the State one-hour O3 standard. Effective June 15, 2005, the United States Environmental Policy Act (EPA) revoked, in full, the Federal one-hour O3 ambient air quality standard, including associated designations and classifications. The EPA has officially designated the status for the Basin regarding the Federal eight-hour O3 standard as nonattainment. Carbon Monoxide. CO is formed by the incomplete combustion of fossil fuels, almost entirely from automobiles. It is a colorless, odorless gas that can cause dizziness, fatigue, and impairments to central nervous system functions. The entire Basin is in attainment for the Federal and State standards for CO. Nitrogen Oxides. NO2, a reddish brown gas, and nitric oxide (NO), a colorless, odorless gas, are formed from fuel combustion under high temperature or pressure. These compounds are referred to as nitrogen oxides, or NOX. NOX is a primary component of the photochemical smog reaction. It also contributes to other pollution problems, including a high concentration of fine particulate matter, poor visibility, and acid deposition (i.e., acid rain). NO2 decreases lung function and may reduce resistance to infection. The entire Basin is designated as an attainment area for the Federal and State standards. Sulfur Dioxide. SO2 is a colorless irritating gas formed primarily from incomplete combustion of fuels containing sulfur. Industrial facilities also contribute to gaseous SO2 levels. SO2 irritates the respiratory tract, can injure lung tissue when combined with fine

L S A A S S O C I A T E S , I N C . A I R Q U A L I T Y A N A L Y S I S M A Y 2 0 1 1 S H I P Y A R D S E D I M E N T R E M E D I A T I O N P R O J E C T S A N D I E G O R E G I O N A L W A T E R Q U A L I T Y C O N T R O L B O A R D
R:\SWB1001A\Air\AQ and GHG-Rev.doc (6/2/2011) 30
particulate matter, and reduces visibility and the level of sunlight. The entire Basin is in attainment with both Federal and State SO2 standards. Lead. Lead is found in old paints and coatings, plumbing, and a variety of other materials. Once in the bloodstream, lead can cause damage to the brain, nervous system, and other body systems. Children are highly susceptible to the effects of lead. The entire Basin is in attainment for the Federal and State standards for lead. Particulate Matter. Particulate matter (PM) is the term used for a mixture of solid particles and liquid droplets found in the air. Coarse particles (all particles less than or equal to 10 micrometers in diameter, or PM10) derive from a variety of sources, including windblown dust and grinding operations. Fuel combustion and resultant exhaust from power plants and diesel buses and trucks are primarily responsible for fine particle (less than 2.5 microns in diameter, or PM2.5) levels. Fine particles can also be formed in the atmosphere through chemical reactions. PM10 can accumulate in the respiratory system and aggravate health problems such as asthma. The EPA’s scientific review concluded that PM2.5, which penetrate deeply into the lungs, are more likely than coarse particles to contribute to the health effects listed in a number of recently published community epidemiological studies at concentrations that extend well below those allowed by the current PM10 standards. These health effects include premature death and increased hospital admissions and emergency room visits (primarily the elderly and individuals with cardiopulmonary disease); increased respiratory symptoms and disease (children and individuals with cardiopulmonary disease such as asthma); decreased lung functions (particularly in children and individuals with asthma); and alterations in lung tissue and structure and in respiratory tract defense mechanisms. The entire Basin is a nonattainment area for the State PM10 and PM2.5 standard. The EPA has designated the Basin as an attainment area for PM10 and PM2.5. Reactive Organic Compounds. Reactive organic compounds (ROCs; also known as ROGs and volatile organic compounds [VOCs]) are formed from the combustion of fuels and the evaporation of organic solvents. ROCs are not defined as criteria pollutants, but are a prime component of the photochemical smog reaction. Consequently, ROC accumulates in the atmosphere more quickly during the winter when sunlight is limited and photochemical reactions are slower. There are no attainment designations for ROC. 3.2 LOCAL AIR QUALITY
SDAPCD, together with the ARB, maintains ambient air quality monitoring stations in the Basin. The air quality monitoring station closest to the site is the San Diego-Beardsley Street station. This station monitors all criteria pollutants. This monitoring station characterizes the air
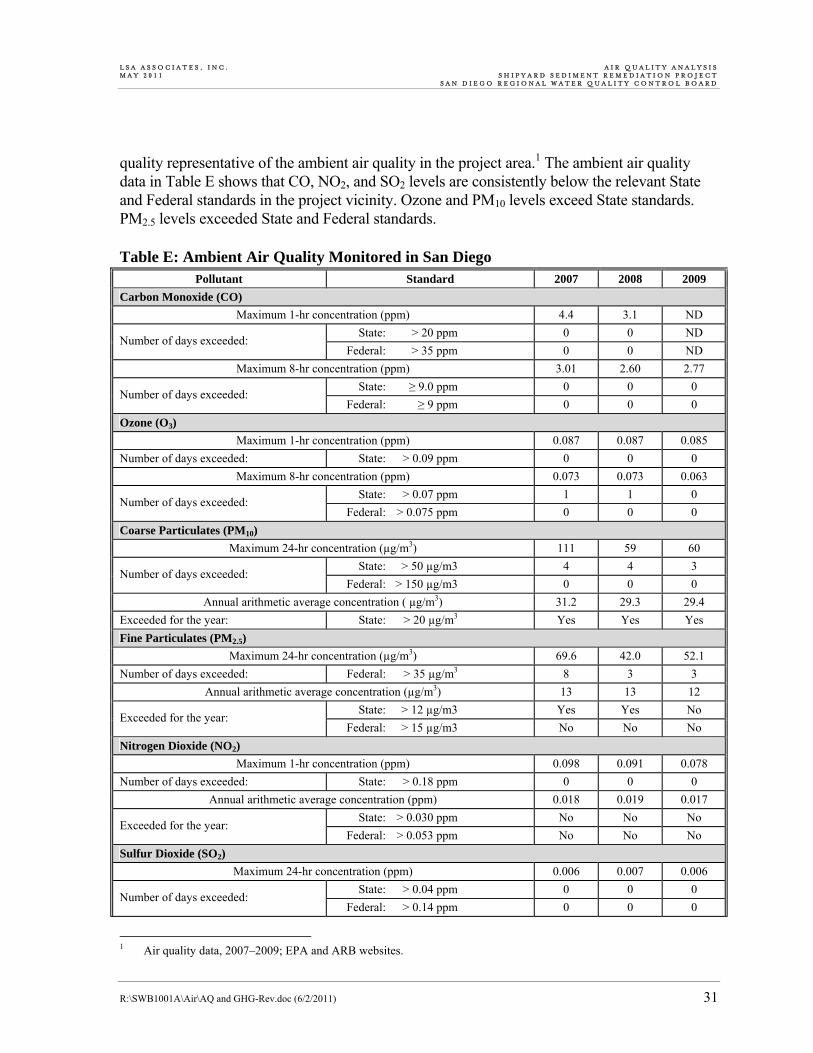
L S A A S S O C I A T E S , I N C . A I R Q U A L I T Y A N A L Y S I S M A Y 2 0 1 1 S H I P Y A R D S E D I M E N T R E M E D I A T I O N P R O J E C T S A N D I E G O R E G I O N A L W A T E R Q U A L I T Y C O N T R O L B O A R D
R:\SWB1001A\Air\AQ and GHG-Rev.doc (6/2/2011) 31
quality representative of the ambient air quality in the project area.1 The ambient air quality data in Table E shows that CO, NO2, and SO2 levels are consistently below the relevant State and Federal standards in the project vicinity. Ozone and PM10 levels exceed State standards. PM2.5 levels exceeded State and Federal standards. Table E: Ambient Air Quality Monitored in San Diego
Pollutant Standard 2007 2008 2009
Carbon Monoxide (CO) Maximum 1-hr concentration (ppm) 4.4 3.1 ND
State: > 20 ppm 0 0 ND Number of days exceeded:
Federal: > 35 ppm 0 0 ND Maximum 8-hr concentration (ppm) 3.01 2.60 2.77
State: ≥ 9.0 ppm 0 0 0 Number of days exceeded:
Federal: ≥ 9 ppm 0 0 0 Ozone (O3)
Maximum 1-hr concentration (ppm) 0.087 0.087 0.085 Number of days exceeded: State: > 0.09 ppm 0 0 0
Maximum 8-hr concentration (ppm) 0.073 0.073 0.063 State: > 0.07 ppm 1 1 0
Number of days exceeded: Federal: > 0.075 ppm 0 0 0
Coarse Particulates (PM10)
Maximum 24-hr concentration (µg/m3) 111 59 60 State: > 50 µg/m3 4 4 3
Number of days exceeded: Federal: > 150 µg/m3 0 0 0
Annual arithmetic average concentration ( µg/m3) 31.2 29.3 29.4 Exceeded for the year: State: > 20 µg/m3 Yes Yes Yes Fine Particulates (PM2.5)
Maximum 24-hr concentration (µg/m3) 69.6 42.0 52.1 Number of days exceeded: Federal: > 35 µg/m3 8 3 3
Annual arithmetic average concentration (µg/m3) 13 13 12 State: > 12 µg/m3 Yes Yes No
Exceeded for the year: Federal: > 15 µg/m3 No No No
Nitrogen Dioxide (NO2) Maximum 1-hr concentration (ppm) 0.098 0.091 0.078
Number of days exceeded: State: > 0.18 ppm 0 0 0 Annual arithmetic average concentration (ppm) 0.018 0.019 0.017
State: > 0.030 ppm No No No Exceeded for the year:
Federal: > 0.053 ppm No No No Sulfur Dioxide (SO2)
Maximum 24-hr concentration (ppm) 0.006 0.007 0.006 State: > 0.04 ppm 0 0 0
Number of days exceeded: Federal: > 0.14 ppm 0 0 0
1 Air quality data, 2007–2009; EPA and ARB websites.

L S A A S S O C I A T E S , I N C . A I R Q U A L I T Y A N A L Y S I S M A Y 2 0 1 1 S H I P Y A R D S E D I M E N T R E M E D I A T I O N P R O J E C T S A N D I E G O R E G I O N A L W A T E R Q U A L I T Y C O N T R O L B O A R D
R:\SWB1001A\Air\AQ and GHG-Rev.doc (6/2/2011) 32
Table E: Ambient Air Quality Monitored in San Diego
Pollutant Standard 2007 2008 2009
Annual arithmetic average concentration (ppm) 0.002 0.003 0.001 Exceeded for the year: Federal: > 0.030 ppm No No No
Sources: EPA and ARB websites: www.epa.gov/air/data/index.html and www.arb.ca.gov/adam/welcome.html. µg/m3 = micrograms per cubic meter ARB = California Air Resources Board EPA = United States Environmental Protection Agency ppm = parts per million ND = No Data
3.3 REGULATORY SETTINGS
3.3.1 Federal Regulations/Standards
Pursuant to the Federal Clean Air Act (CAA) of 1970, the EPA established national ambient air quality standards (NAAQS). The NAAQS were established for six major pollutants, termed “criteria” pollutants. Criteria pollutants are defined as those pollutants for which the Federal and State governments have established AAQS, or criteria, for outdoor concentrations in order to protect public health. Data collected at permanent monitoring stations are used by the EPA to classify regions as “attainment” or “nonattainment,” depending on whether the regions met the requirements stated in the primary NAAQS. Nonattainment areas are imposed with additional restrictions as required by the EPA. The EPA has designated the San Diego Association of Governments (SANDAG) as the Metropolitan Planning Organization (MPO) responsible for ensuring compliance with the requirements of the CAA for the Basin. The EPA established new national air quality standards for ground-level O3 and fine particulate matter in 1997. On May 14, 1999, the Court of Appeals for the District of Columbia Circuit issued a decision ruling that the CAA, as applied in setting the new public health standards for O3 and particulate matter, was unconstitutional as an improper delegation of legislative authority to the EPA. On February 27, 2001, the U.S. Supreme Court upheld the way the government sets air quality standards under the CAA. The court unanimously rejected industry arguments that the EPA must consider financial cost as well as health benefits in writing standards. The justices also rejected arguments that the EPA took too much lawmaking power from Congress when it set tougher standards for O3 and soot in 1997. Nevertheless, the Court threw out the EPA’s policy for implementing new O3 rules, saying that the agency ignored a section of the law that restricts its authority to enforce such rules. In April 2003, the EPA was cleared by the White House Office of Management and Budget (OMB) to implement the 8-hour ground-level O3 standard. The EPA issued the proposed rule implementing the 8-hour O3 standard in April 2003. The EPA completed final 8-hour

L S A A S S O C I A T E S , I N C . A I R Q U A L I T Y A N A L Y S I S M A Y 2 0 1 1 S H I P Y A R D S E D I M E N T R E M E D I A T I O N P R O J E C T S A N D I E G O R E G I O N A L W A T E R Q U A L I T Y C O N T R O L B O A R D
R:\SWB1001A\Air\AQ and GHG-Rev.doc (6/2/2011) 33
nonattainment status on April 15, 2004. The EPA revoked the 1-hour O3 standard on June 15, 2005, and lowered the 8-hour O3 standard from 0.08 ppm to 0.075 ppm on April 1, 2008. The EPA issued the final PM2.5 implementation rule in fall 2004. The EPA lowered the 24-hour PM2.5 standard from 65 to 35 µg/m3 and revoked the annual PM10 standard on December 17, 2006. The EPA issued final designations for the 2006 24-hour PM2.5 standard on December 12, 2008. The United States has historically had a voluntary approach to reducing GHG emissions. However, on April 2, 2007, the United States Supreme Court ruled that the EPA has the authority to regulate CO2 emissions under the CAA. While there currently are no adopted Federal regulations for the control or reduction of GHG emissions, the EPA commenced several actions in 2009 that are required to implement a regulatory approach to global climate change. On September 30, 2009, the EPA announced a proposal that focuses on large facilities emitting over 25,000 tons of GHG emissions per year. These facilities would be required to obtain permits that would demonstrate they are using the best practices and technologies to minimize GHG emissions.
On December 7, 2009, the EPA Administrator signed a final action under the CAA, finding that six GHGs (CO2, CH4, N2O, HFCs, PFCs, SF6) constitute a threat to public health and welfare, and that the combined emissions from motor vehicles cause and contribute to global climate change. This EPA action does not impose any requirements on industry or other entities. However, the findings are a prerequisite to finalizing the GHG emission standards for light-duty vehicles mentioned below. On April 1, 2010, the EPA and the Department of Transportation’s National Highway Traffic Safety Administration (NHTSA) announced a final joint rule to establish a national program consisting of new standards for model year 2012 through 2016 light-duty vehicles that will reduce GHG emissions and improve fuel economy. The EPA is finalizing the first-ever national GHG emissions standards under the CAA, and NHTSA is finalizing Corporate Average Fuel Economy (CAFE) standards under the Energy Policy and Conservation Act. The EPA GHG standards require these vehicles to meet an estimated combined average emissions level of 250 grams of CO2 per mile in model year 2016, equivalent to 35.5 miles per gallon (mpg). 3.3.2 State Regulations/Standards
In 1967, the California Legislature passed the Mulford-Carrell Act, which combined two Department of Health bureaus, the Bureau of Air Sanitation and the Motor Vehicle Pollution Control Board, to establish the ARB. Since its formation, the ARB has worked with the

L S A A S S O C I A T E S , I N C . A I R Q U A L I T Y A N A L Y S I S M A Y 2 0 1 1 S H I P Y A R D S E D I M E N T R E M E D I A T I O N P R O J E C T S A N D I E G O R E G I O N A L W A T E R Q U A L I T Y C O N T R O L B O A R D
R:\SWB1001A\Air\AQ and GHG-Rev.doc (6/2/2011) 34
public, the business sector, and local governments to find solutions to California’s air pollution problems. In a response to the transportation sector’s significant contribution to California’s CO2 emissions, AB 1493 (Pavley) was enacted on July 22, 2002. AB 1493 requires the ARB to set GHG emission standards for passenger vehicles and light-duty trucks (and other vehicles whose primary use is noncommercial personal transportation in the State) manufactured in 2009 and all subsequent model years. In setting these standards, the ARB considered cost effectiveness, technological feasibility, and economic impacts. The ARB adopted the standards in September 2004. When fully phased in, the near-term (2009 to 2012) standards would result in a reduction in GHG emissions of approximately 22 percent compared to the emissions from the 2002 fleet, while the midterm (2013 to 2016) standards would result in a reduction of approximately 30 percent. To set its own GHG emissions limits on motor vehicles, California must receive a waiver from the EPA. However, in December 2007, the EPA denied the request from California for the waiver. In January 2008, the California Attorney General filed a petition for review of the EPA’s decision in the Ninth Circuit Court of Appeals; however, no decision on that petition has been published as of January 2009. On January 26, 2009, President Barack Obama issued an Executive Memorandum directing the EPA to reassess its decision to deny the waiver and to initiate any appropriate action.1 On May 18, 2009, the President announced the enactment of a 35.5 mpg fuel economy standard for automobiles and light-duty trucks, which will begin to take effect in 2012. This standard is approximately the same standard that was proposed by California; therefore, the California waiver request was shelved.
The ARB identified particulate emissions from diesel-fueled engines (diesel particulate matter [DPM]) as toxic air contaminants (TACs) in August 1998. Following the identification process, the ARB was required by law to determine whether there is a need for further control. In September 2000, the ARB adopted the Diesel Risk Reduction Plan (Diesel RRP), which recommends many control measures to reduce the risks associated with DPM and to achieve goals of 75 percent DPM reduction by 2010 and 85 percent by 2020. In June 2005, Governor Schwarzenegger established California’s GHG emissions reduction targets in Executive Order (EO) S-3-05. This EO established the following goals for the State of California: GHG emissions should be reduced to 2000 levels by 2010; GHG emissions should be reduced to 1990 levels by 2020; and GHG emissions should be reduced to 80 percent below 1990 levels by 2050. California’s major initiative for reducing GHG emissions is outlined in AB 32, the “Global Warming Solutions Act,” passed by the California State legislature on August 31, 2006. AB 32 will require the ARB to:
1 President Barack Obama. 2009. Memorandum to the Administrator of the EPA. State of California Request for Waiver
Under 42 United States Code (U.S.C.) 7543(b), the Clean Air Act. January 26.

L S A A S S O C I A T E S , I N C . A I R Q U A L I T Y A N A L Y S I S M A Y 2 0 1 1 S H I P Y A R D S E D I M E N T R E M E D I A T I O N P R O J E C T S A N D I E G O R E G I O N A L W A T E R Q U A L I T Y C O N T R O L B O A R D
R:\SWB1001A\Air\AQ and GHG-Rev.doc (6/2/2011) 35
• Establish a statewide GHG emissions cap for 2020, based on 1990 emissions, by January 1, 2008;
• Adopt mandatory reporting rules for significant sources of GHG emissions by January 1, 2008;
• Adopt an emissions reduction plan by January 1, 2009, indicating how emissions reductions will be achieved via regulations, market mechanisms, and other actions; and
• Adopt regulations to achieve the maximum technologically feasible and cost-effective reductions of GHGs by January 1, 2011.
The ARB has established the level of GHG emissions in 1990 at 427 MMTCO2e. The emissions target of 427 MMT requires the reduction of 169 MMT from the State’s projected business-as-usual 2020 emissions of 596 MMT. AB 32 requires the ARB to prepare a Scoping Plan that outlines the main State strategies for meeting the 2020 deadline and to reduce GHGs that contribute to global climate change. The Scoping Plan was approved by the ARB on December 11, 2008, and includes measures to address GHG emission reduction strategies related to energy efficiency, water use, and recycling and solid waste, among other measures.1 Emission reductions that are projected to result from the recommended measures in the Scoping Plan are expected to total 174 MMTCO2e, which would allow California to attain the emissions goal of 427 MMTCO2e by 2020. The Scoping Plan includes a range of GHG reduction actions that may include direct regulations, alternative compliance mechanisms, monetary and non-monetary incentives, voluntary actions, and market-based mechanisms such as a cap-and-trade system. The Scoping Plan, even after Board approval, remains a recommendation. The measures in the Scoping Plan will not be binding until after they are adopted through the normal rulemaking process. The ARB rule-making process includes preparation and release of each of the draft measures, public input through workshops, and a public comment period, followed by an ARB Board hearing and rule adoption. In addition to reducing GHG emissions to 1990 levels by 2020, AB 32 directed the ARB and the newly created Climate Action Team (CAT)2 to identify a list of “discrete early action GHG reduction measures” that can be adopted and made enforceable by January 1, 2010. On January 18, 2007, Governor Schwarzenegger signed EO S-1-07, further solidifying California’s dedication to reducing GHGs by setting a new Low Carbon Fuel Standard. This EO sets a target to reduce the carbon intensity of California transportation fuels by at least 10 percent by 2020 and directs the ARB to consider the Low Carbon Fuel Standard as a discrete early action measure.
1 ARB. 2008. Climate Change Proposed Scoping Plan: a Framework for Change. October. 2 CAT is a consortium of representatives from State agencies who have been charged with coordinating and
implementing GHG emission reduction programs that fall outside of ARB’s jurisdiction.
L S A A S S O C I A T E S , I N C . A I R Q U A L I T Y A N A L Y S I S M A Y 2 0 1 1 S H I P Y A R D S E D I M E N T R E M E D I A T I O N P R O J E C T S A N D I E G O R E G I O N A L W A T E R Q U A L I T Y C O N T R O L B O A R D
R:\SWB1001A\Air\AQ and GHG-Rev.doc (6/2/2011) 36
In June 2007, the ARB approved a list of 37 early action measures, including three discrete early action measures (Low Carbon Fuel Standard, Restrictions on High Global Warming Potential Refrigerants, and Landfill Methane Capture). Discrete early action measures are measures that were required to be adopted as regulations and made effective no later than January 1, 2010, the date established by Health and Safety Code (HSC) Section 38560.5. The ARB adopted additional early action measures in October 20071 that tripled the number of discrete early action measures. These measures relate to truck efficiency, port electrification, reduction of perfluorocarbons from the semiconductor industry, reduction of propellants in consumer products, proper tire inflation, and SF6 reductions from the non-electricity sector. The combination of early action measures is estimated to reduce State-wide GHG emissions by nearly 16 MMT.2 To assist public agencies in the mitigation of GHG emissions or analyzing the effects of GHGs under CEQA, including the effects associated with transportation and energy consumption, Senate Bill (SB) 97 (Chapter 185, 2007) requires the Governor’s Office of Planning and Research (OPR) to develop CEQA guidelines on how to minimize and mitigate a project’s GHG emissions. The OPR prepared, developed, and transmitted these guidelines in May 2009 the Resources Agency certified and adopted them December 30, 2009, and they became effective on March 18, 2010. The amendments encourage lead agencies to consider many factors in performing a CEQA analysis, but preserve the discretion granted by CEQA to lead agencies in making their own determinations. SB 375, signed into law on October 1, 2008, is intended to enhance the ARB’s ability to reach AB 32 goals by directing the ARB to develop regional GHG emissions reduction targets to be achieved within the automobile and light truck sectors for 2020 and 2035. The ARB will work with California’s 18 metropolitan planning organizations to align their regional transportation, housing, and land use plans and prepare a “Sustainable Communities Strategy” to reduce the number of vehicle miles traveled in their respective regions and demonstrate the region’s ability to attain its GHG reduction targets. Additionally, SB 375 provides incentives for creating attractive, walkable, and sustainable communities and revitalizing existing communities. The bill exempts home builders from certain CEQA requirements if they build projects consistent with the new sustainable community strategies. It will also encourage the development of more alternative transportation options to promote healthy lifestyles and reduce traffic congestion.
1 ARB. 2007. Expanded List of Early Action Measures to Reduce Greenhouse Gas Emissions in California
Recommended for Board Consideration. October. 2 ARB. 2007. “ARB approves tripling of early action measures required under AB 32.” News Release 07-46.
http://www.arb.ca.gov/newsrel/nr102507.htm. October 25.
L S A A S S O C I A T E S , I N C . A I R Q U A L I T Y A N A L Y S I S M A Y 2 0 1 1 S H I P Y A R D S E D I M E N T R E M E D I A T I O N P R O J E C T S A N D I E G O R E G I O N A L W A T E R Q U A L I T Y C O N T R O L B O A R D
R:\SWB1001A\Air\AQ and GHG-Rev.doc (6/2/2011) 37
3.3.3 Regional Air Quality Planning Framework
The 1976 Lewis Air Quality Management Act established the SDAPCD and other air districts throughout the State. The Federal CAA Amendments of 1977 required that each state adopt an implementation plan outlining pollution control measures to attain the Federal standards in nonattainment areas of the state. The ARB is responsible for incorporating air quality management plans for local air basins into a State Implementation Plan (SIP) for EPA approval. Significant authority for air quality control within them has been given to local air districts that regulate stationary source emissions and develop local nonattainment plans. 3.3.4 Regional Air Quality Management Plan
The SDAPCD and SANDAG are responsible for formulating and implementing air quality plans for the Basin. Regional air quality plans were adopted for the Basin for 1979, 1982, 1989, 1991, 1994, 1997, 2001, and 2004. The San Diego Air Basin 2009 Triennial Regional Air Quality Strategy Revision (RAQS) was adopted by the SDAPCD on April 22, 2009.

L S A A S S O C I A T E S , I N C . A I R Q U A L I T Y A N A L Y S I S M A Y 2 0 1 1 S H I P Y A R D S E D I M E N T R E M E D I A T I O N P R O J E C T S A N D I E G O R E G I O N A L W A T E R Q U A L I T Y C O N T R O L B O A R D
R:\SWB1001A\Air\AQ and GHG-Rev.doc (6/2/2011) 38
4.0 METHODOLOGY
This air quality assessment includes estimated emissions associated with short-term construction and long-term operation of the proposed project. Criteria pollutants with regional impacts would be emitted by project-related vehicular trips, as well as by emissions associated with stationary sources used on site. The net increase in pollutant emissions determines the significance and impact on regional air quality as a result of the proposed project. The results also allow the local government to determine whether the proposed project will deter the region from achieving the goal of reducing pollutants in accordance with the air quality plan in order to comply with Federal and State ambient air quality standards. 4.1 THRESHOLDS OF SIGNIFICANCE
4.1.1 Criteria Pollutants with Regional Effects
The SDAPCD has not established guidelines on emissions thresholds for CEQA purposes. Therefore, the following thresholds established in the City of San Diego California Environmental Quality Act Significance Determination Thresholds (January 2011) (City Guidelines) were used. The thresholds listed in the City’s Guidelines are based on the SDAPCD’s stationary source emission thresholds. The City of National City has not established air quality CEQA thresholds. Therefore, the San Diego thresholds were applied to the entire project site. Based on the criteria set forth in the City Guidelines, a project would have a significant impact with regard to construction or operational emissions if it would exceed any of the following: • 137 pounds per day (lbs/day) of VOCs;
• 250 lbs/day of NOX;
• 250 lbs/day of SOX;
• 550 lbs/day of CO; and/or
• 100 lbs/day of PM10;
The Federal Clean Air Act requires EPA to set the health-based or “primary” standards at a level judged to be “requisite to protect the public health with an adequate margin of safety” and establish secondary standards that are “requisite” to protect public welfare from “any known or anticipated adverse effects associated with the pollutant in the ambient air” including effects on vegetation, soils, water, wildlife, buildings and national monuments, and

L S A A S S O C I A T E S , I N C . A I R Q U A L I T Y A N A L Y S I S M A Y 2 0 1 1 S H I P Y A R D S E D I M E N T R E M E D I A T I O N P R O J E C T S A N D I E G O R E G I O N A L W A T E R Q U A L I T Y C O N T R O L B O A R D
R:\SWB1001A\Air\AQ and GHG-Rev.doc (6/2/2011) 39
visibility. Therefore, the emissions thresholds were established based on the attainment status of the air basin in regard to air quality standards for specific criteria pollutants. Because the concentration standards were set at a level that protects public health with an adequate margin of safety, these emissions thresholds are regarded as conservative and would overstate an individual project’s contribution to health risks.
If in conjunction with other past, present, or reasonably foreseeable future projects, the proposed project’s incremental contribution to impacts would exceed the daily emission thresholds identified above, the project may be considered to have a cumulatively significant air quality impact. 4.1.2 Local Microscale Concentrations Standards
The significance of localized project impacts under CEQA depends on whether ambient CO levels in the vicinity of the project are above or below State and Federal CO AAQS. Following are the local emission concentration standards for CO: • California State 1-hour CO standard of 20.0 ppm; and/or
• California State 8-hour CO standard of 9.0 ppm.
4.1.3 Health Risk Assessment Thresholds
For pollutants without defined significance standards or air contaminants not covered by the standard criteria cited above, the definition of substantial pollutant concentrations varies. For TACs, “substantial” is taken to mean that the individual cancer risk exceeds a threshold considered to be a prudent risk management level. If best available control technology for toxics (T-BACT) has been applied, the individual cancer risk to the maximum exposed individual (MEI) must not exceed 10 in 1 million in order for an impact to be determined not to be significant. Airborne impacts are also derived from materials considered to be a nuisance for which there may not be associated standards. Odors or the deposition of large-diameter dust particles outside the PM10 size range would be included in this category. The following limits for maximum individual cancer risk (MICR), cancer burden, and the non-cancer acute and chronic hazard index (HI) from project emissions of TACs are considered appropriate for use in determining the health risk for projects in the Basin: • Maximum Individual Cancer Risk: MICR is the estimated probability of an MEI
contracting cancer as a result of exposure to TACs over a period of 70 years for residential and 40 years for worker receptor locations. The MICR calculations include multi-pathway consideration when applicable.

L S A A S S O C I A T E S , I N C . A I R Q U A L I T Y A N A L Y S I S M A Y 2 0 1 1 S H I P Y A R D S E D I M E N T R E M E D I A T I O N P R O J E C T S A N D I E G O R E G I O N A L W A T E R Q U A L I T Y C O N T R O L B O A R D
R:\SWB1001A\Air\AQ and GHG-Rev.doc (6/2/2011) 40
The cumulative increase in MICR that is the sum of the calculated MICR values for all TACs emitted from the project would be considered significant if it would result in an increased MICR greater than 10 in 1 million (1.0 × 10⁻⁵) at any sensitive receptor location, assuming the project is constructed with T-BACT.
• Chronic Hazard Index: Chronic HI is the ratio of the estimated long-term level of exposure to a TAC for a potential MEI to its chronic reference exposure level. The chronic HI calculations include multi-pathway consideration when applicable.
The project would be considered significant if the cumulative increase in total chronic HI for any target organ system due to total emissions from the project would exceed 1.0 at any receptor location.
• Acute Hazards Index: Acute HI is the ratio of the estimated maximum 1-hour concentration of a TAC for a potential MEI to its acute reference exposure level.
The project would be considered significant if the cumulative increase in total acute HI for any target organ system due to total emissions from the project would exceed 1.0 at any receptor location.
4.2 GREENHOUSE GAS EMISSIONS/GLOBAL CLIMATE CHANGE
Currently, neither the CEQA statutes, OPR guidelines, nor the CEQA Guidelines prescribe specific quantitative thresholds of significance or a particular methodology for performing an impact analysis. Significance criteria are left to the judgment and discretion of the Lead Agency. The discussion below provides an overview of the regulatory considerations and methodological approach for this EIR. In June 2008, OPR issued a Technical Advisory titled “CEQA and Climate Change: Addressing Climate Change through California Environmental Quality Act (CEQA) Review.” The recommended approach for GHG analysis included in the Governor’s OPR June 2008 Technical Advisory (TA) is to: (1) identify and quantify GHG emissions, (2) assess the significance of the impact on GCC, and (3) if significant, identify alternatives and/or mitigation measures to reduce the impact below significance.1 The June 2008 OPR guidance provides some additional direction regarding planning documents as follows: “CEQA can be a more effective tool for GHG emissions analysis and mitigation if it is supported and supplemented by sound development policies and practices that will reduce GHG emissions on a broad planning scale and that can provide the basis for a programmatic approach to project-specific CEQA analysis and mitigation. For local government Lead Agencies, adoption of General Plan policies and certification of General Plan EIRs that analyze broad jurisdiction-wide impacts of GHG emissions can be part of an effective
1 State of California, 2008. Governor’s Office of Planning and Research. CEQA and Climate Change: Addressing
Climate Change through California Environmental Quality Act Review. June 19.

L S A A S S O C I A T E S , I N C . A I R Q U A L I T Y A N A L Y S I S M A Y 2 0 1 1 S H I P Y A R D S E D I M E N T R E M E D I A T I O N P R O J E C T S A N D I E G O R E G I O N A L W A T E R Q U A L I T Y C O N T R O L B O A R D
R:\SWB1001A\Air\AQ and GHG-Rev.doc (6/2/2011) 41
strategy for addressing cumulative impacts and for streamlining later project-specific CEQA reviews.” The ARB released a preliminary draft staff proposal in October 2008 that included initial suggestions for significance criteria related to industrial, commercial, and residential projects. Although the ARB anticipated adopting the significance criteria in 2009 to allow coordination with OPR’s efforts on GCC, no formal announcement of adoption has been made.1 Currently, it appears that the ARB is deferring action on the adoption of final thresholds. AB 32 does not prohibit all new GHG emissions; rather, it requires a reduction in statewide emissions to a given level. Thus, AB 32 recognizes that GHG emissions will continue to occur and that increases will result from certain activities, but that emissions reductions must be achieved overall. Moreover, if all economic development were to cease, the State would very likely be unable to fund the very measures that are needed to combat GCC. For the purpose of this technical analysis, the concept of CO2e is used to describe how much global warming a given type and amount of GHG may cause, using the functionally equivalent amount or concentration of CO2 as the reference. Individual GHGs have varying global warming potentials and atmospheric lifetimes. The CO2e is a consistent methodology for comparing GHG emissions since it normalizes various GHG to the same metric. The reference gas is CO2, which has a global warming potential equal to 1. The equation below provides the basic calculation required to determine CO2e from the total mass of a given GHG using the global warming potentials published by the Intergovernmental Panel on Climate Change (IPCC).
Metric Tons of CO2e = Metric Tons of GHG × GWP Where: CO2e = carbon dioxide equivalent GHG = greenhouse gas GWP = global warming potential This method was used to evaluate GHG emissions during construction and operation of the proposed project. According to the California Greenhouse Gas Inventory,2 in the years from 2000 to 2008, CO2 comprised approximately 88 percent of total statewide GHG emissions, CH4 approximately 6 percent, and N2O approximately 3 percent, leaving about 3 percent for all the other GHGs combined. Therefore, for this analysis, CO2, CH4, and N2O are considered due to
1 California, State of, 2008. California Air Resources Board (ARB). Preliminary Draft Staff Proposal: Recommended
Approaches for Setting Interim Thresholds for Greenhouse Gases Under the California Environmental Quality Act. October 24.
2 http://www.arb.ca.gov/cc/inventory/data/data.htm

L S A A S S O C I A T E S , I N C . A I R Q U A L I T Y A N A L Y S I S M A Y 2 0 1 1 S H I P Y A R D S E D I M E N T R E M E D I A T I O N P R O J E C T S A N D I E G O R E G I O N A L W A T E R Q U A L I T Y C O N T R O L B O A R D
R:\SWB1001A\Air\AQ and GHG-Rev.doc (6/2/2011) 42
the relatively large contribution of these gases in comparison to other GHGs produced during the project construction and operation phases. The GHG emission estimates were calculated using URBEMIS 2007. As described above, URBEMIS stands for “Urban Emissions,” and URBEMIS 2007 is an air quality modeling program that estimates air pollution emissions in pounds per day or tons per year for various land uses, area sources, construction projects, and project operations. The URBEMIS 2007 model uses the ARB EMFAC2007 model for on-road vehicle emissions and the OFFROAD2007 model for off-road vehicle emissions. URBEMIS 2007 includes CO2 emissions factors, the principal GHG constituent. The GHG emissions resulting from increased electricity demand are modeled using GHG emissions factors from the United States Energy Information Administration. The GHG emissions resulting from the energy used for water delivery, treatment, and use are modeled using GHG emissions factors from the California Energy Commission (CEC). The GHG emissions resulting from solid waste disposal are modeled using GHG emissions factors from the California Integrated Waste Management Board, recently renamed the Department of Resources Recycling and Recovery, or CalRecycle. The analysis included in this report is the result of a thorough investigation of the proposed project’s impact on GCC, including a review of EO S-3-05, AB 32, and the legislative intent behind AB 32, as well as an extensive review of scientific literature regarding GCC. Every effort will be made to maximize the disclosure of information to the public, fairly present the project’s potential for significant adverse effects on GCC, and identify techniques to minimize any such effects, in light of the fact that there are no generally accepted or adopted numeric standards for GHG emissions. On June 19, 2008, the Governor’s OPR issued a memorandum titled “CEQA and Climate Change: Addressing Climate Change through California Environmental Quality Act Review” (the Memorandum).
The Memorandum is intended to provide professional planners, land use officials and CEQA practitioners with guidance on how to approach GCC analysis and GHG emissions in an EIR, pending OPR’s adoption of amendments to the CEQA Guidelines that address the topic. OPR will develop, certify, and adopt amendments to the CEQA Guidelines that address GCC on or before January 1, 2010, pursuant to SB 97 (Dutton 2007). Even in the absence of clearly defined thresholds for GHG emissions, the law requires that such emissions from CEQA projects be disclosed and mitigated to the extent feasible whenever the Lead Agency determines that a project contributes to a significant cumulative GCC impact. Until OPR establishes thresholds of significance for GHG emissions, it recommends approaching a GCC analysis as follows: 1. Identify and quantify the GHG emissions of the project;

L S A A S S O C I A T E S , I N C . A I R Q U A L I T Y A N A L Y S I S M A Y 2 0 1 1 S H I P Y A R D S E D I M E N T R E M E D I A T I O N P R O J E C T S A N D I E G O R E G I O N A L W A T E R Q U A L I T Y C O N T R O L B O A R D
R:\SWB1001A\Air\AQ and GHG-Rev.doc (6/2/2011) 43
2. Assess the significance of the impact on GCC; and
3. If impacts are found to be significant, identify alternatives and/or mitigation measures that will reduce impacts below a level of significance.
When assessing a project’s GHG emissions, Lead Agencies must describe the existing environmental conditions or setting without the project and determine what constitutes a significant impact “consistent with available evidence and current CEQA practice.” Not every project that emits GHGs will necessarily contribute to a significant cumulative impact on the environment. If it is determined a project will contribute to a significant GHG impact, mitigation should be implemented. This report identifies and quantifies the GHG emissions of the proposed project. Moreover, it assesses the project’s potential to result in a significant GHG impact by determining its consistency with strategies identified in the March 2006 CAT Report to the Governor. The CAT Report is cited by the OPR Technical Advisory Memorandum as a reference and/or information source for Lead Agencies determining what constitutes a significant impact. Accordingly, this method of determining significance is consistent with recent OPR recommendations. As described above and in consistency with OPR recommendations, the methodology used in the EIR to analyze the project’s potential effect on global warming includes a calculation of GHG emissions. The purpose of calculating the emissions is for information purposes, as there is no quantifiable emissions threshold. Rather, the project’s incremental contribution to GCC would be considered cumulatively significant if, due to the size or nature of the proposed project, it would generate a substantial increase in GHG emissions relative to existing conditions. The project’s potential for generating a substantial increase in GHG emissions relative to existing conditions is based on a cooperative analysis of the project against the emissions reduction strategies contained in the California CAT Report to the Governor. If it is determined that the proposed project is compatible or consistent with the applicable CAT strategies, the project’s cumulative impact on global climate change is considered less than significant.”

L S A A S S O C I A T E S , I N C . A I R Q U A L I T Y A N A L Y S I S M A Y 2 0 1 1 S H I P Y A R D S E D I M E N T R E M E D I A T I O N P R O J E C T S A N D I E G O R E G I O N A L W A T E R Q U A L I T Y C O N T R O L B O A R D
R:\SWB1001A\Air\AQ and GHG-Rev.doc (6/2/2011) 44
5.0 IMPACTS AND MITIGATION
Air pollutant emissions associated with the project would occur over the short term from construction activities, such as fugitive dust from site preparation and grading, and emissions from equipment exhaust. Implementation of the proposed project would not alter the long-term operations of any nearby land uses and no increases in traffic would occur after construction activities associated with the proposed project are completed. Therefore, no changes to the long-term emissions are anticipated. 5.1 CONSTRUCTION IMPACTS
Construction activities produce combustion emissions from various sources such as utility engines, on-site heavy-duty construction vehicles, equipment hauling materials to and from the site, and motor vehicles transporting the construction crew. Exhaust emissions from construction activities envisioned on site would vary daily as construction activity levels change. The use of construction equipment on site would result in localized exhaust emissions. 5.1.1 Equipment Exhaust and Related Construction Activities
The activities required to complete the dredging have been split into multiple tasks. The maximum daily exhaust emissions generated within each of the construction tasks are listed in Table F and detailed in Appendix A. The emissions listed in Table F include the truck trips required to haul the dredge material to Otay Landfill and Kettleman Hills Landfill. An average trip length of 100 miles was assumed for the haul trips, based on a round trip distance of 30 miles to the Otay Landfill and 480 miles to the Kettleman Landfill, and the anticipated 85–15 percent split in landfill destination. Table F: Construction Emissions by Task (lb/day)
Task CO ROCs NOX SOX PM10 PM2.5 CO2
Debris and Pile Removal 53.8 8.2 148.4 5.2 5.4 4.7 10,846.8 Dredging of Project Site 70.0 14.6 340.7 8.6 11.3 10.3 15,171.9 Landside Staging Area, Pad Construction 83.2 14.3 163.8 20.3 8.7 7.6 14,045.8 Landside Staging Area, Operations 168.6 22.4 333.8 7.7 12.6 11.0 36,201.1 Covering of Sediment Near Structures 30.9 5.5 105.2 3.9 3.9 3.5 5,747.9 Source: LSA Associates, Inc., March 2011.

L S A A S S O C I A T E S , I N C . A I R Q U A L I T Y A N A L Y S I S M A Y 2 0 1 1 S H I P Y A R D S E D I M E N T R E M E D I A T I O N P R O J E C T S A N D I E G O R E G I O N A L W A T E R Q U A L I T Y C O N T R O L B O A R D
R:\SWB1001A\Air\AQ and GHG-Rev.doc (6/2/2011) 45
Throughout the construction schedule, the various construction tasks will overlap. Table G lists the maximum emissions that would be generated on a peak construction day. Table G shows that construction equipment/vehicle emissions would exceed the City’s daily emissions threshold for NOX.
Table G: Peak Daily Construction Emissions (lbs/day)
Activity CO ROCs NOX SOX PM10 PM2.5 CO2
Pad Construction 83.2 14.3 163.8 20.3 8.7 7.6 14,045.8 Dredging/Landside Operations 323.3 50.7 928.1 25.4 33.2 29.5 67,967.7 San Diego Emissions Threshold 550 137 250 250 100 NA1 NA
Exceed Significance? NO NO YES NO NO NO NA Source: LSA Associates, Inc., March 2011. 1 No threshold has been established. Note: Bold face numbers indicate emissions exceeding San Diego City emissions threshold. CO = carbon monoxide PM2.5 = particulate matter less than 2.5 microns in size CO2 = carbon dioxide ROCs = reactive organic compounds NOX = nitrogen oxides PM10 = particulate matter less than 10 microns in size SOX = sulfur oxides
5.1.2 Fugitive Dust
Fugitive dust emissions are generally associated with land clearing, exposure, and cut-and-fill operations. Construction of the proposed project improvements largely involves dredging, handling, and removal of wet material. As a result, little fugitive dust is expected to be generated by these operations. However, fugitive dust could be generated as construction equipment or trucks travel on and off the construction site and during the pad construction. These emissions will be relatively small, as shown in previously referenced Tables F and G. 5.1.3 Odors
Heavy-duty equipment in the project area during construction would emit odors. These odors would be limited to the time that construction equipment is operating during the construction period for the project. Mitigation Measure 1 requires that all construction equipment be maintained in accordance with the manufacturer’s specifications. Mitigation Measure 2 requires that all construction equipment be turned off when not in use. These measures reduce impacts associated with objectionable odors from the operation of diesel-powered construction equipment. In addition, the closest sensitive receptors to the project site are residences located approximately 300 feet from the Staging Areas. Therefore, odors from construction equipment exhaust would be less than significant after mitigation. During the dredging phases of the proposed project, the dredged materials will be spread out on site to dry before being hauled off site. It is anticipated that the dredged sediment will contain organic materials and that the decomposition of the organic matter when exposed to
L S A A S S O C I A T E S , I N C . A I R Q U A L I T Y A N A L Y S I S M A Y 2 0 1 1 S H I P Y A R D S E D I M E N T R E M E D I A T I O N P R O J E C T S A N D I E G O R E G I O N A L W A T E R Q U A L I T Y C O N T R O L B O A R D
R:\SWB1001A\Air\AQ and GHG-Rev.doc (6/2/2011) 46
air may generate unpleasant odors. Therefore, the dredged material may result in odor impacts at the adjacent and nearby sensitive land uses. Implementation of Mitigation Measure 10 requires the application of a mixture of Simple Green and water to the excavated sediment as part of odor management. Simple Green accelerates the decomposition process and will have the overall result of shortening the duration of odor emissions. Potential odor impacts are expected to be less than significant for residences due to their distance from the project site. However, since it is difficult to predict the nature and duration of odor emissions from decomposition, it is concluded that the odor impacts would remain significant and unavoidable for the closest sensitive receptors, the park uses adjacent to the project site.
5.2 LONG-TERM PROJECT-RELATED EMISSIONS IMPACTS
Long-term air pollutant emission impacts are associated with any change in permanent use of the project site by on-site stationary and off-site mobile sources that substantially increase emissions. Stationary source emissions include those associated with electricity consumption and natural gas usage. Mobile source emissions would result from vehicle trips associated with the proposed project. The proposed project would not result in any long-term on-site stationary sources and would not change the number of long-term off-site vehicle trips. Therefore, no emissions were calculated for the proposed project from long-term mobile source or long-term stationary sources. The project’s air quality impact would be less than significant because there would be no increase in stationary or mobile source emissions. 5.2.1 CO Hot-Spot Analysis
The primary mobile source pollutant of local concern is CO, which is a direct function of vehicle idling time caused by traffic conditions. CO transport is extremely limited; it disperses rapidly with distance from the source under normal meteorological conditions. Under certain extreme meteorological conditions, CO concentrations proximate to a congested roadway or intersection may reach unhealthy levels affecting local sensitive receptors (residents, schoolchildren, the elderly, hospital patients, etc.). Typically, high CO concentrations are associated with roadways or intersections operating at unacceptable levels of service or with extremely high traffic volumes. In areas with high ambient CO concentrations, modeling of CO concentrations is recommended in determining a project’s effect on local CO levels. Because the proposed project would not change the number of long-term off-site vehicle trips, no significant CO contributions would occur in the project vicinity. Therefore, no CO “hot spots” are expected, and modeling of CO emissions is not necessary. 5.3 HEALTH RISK ASSESSMENT
A health risk assessment (HRA) is included due to the close proximity of current residents to the proposed truck hauling routes that will be exposed to diesel-powered haul trucks,

L S A A S S O C I A T E S , I N C . A I R Q U A L I T Y A N A L Y S I S M A Y 2 0 1 1 S H I P Y A R D S E D I M E N T R E M E D I A T I O N P R O J E C T S A N D I E G O R E G I O N A L W A T E R Q U A L I T Y C O N T R O L B O A R D
R:\SWB1001A\Air\AQ and GHG-Rev.doc (6/2/2011) 47
potentially resulting in a significant exposure. An HRA is a process used to estimate the increased risk of health problems in people who are exposed to toxic substances. An HRA combines results of studies on the health effects of various animal and human exposures to toxic air pollutants with results of studies that estimate the level of people’s exposures at different distances from the sources of the pollutants. This section examines the short-term and long-term potential health effects from project-related emissions of TAC on existing surrounding sensitive receptors, including single- and multifamily residences. The only TAC known to be released from the proposed dredging operations in potentially significant quantities is contained in the exhaust of project-related haul trucks. This assessment focuses on the risks from diesel exhaust. For the purposes of an HRA, short-term emissions are of concern for analyzing acute health impacts, and long-term emissions are of concern for analyzing chronic and carcinogenic health impacts. The proposed project includes treatment of the dredged material with binding agents to minimize the spread of contaminants to the surrounding environment during dredging and material handling operations; therefore, it is not expected that there will be any measurable increase to the health risk levels at residences near to the dredging or material staging areas.
A screening-level single pathway analysis has been conducted, analyzing the inhalation pathway. This technique was chosen as recommended in the Office of Environmental Health and Hazards Assessment (OEHHA) Air Toxic Hot Spots Program Risk Assessment Guidelines (August 2003), Appendix D, “Risk Assessment Procedures to Evaluate Particulate Emissions from Diesel-Fueled Vehicles.” For risk assessment procedures, the OEHHA specifies that the surrogate for whole diesel exhaust is diesel particulate. In accordance with OEHHA’s revised health risk assessment guidelines (specifically, OEHHA’s Technical Support Document [TSD] for Cancer Potency Factors, May 2009), calculation of cancer risk estimates should also incorporate age sensitivity factors (ASFs). The revised TSD for Cancer Potency Factors provides updated calculation procedures used to consider the increased susceptibility of infants and children to carcinogens, as compared to adults. The updated calculation procedure includes the use of age-specific weighting factors in calculating cancer risks from exposures of infants, children and adolescents, to reflect their anticipated special sensitivity to carcinogens. OEHHA recommends weighting cancer risk by a factor of 10 for exposures that occur from the third trimester of pregnancy to 2 years of age, and by a factor of 3 for exposures that occur from 2 years through 15 years of age. These weighting factors should be applied to all carcinogens. For estimating cancer risk for residential receptors, the incorporation of the ASFs results in a cancer risk adjustment factor (CRAF) of 1.7. The project-related vehicle emissions were characterized for the HRA analysis. Once hauling of the dried dredged material commences, it is anticipated that there would be a total of 100 truck trips per day (50 in each direction), regardless of which staging area is selected. Even though these trucks could be of various sizes, for the HRA, it was assumed that these trucks

L S A A S S O C I A T E S , I N C . A I R Q U A L I T Y A N A L Y S I S M A Y 2 0 1 1 S H I P Y A R D S E D I M E N T R E M E D I A T I O N P R O J E C T S A N D I E G O R E G I O N A L W A T E R Q U A L I T Y C O N T R O L B O A R D
R:\SWB1001A\Air\AQ and GHG-Rev.doc (6/2/2011) 48
were all the type of truck that resulted in the greatest exhaust emissions and highest health risk levels. The ARB model, EMFAC2007, was used to determine diesel truck PM10 emission factors for the haul trucks. This HRA is examining long-term, 70-year carcinogenic and chronic effects. Because the HRA model only allows for a single emission rate for the entire period, a median set of emission factors for the 70-year period is typically used. However, to be conservative in this HRA, emissions factors for existing trucks were used. For the purposes of this analysis, three different truck haul routes were modeled, one for Staging Areas 1 through 4 as 8 discrete sources1 located along 28th Street and Boston Avenue for access to I-5, a second for the same Staging Areas 1 through 4 as 12 discrete sources located along Harbor Drive and Civic Center Drive, and a third for Staging Area 5 as 11 discrete sources located along Bay Marina Drive and 32nd Street, also for access to I-5. Model receptors were placed in key locations along the truck haul routes to characterize the risk levels to existing residents. Meteorological data representing the conditions at the project site were obtained using data from the San Diego Lindberg Field meteorological monitoring station. The meteorological data indicate a frequent presence of wind at the project site from the west-northwest, with speeds up to 20 miles per hour. Appendix B includes the windrose figure. Appendix B includes portions of the AERMOD output file showing all model inputs and important outputs. The HARP model output listing the modeled health risks for the proposed project for all receptors can also be found in Appendix B. 5.3.1 Carcinogenic and Chronic Project-Related Emission Impacts
Tables H through J show the results for carcinogenic and chronic impacts for each truck route. Results of the analysis indicate that the MEI inhalation cancer risk associated with living alongside any of the haul truck routes for 70 years from the proposed project haul truck exhaust would be 0.49 in 1 million, less than the threshold of 10 in 1 million. Actual exposure would be limited to the approximately 12.5-month dredging and hauling period. The maximum chronic Hazard Index would be 0.000179, which is well below the threshold of 1.0.
1 Discrete sources are emissions sources used in the air dispersion modeling to characterize roadways.
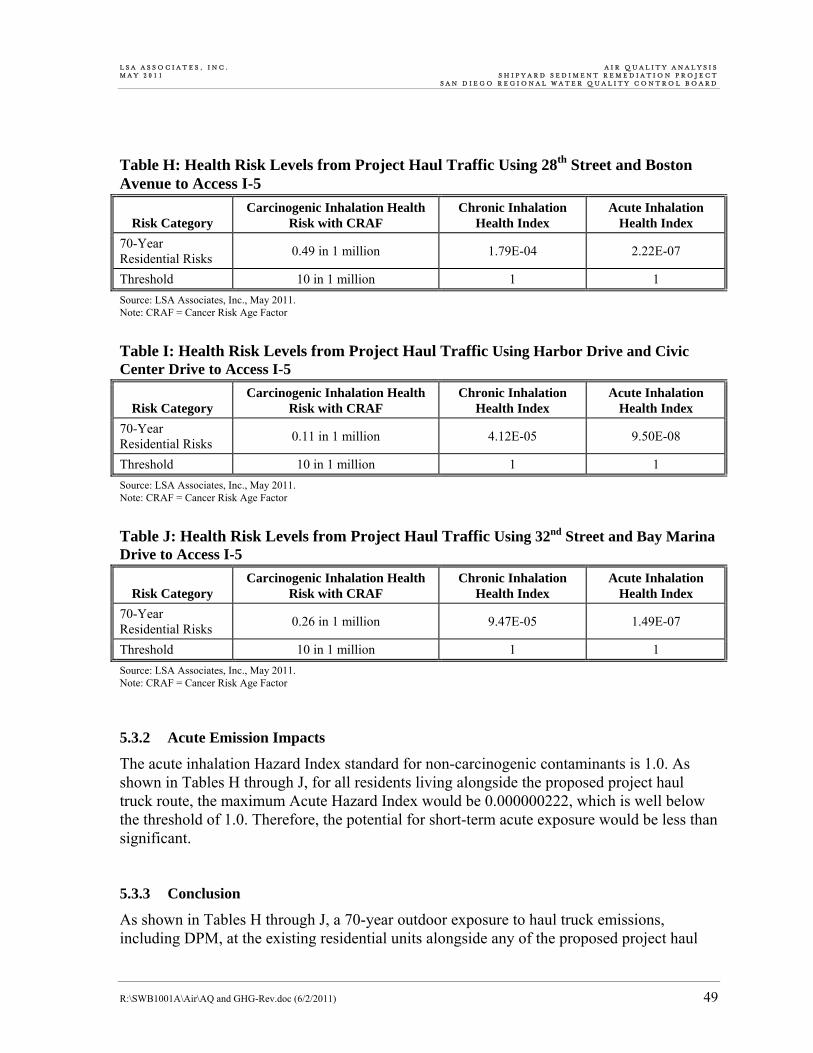
L S A A S S O C I A T E S , I N C . A I R Q U A L I T Y A N A L Y S I S M A Y 2 0 1 1 S H I P Y A R D S E D I M E N T R E M E D I A T I O N P R O J E C T S A N D I E G O R E G I O N A L W A T E R Q U A L I T Y C O N T R O L B O A R D
R:\SWB1001A\Air\AQ and GHG-Rev.doc (6/2/2011) 49
Table H: Health Risk Levels from Project Haul Traffic Using 28th Street and Boston Avenue to Access I-5
Risk Category Carcinogenic Inhalation Health
Risk with CRAF Chronic Inhalation
Health Index Acute Inhalation
Health Index
70-Year Residential Risks 0.49 in 1 million 1.79E-04 2.22E-07
Threshold 10 in 1 million 1 1 Source: LSA Associates, Inc., May 2011. Note: CRAF = Cancer Risk Age Factor
Table I: Health Risk Levels from Project Haul Traffic Using Harbor Drive and Civic Center Drive to Access I-5
Risk Category Carcinogenic Inhalation Health
Risk with CRAF Chronic Inhalation
Health Index Acute Inhalation
Health Index
70-Year Residential Risks 0.11 in 1 million 4.12E-05 9.50E-08
Threshold 10 in 1 million 1 1 Source: LSA Associates, Inc., May 2011. Note: CRAF = Cancer Risk Age Factor
Table J: Health Risk Levels from Project Haul Traffic Using 32nd Street and Bay Marina Drive to Access I-5
Risk Category Carcinogenic Inhalation Health
Risk with CRAF Chronic Inhalation
Health Index Acute Inhalation
Health Index
70-Year Residential Risks 0.26 in 1 million 9.47E-05 1.49E-07
Threshold 10 in 1 million 1 1 Source: LSA Associates, Inc., May 2011. Note: CRAF = Cancer Risk Age Factor
5.3.2 Acute Emission Impacts
The acute inhalation Hazard Index standard for non-carcinogenic contaminants is 1.0. As shown in Tables H through J, for all residents living alongside the proposed project haul truck route, the maximum Acute Hazard Index would be 0.000000222, which is well below the threshold of 1.0. Therefore, the potential for short-term acute exposure would be less than significant. 5.3.3 Conclusion
As shown in Tables H through J, a 70-year outdoor exposure to haul truck emissions, including DPM, at the existing residential units alongside any of the proposed project haul

L S A A S S O C I A T E S , I N C . A I R Q U A L I T Y A N A L Y S I S M A Y 2 0 1 1 S H I P Y A R D S E D I M E N T R E M E D I A T I O N P R O J E C T S A N D I E G O R E G I O N A L W A T E R Q U A L I T Y C O N T R O L B O A R D
R:\SWB1001A\Air\AQ and GHG-Rev.doc (6/2/2011) 50
truck routes would result in a maximum exposure of future residents to a risk level that is below the SDAPCD criterion of significance for cancer health effects (10 in 1 million). Key factors affecting HRA results include the distance from the roadway to the residences, truck traffic density, and wind direction and speed. The low amount of truck traffic associated with the project limits the resulting carcinogenic inhalation health risk. High carcinogenic risk levels are typically associated with freeways that carry a high volume of truck traffic; therefore, the increase in health risk from the project’s haul truck traffic is relatively low due to its low volume of truck traffic. Wind dispersion also influenced the low risk levels on the project site. Frequent winds from the west-northwest in the vicinity of the haul route prevent elevated concentrations of exhaust from accumulating for prolonged periods of time in the project area. Historically, the SDAPCD has used the criterion of 10 in 1 million to determine the risk for point sources such as emissions from industrial facilities. The SDAPCD has the authority to regulate point-source emissions but not mobile-source emissions such as vehicles on roadways. The exposure risks indicated in Tables H and I only include exposure to emissions from project-related haul truck traffic. The HRA results indicate that the proposed project would result in an increased exposure to risk that would not exceed the SDAPCD criterion for cancer or chronic or acute health risks. 5.4 GLOBAL CLIMATE CHANGE/GREENHOUSE GAS EMISSIONS
This section evaluates potential significant impacts to GCC that could result from implementation of the proposed project. While an individual project cannot generate enough GHG emissions to significantly influence GCC, individual projects can incrementally contribute to the potential for the cumulative emissions driving GCC. This air quality analysis analyzes whether the project’s contributions combined with emissions from all other past, present, and probable future projects contribute to the potential for GCC on a cumulative basis and whether the project’s contribution to the impact is “cumulatively considerable.” The ARB has published draft preliminary guidance to agencies on how to establish interim significance thresholds for analyzing GHG emissions called Recommended Approaches for Setting Interim Thresholds for Greenhouse Gases under the California Environmental Quality Act. The proposed Guidance is still in draft form. The proposed draft Guidance generally describes three classes of common projects: industrial, commercial, and residential projects. For each type of project, the proposed draft Guidance recommends that a two-pronged threshold be employed, one performance-based and one numerical. For performance standards, the draft guidance suggests that operations and construction of the project be evaluated for their consistency with applicable performance standards contained in plans designed to reduce GHG emissions and/or help meet the State’s emission reduction objectives in AB 32. The proposed draft Guidance contains two numerical standards. First,

L S A A S S O C I A T E S , I N C . A I R Q U A L I T Y A N A L Y S I S M A Y 2 0 1 1 S H I P Y A R D S E D I M E N T R E M E D I A T I O N P R O J E C T S A N D I E G O R E G I O N A L W A T E R Q U A L I T Y C O N T R O L B O A R D
R:\SWB1001A\Air\AQ and GHG-Rev.doc (6/2/2011) 51
the proposed draft Guidance states that some small residential and commercial projects, emitting 1,600 metric tons of CO2e per year or less, would clearly not interfere with achieving the State’s emission reduction objectives in AB 32 (and EO S-03-05) and thus may be deemed categorically exempt from CEQA. Under this approach, projects emitting less than 1,600 metric tons would not require further analysis. The Guidance does not state or imply that projects emitting more than 1,600 metric tons of CO2e per year will necessarily result in a significant impact, although at this point the Guidance has no precise numerical threshold for commercial and residential projects. Second, for industrial projects, the proposed draft Guidance proposes that projects that emit less than 7,000 metric tons of CO2e per year may be considered less than significant, recognizing that AB 32 will continue to reduce or mitigate emissions from these sorts of projects over time. Thus, while State agencies and local air pollution control districts are currently working to develop CEQA quantitative thresholds of significance that would guide classification of impacts associated with GCC in CEQA documents, to date there is insufficient information to establish formal, permanent thresholds by which to classify projects with relatively small, incremental contributions to the State’s total GHG emissions as cumulatively considerable or not. GHGs would be generated during project construction. The proposed project is not expected to change the long-term operations within the shipyard. Therefore, the project would not generate any long-term operational GHG emissions. Overall, the following activities associated with the proposed project could directly or indirectly contribute to the generation of GHG emissions: • Construction Activities: During construction of the project, GHGs would be emitted
through the operation of construction equipment and from worker and builder supply vendor vehicles, each of which typically uses fossil-based fuels to operate. The combustion of fossil-based fuels creates GHGs such as CO2, CH4, and N2O.
• Electricity and Water Use: Electricity use can result in GHG production if the electricity is generated by combusting fossil fuel. California’s water conveyance system is energy-intensive. Approximately one-fifth of the electricity and one-third of the non-power plant natural gas consumed in the State are associated with water delivery, treatment, and use.1
• Solid Waste Disposal: Solid waste generated by the project could contribute to GHG emissions in a variety of ways. Landfilling and other methods of disposal use energy for transporting and managing the waste, and they produce additional GHGs to varying degrees.
1 California Air Resources Board, 2010. Economic Sectors Portal. Website: www.arb.ca.gov/cc/ghgsectors/
ghgsectors.htm. Accessed January 5, 2010.

L S A A S S O C I A T E S , I N C . A I R Q U A L I T Y A N A L Y S I S M A Y 2 0 1 1 S H I P Y A R D S E D I M E N T R E M E D I A T I O N P R O J E C T S A N D I E G O R E G I O N A L W A T E R Q U A L I T Y C O N T R O L B O A R D
R:\SWB1001A\Air\AQ and GHG-Rev.doc (6/2/2011) 52
• Motor Vehicle Use: Transportation associated with the proposed project would result in GHG emissions from fuel combustion in daily automobile and truck trips. CO2 is the most significant GHG emitted by vehicles, but lesser amounts of CH4 and N2O are also emitted in vehicle exhaust.
5.4.1 Global Climate Change/Greenhouse Gas Emissions – Construction GHG Emissions
GHG emissions associated with the project would occur over the short term from construction activities, consisting primarily of emissions from equipment exhaust. Calculating emissions is for informational purposes, as there is no adopted quantified GHG emissions threshold. GHG emissions generated by the proposed project would predominantly consist of CO2. In comparison to criteria air pollutants such as O3 and PM10, CO2 emissions persist in the atmosphere for a substantially longer period of time. Construction activities produce combustion emissions from various sources such as site grading, utility engines, on-site heavy-duty construction vehicles, equipment hauling materials to and from the site, asphalt paving, and motor vehicles transporting the construction crew. Exhaust emissions from on-site construction activities would vary daily as construction activity levels change. The modeling conducted for the construction analysis (see Appendix A) shows that emissions of CO2 would be as high as 34 tons per day (31 metric tons) during project construction. Assuming 250 construction days per year, the project would generate up to 7,750 metric tons of CO2 per year. As described above, the ARB-proposed draft Guidance states that some small projects, emitting 1,600 metric tons of CO2e per year or less, would clearly not interfere with achieving the State’s emission reduction objectives in AB 32 (and EO S-03-05). While the significance conclusions of this analysis do not rely upon the proposed draft guidance, it is noted that the project’s construction GHG emissions are a single-event contribution limited to a short period of time In addition, the projected GHG emissions are only slightly higher than the ARB’s proposed 7,000-metric ton threshold for industrial facilities. Therefore, the project’s short-term construction GHG emissions are not considered to impede or interfere with achieving the State’s emission reduction objectives in AB 32 (and EO S-03-05). 5.4.2 Global Climate Change/GHG Impact Analysis
GHG emissions are considered for their potential to contribute to Global Climate Change. The proposed project will result in short-term emissions associated with the use of construction equipment. There will be no ongoing increase in contribution to global warming because there are no on-site stationary sources, and there is essentially no increase in the number of vehicular trips coming to and from the project site. Therefore, the proposed

L S A A S S O C I A T E S , I N C . A I R Q U A L I T Y A N A L Y S I S M A Y 2 0 1 1 S H I P Y A R D S E D I M E N T R E M E D I A T I O N P R O J E C T S A N D I E G O R E G I O N A L W A T E R Q U A L I T Y C O N T R O L B O A R D
R:\SWB1001A\Air\AQ and GHG-Rev.doc (6/2/2011) 53
project’s contribution to Global Climate Change in the form of GHG emissions is less than significant. 5.5 AIR QUALITY MANAGEMENT PLAN CONSISTENCY
A regional air quality management plan describes air pollution control strategies to be taken by counties or regions classified as nonattainment areas. The SDAPCD has developed the 2009 RAQS to bring the area into compliance with the requirements of Federal and State air quality standards. CEQA requires that certain proposed projects be analyzed for consistency with the air quality plan. For a project to be consistent with the RAQS adopted by the SDAPCD, the pollutants emitted from the project should not exceed the daily threshold or cause a significant impact on air quality, or the project must already have been included in the RAQS projection. However, if feasible mitigation measures are implemented and shown to reduce the impact level from significant to less than significant, a project may be deemed consistent with the air quality plan. The RAQS uses the assumptions and projections of local planning agencies to determine control strategies for regional compliance status. Since the RAQS is based on local General Plans, projects that are deemed consistent with the General Plan are found to be consistent with the air quality plan. The proposed project would not result in any population growth and is consistent with the City’s General Plan. In addition, the proposed project is not expected to result in any increase in long-term regional air quality impacts. Therefore, the project will not conflict with the RAQS, and no significant impact will result with respect to implementation of the air quality plan. 5.6 MITIGATION MEASURES
5.6.1 Construction Impacts
Mitigation Measures 1 through 10 are identified to reduce the proposed project’s construction air quality impacts, including odors, to the extent feasible. However, as identified above, the project’s construction activities would exceed the City’s daily NOX emission threshold and odor emissions from decomposition are considered significant and unavoidable. All other project-related air quality impacts to adjacent sensitive land uses would be reduced to a less than significant level with implementation of Measures 1 through 10. Mitigation Measure 1
Prior to and during construction, the construction contractor shall select the construction equipment used on site based on low emission factors and high energy efficiency. The construction contractor shall ensure that construction grading plans include a statement that all construction equipment will be tuned and maintained in accordance with the manufacturer’s specifications.

L S A A S S O C I A T E S , I N C . A I R Q U A L I T Y A N A L Y S I S M A Y 2 0 1 1 S H I P Y A R D S E D I M E N T R E M E D I A T I O N P R O J E C T S A N D I E G O R E G I O N A L W A T E R Q U A L I T Y C O N T R O L B O A R D
R:\SWB1001A\Air\AQ and GHG-Rev.doc (6/2/2011) 54
Mitigation Measure 2
Prior to construction, the construction contractor shall ensure that construction grading plans include a statement that work crews will shut off equipment when not in use.
Mitigation Measure 3
During construction, the construction contractor shall time the construction activities so as not to interfere with peak-hour traffic and to minimize obstruction of through traffic lanes adjacent to the site; if necessary, a flagperson shall be retained to maintain safety adjacent to existing roadways.
Mitigation Measure 4
During construction, the construction contractor shall support and encourage ridesharing and transit incentives for the construction crew.
Mitigation Measure 5
During construction, the construction contractor shall ensure that on-site vehicle speed shall be limited to 15 miles per hour (mph).
Mitigation Measure 6
During construction, the construction contractor shall ensure that all on-site roads are paved.
Mitigation Measure 7
During construction, the construction contractor shall adhere to SDAPCD Rule 55 to ensure that all material excavated or graded is sufficiently watered to prevent airborne dust from being visible beyond to property line. Watering, with complete coverage, shall occur at least twice daily, preferably in the late morning and after work is done for the day. Surfactants shall be applied to stock piles of dirt, inactive construction areas, and construction roads.
Mitigation Measure 8
During construction, the construction contractor shall ensure that all earth moving activities cease during periods of high winds (i.e., greater than 25 miles per hour [mph] averaged over 1 hour).
Mitigation Measure 9
During construction, the construction contractor shall ensure that all material transported off site is either sufficiently wet or securely covered to prevent excessive amounts of dust. In addition, per SDAPCD Rule 55, the construction contractor shall ensure that visible roadway dust from track-out/carry-out be minimized.
Mitigation Measure 10
To accelerate the decomposition process, and reduce odor impacts, a mixture of Simple Green and water (10:1) will be lightly applied to the dredged material.
Level of Significance after Mitigation. Implementing measures 1 through 10 would reduce the NOX emissions from construction equipment and the odors from the decomposing dredge material. However, these impacts would remain significant after mitigation.

L S A A S S O C I A T E S , I N C . A I R Q U A L I T Y A N A L Y S I S M A Y 2 0 1 1 S H I P Y A R D S E D I M E N T R E M E D I A T I O N P R O J E C T S A N D I E G O R E G I O N A L W A T E R Q U A L I T Y C O N T R O L B O A R D
R:\SWB1001A\Air\AQ and GHG-Rev.doc (6/2/2011) 55
5.6.2 Project Operations
The project would not create total (vehicular and stationary) daily emissions that exceed the daily emissions thresholds established by the Cities. No mitigation measures would be required. 5.7 CUMULATIVE IMPACTS
The project would contribute criteria pollutants to the area during project construction. Construction emissions associated with the project would exceed the City’s threshold for NOX. A number of individual projects in the area may be under construction simultaneously with the proposed project. Depending on construction schedules and actual implementation of projects in the area, generation of fugitive dust and pollutant emissions during construction could result in substantial short-term increases in air pollutants. Therefore, the proposed project could have a significant short-term cumulative impact. Odors resulting from the project’s treatment of decomposing sediments could have short-term but significant odor impacts on adjacent park uses. However, because no other similar odor-producing projects are anticipated in the immediate area, odor impacts are not considered cumulatively significant. The HRA results indicate that exposure to emissions from project-related haul truck traffic would not exceed the SDAPCD criterion for cancer or chronic or acute health risks. The risk levels associated with the proposed project are well below the established thresholds. In addition, the low amount of project truck traffic and the temporary nature of construction limit the resulting health risk. Therefore, the proposed project is not anticipated to contribute significantly to short-term or long-term cumulative health risk impacts. The project would not result in increases in long-term operational emissions because the project does not create any traffic once construction activities have been completed. The project would not create total (vehicular and stationary) daily emissions that exceed the daily emissions thresholds established by the Cities. Therefore, the project would not contribute cumulatively to long-term local and regional air quality degradation.

L S A A S S O C I A T E S , I N C . A I R Q U A L I T Y A N A L Y S I S M A Y 2 0 1 1 S H I P Y A R D S E D I M E N T R E M E D I A T I O N P R O J E C T S A N D I E G O R E G I O N A L W A T E R Q U A L I T Y C O N T R O L B O A R D
R:\SWB1001A\Air\AQ and GHG-Rev.doc (6/2/2011) 56
6.0 REFERENCES
California Air Resources Board website: http://www.arb.ca.gov. California Air Resources Board (ARB). 2007. “ARB approves tripling of early action
measures required under AB 32.” News Release 07-46. http://www.arb.ca.gov/newsrel/nr102507.htm. October 25.
California Air Resources Board (ARB). 2007. Expanded List of Early Action Measures to
Reduce Greenhouse Gas Emissions in California Recommended for Board Consideration. October.
California Air Resources Board (ARB). 2008. Greenhouse Gas Emissions Inventory.
http://www.climatechange.ca.gov/inventory/index.html. September. California Air Resources Board (ARB). 2008. Greenhouse Gas Inventory Data - 1990 to
2004. http://www.arb.ca.gov/cc/inventory/data/data.htm. November. California Air Resources Board (ARB). 2008. Climate Change Proposed Scoping Plan: a
framework for change. October. California Air Resources Board (ARB). 2008. Preliminary Draft Staff Proposal:
Recommended Approaches for Setting Interim Thresholds for Greenhouse Gases Under the California Environmental Quality Act. October 24.
California Air Resources Board (ARB). 2010. Early Action Items.
http://www.arb.ca.gov/cc/ccea/ccea.htm. California Air Resources Board, 2010. Economic Sectors Portal. Website:
www.arb.ca.gov/cc/ghgsectors/ghgsectors.htm. Accessed January 5, 2010 California Climate Change Center, 2006. Our Changing Climate. Assessing the Risks to
California. July. California Environmental Protection Agency. 2006. Climate Action Team Report to
Governor Schwarzenegger and the Legislature. March.

L S A A S S O C I A T E S , I N C . A I R Q U A L I T Y A N A L Y S I S M A Y 2 0 1 1 S H I P Y A R D S E D I M E N T R E M E D I A T I O N P R O J E C T S A N D I E G O R E G I O N A L W A T E R Q U A L I T Y C O N T R O L B O A R D
R:\SWB1001A\Air\AQ and GHG-Rev.doc (6/2/2011) 57
California Environmental Protection Agency Climate Action Team. 2010. Climate Action Team Proposed Early Actions to Mitigate Climate Change in California (Draft). December 31.
City of San Diego. 2011. California Environmental Quality Act Significance Determination
Thresholds. January. County of San Diego. 2009. Air Toxics “Hot Spots” Program Report for San Diego County.
December 8. Intergovernmental Panel on Climate Change (IPCC), 2007. Climate Change 2007: The
Physical Science Basis. Contribution of Working Group I to the Fourth Assessment Report of the IPCC.
Intergovernmental Panel on Climate Change (IPCC), Climate Change 2007: The Physical
Science Basis, http://www.ipcc.ch. LSA Associates, Inc., Traffic Impact Analysis, March 2011. Office of Environmental Health and Hazards Assessment (OEHHA). 2003. Air Toxics Hot
Spots Program Risk Assessment Guidelines. August. President Barack Obama. 2009. Memorandum to the Administrator of the EPA. State of
California Request for Waiver Under 42 United States Code (U.S.C.) 7543(b), the Clean Air Act. January 26.
State of California. 2008. Governor’s Office of Planning and Research. CEQA and Climate
Change: Addressing Climate Change through California Environmental Quality Act Review. June 19.
United Nations Framework Convention on Climate Change (UNFCCC), 2007. Greenhouse
Gas Inventory Data. Information available at http://unfccc.int/ghg_data/ghg_data_unfccc/time_series_annex_i/items/3814.php and http://maindb.unfccc.int/library/view_pdf.pl?url=http://unfccc.int/resource/docs/2005/sbi/eng/18a02.pdf.
United States Department of Energy. 2003. Buildings Energy Data Book. United States Environmental Protection Agency (EPA). 2008. The U.S. Greenhouse Gas
Emissions and Sinks: Fast Facts. http://www.epa.gov/climatechange/emissions/downloads/2008_GHG_Fast_Facts.pdf.

L S A A S S O C I A T E S , I N C . A I R Q U A L I T Y A N A L Y S I S M A Y 2 0 1 1 S H I P Y A R D S E D I M E N T R E M E D I A T I O N P R O J E C T S A N D I E G O R E G I O N A L W A T E R Q U A L I T Y C O N T R O L B O A R D
R:\SWB1001A\Air\AQ and GHG-Rev.doc (6/2/2011) 58
United States Environmental Protection Agency (EPA) website: www.epa.gov/air/data/index.html.
United States Environmental Protection Agency (EPA), 1999. Integrated Urban Air Toxics
Strategy. July. United States Environmental Protection Agency (EPA), 1991. Risk Assessment for Toxic Air
Pollutants: A Citizen’s Guide, EPA #450/3-90-024. March. Western Regional Climate Center, http://www.wrcc.dri.edu.

L S A A S S O C I A T E S , I N C . A I R Q U A L I T Y A N A L Y S I S M A Y 2 0 1 1 S H I P Y A R D S E D I M E N T R E M E D I A T I O N P R O J E C T S A N D I E G O R E G I O N A L W A T E R Q U A L I T Y C O N T R O L B O A R D
R:\SWB1001A\Air\AQ and GHG-Rev.doc (6/2/2011)
APPENDIX A
CONSTRUCTION EMISSION CALCULATIONS
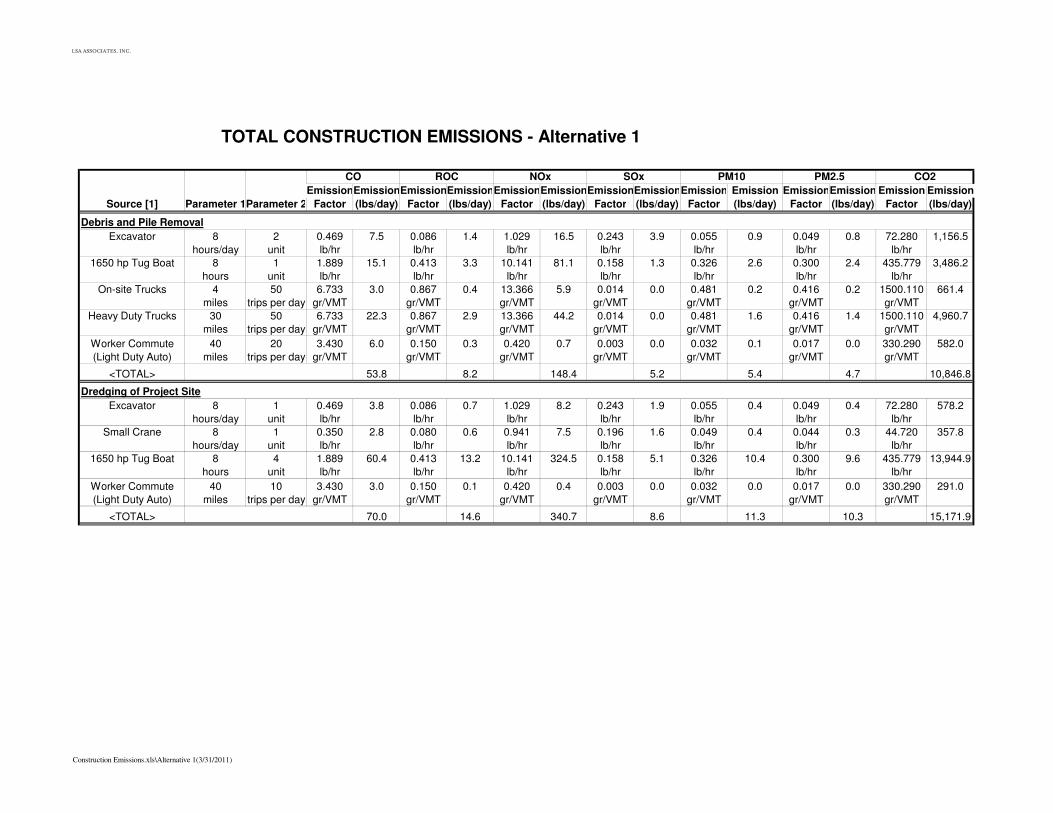
LSA ASSOCIATES, INC.
TOTAL CONSTRUCTION EMISSIONS - Alternative 1
CO ROC NOx SOx
EmissionEmissionEmissionEmissionEmissionEmissionEmissionEmissionEmission Emission EmissionEmission Emission Emission
Source [1] Parameter 1Parameter 2 Factor (lbs/day) Factor (lbs/day) Factor (lbs/day) Factor (lbs/day) Factor (lbs/day) Factor (lbs/day) Factor (lbs/day)
Debris and Pile Removal
Excavator 8 2 0.469 7.5 0.086 1.4 1.029 16.5 0.243 3.9 0.055 0.9 0.049 0.8 72.280 1,156.5
hours/day unit lb/hr lb/hr lb/hr lb/hr lb/hr lb/hr lb/hr
1650 hp Tug Boat 8 1 1.889 15.1 0.413 3.3 10.141 81.1 0.158 1.3 0.326 2.6 0.300 2.4 435.779 3,486.2
hours unit lb/hr lb/hr lb/hr lb/hr lb/hr lb/hr lb/hr
On-site Trucks 4 50 6.733 3.0 0.867 0.4 13.366 5.9 0.014 0.0 0.481 0.2 0.416 0.2 1500.110 661.4
miles trips per day gr/VMT gr/VMT gr/VMT gr/VMT gr/VMT gr/VMT gr/VMT
Heavy Duty Trucks 30 50 6.733 22.3 0.867 2.9 13.366 44.2 0.014 0.0 0.481 1.6 0.416 1.4 1500.110 4,960.7
miles trips per day gr/VMT gr/VMT gr/VMT gr/VMT gr/VMT gr/VMT gr/VMT
Worker Commute 40 20 3.430 6.0 0.150 0.3 0.420 0.7 0.003 0.0 0.032 0.1 0.017 0.0 330.290 582.0
(Light Duty Auto) miles trips per day gr/VMT gr/VMT gr/VMT gr/VMT gr/VMT gr/VMT gr/VMT
<TOTAL> 53.8 8.2 148.4 5.2 5.4 4.7 10,846.8
Dredging of Project Site
Excavator 8 1 0.469 3.8 0.086 0.7 1.029 8.2 0.243 1.9 0.055 0.4 0.049 0.4 72.280 578.2
hours/day unit lb/hr lb/hr lb/hr lb/hr lb/hr lb/hr lb/hr
Small Crane 8 1 0.350 2.8 0.080 0.6 0.941 7.5 0.196 1.6 0.049 0.4 0.044 0.3 44.720 357.8
hours/day unit lb/hr lb/hr lb/hr lb/hr lb/hr lb/hr lb/hr
1650 hp Tug Boat 8 4 1.889 60.4 0.413 13.2 10.141 324.5 0.158 5.1 0.326 10.4 0.300 9.6 435.779 13,944.9
hours unit lb/hr lb/hr lb/hr lb/hr lb/hr lb/hr lb/hr
Worker Commute 40 10 3.430 3.0 0.150 0.1 0.420 0.4 0.003 0.0 0.032 0.0 0.017 0.0 330.290 291.0
(Light Duty Auto) miles trips per day gr/VMT gr/VMT gr/VMT gr/VMT gr/VMT gr/VMT gr/VMT
<TOTAL> 70.0 14.6 340.7 8.6 11.3 10.3 15,171.9
PM10 PM2.5 CO2
Construction Emissions.xls\Alternative 1(3/31/2011)
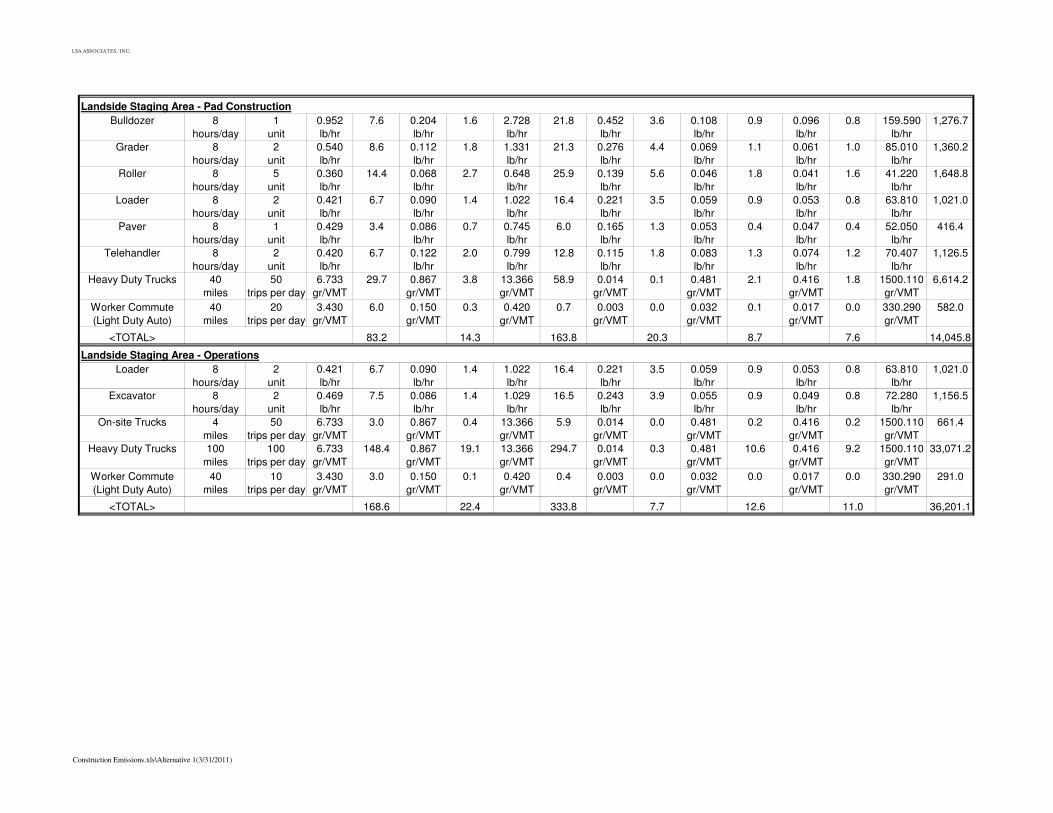
LSA ASSOCIATES, INC.
Landside Staging Area - Pad Construction
Bulldozer 8 1 0.952 7.6 0.204 1.6 2.728 21.8 0.452 3.6 0.108 0.9 0.096 0.8 159.590 1,276.7
hours/day unit lb/hr lb/hr lb/hr lb/hr lb/hr lb/hr lb/hr
Grader 8 2 0.540 8.6 0.112 1.8 1.331 21.3 0.276 4.4 0.069 1.1 0.061 1.0 85.010 1,360.2
hours/day unit lb/hr lb/hr lb/hr lb/hr lb/hr lb/hr lb/hr
Roller 8 5 0.360 14.4 0.068 2.7 0.648 25.9 0.139 5.6 0.046 1.8 0.041 1.6 41.220 1,648.8
hours/day unit lb/hr lb/hr lb/hr lb/hr lb/hr lb/hr lb/hr
Loader 8 2 0.421 6.7 0.090 1.4 1.022 16.4 0.221 3.5 0.059 0.9 0.053 0.8 63.810 1,021.0
hours/day unit lb/hr lb/hr lb/hr lb/hr lb/hr lb/hr lb/hr
Paver 8 1 0.429 3.4 0.086 0.7 0.745 6.0 0.165 1.3 0.053 0.4 0.047 0.4 52.050 416.4
hours/day unit lb/hr lb/hr lb/hr lb/hr lb/hr lb/hr lb/hr
Telehandler 8 2 0.420 6.7 0.122 2.0 0.799 12.8 0.115 1.8 0.083 1.3 0.074 1.2 70.407 1,126.5
hours/day unit lb/hr lb/hr lb/hr lb/hr lb/hr lb/hr lb/hr
Heavy Duty Trucks 40 50 6.733 29.7 0.867 3.8 13.366 58.9 0.014 0.1 0.481 2.1 0.416 1.8 1500.110 6,614.2
miles trips per day gr/VMT gr/VMT gr/VMT gr/VMT gr/VMT gr/VMT gr/VMT
Worker Commute 40 20 3.430 6.0 0.150 0.3 0.420 0.7 0.003 0.0 0.032 0.1 0.017 0.0 330.290 582.0
(Light Duty Auto) miles trips per day gr/VMT gr/VMT gr/VMT gr/VMT gr/VMT gr/VMT gr/VMT
<TOTAL> 83.2 14.3 163.8 20.3 8.7 7.6 14,045.8
Landside Staging Area - Operations
Loader 8 2 0.421 6.7 0.090 1.4 1.022 16.4 0.221 3.5 0.059 0.9 0.053 0.8 63.810 1,021.0
hours/day unit lb/hr lb/hr lb/hr lb/hr lb/hr lb/hr lb/hr
Excavator 8 2 0.469 7.5 0.086 1.4 1.029 16.5 0.243 3.9 0.055 0.9 0.049 0.8 72.280 1,156.5
hours/day unit lb/hr lb/hr lb/hr lb/hr lb/hr lb/hr lb/hr
On-site Trucks 4 50 6.733 3.0 0.867 0.4 13.366 5.9 0.014 0.0 0.481 0.2 0.416 0.2 1500.110 661.4
miles trips per day gr/VMT gr/VMT gr/VMT gr/VMT gr/VMT gr/VMT gr/VMT
Heavy Duty Trucks 100 100 6.733 148.4 0.867 19.1 13.366 294.7 0.014 0.3 0.481 10.6 0.416 9.2 1500.110 33,071.2
miles trips per day gr/VMT gr/VMT gr/VMT gr/VMT gr/VMT gr/VMT gr/VMT
Worker Commute 40 10 3.430 3.0 0.150 0.1 0.420 0.4 0.003 0.0 0.032 0.0 0.017 0.0 330.290 291.0
(Light Duty Auto) miles trips per day gr/VMT gr/VMT gr/VMT gr/VMT gr/VMT gr/VMT gr/VMT
<TOTAL> 168.6 22.4 333.8 7.7 12.6 11.0 36,201.1
Construction Emissions.xls\Alternative 1(3/31/2011)

LSA ASSOCIATES, INC.
Covering of Sediment Near Structures
Stone Slinger 8 2 0.429 6.9 0.086 1.4 0.745 11.9 0.165 2.6 0.053 0.8 0.047 0.8 40.490 647.8
hours/day unit lb/hr lb/hr lb/hr lb/hr lb/hr lb/hr lb/hr
1650 hp Tug Boat 8 1 1.889 15.1 0.413 3.3 10.141 81.1 0.158 1.3 0.326 2.6 0.300 2.4 435.779 3,486.2
hours unit lb/hr lb/hr lb/hr lb/hr lb/hr lb/hr lb/hr
Heavy Duty Trucks 40 10 6.733 5.9 0.867 0.8 13.366 11.8 0.014 0.0 0.481 0.4 0.416 0.4 1500.110 1,322.8
miles trips per day gr/VMT gr/VMT gr/VMT gr/VMT gr/VMT gr/VMT gr/VMT
Worker Commute 40 10 3.430 3.0 0.150 0.1 0.420 0.4 0.003 0.0 0.032 0.0 0.017 0.0 330.290 291.0
(Light Duty Auto) miles trips per day gr/VMT gr/VMT gr/VMT gr/VMT gr/VMT gr/VMT gr/VMT
<TOTAL> 30.9 5.5 105.2 3.9 3.9 3.5 5,747.9
Construction Emissions.xls\Alternative 1(3/31/2011)

L S A A S S O C I A T E S , I N C . A I R Q U A L I T Y A N A L Y S I S M A Y 2 0 1 1 S H I P Y A R D S E D I M E N T R E M E D I A T I O N P R O J E C T S A N D I E G O R E G I O N A L W A T E R Q U A L I T Y C O N T R O L B O A R D
R:\SWB1001A\Air\AQ and GHG-Rev.doc (6/2/2011)
APPENDIX B
HEALTH RISK ASSESSMENT
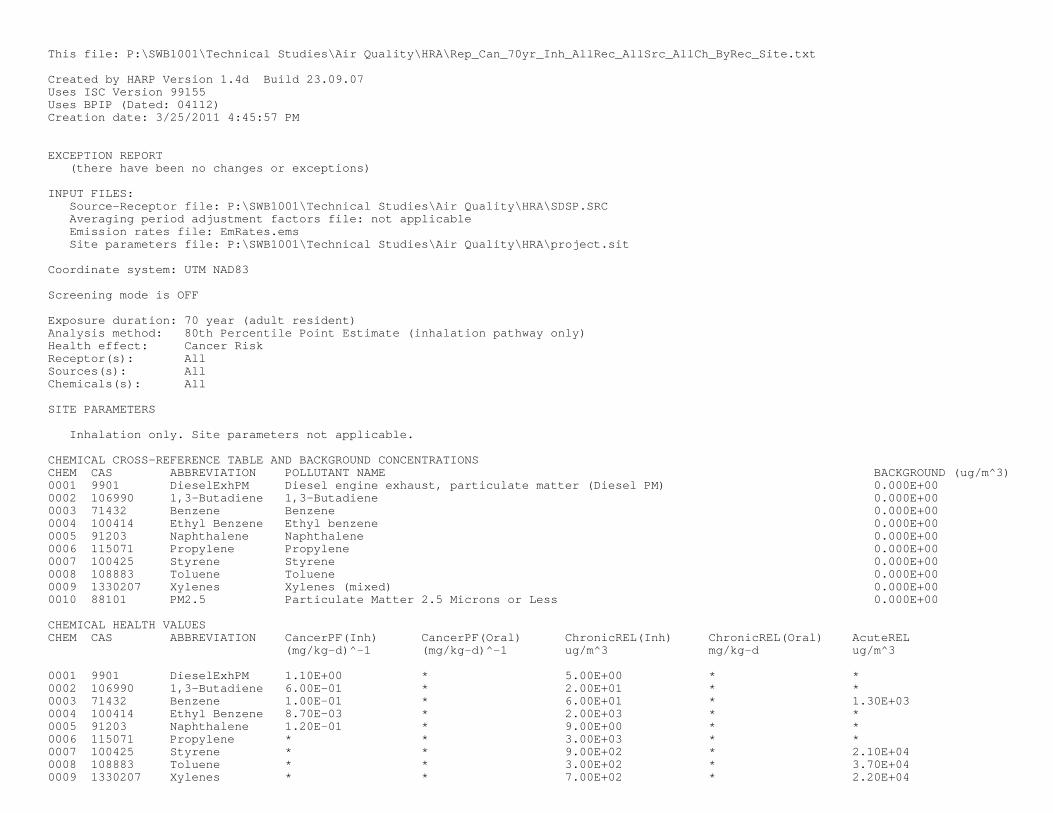
This file: P:\SWB1001\Technical Studies\Air Quality\HRA\Rep_Can_70yr_Inh_AllRec_AllSrc_AllCh_ByRec_Site.txt
Created by HARP Version 1.4d Build 23.09.07Uses ISC Version 99155Uses BPIP (Dated: 04112)Creation date: 3/25/2011 4:45:57 PM
EXCEPTION REPORT (there have been no changes or exceptions)
INPUT FILES: Source-Receptor file: P:\SWB1001\Technical Studies\Air Quality\HRA\SDSP.SRC Averaging period adjustment factors file: not applicable Emission rates file: EmRates.ems Site parameters file: P:\SWB1001\Technical Studies\Air Quality\HRA\project.sit
Coordinate system: UTM NAD83
Screening mode is OFF
Exposure duration: 70 year (adult resident)Analysis method: 80th Percentile Point Estimate (inhalation pathway only)Health effect: Cancer RiskReceptor(s): AllSources(s): AllChemicals(s): All
SITE PARAMETERS
Inhalation only. Site parameters not applicable.
CHEMICAL CROSS-REFERENCE TABLE AND BACKGROUND CONCENTRATIONSCHEM CAS ABBREVIATION POLLUTANT NAME BACKGROUND (ug/m^3)0001 9901 DieselExhPM Diesel engine exhaust, particulate matter (Diesel PM) 0.000E+000002 106990 1,3-Butadiene 1,3-Butadiene 0.000E+000003 71432 Benzene Benzene 0.000E+000004 100414 Ethyl Benzene Ethyl benzene 0.000E+000005 91203 Naphthalene Naphthalene 0.000E+000006 115071 Propylene Propylene 0.000E+000007 100425 Styrene Styrene 0.000E+000008 108883 Toluene Toluene 0.000E+000009 1330207 Xylenes Xylenes (mixed) 0.000E+000010 88101 PM2.5 Particulate Matter 2.5 Microns or Less 0.000E+00
CHEMICAL HEALTH VALUESCHEM CAS ABBREVIATION CancerPF(Inh) CancerPF(Oral) ChronicREL(Inh) ChronicREL(Oral) AcuteREL (mg/kg-d)^-1 (mg/kg-d)^-1 ug/m^3 mg/kg-d ug/m^3
0001 9901 DieselExhPM 1.10E+00 * 5.00E+00 * *0002 106990 1,3-Butadiene 6.00E-01 * 2.00E+01 * *0003 71432 Benzene 1.00E-01 * 6.00E+01 * 1.30E+030004 100414 Ethyl Benzene 8.70E-03 * 2.00E+03 * *0005 91203 Naphthalene 1.20E-01 * 9.00E+00 * *0006 115071 Propylene * * 3.00E+03 * *0007 100425 Styrene * * 9.00E+02 * 2.10E+040008 108883 Toluene * * 3.00E+02 * 3.70E+040009 1330207 Xylenes * * 7.00E+02 * 2.20E+04
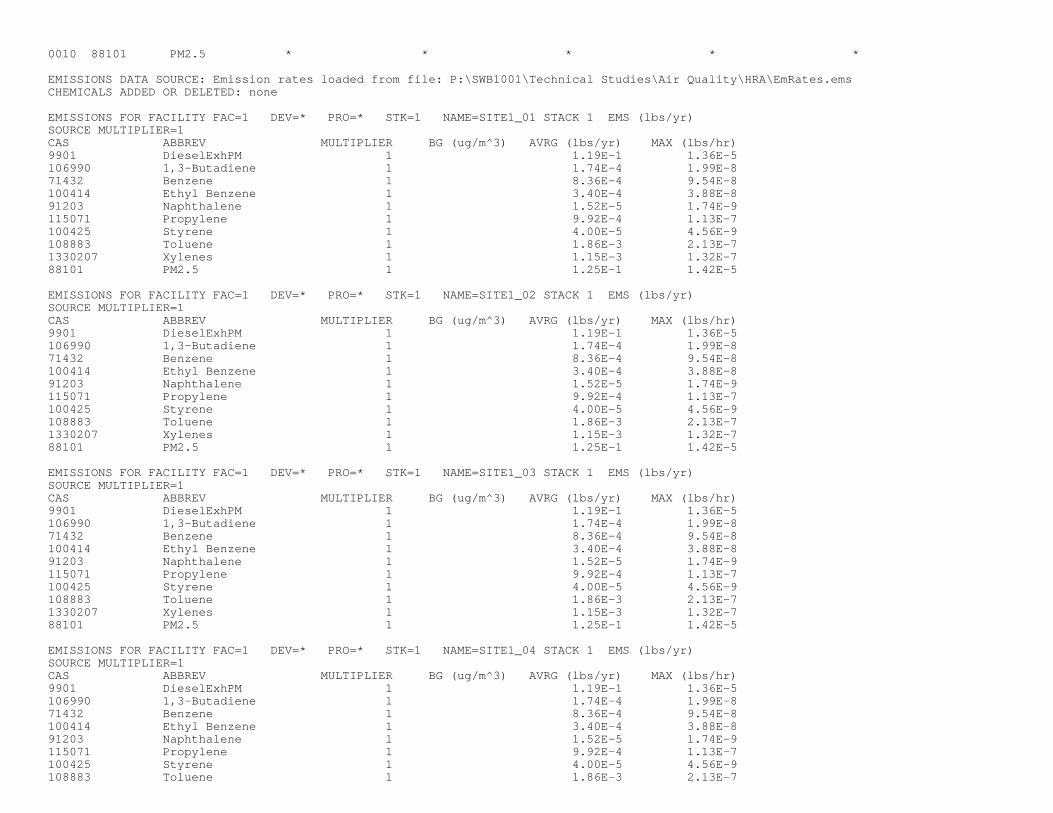
0010 88101 PM2.5 * * * * *
EMISSIONS DATA SOURCE: Emission rates loaded from file: P:\SWB1001\Technical Studies\Air Quality\HRA\EmRates.emsCHEMICALS ADDED OR DELETED: none
EMISSIONS FOR FACILITY FAC=1 DEV=* PRO=* STK=1 NAME=SITE1_01 STACK 1 EMS (lbs/yr)SOURCE MULTIPLIER=1CAS ABBREV MULTIPLIER BG (ug/m^3) AVRG (lbs/yr) MAX (lbs/hr) 9901 DieselExhPM 1 1.19E-1 1.36E-5 106990 1,3-Butadiene 1 1.74E-4 1.99E-8 71432 Benzene 1 8.36E-4 9.54E-8 100414 Ethyl Benzene 1 3.40E-4 3.88E-8 91203 Naphthalene 1 1.52E-5 1.74E-9 115071 Propylene 1 9.92E-4 1.13E-7 100425 Styrene 1 4.00E-5 4.56E-9 108883 Toluene 1 1.86E-3 2.13E-7 1330207 Xylenes 1 1.15E-3 1.32E-7 88101 PM2.5 1 1.25E-1 1.42E-5
EMISSIONS FOR FACILITY FAC=1 DEV=* PRO=* STK=1 NAME=SITE1_02 STACK 1 EMS (lbs/yr)SOURCE MULTIPLIER=1CAS ABBREV MULTIPLIER BG (ug/m^3) AVRG (lbs/yr) MAX (lbs/hr) 9901 DieselExhPM 1 1.19E-1 1.36E-5 106990 1,3-Butadiene 1 1.74E-4 1.99E-8 71432 Benzene 1 8.36E-4 9.54E-8 100414 Ethyl Benzene 1 3.40E-4 3.88E-8 91203 Naphthalene 1 1.52E-5 1.74E-9 115071 Propylene 1 9.92E-4 1.13E-7 100425 Styrene 1 4.00E-5 4.56E-9 108883 Toluene 1 1.86E-3 2.13E-7 1330207 Xylenes 1 1.15E-3 1.32E-7 88101 PM2.5 1 1.25E-1 1.42E-5
EMISSIONS FOR FACILITY FAC=1 DEV=* PRO=* STK=1 NAME=SITE1_03 STACK 1 EMS (lbs/yr)SOURCE MULTIPLIER=1CAS ABBREV MULTIPLIER BG (ug/m^3) AVRG (lbs/yr) MAX (lbs/hr) 9901 DieselExhPM 1 1.19E-1 1.36E-5 106990 1,3-Butadiene 1 1.74E-4 1.99E-8 71432 Benzene 1 8.36E-4 9.54E-8 100414 Ethyl Benzene 1 3.40E-4 3.88E-8 91203 Naphthalene 1 1.52E-5 1.74E-9 115071 Propylene 1 9.92E-4 1.13E-7 100425 Styrene 1 4.00E-5 4.56E-9 108883 Toluene 1 1.86E-3 2.13E-7 1330207 Xylenes 1 1.15E-3 1.32E-7 88101 PM2.5 1 1.25E-1 1.42E-5
EMISSIONS FOR FACILITY FAC=1 DEV=* PRO=* STK=1 NAME=SITE1_04 STACK 1 EMS (lbs/yr)SOURCE MULTIPLIER=1CAS ABBREV MULTIPLIER BG (ug/m^3) AVRG (lbs/yr) MAX (lbs/hr) 9901 DieselExhPM 1 1.19E-1 1.36E-5 106990 1,3-Butadiene 1 1.74E-4 1.99E-8 71432 Benzene 1 8.36E-4 9.54E-8 100414 Ethyl Benzene 1 3.40E-4 3.88E-8 91203 Naphthalene 1 1.52E-5 1.74E-9 115071 Propylene 1 9.92E-4 1.13E-7 100425 Styrene 1 4.00E-5 4.56E-9 108883 Toluene 1 1.86E-3 2.13E-7

1330207 Xylenes 1 1.15E-3 1.32E-7 88101 PM2.5 1 1.25E-1 1.42E-5
EMISSIONS FOR FACILITY FAC=1 DEV=* PRO=* STK=1 NAME=SITE1_05 STACK 1 EMS (lbs/yr)SOURCE MULTIPLIER=1CAS ABBREV MULTIPLIER BG (ug/m^3) AVRG (lbs/yr) MAX (lbs/hr) 9901 DieselExhPM 1 1.19E-1 1.36E-5 106990 1,3-Butadiene 1 1.74E-4 1.99E-8 71432 Benzene 1 8.36E-4 9.54E-8 100414 Ethyl Benzene 1 3.40E-4 3.88E-8 91203 Naphthalene 1 1.52E-5 1.74E-9 115071 Propylene 1 9.92E-4 1.13E-7 100425 Styrene 1 4.00E-5 4.56E-9 108883 Toluene 1 1.86E-3 2.13E-7 1330207 Xylenes 1 1.15E-3 1.32E-7 88101 PM2.5 1 1.25E-1 1.42E-5
EMISSIONS FOR FACILITY FAC=1 DEV=* PRO=* STK=1 NAME=SITE1_06 STACK 1 EMS (lbs/yr)SOURCE MULTIPLIER=1CAS ABBREV MULTIPLIER BG (ug/m^3) AVRG (lbs/yr) MAX (lbs/hr) 9901 DieselExhPM 1 1.19E-1 1.36E-5 106990 1,3-Butadiene 1 1.74E-4 1.99E-8 71432 Benzene 1 8.36E-4 9.54E-8 100414 Ethyl Benzene 1 3.40E-4 3.88E-8 91203 Naphthalene 1 1.52E-5 1.74E-9 115071 Propylene 1 9.92E-4 1.13E-7 100425 Styrene 1 4.00E-5 4.56E-9 108883 Toluene 1 1.86E-3 2.13E-7 1330207 Xylenes 1 1.15E-3 1.32E-7 88101 PM2.5 1 1.25E-1 1.42E-5
EMISSIONS FOR FACILITY FAC=1 DEV=* PRO=* STK=1 NAME=SITE5_01 STACK 1 EMS (lbs/yr)SOURCE MULTIPLIER=1CAS ABBREV MULTIPLIER BG (ug/m^3) AVRG (lbs/yr) MAX (lbs/hr) 9901 DieselExhPM 1 2.26E-1 2.58E-5 106990 1,3-Butadiene 1 3.31E-4 3.78E-8 71432 Benzene 1 1.59E-3 1.81E-7 100414 Ethyl Benzene 1 6.46E-4 7.37E-8 91203 Naphthalene 1 2.89E-5 3.30E-9 115071 Propylene 1 1.88E-3 2.15E-7 100425 Styrene 1 7.59E-5 8.66E-9 108883 Toluene 1 3.54E-3 4.04E-7 1330207 Xylenes 1 2.19E-3 2.50E-7 88101 PM2.5 1 2.37E-1 2.71E-5
EMISSIONS FOR FACILITY FAC=1 DEV=* PRO=* STK=1 NAME=SITE5_02 STACK 1 EMS (lbs/yr)SOURCE MULTIPLIER=1CAS ABBREV MULTIPLIER BG (ug/m^3) AVRG (lbs/yr) MAX (lbs/hr) 9901 DieselExhPM 1 2.26E-1 2.58E-5 106990 1,3-Butadiene 1 3.31E-4 3.78E-8 71432 Benzene 1 1.59E-3 1.81E-7 100414 Ethyl Benzene 1 6.46E-4 7.37E-8 91203 Naphthalene 1 2.89E-5 3.30E-9 115071 Propylene 1 1.88E-3 2.15E-7 100425 Styrene 1 7.59E-5 8.66E-9 108883 Toluene 1 3.54E-3 4.04E-7 1330207 Xylenes 1 2.19E-3 2.50E-7 88101 PM2.5 1 2.37E-1 2.71E-5

EMISSIONS FOR FACILITY FAC=1 DEV=* PRO=* STK=1 NAME=SITE5_03 STACK 1 EMS (lbs/yr)SOURCE MULTIPLIER=1CAS ABBREV MULTIPLIER BG (ug/m^3) AVRG (lbs/yr) MAX (lbs/hr) 9901 DieselExhPM 1 2.26E-1 2.58E-5 106990 1,3-Butadiene 1 3.31E-4 3.78E-8 71432 Benzene 1 1.59E-3 1.81E-7 100414 Ethyl Benzene 1 6.46E-4 7.37E-8 91203 Naphthalene 1 2.89E-5 3.30E-9 115071 Propylene 1 1.88E-3 2.15E-7 100425 Styrene 1 7.59E-5 8.66E-9 108883 Toluene 1 3.54E-3 4.04E-7 1330207 Xylenes 1 2.19E-3 2.50E-7 88101 PM2.5 1 2.37E-1 2.71E-5
EMISSIONS FOR FACILITY FAC=1 DEV=* PRO=* STK=1 NAME=SITE5_04 STACK 1 EMS (lbs/yr)SOURCE MULTIPLIER=1CAS ABBREV MULTIPLIER BG (ug/m^3) AVRG (lbs/yr) MAX (lbs/hr) 9901 DieselExhPM 1 2.26E-1 2.58E-5 106990 1,3-Butadiene 1 3.31E-4 3.78E-8 71432 Benzene 1 1.59E-3 1.81E-7 100414 Ethyl Benzene 1 6.46E-4 7.37E-8 91203 Naphthalene 1 2.89E-5 3.30E-9 115071 Propylene 1 1.88E-3 2.15E-7 100425 Styrene 1 7.59E-5 8.66E-9 108883 Toluene 1 3.54E-3 4.04E-7 1330207 Xylenes 1 2.19E-3 2.50E-7 88101 PM2.5 1 2.37E-1 2.71E-5
EMISSIONS FOR FACILITY FAC=1 DEV=* PRO=* STK=1 NAME=SITE5_05 STACK 1 EMS (lbs/yr)SOURCE MULTIPLIER=1CAS ABBREV MULTIPLIER BG (ug/m^3) AVRG (lbs/yr) MAX (lbs/hr) 9901 DieselExhPM 1 2.26E-1 2.58E-5 106990 1,3-Butadiene 1 3.31E-4 3.78E-8 71432 Benzene 1 1.59E-3 1.81E-7 100414 Ethyl Benzene 1 6.46E-4 7.37E-8 91203 Naphthalene 1 2.89E-5 3.30E-9 115071 Propylene 1 1.88E-3 2.15E-7 100425 Styrene 1 7.59E-5 8.66E-9 108883 Toluene 1 3.54E-3 4.04E-7 1330207 Xylenes 1 2.19E-3 2.50E-7 88101 PM2.5 1 2.37E-1 2.71E-5
EMISSIONS FOR FACILITY FAC=1 DEV=* PRO=* STK=1 NAME=SITE5_06 STACK 1 EMS (lbs/yr)SOURCE MULTIPLIER=1CAS ABBREV MULTIPLIER BG (ug/m^3) AVRG (lbs/yr) MAX (lbs/hr) 9901 DieselExhPM 1 2.26E-1 2.58E-5 106990 1,3-Butadiene 1 3.31E-4 3.78E-8 71432 Benzene 1 1.59E-3 1.81E-7 100414 Ethyl Benzene 1 6.46E-4 7.37E-8 91203 Naphthalene 1 2.89E-5 3.30E-9 115071 Propylene 1 1.88E-3 2.15E-7 100425 Styrene 1 7.59E-5 8.66E-9 108883 Toluene 1 3.54E-3 4.04E-7 1330207 Xylenes 1 2.19E-3 2.50E-7 88101 PM2.5 1 2.37E-1 2.71E-5
EMISSIONS FOR FACILITY FAC=1 DEV=* PRO=* STK=1 NAME=SITE5_07 STACK 1 EMS (lbs/yr)

SOURCE MULTIPLIER=1CAS ABBREV MULTIPLIER BG (ug/m^3) AVRG (lbs/yr) MAX (lbs/hr) 9901 DieselExhPM 1 2.26E-1 2.58E-5 106990 1,3-Butadiene 1 3.31E-4 3.78E-8 71432 Benzene 1 1.59E-3 1.81E-7 100414 Ethyl Benzene 1 6.46E-4 7.37E-8 91203 Naphthalene 1 2.89E-5 3.30E-9 115071 Propylene 1 1.88E-3 2.15E-7 100425 Styrene 1 7.59E-5 8.66E-9 108883 Toluene 1 3.54E-3 4.04E-7 1330207 Xylenes 1 2.19E-3 2.50E-7 88101 PM2.5 1 2.37E-1 2.71E-5
EMISSIONS FOR FACILITY FAC=1 DEV=* PRO=* STK=1 NAME=SITE5_08 STACK 1 EMS (lbs/yr)SOURCE MULTIPLIER=1CAS ABBREV MULTIPLIER BG (ug/m^3) AVRG (lbs/yr) MAX (lbs/hr) 9901 DieselExhPM 1 2.26E-1 2.58E-5 106990 1,3-Butadiene 1 3.31E-4 3.78E-8 71432 Benzene 1 1.59E-3 1.81E-7 100414 Ethyl Benzene 1 6.46E-4 7.37E-8 91203 Naphthalene 1 2.89E-5 3.30E-9 115071 Propylene 1 1.88E-3 2.15E-7 100425 Styrene 1 7.59E-5 8.66E-9 108883 Toluene 1 3.54E-3 4.04E-7 1330207 Xylenes 1 2.19E-3 2.50E-7 88101 PM2.5 1 2.37E-1 2.71E-5
EMISSIONS FOR FACILITY FAC=1 DEV=* PRO=* STK=1 NAME=SITE5_09 STACK 1 EMS (lbs/yr)SOURCE MULTIPLIER=1CAS ABBREV MULTIPLIER BG (ug/m^3) AVRG (lbs/yr) MAX (lbs/hr) 9901 DieselExhPM 1 2.26E-1 2.58E-5 106990 1,3-Butadiene 1 3.31E-4 3.78E-8 71432 Benzene 1 1.59E-3 1.81E-7 100414 Ethyl Benzene 1 6.46E-4 7.37E-8 91203 Naphthalene 1 2.89E-5 3.30E-9 115071 Propylene 1 1.88E-3 2.15E-7 100425 Styrene 1 7.59E-5 8.66E-9 108883 Toluene 1 3.54E-3 4.04E-7 1330207 Xylenes 1 2.19E-3 2.50E-7 88101 PM2.5 1 2.37E-1 2.71E-5
EMISSIONS FOR FACILITY FAC=1 DEV=* PRO=* STK=1 NAME=SITE5_10 STACK 1 EMS (lbs/yr)SOURCE MULTIPLIER=1CAS ABBREV MULTIPLIER BG (ug/m^3) AVRG (lbs/yr) MAX (lbs/hr) 9901 DieselExhPM 1 2.26E-1 2.58E-5 106990 1,3-Butadiene 1 3.31E-4 3.78E-8 71432 Benzene 1 1.59E-3 1.81E-7 100414 Ethyl Benzene 1 6.46E-4 7.37E-8 91203 Naphthalene 1 2.89E-5 3.30E-9 115071 Propylene 1 1.88E-3 2.15E-7 100425 Styrene 1 7.59E-5 8.66E-9 108883 Toluene 1 3.54E-3 4.04E-7 1330207 Xylenes 1 2.19E-3 2.50E-7 88101 PM2.5 1 2.37E-1 2.71E-5
EMISSIONS FOR FACILITY FAC=1 DEV=* PRO=* STK=1 NAME=SITE5_11 STACK 1 EMS (lbs/yr)SOURCE MULTIPLIER=1CAS ABBREV MULTIPLIER BG (ug/m^3) AVRG (lbs/yr) MAX (lbs/hr)

9901 DieselExhPM 1 2.26E-1 2.58E-5 106990 1,3-Butadiene 1 3.31E-4 3.78E-8 71432 Benzene 1 1.59E-3 1.81E-7 100414 Ethyl Benzene 1 6.46E-4 7.37E-8 91203 Naphthalene 1 2.89E-5 3.30E-9 115071 Propylene 1 1.88E-3 2.15E-7 100425 Styrene 1 7.59E-5 8.66E-9 108883 Toluene 1 3.54E-3 4.04E-7 1330207 Xylenes 1 2.19E-3 2.50E-7 88101 PM2.5 1 2.37E-1 2.71E-5
EMISSIONS FOR FACILITY FAC=1 DEV=* PRO=* STK=1 NAME=SITE1_07 STACK 1 EMS (lbs/yr)SOURCE MULTIPLIER=1CAS ABBREV MULTIPLIER BG (ug/m^3) AVRG (lbs/yr) MAX (lbs/hr) 9901 DieselExhPM 1 1.19E-1 1.36E-5 106990 1,3-Butadiene 1 1.74E-4 1.99E-8 71432 Benzene 1 8.36E-4 9.54E-8 100414 Ethyl Benzene 1 3.40E-4 3.88E-8 91203 Naphthalene 1 1.52E-5 1.74E-9 115071 Propylene 1 9.92E-4 1.13E-7 100425 Styrene 1 4.00E-5 4.56E-9 108883 Toluene 1 1.86E-3 2.13E-7 1330207 Xylenes 1 1.15E-3 1.32E-7 88101 PM2.5 1 1.25E-1 1.42E-5
EMISSIONS FOR FACILITY FAC=1 DEV=* PRO=* STK=1 NAME=SITE1_08 STACK 1 EMS (lbs/yr)SOURCE MULTIPLIER=1CAS ABBREV MULTIPLIER BG (ug/m^3) AVRG (lbs/yr) MAX (lbs/hr) 9901 DieselExhPM 1 1.19E-1 1.36E-5 106990 1,3-Butadiene 1 1.74E-4 1.99E-8 71432 Benzene 1 8.36E-4 9.54E-8 100414 Ethyl Benzene 1 3.40E-4 3.88E-8 91203 Naphthalene 1 1.52E-5 1.74E-9 115071 Propylene 1 9.92E-4 1.13E-7 100425 Styrene 1 4.00E-5 4.56E-9 108883 Toluene 1 1.86E-3 2.13E-7 1330207 Xylenes 1 1.15E-3 1.32E-7 88101 PM2.5 1 1.25E-1 1.42E-5
CANCER RISK REPORTREC INHAL DERM SOIL MOTHER FISH WATER VEG DAIRY BEEF CHICK PIG EGG MEAT ORAL TOT0001 1.45E-07 0.00E+00 0.00E+00 0.00E+00 0.00E+00 0.00E+00 0.00E+00 0.00E+00 0.00E+00 0.00E+00 0.00E+00 0.00E+00 0.00E+00 0.00E+00 1.45E-0002 5.85E-08 0.00E+00 0.00E+00 0.00E+00 0.00E+00 0.00E+00 0.00E+00 0.00E+00 0.00E+00 0.00E+00 0.00E+00 0.00E+00 0.00E+00 0.00E+00 5.85E-0003 4.22E-08 0.00E+00 0.00E+00 0.00E+00 0.00E+00 0.00E+00 0.00E+00 0.00E+00 0.00E+00 0.00E+00 0.00E+00 0.00E+00 0.00E+00 0.00E+00 4.22E-0004 2.17E-08 0.00E+00 0.00E+00 0.00E+00 0.00E+00 0.00E+00 0.00E+00 0.00E+00 0.00E+00 0.00E+00 0.00E+00 0.00E+00 0.00E+00 0.00E+00 2.17E-0005 1.88E-08 0.00E+00 0.00E+00 0.00E+00 0.00E+00 0.00E+00 0.00E+00 0.00E+00 0.00E+00 0.00E+00 0.00E+00 0.00E+00 0.00E+00 0.00E+00 1.88E-0006 1.10E-08 0.00E+00 0.00E+00 0.00E+00 0.00E+00 0.00E+00 0.00E+00 0.00E+00 0.00E+00 0.00E+00 0.00E+00 0.00E+00 0.00E+00 0.00E+00 1.10E-0007 2.79E-07 0.00E+00 0.00E+00 0.00E+00 0.00E+00 0.00E+00 0.00E+00 0.00E+00 0.00E+00 0.00E+00 0.00E+00 0.00E+00 0.00E+00 0.00E+00 2.79E-0008 2.28E-07 0.00E+00 0.00E+00 0.00E+00 0.00E+00 0.00E+00 0.00E+00 0.00E+00 0.00E+00 0.00E+00 0.00E+00 0.00E+00 0.00E+00 0.00E+00 2.28E-0009 7.25E-08 0.00E+00 0.00E+00 0.00E+00 0.00E+00 0.00E+00 0.00E+00 0.00E+00 0.00E+00 0.00E+00 0.00E+00 0.00E+00 0.00E+00 0.00E+00 7.25E-0010 5.30E-08 0.00E+00 0.00E+00 0.00E+00 0.00E+00 0.00E+00 0.00E+00 0.00E+00 0.00E+00 0.00E+00 0.00E+00 0.00E+00 0.00E+00 0.00E+00 5.30E-

This file: P:\SWB1001\Technical Studies\Air Quality\HRA\Rep_Can_30yr_Avg_AllRec_AllSrc_AllCh_ByRec_Site.txt
Created by HARP Version 1.4d Build 23.09.07Uses ISC Version 99155Uses BPIP (Dated: 04112)Creation date: 3/25/2011 4:49:05 PM
EXCEPTION REPORT (there have been no changes or exceptions)
INPUT FILES: Source-Receptor file: P:\SWB1001\Technical Studies\Air Quality\HRA\SDSP.SRC Averaging period adjustment factors file: not applicable Emission rates file: EmRates.ems Site parameters file: P:\SWB1001\Technical Studies\Air Quality\HRA\project.sit
Coordinate system: UTM NAD83
Screening mode is OFF
Exposure duration: 30 year (adult resident)Analysis method: Average point estimateHealth effect: Cancer RiskReceptor(s): AllSources(s): AllChemicals(s): All
SITE PARAMETERS
DEPOSITION
Deposition rate (m/s) 0.05
DRINKING WATER
*** Pathway disabled ***
FISH
*** Pathway disabled ***
PASTURE
*** Pathway disabled ***
HOME GROWN PRODUCE
*** Pathway disabled ***
PIGS, CHICKENS AND EGGS
*** Pathway disabled ***
DERMAL ABSORPTION
*** Pathway disabled ***

SOIL INGESTION
*** Pathway disabled ***
MOTHER'S MILK
*** Pathway disabled ***
CHEMICAL CROSS-REFERENCE TABLE AND BACKGROUND CONCENTRATIONSCHEM CAS ABBREVIATION POLLUTANT NAME BACKGROUND (ug/m^3)0001 9901 DieselExhPM Diesel engine exhaust, particulate matter (Diesel PM) 0.000E+000002 106990 1,3-Butadiene 1,3-Butadiene 0.000E+000003 71432 Benzene Benzene 0.000E+000004 100414 Ethyl Benzene Ethyl benzene 0.000E+000005 91203 Naphthalene Naphthalene 0.000E+000006 115071 Propylene Propylene 0.000E+000007 100425 Styrene Styrene 0.000E+000008 108883 Toluene Toluene 0.000E+000009 1330207 Xylenes Xylenes (mixed) 0.000E+000010 88101 PM2.5 Particulate Matter 2.5 Microns or Less 0.000E+00
CHEMICAL HEALTH VALUESCHEM CAS ABBREVIATION CancerPF(Inh) CancerPF(Oral) ChronicREL(Inh) ChronicREL(Oral) AcuteREL (mg/kg-d)^-1 (mg/kg-d)^-1 ug/m^3 mg/kg-d ug/m^3
0001 9901 DieselExhPM 1.10E+00 * 5.00E+00 * *0002 106990 1,3-Butadiene 6.00E-01 * 2.00E+01 * *0003 71432 Benzene 1.00E-01 * 6.00E+01 * 1.30E+030004 100414 Ethyl Benzene 8.70E-03 * 2.00E+03 * *0005 91203 Naphthalene 1.20E-01 * 9.00E+00 * *0006 115071 Propylene * * 3.00E+03 * *0007 100425 Styrene * * 9.00E+02 * 2.10E+040008 108883 Toluene * * 3.00E+02 * 3.70E+040009 1330207 Xylenes * * 7.00E+02 * 2.20E+040010 88101 PM2.5 * * * * *
EMISSIONS DATA SOURCE: Emission rates loaded from file: P:\SWB1001\Technical Studies\Air Quality\HRA\EmRates.emsCHEMICALS ADDED OR DELETED: none
EMISSIONS FOR FACILITY FAC=1 DEV=* PRO=* STK=1 NAME=SITE1_01 STACK 1 EMS (lbs/yr)SOURCE MULTIPLIER=1CAS ABBREV MULTIPLIER BG (ug/m^3) AVRG (lbs/yr) MAX (lbs/hr) 9901 DieselExhPM 1 1.19E-1 1.36E-5 106990 1,3-Butadiene 1 1.74E-4 1.99E-8 71432 Benzene 1 8.36E-4 9.54E-8 100414 Ethyl Benzene 1 3.40E-4 3.88E-8 91203 Naphthalene 1 1.52E-5 1.74E-9 115071 Propylene 1 9.92E-4 1.13E-7 100425 Styrene 1 4.00E-5 4.56E-9 108883 Toluene 1 1.86E-3 2.13E-7 1330207 Xylenes 1 1.15E-3 1.32E-7 88101 PM2.5 1 1.25E-1 1.42E-5
EMISSIONS FOR FACILITY FAC=1 DEV=* PRO=* STK=1 NAME=SITE1_02 STACK 1 EMS (lbs/yr)SOURCE MULTIPLIER=1CAS ABBREV MULTIPLIER BG (ug/m^3) AVRG (lbs/yr) MAX (lbs/hr)

9901 DieselExhPM 1 1.19E-1 1.36E-5 106990 1,3-Butadiene 1 1.74E-4 1.99E-8 71432 Benzene 1 8.36E-4 9.54E-8 100414 Ethyl Benzene 1 3.40E-4 3.88E-8 91203 Naphthalene 1 1.52E-5 1.74E-9 115071 Propylene 1 9.92E-4 1.13E-7 100425 Styrene 1 4.00E-5 4.56E-9 108883 Toluene 1 1.86E-3 2.13E-7 1330207 Xylenes 1 1.15E-3 1.32E-7 88101 PM2.5 1 1.25E-1 1.42E-5
EMISSIONS FOR FACILITY FAC=1 DEV=* PRO=* STK=1 NAME=SITE1_03 STACK 1 EMS (lbs/yr)SOURCE MULTIPLIER=1CAS ABBREV MULTIPLIER BG (ug/m^3) AVRG (lbs/yr) MAX (lbs/hr) 9901 DieselExhPM 1 1.19E-1 1.36E-5 106990 1,3-Butadiene 1 1.74E-4 1.99E-8 71432 Benzene 1 8.36E-4 9.54E-8 100414 Ethyl Benzene 1 3.40E-4 3.88E-8 91203 Naphthalene 1 1.52E-5 1.74E-9 115071 Propylene 1 9.92E-4 1.13E-7 100425 Styrene 1 4.00E-5 4.56E-9 108883 Toluene 1 1.86E-3 2.13E-7 1330207 Xylenes 1 1.15E-3 1.32E-7 88101 PM2.5 1 1.25E-1 1.42E-5
EMISSIONS FOR FACILITY FAC=1 DEV=* PRO=* STK=1 NAME=SITE1_04 STACK 1 EMS (lbs/yr)SOURCE MULTIPLIER=1CAS ABBREV MULTIPLIER BG (ug/m^3) AVRG (lbs/yr) MAX (lbs/hr) 9901 DieselExhPM 1 1.19E-1 1.36E-5 106990 1,3-Butadiene 1 1.74E-4 1.99E-8 71432 Benzene 1 8.36E-4 9.54E-8 100414 Ethyl Benzene 1 3.40E-4 3.88E-8 91203 Naphthalene 1 1.52E-5 1.74E-9 115071 Propylene 1 9.92E-4 1.13E-7 100425 Styrene 1 4.00E-5 4.56E-9 108883 Toluene 1 1.86E-3 2.13E-7 1330207 Xylenes 1 1.15E-3 1.32E-7 88101 PM2.5 1 1.25E-1 1.42E-5
EMISSIONS FOR FACILITY FAC=1 DEV=* PRO=* STK=1 NAME=SITE1_05 STACK 1 EMS (lbs/yr)SOURCE MULTIPLIER=1CAS ABBREV MULTIPLIER BG (ug/m^3) AVRG (lbs/yr) MAX (lbs/hr) 9901 DieselExhPM 1 1.19E-1 1.36E-5 106990 1,3-Butadiene 1 1.74E-4 1.99E-8 71432 Benzene 1 8.36E-4 9.54E-8 100414 Ethyl Benzene 1 3.40E-4 3.88E-8 91203 Naphthalene 1 1.52E-5 1.74E-9 115071 Propylene 1 9.92E-4 1.13E-7 100425 Styrene 1 4.00E-5 4.56E-9 108883 Toluene 1 1.86E-3 2.13E-7 1330207 Xylenes 1 1.15E-3 1.32E-7 88101 PM2.5 1 1.25E-1 1.42E-5
EMISSIONS FOR FACILITY FAC=1 DEV=* PRO=* STK=1 NAME=SITE1_06 STACK 1 EMS (lbs/yr)SOURCE MULTIPLIER=1CAS ABBREV MULTIPLIER BG (ug/m^3) AVRG (lbs/yr) MAX (lbs/hr) 9901 DieselExhPM 1 1.19E-1 1.36E-5 106990 1,3-Butadiene 1 1.74E-4 1.99E-8

71432 Benzene 1 8.36E-4 9.54E-8 100414 Ethyl Benzene 1 3.40E-4 3.88E-8 91203 Naphthalene 1 1.52E-5 1.74E-9 115071 Propylene 1 9.92E-4 1.13E-7 100425 Styrene 1 4.00E-5 4.56E-9 108883 Toluene 1 1.86E-3 2.13E-7 1330207 Xylenes 1 1.15E-3 1.32E-7 88101 PM2.5 1 1.25E-1 1.42E-5
EMISSIONS FOR FACILITY FAC=1 DEV=* PRO=* STK=1 NAME=SITE5_01 STACK 1 EMS (lbs/yr)SOURCE MULTIPLIER=1CAS ABBREV MULTIPLIER BG (ug/m^3) AVRG (lbs/yr) MAX (lbs/hr) 9901 DieselExhPM 1 2.26E-1 2.58E-5 106990 1,3-Butadiene 1 3.31E-4 3.78E-8 71432 Benzene 1 1.59E-3 1.81E-7 100414 Ethyl Benzene 1 6.46E-4 7.37E-8 91203 Naphthalene 1 2.89E-5 3.30E-9 115071 Propylene 1 1.88E-3 2.15E-7 100425 Styrene 1 7.59E-5 8.66E-9 108883 Toluene 1 3.54E-3 4.04E-7 1330207 Xylenes 1 2.19E-3 2.50E-7 88101 PM2.5 1 2.37E-1 2.71E-5
EMISSIONS FOR FACILITY FAC=1 DEV=* PRO=* STK=1 NAME=SITE5_02 STACK 1 EMS (lbs/yr)SOURCE MULTIPLIER=1CAS ABBREV MULTIPLIER BG (ug/m^3) AVRG (lbs/yr) MAX (lbs/hr) 9901 DieselExhPM 1 2.26E-1 2.58E-5 106990 1,3-Butadiene 1 3.31E-4 3.78E-8 71432 Benzene 1 1.59E-3 1.81E-7 100414 Ethyl Benzene 1 6.46E-4 7.37E-8 91203 Naphthalene 1 2.89E-5 3.30E-9 115071 Propylene 1 1.88E-3 2.15E-7 100425 Styrene 1 7.59E-5 8.66E-9 108883 Toluene 1 3.54E-3 4.04E-7 1330207 Xylenes 1 2.19E-3 2.50E-7 88101 PM2.5 1 2.37E-1 2.71E-5
EMISSIONS FOR FACILITY FAC=1 DEV=* PRO=* STK=1 NAME=SITE5_03 STACK 1 EMS (lbs/yr)SOURCE MULTIPLIER=1CAS ABBREV MULTIPLIER BG (ug/m^3) AVRG (lbs/yr) MAX (lbs/hr) 9901 DieselExhPM 1 2.26E-1 2.58E-5 106990 1,3-Butadiene 1 3.31E-4 3.78E-8 71432 Benzene 1 1.59E-3 1.81E-7 100414 Ethyl Benzene 1 6.46E-4 7.37E-8 91203 Naphthalene 1 2.89E-5 3.30E-9 115071 Propylene 1 1.88E-3 2.15E-7 100425 Styrene 1 7.59E-5 8.66E-9 108883 Toluene 1 3.54E-3 4.04E-7 1330207 Xylenes 1 2.19E-3 2.50E-7 88101 PM2.5 1 2.37E-1 2.71E-5
EMISSIONS FOR FACILITY FAC=1 DEV=* PRO=* STK=1 NAME=SITE5_04 STACK 1 EMS (lbs/yr)SOURCE MULTIPLIER=1CAS ABBREV MULTIPLIER BG (ug/m^3) AVRG (lbs/yr) MAX (lbs/hr) 9901 DieselExhPM 1 2.26E-1 2.58E-5 106990 1,3-Butadiene 1 3.31E-4 3.78E-8 71432 Benzene 1 1.59E-3 1.81E-7 100414 Ethyl Benzene 1 6.46E-4 7.37E-8

91203 Naphthalene 1 2.89E-5 3.30E-9 115071 Propylene 1 1.88E-3 2.15E-7 100425 Styrene 1 7.59E-5 8.66E-9 108883 Toluene 1 3.54E-3 4.04E-7 1330207 Xylenes 1 2.19E-3 2.50E-7 88101 PM2.5 1 2.37E-1 2.71E-5
EMISSIONS FOR FACILITY FAC=1 DEV=* PRO=* STK=1 NAME=SITE5_05 STACK 1 EMS (lbs/yr)SOURCE MULTIPLIER=1CAS ABBREV MULTIPLIER BG (ug/m^3) AVRG (lbs/yr) MAX (lbs/hr) 9901 DieselExhPM 1 2.26E-1 2.58E-5 106990 1,3-Butadiene 1 3.31E-4 3.78E-8 71432 Benzene 1 1.59E-3 1.81E-7 100414 Ethyl Benzene 1 6.46E-4 7.37E-8 91203 Naphthalene 1 2.89E-5 3.30E-9 115071 Propylene 1 1.88E-3 2.15E-7 100425 Styrene 1 7.59E-5 8.66E-9 108883 Toluene 1 3.54E-3 4.04E-7 1330207 Xylenes 1 2.19E-3 2.50E-7 88101 PM2.5 1 2.37E-1 2.71E-5
EMISSIONS FOR FACILITY FAC=1 DEV=* PRO=* STK=1 NAME=SITE5_06 STACK 1 EMS (lbs/yr)SOURCE MULTIPLIER=1CAS ABBREV MULTIPLIER BG (ug/m^3) AVRG (lbs/yr) MAX (lbs/hr) 9901 DieselExhPM 1 2.26E-1 2.58E-5 106990 1,3-Butadiene 1 3.31E-4 3.78E-8 71432 Benzene 1 1.59E-3 1.81E-7 100414 Ethyl Benzene 1 6.46E-4 7.37E-8 91203 Naphthalene 1 2.89E-5 3.30E-9 115071 Propylene 1 1.88E-3 2.15E-7 100425 Styrene 1 7.59E-5 8.66E-9 108883 Toluene 1 3.54E-3 4.04E-7 1330207 Xylenes 1 2.19E-3 2.50E-7 88101 PM2.5 1 2.37E-1 2.71E-5
EMISSIONS FOR FACILITY FAC=1 DEV=* PRO=* STK=1 NAME=SITE5_07 STACK 1 EMS (lbs/yr)SOURCE MULTIPLIER=1CAS ABBREV MULTIPLIER BG (ug/m^3) AVRG (lbs/yr) MAX (lbs/hr) 9901 DieselExhPM 1 2.26E-1 2.58E-5 106990 1,3-Butadiene 1 3.31E-4 3.78E-8 71432 Benzene 1 1.59E-3 1.81E-7 100414 Ethyl Benzene 1 6.46E-4 7.37E-8 91203 Naphthalene 1 2.89E-5 3.30E-9 115071 Propylene 1 1.88E-3 2.15E-7 100425 Styrene 1 7.59E-5 8.66E-9 108883 Toluene 1 3.54E-3 4.04E-7 1330207 Xylenes 1 2.19E-3 2.50E-7 88101 PM2.5 1 2.37E-1 2.71E-5
EMISSIONS FOR FACILITY FAC=1 DEV=* PRO=* STK=1 NAME=SITE5_08 STACK 1 EMS (lbs/yr)SOURCE MULTIPLIER=1CAS ABBREV MULTIPLIER BG (ug/m^3) AVRG (lbs/yr) MAX (lbs/hr) 9901 DieselExhPM 1 2.26E-1 2.58E-5 106990 1,3-Butadiene 1 3.31E-4 3.78E-8 71432 Benzene 1 1.59E-3 1.81E-7 100414 Ethyl Benzene 1 6.46E-4 7.37E-8 91203 Naphthalene 1 2.89E-5 3.30E-9 115071 Propylene 1 1.88E-3 2.15E-7

100425 Styrene 1 7.59E-5 8.66E-9 108883 Toluene 1 3.54E-3 4.04E-7 1330207 Xylenes 1 2.19E-3 2.50E-7 88101 PM2.5 1 2.37E-1 2.71E-5
EMISSIONS FOR FACILITY FAC=1 DEV=* PRO=* STK=1 NAME=SITE5_09 STACK 1 EMS (lbs/yr)SOURCE MULTIPLIER=1CAS ABBREV MULTIPLIER BG (ug/m^3) AVRG (lbs/yr) MAX (lbs/hr) 9901 DieselExhPM 1 2.26E-1 2.58E-5 106990 1,3-Butadiene 1 3.31E-4 3.78E-8 71432 Benzene 1 1.59E-3 1.81E-7 100414 Ethyl Benzene 1 6.46E-4 7.37E-8 91203 Naphthalene 1 2.89E-5 3.30E-9 115071 Propylene 1 1.88E-3 2.15E-7 100425 Styrene 1 7.59E-5 8.66E-9 108883 Toluene 1 3.54E-3 4.04E-7 1330207 Xylenes 1 2.19E-3 2.50E-7 88101 PM2.5 1 2.37E-1 2.71E-5
EMISSIONS FOR FACILITY FAC=1 DEV=* PRO=* STK=1 NAME=SITE5_10 STACK 1 EMS (lbs/yr)SOURCE MULTIPLIER=1CAS ABBREV MULTIPLIER BG (ug/m^3) AVRG (lbs/yr) MAX (lbs/hr) 9901 DieselExhPM 1 2.26E-1 2.58E-5 106990 1,3-Butadiene 1 3.31E-4 3.78E-8 71432 Benzene 1 1.59E-3 1.81E-7 100414 Ethyl Benzene 1 6.46E-4 7.37E-8 91203 Naphthalene 1 2.89E-5 3.30E-9 115071 Propylene 1 1.88E-3 2.15E-7 100425 Styrene 1 7.59E-5 8.66E-9 108883 Toluene 1 3.54E-3 4.04E-7 1330207 Xylenes 1 2.19E-3 2.50E-7 88101 PM2.5 1 2.37E-1 2.71E-5
EMISSIONS FOR FACILITY FAC=1 DEV=* PRO=* STK=1 NAME=SITE5_11 STACK 1 EMS (lbs/yr)SOURCE MULTIPLIER=1CAS ABBREV MULTIPLIER BG (ug/m^3) AVRG (lbs/yr) MAX (lbs/hr) 9901 DieselExhPM 1 2.26E-1 2.58E-5 106990 1,3-Butadiene 1 3.31E-4 3.78E-8 71432 Benzene 1 1.59E-3 1.81E-7 100414 Ethyl Benzene 1 6.46E-4 7.37E-8 91203 Naphthalene 1 2.89E-5 3.30E-9 115071 Propylene 1 1.88E-3 2.15E-7 100425 Styrene 1 7.59E-5 8.66E-9 108883 Toluene 1 3.54E-3 4.04E-7 1330207 Xylenes 1 2.19E-3 2.50E-7 88101 PM2.5 1 2.37E-1 2.71E-5
EMISSIONS FOR FACILITY FAC=1 DEV=* PRO=* STK=1 NAME=SITE1_07 STACK 1 EMS (lbs/yr)SOURCE MULTIPLIER=1CAS ABBREV MULTIPLIER BG (ug/m^3) AVRG (lbs/yr) MAX (lbs/hr) 9901 DieselExhPM 1 1.19E-1 1.36E-5 106990 1,3-Butadiene 1 1.74E-4 1.99E-8 71432 Benzene 1 8.36E-4 9.54E-8 100414 Ethyl Benzene 1 3.40E-4 3.88E-8 91203 Naphthalene 1 1.52E-5 1.74E-9 115071 Propylene 1 9.92E-4 1.13E-7 100425 Styrene 1 4.00E-5 4.56E-9 108883 Toluene 1 1.86E-3 2.13E-7

1330207 Xylenes 1 1.15E-3 1.32E-7 88101 PM2.5 1 1.25E-1 1.42E-5
EMISSIONS FOR FACILITY FAC=1 DEV=* PRO=* STK=1 NAME=SITE1_08 STACK 1 EMS (lbs/yr)SOURCE MULTIPLIER=1CAS ABBREV MULTIPLIER BG (ug/m^3) AVRG (lbs/yr) MAX (lbs/hr) 9901 DieselExhPM 1 1.19E-1 1.36E-5 106990 1,3-Butadiene 1 1.74E-4 1.99E-8 71432 Benzene 1 8.36E-4 9.54E-8 100414 Ethyl Benzene 1 3.40E-4 3.88E-8 91203 Naphthalene 1 1.52E-5 1.74E-9 115071 Propylene 1 9.92E-4 1.13E-7 100425 Styrene 1 4.00E-5 4.56E-9 108883 Toluene 1 1.86E-3 2.13E-7 1330207 Xylenes 1 1.15E-3 1.32E-7 88101 PM2.5 1 1.25E-1 1.42E-5
CANCER RISK REPORTREC INHAL DERM SOIL MOTHER FISH WATER VEG DAIRY BEEF CHICK PIG EGG MEAT ORAL TOT0001 5.57E-08 0.00E+00 0.00E+00 0.00E+00 0.00E+00 0.00E+00 0.00E+00 0.00E+00 0.00E+00 0.00E+00 0.00E+00 0.00E+00 0.00E+00 0.00E+00 5.57E-0002 2.25E-08 0.00E+00 0.00E+00 0.00E+00 0.00E+00 0.00E+00 0.00E+00 0.00E+00 0.00E+00 0.00E+00 0.00E+00 0.00E+00 0.00E+00 0.00E+00 2.25E-0003 1.62E-08 0.00E+00 0.00E+00 0.00E+00 0.00E+00 0.00E+00 0.00E+00 0.00E+00 0.00E+00 0.00E+00 0.00E+00 0.00E+00 0.00E+00 0.00E+00 1.62E-0004 8.33E-09 0.00E+00 0.00E+00 0.00E+00 0.00E+00 0.00E+00 0.00E+00 0.00E+00 0.00E+00 0.00E+00 0.00E+00 0.00E+00 0.00E+00 0.00E+00 8.33E-0005 7.22E-09 0.00E+00 0.00E+00 0.00E+00 0.00E+00 0.00E+00 0.00E+00 0.00E+00 0.00E+00 0.00E+00 0.00E+00 0.00E+00 0.00E+00 0.00E+00 7.22E-0006 4.22E-09 0.00E+00 0.00E+00 0.00E+00 0.00E+00 0.00E+00 0.00E+00 0.00E+00 0.00E+00 0.00E+00 0.00E+00 0.00E+00 0.00E+00 0.00E+00 4.22E-0007 1.07E-07 0.00E+00 0.00E+00 0.00E+00 0.00E+00 0.00E+00 0.00E+00 0.00E+00 0.00E+00 0.00E+00 0.00E+00 0.00E+00 0.00E+00 0.00E+00 1.07E-0008 8.78E-08 0.00E+00 0.00E+00 0.00E+00 0.00E+00 0.00E+00 0.00E+00 0.00E+00 0.00E+00 0.00E+00 0.00E+00 0.00E+00 0.00E+00 0.00E+00 8.78E-0009 2.79E-08 0.00E+00 0.00E+00 0.00E+00 0.00E+00 0.00E+00 0.00E+00 0.00E+00 0.00E+00 0.00E+00 0.00E+00 0.00E+00 0.00E+00 0.00E+00 2.79E-0010 2.04E-08 0.00E+00 0.00E+00 0.00E+00 0.00E+00 0.00E+00 0.00E+00 0.00E+00 0.00E+00 0.00E+00 0.00E+00 0.00E+00 0.00E+00 0.00E+00 2.04E-
This file: P:\SWB1001\Technical Studies\Air Quality\HRA\Rep_Can_9yrC_Avg_AllRec_AllSrc_AllCh_ByRec_Site.txt
Created by HARP Version 1.4d Build 23.09.07Uses ISC Version 99155Uses BPIP (Dated: 04112)Creation date: 3/25/2011 4:49:43 PM
EXCEPTION REPORT (there have been no changes or exceptions)
INPUT FILES: Source-Receptor file: P:\SWB1001\Technical Studies\Air Quality\HRA\SDSP.SRC Averaging period adjustment factors file: not applicable Emission rates file: EmRates.ems Site parameters file: P:\SWB1001\Technical Studies\Air Quality\HRA\project.sit
Coordinate system: UTM NAD83
Screening mode is OFF
Exposure duration: 9 year (child resident)Analysis method: Average point estimateHealth effect: Cancer RiskReceptor(s): AllSources(s): AllChemicals(s): All
SITE PARAMETERS
DEPOSITION
Deposition rate (m/s) 0.05
DRINKING WATER
*** Pathway disabled ***
FISH
*** Pathway disabled ***
PASTURE
*** Pathway disabled ***
HOME GROWN PRODUCE
*** Pathway disabled ***
PIGS, CHICKENS AND EGGS
*** Pathway disabled ***
DERMAL ABSORPTION
*** Pathway disabled ***
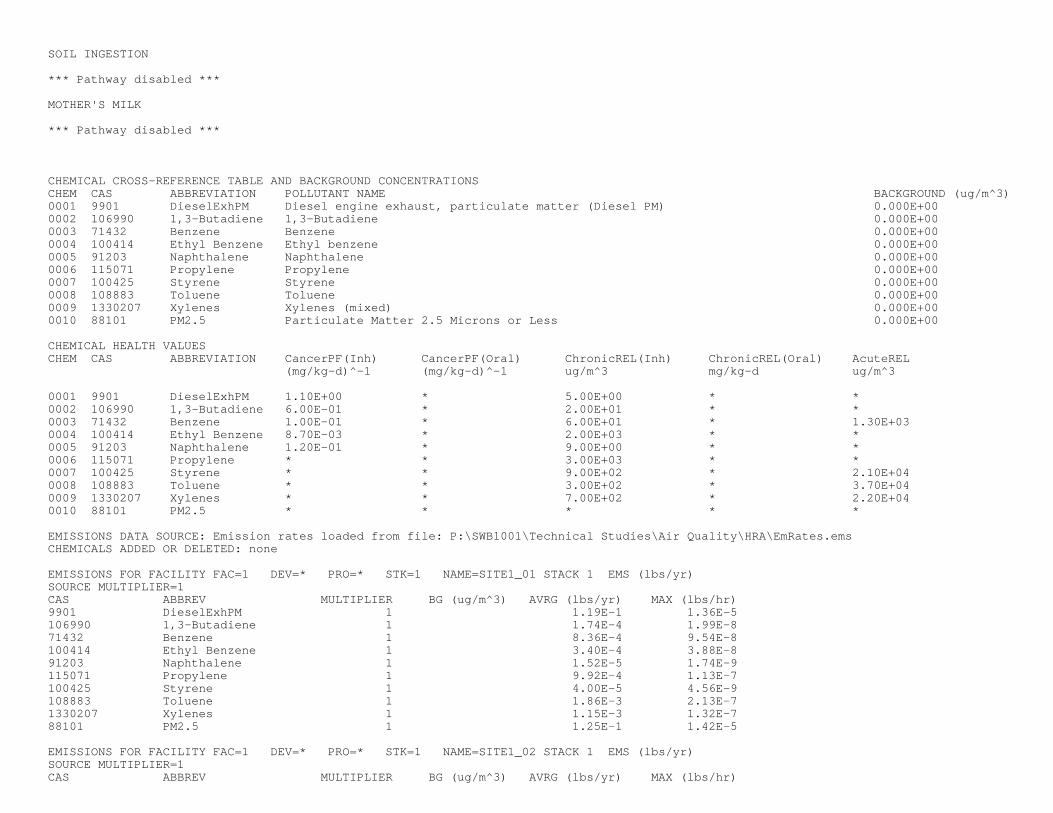
SOIL INGESTION
*** Pathway disabled ***
MOTHER'S MILK
*** Pathway disabled ***
CHEMICAL CROSS-REFERENCE TABLE AND BACKGROUND CONCENTRATIONSCHEM CAS ABBREVIATION POLLUTANT NAME BACKGROUND (ug/m^3)0001 9901 DieselExhPM Diesel engine exhaust, particulate matter (Diesel PM) 0.000E+000002 106990 1,3-Butadiene 1,3-Butadiene 0.000E+000003 71432 Benzene Benzene 0.000E+000004 100414 Ethyl Benzene Ethyl benzene 0.000E+000005 91203 Naphthalene Naphthalene 0.000E+000006 115071 Propylene Propylene 0.000E+000007 100425 Styrene Styrene 0.000E+000008 108883 Toluene Toluene 0.000E+000009 1330207 Xylenes Xylenes (mixed) 0.000E+000010 88101 PM2.5 Particulate Matter 2.5 Microns or Less 0.000E+00
CHEMICAL HEALTH VALUESCHEM CAS ABBREVIATION CancerPF(Inh) CancerPF(Oral) ChronicREL(Inh) ChronicREL(Oral) AcuteREL (mg/kg-d)^-1 (mg/kg-d)^-1 ug/m^3 mg/kg-d ug/m^3
0001 9901 DieselExhPM 1.10E+00 * 5.00E+00 * *0002 106990 1,3-Butadiene 6.00E-01 * 2.00E+01 * *0003 71432 Benzene 1.00E-01 * 6.00E+01 * 1.30E+030004 100414 Ethyl Benzene 8.70E-03 * 2.00E+03 * *0005 91203 Naphthalene 1.20E-01 * 9.00E+00 * *0006 115071 Propylene * * 3.00E+03 * *0007 100425 Styrene * * 9.00E+02 * 2.10E+040008 108883 Toluene * * 3.00E+02 * 3.70E+040009 1330207 Xylenes * * 7.00E+02 * 2.20E+040010 88101 PM2.5 * * * * *
EMISSIONS DATA SOURCE: Emission rates loaded from file: P:\SWB1001\Technical Studies\Air Quality\HRA\EmRates.emsCHEMICALS ADDED OR DELETED: none
EMISSIONS FOR FACILITY FAC=1 DEV=* PRO=* STK=1 NAME=SITE1_01 STACK 1 EMS (lbs/yr)SOURCE MULTIPLIER=1CAS ABBREV MULTIPLIER BG (ug/m^3) AVRG (lbs/yr) MAX (lbs/hr) 9901 DieselExhPM 1 1.19E-1 1.36E-5 106990 1,3-Butadiene 1 1.74E-4 1.99E-8 71432 Benzene 1 8.36E-4 9.54E-8 100414 Ethyl Benzene 1 3.40E-4 3.88E-8 91203 Naphthalene 1 1.52E-5 1.74E-9 115071 Propylene 1 9.92E-4 1.13E-7 100425 Styrene 1 4.00E-5 4.56E-9 108883 Toluene 1 1.86E-3 2.13E-7 1330207 Xylenes 1 1.15E-3 1.32E-7 88101 PM2.5 1 1.25E-1 1.42E-5
EMISSIONS FOR FACILITY FAC=1 DEV=* PRO=* STK=1 NAME=SITE1_02 STACK 1 EMS (lbs/yr)SOURCE MULTIPLIER=1CAS ABBREV MULTIPLIER BG (ug/m^3) AVRG (lbs/yr) MAX (lbs/hr)

9901 DieselExhPM 1 1.19E-1 1.36E-5 106990 1,3-Butadiene 1 1.74E-4 1.99E-8 71432 Benzene 1 8.36E-4 9.54E-8 100414 Ethyl Benzene 1 3.40E-4 3.88E-8 91203 Naphthalene 1 1.52E-5 1.74E-9 115071 Propylene 1 9.92E-4 1.13E-7 100425 Styrene 1 4.00E-5 4.56E-9 108883 Toluene 1 1.86E-3 2.13E-7 1330207 Xylenes 1 1.15E-3 1.32E-7 88101 PM2.5 1 1.25E-1 1.42E-5
EMISSIONS FOR FACILITY FAC=1 DEV=* PRO=* STK=1 NAME=SITE1_03 STACK 1 EMS (lbs/yr)SOURCE MULTIPLIER=1CAS ABBREV MULTIPLIER BG (ug/m^3) AVRG (lbs/yr) MAX (lbs/hr) 9901 DieselExhPM 1 1.19E-1 1.36E-5 106990 1,3-Butadiene 1 1.74E-4 1.99E-8 71432 Benzene 1 8.36E-4 9.54E-8 100414 Ethyl Benzene 1 3.40E-4 3.88E-8 91203 Naphthalene 1 1.52E-5 1.74E-9 115071 Propylene 1 9.92E-4 1.13E-7 100425 Styrene 1 4.00E-5 4.56E-9 108883 Toluene 1 1.86E-3 2.13E-7 1330207 Xylenes 1 1.15E-3 1.32E-7 88101 PM2.5 1 1.25E-1 1.42E-5
EMISSIONS FOR FACILITY FAC=1 DEV=* PRO=* STK=1 NAME=SITE1_04 STACK 1 EMS (lbs/yr)SOURCE MULTIPLIER=1CAS ABBREV MULTIPLIER BG (ug/m^3) AVRG (lbs/yr) MAX (lbs/hr) 9901 DieselExhPM 1 1.19E-1 1.36E-5 106990 1,3-Butadiene 1 1.74E-4 1.99E-8 71432 Benzene 1 8.36E-4 9.54E-8 100414 Ethyl Benzene 1 3.40E-4 3.88E-8 91203 Naphthalene 1 1.52E-5 1.74E-9 115071 Propylene 1 9.92E-4 1.13E-7 100425 Styrene 1 4.00E-5 4.56E-9 108883 Toluene 1 1.86E-3 2.13E-7 1330207 Xylenes 1 1.15E-3 1.32E-7 88101 PM2.5 1 1.25E-1 1.42E-5
EMISSIONS FOR FACILITY FAC=1 DEV=* PRO=* STK=1 NAME=SITE1_05 STACK 1 EMS (lbs/yr)SOURCE MULTIPLIER=1CAS ABBREV MULTIPLIER BG (ug/m^3) AVRG (lbs/yr) MAX (lbs/hr) 9901 DieselExhPM 1 1.19E-1 1.36E-5 106990 1,3-Butadiene 1 1.74E-4 1.99E-8 71432 Benzene 1 8.36E-4 9.54E-8 100414 Ethyl Benzene 1 3.40E-4 3.88E-8 91203 Naphthalene 1 1.52E-5 1.74E-9 115071 Propylene 1 9.92E-4 1.13E-7 100425 Styrene 1 4.00E-5 4.56E-9 108883 Toluene 1 1.86E-3 2.13E-7 1330207 Xylenes 1 1.15E-3 1.32E-7 88101 PM2.5 1 1.25E-1 1.42E-5
EMISSIONS FOR FACILITY FAC=1 DEV=* PRO=* STK=1 NAME=SITE1_06 STACK 1 EMS (lbs/yr)SOURCE MULTIPLIER=1CAS ABBREV MULTIPLIER BG (ug/m^3) AVRG (lbs/yr) MAX (lbs/hr) 9901 DieselExhPM 1 1.19E-1 1.36E-5 106990 1,3-Butadiene 1 1.74E-4 1.99E-8

71432 Benzene 1 8.36E-4 9.54E-8 100414 Ethyl Benzene 1 3.40E-4 3.88E-8 91203 Naphthalene 1 1.52E-5 1.74E-9 115071 Propylene 1 9.92E-4 1.13E-7 100425 Styrene 1 4.00E-5 4.56E-9 108883 Toluene 1 1.86E-3 2.13E-7 1330207 Xylenes 1 1.15E-3 1.32E-7 88101 PM2.5 1 1.25E-1 1.42E-5
EMISSIONS FOR FACILITY FAC=1 DEV=* PRO=* STK=1 NAME=SITE5_01 STACK 1 EMS (lbs/yr)SOURCE MULTIPLIER=1CAS ABBREV MULTIPLIER BG (ug/m^3) AVRG (lbs/yr) MAX (lbs/hr) 9901 DieselExhPM 1 2.26E-1 2.58E-5 106990 1,3-Butadiene 1 3.31E-4 3.78E-8 71432 Benzene 1 1.59E-3 1.81E-7 100414 Ethyl Benzene 1 6.46E-4 7.37E-8 91203 Naphthalene 1 2.89E-5 3.30E-9 115071 Propylene 1 1.88E-3 2.15E-7 100425 Styrene 1 7.59E-5 8.66E-9 108883 Toluene 1 3.54E-3 4.04E-7 1330207 Xylenes 1 2.19E-3 2.50E-7 88101 PM2.5 1 2.37E-1 2.71E-5
EMISSIONS FOR FACILITY FAC=1 DEV=* PRO=* STK=1 NAME=SITE5_02 STACK 1 EMS (lbs/yr)SOURCE MULTIPLIER=1CAS ABBREV MULTIPLIER BG (ug/m^3) AVRG (lbs/yr) MAX (lbs/hr) 9901 DieselExhPM 1 2.26E-1 2.58E-5 106990 1,3-Butadiene 1 3.31E-4 3.78E-8 71432 Benzene 1 1.59E-3 1.81E-7 100414 Ethyl Benzene 1 6.46E-4 7.37E-8 91203 Naphthalene 1 2.89E-5 3.30E-9 115071 Propylene 1 1.88E-3 2.15E-7 100425 Styrene 1 7.59E-5 8.66E-9 108883 Toluene 1 3.54E-3 4.04E-7 1330207 Xylenes 1 2.19E-3 2.50E-7 88101 PM2.5 1 2.37E-1 2.71E-5
EMISSIONS FOR FACILITY FAC=1 DEV=* PRO=* STK=1 NAME=SITE5_03 STACK 1 EMS (lbs/yr)SOURCE MULTIPLIER=1CAS ABBREV MULTIPLIER BG (ug/m^3) AVRG (lbs/yr) MAX (lbs/hr) 9901 DieselExhPM 1 2.26E-1 2.58E-5 106990 1,3-Butadiene 1 3.31E-4 3.78E-8 71432 Benzene 1 1.59E-3 1.81E-7 100414 Ethyl Benzene 1 6.46E-4 7.37E-8 91203 Naphthalene 1 2.89E-5 3.30E-9 115071 Propylene 1 1.88E-3 2.15E-7 100425 Styrene 1 7.59E-5 8.66E-9 108883 Toluene 1 3.54E-3 4.04E-7 1330207 Xylenes 1 2.19E-3 2.50E-7 88101 PM2.5 1 2.37E-1 2.71E-5
EMISSIONS FOR FACILITY FAC=1 DEV=* PRO=* STK=1 NAME=SITE5_04 STACK 1 EMS (lbs/yr)SOURCE MULTIPLIER=1CAS ABBREV MULTIPLIER BG (ug/m^3) AVRG (lbs/yr) MAX (lbs/hr) 9901 DieselExhPM 1 2.26E-1 2.58E-5 106990 1,3-Butadiene 1 3.31E-4 3.78E-8 71432 Benzene 1 1.59E-3 1.81E-7 100414 Ethyl Benzene 1 6.46E-4 7.37E-8
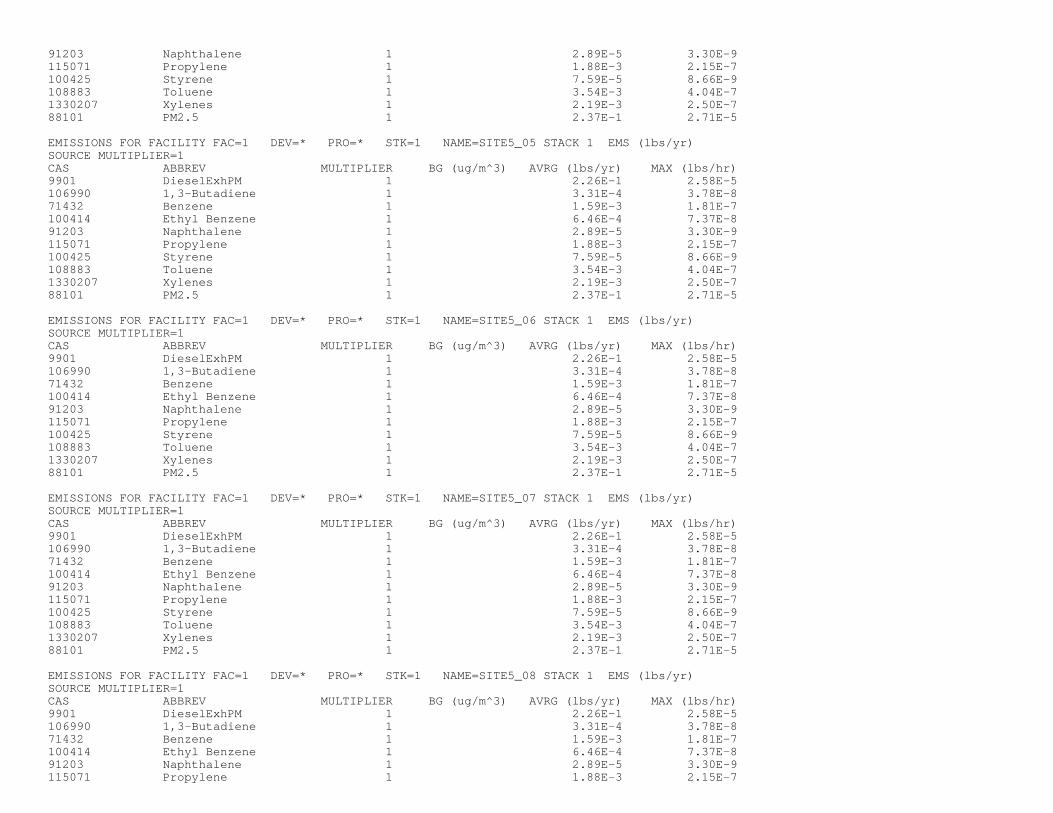
91203 Naphthalene 1 2.89E-5 3.30E-9 115071 Propylene 1 1.88E-3 2.15E-7 100425 Styrene 1 7.59E-5 8.66E-9 108883 Toluene 1 3.54E-3 4.04E-7 1330207 Xylenes 1 2.19E-3 2.50E-7 88101 PM2.5 1 2.37E-1 2.71E-5
EMISSIONS FOR FACILITY FAC=1 DEV=* PRO=* STK=1 NAME=SITE5_05 STACK 1 EMS (lbs/yr)SOURCE MULTIPLIER=1CAS ABBREV MULTIPLIER BG (ug/m^3) AVRG (lbs/yr) MAX (lbs/hr) 9901 DieselExhPM 1 2.26E-1 2.58E-5 106990 1,3-Butadiene 1 3.31E-4 3.78E-8 71432 Benzene 1 1.59E-3 1.81E-7 100414 Ethyl Benzene 1 6.46E-4 7.37E-8 91203 Naphthalene 1 2.89E-5 3.30E-9 115071 Propylene 1 1.88E-3 2.15E-7 100425 Styrene 1 7.59E-5 8.66E-9 108883 Toluene 1 3.54E-3 4.04E-7 1330207 Xylenes 1 2.19E-3 2.50E-7 88101 PM2.5 1 2.37E-1 2.71E-5
EMISSIONS FOR FACILITY FAC=1 DEV=* PRO=* STK=1 NAME=SITE5_06 STACK 1 EMS (lbs/yr)SOURCE MULTIPLIER=1CAS ABBREV MULTIPLIER BG (ug/m^3) AVRG (lbs/yr) MAX (lbs/hr) 9901 DieselExhPM 1 2.26E-1 2.58E-5 106990 1,3-Butadiene 1 3.31E-4 3.78E-8 71432 Benzene 1 1.59E-3 1.81E-7 100414 Ethyl Benzene 1 6.46E-4 7.37E-8 91203 Naphthalene 1 2.89E-5 3.30E-9 115071 Propylene 1 1.88E-3 2.15E-7 100425 Styrene 1 7.59E-5 8.66E-9 108883 Toluene 1 3.54E-3 4.04E-7 1330207 Xylenes 1 2.19E-3 2.50E-7 88101 PM2.5 1 2.37E-1 2.71E-5
EMISSIONS FOR FACILITY FAC=1 DEV=* PRO=* STK=1 NAME=SITE5_07 STACK 1 EMS (lbs/yr)SOURCE MULTIPLIER=1CAS ABBREV MULTIPLIER BG (ug/m^3) AVRG (lbs/yr) MAX (lbs/hr) 9901 DieselExhPM 1 2.26E-1 2.58E-5 106990 1,3-Butadiene 1 3.31E-4 3.78E-8 71432 Benzene 1 1.59E-3 1.81E-7 100414 Ethyl Benzene 1 6.46E-4 7.37E-8 91203 Naphthalene 1 2.89E-5 3.30E-9 115071 Propylene 1 1.88E-3 2.15E-7 100425 Styrene 1 7.59E-5 8.66E-9 108883 Toluene 1 3.54E-3 4.04E-7 1330207 Xylenes 1 2.19E-3 2.50E-7 88101 PM2.5 1 2.37E-1 2.71E-5
EMISSIONS FOR FACILITY FAC=1 DEV=* PRO=* STK=1 NAME=SITE5_08 STACK 1 EMS (lbs/yr)SOURCE MULTIPLIER=1CAS ABBREV MULTIPLIER BG (ug/m^3) AVRG (lbs/yr) MAX (lbs/hr) 9901 DieselExhPM 1 2.26E-1 2.58E-5 106990 1,3-Butadiene 1 3.31E-4 3.78E-8 71432 Benzene 1 1.59E-3 1.81E-7 100414 Ethyl Benzene 1 6.46E-4 7.37E-8 91203 Naphthalene 1 2.89E-5 3.30E-9 115071 Propylene 1 1.88E-3 2.15E-7

100425 Styrene 1 7.59E-5 8.66E-9 108883 Toluene 1 3.54E-3 4.04E-7 1330207 Xylenes 1 2.19E-3 2.50E-7 88101 PM2.5 1 2.37E-1 2.71E-5
EMISSIONS FOR FACILITY FAC=1 DEV=* PRO=* STK=1 NAME=SITE5_09 STACK 1 EMS (lbs/yr)SOURCE MULTIPLIER=1CAS ABBREV MULTIPLIER BG (ug/m^3) AVRG (lbs/yr) MAX (lbs/hr) 9901 DieselExhPM 1 2.26E-1 2.58E-5 106990 1,3-Butadiene 1 3.31E-4 3.78E-8 71432 Benzene 1 1.59E-3 1.81E-7 100414 Ethyl Benzene 1 6.46E-4 7.37E-8 91203 Naphthalene 1 2.89E-5 3.30E-9 115071 Propylene 1 1.88E-3 2.15E-7 100425 Styrene 1 7.59E-5 8.66E-9 108883 Toluene 1 3.54E-3 4.04E-7 1330207 Xylenes 1 2.19E-3 2.50E-7 88101 PM2.5 1 2.37E-1 2.71E-5
EMISSIONS FOR FACILITY FAC=1 DEV=* PRO=* STK=1 NAME=SITE5_10 STACK 1 EMS (lbs/yr)SOURCE MULTIPLIER=1CAS ABBREV MULTIPLIER BG (ug/m^3) AVRG (lbs/yr) MAX (lbs/hr) 9901 DieselExhPM 1 2.26E-1 2.58E-5 106990 1,3-Butadiene 1 3.31E-4 3.78E-8 71432 Benzene 1 1.59E-3 1.81E-7 100414 Ethyl Benzene 1 6.46E-4 7.37E-8 91203 Naphthalene 1 2.89E-5 3.30E-9 115071 Propylene 1 1.88E-3 2.15E-7 100425 Styrene 1 7.59E-5 8.66E-9 108883 Toluene 1 3.54E-3 4.04E-7 1330207 Xylenes 1 2.19E-3 2.50E-7 88101 PM2.5 1 2.37E-1 2.71E-5
EMISSIONS FOR FACILITY FAC=1 DEV=* PRO=* STK=1 NAME=SITE5_11 STACK 1 EMS (lbs/yr)SOURCE MULTIPLIER=1CAS ABBREV MULTIPLIER BG (ug/m^3) AVRG (lbs/yr) MAX (lbs/hr) 9901 DieselExhPM 1 2.26E-1 2.58E-5 106990 1,3-Butadiene 1 3.31E-4 3.78E-8 71432 Benzene 1 1.59E-3 1.81E-7 100414 Ethyl Benzene 1 6.46E-4 7.37E-8 91203 Naphthalene 1 2.89E-5 3.30E-9 115071 Propylene 1 1.88E-3 2.15E-7 100425 Styrene 1 7.59E-5 8.66E-9 108883 Toluene 1 3.54E-3 4.04E-7 1330207 Xylenes 1 2.19E-3 2.50E-7 88101 PM2.5 1 2.37E-1 2.71E-5
EMISSIONS FOR FACILITY FAC=1 DEV=* PRO=* STK=1 NAME=SITE1_07 STACK 1 EMS (lbs/yr)SOURCE MULTIPLIER=1CAS ABBREV MULTIPLIER BG (ug/m^3) AVRG (lbs/yr) MAX (lbs/hr) 9901 DieselExhPM 1 1.19E-1 1.36E-5 106990 1,3-Butadiene 1 1.74E-4 1.99E-8 71432 Benzene 1 8.36E-4 9.54E-8 100414 Ethyl Benzene 1 3.40E-4 3.88E-8 91203 Naphthalene 1 1.52E-5 1.74E-9 115071 Propylene 1 9.92E-4 1.13E-7 100425 Styrene 1 4.00E-5 4.56E-9 108883 Toluene 1 1.86E-3 2.13E-7

1330207 Xylenes 1 1.15E-3 1.32E-7 88101 PM2.5 1 1.25E-1 1.42E-5
EMISSIONS FOR FACILITY FAC=1 DEV=* PRO=* STK=1 NAME=SITE1_08 STACK 1 EMS (lbs/yr)SOURCE MULTIPLIER=1CAS ABBREV MULTIPLIER BG (ug/m^3) AVRG (lbs/yr) MAX (lbs/hr) 9901 DieselExhPM 1 1.19E-1 1.36E-5 106990 1,3-Butadiene 1 1.74E-4 1.99E-8 71432 Benzene 1 8.36E-4 9.54E-8 100414 Ethyl Benzene 1 3.40E-4 3.88E-8 91203 Naphthalene 1 1.52E-5 1.74E-9 115071 Propylene 1 9.92E-4 1.13E-7 100425 Styrene 1 4.00E-5 4.56E-9 108883 Toluene 1 1.86E-3 2.13E-7 1330207 Xylenes 1 1.15E-3 1.32E-7 88101 PM2.5 1 1.25E-1 1.42E-5
CANCER RISK REPORTREC INHAL DERM SOIL MOTHER FISH WATER VEG DAIRY BEEF CHICK PIG EGG MEAT ORAL TOT0001 2.79E-08 0.00E+00 0.00E+00 0.00E+00 0.00E+00 0.00E+00 0.00E+00 0.00E+00 0.00E+00 0.00E+00 0.00E+00 0.00E+00 0.00E+00 0.00E+00 2.79E-0002 1.13E-08 0.00E+00 0.00E+00 0.00E+00 0.00E+00 0.00E+00 0.00E+00 0.00E+00 0.00E+00 0.00E+00 0.00E+00 0.00E+00 0.00E+00 0.00E+00 1.13E-0003 8.11E-09 0.00E+00 0.00E+00 0.00E+00 0.00E+00 0.00E+00 0.00E+00 0.00E+00 0.00E+00 0.00E+00 0.00E+00 0.00E+00 0.00E+00 0.00E+00 8.11E-0004 4.17E-09 0.00E+00 0.00E+00 0.00E+00 0.00E+00 0.00E+00 0.00E+00 0.00E+00 0.00E+00 0.00E+00 0.00E+00 0.00E+00 0.00E+00 0.00E+00 4.17E-0005 3.61E-09 0.00E+00 0.00E+00 0.00E+00 0.00E+00 0.00E+00 0.00E+00 0.00E+00 0.00E+00 0.00E+00 0.00E+00 0.00E+00 0.00E+00 0.00E+00 3.61E-0006 2.11E-09 0.00E+00 0.00E+00 0.00E+00 0.00E+00 0.00E+00 0.00E+00 0.00E+00 0.00E+00 0.00E+00 0.00E+00 0.00E+00 0.00E+00 0.00E+00 2.11E-0007 5.37E-08 0.00E+00 0.00E+00 0.00E+00 0.00E+00 0.00E+00 0.00E+00 0.00E+00 0.00E+00 0.00E+00 0.00E+00 0.00E+00 0.00E+00 0.00E+00 5.37E-0008 4.39E-08 0.00E+00 0.00E+00 0.00E+00 0.00E+00 0.00E+00 0.00E+00 0.00E+00 0.00E+00 0.00E+00 0.00E+00 0.00E+00 0.00E+00 0.00E+00 4.39E-0009 1.40E-08 0.00E+00 0.00E+00 0.00E+00 0.00E+00 0.00E+00 0.00E+00 0.00E+00 0.00E+00 0.00E+00 0.00E+00 0.00E+00 0.00E+00 0.00E+00 1.40E-0010 1.02E-08 0.00E+00 0.00E+00 0.00E+00 0.00E+00 0.00E+00 0.00E+00 0.00E+00 0.00E+00 0.00E+00 0.00E+00 0.00E+00 0.00E+00 0.00E+00 1.02E-

This file: P:\SWB1001\Technical Studies\Air Quality\HRA\Rep_Chr_Res_Avg_AllRec_AllSrc_AllCh_ByRec_Site.txt
Created by HARP Version 1.4d Build 23.09.07Uses ISC Version 99155Uses BPIP (Dated: 04112)Creation date: 3/25/2011 4:45:49 PM
EXCEPTION REPORT (there have been no changes or exceptions)
INPUT FILES: Source-Receptor file: P:\SWB1001\Technical Studies\Air Quality\HRA\SDSP.SRC Averaging period adjustment factors file: not applicable Emission rates file: EmRates.ems Site parameters file: P:\SWB1001\Technical Studies\Air Quality\HRA\project.sit
Coordinate system: UTM NAD83
Screening mode is OFF
Exposure duration: residentAnalysis method: Average Point EstimateHealth effect: Chronic HIReceptor(s): AllSources(s): AllChemicals(s): All
SITE PARAMETERS
DEPOSITION
Deposition rate (m/s) 0.05
DRINKING WATER
*** Pathway disabled ***
FISH
*** Pathway disabled ***
PASTURE
*** Pathway disabled ***
HOME GROWN PRODUCE
*** Pathway disabled ***
PIGS, CHICKENS AND EGGS
*** Pathway disabled ***
DERMAL ABSORPTION
*** Pathway disabled ***

SOIL INGESTION
*** Pathway disabled ***
MOTHER'S MILK
*** Pathway disabled ***
CHEMICAL CROSS-REFERENCE TABLE AND BACKGROUND CONCENTRATIONSCHEM CAS ABBREVIATION POLLUTANT NAME BACKGROUND (ug/m^3)0001 9901 DieselExhPM Diesel engine exhaust, particulate matter (Diesel PM) 0.000E+000002 106990 1,3-Butadiene 1,3-Butadiene 0.000E+000003 71432 Benzene Benzene 0.000E+000004 100414 Ethyl Benzene Ethyl benzene 0.000E+000005 91203 Naphthalene Naphthalene 0.000E+000006 115071 Propylene Propylene 0.000E+000007 100425 Styrene Styrene 0.000E+000008 108883 Toluene Toluene 0.000E+000009 1330207 Xylenes Xylenes (mixed) 0.000E+000010 88101 PM2.5 Particulate Matter 2.5 Microns or Less 0.000E+00
CHEMICAL HEALTH VALUESCHEM CAS ABBREVIATION CancerPF(Inh) CancerPF(Oral) ChronicREL(Inh) ChronicREL(Oral) AcuteREL (mg/kg-d)^-1 (mg/kg-d)^-1 ug/m^3 mg/kg-d ug/m^3
0001 9901 DieselExhPM 1.10E+00 * 5.00E+00 * *0002 106990 1,3-Butadiene 6.00E-01 * 2.00E+01 * *0003 71432 Benzene 1.00E-01 * 6.00E+01 * 1.30E+030004 100414 Ethyl Benzene 8.70E-03 * 2.00E+03 * *0005 91203 Naphthalene 1.20E-01 * 9.00E+00 * *0006 115071 Propylene * * 3.00E+03 * *0007 100425 Styrene * * 9.00E+02 * 2.10E+040008 108883 Toluene * * 3.00E+02 * 3.70E+040009 1330207 Xylenes * * 7.00E+02 * 2.20E+040010 88101 PM2.5 * * * * *
EMISSIONS DATA SOURCE: Emission rates loaded from file: P:\SWB1001\Technical Studies\Air Quality\HRA\EmRates.emsCHEMICALS ADDED OR DELETED: none
EMISSIONS FOR FACILITY FAC=1 DEV=* PRO=* STK=1 NAME=SITE1_01 STACK 1 EMS (lbs/yr)SOURCE MULTIPLIER=1CAS ABBREV MULTIPLIER BG (ug/m^3) AVRG (lbs/yr) MAX (lbs/hr) 9901 DieselExhPM 1 1.19E-1 1.36E-5 106990 1,3-Butadiene 1 1.74E-4 1.99E-8 71432 Benzene 1 8.36E-4 9.54E-8 100414 Ethyl Benzene 1 3.40E-4 3.88E-8 91203 Naphthalene 1 1.52E-5 1.74E-9 115071 Propylene 1 9.92E-4 1.13E-7 100425 Styrene 1 4.00E-5 4.56E-9 108883 Toluene 1 1.86E-3 2.13E-7 1330207 Xylenes 1 1.15E-3 1.32E-7 88101 PM2.5 1 1.25E-1 1.42E-5
EMISSIONS FOR FACILITY FAC=1 DEV=* PRO=* STK=1 NAME=SITE1_02 STACK 1 EMS (lbs/yr)SOURCE MULTIPLIER=1CAS ABBREV MULTIPLIER BG (ug/m^3) AVRG (lbs/yr) MAX (lbs/hr)

9901 DieselExhPM 1 1.19E-1 1.36E-5 106990 1,3-Butadiene 1 1.74E-4 1.99E-8 71432 Benzene 1 8.36E-4 9.54E-8 100414 Ethyl Benzene 1 3.40E-4 3.88E-8 91203 Naphthalene 1 1.52E-5 1.74E-9 115071 Propylene 1 9.92E-4 1.13E-7 100425 Styrene 1 4.00E-5 4.56E-9 108883 Toluene 1 1.86E-3 2.13E-7 1330207 Xylenes 1 1.15E-3 1.32E-7 88101 PM2.5 1 1.25E-1 1.42E-5
EMISSIONS FOR FACILITY FAC=1 DEV=* PRO=* STK=1 NAME=SITE1_03 STACK 1 EMS (lbs/yr)SOURCE MULTIPLIER=1CAS ABBREV MULTIPLIER BG (ug/m^3) AVRG (lbs/yr) MAX (lbs/hr) 9901 DieselExhPM 1 1.19E-1 1.36E-5 106990 1,3-Butadiene 1 1.74E-4 1.99E-8 71432 Benzene 1 8.36E-4 9.54E-8 100414 Ethyl Benzene 1 3.40E-4 3.88E-8 91203 Naphthalene 1 1.52E-5 1.74E-9 115071 Propylene 1 9.92E-4 1.13E-7 100425 Styrene 1 4.00E-5 4.56E-9 108883 Toluene 1 1.86E-3 2.13E-7 1330207 Xylenes 1 1.15E-3 1.32E-7 88101 PM2.5 1 1.25E-1 1.42E-5
EMISSIONS FOR FACILITY FAC=1 DEV=* PRO=* STK=1 NAME=SITE1_04 STACK 1 EMS (lbs/yr)SOURCE MULTIPLIER=1CAS ABBREV MULTIPLIER BG (ug/m^3) AVRG (lbs/yr) MAX (lbs/hr) 9901 DieselExhPM 1 1.19E-1 1.36E-5 106990 1,3-Butadiene 1 1.74E-4 1.99E-8 71432 Benzene 1 8.36E-4 9.54E-8 100414 Ethyl Benzene 1 3.40E-4 3.88E-8 91203 Naphthalene 1 1.52E-5 1.74E-9 115071 Propylene 1 9.92E-4 1.13E-7 100425 Styrene 1 4.00E-5 4.56E-9 108883 Toluene 1 1.86E-3 2.13E-7 1330207 Xylenes 1 1.15E-3 1.32E-7 88101 PM2.5 1 1.25E-1 1.42E-5
EMISSIONS FOR FACILITY FAC=1 DEV=* PRO=* STK=1 NAME=SITE1_05 STACK 1 EMS (lbs/yr)SOURCE MULTIPLIER=1CAS ABBREV MULTIPLIER BG (ug/m^3) AVRG (lbs/yr) MAX (lbs/hr) 9901 DieselExhPM 1 1.19E-1 1.36E-5 106990 1,3-Butadiene 1 1.74E-4 1.99E-8 71432 Benzene 1 8.36E-4 9.54E-8 100414 Ethyl Benzene 1 3.40E-4 3.88E-8 91203 Naphthalene 1 1.52E-5 1.74E-9 115071 Propylene 1 9.92E-4 1.13E-7 100425 Styrene 1 4.00E-5 4.56E-9 108883 Toluene 1 1.86E-3 2.13E-7 1330207 Xylenes 1 1.15E-3 1.32E-7 88101 PM2.5 1 1.25E-1 1.42E-5
EMISSIONS FOR FACILITY FAC=1 DEV=* PRO=* STK=1 NAME=SITE1_06 STACK 1 EMS (lbs/yr)SOURCE MULTIPLIER=1CAS ABBREV MULTIPLIER BG (ug/m^3) AVRG (lbs/yr) MAX (lbs/hr) 9901 DieselExhPM 1 1.19E-1 1.36E-5 106990 1,3-Butadiene 1 1.74E-4 1.99E-8

71432 Benzene 1 8.36E-4 9.54E-8 100414 Ethyl Benzene 1 3.40E-4 3.88E-8 91203 Naphthalene 1 1.52E-5 1.74E-9 115071 Propylene 1 9.92E-4 1.13E-7 100425 Styrene 1 4.00E-5 4.56E-9 108883 Toluene 1 1.86E-3 2.13E-7 1330207 Xylenes 1 1.15E-3 1.32E-7 88101 PM2.5 1 1.25E-1 1.42E-5
EMISSIONS FOR FACILITY FAC=1 DEV=* PRO=* STK=1 NAME=SITE5_01 STACK 1 EMS (lbs/yr)SOURCE MULTIPLIER=1CAS ABBREV MULTIPLIER BG (ug/m^3) AVRG (lbs/yr) MAX (lbs/hr) 9901 DieselExhPM 1 2.26E-1 2.58E-5 106990 1,3-Butadiene 1 3.31E-4 3.78E-8 71432 Benzene 1 1.59E-3 1.81E-7 100414 Ethyl Benzene 1 6.46E-4 7.37E-8 91203 Naphthalene 1 2.89E-5 3.30E-9 115071 Propylene 1 1.88E-3 2.15E-7 100425 Styrene 1 7.59E-5 8.66E-9 108883 Toluene 1 3.54E-3 4.04E-7 1330207 Xylenes 1 2.19E-3 2.50E-7 88101 PM2.5 1 2.37E-1 2.71E-5
EMISSIONS FOR FACILITY FAC=1 DEV=* PRO=* STK=1 NAME=SITE5_02 STACK 1 EMS (lbs/yr)SOURCE MULTIPLIER=1CAS ABBREV MULTIPLIER BG (ug/m^3) AVRG (lbs/yr) MAX (lbs/hr) 9901 DieselExhPM 1 2.26E-1 2.58E-5 106990 1,3-Butadiene 1 3.31E-4 3.78E-8 71432 Benzene 1 1.59E-3 1.81E-7 100414 Ethyl Benzene 1 6.46E-4 7.37E-8 91203 Naphthalene 1 2.89E-5 3.30E-9 115071 Propylene 1 1.88E-3 2.15E-7 100425 Styrene 1 7.59E-5 8.66E-9 108883 Toluene 1 3.54E-3 4.04E-7 1330207 Xylenes 1 2.19E-3 2.50E-7 88101 PM2.5 1 2.37E-1 2.71E-5
EMISSIONS FOR FACILITY FAC=1 DEV=* PRO=* STK=1 NAME=SITE5_03 STACK 1 EMS (lbs/yr)SOURCE MULTIPLIER=1CAS ABBREV MULTIPLIER BG (ug/m^3) AVRG (lbs/yr) MAX (lbs/hr) 9901 DieselExhPM 1 2.26E-1 2.58E-5 106990 1,3-Butadiene 1 3.31E-4 3.78E-8 71432 Benzene 1 1.59E-3 1.81E-7 100414 Ethyl Benzene 1 6.46E-4 7.37E-8 91203 Naphthalene 1 2.89E-5 3.30E-9 115071 Propylene 1 1.88E-3 2.15E-7 100425 Styrene 1 7.59E-5 8.66E-9 108883 Toluene 1 3.54E-3 4.04E-7 1330207 Xylenes 1 2.19E-3 2.50E-7 88101 PM2.5 1 2.37E-1 2.71E-5
EMISSIONS FOR FACILITY FAC=1 DEV=* PRO=* STK=1 NAME=SITE5_04 STACK 1 EMS (lbs/yr)SOURCE MULTIPLIER=1CAS ABBREV MULTIPLIER BG (ug/m^3) AVRG (lbs/yr) MAX (lbs/hr) 9901 DieselExhPM 1 2.26E-1 2.58E-5 106990 1,3-Butadiene 1 3.31E-4 3.78E-8 71432 Benzene 1 1.59E-3 1.81E-7 100414 Ethyl Benzene 1 6.46E-4 7.37E-8

91203 Naphthalene 1 2.89E-5 3.30E-9 115071 Propylene 1 1.88E-3 2.15E-7 100425 Styrene 1 7.59E-5 8.66E-9 108883 Toluene 1 3.54E-3 4.04E-7 1330207 Xylenes 1 2.19E-3 2.50E-7 88101 PM2.5 1 2.37E-1 2.71E-5
EMISSIONS FOR FACILITY FAC=1 DEV=* PRO=* STK=1 NAME=SITE5_05 STACK 1 EMS (lbs/yr)SOURCE MULTIPLIER=1CAS ABBREV MULTIPLIER BG (ug/m^3) AVRG (lbs/yr) MAX (lbs/hr) 9901 DieselExhPM 1 2.26E-1 2.58E-5 106990 1,3-Butadiene 1 3.31E-4 3.78E-8 71432 Benzene 1 1.59E-3 1.81E-7 100414 Ethyl Benzene 1 6.46E-4 7.37E-8 91203 Naphthalene 1 2.89E-5 3.30E-9 115071 Propylene 1 1.88E-3 2.15E-7 100425 Styrene 1 7.59E-5 8.66E-9 108883 Toluene 1 3.54E-3 4.04E-7 1330207 Xylenes 1 2.19E-3 2.50E-7 88101 PM2.5 1 2.37E-1 2.71E-5
EMISSIONS FOR FACILITY FAC=1 DEV=* PRO=* STK=1 NAME=SITE5_06 STACK 1 EMS (lbs/yr)SOURCE MULTIPLIER=1CAS ABBREV MULTIPLIER BG (ug/m^3) AVRG (lbs/yr) MAX (lbs/hr) 9901 DieselExhPM 1 2.26E-1 2.58E-5 106990 1,3-Butadiene 1 3.31E-4 3.78E-8 71432 Benzene 1 1.59E-3 1.81E-7 100414 Ethyl Benzene 1 6.46E-4 7.37E-8 91203 Naphthalene 1 2.89E-5 3.30E-9 115071 Propylene 1 1.88E-3 2.15E-7 100425 Styrene 1 7.59E-5 8.66E-9 108883 Toluene 1 3.54E-3 4.04E-7 1330207 Xylenes 1 2.19E-3 2.50E-7 88101 PM2.5 1 2.37E-1 2.71E-5
EMISSIONS FOR FACILITY FAC=1 DEV=* PRO=* STK=1 NAME=SITE5_07 STACK 1 EMS (lbs/yr)SOURCE MULTIPLIER=1CAS ABBREV MULTIPLIER BG (ug/m^3) AVRG (lbs/yr) MAX (lbs/hr) 9901 DieselExhPM 1 2.26E-1 2.58E-5 106990 1,3-Butadiene 1 3.31E-4 3.78E-8 71432 Benzene 1 1.59E-3 1.81E-7 100414 Ethyl Benzene 1 6.46E-4 7.37E-8 91203 Naphthalene 1 2.89E-5 3.30E-9 115071 Propylene 1 1.88E-3 2.15E-7 100425 Styrene 1 7.59E-5 8.66E-9 108883 Toluene 1 3.54E-3 4.04E-7 1330207 Xylenes 1 2.19E-3 2.50E-7 88101 PM2.5 1 2.37E-1 2.71E-5
EMISSIONS FOR FACILITY FAC=1 DEV=* PRO=* STK=1 NAME=SITE5_08 STACK 1 EMS (lbs/yr)SOURCE MULTIPLIER=1CAS ABBREV MULTIPLIER BG (ug/m^3) AVRG (lbs/yr) MAX (lbs/hr) 9901 DieselExhPM 1 2.26E-1 2.58E-5 106990 1,3-Butadiene 1 3.31E-4 3.78E-8 71432 Benzene 1 1.59E-3 1.81E-7 100414 Ethyl Benzene 1 6.46E-4 7.37E-8 91203 Naphthalene 1 2.89E-5 3.30E-9 115071 Propylene 1 1.88E-3 2.15E-7
100425 Styrene 1 7.59E-5 8.66E-9 108883 Toluene 1 3.54E-3 4.04E-7 1330207 Xylenes 1 2.19E-3 2.50E-7 88101 PM2.5 1 2.37E-1 2.71E-5
EMISSIONS FOR FACILITY FAC=1 DEV=* PRO=* STK=1 NAME=SITE5_09 STACK 1 EMS (lbs/yr)SOURCE MULTIPLIER=1CAS ABBREV MULTIPLIER BG (ug/m^3) AVRG (lbs/yr) MAX (lbs/hr) 9901 DieselExhPM 1 2.26E-1 2.58E-5 106990 1,3-Butadiene 1 3.31E-4 3.78E-8 71432 Benzene 1 1.59E-3 1.81E-7 100414 Ethyl Benzene 1 6.46E-4 7.37E-8 91203 Naphthalene 1 2.89E-5 3.30E-9 115071 Propylene 1 1.88E-3 2.15E-7 100425 Styrene 1 7.59E-5 8.66E-9 108883 Toluene 1 3.54E-3 4.04E-7 1330207 Xylenes 1 2.19E-3 2.50E-7 88101 PM2.5 1 2.37E-1 2.71E-5
EMISSIONS FOR FACILITY FAC=1 DEV=* PRO=* STK=1 NAME=SITE5_10 STACK 1 EMS (lbs/yr)SOURCE MULTIPLIER=1CAS ABBREV MULTIPLIER BG (ug/m^3) AVRG (lbs/yr) MAX (lbs/hr) 9901 DieselExhPM 1 2.26E-1 2.58E-5 106990 1,3-Butadiene 1 3.31E-4 3.78E-8 71432 Benzene 1 1.59E-3 1.81E-7 100414 Ethyl Benzene 1 6.46E-4 7.37E-8 91203 Naphthalene 1 2.89E-5 3.30E-9 115071 Propylene 1 1.88E-3 2.15E-7 100425 Styrene 1 7.59E-5 8.66E-9 108883 Toluene 1 3.54E-3 4.04E-7 1330207 Xylenes 1 2.19E-3 2.50E-7 88101 PM2.5 1 2.37E-1 2.71E-5
EMISSIONS FOR FACILITY FAC=1 DEV=* PRO=* STK=1 NAME=SITE5_11 STACK 1 EMS (lbs/yr)SOURCE MULTIPLIER=1CAS ABBREV MULTIPLIER BG (ug/m^3) AVRG (lbs/yr) MAX (lbs/hr) 9901 DieselExhPM 1 2.26E-1 2.58E-5 106990 1,3-Butadiene 1 3.31E-4 3.78E-8 71432 Benzene 1 1.59E-3 1.81E-7 100414 Ethyl Benzene 1 6.46E-4 7.37E-8 91203 Naphthalene 1 2.89E-5 3.30E-9 115071 Propylene 1 1.88E-3 2.15E-7 100425 Styrene 1 7.59E-5 8.66E-9 108883 Toluene 1 3.54E-3 4.04E-7 1330207 Xylenes 1 2.19E-3 2.50E-7 88101 PM2.5 1 2.37E-1 2.71E-5
EMISSIONS FOR FACILITY FAC=1 DEV=* PRO=* STK=1 NAME=SITE1_07 STACK 1 EMS (lbs/yr)SOURCE MULTIPLIER=1CAS ABBREV MULTIPLIER BG (ug/m^3) AVRG (lbs/yr) MAX (lbs/hr) 9901 DieselExhPM 1 1.19E-1 1.36E-5 106990 1,3-Butadiene 1 1.74E-4 1.99E-8 71432 Benzene 1 8.36E-4 9.54E-8 100414 Ethyl Benzene 1 3.40E-4 3.88E-8 91203 Naphthalene 1 1.52E-5 1.74E-9 115071 Propylene 1 9.92E-4 1.13E-7 100425 Styrene 1 4.00E-5 4.56E-9 108883 Toluene 1 1.86E-3 2.13E-7
1330207 Xylenes 1 1.15E-3 1.32E-7 88101 PM2.5 1 1.25E-1 1.42E-5
EMISSIONS FOR FACILITY FAC=1 DEV=* PRO=* STK=1 NAME=SITE1_08 STACK 1 EMS (lbs/yr)SOURCE MULTIPLIER=1CAS ABBREV MULTIPLIER BG (ug/m^3) AVRG (lbs/yr) MAX (lbs/hr) 9901 DieselExhPM 1 1.19E-1 1.36E-5 106990 1,3-Butadiene 1 1.74E-4 1.99E-8 71432 Benzene 1 8.36E-4 9.54E-8 100414 Ethyl Benzene 1 3.40E-4 3.88E-8 91203 Naphthalene 1 1.52E-5 1.74E-9 115071 Propylene 1 9.92E-4 1.13E-7 100425 Styrene 1 4.00E-5 4.56E-9 108883 Toluene 1 1.86E-3 2.13E-7 1330207 Xylenes 1 1.15E-3 1.32E-7 88101 PM2.5 1 1.25E-1 1.42E-5
CHRONIC HI REPORTREC CV CNS BONE DEVEL ENDO EYE GILV IMMUN KIDN REPRO RESP SKIN BLOOD MAX0001 0.00E+00 8.35E-08 0.00E+00 7.77E-08 6.49E-10 0.00E+00 6.49E-10 0.00E+00 6.49E-10 3.33E-08 9.09E-05 0.00E+00 5.33E-08 9.09E-050002 0.00E+00 3.37E-08 0.00E+00 3.13E-08 2.62E-10 0.00E+00 2.62E-10 0.00E+00 2.62E-10 1.34E-08 3.67E-05 0.00E+00 2.15E-08 3.67E-050003 0.00E+00 2.43E-08 0.00E+00 2.26E-08 1.89E-10 0.00E+00 1.89E-10 0.00E+00 1.89E-10 9.68E-09 2.64E-05 0.00E+00 1.55E-08 2.64E-050004 0.00E+00 1.24E-08 0.00E+00 1.16E-08 9.70E-11 0.00E+00 9.70E-11 0.00E+00 9.70E-11 4.96E-09 1.36E-05 0.00E+00 7.95E-09 1.36E-050005 0.00E+00 1.08E-08 0.00E+00 1.00E-08 8.40E-11 0.00E+00 8.40E-11 0.00E+00 8.40E-11 4.30E-09 1.18E-05 0.00E+00 6.89E-09 1.18E-050006 0.00E+00 6.30E-09 0.00E+00 5.87E-09 4.91E-11 0.00E+00 4.91E-11 0.00E+00 4.91E-11 2.51E-09 6.88E-06 0.00E+00 4.03E-09 6.88E-060007 0.00E+00 1.61E-07 0.00E+00 1.49E-07 1.25E-09 0.00E+00 1.25E-09 0.00E+00 1.25E-09 6.40E-08 1.75E-04 0.00E+00 1.02E-07 1.75E-040008 0.00E+00 1.31E-07 0.00E+00 1.22E-07 1.02E-09 0.00E+00 1.02E-09 0.00E+00 1.02E-09 5.23E-08 1.43E-04 0.00E+00 8.38E-08 1.43E-040009 0.00E+00 4.17E-08 0.00E+00 3.88E-08 3.25E-10 0.00E+00 3.25E-10 0.00E+00 3.25E-10 1.66E-08 4.55E-05 0.00E+00 2.66E-08 4.55E-050010 0.00E+00 3.04E-08 0.00E+00 2.83E-08 2.37E-10 0.00E+00 2.37E-10 0.00E+00 2.37E-10 1.21E-08 3.32E-05 0.00E+00 1.94E-08 3.32E-05
This file: P:\SWB1001\Technical Studies\Air Quality\HRA\Rep_Acu_AllRec_AllSrc_AllCh_ByRec.txt
Created by HARP Version 1.4d Build 23.09.07Uses ISC Version 99155Uses BPIP (Dated: 04112)Creation date: 3/25/2011 4:45:43 PM
EXCEPTION REPORT (there have been no changes or exceptions)
INPUT FILES: Source-Receptor file: P:\SWB1001\Technical Studies\Air Quality\HRA\SDSP.SRC Averaging period adjustment factors file: not applicable Emission rates file: EmRates.ems Site parameters file: P:\SWB1001\Technical Studies\Air Quality\HRA\project.sit
Coordinate system: UTM NAD83
Screening mode is OFF
Analysis method: Point EstimateHealth effect: Acute HI Simple (Concurrent Max.)Receptor(s): AllSources(s): AllChemicals(s): All
CHEMICAL CROSS-REFERENCE TABLE AND BACKGROUND CONCENTRATIONSCHEM CAS ABBREVIATION POLLUTANT NAME BACKGROUND (ug/m^3)0001 9901 DieselExhPM Diesel engine exhaust, particulate matter (Diesel PM) 0.000E+000002 106990 1,3-Butadiene 1,3-Butadiene 0.000E+000003 71432 Benzene Benzene 0.000E+000004 100414 Ethyl Benzene Ethyl benzene 0.000E+000005 91203 Naphthalene Naphthalene 0.000E+000006 115071 Propylene Propylene 0.000E+000007 100425 Styrene Styrene 0.000E+000008 108883 Toluene Toluene 0.000E+000009 1330207 Xylenes Xylenes (mixed) 0.000E+000010 88101 PM2.5 Particulate Matter 2.5 Microns or Less 0.000E+00
CHEMICAL HEALTH VALUESCHEM CAS ABBREVIATION CancerPF(Inh) CancerPF(Oral) ChronicREL(Inh) ChronicREL(Oral) AcuteREL (mg/kg-d)^-1 (mg/kg-d)^-1 ug/m^3 mg/kg-d ug/m^3
0001 9901 DieselExhPM 1.10E+00 * 5.00E+00 * *0002 106990 1,3-Butadiene 6.00E-01 * 2.00E+01 * *0003 71432 Benzene 1.00E-01 * 6.00E+01 * 1.30E+030004 100414 Ethyl Benzene 8.70E-03 * 2.00E+03 * *0005 91203 Naphthalene 1.20E-01 * 9.00E+00 * *0006 115071 Propylene * * 3.00E+03 * *0007 100425 Styrene * * 9.00E+02 * 2.10E+040008 108883 Toluene * * 3.00E+02 * 3.70E+040009 1330207 Xylenes * * 7.00E+02 * 2.20E+040010 88101 PM2.5 * * * * *
EMISSIONS DATA SOURCE: Emission rates loaded from file: P:\SWB1001\Technical Studies\Air Quality\HRA\EmRates.emsCHEMICALS ADDED OR DELETED: none

EMISSIONS FOR FACILITY FAC=1 DEV=* PRO=* STK=1 NAME=SITE1_01 STACK 1 EMS (lbs/yr)SOURCE MULTIPLIER=1CAS ABBREV MULTIPLIER BG (ug/m^3) AVRG (lbs/yr) MAX (lbs/hr) 9901 DieselExhPM 1 1.19E-1 1.36E-5 106990 1,3-Butadiene 1 1.74E-4 1.99E-8 71432 Benzene 1 8.36E-4 9.54E-8 100414 Ethyl Benzene 1 3.40E-4 3.88E-8 91203 Naphthalene 1 1.52E-5 1.74E-9 115071 Propylene 1 9.92E-4 1.13E-7 100425 Styrene 1 4.00E-5 4.56E-9 108883 Toluene 1 1.86E-3 2.13E-7 1330207 Xylenes 1 1.15E-3 1.32E-7 88101 PM2.5 1 1.25E-1 1.42E-5
EMISSIONS FOR FACILITY FAC=1 DEV=* PRO=* STK=1 NAME=SITE1_02 STACK 1 EMS (lbs/yr)SOURCE MULTIPLIER=1CAS ABBREV MULTIPLIER BG (ug/m^3) AVRG (lbs/yr) MAX (lbs/hr) 9901 DieselExhPM 1 1.19E-1 1.36E-5 106990 1,3-Butadiene 1 1.74E-4 1.99E-8 71432 Benzene 1 8.36E-4 9.54E-8 100414 Ethyl Benzene 1 3.40E-4 3.88E-8 91203 Naphthalene 1 1.52E-5 1.74E-9 115071 Propylene 1 9.92E-4 1.13E-7 100425 Styrene 1 4.00E-5 4.56E-9 108883 Toluene 1 1.86E-3 2.13E-7 1330207 Xylenes 1 1.15E-3 1.32E-7 88101 PM2.5 1 1.25E-1 1.42E-5
EMISSIONS FOR FACILITY FAC=1 DEV=* PRO=* STK=1 NAME=SITE1_03 STACK 1 EMS (lbs/yr)SOURCE MULTIPLIER=1CAS ABBREV MULTIPLIER BG (ug/m^3) AVRG (lbs/yr) MAX (lbs/hr) 9901 DieselExhPM 1 1.19E-1 1.36E-5 106990 1,3-Butadiene 1 1.74E-4 1.99E-8 71432 Benzene 1 8.36E-4 9.54E-8 100414 Ethyl Benzene 1 3.40E-4 3.88E-8 91203 Naphthalene 1 1.52E-5 1.74E-9 115071 Propylene 1 9.92E-4 1.13E-7 100425 Styrene 1 4.00E-5 4.56E-9 108883 Toluene 1 1.86E-3 2.13E-7 1330207 Xylenes 1 1.15E-3 1.32E-7 88101 PM2.5 1 1.25E-1 1.42E-5
EMISSIONS FOR FACILITY FAC=1 DEV=* PRO=* STK=1 NAME=SITE1_04 STACK 1 EMS (lbs/yr)SOURCE MULTIPLIER=1CAS ABBREV MULTIPLIER BG (ug/m^3) AVRG (lbs/yr) MAX (lbs/hr) 9901 DieselExhPM 1 1.19E-1 1.36E-5 106990 1,3-Butadiene 1 1.74E-4 1.99E-8 71432 Benzene 1 8.36E-4 9.54E-8 100414 Ethyl Benzene 1 3.40E-4 3.88E-8 91203 Naphthalene 1 1.52E-5 1.74E-9 115071 Propylene 1 9.92E-4 1.13E-7 100425 Styrene 1 4.00E-5 4.56E-9 108883 Toluene 1 1.86E-3 2.13E-7 1330207 Xylenes 1 1.15E-3 1.32E-7 88101 PM2.5 1 1.25E-1 1.42E-5
EMISSIONS FOR FACILITY FAC=1 DEV=* PRO=* STK=1 NAME=SITE1_05 STACK 1 EMS (lbs/yr)SOURCE MULTIPLIER=1
CAS ABBREV MULTIPLIER BG (ug/m^3) AVRG (lbs/yr) MAX (lbs/hr) 9901 DieselExhPM 1 1.19E-1 1.36E-5 106990 1,3-Butadiene 1 1.74E-4 1.99E-8 71432 Benzene 1 8.36E-4 9.54E-8 100414 Ethyl Benzene 1 3.40E-4 3.88E-8 91203 Naphthalene 1 1.52E-5 1.74E-9 115071 Propylene 1 9.92E-4 1.13E-7 100425 Styrene 1 4.00E-5 4.56E-9 108883 Toluene 1 1.86E-3 2.13E-7 1330207 Xylenes 1 1.15E-3 1.32E-7 88101 PM2.5 1 1.25E-1 1.42E-5
EMISSIONS FOR FACILITY FAC=1 DEV=* PRO=* STK=1 NAME=SITE1_06 STACK 1 EMS (lbs/yr)SOURCE MULTIPLIER=1CAS ABBREV MULTIPLIER BG (ug/m^3) AVRG (lbs/yr) MAX (lbs/hr) 9901 DieselExhPM 1 1.19E-1 1.36E-5 106990 1,3-Butadiene 1 1.74E-4 1.99E-8 71432 Benzene 1 8.36E-4 9.54E-8 100414 Ethyl Benzene 1 3.40E-4 3.88E-8 91203 Naphthalene 1 1.52E-5 1.74E-9 115071 Propylene 1 9.92E-4 1.13E-7 100425 Styrene 1 4.00E-5 4.56E-9 108883 Toluene 1 1.86E-3 2.13E-7 1330207 Xylenes 1 1.15E-3 1.32E-7 88101 PM2.5 1 1.25E-1 1.42E-5
EMISSIONS FOR FACILITY FAC=1 DEV=* PRO=* STK=1 NAME=SITE5_01 STACK 1 EMS (lbs/yr)SOURCE MULTIPLIER=1CAS ABBREV MULTIPLIER BG (ug/m^3) AVRG (lbs/yr) MAX (lbs/hr) 9901 DieselExhPM 1 2.26E-1 2.58E-5 106990 1,3-Butadiene 1 3.31E-4 3.78E-8 71432 Benzene 1 1.59E-3 1.81E-7 100414 Ethyl Benzene 1 6.46E-4 7.37E-8 91203 Naphthalene 1 2.89E-5 3.30E-9 115071 Propylene 1 1.88E-3 2.15E-7 100425 Styrene 1 7.59E-5 8.66E-9 108883 Toluene 1 3.54E-3 4.04E-7 1330207 Xylenes 1 2.19E-3 2.50E-7 88101 PM2.5 1 2.37E-1 2.71E-5
EMISSIONS FOR FACILITY FAC=1 DEV=* PRO=* STK=1 NAME=SITE5_02 STACK 1 EMS (lbs/yr)SOURCE MULTIPLIER=1CAS ABBREV MULTIPLIER BG (ug/m^3) AVRG (lbs/yr) MAX (lbs/hr) 9901 DieselExhPM 1 2.26E-1 2.58E-5 106990 1,3-Butadiene 1 3.31E-4 3.78E-8 71432 Benzene 1 1.59E-3 1.81E-7 100414 Ethyl Benzene 1 6.46E-4 7.37E-8 91203 Naphthalene 1 2.89E-5 3.30E-9 115071 Propylene 1 1.88E-3 2.15E-7 100425 Styrene 1 7.59E-5 8.66E-9 108883 Toluene 1 3.54E-3 4.04E-7 1330207 Xylenes 1 2.19E-3 2.50E-7 88101 PM2.5 1 2.37E-1 2.71E-5
EMISSIONS FOR FACILITY FAC=1 DEV=* PRO=* STK=1 NAME=SITE5_03 STACK 1 EMS (lbs/yr)SOURCE MULTIPLIER=1CAS ABBREV MULTIPLIER BG (ug/m^3) AVRG (lbs/yr) MAX (lbs/hr) 9901 DieselExhPM 1 2.26E-1 2.58E-5
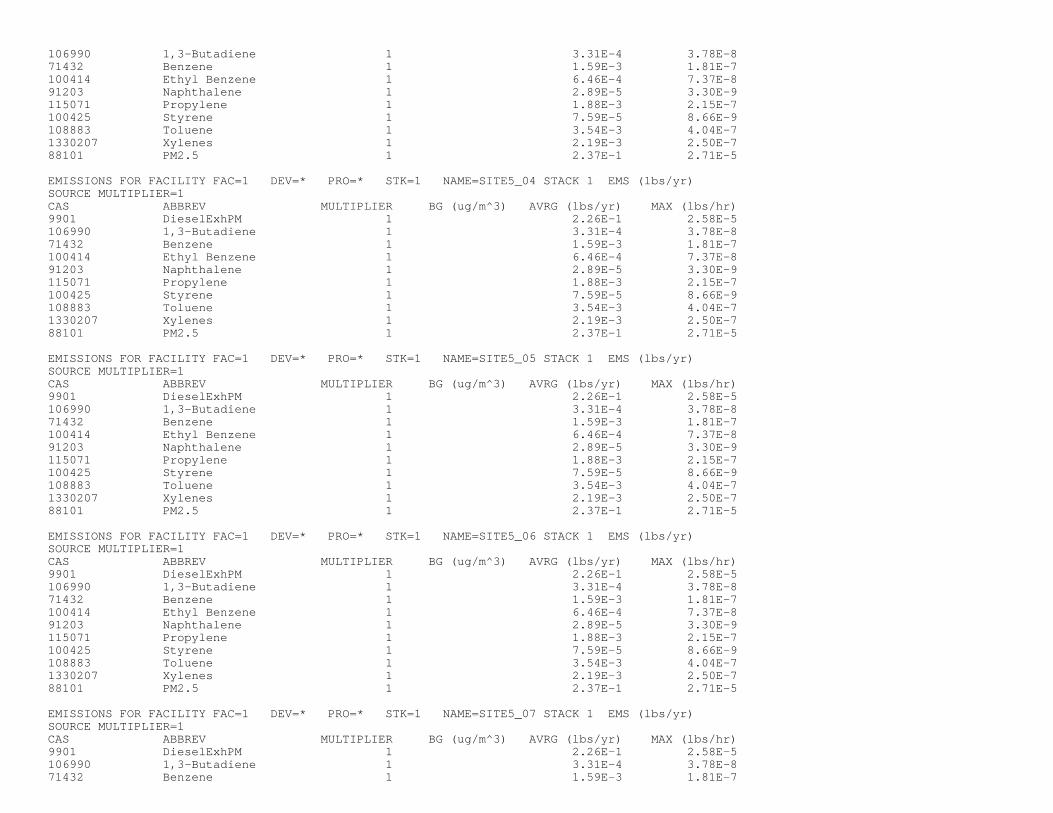
106990 1,3-Butadiene 1 3.31E-4 3.78E-8 71432 Benzene 1 1.59E-3 1.81E-7 100414 Ethyl Benzene 1 6.46E-4 7.37E-8 91203 Naphthalene 1 2.89E-5 3.30E-9 115071 Propylene 1 1.88E-3 2.15E-7 100425 Styrene 1 7.59E-5 8.66E-9 108883 Toluene 1 3.54E-3 4.04E-7 1330207 Xylenes 1 2.19E-3 2.50E-7 88101 PM2.5 1 2.37E-1 2.71E-5
EMISSIONS FOR FACILITY FAC=1 DEV=* PRO=* STK=1 NAME=SITE5_04 STACK 1 EMS (lbs/yr)SOURCE MULTIPLIER=1CAS ABBREV MULTIPLIER BG (ug/m^3) AVRG (lbs/yr) MAX (lbs/hr) 9901 DieselExhPM 1 2.26E-1 2.58E-5 106990 1,3-Butadiene 1 3.31E-4 3.78E-8 71432 Benzene 1 1.59E-3 1.81E-7 100414 Ethyl Benzene 1 6.46E-4 7.37E-8 91203 Naphthalene 1 2.89E-5 3.30E-9 115071 Propylene 1 1.88E-3 2.15E-7 100425 Styrene 1 7.59E-5 8.66E-9 108883 Toluene 1 3.54E-3 4.04E-7 1330207 Xylenes 1 2.19E-3 2.50E-7 88101 PM2.5 1 2.37E-1 2.71E-5
EMISSIONS FOR FACILITY FAC=1 DEV=* PRO=* STK=1 NAME=SITE5_05 STACK 1 EMS (lbs/yr)SOURCE MULTIPLIER=1CAS ABBREV MULTIPLIER BG (ug/m^3) AVRG (lbs/yr) MAX (lbs/hr) 9901 DieselExhPM 1 2.26E-1 2.58E-5 106990 1,3-Butadiene 1 3.31E-4 3.78E-8 71432 Benzene 1 1.59E-3 1.81E-7 100414 Ethyl Benzene 1 6.46E-4 7.37E-8 91203 Naphthalene 1 2.89E-5 3.30E-9 115071 Propylene 1 1.88E-3 2.15E-7 100425 Styrene 1 7.59E-5 8.66E-9 108883 Toluene 1 3.54E-3 4.04E-7 1330207 Xylenes 1 2.19E-3 2.50E-7 88101 PM2.5 1 2.37E-1 2.71E-5
EMISSIONS FOR FACILITY FAC=1 DEV=* PRO=* STK=1 NAME=SITE5_06 STACK 1 EMS (lbs/yr)SOURCE MULTIPLIER=1CAS ABBREV MULTIPLIER BG (ug/m^3) AVRG (lbs/yr) MAX (lbs/hr) 9901 DieselExhPM 1 2.26E-1 2.58E-5 106990 1,3-Butadiene 1 3.31E-4 3.78E-8 71432 Benzene 1 1.59E-3 1.81E-7 100414 Ethyl Benzene 1 6.46E-4 7.37E-8 91203 Naphthalene 1 2.89E-5 3.30E-9 115071 Propylene 1 1.88E-3 2.15E-7 100425 Styrene 1 7.59E-5 8.66E-9 108883 Toluene 1 3.54E-3 4.04E-7 1330207 Xylenes 1 2.19E-3 2.50E-7 88101 PM2.5 1 2.37E-1 2.71E-5
EMISSIONS FOR FACILITY FAC=1 DEV=* PRO=* STK=1 NAME=SITE5_07 STACK 1 EMS (lbs/yr)SOURCE MULTIPLIER=1CAS ABBREV MULTIPLIER BG (ug/m^3) AVRG (lbs/yr) MAX (lbs/hr) 9901 DieselExhPM 1 2.26E-1 2.58E-5 106990 1,3-Butadiene 1 3.31E-4 3.78E-8 71432 Benzene 1 1.59E-3 1.81E-7
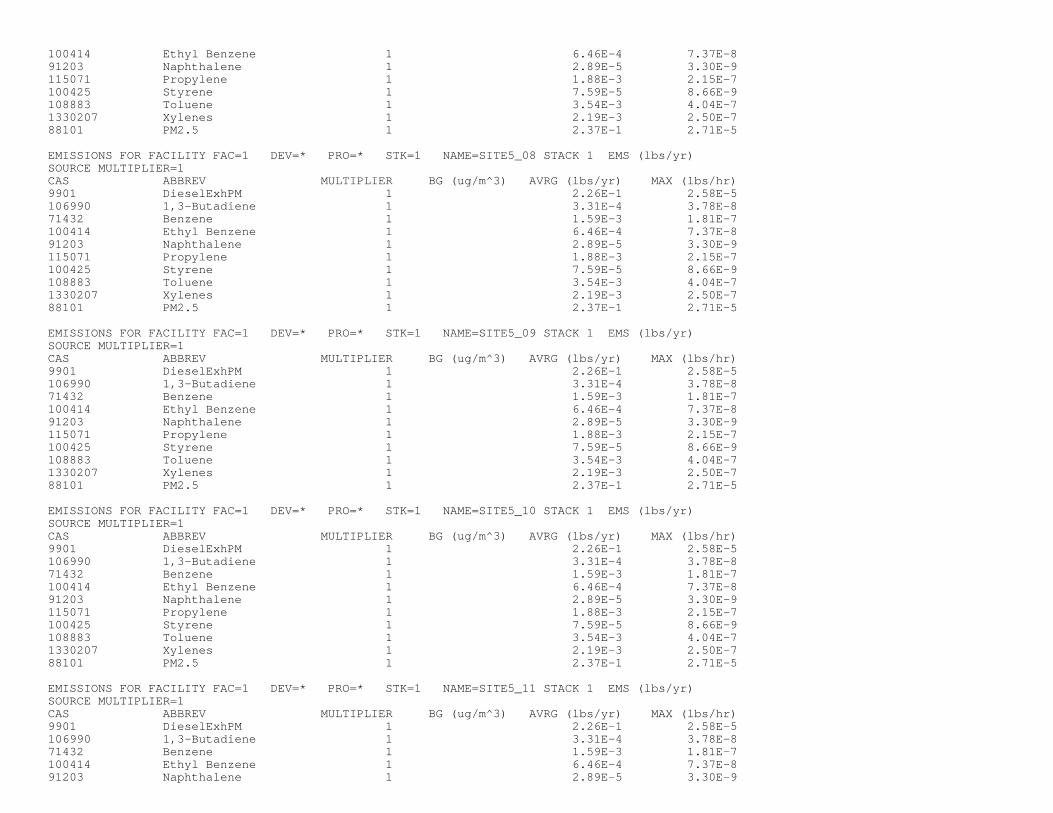
100414 Ethyl Benzene 1 6.46E-4 7.37E-8 91203 Naphthalene 1 2.89E-5 3.30E-9 115071 Propylene 1 1.88E-3 2.15E-7 100425 Styrene 1 7.59E-5 8.66E-9 108883 Toluene 1 3.54E-3 4.04E-7 1330207 Xylenes 1 2.19E-3 2.50E-7 88101 PM2.5 1 2.37E-1 2.71E-5
EMISSIONS FOR FACILITY FAC=1 DEV=* PRO=* STK=1 NAME=SITE5_08 STACK 1 EMS (lbs/yr)SOURCE MULTIPLIER=1CAS ABBREV MULTIPLIER BG (ug/m^3) AVRG (lbs/yr) MAX (lbs/hr) 9901 DieselExhPM 1 2.26E-1 2.58E-5 106990 1,3-Butadiene 1 3.31E-4 3.78E-8 71432 Benzene 1 1.59E-3 1.81E-7 100414 Ethyl Benzene 1 6.46E-4 7.37E-8 91203 Naphthalene 1 2.89E-5 3.30E-9 115071 Propylene 1 1.88E-3 2.15E-7 100425 Styrene 1 7.59E-5 8.66E-9 108883 Toluene 1 3.54E-3 4.04E-7 1330207 Xylenes 1 2.19E-3 2.50E-7 88101 PM2.5 1 2.37E-1 2.71E-5
EMISSIONS FOR FACILITY FAC=1 DEV=* PRO=* STK=1 NAME=SITE5_09 STACK 1 EMS (lbs/yr)SOURCE MULTIPLIER=1CAS ABBREV MULTIPLIER BG (ug/m^3) AVRG (lbs/yr) MAX (lbs/hr) 9901 DieselExhPM 1 2.26E-1 2.58E-5 106990 1,3-Butadiene 1 3.31E-4 3.78E-8 71432 Benzene 1 1.59E-3 1.81E-7 100414 Ethyl Benzene 1 6.46E-4 7.37E-8 91203 Naphthalene 1 2.89E-5 3.30E-9 115071 Propylene 1 1.88E-3 2.15E-7 100425 Styrene 1 7.59E-5 8.66E-9 108883 Toluene 1 3.54E-3 4.04E-7 1330207 Xylenes 1 2.19E-3 2.50E-7 88101 PM2.5 1 2.37E-1 2.71E-5
EMISSIONS FOR FACILITY FAC=1 DEV=* PRO=* STK=1 NAME=SITE5_10 STACK 1 EMS (lbs/yr)SOURCE MULTIPLIER=1CAS ABBREV MULTIPLIER BG (ug/m^3) AVRG (lbs/yr) MAX (lbs/hr) 9901 DieselExhPM 1 2.26E-1 2.58E-5 106990 1,3-Butadiene 1 3.31E-4 3.78E-8 71432 Benzene 1 1.59E-3 1.81E-7 100414 Ethyl Benzene 1 6.46E-4 7.37E-8 91203 Naphthalene 1 2.89E-5 3.30E-9 115071 Propylene 1 1.88E-3 2.15E-7 100425 Styrene 1 7.59E-5 8.66E-9 108883 Toluene 1 3.54E-3 4.04E-7 1330207 Xylenes 1 2.19E-3 2.50E-7 88101 PM2.5 1 2.37E-1 2.71E-5
EMISSIONS FOR FACILITY FAC=1 DEV=* PRO=* STK=1 NAME=SITE5_11 STACK 1 EMS (lbs/yr)SOURCE MULTIPLIER=1CAS ABBREV MULTIPLIER BG (ug/m^3) AVRG (lbs/yr) MAX (lbs/hr) 9901 DieselExhPM 1 2.26E-1 2.58E-5 106990 1,3-Butadiene 1 3.31E-4 3.78E-8 71432 Benzene 1 1.59E-3 1.81E-7 100414 Ethyl Benzene 1 6.46E-4 7.37E-8 91203 Naphthalene 1 2.89E-5 3.30E-9

115071 Propylene 1 1.88E-3 2.15E-7 100425 Styrene 1 7.59E-5 8.66E-9 108883 Toluene 1 3.54E-3 4.04E-7 1330207 Xylenes 1 2.19E-3 2.50E-7 88101 PM2.5 1 2.37E-1 2.71E-5
EMISSIONS FOR FACILITY FAC=1 DEV=* PRO=* STK=1 NAME=SITE1_07 STACK 1 EMS (lbs/yr)SOURCE MULTIPLIER=1CAS ABBREV MULTIPLIER BG (ug/m^3) AVRG (lbs/yr) MAX (lbs/hr) 9901 DieselExhPM 1 1.19E-1 1.36E-5 106990 1,3-Butadiene 1 1.74E-4 1.99E-8 71432 Benzene 1 8.36E-4 9.54E-8 100414 Ethyl Benzene 1 3.40E-4 3.88E-8 91203 Naphthalene 1 1.52E-5 1.74E-9 115071 Propylene 1 9.92E-4 1.13E-7 100425 Styrene 1 4.00E-5 4.56E-9 108883 Toluene 1 1.86E-3 2.13E-7 1330207 Xylenes 1 1.15E-3 1.32E-7 88101 PM2.5 1 1.25E-1 1.42E-5
EMISSIONS FOR FACILITY FAC=1 DEV=* PRO=* STK=1 NAME=SITE1_08 STACK 1 EMS (lbs/yr)SOURCE MULTIPLIER=1CAS ABBREV MULTIPLIER BG (ug/m^3) AVRG (lbs/yr) MAX (lbs/hr) 9901 DieselExhPM 1 1.19E-1 1.36E-5 106990 1,3-Butadiene 1 1.74E-4 1.99E-8 71432 Benzene 1 8.36E-4 9.54E-8 100414 Ethyl Benzene 1 3.40E-4 3.88E-8 91203 Naphthalene 1 1.52E-5 1.74E-9 115071 Propylene 1 9.92E-4 1.13E-7 100425 Styrene 1 4.00E-5 4.56E-9 108883 Toluene 1 1.86E-3 2.13E-7 1330207 Xylenes 1 1.15E-3 1.32E-7 88101 PM2.5 1 1.25E-1 1.42E-5
ACUTE HI REPORTREC CV CNS BONE DEVEL ENDO EYE GILV IMMUN KIDN REPRO RESP SKIN BLOOD MAX0001 0.00E+00 1.09E-08 0.00E+00 1.50E-07 0.00E+00 2.27E-08 0.00E+00 1.39E-07 0.00E+00 1.50E-07 2.27E-08 0.00E+00 1.39E-07 1.50E-070002 0.00E+00 6.04E-09 0.00E+00 8.31E-08 0.00E+00 1.26E-08 0.00E+00 7.71E-08 0.00E+00 8.31E-08 1.26E-08 0.00E+00 7.71E-08 8.31E-080003 0.00E+00 5.21E-09 0.00E+00 7.16E-08 0.00E+00 1.08E-08 0.00E+00 6.64E-08 0.00E+00 7.16E-08 1.08E-08 0.00E+00 6.64E-08 7.16E-080004 0.00E+00 3.62E-09 0.00E+00 4.98E-08 0.00E+00 7.53E-09 0.00E+00 4.61E-08 0.00E+00 4.98E-08 7.53E-09 0.00E+00 4.61E-08 4.98E-080005 0.00E+00 2.78E-09 0.00E+00 3.83E-08 0.00E+00 5.79E-09 0.00E+00 3.55E-08 0.00E+00 3.83E-08 5.79E-09 0.00E+00 3.55E-08 3.83E-080006 0.00E+00 2.41E-09 0.00E+00 3.31E-08 0.00E+00 5.00E-09 0.00E+00 3.07E-08 0.00E+00 3.31E-08 5.00E-09 0.00E+00 3.07E-08 3.31E-080007 0.00E+00 1.64E-08 0.00E+00 2.25E-07 0.00E+00 3.41E-08 0.00E+00 2.09E-07 0.00E+00 2.25E-07 3.41E-08 0.00E+00 2.09E-07 2.25E-070008 0.00E+00 1.41E-08 0.00E+00 1.93E-07 0.00E+00 2.93E-08 0.00E+00 1.79E-07 0.00E+00 1.93E-07 2.93E-08 0.00E+00 1.79E-07 1.93E-070009 0.00E+00 6.19E-09 0.00E+00 8.51E-08 0.00E+00 1.29E-08 0.00E+00 7.89E-08 0.00E+00 8.51E-08 1.29E-08 0.00E+00 7.89E-08 8.51E-080010 0.00E+00 4.99E-09 0.00E+00 6.86E-08 0.00E+00 1.04E-08 0.00E+00 6.36E-08 0.00E+00 6.86E-08 1.04E-08 0.00E+00 6.36E-08 6.86E-08

WRPLOT View - Lakes Environmental Software
WIND ROSE PLOT:
Wind Direction and Speed Data for San Diego, CA1989 Data
COMMENTS:
Name: San Diego Lindberg FieldSite ID: 23188
COMPANY NAME:
LSA Associates, Inc.
MODELER:
Ronald Brugger
DATE:
3/25/2011
PROJECT NO.:
SWB1001
NORTH
SOUTH
WEST EAST
4%
8%
12%
16%
20%
WIND SPEED (Knots)
>= 22
17 - 21
11 - 17
7 - 11
4 - 7
1 - 4
Calms: 3.48%
TOTAL COUNT:
6143 hrs.
CALM WINDS:
3.48%
DATA PERIOD:
Start Date: 1/1/1989 - 00:00End Date: 9/13/1989 - 23:00
AVG. WIND SPEED:
6.87 Knots
DISPLAY:
Wind SpeedDirection (blowing from)

*** AERMOD - VERSION 09292 *** *** San Diego Sediment Project HRA *** 03/24/11 *** Emissions From Haul Truck Traffic *** 14:57:23 PAGE 1 **MODELOPTs: RegDFAULT CONC ELEV
*** MODEL SETUP OPTIONS SUMMARY *** - - - - - - - - - - - - - - - - - - - - - - - - - - - - - - - - - - - - - - - - - - - - - - - - - - - - - - - - - - - - - - -
**Model Is Setup For Calculation of Average CONCentration Values. -- DEPOSITION LOGIC -- **NO GAS DEPOSITION Data Provided. **NO PARTICLE DEPOSITION Data Provided. **Model Uses NO DRY DEPLETION. DRYDPLT = F **Model Uses NO WET DEPLETION. WETDPLT = F **Model Uses RURAL Dispersion Only. **Model Uses Regulatory DEFAULT Options: 1. Stack-tip Downwash. 2. Model Accounts for ELEVated Terrain Effects. 3. Use Calms Processing Routine. 4. Use Missing Data Processing Routine. 5. No Exponential Decay. **Model Assumes No FLAGPOLE Receptor Heights. **Model Calculates 1 Short Term Average(s) of: 1-HR and Calculates PERIOD Averages **This Run Includes: 19 Source(s); 19 Source Group(s); and 10 Receptor(s) **The Model Assumes A Pollutant Type of: OTHER **Model Set To Continue RUNning After the Setup Testing. **Output Options Selected: Model Outputs Tables of PERIOD Averages by Receptor Model Outputs Tables of Highest Short Term Values by Receptor (RECTABLE Keyword) Model Outputs External File(s) of High Values for Plotting (PLOTFILE Keyword) **NOTE: The Following Flags May Appear Following CONC Values: c for Calm Hours m for Missing Hours b for Both Calm and Missing Hours **Misc. Inputs: Base Elev. for Pot. Temp. Profile (m MSL) = 6.10 ; Decay Coef. = 0.000 ; Rot. Angle = 0.0 Emission Units = GRAMS/SEC ; Emission Rate Unit Factor = 0.10000E+07 Output Units = MICROGRAMS/M**3 **Approximate Storage Requirements of Model = 3.5 MB of RAM.

*** AERMOD - VERSION 09292 *** *** San Diego Sediment Project HRA *** 03/24/11 *** Emissions From Haul Truck Traffic *** 14:57:23 PAGE 2 **MODELOPTs: RegDFAULT CONC ELEV
*** VOLUME SOURCE DATA ***
NUMBER EMISSION RATE BASE RELEASE INIT. INIT. URBAN EMISSION RATE SOURCE PART. (GRAMS/SEC) X Y ELEV. HEIGHT SY SZ SOURCE SCALAR VARY ID CATS. (METERS) (METERS) (METERS) (METERS) (METERS) (METERS) BY - - - - - - - - - - - - - - - - - - - - - - - - - - - - - - - - - - - - - - - - - - - - - - - - - - - - - - - - - - - - -
SITE1_01 0 0.10000E+01 487512.4 3616899.2 1.6 1.52 9.02 0.21 NO SITE1_02 0 0.10000E+01 487520.4 3616963.5 2.6 1.52 9.02 0.21 NO SITE1_03 0 0.10000E+01 487520.4 3617043.8 4.2 1.52 9.02 0.21 NO SITE1_04 0 0.10000E+01 487520.4 3617140.3 5.9 1.52 9.02 0.21 NO SITE1_05 0 0.10000E+01 487520.4 3617224.7 8.4 1.52 9.02 0.21 NO SITE1_06 0 0.10000E+01 487520.4 3617297.0 10.0 1.52 9.02 0.21 NO SITE5_01 0 0.10000E+01 489039.4 3613607.9 1.0 1.52 9.02 0.21 NO SITE5_02 0 0.10000E+01 489236.3 3613668.2 3.0 1.52 9.02 0.21 NO SITE5_03 0 0.10000E+01 489417.2 3613704.4 5.6 1.52 9.02 0.21 NO SITE5_04 0 0.10000E+01 489577.9 3613744.6 7.6 1.52 9.02 0.21 NO SITE5_05 0 0.10000E+01 489098.7 3612915.7 3.9 1.52 9.02 0.21 NO SITE5_06 0 0.10000E+01 489410.1 3613008.2 7.5 1.52 9.02 0.21 NO SITE5_07 0 0.10000E+01 489698.5 3613085.5 11.1 1.52 9.02 0.21 NO SITE5_08 0 0.10000E+01 489653.3 3613308.6 10.6 1.52 9.02 0.21 NO SITE5_09 0 0.10000E+01 489611.1 3613540.6 9.1 1.52 9.02 0.21 NO SITE5_10 0 0.10000E+01 489713.5 3613784.8 10.4 1.52 9.02 0.21 NO SITE5_11 0 0.10000E+01 489846.2 3613817.9 12.1 1.52 9.02 0.21 NO SITE1_07 0 0.10000E+01 487601.3 3617140.3 6.1 1.52 9.02 0.21 NO SITE1_08 0 0.10000E+01 487685.4 3617140.3 6.6 1.52 9.02 0.21 NO

*** AERMOD - VERSION 09292 *** *** San Diego Sediment Project HRA *** 03/24/11 *** Emissions From Haul Truck Traffic *** 14:57:23 PAGE 3 **MODELOPTs: RegDFAULT CONC ELEV
*** SOURCE IDs DEFINING SOURCE GROUPS ***
GROUP ID SOURCE IDs
SITE1_01 SITE1_01,
SITE1_02 SITE1_02,
SITE1_03 SITE1_03,
SITE1_04 SITE1_04,
SITE1_05 SITE1_05,
SITE1_06 SITE1_06,
SITE5_01 SITE5_01,
SITE5_02 SITE5_02,
SITE5_03 SITE5_03,
SITE5_04 SITE5_04,
SITE5_05 SITE5_05,
SITE5_06 SITE5_06,
SITE5_07 SITE5_07,
SITE5_08 SITE5_08,
SITE5_09 SITE5_09,

SITE5_10 SITE5_10,
SITE5_11 SITE5_11,
SITE1_08 SITE1_08,
SITE1_07 SITE1_07,

*** AERMOD - VERSION 09292 *** *** San Diego Sediment Project HRA *** 03/24/11 *** Emissions From Haul Truck Traffic *** 14:57:23 PAGE 4 **MODELOPTs: RegDFAULT CONC ELEV
*** DISCRETE CARTESIAN RECEPTORS *** (X-COORD, Y-COORD, ZELEV, ZHILL, ZFLAG) (METERS)
( 489737.1, 3613699.9, 10.7, 10.7, 0.0); ( 489969.2, 3613736.0, 13.6, 13.6, 0.0); ( 489893.9, 3613947.0, 12.7, 12.7, 0.0); ( 487561.1, 3617473.3, 14.7, 14.7, 0.0); ( 487618.3, 3617476.3, 14.3, 14.3, 0.0); ( 487386.3, 3617476.3, 14.3, 14.3, 0.0); ( 487582.2, 3617168.9, 6.8, 6.8, 0.0); ( 487630.4, 3617168.9, 7.1, 7.1, 0.0); ( 487681.6, 3616985.1, 3.9, 3.9, 0.0); ( 487751.0, 3616985.1, 4.8, 4.8, 0.0);

*** AERMOD - VERSION 09292 *** *** San Diego Sediment Project HRA *** 03/24/11 *** Emissions From Haul Truck Traffic *** 14:57:23 PAGE 5 **MODELOPTs: RegDFAULT CONC ELEV
*** METEOROLOGICAL DAYS SELECTED FOR PROCESSING *** (1=YES; 0=NO)
1 1 1 1 1 1 1 1 1 1 1 1 1 1 1 1 1 1 1 1 1 1 1 1 1 1 1 1 1 1 1 1 1 1 1 1 1 1 1 1 1 1 1 1 1 1 1 1 1 1 1 1 1 1 1 1 1 1 1 1 1 1 1 1 1 1 1 1 1 1 1 1 1 1 1 1 1 1 1 1 1 1 1 1 1 1 1 1 1 1 1 1 1 1 1 1 1 1 1 1 1 1 1 1 1 1 1 1 1 1 1 1 1 1 1 1 1 1 1 1 1 1 1 1 1 1 1 1 1 1 1 1 1 1 1 1 1 1 1 1 1 1 1 1 1 1 1 1 1 1 1 1 1 1 1 1 1 1 1 1 1 1 1 1 1 1 1 1 1 1 1 1 1 1 1 1 1 1 1 1 1 1 1 1 1 1 1 1 1 1 1 1 1 1 1 1 1 1 1 1 1 1 1 1 1 1 1 1 1 1 1 1 1 1 1 1 1 1 1 1 1 1 1 1 1 1 1 1 1 1 1 1 1 1 1 1 1 1 1 1 1 1 1 1 1 1 1 1 1 1 1 1 1 1 1 1 1 1 1 1 1 1 1 1 1 1 1 1 1 1 1 1 1 1 1 1 1 1 1 1 1 1 1 1 1 1 1 1 1 1 1 1 1 1 1 1 1 1 1 1 1 1 1 1 1 1 1 1 1 1 1 1 1 1 1 1 1 1 1 1 1 1 1 1 1 1 1 1 1 1 1 1 1 1 1 1 1 1 1 1 1 1 1 1 1 1 1 1 1 1 1 1 1 1 1 1 1 1 1 1 1 1 1 1 1 1
NOTE: METEOROLOGICAL DATA ACTUALLY PROCESSED WILL ALSO DEPEND ON WHAT IS INCLUDED IN THE DATA FILE.
*** UPPER BOUND OF FIRST THROUGH FIFTH WIND SPEED CATEGORIES *** (METERS/SEC)
1.54, 3.09, 5.14, 8.23, 10.80,

*** AERMOD - VERSION 09292 *** *** San Diego Sediment Project HRA *** 03/24/11 *** Emissions From Haul Truck Traffic *** 14:57:23 PAGE 6 **MODELOPTs: RegDFAULT CONC ELEV
*** UP TO THE FIRST 24 HOURS OF METEOROLOGICAL DATA ***
Surface file: Met Data\SanDiego1989.SFC Met Version: 06341 Profile file: Met Data\SanDiego1989.PFL Surface format: FREE Profile format: FREE Surface station no.: 23188 Upper air station no.: 3131 Name: SAN_DIEGO/LINDBERGH_FIELD Name: UNKNOWN Year: 1989 Year: 1989
First 24 hours of scalar data YR MO DY JDY HR H0 U* W* DT/DZ ZICNV ZIMCH M-O LEN Z0 BOWEN ALBEDO REF WS WD HT REF TA HT- - - - - - - - - - - - - - - - - - - - - - - - - - - - - - - - - - - - - - - - - - - - - - - - - - - - - - - - - - - - 89 01 01 1 01 -23.8 0.410 -9.000 -9.000 -999. 604. 260.9 0.54 1.75 0.59 2.60 71. 6.1 284.2 2.0 89 01 01 1 02 -14.7 0.193 -9.000 -9.000 -999. 236. 43.8 0.54 1.75 1.00 1.50 98. 6.1 283.8 2.0 89 01 01 1 03 -999.0 -9.000 -9.000 -9.000 -999. -999. -99999.0 0.54 1.75 1.00 0.00 0. 6.1 282.5 2.0 89 01 01 1 04 -13.8 0.124 -9.000 -9.000 -999. 100. 12.4 0.54 1.75 1.00 1.50 183. 6.1 282.0 2.0 89 01 01 1 05 -999.0 -9.000 -9.000 -9.000 -999. -999. -99999.0 0.54 1.75 1.00 0.00 0. 6.1 281.4 2.0 89 01 01 1 06 -999.0 -9.000 -9.000 -9.000 -999. -999. -99999.0 0.54 1.75 1.00 0.00 0. 6.1 280.9 2.0 89 01 01 1 07 -999.0 -9.000 -9.000 -9.000 -999. -999. -99999.0 0.54 1.75 1.00 0.00 0. 6.1 280.4 2.0 89 01 01 1 08 -999.0 -9.000 -9.000 -9.000 -999. -999. -99999.0 0.54 1.75 1.00 0.00 0. 6.1 282.5 2.0 89 01 01 1 09 -32.5 0.295 -9.000 -9.000 -999. 369. 71.4 0.54 1.75 1.00 2.10 327. 6.1 283.8 2.0 89 01 01 1 10 -31.7 0.297 -9.000 -9.000 -999. 372. 74.5 0.54 1.75 1.00 2.10 331. 6.1 284.9 2.0 89 01 01 1 11 -55.2 0.571 -9.000 -9.000 -999. 994. 305.2 0.54 1.75 1.00 3.60 334. 6.1 288.8 2.0 89 01 01 1 12 -64.0 0.830 -9.000 -9.000 -999. 1737. 806.1 0.54 1.75 1.00 5.10 306. 6.1 287.0 2.0 89 01 01 1 13 -64.0 0.830 -9.000 -9.000 -999. 1739. 805.3 0.54 1.75 1.00 5.10 323. 6.1 288.8 2.0 89 01 01 1 14 -64.0 0.932 -9.000 -9.000 -999. 2062. 1139.6 0.54 1.75 1.00 5.70 299. 6.1 289.9 2.0 89 01 01 1 15 -62.4 0.830 -9.000 -9.000 -999. 1758. 827.5 0.54 1.75 1.00 5.10 302. 6.1 288.1 2.0 89 01 01 1 16 -22.1 0.671 -9.000 -9.000 -999. 1295. 1231.7 0.54 1.75 0.49 4.10 344. 6.1 288.1 2.0 89 01 01 1 17 25.0 0.441 -9.000 -9.000 -999. 728. -311.1 0.54 1.75 0.29 2.60 321. 6.1 287.0 2.0 89 01 01 1 18 54.3 -9.000 -9.000 -9.000 -999. -999. -99999.0 0.54 1.75 0.22 0.00 0. 6.1 286.4 2.0 89 01 01 1 19 104.7 0.304 -9.000 -9.000 -999. 386. -24.3 0.54 1.75 0.20 1.50 4. 6.1 285.9 2.0 89 01 01 1 20 158.5 -9.000 -9.000 -9.000 -999. -999. -99999.0 0.54 1.75 0.19 0.00 0. 6.1 285.9 2.0 89 01 01 1 21 115.3 -9.000 -9.000 -9.000 -999. -999. -99999.0 0.54 1.75 0.19 0.00 0. 6.1 284.9 2.0 89 01 01 1 22 144.8 -9.000 -9.000 -9.000 -999. -999. -99999.0 0.54 1.75 0.20 0.00 0. 6.1 284.9 2.0 89 01 01 1 23 80.9 -9.000 -9.000 -9.000 -999. -999. -99999.0 0.54 1.75 0.23 0.00 0. 6.1 283.1 2.0 89 01 01 1 24 33.1 -9.000 -9.000 -9.000 -999. -999. -99999.0 0.54 1.75 0.32 0.00 0. 6.1 283.8 2.0
First hour of profile data YR MO DY HR HEIGHT F WDIR WSPD AMB_TMP sigmaA sigmaW sigmaV 89 01 01 01 6.1 1 71. 2.60 284.3 99.0 -99.00 -99.00
F indicates top of profile (=1) or below (=0)

*** AERMOD - VERSION 09292 *** *** San Diego Sediment Project HRA *** 03/24/11 *** Emissions From Haul Truck Traffic *** 14:57:23 PAGE 7 **MODELOPTs: RegDFAULT CONC ELEV
*** THE PERIOD ( 6144 HRS) AVERAGE CONCENTRATION VALUES FOR SOURCE GROUP: SITE1_01 *** INCLUDING SOURCE(S): SITE1_01,
*** DISCRETE CARTESIAN RECEPTOR POINTS ***
** CONC OF OTHER IN MICROGRAMS/M**3 **
X-COORD (M) Y-COORD (M) CONC X-COORD (M) Y-COORD (M) CONC - - - - - - - - - - - - - - - - - - - - - - - - - - - - - - - - - - - - - - - - - - - - - - - - - - - - - - - - - - - - - - - - - 489737.15 3613699.86 0.10122 489969.22 3613736.03 0.10656 489893.87 3613947.00 0.12519 487561.08 3617473.32 1.78859 487618.34 3617476.33 1.73705 487386.27 3617476.33 0.98959 487582.18 3617168.91 6.13533 487630.40 3617168.91 4.92113 487681.64 3616985.06 11.34585 487750.96 3616985.06 6.62333

*** AERMOD - VERSION 09292 *** *** San Diego Sediment Project HRA *** 03/24/11 *** Emissions From Haul Truck Traffic *** 14:57:23 PAGE 8 **MODELOPTs: RegDFAULT CONC ELEV
*** THE PERIOD ( 6144 HRS) AVERAGE CONCENTRATION VALUES FOR SOURCE GROUP: SITE1_02 *** INCLUDING SOURCE(S): SITE1_02,
*** DISCRETE CARTESIAN RECEPTOR POINTS ***
** CONC OF OTHER IN MICROGRAMS/M**3 **
X-COORD (M) Y-COORD (M) CONC X-COORD (M) Y-COORD (M) CONC - - - - - - - - - - - - - - - - - - - - - - - - - - - - - - - - - - - - - - - - - - - - - - - - - - - - - - - - - - - - - - - - - 489737.15 3613699.86 0.09812 489969.22 3613736.03 0.10140 489893.87 3613947.00 0.11705 487561.08 3617473.32 2.20662 487618.34 3617476.33 2.11764 487386.27 3617476.33 1.17610 487582.18 3617168.91 9.60632 487630.40 3617168.91 7.66416 487681.64 3616985.06 15.98387 487750.96 3616985.06 8.29562

*** AERMOD - VERSION 09292 *** *** San Diego Sediment Project HRA *** 03/24/11 *** Emissions From Haul Truck Traffic *** 14:57:23 PAGE 9 **MODELOPTs: RegDFAULT CONC ELEV
*** THE PERIOD ( 6144 HRS) AVERAGE CONCENTRATION VALUES FOR SOURCE GROUP: SITE1_03 *** INCLUDING SOURCE(S): SITE1_03,
*** DISCRETE CARTESIAN RECEPTOR POINTS ***
** CONC OF OTHER IN MICROGRAMS/M**3 **
X-COORD (M) Y-COORD (M) CONC X-COORD (M) Y-COORD (M) CONC - - - - - - - - - - - - - - - - - - - - - - - - - - - - - - - - - - - - - - - - - - - - - - - - - - - - - - - - - - - - - - - - - 489737.15 3613699.86 0.09495 489969.22 3613736.03 0.09612 489893.87 3613947.00 0.10913 487561.08 3617473.32 3.00987 487618.34 3617476.33 2.72367 487386.27 3617476.33 1.56078 487582.18 3617168.91 20.38974 487630.40 3617168.91 14.60070 487681.64 3616985.06 21.84667 487750.96 3616985.06 10.88211

*** AERMOD - VERSION 09292 *** *** San Diego Sediment Project HRA *** 03/24/11 *** Emissions From Haul Truck Traffic *** 14:57:23 PAGE 10 **MODELOPTs: RegDFAULT CONC ELEV
*** THE PERIOD ( 6144 HRS) AVERAGE CONCENTRATION VALUES FOR SOURCE GROUP: SITE1_04 *** INCLUDING SOURCE(S): SITE1_04,
*** DISCRETE CARTESIAN RECEPTOR POINTS ***
** CONC OF OTHER IN MICROGRAMS/M**3 **
X-COORD (M) Y-COORD (M) CONC X-COORD (M) Y-COORD (M) CONC - - - - - - - - - - - - - - - - - - - - - - - - - - - - - - - - - - - - - - - - - - - - - - - - - - - - - - - - - - - - - - - - - 489737.15 3613699.86 0.09021 489969.22 3613736.03 0.09052 489893.87 3613947.00 0.10129 487561.08 3617473.32 4.70076 487618.34 3617476.33 3.84122 487386.27 3617476.33 2.40295 487582.18 3617168.91 79.53435 487630.40 3617168.91 30.42743 487681.64 3616985.06 17.12399 487750.96 3616985.06 11.30223

*** AERMOD - VERSION 09292 *** *** San Diego Sediment Project HRA *** 03/24/11 *** Emissions From Haul Truck Traffic *** 14:57:23 PAGE 11 **MODELOPTs: RegDFAULT CONC ELEV
*** THE PERIOD ( 6144 HRS) AVERAGE CONCENTRATION VALUES FOR SOURCE GROUP: SITE1_05 *** INCLUDING SOURCE(S): SITE1_05,
*** DISCRETE CARTESIAN RECEPTOR POINTS ***
** CONC OF OTHER IN MICROGRAMS/M**3 **
X-COORD (M) Y-COORD (M) CONC X-COORD (M) Y-COORD (M) CONC - - - - - - - - - - - - - - - - - - - - - - - - - - - - - - - - - - - - - - - - - - - - - - - - - - - - - - - - - - - - - - - - - 489737.15 3613699.86 0.08849 489969.22 3613736.03 0.08557 489893.87 3613947.00 0.09288 487561.08 3617473.32 7.76391 487618.34 3617476.33 5.86044 487386.27 3617476.33 3.90867 487582.18 3617168.91 100.15812 487630.40 3617168.91 44.21290 487681.64 3616985.06 9.94317 487750.96 3616985.06 8.35022

*** AERMOD - VERSION 09292 *** *** San Diego Sediment Project HRA *** 03/24/11 *** Emissions From Haul Truck Traffic *** 14:57:23 PAGE 12 **MODELOPTs: RegDFAULT CONC ELEV
*** THE PERIOD ( 6144 HRS) AVERAGE CONCENTRATION VALUES FOR SOURCE GROUP: SITE1_06 *** INCLUDING SOURCE(S): SITE1_06,
*** DISCRETE CARTESIAN RECEPTOR POINTS ***
** CONC OF OTHER IN MICROGRAMS/M**3 **
X-COORD (M) Y-COORD (M) CONC X-COORD (M) Y-COORD (M) CONC - - - - - - - - - - - - - - - - - - - - - - - - - - - - - - - - - - - - - - - - - - - - - - - - - - - - - - - - - - - - - - - - - 489737.15 3613699.86 0.08728 489969.22 3613736.03 0.08133 489893.87 3613947.00 0.08966 487561.08 3617473.32 13.49437 487618.34 3617476.33 9.80026 487386.27 3617476.33 6.11512 487582.18 3617168.91 35.49698 487630.40 3617168.91 27.34645 487681.64 3616985.06 6.98399 487750.96 3616985.06 5.88726
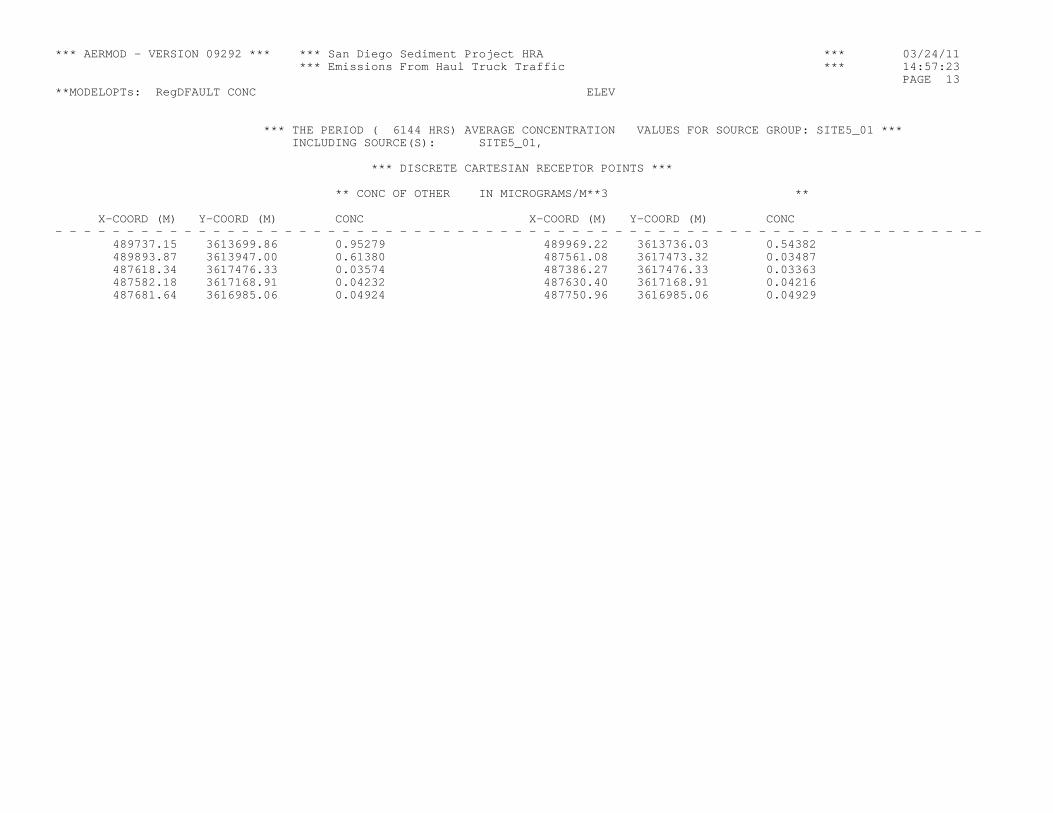
*** AERMOD - VERSION 09292 *** *** San Diego Sediment Project HRA *** 03/24/11 *** Emissions From Haul Truck Traffic *** 14:57:23 PAGE 13 **MODELOPTs: RegDFAULT CONC ELEV
*** THE PERIOD ( 6144 HRS) AVERAGE CONCENTRATION VALUES FOR SOURCE GROUP: SITE5_01 *** INCLUDING SOURCE(S): SITE5_01,
*** DISCRETE CARTESIAN RECEPTOR POINTS ***
** CONC OF OTHER IN MICROGRAMS/M**3 **
X-COORD (M) Y-COORD (M) CONC X-COORD (M) Y-COORD (M) CONC - - - - - - - - - - - - - - - - - - - - - - - - - - - - - - - - - - - - - - - - - - - - - - - - - - - - - - - - - - - - - - - - - 489737.15 3613699.86 0.95279 489969.22 3613736.03 0.54382 489893.87 3613947.00 0.61380 487561.08 3617473.32 0.03487 487618.34 3617476.33 0.03574 487386.27 3617476.33 0.03363 487582.18 3617168.91 0.04232 487630.40 3617168.91 0.04216 487681.64 3616985.06 0.04924 487750.96 3616985.06 0.04929

*** AERMOD - VERSION 09292 *** *** San Diego Sediment Project HRA *** 03/24/11 *** Emissions From Haul Truck Traffic *** 14:57:23 PAGE 14 **MODELOPTs: RegDFAULT CONC ELEV
*** THE PERIOD ( 6144 HRS) AVERAGE CONCENTRATION VALUES FOR SOURCE GROUP: SITE5_02 *** INCLUDING SOURCE(S): SITE5_02,
*** DISCRETE CARTESIAN RECEPTOR POINTS ***
** CONC OF OTHER IN MICROGRAMS/M**3 **
X-COORD (M) Y-COORD (M) CONC X-COORD (M) Y-COORD (M) CONC - - - - - - - - - - - - - - - - - - - - - - - - - - - - - - - - - - - - - - - - - - - - - - - - - - - - - - - - - - - - - - - - - 489737.15 3613699.86 1.81899 489969.22 3613736.03 0.88368 489893.87 3613947.00 0.94817 487561.08 3617473.32 0.03518 487618.34 3617476.33 0.03519 487386.27 3617476.33 0.03270 487582.18 3617168.91 0.04565 487630.40 3617168.91 0.04591 487681.64 3616985.06 0.05011 487750.96 3616985.06 0.05047

*** AERMOD - VERSION 09292 *** *** San Diego Sediment Project HRA *** 03/24/11 *** Emissions From Haul Truck Traffic *** 14:57:23 PAGE 15 **MODELOPTs: RegDFAULT CONC ELEV
*** THE PERIOD ( 6144 HRS) AVERAGE CONCENTRATION VALUES FOR SOURCE GROUP: SITE5_03 *** INCLUDING SOURCE(S): SITE5_03,
*** DISCRETE CARTESIAN RECEPTOR POINTS ***
** CONC OF OTHER IN MICROGRAMS/M**3 **
X-COORD (M) Y-COORD (M) CONC X-COORD (M) Y-COORD (M) CONC - - - - - - - - - - - - - - - - - - - - - - - - - - - - - - - - - - - - - - - - - - - - - - - - - - - - - - - - - - - - - - - - - 489737.15 3613699.86 4.66793 489969.22 3613736.03 1.51651 489893.87 3613947.00 1.62271 487561.08 3617473.32 0.03393 487618.34 3617476.33 0.03517 487386.27 3617476.33 0.03316 487582.18 3617168.91 0.04490 487630.40 3617168.91 0.04533 487681.64 3616985.06 0.04927 487750.96 3616985.06 0.04999

*** AERMOD - VERSION 09292 *** *** San Diego Sediment Project HRA *** 03/24/11 *** Emissions From Haul Truck Traffic *** 14:57:23 PAGE 16 **MODELOPTs: RegDFAULT CONC ELEV
*** THE PERIOD ( 6144 HRS) AVERAGE CONCENTRATION VALUES FOR SOURCE GROUP: SITE5_04 *** INCLUDING SOURCE(S): SITE5_04,
*** DISCRETE CARTESIAN RECEPTOR POINTS ***
** CONC OF OTHER IN MICROGRAMS/M**3 **
X-COORD (M) Y-COORD (M) CONC X-COORD (M) Y-COORD (M) CONC - - - - - - - - - - - - - - - - - - - - - - - - - - - - - - - - - - - - - - - - - - - - - - - - - - - - - - - - - - - - - - - - - 489737.15 3613699.86 21.73974 489969.22 3613736.03 3.15633 489893.87 3613947.00 3.30801 487561.08 3617473.32 0.03522 487618.34 3617476.33 0.03559 487386.27 3617476.33 0.03495 487582.18 3617168.91 0.04347 487630.40 3617168.91 0.04422 487681.64 3616985.06 0.04749 487750.96 3616985.06 0.04876

*** AERMOD - VERSION 09292 *** *** San Diego Sediment Project HRA *** 03/24/11 *** Emissions From Haul Truck Traffic *** 14:57:23 PAGE 17 **MODELOPTs: RegDFAULT CONC ELEV
*** THE PERIOD ( 6144 HRS) AVERAGE CONCENTRATION VALUES FOR SOURCE GROUP: SITE5_05 *** INCLUDING SOURCE(S): SITE5_05,
*** DISCRETE CARTESIAN RECEPTOR POINTS ***
** CONC OF OTHER IN MICROGRAMS/M**3 **
X-COORD (M) Y-COORD (M) CONC X-COORD (M) Y-COORD (M) CONC - - - - - - - - - - - - - - - - - - - - - - - - - - - - - - - - - - - - - - - - - - - - - - - - - - - - - - - - - - - - - - - - - 489737.15 3613699.86 0.53628 489969.22 3613736.03 0.41808 489893.87 3613947.00 0.34838 487561.08 3617473.32 0.02795 487618.34 3617476.33 0.02777 487386.27 3617476.33 0.02719 487582.18 3617168.91 0.03366 487630.40 3617168.91 0.03374 487681.64 3616985.06 0.03628 487750.96 3616985.06 0.03641

*** AERMOD - VERSION 09292 *** *** San Diego Sediment Project HRA *** 03/24/11 *** Emissions From Haul Truck Traffic *** 14:57:23 PAGE 18 **MODELOPTs: RegDFAULT CONC ELEV
*** THE PERIOD ( 6144 HRS) AVERAGE CONCENTRATION VALUES FOR SOURCE GROUP: SITE5_06 *** INCLUDING SOURCE(S): SITE5_06,
*** DISCRETE CARTESIAN RECEPTOR POINTS ***
** CONC OF OTHER IN MICROGRAMS/M**3 **
X-COORD (M) Y-COORD (M) CONC X-COORD (M) Y-COORD (M) CONC - - - - - - - - - - - - - - - - - - - - - - - - - - - - - - - - - - - - - - - - - - - - - - - - - - - - - - - - - - - - - - - - - 489737.15 3613699.86 0.86348 489969.22 3613736.03 0.64590 489893.87 3613947.00 0.47804 487561.08 3617473.32 0.02827 487618.34 3617476.33 0.02848 487386.27 3617476.33 0.02806 487582.18 3617168.91 0.03455 487630.40 3617168.91 0.03464 487681.64 3616985.06 0.03730 487750.96 3616985.06 0.03740

*** AERMOD - VERSION 09292 *** *** San Diego Sediment Project HRA *** 03/24/11 *** Emissions From Haul Truck Traffic *** 14:57:23 PAGE 19 **MODELOPTs: RegDFAULT CONC ELEV
*** THE PERIOD ( 6144 HRS) AVERAGE CONCENTRATION VALUES FOR SOURCE GROUP: SITE5_07 *** INCLUDING SOURCE(S): SITE5_07,
*** DISCRETE CARTESIAN RECEPTOR POINTS ***
** CONC OF OTHER IN MICROGRAMS/M**3 **
X-COORD (M) Y-COORD (M) CONC X-COORD (M) Y-COORD (M) CONC - - - - - - - - - - - - - - - - - - - - - - - - - - - - - - - - - - - - - - - - - - - - - - - - - - - - - - - - - - - - - - - - - 489737.15 3613699.86 1.60939 489969.22 3613736.03 1.01246 489893.87 3613947.00 0.82011 487561.08 3617473.32 0.03089 487618.34 3617476.33 0.03110 487386.27 3617476.33 0.03008 487582.18 3617168.91 0.03420 487630.40 3617168.91 0.03446 487681.64 3616985.06 0.03698 487750.96 3616985.06 0.03741

*** AERMOD - VERSION 09292 *** *** San Diego Sediment Project HRA *** 03/24/11 *** Emissions From Haul Truck Traffic *** 14:57:23 PAGE 20 **MODELOPTs: RegDFAULT CONC ELEV
*** THE PERIOD ( 6144 HRS) AVERAGE CONCENTRATION VALUES FOR SOURCE GROUP: SITE5_08 *** INCLUDING SOURCE(S): SITE5_08,
*** DISCRETE CARTESIAN RECEPTOR POINTS ***
** CONC OF OTHER IN MICROGRAMS/M**3 **
X-COORD (M) Y-COORD (M) CONC X-COORD (M) Y-COORD (M) CONC - - - - - - - - - - - - - - - - - - - - - - - - - - - - - - - - - - - - - - - - - - - - - - - - - - - - - - - - - - - - - - - - - 489737.15 3613699.86 3.31558 489969.22 3613736.03 1.71952 489893.87 3613947.00 1.09556 487561.08 3617473.32 0.03342 487618.34 3617476.33 0.03368 487386.27 3617476.33 0.03249 487582.18 3617168.91 0.03717 487630.40 3617168.91 0.03749 487681.64 3616985.06 0.04034 487750.96 3616985.06 0.04088

*** AERMOD - VERSION 09292 *** *** San Diego Sediment Project HRA *** 03/24/11 *** Emissions From Haul Truck Traffic *** 14:57:23 PAGE 21 **MODELOPTs: RegDFAULT CONC ELEV
*** THE PERIOD ( 6144 HRS) AVERAGE CONCENTRATION VALUES FOR SOURCE GROUP: SITE5_09 *** INCLUDING SOURCE(S): SITE5_09,
*** DISCRETE CARTESIAN RECEPTOR POINTS ***
** CONC OF OTHER IN MICROGRAMS/M**3 **
X-COORD (M) Y-COORD (M) CONC X-COORD (M) Y-COORD (M) CONC - - - - - - - - - - - - - - - - - - - - - - - - - - - - - - - - - - - - - - - - - - - - - - - - - - - - - - - - - - - - - - - - - 489737.15 3613699.86 10.05703 489969.22 3613736.03 2.78671 489893.87 3613947.00 1.94912 487561.08 3617473.32 0.03363 487618.34 3617476.33 0.03436 487386.27 3617476.33 0.03335 487582.18 3617168.91 0.04052 487630.40 3617168.91 0.04100 487681.64 3616985.06 0.04415 487750.96 3616985.06 0.04495

*** AERMOD - VERSION 09292 *** *** San Diego Sediment Project HRA *** 03/24/11 *** Emissions From Haul Truck Traffic *** 14:57:23 PAGE 22 **MODELOPTs: RegDFAULT CONC ELEV
*** THE PERIOD ( 6144 HRS) AVERAGE CONCENTRATION VALUES FOR SOURCE GROUP: SITE5_10 *** INCLUDING SOURCE(S): SITE5_10,
*** DISCRETE CARTESIAN RECEPTOR POINTS ***
** CONC OF OTHER IN MICROGRAMS/M**3 **
X-COORD (M) Y-COORD (M) CONC X-COORD (M) Y-COORD (M) CONC - - - - - - - - - - - - - - - - - - - - - - - - - - - - - - - - - - - - - - - - - - - - - - - - - - - - - - - - - - - - - - - - - 489737.15 3613699.86 84.04176 489969.22 3613736.03 8.65076 489893.87 3613947.00 7.40250 487561.08 3617473.32 0.03835 487618.34 3617476.33 0.03903 487386.27 3617476.33 0.03535 487582.18 3617168.91 0.04091 487630.40 3617168.91 0.04206 487681.64 3616985.06 0.04442 487750.96 3616985.06 0.04633

*** AERMOD - VERSION 09292 *** *** San Diego Sediment Project HRA *** 03/24/11 *** Emissions From Haul Truck Traffic *** 14:57:23 PAGE 23 **MODELOPTs: RegDFAULT CONC ELEV
*** THE PERIOD ( 6144 HRS) AVERAGE CONCENTRATION VALUES FOR SOURCE GROUP: SITE5_11 *** INCLUDING SOURCE(S): SITE5_11,
*** DISCRETE CARTESIAN RECEPTOR POINTS ***
** CONC OF OTHER IN MICROGRAMS/M**3 **
X-COORD (M) Y-COORD (M) CONC X-COORD (M) Y-COORD (M) CONC - - - - - - - - - - - - - - - - - - - - - - - - - - - - - - - - - - - - - - - - - - - - - - - - - - - - - - - - - - - - - - - - - 489737.15 3613699.86 9.78348 489969.22 3613736.03 34.66307 489893.87 3613947.00 21.63489 487561.08 3617473.32 0.03633 487618.34 3617476.33 0.03740 487386.27 3617476.33 0.03278 487582.18 3617168.91 0.03772 487630.40 3617168.91 0.03891 487681.64 3616985.06 0.04080 487750.96 3616985.06 0.04273
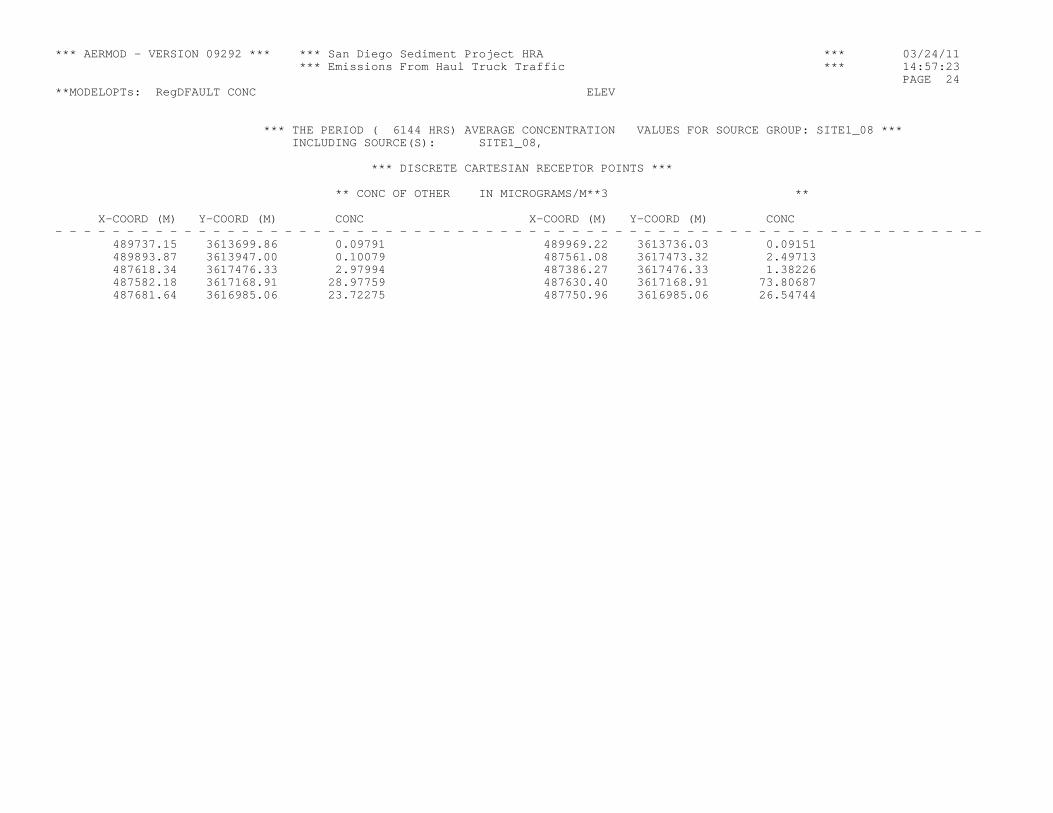
*** AERMOD - VERSION 09292 *** *** San Diego Sediment Project HRA *** 03/24/11 *** Emissions From Haul Truck Traffic *** 14:57:23 PAGE 24 **MODELOPTs: RegDFAULT CONC ELEV
*** THE PERIOD ( 6144 HRS) AVERAGE CONCENTRATION VALUES FOR SOURCE GROUP: SITE1_08 *** INCLUDING SOURCE(S): SITE1_08,
*** DISCRETE CARTESIAN RECEPTOR POINTS ***
** CONC OF OTHER IN MICROGRAMS/M**3 **
X-COORD (M) Y-COORD (M) CONC X-COORD (M) Y-COORD (M) CONC - - - - - - - - - - - - - - - - - - - - - - - - - - - - - - - - - - - - - - - - - - - - - - - - - - - - - - - - - - - - - - - - - 489737.15 3613699.86 0.09791 489969.22 3613736.03 0.09151 489893.87 3613947.00 0.10079 487561.08 3617473.32 2.49713 487618.34 3617476.33 2.97994 487386.27 3617476.33 1.38226 487582.18 3617168.91 28.97759 487630.40 3617168.91 73.80687 487681.64 3616985.06 23.72275 487750.96 3616985.06 26.54744

*** AERMOD - VERSION 09292 *** *** San Diego Sediment Project HRA *** 03/24/11 *** Emissions From Haul Truck Traffic *** 14:57:23 PAGE 25 **MODELOPTs: RegDFAULT CONC ELEV
*** THE PERIOD ( 6144 HRS) AVERAGE CONCENTRATION VALUES FOR SOURCE GROUP: SITE1_07 *** INCLUDING SOURCE(S): SITE1_07,
*** DISCRETE CARTESIAN RECEPTOR POINTS ***
** CONC OF OTHER IN MICROGRAMS/M**3 **
X-COORD (M) Y-COORD (M) CONC X-COORD (M) Y-COORD (M) CONC - - - - - - - - - - - - - - - - - - - - - - - - - - - - - - - - - - - - - - - - - - - - - - - - - - - - - - - - - - - - - - - - - 489737.15 3613699.86 0.09355 489969.22 3613736.03 0.09056 489893.87 3613947.00 0.10057 487561.08 3617473.32 3.49514 487618.34 3617476.33 4.59229 487386.27 3617476.33 1.87673 487582.18 3617168.91 230.33012 487630.40 3617168.91 214.28329 487681.64 3616985.06 24.96802 487750.96 3616985.06 18.19427

*** AERMOD - VERSION 09292 *** *** San Diego Sediment Project HRA *** 03/24/11 *** Emissions From Haul Truck Traffic *** 14:57:23 PAGE 26 **MODELOPTs: RegDFAULT CONC ELEV
*** THE 1ST HIGHEST 1-HR AVERAGE CONCENTRATION VALUES FOR SOURCE GROUP: SITE1_01 *** INCLUDING SOURCE(S): SITE1_01,
*** DISCRETE CARTESIAN RECEPTOR POINTS ***
** CONC OF OTHER IN MICROGRAMS/M**3 **
X-COORD (M) Y-COORD (M) CONC (YYMMDDHH) X-COORD (M) Y-COORD (M) CONC (YYMMDDHH) - - - - - - - - - - - - - - - - - - - - - - - - - - - - - - - - - - - - - - - - - - - - - - - - - - - - - - - - - - - - - - - - - - 489737.15 3613699.86 28.20184 (89022008) 489969.22 3613736.03 14.46133 (89030702) 489893.87 3613947.00 20.24674 (89011803) 487561.08 3617473.32 295.92941 (89010104) 487618.34 3617476.33 313.44130 (89011011) 487386.27 3617476.33 83.96889 (89062009) 487582.18 3617168.91 750.45178 (89011010) 487630.40 3617168.91 144.59798 (89031105) 487681.64 3616985.06 893.29366 (89021411) 487750.96 3616985.06 771.60197 (89011309)

*** AERMOD - VERSION 09292 *** *** San Diego Sediment Project HRA *** 03/24/11 *** Emissions From Haul Truck Traffic *** 14:57:23 PAGE 27 **MODELOPTs: RegDFAULT CONC ELEV
*** THE 1ST HIGHEST 1-HR AVERAGE CONCENTRATION VALUES FOR SOURCE GROUP: SITE1_02 *** INCLUDING SOURCE(S): SITE1_02,
*** DISCRETE CARTESIAN RECEPTOR POINTS ***
** CONC OF OTHER IN MICROGRAMS/M**3 **
X-COORD (M) Y-COORD (M) CONC (YYMMDDHH) X-COORD (M) Y-COORD (M) CONC (YYMMDDHH) - - - - - - - - - - - - - - - - - - - - - - - - - - - - - - - - - - - - - - - - - - - - - - - - - - - - - - - - - - - - - - - - - - 489737.15 3613699.86 24.87356 (89022008) 489969.22 3613736.03 17.33534 (89022008) 489893.87 3613947.00 14.18493 (89030702) 487561.08 3617473.32 365.19277 (89010104) 487618.34 3617476.33 377.89125 (89011010) 487386.27 3617476.33 128.90640 (89062009) 487582.18 3617168.91 831.02631 (89011010) 487630.40 3617168.91 588.26323 (89031105) 487681.64 3616985.06 1476.80472 (89011305) 487750.96 3616985.06 935.83000 (89011305)

*** AERMOD - VERSION 09292 *** *** San Diego Sediment Project HRA *** 03/24/11 *** Emissions From Haul Truck Traffic *** 14:57:23 PAGE 28 **MODELOPTs: RegDFAULT CONC ELEV
*** THE 1ST HIGHEST 1-HR AVERAGE CONCENTRATION VALUES FOR SOURCE GROUP: SITE1_03 *** INCLUDING SOURCE(S): SITE1_03,
*** DISCRETE CARTESIAN RECEPTOR POINTS ***
** CONC OF OTHER IN MICROGRAMS/M**3 **
X-COORD (M) Y-COORD (M) CONC (YYMMDDHH) X-COORD (M) Y-COORD (M) CONC (YYMMDDHH) - - - - - - - - - - - - - - - - - - - - - - - - - - - - - - - - - - - - - - - - - - - - - - - - - - - - - - - - - - - - - - - - - - 489737.15 3613699.86 19.71464 (89022008) 489969.22 3613736.03 21.34778 (89022008) 489893.87 3613947.00 16.17993 (89022008) 487561.08 3617473.32 443.91346 (89030409) 487618.34 3617476.33 486.25377 (89011010) 487386.27 3617476.33 238.82735 (89020109) 487582.18 3617168.91 1127.12694 (89031105) 487630.40 3617168.91 1058.76064 (89031105) 487681.64 3616985.06 1083.04155 (89030509) 487750.96 3616985.06 896.42432 (89012609)

*** AERMOD - VERSION 09292 *** *** San Diego Sediment Project HRA *** 03/24/11 *** Emissions From Haul Truck Traffic *** 14:57:23 PAGE 29 **MODELOPTs: RegDFAULT CONC ELEV
*** THE 1ST HIGHEST 1-HR AVERAGE CONCENTRATION VALUES FOR SOURCE GROUP: SITE1_04 *** INCLUDING SOURCE(S): SITE1_04,
*** DISCRETE CARTESIAN RECEPTOR POINTS ***
** CONC OF OTHER IN MICROGRAMS/M**3 **
X-COORD (M) Y-COORD (M) CONC (YYMMDDHH) X-COORD (M) Y-COORD (M) CONC (YYMMDDHH) - - - - - - - - - - - - - - - - - - - - - - - - - - - - - - - - - - - - - - - - - - - - - - - - - - - - - - - - - - - - - - - - - - 489737.15 3613699.86 13.25538 (89022008) 489969.22 3613736.03 22.65335 (89022008) 489893.87 3613947.00 19.67808 (89022008) 487561.08 3617473.32 644.21601 (89030409) 487618.34 3617476.33 445.71874 (89011010) 487386.27 3617476.33 502.31296 (89011903) 487582.18 3617168.91 3837.31858 (89011309) 487630.40 3617168.91 2359.11896 (89013109) 487681.64 3616985.06 964.96838 (89011704) 487750.96 3616985.06 669.09472 (89030504)

*** AERMOD - VERSION 09292 *** *** San Diego Sediment Project HRA *** 03/24/11 *** Emissions From Haul Truck Traffic *** 14:57:23 PAGE 30 **MODELOPTs: RegDFAULT CONC ELEV
*** THE 1ST HIGHEST 1-HR AVERAGE CONCENTRATION VALUES FOR SOURCE GROUP: SITE1_05 *** INCLUDING SOURCE(S): SITE1_05,
*** DISCRETE CARTESIAN RECEPTOR POINTS ***
** CONC OF OTHER IN MICROGRAMS/M**3 **
X-COORD (M) Y-COORD (M) CONC (YYMMDDHH) X-COORD (M) Y-COORD (M) CONC (YYMMDDHH) - - - - - - - - - - - - - - - - - - - - - - - - - - - - - - - - - - - - - - - - - - - - - - - - - - - - - - - - - - - - - - - - - - 489737.15 3613699.86 13.31241 (89042803) 489969.22 3613736.03 18.85793 (89022008) 489893.87 3613947.00 16.31670 (89022008) 487561.08 3617473.32 862.77534 (89011010) 487618.34 3617476.33 268.71756 (89011010) 487386.27 3617476.33 772.94948 (89030603) 487582.18 3617168.91 3215.14578 (89011704) 487630.40 3617168.91 2068.48512 (89030509) 487681.64 3616985.06 611.51085 (89022008) 487750.96 3616985.06 531.18768 (89011704)

*** AERMOD - VERSION 09292 *** *** San Diego Sediment Project HRA *** 03/24/11 *** Emissions From Haul Truck Traffic *** 14:57:23 PAGE 31 **MODELOPTs: RegDFAULT CONC ELEV
*** THE 1ST HIGHEST 1-HR AVERAGE CONCENTRATION VALUES FOR SOURCE GROUP: SITE1_06 *** INCLUDING SOURCE(S): SITE1_06,
*** DISCRETE CARTESIAN RECEPTOR POINTS ***
** CONC OF OTHER IN MICROGRAMS/M**3 **
X-COORD (M) Y-COORD (M) CONC (YYMMDDHH) X-COORD (M) Y-COORD (M) CONC (YYMMDDHH) - - - - - - - - - - - - - - - - - - - - - - - - - - - - - - - - - - - - - - - - - - - - - - - - - - - - - - - - - - - - - - - - - - 489737.15 3613699.86 14.42677 (89042803) 489969.22 3613736.03 15.27390 (89022008) 489893.87 3613947.00 16.54777 (89022008) 487561.08 3617473.32 1220.07121 (89011010) 487618.34 3617476.33 756.79557 (89031105) 487386.27 3617476.33 635.73329 (89030603) 487582.18 3617168.91 1629.06899 (89021607) 487630.40 3617168.91 1341.49150 (89011803) 487681.64 3616985.06 494.16944 (89031807) 487750.96 3616985.06 407.01058 (89022008)

*** AERMOD - VERSION 09292 *** *** San Diego Sediment Project HRA *** 03/24/11 *** Emissions From Haul Truck Traffic *** 14:57:23 PAGE 32 **MODELOPTs: RegDFAULT CONC ELEV
*** THE 1ST HIGHEST 1-HR AVERAGE CONCENTRATION VALUES FOR SOURCE GROUP: SITE5_01 *** INCLUDING SOURCE(S): SITE5_01,
*** DISCRETE CARTESIAN RECEPTOR POINTS ***
** CONC OF OTHER IN MICROGRAMS/M**3 **
X-COORD (M) Y-COORD (M) CONC (YYMMDDHH) X-COORD (M) Y-COORD (M) CONC (YYMMDDHH) - - - - - - - - - - - - - - - - - - - - - - - - - - - - - - - - - - - - - - - - - - - - - - - - - - - - - - - - - - - - - - - - - - 489737.15 3613699.86 272.74704 (89011305) 489969.22 3613736.03 175.27748 (89011305) 489893.87 3613947.00 148.12765 (89011309) 487561.08 3617473.32 14.95583 (89020109) 487618.34 3617476.33 15.92312 (89020109) 487386.27 3617476.33 19.23002 (89011903) 487582.18 3617168.91 14.37667 (89011903) 487630.40 3617168.91 10.94930 (89020109) 487681.64 3616985.06 13.04325 (89011903) 487750.96 3616985.06 9.90819 (89020109)

*** AERMOD - VERSION 09292 *** *** San Diego Sediment Project HRA *** 03/24/11 *** Emissions From Haul Truck Traffic *** 14:57:23 PAGE 33 **MODELOPTs: RegDFAULT CONC ELEV
*** THE 1ST HIGHEST 1-HR AVERAGE CONCENTRATION VALUES FOR SOURCE GROUP: SITE5_02 *** INCLUDING SOURCE(S): SITE5_02,
*** DISCRETE CARTESIAN RECEPTOR POINTS ***
** CONC OF OTHER IN MICROGRAMS/M**3 **
X-COORD (M) Y-COORD (M) CONC (YYMMDDHH) X-COORD (M) Y-COORD (M) CONC (YYMMDDHH) - - - - - - - - - - - - - - - - - - - - - - - - - - - - - - - - - - - - - - - - - - - - - - - - - - - - - - - - - - - - - - - - - - 489737.15 3613699.86 374.85299 (89011305) 489969.22 3613736.03 277.10786 (89011305) 489893.87 3613947.00 160.08983 (89011309) 487561.08 3617473.32 25.15789 (89011903) 487618.34 3617476.33 18.59207 (89011903) 487386.27 3617476.33 26.55953 (89011903) 487582.18 3617168.91 19.14367 (89011903) 487630.40 3617168.91 19.24433 (89011903) 487681.64 3616985.06 20.80064 (89011903) 487750.96 3616985.06 20.26086 (89011903)
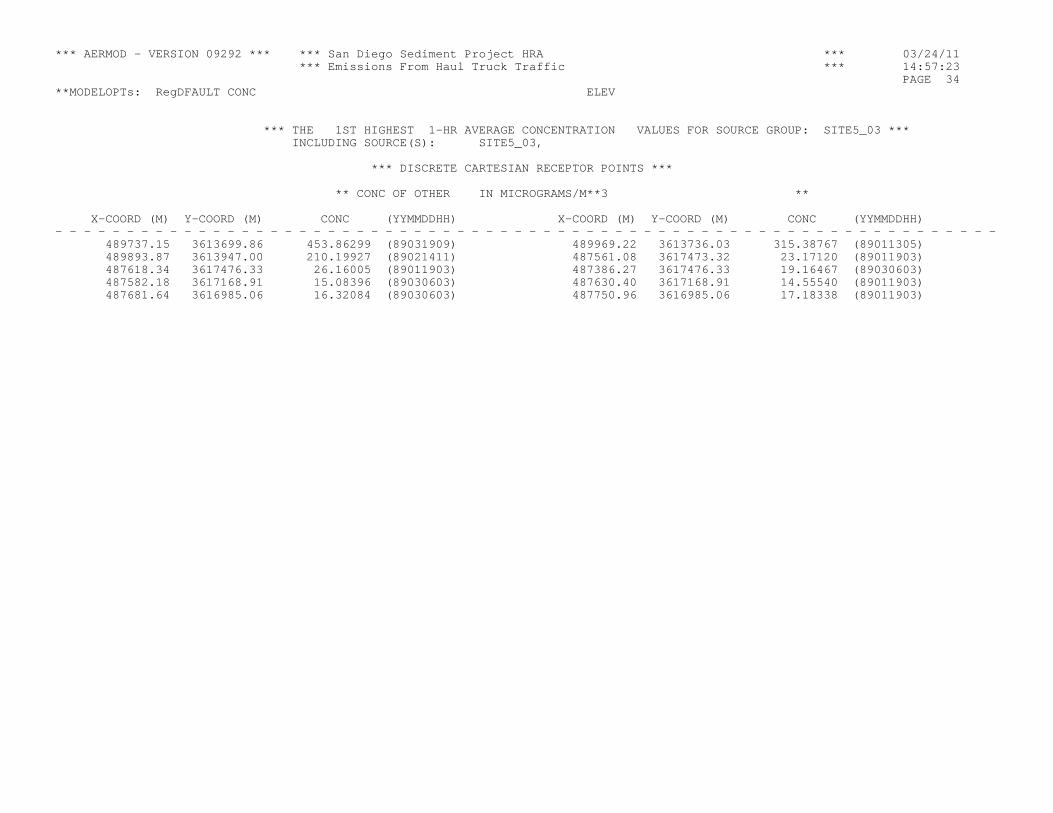
*** AERMOD - VERSION 09292 *** *** San Diego Sediment Project HRA *** 03/24/11 *** Emissions From Haul Truck Traffic *** 14:57:23 PAGE 34 **MODELOPTs: RegDFAULT CONC ELEV
*** THE 1ST HIGHEST 1-HR AVERAGE CONCENTRATION VALUES FOR SOURCE GROUP: SITE5_03 *** INCLUDING SOURCE(S): SITE5_03,
*** DISCRETE CARTESIAN RECEPTOR POINTS ***
** CONC OF OTHER IN MICROGRAMS/M**3 **
X-COORD (M) Y-COORD (M) CONC (YYMMDDHH) X-COORD (M) Y-COORD (M) CONC (YYMMDDHH) - - - - - - - - - - - - - - - - - - - - - - - - - - - - - - - - - - - - - - - - - - - - - - - - - - - - - - - - - - - - - - - - - - 489737.15 3613699.86 453.86299 (89031909) 489969.22 3613736.03 315.38767 (89011305) 489893.87 3613947.00 210.19927 (89021411) 487561.08 3617473.32 23.17120 (89011903) 487618.34 3617476.33 26.16005 (89011903) 487386.27 3617476.33 19.16467 (89030603) 487582.18 3617168.91 15.08396 (89030603) 487630.40 3617168.91 14.55540 (89011903) 487681.64 3616985.06 16.32084 (89030603) 487750.96 3616985.06 17.18338 (89011903)

*** AERMOD - VERSION 09292 *** *** San Diego Sediment Project HRA *** 03/24/11 *** Emissions From Haul Truck Traffic *** 14:57:23 PAGE 35 **MODELOPTs: RegDFAULT CONC ELEV
*** THE 1ST HIGHEST 1-HR AVERAGE CONCENTRATION VALUES FOR SOURCE GROUP: SITE5_04 *** INCLUDING SOURCE(S): SITE5_04,
*** DISCRETE CARTESIAN RECEPTOR POINTS ***
** CONC OF OTHER IN MICROGRAMS/M**3 **
X-COORD (M) Y-COORD (M) CONC (YYMMDDHH) X-COORD (M) Y-COORD (M) CONC (YYMMDDHH) - - - - - - - - - - - - - - - - - - - - - - - - - - - - - - - - - - - - - - - - - - - - - - - - - - - - - - - - - - - - - - - - - - 489737.15 3613699.86 1362.73973 (89012609) 489969.22 3613736.03 335.09966 (89031909) 489893.87 3613947.00 504.34636 (89031908) 487561.08 3617473.32 18.97903 (89030603) 487618.34 3617476.33 14.93252 (89030603) 487386.27 3617476.33 22.08120 (89030603) 487582.18 3617168.91 18.60993 (89030603) 487630.40 3617168.91 18.69106 (89030603) 487681.64 3616985.06 20.01043 (89030603) 487750.96 3616985.06 20.05196 (89030603)

*** AERMOD - VERSION 09292 *** *** San Diego Sediment Project HRA *** 03/24/11 *** Emissions From Haul Truck Traffic *** 14:57:23 PAGE 36 **MODELOPTs: RegDFAULT CONC ELEV
*** THE 1ST HIGHEST 1-HR AVERAGE CONCENTRATION VALUES FOR SOURCE GROUP: SITE5_05 *** INCLUDING SOURCE(S): SITE5_05,
*** DISCRETE CARTESIAN RECEPTOR POINTS ***
** CONC OF OTHER IN MICROGRAMS/M**3 **
X-COORD (M) Y-COORD (M) CONC (YYMMDDHH) X-COORD (M) Y-COORD (M) CONC (YYMMDDHH) - - - - - - - - - - - - - - - - - - - - - - - - - - - - - - - - - - - - - - - - - - - - - - - - - - - - - - - - - - - - - - - - - - 489737.15 3613699.86 90.61971 (89031105) 489969.22 3613736.03 98.58733 (89040409) 489893.87 3613947.00 90.80989 (89031105) 487561.08 3617473.32 10.22055 (89020109) 487618.34 3617476.33 8.61449 (89020109) 487386.27 3617476.33 11.07377 (89020109) 487582.18 3617168.91 7.35542 (89020109) 487630.40 3617168.91 7.19932 (89020109) 487681.64 3616985.06 7.73518 (89020109) 487750.96 3616985.06 7.24827 (89020109)

*** AERMOD - VERSION 09292 *** *** San Diego Sediment Project HRA *** 03/24/11 *** Emissions From Haul Truck Traffic *** 14:57:23 PAGE 37 **MODELOPTs: RegDFAULT CONC ELEV
*** THE 1ST HIGHEST 1-HR AVERAGE CONCENTRATION VALUES FOR SOURCE GROUP: SITE5_06 *** INCLUDING SOURCE(S): SITE5_06,
*** DISCRETE CARTESIAN RECEPTOR POINTS ***
** CONC OF OTHER IN MICROGRAMS/M**3 **
X-COORD (M) Y-COORD (M) CONC (YYMMDDHH) X-COORD (M) Y-COORD (M) CONC (YYMMDDHH) - - - - - - - - - - - - - - - - - - - - - - - - - - - - - - - - - - - - - - - - - - - - - - - - - - - - - - - - - - - - - - - - - - 489737.15 3613699.86 33.69237 (89031105) 489969.22 3613736.03 144.87326 (89031105) 489893.87 3613947.00 26.07742 (89031105) 487561.08 3617473.32 10.85721 (89011903) 487618.34 3617476.33 7.81295 (89020109) 487386.27 3617476.33 18.24788 (89011903) 487582.18 3617168.91 13.94383 (89011903) 487630.40 3617168.91 12.71204 (89011903) 487681.64 3616985.06 14.42062 (89011903) 487750.96 3616985.06 12.17304 (89011903)

*** AERMOD - VERSION 09292 *** *** San Diego Sediment Project HRA *** 03/24/11 *** Emissions From Haul Truck Traffic *** 14:57:23 PAGE 38 **MODELOPTs: RegDFAULT CONC ELEV
*** THE 1ST HIGHEST 1-HR AVERAGE CONCENTRATION VALUES FOR SOURCE GROUP: SITE5_07 *** INCLUDING SOURCE(S): SITE5_07,
*** DISCRETE CARTESIAN RECEPTOR POINTS ***
** CONC OF OTHER IN MICROGRAMS/M**3 **
X-COORD (M) Y-COORD (M) CONC (YYMMDDHH) X-COORD (M) Y-COORD (M) CONC (YYMMDDHH) - - - - - - - - - - - - - - - - - - - - - - - - - - - - - - - - - - - - - - - - - - - - - - - - - - - - - - - - - - - - - - - - - - 489737.15 3613699.86 249.21086 (89010104) 489969.22 3613736.03 26.33533 (89011010) 489893.87 3613947.00 149.92264 (89011010) 487561.08 3617473.32 13.06429 (89011903) 487618.34 3617476.33 13.80742 (89011903) 487386.27 3617476.33 10.03619 (89030603) 487582.18 3617168.91 10.82219 (89011903) 487630.40 3617168.91 12.42235 (89011903) 487681.64 3616985.06 11.78839 (89011903) 487750.96 3616985.06 14.20534 (89011903)

*** AERMOD - VERSION 09292 *** *** San Diego Sediment Project HRA *** 03/24/11 *** Emissions From Haul Truck Traffic *** 14:57:23 PAGE 39 **MODELOPTs: RegDFAULT CONC ELEV
*** THE 1ST HIGHEST 1-HR AVERAGE CONCENTRATION VALUES FOR SOURCE GROUP: SITE5_08 *** INCLUDING SOURCE(S): SITE5_08,
*** DISCRETE CARTESIAN RECEPTOR POINTS ***
** CONC OF OTHER IN MICROGRAMS/M**3 **
X-COORD (M) Y-COORD (M) CONC (YYMMDDHH) X-COORD (M) Y-COORD (M) CONC (YYMMDDHH) - - - - - - - - - - - - - - - - - - - - - - - - - - - - - - - - - - - - - - - - - - - - - - - - - - - - - - - - - - - - - - - - - - 489737.15 3613699.86 450.07500 (89011010) 489969.22 3613736.03 281.48727 (89031105) 489893.87 3613947.00 55.97636 (89011010) 487561.08 3617473.32 12.56079 (89011903) 487618.34 3617476.33 13.99426 (89011903) 487386.27 3617476.33 12.74450 (89030603) 487582.18 3617168.91 13.52218 (89030603) 487630.40 3617168.91 11.98923 (89030603) 487681.64 3616985.06 14.50609 (89030603) 487750.96 3616985.06 12.93977 (89011903)

*** AERMOD - VERSION 09292 *** *** San Diego Sediment Project HRA *** 03/24/11 *** Emissions From Haul Truck Traffic *** 14:57:23 PAGE 40 **MODELOPTs: RegDFAULT CONC ELEV
*** THE 1ST HIGHEST 1-HR AVERAGE CONCENTRATION VALUES FOR SOURCE GROUP: SITE5_09 *** INCLUDING SOURCE(S): SITE5_09,
*** DISCRETE CARTESIAN RECEPTOR POINTS ***
** CONC OF OTHER IN MICROGRAMS/M**3 **
X-COORD (M) Y-COORD (M) CONC (YYMMDDHH) X-COORD (M) Y-COORD (M) CONC (YYMMDDHH) - - - - - - - - - - - - - - - - - - - - - - - - - - - - - - - - - - - - - - - - - - - - - - - - - - - - - - - - - - - - - - - - - - 489737.15 3613699.86 985.02458 (89031105) 489969.22 3613736.03 323.33073 (89021411) 489893.87 3613947.00 318.70949 (89031105) 487561.08 3617473.32 12.48152 (89030603) 487618.34 3617476.33 15.01210 (89011903) 487386.27 3617476.33 18.23549 (89030603) 487582.18 3617168.91 16.85556 (89030603) 487630.40 3617168.91 15.88034 (89030603) 487681.64 3616985.06 18.18123 (89030603) 487750.96 3616985.06 16.50670 (89030603)

*** AERMOD - VERSION 09292 *** *** San Diego Sediment Project HRA *** 03/24/11 *** Emissions From Haul Truck Traffic *** 14:57:23 PAGE 41 **MODELOPTs: RegDFAULT CONC ELEV
*** THE 1ST HIGHEST 1-HR AVERAGE CONCENTRATION VALUES FOR SOURCE GROUP: SITE5_10 *** INCLUDING SOURCE(S): SITE5_10,
*** DISCRETE CARTESIAN RECEPTOR POINTS ***
** CONC OF OTHER IN MICROGRAMS/M**3 **
X-COORD (M) Y-COORD (M) CONC (YYMMDDHH) X-COORD (M) Y-COORD (M) CONC (YYMMDDHH) - - - - - - - - - - - - - - - - - - - - - - - - - - - - - - - - - - - - - - - - - - - - - - - - - - - - - - - - - - - - - - - - - - 489737.15 3613699.86 3264.69332 (89010908) 489969.22 3613736.03 756.66520 (89012609) 489893.87 3613947.00 807.73274 (89010809) 487561.08 3617473.32 16.70588 (89030603) 487618.34 3617476.33 16.75470 (89030603) 487386.27 3617476.33 12.33386 (89030603) 487582.18 3617168.91 14.23849 (89030603) 487630.40 3617168.91 16.19023 (89030603) 487681.64 3616985.06 14.70109 (89030603) 487750.96 3616985.06 17.86843 (89030603)

*** AERMOD - VERSION 09292 *** *** San Diego Sediment Project HRA *** 03/24/11 *** Emissions From Haul Truck Traffic *** 14:57:23 PAGE 42 **MODELOPTs: RegDFAULT CONC ELEV
*** THE 1ST HIGHEST 1-HR AVERAGE CONCENTRATION VALUES FOR SOURCE GROUP: SITE5_11 *** INCLUDING SOURCE(S): SITE5_11,
*** DISCRETE CARTESIAN RECEPTOR POINTS ***
** CONC OF OTHER IN MICROGRAMS/M**3 **
X-COORD (M) Y-COORD (M) CONC (YYMMDDHH) X-COORD (M) Y-COORD (M) CONC (YYMMDDHH) - - - - - - - - - - - - - - - - - - - - - - - - - - - - - - - - - - - - - - - - - - - - - - - - - - - - - - - - - - - - - - - - - - 489737.15 3613699.86 321.14153 (89043005) 489969.22 3613736.03 1577.16153 (89030504) 489893.87 3613947.00 1236.16787 (89011010) 487561.08 3617473.32 13.24030 (89030603) 487618.34 3617476.33 15.13619 (89030603) 487386.27 3617476.33 7.84805 (89040709) 487582.18 3617168.91 8.76170 (89040709) 487630.40 3617168.91 9.64032 (89030603) 487681.64 3616985.06 9.02340 (89040709) 487750.96 3616985.06 10.58929 (89030603)

*** AERMOD - VERSION 09292 *** *** San Diego Sediment Project HRA *** 03/24/11 *** Emissions From Haul Truck Traffic *** 14:57:23 PAGE 43 **MODELOPTs: RegDFAULT CONC ELEV
*** THE 1ST HIGHEST 1-HR AVERAGE CONCENTRATION VALUES FOR SOURCE GROUP: SITE1_08 *** INCLUDING SOURCE(S): SITE1_08,
*** DISCRETE CARTESIAN RECEPTOR POINTS ***
** CONC OF OTHER IN MICROGRAMS/M**3 **
X-COORD (M) Y-COORD (M) CONC (YYMMDDHH) X-COORD (M) Y-COORD (M) CONC (YYMMDDHH) - - - - - - - - - - - - - - - - - - - - - - - - - - - - - - - - - - - - - - - - - - - - - - - - - - - - - - - - - - - - - - - - - - 489737.15 3613699.86 17.31662 (89042803) 489969.22 3613736.03 21.07107 (89022008) 489893.87 3613947.00 23.13258 (89022008) 487561.08 3617473.32 421.30153 (89011903) 487618.34 3617476.33 183.20640 (89062009) 487386.27 3617476.33 131.20633 (89042904) 487582.18 3617168.91 2336.30543 (89021503) 487630.40 3617168.91 4496.63117 (89022604) 487681.64 3616985.06 1391.48720 (89021505) 487750.96 3616985.06 1380.26636 (89030503)

*** AERMOD - VERSION 09292 *** *** San Diego Sediment Project HRA *** 03/24/11 *** Emissions From Haul Truck Traffic *** 14:57:23 PAGE 44 **MODELOPTs: RegDFAULT CONC ELEV
*** THE 1ST HIGHEST 1-HR AVERAGE CONCENTRATION VALUES FOR SOURCE GROUP: SITE1_07 *** INCLUDING SOURCE(S): SITE1_07,
*** DISCRETE CARTESIAN RECEPTOR POINTS ***
** CONC OF OTHER IN MICROGRAMS/M**3 **
X-COORD (M) Y-COORD (M) CONC (YYMMDDHH) X-COORD (M) Y-COORD (M) CONC (YYMMDDHH) - - - - - - - - - - - - - - - - - - - - - - - - - - - - - - - - - - - - - - - - - - - - - - - - - - - - - - - - - - - - - - - - - - 489737.15 3613699.86 14.86659 (89042803) 489969.22 3613736.03 23.68501 (89022008) 489893.87 3613947.00 23.12205 (89022008) 487561.08 3617473.32 412.48391 (89011906) 487618.34 3617476.33 689.56686 (89010104) 487386.27 3617476.33 486.64111 (89030603) 487582.18 3617168.91 8562.18949 (89030603) 487630.40 3617168.91 7053.69823 (89010809) 487681.64 3616985.06 1314.11626 (89031807) 487750.96 3616985.06 990.63680 (89011704)

*** AERMOD - VERSION 09292 *** *** San Diego Sediment Project HRA *** 03/24/11 *** Emissions From Haul Truck Traffic *** 14:57:23 PAGE 45 **MODELOPTs: RegDFAULT CONC ELEV
*** THE SUMMARY OF MAXIMUM PERIOD ( 6144 HRS) RESULTS ***
** CONC OF OTHER IN MICROGRAMS/M**3 **
NETWORKGROUP ID AVERAGE CONC RECEPTOR (XR, YR, ZELEV, ZHILL, ZFLAG) OF TYPE GRID-ID- - - - - - - - - - - - - - - - - - - - - - - - - - - - - - - - - - - - - - - - - - - - - - - - - - - - - - - - - - -
SITE1_01 1ST HIGHEST VALUE IS 11.34585 AT ( 487681.64, 3616985.06, 3.92, 3.92, 0.00) DC 2ND HIGHEST VALUE IS 6.62333 AT ( 487750.96, 3616985.06, 4.81, 4.81, 0.00) DC 3RD HIGHEST VALUE IS 6.13533 AT ( 487582.18, 3617168.91, 6.81, 6.81, 0.00) DC 4TH HIGHEST VALUE IS 4.92113 AT ( 487630.40, 3617168.91, 7.06, 7.06, 0.00) DC 5TH HIGHEST VALUE IS 1.78859 AT ( 487561.08, 3617473.32, 14.70, 14.70, 0.00) DC 6TH HIGHEST VALUE IS 1.73705 AT ( 487618.34, 3617476.33, 14.32, 14.32, 0.00) DC 7TH HIGHEST VALUE IS 0.98959 AT ( 487386.27, 3617476.33, 14.33, 14.33, 0.00) DC 8TH HIGHEST VALUE IS 0.12519 AT ( 489893.87, 3613947.00, 12.67, 12.67, 0.00) DC 9TH HIGHEST VALUE IS 0.10656 AT ( 489969.22, 3613736.03, 13.64, 13.64, 0.00) DC 10TH HIGHEST VALUE IS 0.10122 AT ( 489737.15, 3613699.86, 10.67, 10.67, 0.00) DC
SITE1_02 1ST HIGHEST VALUE IS 15.98387 AT ( 487681.64, 3616985.06, 3.92, 3.92, 0.00) DC 2ND HIGHEST VALUE IS 9.60632 AT ( 487582.18, 3617168.91, 6.81, 6.81, 0.00) DC 3RD HIGHEST VALUE IS 8.29562 AT ( 487750.96, 3616985.06, 4.81, 4.81, 0.00) DC 4TH HIGHEST VALUE IS 7.66416 AT ( 487630.40, 3617168.91, 7.06, 7.06, 0.00) DC 5TH HIGHEST VALUE IS 2.20662 AT ( 487561.08, 3617473.32, 14.70, 14.70, 0.00) DC 6TH HIGHEST VALUE IS 2.11764 AT ( 487618.34, 3617476.33, 14.32, 14.32, 0.00) DC 7TH HIGHEST VALUE IS 1.17610 AT ( 487386.27, 3617476.33, 14.33, 14.33, 0.00) DC 8TH HIGHEST VALUE IS 0.11705 AT ( 489893.87, 3613947.00, 12.67, 12.67, 0.00) DC 9TH HIGHEST VALUE IS 0.10140 AT ( 489969.22, 3613736.03, 13.64, 13.64, 0.00) DC 10TH HIGHEST VALUE IS 0.09812 AT ( 489737.15, 3613699.86, 10.67, 10.67, 0.00) DC
SITE1_03 1ST HIGHEST VALUE IS 21.84667 AT ( 487681.64, 3616985.06, 3.92, 3.92, 0.00) DC 2ND HIGHEST VALUE IS 20.38974 AT ( 487582.18, 3617168.91, 6.81, 6.81, 0.00) DC 3RD HIGHEST VALUE IS 14.60070 AT ( 487630.40, 3617168.91, 7.06, 7.06, 0.00) DC 4TH HIGHEST VALUE IS 10.88211 AT ( 487750.96, 3616985.06, 4.81, 4.81, 0.00) DC 5TH HIGHEST VALUE IS 3.00987 AT ( 487561.08, 3617473.32, 14.70, 14.70, 0.00) DC 6TH HIGHEST VALUE IS 2.72367 AT ( 487618.34, 3617476.33, 14.32, 14.32, 0.00) DC 7TH HIGHEST VALUE IS 1.56078 AT ( 487386.27, 3617476.33, 14.33, 14.33, 0.00) DC 8TH HIGHEST VALUE IS 0.10913 AT ( 489893.87, 3613947.00, 12.67, 12.67, 0.00) DC 9TH HIGHEST VALUE IS 0.09612 AT ( 489969.22, 3613736.03, 13.64, 13.64, 0.00) DC 10TH HIGHEST VALUE IS 0.09495 AT ( 489737.15, 3613699.86, 10.67, 10.67, 0.00) DC
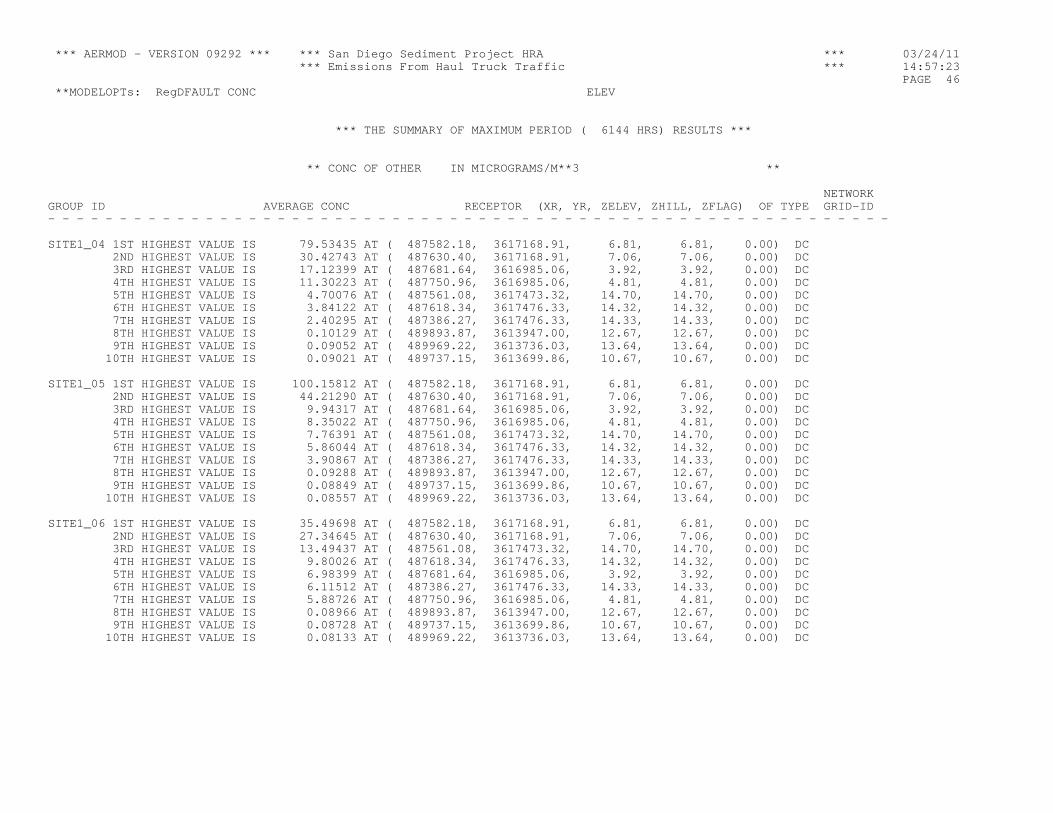
*** AERMOD - VERSION 09292 *** *** San Diego Sediment Project HRA *** 03/24/11 *** Emissions From Haul Truck Traffic *** 14:57:23 PAGE 46 **MODELOPTs: RegDFAULT CONC ELEV
*** THE SUMMARY OF MAXIMUM PERIOD ( 6144 HRS) RESULTS ***
** CONC OF OTHER IN MICROGRAMS/M**3 **
NETWORKGROUP ID AVERAGE CONC RECEPTOR (XR, YR, ZELEV, ZHILL, ZFLAG) OF TYPE GRID-ID- - - - - - - - - - - - - - - - - - - - - - - - - - - - - - - - - - - - - - - - - - - - - - - - - - - - - - - - - - -
SITE1_04 1ST HIGHEST VALUE IS 79.53435 AT ( 487582.18, 3617168.91, 6.81, 6.81, 0.00) DC 2ND HIGHEST VALUE IS 30.42743 AT ( 487630.40, 3617168.91, 7.06, 7.06, 0.00) DC 3RD HIGHEST VALUE IS 17.12399 AT ( 487681.64, 3616985.06, 3.92, 3.92, 0.00) DC 4TH HIGHEST VALUE IS 11.30223 AT ( 487750.96, 3616985.06, 4.81, 4.81, 0.00) DC 5TH HIGHEST VALUE IS 4.70076 AT ( 487561.08, 3617473.32, 14.70, 14.70, 0.00) DC 6TH HIGHEST VALUE IS 3.84122 AT ( 487618.34, 3617476.33, 14.32, 14.32, 0.00) DC 7TH HIGHEST VALUE IS 2.40295 AT ( 487386.27, 3617476.33, 14.33, 14.33, 0.00) DC 8TH HIGHEST VALUE IS 0.10129 AT ( 489893.87, 3613947.00, 12.67, 12.67, 0.00) DC 9TH HIGHEST VALUE IS 0.09052 AT ( 489969.22, 3613736.03, 13.64, 13.64, 0.00) DC 10TH HIGHEST VALUE IS 0.09021 AT ( 489737.15, 3613699.86, 10.67, 10.67, 0.00) DC
SITE1_05 1ST HIGHEST VALUE IS 100.15812 AT ( 487582.18, 3617168.91, 6.81, 6.81, 0.00) DC 2ND HIGHEST VALUE IS 44.21290 AT ( 487630.40, 3617168.91, 7.06, 7.06, 0.00) DC 3RD HIGHEST VALUE IS 9.94317 AT ( 487681.64, 3616985.06, 3.92, 3.92, 0.00) DC 4TH HIGHEST VALUE IS 8.35022 AT ( 487750.96, 3616985.06, 4.81, 4.81, 0.00) DC 5TH HIGHEST VALUE IS 7.76391 AT ( 487561.08, 3617473.32, 14.70, 14.70, 0.00) DC 6TH HIGHEST VALUE IS 5.86044 AT ( 487618.34, 3617476.33, 14.32, 14.32, 0.00) DC 7TH HIGHEST VALUE IS 3.90867 AT ( 487386.27, 3617476.33, 14.33, 14.33, 0.00) DC 8TH HIGHEST VALUE IS 0.09288 AT ( 489893.87, 3613947.00, 12.67, 12.67, 0.00) DC 9TH HIGHEST VALUE IS 0.08849 AT ( 489737.15, 3613699.86, 10.67, 10.67, 0.00) DC 10TH HIGHEST VALUE IS 0.08557 AT ( 489969.22, 3613736.03, 13.64, 13.64, 0.00) DC
SITE1_06 1ST HIGHEST VALUE IS 35.49698 AT ( 487582.18, 3617168.91, 6.81, 6.81, 0.00) DC 2ND HIGHEST VALUE IS 27.34645 AT ( 487630.40, 3617168.91, 7.06, 7.06, 0.00) DC 3RD HIGHEST VALUE IS 13.49437 AT ( 487561.08, 3617473.32, 14.70, 14.70, 0.00) DC 4TH HIGHEST VALUE IS 9.80026 AT ( 487618.34, 3617476.33, 14.32, 14.32, 0.00) DC 5TH HIGHEST VALUE IS 6.98399 AT ( 487681.64, 3616985.06, 3.92, 3.92, 0.00) DC 6TH HIGHEST VALUE IS 6.11512 AT ( 487386.27, 3617476.33, 14.33, 14.33, 0.00) DC 7TH HIGHEST VALUE IS 5.88726 AT ( 487750.96, 3616985.06, 4.81, 4.81, 0.00) DC 8TH HIGHEST VALUE IS 0.08966 AT ( 489893.87, 3613947.00, 12.67, 12.67, 0.00) DC 9TH HIGHEST VALUE IS 0.08728 AT ( 489737.15, 3613699.86, 10.67, 10.67, 0.00) DC 10TH HIGHEST VALUE IS 0.08133 AT ( 489969.22, 3613736.03, 13.64, 13.64, 0.00) DC

*** AERMOD - VERSION 09292 *** *** San Diego Sediment Project HRA *** 03/24/11 *** Emissions From Haul Truck Traffic *** 14:57:23 PAGE 47 **MODELOPTs: RegDFAULT CONC ELEV
*** THE SUMMARY OF MAXIMUM PERIOD ( 6144 HRS) RESULTS ***
** CONC OF OTHER IN MICROGRAMS/M**3 **
NETWORKGROUP ID AVERAGE CONC RECEPTOR (XR, YR, ZELEV, ZHILL, ZFLAG) OF TYPE GRID-ID- - - - - - - - - - - - - - - - - - - - - - - - - - - - - - - - - - - - - - - - - - - - - - - - - - - - - - - - - - -
SITE5_01 1ST HIGHEST VALUE IS 0.95279 AT ( 489737.15, 3613699.86, 10.67, 10.67, 0.00) DC 2ND HIGHEST VALUE IS 0.61380 AT ( 489893.87, 3613947.00, 12.67, 12.67, 0.00) DC 3RD HIGHEST VALUE IS 0.54382 AT ( 489969.22, 3613736.03, 13.64, 13.64, 0.00) DC 4TH HIGHEST VALUE IS 0.04929 AT ( 487750.96, 3616985.06, 4.81, 4.81, 0.00) DC 5TH HIGHEST VALUE IS 0.04924 AT ( 487681.64, 3616985.06, 3.92, 3.92, 0.00) DC 6TH HIGHEST VALUE IS 0.04232 AT ( 487582.18, 3617168.91, 6.81, 6.81, 0.00) DC 7TH HIGHEST VALUE IS 0.04216 AT ( 487630.40, 3617168.91, 7.06, 7.06, 0.00) DC 8TH HIGHEST VALUE IS 0.03574 AT ( 487618.34, 3617476.33, 14.32, 14.32, 0.00) DC 9TH HIGHEST VALUE IS 0.03487 AT ( 487561.08, 3617473.32, 14.70, 14.70, 0.00) DC 10TH HIGHEST VALUE IS 0.03363 AT ( 487386.27, 3617476.33, 14.33, 14.33, 0.00) DC
SITE5_02 1ST HIGHEST VALUE IS 1.81899 AT ( 489737.15, 3613699.86, 10.67, 10.67, 0.00) DC 2ND HIGHEST VALUE IS 0.94817 AT ( 489893.87, 3613947.00, 12.67, 12.67, 0.00) DC 3RD HIGHEST VALUE IS 0.88368 AT ( 489969.22, 3613736.03, 13.64, 13.64, 0.00) DC 4TH HIGHEST VALUE IS 0.05047 AT ( 487750.96, 3616985.06, 4.81, 4.81, 0.00) DC 5TH HIGHEST VALUE IS 0.05011 AT ( 487681.64, 3616985.06, 3.92, 3.92, 0.00) DC 6TH HIGHEST VALUE IS 0.04591 AT ( 487630.40, 3617168.91, 7.06, 7.06, 0.00) DC 7TH HIGHEST VALUE IS 0.04565 AT ( 487582.18, 3617168.91, 6.81, 6.81, 0.00) DC 8TH HIGHEST VALUE IS 0.03519 AT ( 487618.34, 3617476.33, 14.32, 14.32, 0.00) DC 9TH HIGHEST VALUE IS 0.03518 AT ( 487561.08, 3617473.32, 14.70, 14.70, 0.00) DC 10TH HIGHEST VALUE IS 0.03270 AT ( 487386.27, 3617476.33, 14.33, 14.33, 0.00) DC
SITE5_03 1ST HIGHEST VALUE IS 4.66793 AT ( 489737.15, 3613699.86, 10.67, 10.67, 0.00) DC 2ND HIGHEST VALUE IS 1.62271 AT ( 489893.87, 3613947.00, 12.67, 12.67, 0.00) DC 3RD HIGHEST VALUE IS 1.51651 AT ( 489969.22, 3613736.03, 13.64, 13.64, 0.00) DC 4TH HIGHEST VALUE IS 0.04999 AT ( 487750.96, 3616985.06, 4.81, 4.81, 0.00) DC 5TH HIGHEST VALUE IS 0.04927 AT ( 487681.64, 3616985.06, 3.92, 3.92, 0.00) DC 6TH HIGHEST VALUE IS 0.04533 AT ( 487630.40, 3617168.91, 7.06, 7.06, 0.00) DC 7TH HIGHEST VALUE IS 0.04490 AT ( 487582.18, 3617168.91, 6.81, 6.81, 0.00) DC 8TH HIGHEST VALUE IS 0.03517 AT ( 487618.34, 3617476.33, 14.32, 14.32, 0.00) DC 9TH HIGHEST VALUE IS 0.03393 AT ( 487561.08, 3617473.32, 14.70, 14.70, 0.00) DC 10TH HIGHEST VALUE IS 0.03316 AT ( 487386.27, 3617476.33, 14.33, 14.33, 0.00) DC
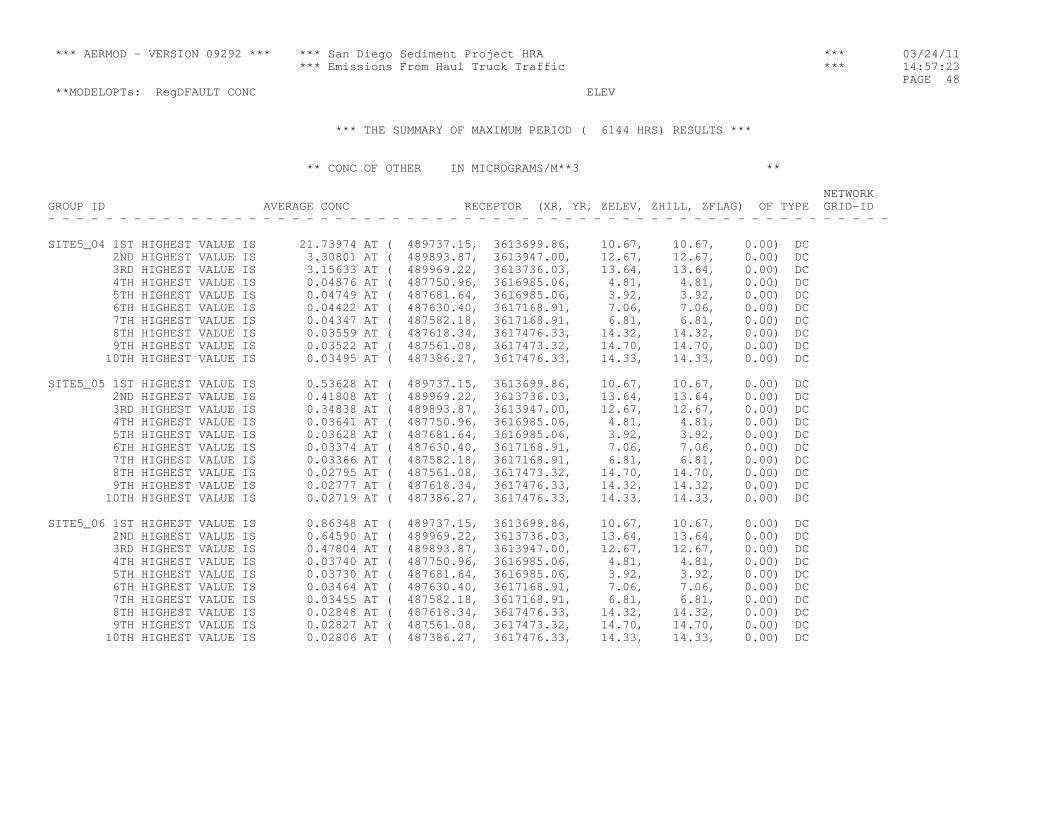
*** AERMOD - VERSION 09292 *** *** San Diego Sediment Project HRA *** 03/24/11 *** Emissions From Haul Truck Traffic *** 14:57:23 PAGE 48 **MODELOPTs: RegDFAULT CONC ELEV
*** THE SUMMARY OF MAXIMUM PERIOD ( 6144 HRS) RESULTS ***
** CONC OF OTHER IN MICROGRAMS/M**3 **
NETWORKGROUP ID AVERAGE CONC RECEPTOR (XR, YR, ZELEV, ZHILL, ZFLAG) OF TYPE GRID-ID- - - - - - - - - - - - - - - - - - - - - - - - - - - - - - - - - - - - - - - - - - - - - - - - - - - - - - - - - - -
SITE5_04 1ST HIGHEST VALUE IS 21.73974 AT ( 489737.15, 3613699.86, 10.67, 10.67, 0.00) DC 2ND HIGHEST VALUE IS 3.30801 AT ( 489893.87, 3613947.00, 12.67, 12.67, 0.00) DC 3RD HIGHEST VALUE IS 3.15633 AT ( 489969.22, 3613736.03, 13.64, 13.64, 0.00) DC 4TH HIGHEST VALUE IS 0.04876 AT ( 487750.96, 3616985.06, 4.81, 4.81, 0.00) DC 5TH HIGHEST VALUE IS 0.04749 AT ( 487681.64, 3616985.06, 3.92, 3.92, 0.00) DC 6TH HIGHEST VALUE IS 0.04422 AT ( 487630.40, 3617168.91, 7.06, 7.06, 0.00) DC 7TH HIGHEST VALUE IS 0.04347 AT ( 487582.18, 3617168.91, 6.81, 6.81, 0.00) DC 8TH HIGHEST VALUE IS 0.03559 AT ( 487618.34, 3617476.33, 14.32, 14.32, 0.00) DC 9TH HIGHEST VALUE IS 0.03522 AT ( 487561.08, 3617473.32, 14.70, 14.70, 0.00) DC 10TH HIGHEST VALUE IS 0.03495 AT ( 487386.27, 3617476.33, 14.33, 14.33, 0.00) DC
SITE5_05 1ST HIGHEST VALUE IS 0.53628 AT ( 489737.15, 3613699.86, 10.67, 10.67, 0.00) DC 2ND HIGHEST VALUE IS 0.41808 AT ( 489969.22, 3613736.03, 13.64, 13.64, 0.00) DC 3RD HIGHEST VALUE IS 0.34838 AT ( 489893.87, 3613947.00, 12.67, 12.67, 0.00) DC 4TH HIGHEST VALUE IS 0.03641 AT ( 487750.96, 3616985.06, 4.81, 4.81, 0.00) DC 5TH HIGHEST VALUE IS 0.03628 AT ( 487681.64, 3616985.06, 3.92, 3.92, 0.00) DC 6TH HIGHEST VALUE IS 0.03374 AT ( 487630.40, 3617168.91, 7.06, 7.06, 0.00) DC 7TH HIGHEST VALUE IS 0.03366 AT ( 487582.18, 3617168.91, 6.81, 6.81, 0.00) DC 8TH HIGHEST VALUE IS 0.02795 AT ( 487561.08, 3617473.32, 14.70, 14.70, 0.00) DC 9TH HIGHEST VALUE IS 0.02777 AT ( 487618.34, 3617476.33, 14.32, 14.32, 0.00) DC 10TH HIGHEST VALUE IS 0.02719 AT ( 487386.27, 3617476.33, 14.33, 14.33, 0.00) DC
SITE5_06 1ST HIGHEST VALUE IS 0.86348 AT ( 489737.15, 3613699.86, 10.67, 10.67, 0.00) DC 2ND HIGHEST VALUE IS 0.64590 AT ( 489969.22, 3613736.03, 13.64, 13.64, 0.00) DC 3RD HIGHEST VALUE IS 0.47804 AT ( 489893.87, 3613947.00, 12.67, 12.67, 0.00) DC 4TH HIGHEST VALUE IS 0.03740 AT ( 487750.96, 3616985.06, 4.81, 4.81, 0.00) DC 5TH HIGHEST VALUE IS 0.03730 AT ( 487681.64, 3616985.06, 3.92, 3.92, 0.00) DC 6TH HIGHEST VALUE IS 0.03464 AT ( 487630.40, 3617168.91, 7.06, 7.06, 0.00) DC 7TH HIGHEST VALUE IS 0.03455 AT ( 487582.18, 3617168.91, 6.81, 6.81, 0.00) DC 8TH HIGHEST VALUE IS 0.02848 AT ( 487618.34, 3617476.33, 14.32, 14.32, 0.00) DC 9TH HIGHEST VALUE IS 0.02827 AT ( 487561.08, 3617473.32, 14.70, 14.70, 0.00) DC 10TH HIGHEST VALUE IS 0.02806 AT ( 487386.27, 3617476.33, 14.33, 14.33, 0.00) DC

*** AERMOD - VERSION 09292 *** *** San Diego Sediment Project HRA *** 03/24/11 *** Emissions From Haul Truck Traffic *** 14:57:23 PAGE 49 **MODELOPTs: RegDFAULT CONC ELEV
*** THE SUMMARY OF MAXIMUM PERIOD ( 6144 HRS) RESULTS ***
** CONC OF OTHER IN MICROGRAMS/M**3 **
NETWORKGROUP ID AVERAGE CONC RECEPTOR (XR, YR, ZELEV, ZHILL, ZFLAG) OF TYPE GRID-ID- - - - - - - - - - - - - - - - - - - - - - - - - - - - - - - - - - - - - - - - - - - - - - - - - - - - - - - - - - -
SITE5_07 1ST HIGHEST VALUE IS 1.60939 AT ( 489737.15, 3613699.86, 10.67, 10.67, 0.00) DC 2ND HIGHEST VALUE IS 1.01246 AT ( 489969.22, 3613736.03, 13.64, 13.64, 0.00) DC 3RD HIGHEST VALUE IS 0.82011 AT ( 489893.87, 3613947.00, 12.67, 12.67, 0.00) DC 4TH HIGHEST VALUE IS 0.03741 AT ( 487750.96, 3616985.06, 4.81, 4.81, 0.00) DC 5TH HIGHEST VALUE IS 0.03698 AT ( 487681.64, 3616985.06, 3.92, 3.92, 0.00) DC 6TH HIGHEST VALUE IS 0.03446 AT ( 487630.40, 3617168.91, 7.06, 7.06, 0.00) DC 7TH HIGHEST VALUE IS 0.03420 AT ( 487582.18, 3617168.91, 6.81, 6.81, 0.00) DC 8TH HIGHEST VALUE IS 0.03110 AT ( 487618.34, 3617476.33, 14.32, 14.32, 0.00) DC 9TH HIGHEST VALUE IS 0.03089 AT ( 487561.08, 3617473.32, 14.70, 14.70, 0.00) DC 10TH HIGHEST VALUE IS 0.03008 AT ( 487386.27, 3617476.33, 14.33, 14.33, 0.00) DC
SITE5_08 1ST HIGHEST VALUE IS 3.31558 AT ( 489737.15, 3613699.86, 10.67, 10.67, 0.00) DC 2ND HIGHEST VALUE IS 1.71952 AT ( 489969.22, 3613736.03, 13.64, 13.64, 0.00) DC 3RD HIGHEST VALUE IS 1.09556 AT ( 489893.87, 3613947.00, 12.67, 12.67, 0.00) DC 4TH HIGHEST VALUE IS 0.04088 AT ( 487750.96, 3616985.06, 4.81, 4.81, 0.00) DC 5TH HIGHEST VALUE IS 0.04034 AT ( 487681.64, 3616985.06, 3.92, 3.92, 0.00) DC 6TH HIGHEST VALUE IS 0.03749 AT ( 487630.40, 3617168.91, 7.06, 7.06, 0.00) DC 7TH HIGHEST VALUE IS 0.03717 AT ( 487582.18, 3617168.91, 6.81, 6.81, 0.00) DC 8TH HIGHEST VALUE IS 0.03368 AT ( 487618.34, 3617476.33, 14.32, 14.32, 0.00) DC 9TH HIGHEST VALUE IS 0.03342 AT ( 487561.08, 3617473.32, 14.70, 14.70, 0.00) DC 10TH HIGHEST VALUE IS 0.03249 AT ( 487386.27, 3617476.33, 14.33, 14.33, 0.00) DC
SITE5_09 1ST HIGHEST VALUE IS 10.05703 AT ( 489737.15, 3613699.86, 10.67, 10.67, 0.00) DC 2ND HIGHEST VALUE IS 2.78671 AT ( 489969.22, 3613736.03, 13.64, 13.64, 0.00) DC 3RD HIGHEST VALUE IS 1.94912 AT ( 489893.87, 3613947.00, 12.67, 12.67, 0.00) DC 4TH HIGHEST VALUE IS 0.04495 AT ( 487750.96, 3616985.06, 4.81, 4.81, 0.00) DC 5TH HIGHEST VALUE IS 0.04415 AT ( 487681.64, 3616985.06, 3.92, 3.92, 0.00) DC 6TH HIGHEST VALUE IS 0.04100 AT ( 487630.40, 3617168.91, 7.06, 7.06, 0.00) DC 7TH HIGHEST VALUE IS 0.04052 AT ( 487582.18, 3617168.91, 6.81, 6.81, 0.00) DC 8TH HIGHEST VALUE IS 0.03436 AT ( 487618.34, 3617476.33, 14.32, 14.32, 0.00) DC 9TH HIGHEST VALUE IS 0.03363 AT ( 487561.08, 3617473.32, 14.70, 14.70, 0.00) DC 10TH HIGHEST VALUE IS 0.03335 AT ( 487386.27, 3617476.33, 14.33, 14.33, 0.00) DC

*** AERMOD - VERSION 09292 *** *** San Diego Sediment Project HRA *** 03/24/11 *** Emissions From Haul Truck Traffic *** 14:57:23 PAGE 50 **MODELOPTs: RegDFAULT CONC ELEV
*** THE SUMMARY OF MAXIMUM PERIOD ( 6144 HRS) RESULTS ***
** CONC OF OTHER IN MICROGRAMS/M**3 **
NETWORKGROUP ID AVERAGE CONC RECEPTOR (XR, YR, ZELEV, ZHILL, ZFLAG) OF TYPE GRID-ID- - - - - - - - - - - - - - - - - - - - - - - - - - - - - - - - - - - - - - - - - - - - - - - - - - - - - - - - - - -
SITE5_10 1ST HIGHEST VALUE IS 84.04176 AT ( 489737.15, 3613699.86, 10.67, 10.67, 0.00) DC 2ND HIGHEST VALUE IS 8.65076 AT ( 489969.22, 3613736.03, 13.64, 13.64, 0.00) DC 3RD HIGHEST VALUE IS 7.40250 AT ( 489893.87, 3613947.00, 12.67, 12.67, 0.00) DC 4TH HIGHEST VALUE IS 0.04633 AT ( 487750.96, 3616985.06, 4.81, 4.81, 0.00) DC 5TH HIGHEST VALUE IS 0.04442 AT ( 487681.64, 3616985.06, 3.92, 3.92, 0.00) DC 6TH HIGHEST VALUE IS 0.04206 AT ( 487630.40, 3617168.91, 7.06, 7.06, 0.00) DC 7TH HIGHEST VALUE IS 0.04091 AT ( 487582.18, 3617168.91, 6.81, 6.81, 0.00) DC 8TH HIGHEST VALUE IS 0.03903 AT ( 487618.34, 3617476.33, 14.32, 14.32, 0.00) DC 9TH HIGHEST VALUE IS 0.03835 AT ( 487561.08, 3617473.32, 14.70, 14.70, 0.00) DC 10TH HIGHEST VALUE IS 0.03535 AT ( 487386.27, 3617476.33, 14.33, 14.33, 0.00) DC
SITE5_11 1ST HIGHEST VALUE IS 34.66307 AT ( 489969.22, 3613736.03, 13.64, 13.64, 0.00) DC 2ND HIGHEST VALUE IS 21.63489 AT ( 489893.87, 3613947.00, 12.67, 12.67, 0.00) DC 3RD HIGHEST VALUE IS 9.78348 AT ( 489737.15, 3613699.86, 10.67, 10.67, 0.00) DC 4TH HIGHEST VALUE IS 0.04273 AT ( 487750.96, 3616985.06, 4.81, 4.81, 0.00) DC 5TH HIGHEST VALUE IS 0.04080 AT ( 487681.64, 3616985.06, 3.92, 3.92, 0.00) DC 6TH HIGHEST VALUE IS 0.03891 AT ( 487630.40, 3617168.91, 7.06, 7.06, 0.00) DC 7TH HIGHEST VALUE IS 0.03772 AT ( 487582.18, 3617168.91, 6.81, 6.81, 0.00) DC 8TH HIGHEST VALUE IS 0.03740 AT ( 487618.34, 3617476.33, 14.32, 14.32, 0.00) DC 9TH HIGHEST VALUE IS 0.03633 AT ( 487561.08, 3617473.32, 14.70, 14.70, 0.00) DC 10TH HIGHEST VALUE IS 0.03278 AT ( 487386.27, 3617476.33, 14.33, 14.33, 0.00) DC
SITE1_08 1ST HIGHEST VALUE IS 73.80687 AT ( 487630.40, 3617168.91, 7.06, 7.06, 0.00) DC 2ND HIGHEST VALUE IS 28.97759 AT ( 487582.18, 3617168.91, 6.81, 6.81, 0.00) DC 3RD HIGHEST VALUE IS 26.54744 AT ( 487750.96, 3616985.06, 4.81, 4.81, 0.00) DC 4TH HIGHEST VALUE IS 23.72275 AT ( 487681.64, 3616985.06, 3.92, 3.92, 0.00) DC 5TH HIGHEST VALUE IS 2.97994 AT ( 487618.34, 3617476.33, 14.32, 14.32, 0.00) DC 6TH HIGHEST VALUE IS 2.49713 AT ( 487561.08, 3617473.32, 14.70, 14.70, 0.00) DC 7TH HIGHEST VALUE IS 1.38226 AT ( 487386.27, 3617476.33, 14.33, 14.33, 0.00) DC 8TH HIGHEST VALUE IS 0.10079 AT ( 489893.87, 3613947.00, 12.67, 12.67, 0.00) DC 9TH HIGHEST VALUE IS 0.09791 AT ( 489737.15, 3613699.86, 10.67, 10.67, 0.00) DC 10TH HIGHEST VALUE IS 0.09151 AT ( 489969.22, 3613736.03, 13.64, 13.64, 0.00) DC
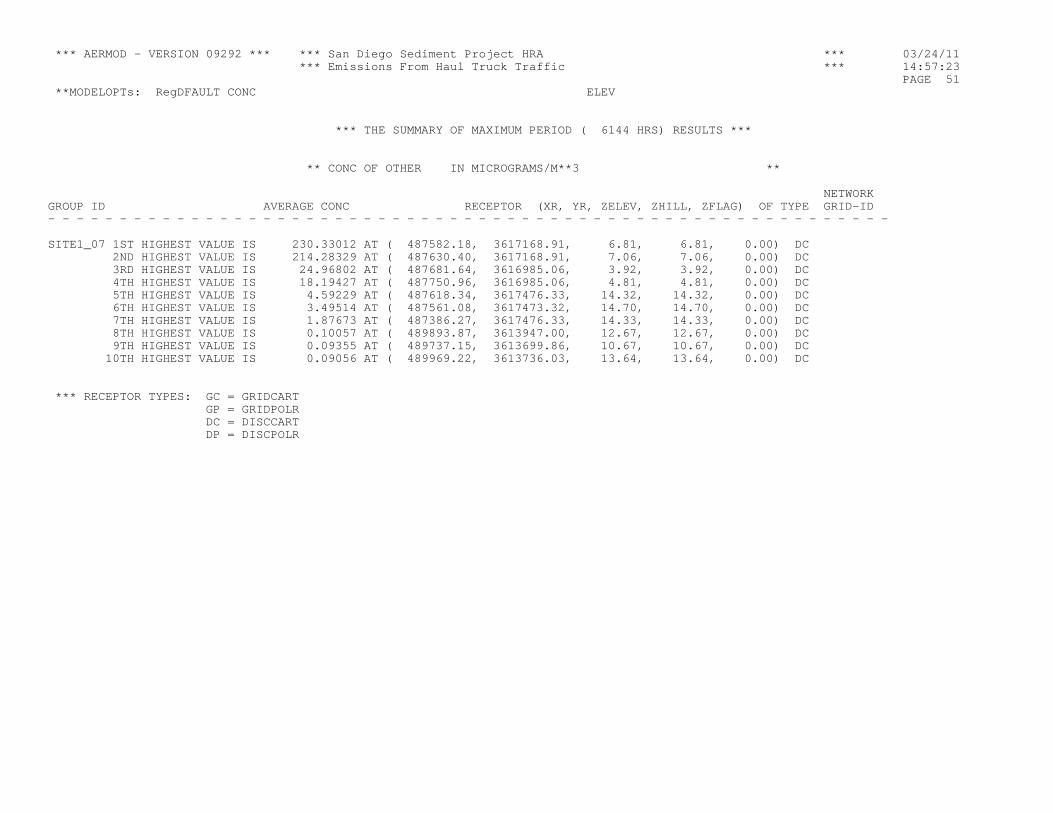
*** AERMOD - VERSION 09292 *** *** San Diego Sediment Project HRA *** 03/24/11 *** Emissions From Haul Truck Traffic *** 14:57:23 PAGE 51 **MODELOPTs: RegDFAULT CONC ELEV
*** THE SUMMARY OF MAXIMUM PERIOD ( 6144 HRS) RESULTS ***
** CONC OF OTHER IN MICROGRAMS/M**3 **
NETWORKGROUP ID AVERAGE CONC RECEPTOR (XR, YR, ZELEV, ZHILL, ZFLAG) OF TYPE GRID-ID- - - - - - - - - - - - - - - - - - - - - - - - - - - - - - - - - - - - - - - - - - - - - - - - - - - - - - - - - - -
SITE1_07 1ST HIGHEST VALUE IS 230.33012 AT ( 487582.18, 3617168.91, 6.81, 6.81, 0.00) DC 2ND HIGHEST VALUE IS 214.28329 AT ( 487630.40, 3617168.91, 7.06, 7.06, 0.00) DC 3RD HIGHEST VALUE IS 24.96802 AT ( 487681.64, 3616985.06, 3.92, 3.92, 0.00) DC 4TH HIGHEST VALUE IS 18.19427 AT ( 487750.96, 3616985.06, 4.81, 4.81, 0.00) DC 5TH HIGHEST VALUE IS 4.59229 AT ( 487618.34, 3617476.33, 14.32, 14.32, 0.00) DC 6TH HIGHEST VALUE IS 3.49514 AT ( 487561.08, 3617473.32, 14.70, 14.70, 0.00) DC 7TH HIGHEST VALUE IS 1.87673 AT ( 487386.27, 3617476.33, 14.33, 14.33, 0.00) DC 8TH HIGHEST VALUE IS 0.10057 AT ( 489893.87, 3613947.00, 12.67, 12.67, 0.00) DC 9TH HIGHEST VALUE IS 0.09355 AT ( 489737.15, 3613699.86, 10.67, 10.67, 0.00) DC 10TH HIGHEST VALUE IS 0.09056 AT ( 489969.22, 3613736.03, 13.64, 13.64, 0.00) DC
*** RECEPTOR TYPES: GC = GRIDCART GP = GRIDPOLR DC = DISCCART DP = DISCPOLR

*** AERMOD - VERSION 09292 *** *** San Diego Sediment Project HRA *** 03/24/11 *** Emissions From Haul Truck Traffic *** 14:57:23 PAGE 52 **MODELOPTs: RegDFAULT CONC ELEV
*** THE SUMMARY OF HIGHEST 1-HR RESULTS ***
** CONC OF OTHER IN MICROGRAMS/M**3 **
DATE NETWORKGROUP ID AVERAGE CONC (YYMMDDHH) RECEPTOR (XR, YR, ZELEV, ZHILL, ZFLAG) OF TYPE GRID-ID- - - - - - - - - - - - - - - - - - - - - - - - - - - - - - - - - - - - - - - - - - - - - - - - - - - - - - - - - - - - - - - - - - SITE1_01 HIGH 1ST HIGH VALUE IS 893.29366 ON 89021411: AT ( 487681.64, 3616985.06, 3.92, 3.92, 0.00) DC SITE1_02 HIGH 1ST HIGH VALUE IS 1476.80472 ON 89011305: AT ( 487681.64, 3616985.06, 3.92, 3.92, 0.00) DC SITE1_03 HIGH 1ST HIGH VALUE IS 1127.12694 ON 89031105: AT ( 487582.18, 3617168.91, 6.81, 6.81, 0.00) DC SITE1_04 HIGH 1ST HIGH VALUE IS 3837.31858 ON 89011309: AT ( 487582.18, 3617168.91, 6.81, 6.81, 0.00) DC SITE1_05 HIGH 1ST HIGH VALUE IS 3215.14578 ON 89011704: AT ( 487582.18, 3617168.91, 6.81, 6.81, 0.00) DC SITE1_06 HIGH 1ST HIGH VALUE IS 1629.06899 ON 89021607: AT ( 487582.18, 3617168.91, 6.81, 6.81, 0.00) DC SITE5_01 HIGH 1ST HIGH VALUE IS 272.74704 ON 89011305: AT ( 489737.15, 3613699.86, 10.67, 10.67, 0.00) DC SITE5_02 HIGH 1ST HIGH VALUE IS 374.85299 ON 89011305: AT ( 489737.15, 3613699.86, 10.67, 10.67, 0.00) DC SITE5_03 HIGH 1ST HIGH VALUE IS 453.86299 ON 89031909: AT ( 489737.15, 3613699.86, 10.67, 10.67, 0.00) DC SITE5_04 HIGH 1ST HIGH VALUE IS 1362.73973 ON 89012609: AT ( 489737.15, 3613699.86, 10.67, 10.67, 0.00) DC SITE5_05 HIGH 1ST HIGH VALUE IS 98.58733 ON 89040409: AT ( 489969.22, 3613736.03, 13.64, 13.64, 0.00) DC SITE5_06 HIGH 1ST HIGH VALUE IS 144.87326 ON 89031105: AT ( 489969.22, 3613736.03, 13.64, 13.64, 0.00) DC SITE5_07 HIGH 1ST HIGH VALUE IS 249.21086 ON 89010104: AT ( 489737.15, 3613699.86, 10.67, 10.67, 0.00) DC SITE5_08 HIGH 1ST HIGH VALUE IS 450.07500 ON 89011010: AT ( 489737.15, 3613699.86, 10.67, 10.67, 0.00) DC SITE5_09 HIGH 1ST HIGH VALUE IS 985.02458 ON 89031105: AT ( 489737.15, 3613699.86, 10.67, 10.67, 0.00) DC SITE5_10 HIGH 1ST HIGH VALUE IS 3264.69332 ON 89010908: AT ( 489737.15, 3613699.86, 10.67, 10.67, 0.00) DC SITE5_11 HIGH 1ST HIGH VALUE IS 1577.16153 ON 89030504: AT ( 489969.22, 3613736.03, 13.64, 13.64, 0.00) DC SITE1_08 HIGH 1ST HIGH VALUE IS 4496.63117 ON 89022604: AT ( 487630.40, 3617168.91, 7.06, 7.06, 0.00) DC SITE1_07 HIGH 1ST HIGH VALUE IS 8562.18949 ON 89030603: AT ( 487582.18, 3617168.91, 6.81, 6.81, 0.00) DC
*** RECEPTOR TYPES: GC = GRIDCART GP = GRIDPOLR DC = DISCCART DP = DISCPOLR

*** AERMOD - VERSION 09292 *** *** San Diego Sediment Project HRA *** 03/24/11 *** Emissions From Haul Truck Traffic *** 14:57:23 PAGE 53 **MODELOPTs: RegDFAULT CONC ELEV
*** Message Summary : AERMOD Model Execution ***
--------- Summary of Total Messages -------- A Total of 0 Fatal Error Message(s) A Total of 0 Warning Message(s) A Total of 2931 Informational Message(s)
A Total of 6144 Hours Were Processed
A Total of 214 Calm Hours Identified
A Total of 2717 Missing Hours Identified ( 44.22 Percent)
CAUTION!: Number of Missing Hours Exceeds 10 Percent of Total! Data May Not Be Acceptable for Regulatory Applications. See Section 5.3.2 of "Meteorological Monitoring Guidance for Regulatory Modeling Applications" (EPA-454/R-99-005). ******** FATAL ERROR MESSAGES ******** *** NONE *** ******** WARNING MESSAGES ******** *** NONE ***
************************************ *** AERMOD Finishes Successfully *** ************************************