Appendix G-3: Working Summary Tables from...
124
2005 Dietary Guidelines Advisory Committee Report Appendix G-3: Working Summary Tables from Systematic Review Summary of Vitamin E Literature Search Included: all ages/or elderly, clinical trials, human, English, 1995-2004 Full Citation Design & Duration & Objective Population Methods Outcome Measures Link to site Results Statistics, Conclusions, & Comments Maras, J.E., Intake of alpha-tocopherol is limited among US adults. J Am Diet Assoc 2004 Apr;104(4):567-75. Examined alpha- tocopherol intake & food sources of alpha- tocopherol in the US population relative to current DRI for vit E. Data from 5,056 ♂ & 4,703 ♀ aged 20 years & older were obtained from 1994 to 1996. Analyzed food sources & intake data from the 1994 to 1996 Continuing Survey of Food Intakes by Individuals (CSFII) with added values for alpha- tocopherol from the US Department of Agriculture National Nutrient Database for Standard Reference Release 15. CSFII The complex design & sampling weights of the CSFII survey were taken into account to calculate the mean alpha- tocopherol intake from diet, the SEM, & the % of the Estimated Average Requirements (EARs) for alpha-tocopherol intake by age group & region. Only 8.0% of ♂ & 2.4% of ♀ in the US met the new EARs for vit E intake from foods alone. Regionally, only 5.8% of ♂ & 2.1% of ♀ in the South met these EARs, relative to 9.0% & 2.6%, respectively, in the NE.Top contributors of alpha- tocopherol for ♂ & ♀ included ready- to-eat cereal, sweet baked products, white bread, beef, oils, & salad dressing. The majority of ♂ & ♀ in the US fail to meet the current recommendations for vit E intake. Many of the top contributors are not particularly high sources of alpha- tocopherol but are consumed frequently. Greater inclusion of sources such as nuts, seeds, & vit E-rich oils, could improve intake of alpha-tocopherol. Zandi P.P., et al., Reduced risk of Alzheimer disease in users of antioxidant vitamin supplements: the Cache County Study.Arch Neurol 2004 Jan;61(1):82-8. Cross-sectional & prospective study of dementia. Antioxidants may protect the aging brain against oxidative damage assoc. w. pathol. changes of Alzheimer dz (AD). Examined the relationship between antioxidant suppl use & risk of AD (use was ascertained @ 1st contact. Elderly (65 yrs or↑) Cache County, UT residents assessed in 1995-1997 for prevalent dementia & AD, & again in 1998-2000 for incident illness. 4740 respondents (93%) 200 cases of AD Among 3227 survivors at risk, 104 incident AD cases were identified at f-up. Dx of AD by means of multistage assessment procedures. Analyses of prevalent & incident AD yielded similar results. Use of vit E & C (ascorbic acid) suppl in combination was assoc. w. ↓ AD prevalence (adjusted odds ratio, 0.22; 95% confidence interval, 0.05-0.60) & incidence (adjusted hazard ratio, 0.36; 95% confidence interval, 0.09-0.99). A trend toward ↓ AD risk evident in users of vit E & MVI containing vit C, but no evidence of a protective effect w. use of vit E or vit C suppl alone, w. MVI alone, or w. vit B-complex suppl. Use of vit E & vit C supplements in combination is associated w. ↓ prevalence & incidence of AD. Antioxidant supplements merit further study as agents for the primary prevention of AD. Leonard S.W., et al., Vitamin E bioavailability from fortified breakfast cereal is greater than that from encapsulated supplements. Am J Clin Nutr 2004 Jan;79(1):86-92. Clinical Trial Conflicting results from vit E intervention studies suggest supplemental vitamin E malabsorption. Compared vit E bioavailability from a suppl w. that from a fortified breakfast cereal. 5 fasting subjects sequentially consumed the following (with 236 mL fat-free milk): 400 IU d(9)-alpha-tocopheryl acetate (400-IU capsule), 41 g ready-to- eat wheat cereal containing 30 IU d(9)-alpha-tocopheryl acetate (30-IU cereal), & 45 g cereal containing 400 IU d(9)-alpha- tocopheryl acetate (400-IU cereal). 5 mths later (trial 4), they consumed a 400-IU capsule w. 41 g vit E-free cereal. Blood was obtained up to 72 h after the start of each trial. Vit E bioavailability was evaluated by using deuterium-labeled all-rac-alpha-tocopherol in three 4-d trials (2 wk apart). The mean (+/-SD) vit E bioavailabilities of the 30-IU cereal & the 400-IU cereal were 6 +/- 2 & 26 +/- 8 times, respectively, the vit E bioavailability of the 400-IU capsule. Areas under the 0-72-h d(9)-alpha- tocopherol curves for the 400-IU capsule, the 30-IU cereal, & the 400- IU cereal were 30 +/- 7, 153+/- 43, & 765 +/- 164 micro mol. h/L (all trial comparisons, P < 0.0001). In trial 4, 3 subjects barely responded & 2 subjects had areas under the curve that were similar to their 400-IU cereal responses. The low bioavailability of vit E from the 400-IU capsule & the variability observed when the capsule was consumed w. cereal suggest that encapsulated vit E is poorly absorbed when consumed w. a low-fat meal & that bioavailability can be enhanced by food fortification w. vit E. Djuric Z., et al., Plasma carotenoids, Clinical Trial Randomized Control Trial Fasting plasma was available for ♀ were randomized onto one of four diets for 12 wk: non- Levels of carotenoids & tocopherols did not change significantly over 12 ↓ in dietary fat & energy intakes in this study were 1
Transcript of Appendix G-3: Working Summary Tables from...

2005 Dietary Guidelines Advisory Committee Report
Appendix G-3: Working Summary Tables from Systematic Review Summary of Vitamin E Literature Search Included: all ages/or elderly, clinical trials, human, English, 1995-2004
Full Citation Design & Duration & Objective
Population Methods Outcome MeasuresLink to site
Results Statistics,Conclusions,
& Comments Maras, J.E., Intake of alpha-tocopherol is limited among US adults. J Am Diet Assoc 2004 Apr;104(4):567-75.
Examined alpha-tocopherol intake & food sources of alpha-tocopherol in the US population relative to current DRI for vit E.
Data from 5,056 ♂ & 4,703 ♀ aged 20 years & older were obtained from 1994 to 1996.
Analyzed food sources & intake data from the 1994 to 1996 Continuing Survey of Food Intakes by Individuals (CSFII) with added values for alpha-tocopherol from the US Department of Agriculture National Nutrient Database for Standard Reference Release 15. CSFII
The complex design & sampling weights of the CSFII survey were taken into account to calculate the mean alpha-tocopherol intake from diet, the SEM, & the % of the Estimated Average Requirements (EARs) for alpha-tocopherol intake by age group & region.
Only 8.0% of ♂ & 2.4% of ♀ in the US met the new EARs for vit E intake from foods alone. Regionally, only 5.8% of ♂ & 2.1% of ♀ in the South met these EARs, relative to 9.0% & 2.6%, respectively, in the NE.Top contributors of alpha-tocopherol for ♂ & ♀ included ready-to-eat cereal, sweet baked products, white bread, beef, oils, & salad dressing.
The majority of ♂ & ♀ in the US fail to meet the current recommendations for vit E intake. Many of the top contributors are not particularly high sources of alpha-tocopherol but are consumed frequently. Greater inclusion of sources such as nuts, seeds, & vit E-rich oils, could improve intake of alpha-tocopherol.
Zandi P.P., et al., Reduced risk of Alzheimer disease in users of antioxidant vitamin supplements: the Cache County Study.Arch Neurol 2004 Jan;61(1):82-8.
Cross-sectional & prospective study of dementia. Antioxidants may protect the aging brain against oxidative damage assoc. w. pathol. changes of Alzheimer dz (AD). Examined the relationship between antioxidant suppl use & risk of AD (use was ascertained @ 1st contact.
Elderly (65 yrs or↑) Cache County, UT residents assessed in 1995-1997 for prevalent dementia & AD, & again in 1998-2000 for incident illness. 4740 respondents (93%) 200 cases of AD
Among 3227 survivors at risk, 104 incident AD cases were identified at f-up.
Dx of AD by means of multistage assessment procedures. Analyses of prevalent & incident AD yielded similar results.
Use of vit E & C (ascorbic acid) suppl in combination was assoc. w. ↓ AD prevalence (adjusted odds ratio, 0.22; 95% confidence interval, 0.05-0.60) & incidence (adjusted hazard ratio, 0.36; 95% confidence interval, 0.09-0.99). A trend toward ↓ AD risk evident in users of vit E & MVI containing vit C, but no evidence of a protective effect w. use of vit E or vit C suppl alone, w. MVI alone, or w. vit B-complex suppl.
Use of vit E & vit C supplements in combination is associated w. ↓ prevalence & incidence of AD. Antioxidant supplements merit further study as agents for the primary prevention of AD.
Leonard S.W., et al., Vitamin E bioavailability from fortified breakfast cereal is greater than that from encapsulated supplements. Am J Clin Nutr 2004 Jan;79(1):86-92.
Clinical Trial Conflicting results from vit E intervention studies suggest supplemental vitamin E malabsorption. Compared vit E bioavailability from a suppl w. that from a fortified breakfast cereal.
5 fasting subjects sequentially consumed the following (with 236 mL fat-free milk): 400 IU d(9)-alpha-tocopheryl acetate (400-IU capsule), 41 g ready-to-eat wheat cereal containing 30 IU d(9)-alpha-tocopheryl acetate (30-IU cereal), & 45 g cereal containing 400 IU d(9)-alpha-tocopheryl acetate (400-IU cereal). 5 mths later (trial 4), they consumed a 400-IU capsule w. 41 g vit E-free cereal. Blood was obtained up to 72 h after the start of each trial.
Vit E bioavailability was evaluated by using deuterium-labeled all-rac-alpha-tocopherol in three 4-d trials (2 wk apart).
The mean (+/-SD) vit E bioavailabilities of the 30-IU cereal & the 400-IU cereal were 6 +/- 2 & 26 +/- 8 times, respectively, the vit E bioavailability of the 400-IU capsule. Areas under the 0-72-h d(9)-alpha-tocopherol curves for the 400-IU capsule, the 30-IU cereal, & the 400-IU cereal were 30 +/- 7, 153+/- 43, & 765 +/- 164 micro mol. h/L (all trial comparisons, P < 0.0001). In trial 4, 3 subjects barely responded & 2 subjects had areas under the curve that were similar to their 400-IU cereal responses.
The low bioavailability of vit E from the 400-IU capsule & the variability observed when the capsule was consumed w. cereal suggest that encapsulated vit E is poorly absorbed when consumed w. a low-fat meal & that bioavailability can be enhanced by food fortification w. vit E.
Djuric Z., et al., Plasma carotenoids,
Clinical Trial Randomized Control Trial
Fasting plasma was available for
♀ were randomized onto one of four diets for 12 wk: non-
Levels of carotenoids & tocopherols did not change significantly over 12
↓ in dietary fat & energy intakes in this study were
1

2005 Dietary Guidelines Advisory Committee Report
Summary of Vitamin E Literature Search Included: all ages/or elderly, clinical trials, human, English, 1995-2004 Full Citation Design &
Duration & Objective
Population Methods Outcome Measures Link to site
Results Statistics, Conclusions, & Comments
tocopherols, and antioxidant capacity in a 12-week intervention study to reduce fat and/or energy intakes. Nutrition 2003 Mar;19(3):244-9.
Examined plasma levels of carotenoids, tocopherols, & total antioxidant activity in ♀ before & after dietary intervention to ↓fat and/or energy intakes. Dietary fat & energy may affect intake & bioavailability of carotenoids & tocopherols; micronutrient levels in turn can contribute to the antioxidant capacity of plasma.
analysis from a subset (n = 41) of ♀ enrolled in the study.
intervention, low fat (15% of energy from fat w/maintenance of energy intake), low energy (25% energy↓ w. maintenance of % of energy from fat), & combined ↓fat & low energy.
wk on any diet arm, despite a modest but statistically significant ↑ in fruit & vegetable intake in the ♀ following low-fat diet (from 3.3 to 5.2 servings/d excluding potatoes). Levels of Trolox-equivalent antioxidant capacity (TEAC), total cholesterol, & 2 major plasma antioxidants (urate and bilirubin) also did not change significantly. Of the individual micronutrients measured, lycopene & lutein/zeaxanthin correlated most strongly w. TEAC values, & correlation w. lycopene was statistically significant before intervention.
quite lg, but did not appear to have detrimental effects on plasma micronutrient levels, nor did it appreciably affect plasma antioxidants. Because lycopene levels were significantly associated w. plasma TEAC before intervention, interventions that ↑ levels of lycopene might be more likely to ↑ the antioxidant capacity of plasma.
Mueller-Cunningham W.M., et al., An ad libitum, very low-fat diet results in weight loss and changes in nutrient intakes in postmenopausal women. J Am Diet Assoc 2003 Dec;103(12):1600-6.
Longitudinal, 8-month, ad libitum, free living, very low-fat diet trial. Determined whether a very low-fat diet (<15% of energy intake) consumed ad libitum during an 8-mth period can achieve weight loss of 5%-10% of initial body weight while still providing adequate intakes of other essential nutrients.
54 of the 64 healthy postmenopausal ♀ recruited completed entire study (age 59+/-8 yrs, BMI=29.6+/-6.3). 24 of these ♀ used hormone replacement therapy, thirty ♀ did not.
Weekly sessions aimed at teaching & reinforcing a very low-fat intake diet for eight months.
Body wt, % body fat, waist-to-hip ratio, resting energy expenditure, respiratory quotient, & nutrient intakes derived from 7-day food records at the beginning & @ 2, 4, 6, & 8 mths of the study. Statistical analysis performed Repeated measures analysis of variance and Tukey post hoc analysis were used to analyze significant diff. in mean data (P<.05).
Fat intake ↓ from 33.2+/-7.5% to 11+/-4% over the 8-mth intervention period (P<.00001). Wt loss was 6.0 kg+/- 4.2 kg (P<.000038), an 8% wt change, & ↓ in % body fat of 2.7%+/-0.2% (P< or =.000046). Wt correlated better with the self-reported fat intake (r=0.321, P<.01) than energy intake (r=0.263, P<.05) at baseline. Fiber intake ↑ from 16 g+/-0.6 g to 23 g+/-0.2 g (P<.0005). All micronutrient intakes remained at or above preintervention ranges, except for a decrease in vit E intake from 8.1 mg+/-4.0 mg to 3.7 mg+/-1.1 mg (P<.0005) on the very low-fat diet and linoleic acid from 6.3%+/-1.5% to 2.5%+/-0.7% (P<.000001) with no significant reduction in linolenic acid. Hormone replacement was not associated with the amt of wt loss.
Study demonstrates that adherence to a very low-fat diet consumed ad libitum causes weight loss in the 5% to 10% range and a reduction of body fat. These reductions, along with the observed decreases in fat intake, are associated w. improved health outcomes. Because of the decreased vitamin E and n-3 fatty acid intake, emphasis on foods high in these nutrients may need to be encouraged for those consuming a very low-fat diet.
Cho E., et al., Premenopausal intakes of vitamins A, C, and E, folate, and carotenoids, and risk
Intakes of vits A, C, & E, folate, & carotenoids have been hypothesized to ↓ the risk of breast cancer. Previous
90,655 premenopausal ♀ ages 26-46 years in 1991 in the Nurses' Health Study II.
Nutrient intake was assessed with a validated food-frequency questionnaire at baseline in 1991 & in 1995.
During 8 years of f-up from 1991-1999, 714 incident cases of invasive breast cancer were documented. Overall, none of the vitamins and carotenoids was strongly related to a
Found no evidence that higher intakes of vits C & E, & folate in early adult life reduce risk of breast cancer. However, intake of vit A may be related
2

2005 Dietary Guidelines Advisory Committee Report
Summary of Vitamin E Literature Search Included: all ages/or elderly, clinical trials, human, English, 1995-2004 Full Citation Design &
Duration & Objective
Population Methods Outcome Measures Link to site
Results Statistics, Conclusions, & Comments
of breast cancer. Cancer Epidemiol Biomarkers Prev 2003 Aug;12(8):713-20.
epidemiological studies on these nutrients & breast cancer risk have been inconclusive, & have included primarily postmenopausal ♀. Examined the intake of nutrients in relation to breast cancer risk.
↓ risk of breast cancer. Intake of vit A, including preformed vit A & carotenoids, was associated w. a ↓ risk of breast cancer among smokers; participants in the highest quintile of total vit A intake had a multivariate relative risk of 0.28 (95% confidence interval 0.12-0.62; P, test for trend <0.001; P, test for interaction <0.001) compared w. those in the lowest quintile of intake.
to a reduced risk of breast cancer among smokers.
Wu K., et al., A prospective study on supplemental vitamin e intake and risk of colon cancer in women and men. Cancer Epidemiol Biomarkers Prev. 2002 Nov;11(11):1298-304.
Prospective cohort study on the association between supplemental vit E & colon cancer. There was some suggestion that ♂ w. supplemental vit E intake of 300 IU/day or > may be at lower risk for colon cancer when compared w. never users.
87,998 ♀ from the Nurses' Health Study & 47, 344 ♂ from the Health Professionals Follow-up Study 40-75 yr olds HPFS 30-55 yr olds NHS
Subjects responded to a mailed questionnaire during the HPFS Cohort study 1986. 1976 NHS Cohort of 1976 asked nurses to complete questionnaire. Diet & vitamin supplement assessment. Case & death ascertainment.
Multivariate relative risk (RR), 300-500 IU/day versus never users, 0.73 (95% confidence interval (CI), 0.52-1.03); >or=600 IU/day versus never users = 0.70 (95% CI = 0.38-1.29)], but CIs included 1.
In ♀, there was no evidence for an inverse association between vit E supplementation & risk of colon cancer.
Findings do not provide consistent support for an inverse association between supplemental vit E & colon cancer risk. Considering the paucity of epidemiological data on this association, further studies of vit E & colon cancer are warranted.
van Gils C.H., et al., Differences in base excision repair capacity may modulate the effect of dietary antioxidant intake on prostate cancer risk: an example of polymorphisms in the XRCC1 gene. Cancer Epidemiol Biomarkers Prev 2002 Nov;11(11):1279-84.
Randomized Clinical Trial Pilot Case-control study Differences in base excision repair capacity modulate the effect of dietary antioxidant intake on prostate cancer risk. Evaluate prostate cancer risk in ♂ w. polymorphisms in the XRCC1 gene, a key player in base excision repair, across different strata of antioxidant intake.
77 prostate cancer patients and 183 community controls
Detailed dietary information, were frequency matched on age and race.
Lower prostate cancer risk w. 1 or 2 copies of variant alleles @ theXRCC1 codons 194 & 399 than for those who were homozygous for the common allele [codon 194: odds ratio (OR) = 0.8; 95% confidence interval (CI), 0.4-1.8 and codon 399: OR = 0.8; 95% CI, 0.5-1.3]. The variant at codon 280 was assoc. with a slightly ↑ prostate cancer risk (OR = 1.5; 95% CI, 0.7-3.6). Only the codon 399 polymorphism occurred frequ enough to investigate its joint effect w. antioxidant intake. Prostate cancer risk was ↑among ♂ who were homozygous for the common allele at codon 399 & had ↓ dietary intake of vit E (OR = 2.4; 95% CI,1.0-5.6) or lycopene (OR = 2.0; 95% CI, 0.8-4.9), whereas ↓intake of these antioxidants in ♂ w/o this
Polymorphism did not modulate risk associated with low intake of vitamin C, A, or beta-carotene. The data give some support for our hypothesis but should be regarded as preliminary, because it is limited by small sample size. We discuss what kind of data and what kind of studies are needed for future evaluation of this hypothesis.
3

2005 Dietary Guidelines Advisory Committee Report
Summary of Vitamin E Literature Search Included: all ages/or elderly, clinical trials, human, English, 1995-2004 Full Citation Design &
Duration & Objective
Population Methods Outcome Measures Link to site
Results Statistics, Conclusions, & Comments
genotype hardly ↑ prostate cancer risk.
Michaud D.S., et al., Intakes of fruits and vegetables, carotenoids and vitamins A, E, C in relation to the risk of bladder cancer in the ATBC cohort study. Br J Cancer 2002 Oct 21;87(9):960-5.
Clinical Trial Randomized Control Trial Examined the relation between dietary fruit & vegetables, carotenoids & vit intakes & the risk of bladder cancer among male smokers in a prospective cohort study.
Over a median of 11 yrs, 27 111 ♂ smokers aged 50-69 yrs who were initially enrolled in the Alpha-Tocopherol Beta-Carotene Cancer Prevention Study were followed.
344 ♂ dev. bladder cancer. All ♂ had completed a 276-food item diet questionnaire @ baseline.
Cox proportional hazards models were used to est. relative risks & 95% confidence intervals & to simult. adjust for age, smoking hx, energy intake & intervention group.
Consumption of fruits & vegs was not associated w. risk of bladder cancer (relative risk=1.28; 95% confidence intervals CI: 0.89-1.84, for highest vs lowest quintile). No associations were observed for grps of fruits or vegs (berries and cruciferous vegetables), or for specific fruits & vegs. Dietary intakes of alpha-carotene, beta-carotene, lycopene,lutein/zeaxanthin, beta-cryptoxanthin, vits A, E, & C, & folate were not r/t risk of bladder cancer.
Findings suggest that fruit & vegetable intakes are not likely to be associated with bladder cancer risk. These results may not be generalisable to non-smokers.
Morris M.C., et al., Vitamin E and cognitive decline in older persons. Arch Neurol 2002 Jul;59(7):1125-32.
Longitudinal population-based study conducted from 9/17/93- 11/20/00 w. an ave f-up of 3.2 yrs. Previous studies raise the possibility that antioxidants protect against neuro- degenerative dz. Examined whether intake of antioxidant nutrients, including vit E, vit C, & carotene, is assoc. w. ↓ cognitive ↓ w. age.
2889 pt’s were community residents, aged 65-102 yrs, who completed a food frequency questionnaire, on average 18 months after baseline.
Cognitive changemeasured by 4 tests (the East Boston Memory Test, the Mini-Mental State Examination; and the
Random-effects models estimated nutrient effects on individual change in ave score of the 4 cognitive tests. The cognitive score ↓ on ave by 5.0 x 10(-2) standardized units/yr. There was a 36% ↓ in the rate of decline among persons in the highest quintile of total vit E intake (-4.3 x 10(-2) standardized units/yr) compared w. those in the lowest quintile (-6.7 x 10(-2) standardized units per year) (P =.05), in a model adjusted for age, race, sex, educational level, current smoking, ETOH consumption, total cal intake, & total intakes of vit C,
Symbol Digit Modalities Test) at baseline and 3 yrs for all participants, and at 6 mths for 288 randomly selected participants.
carotene, & vit A. We also observed a ↓ decline with higher vit E intake from foods (P =.03 for trend). There was little evidence of assoc. w. vit C or carotene intake.
Vit E intake, from foods or supplements, is associated with less cognitive decline w. age.
Morris M.C., et al., Dietary intake of antioxidant nutrients and the risk of incident Alzheimer disease in a biracial community study.
Prospective study, conducted 1993-2000, of individuals selected in a stratified random sample of community-dwelling residents. Oxidative processes have
The 815 residents 65 years and older were free of AD at baseline and were followed up for a mean of 3.9 years.
They completed food frequency questionnaires an average of 1.7 years after.
Incident AD diagnosed in clinical evaluations w. standardized criteria.
↑vit E intake from foods was associated w. ↓ risk of developing AD after adjustment for age, education, sex, race, APOE epsilon 4, & length of f-up. Relative risks (95% confidence intervals [CIs]) from lowest to highest quintiles of intake
This study suggests that vit E from food, but not other antioxidants, may be associated with a reduced risk of AD. Unexpectedly, this association was observed only among individuals without the
4

2005 Dietary Guidelines Advisory Committee Report
Summary of Vitamin E Literature Search Included: all ages/or elderly, clinical trials, human, English, 1995-2004 Full Citation Design &
Duration & Objective
Population Methods Outcome Measures Link to site
Results Statistics, Conclusions, & Comments
JAMA 2002 Jun 26;287(24):3230-7.
been suggested as elements in the dev. of Alzheimer dz (AD), but whether dietary intake of vit E & other antioxidant nutrients prevents its development is unknown. Examined whether intake of antioxidant nutrients, vits E, C, & beta carotene is associated with incident AD.
were 1.00, 0.71 (0.24-2.07), 0.62 (0.26-1.45), 0.71 (0.27-1.88), & 0.30 (0.10-0.92) (P for trend =.05). The protective association of vit E was observed only among persons who were APOE epsilon 4 negative. Adjustment for other dietary factors ↓ the protective association. After adjustment for baseline memory score, the risk was 0.36 (95% CI, 0.11-1.17). Intake of vit C, beta carotene, & vit E from suppl was not significantly assoc. w. risk of AD.
APOE epsilon 4 allele.
White E., et al., Correlates of serum alpha- and gamma-tocopherol in the Women's Health Initiative. Ann Epidemiol 2001 Feb;11(2):136-44.
Clinical Trial Multicenter Study Randomized Control Trial There is increasing evidence that vit E (primarily alpha- & gamma-tocopherol) may ↓ the risk of CVD & some cancers, therefore it is important to understand factors that influence blood levels.
1047 postmenopausal ♀ aged 50-79 yrs, who provided fasting blood specimens &detailed information on diet, supplement use, and other factors at entry to the study (1994-96).
The correlates of serum alpha- & gamma-tocopherol were investigated among participants in the Women's Health Initiative (WHI), a 40-site disease prevention trial.
Total serum cholesterol & TG’s were highly correlated w. serum alpha- & gamma-tocopherol concentrations & were controlled for in all analyses along w. age, ethnicity & BMI. Alpha & gamma-tocopherol were strongly negatively correlated (partial r = -0.69). The strongest predictor of serum tocopherols was ave intake of vit E/d from suppl (partial r = 0.60 for alpha, r = -0.54 for gamma). Other factors associated w. ↑ alpha- &/or ↓ gamma-tocopherol concentrations were serum retinol & carotenoids, suppl vit C, alpha- tocopherol intake from food, dietary fiber, & Hispanic ethnicity. Factors associated w. ↓ alpha- and/or ↑ gamma-tocopherol concentrations included gamma-tocopherol intake from food, total fat intake, & BMI. Age, income, hormone use, & geographic location were "spuriously" associated w. serum tocopherol levels through their association w. suppl. use, i.e., there was no such association among the subset of ♀ not taking supplements.
Vit E intake from supplements & BMI are the major independent predictors of serum tocopherol levels in ♀, whereas dietary factors only play a small role.
McGavin J.K., et al., Comparison of a
Clinical Trial Randomized 8 wk random.
Dunedin, New Zealand. 90
Consumption of an additional 12 mg of vit E (alpha tocopherol
Dietary intakes, plasma alpha tocopherol, plasma
3.4 micromol/l ↑ in plasma alpha tocopherol @ week 6 (95% CI 1.6-
Increasing dietary vit E intake can ↑ plasma alpha
5

2005 Dietary Guidelines Advisory Committee Report
Summary of Vitamin E Literature Search Included: all ages/or elderly, clinical trials, human, English, 1995-2004 Full Citation Design &
Duration & Objective
Population Methods Outcome Measures Link to site
Results Statistics, Conclusions, & Comments
vitamin E-rich diet and supplemental vitamin E on measures of vitamin E status and lipoprotein profile. Eur J Clin Nutr. 2001 Jul;55(7):555-61.
Controlled Trial w. parallel tx to compare↑use of vit E-rich foods, suppl w. 200 IU vit E & a placebo. To deter. whether dietary modification rather than use of suppl can raise indices of vit E status to potentially cardioprotective levels.
subjects recruited, 82 non-smoking, free-living individuals aged 22-72 yr w. plasma cholesterol <7.5 mmol/l completed the trial.
equivalents) from dietary sources was primarily achieved through replacement of saturated fat-rich foods with unsaturated fats rich in vit E, nuts & vegetables.
alpha tocopherol/ cholesterol ratio & lipoprotein cholesterol.
5.3), & 0.9 micromol/mmol in plasma alpha tocopherol/cholesterol @ wks 4 & 6 (95% CI 0.3-1.4 and 0.4-1.4, respectively) when compared w. placebo grp. Supplement grp, plasma alpha tocopherol & plasma alpha tocopherol/cholesterol were signific. ↑ w/in 2 wks & remained so throughout the 8 wk intervention.
tocopherol levels, although factors other than dietary intake are also important determinants. The extent of dietary modification required to achieve potentially cardioprotective levels of plasma alpha tocopherol is difficult in practice.
Huang H.Y., et al., The effects of vitamin C and vitamin E on oxidative DNA damage: results from a randomized controlled trial. Cancer Epidemiol Biomarkers Prev. 2000 Jul;9(7):647-52.
Clinical Trial Randomized Controlled Trial Oxidative DNA damage may be important in mutagenic, carcinogenic, & aging processes. Although it is plausible that antioxidant vits may reduce oxidative DNA damage, evidence from human studies has been sparse & inconsistent.
184 nonsmoking adults
Determined the short-term effects of vit C (500 mg/d) & vit E (400 IU d-alpha-tocopheryl acetate/d) suppl on oxidative DNA damage in a double-masked, placebo-controlled, 2x2 factorial trial. Mean duration of supplementation was 2 months.
Oxidative DNA damage was measured by 24-h urinary excretion of 8-hydroxy-2'-deoxyguanosine (8-OHdG).
At baseline, urinary 8-OHdG (mean +/- SE; ng/mg creatinine) was associated w. race (15.6 +/- 0.8 in Afric. Ameri. vs 20.3 +/- 1.2 in Caucasians, P = 0.001), prior antioxidant suppl use (18.6 +/- 0.8 in users vs 13.8 +/- 1.5 in non-users, P = 0.007), & regular exercise (19.2 +/- 1.1in exercisers vs 16.6 +/- 0.9 in non-exercisers, P = 0.04). Fruit & veg intake & serum ascorbic acid were inversely associated with urinary 8-OHdG (P-trend = 0.02 and 0.016, respectively). Benefits of fruit & veg intake became evident w. consumption being at least 3 svgs/d. At the end of suppl, change from baseline in urinary 8-OHdG (mean +/- SE; ng/mg creat) was -0.6 +/- 1.4 (P = 0.61), 0.6 +/- 1.1(P = 0.59), 0.5 +/- 1.0 (P = 0.61), and 1.6 +/- 1.4 (P = 0.27) in the placebo, vit C alone, vit E alone, & combined vit C & E grps, respectively. In overall & subgrp analyses, there was no significant main effect or interaction effect of the suppl on urinary 8-OHdG.
Supplementation of diet with vitamin C (500 mg/day) & vitamin E (400 IU d-alpha-tocopheryl acetate/day) had no signific main effect or interaction effect on oxidative DNA damage as measured by urinary 8-OHdG in non-smoking adults. However, several aspects of a healthy lifestyle were associated with lower oxidative DNA damage.
Horwitt, M.K., et al. Effects of limited tocopherol intake in man with relationships to
Elgin Project No. 4 *Is there a vit E requirement for for growth & maintenance r/t autooxidation of tissue fat?
38 male subjects divided into 3 gps
Plasma levels of tocopherol studied in relationship to vit E levels in the diet compared w. erythrocyte hemolysis by peroxide.
Hemolysis of the erythrocyte has been r/t oxidation of lipid structure of the RBC by comparing data on oxidation of
Thiobarbituric acid used as a suitable reagent for evaluating oxidation of biological material in studies of vit E def. Data has shown ↑ reactivity w. biological material from mammals
Correlations between TBA reactivity & peroxide hemolysis in human erythrocytes have been observed.
6

2005 Dietary Guidelines Advisory Committee Report
Summary of Vitamin E Literature Search Included: all ages/or elderly, clinical trials, human, English, 1995-2004 Full Citation Design &
Duration & Objective
Population Methods Outcome Measures Link to site
Results Statistics, Conclusions, & Comments
erythrocyte hemolysis and lipid oxidations. Am J Clin Nutr 1956 Jul-Aug;4(4):408-19.
*Is this fxn r/t oxidized unsat fat, or other anti-vit E stress factors in the diet? *What are vit E inadequacies in man?
linolenic acid, phospholipids, and brain lipids.
depleted of vit E.
Reviews/Letters Horwitt M.K., Vitamin E and lipid metabolism in man. Am J Clin Nutr 1960 Jul-Aug;8:451-61.
Elgin Study Oct 1953-1960
38 ♂ subjects divided into 3 gps. Grp B-2 mg tocopherol in diet Grp BE-same diet w. 15 mg d-alpha-tocopherol suppl Grp HD- ad lib diet.
After 2 ½ yrs, the lard in basal diet was replaced by 30 gm of stripped corn oil to ↑ ingestion of linoleic acid. After 9 mths it was ↑ed to 60 gm/d. Lard contained about 11% linoleic acid & corn oil about 55%.
Altering levels of unsat lipids in tissues by diet can produce pathological changes. Feeding lipids high in linoleic acid increases need for tocopherol. Tissue tocopherol may be stored less efficiently than tissue linoleic acid causing tocopherol deficiency.
Summary of Nutrient Density Literature Search Included: clinical trials, human, English, 1995-2004
Full Citation Design & Duration & Objective
Population Methods Outcome Measures Results Statistics,Conclusions, & Comments
Kant A.K. and Graubard B.I., Predictors of reported consumption of low-nutrient-density foods in a 24-h recall by 8-16 year old US children and adolescents. Appetite 2003 Oct;41(2):175-80.
Study was to develop an explanatory model to predict the # of low-nutrient-density (LND) foods reported in a 24-h recall by US children & adolescents using data from the th3rd National Health & Nutrition Examination Survey.
8-16 yr old respondents (n=4137; 2024 ♂ & 2113 ♀). LND foods included--baked & dairy desserts, sweeteners, salty snacks, visible/discretionary fat, & misc.
Reported # of LND foods was estimated from 24-h dietary recall data.
The predictive ability of socio-demographic, family, wt/dieting related, life-style or food consumption related subject characteristics was determined using multiple linear regression analyses.
Strongest independent negative predictor of reported # of LND foods was the amt of nutrient-dense foods from 5 major food groups. In addition, number of eating occasions reported was a significant independent positive predictor, & the weekly frequency of consuming a complete school lunch was a significant independent negative predictor of the reported # of LND foods. These models explained approx. 55% of the variance in LND food reporting in both ♂ & ♀.
Socio-demographic, family, body weight, or lifestyle characteristics contributed little to predicting the number of LND foods reported in a 24-h recall.
Kant, A.K., Reported consumption of low-nutrient-density foods by American children and adolescents: nutritional and health
Examined the contribution of foods of modest nutritional value to the diets of American children & adolescents.
4852 children & adolescents, aged 8 to 18 yrs
Data were from the 3rd NHANES 1988-1994. Foods reported in the 24-hour dietary recall were grouped into the following low-nutrient-density (LND) food categories: visible fat; table sweeteners, candy, & sweetened
The LND foods contributed > 30% of daily energy, w. sweeteners & desserts jointly accounting for nearly 25%. Intakes of total energy & % of energy from CHO & fat related positively, but % of energy from protein & dietary fiber (in gms)
High LND food reporting was related to higher energy intake, but lower amounts of the 5 major food groups & most micronutrients.
7

2005 Dietary Guidelines Advisory Committee Report
Summary of Nutrient Density Literature Search Included: clinical trials, human, English, 1995-2004 Full Citation Design &
Duration & Objective
Population Methods Outcome Measures Results Statistics, Conclusions, & Comments
correlates, NHANES III, 1988 to 1994. Arch Pediatr Adolesc Med 2003 Aug;157(8):789-96.
beverages; baked & dairy desserts; salty snacks; & misc. The independent association of the number of LND foods mentioned in the recall w. intake of food grps, macronutrients, micronutrients, & BMI was examined by means of regression procedures to adjust for multiple covariates.
inversely r/t reported # of LND foods (P<.05). The reported # of LND foods was a (-) predictor (P<.001) of the amt of nutrient-dense foods reported. The mean amt of reported intake of several micronutrients-vits A, B6, & folate, & ca, mg, fe, & zn-↓ (P<.05) w. increasing tertiles of reported number of LND foods. LND food reporting was not a significant predictor of BMI.
Nicklas T.A., et al., Eating patterns and obesity in children. The Bogalusa Heart Study. Am J Prev Med. 2003 Jul;25(1):9-16.
Childhood obesity is a growing public health problem. Study examined the association between eating patterns & overwt status in children who participated in the Bogalusa Heart Study.
Cross-sectional sample of 1562 children aged 10 yrs (65% Euro-American [EA], 35% African American [AA]) over a 21-yr period.
A single 24-hr dietary recall was collected. Overwt was defined as BMI > the 85th percentile using CDC reference standards.
Multivariate logistic regression was used to investigate the association between eating patterns & overwt.
Consumption of sweetened beverages (58% soft drinks, 20% fruit flavor drinks, 19% tea, & 3% coffee) (p<0.001); sweets (desserts, candy, & sweetened beverages) (p<0.001); meats (mixed meats, poultry, seafood, eggs, pork, & beef) (p<0.051); & total consumption of low-quality foods (p<0.01) were positively associated w. overwt status. Total amt of food consumed, specifically from snacks, was positively associated w. overwt status (p<0.05). There was a lack of congruency in types of eating patterns associated w. overweight status across 4 ethnic-gender grps. The % variance explained from the eating pattern-overwt models was very small. The interaction of ethnicity & gender was signif. associated w. overwt status (p<0.001). The odds of being overwt for EA males were 1.2 times higher than for AA females.
These results demonstrate that numerous eating patterns were associated with overweight status, yet the odds of being overweight were very small. Additional studies are needed to confirm these findings in a longitudinal sample having multiple days of assessment.
Hakeem R., et al., Food habits and nutrient density of diets of Pakistani children living in different urban and rural settings. J Health Popul Nutr. 2002 Sep;20(3):255-
Food habits & nutrient density of diets of 6 groups of rural and urban school children were compared. UK, data collected Oct-Nov 1994 & in Pakistan Apr-May 1995. Based on apparent level of
Rural & urban school children aged 10-12 years.
Data collected from 3-day food records.
Patterns of food & intake of nutrients were different from each other in various aspects & were not always associated w. the apparent level of urbanism of the group.
With urbanization, the intake of fat and sugar ↑steadily. The intake of CHO, fibre, riboflavin, and vit E ↓ w. urbanization. The intake of vitamin C, vitamin B12, and folates was higher among group 4, 5, and 6 than other groups.
Due to various factors, in terms of micronutrient density, diets of various urban groups could have more differences than similarities. While these differences point toward the need for comprehensive nutrition education & community nutrition surveys,
8

2005 Dietary Guidelines Advisory Committee Report
Summary of Nutrient Density Literature Search Included: clinical trials, human, English, 1995-2004 Full Citation Design &
Duration & Objective
Population Methods Outcome Measures Results Statistics, Conclusions, & Comments
63. urbanism, 6 groups were arbitrarily assigned urbanization rank 1-6.
they also indicate the possibility of having healthy diets in urban settings.
Bannerman E., et al., Evaluation of micronutrient intakes of older Australians: The National Nutrition Survey--1995. J Nutr Health Aging. 2001;5(4):243-7.
Dietary intake of 1960 collected & assessed using a structured 24-hour diet recall. To determine the proportion of Australian adults >65 years w. nutrient intakes < 70% of current national RDIs and investigate associated differences in both diet quality & quantity.
902 adult males (>65 yrs)
Intake data collected as part of the National Nutrition Survey 1995 representing all areas of Australia.
Intakes of 12 micronutrients were compared w. current Australian recommended dietary intakes (RDIs) and assessed as > RDI, < RDI but > 70% RDI, and < 70% RDI.
Intakes of vit A, magnesium, potassium and calcium were < 70% RDI in 12-24% ♂ & 14-61% ♀. In addition 10% & 43% ♀ had low intakes of folate & zinc respectively. None of the participants had intakes of niacin or vitamin C < 70% RDI, and few ♂ had low thiamin intakes. Specific nutrient density & energy intake (kJ/kg) were significantly less in those with intakes < 70% RDI for 8 of the 12 nutrients studied.
In general the low nutrient intakes reported here can be attributed to diets of poor quality, in terms of low nutrient density, & quantity of food eaten. Age-specific targeted nutrition promotion strategies are required to improve overall health of older Australians.
Millen B.E., et al., Validation of a dietary pattern approach for evaluating nutritional risk: the Framingham Nutrition Studies. J Am Diet Assoc. 2001 Feb;101(2):187-94.
Validation Studies Cluster analysis applied to a food frequency questionnaire to define dietary patterns. To validate the use of cluster analysis for characterizing population dietary patterns.
Adult women (n = 1,828) participating in the Framingham Offspring-Spouse study.
Independent estimates of nutrient intake were derived from 3-day food records. Heart disease risk factors were assessed using standardized protocols in a clinic setting.
Compliance w. published recommendations was determined for selected heart disease risk factors. Differences in age-adjusted compliance across clusters were evaluated using logistic regression.
Cluster analysis identified 5 distinct dietary patterns characterized by unique food behaviors & significantly different nutrient intake profiles. Patterns rich in fruits/vegs, grains, LF dairy, & lean protein foods resulted in ↑ nutrient density. Patterns rich in fatty foods, added fats, desserts, & sweets were less nutrient-dense. ♀ who consumed an Empty Calorie pattern were less likely to achieve compliance w. clinical risk factor guidelines in contrast to most other groups of ♀.
Age-adjusted mean nutrient intakes were determined for each cluster. Analysis of covariance used to evaluate pairwise differences in intake across clusters. Cluster analysis is a valid tool for evaluating nutrition risk by considering overall patterns & food behaviors. This is important because dietary patterns appear to be linked w. other health-related behaviors that confer risk for chronic dz. Insight into dietary behaviors of distinct clusters w/in a population can help design intervention strategies for prevention & management of chronic health conditions including obesity & CVD.
Kant A.K., Consumption of energy-dense, nutrient-poor foods by adult Americans: nutritional and health implications. The
Current dietary guidance recommends limiting intake of energy-dense, nutrient-poor (EDNP) foods. Little is known about recent consumption patterns of these foods.
n = 15611; age >/=20 y
Potential independent associations of EDNP food intake w. intakes of energy, Macro/micronutrients, & serum vit, lipid, & carotenoid profiles were examined w. linear & logistic regression procedures.
EDNP categories included visible fats, nutritive sweeteners & sweetened beverages, desserts, & snacks.
EDNP foods supplied approximately 27% of energy intake; alcohol provided an additional 4%. The relative odds of consuming foods from all 5 food groups & meeting the RDA or DRI for protein & several micronutrients ↓ w. ↑ EDNP food
Results suggest that EDNP foods were consumed at the expense of nutrient-dense foods, resulting in 1) increased riskof high energy intake, 2) marginal micronutrient
9

2005 Dietary Guidelines Advisory Committee Report
Summary of Nutrient Density Literature Search Included: clinical trials, human, English, 1995-2004 Full Citation Design &
Duration & Objective
Population Methods Outcome Measures Results Statistics, Conclusions, & Comments
third National Health and Nutrition Examination Survey, 1988-1994. Am J Clin Nutr. 2000 Oct;72(4):929-36.
Data from the 3rd NHANES were used. To examine contribution of EDNP foods to the American diet & the associated nutritional & health implications.
intake (P: < 0.0001). Energy intake & % energy from fat were positively r/t EDNP intake. Serum concentrations of vits A, E, C, & B-12; folate; several carotenoids; & HDL cholesterol were inversely related (P: </= 0. 0005) whereas serum homocysteine concentration was positively related (P: =0.02) to EDNP food intake.
intake, 3) poor compliance w. nutrient- and food group-related dietary guidance, and 4) low serum concentrations of vitamins and carotenoids.
Bandini L.G., et al., Comparison of high-calorie, low-nutrient-dense food consumption among obese and non-obese adolescents. Obes Res. 1999 Sep;7(5):438-43.
Cross-sectional design 14-day food records provided estimates of total daily energy intake & caloric intake from 5 categories of high-calorie, low-nutrient-dense (HC) foods: candy, chips, soda, baked goods, and ice cream. To determine whether obese adolescents eat more high-calorie low-nutrient-dense foods than non-obese adolescents.
22 non-obese and 21 obese adolescents
Percentage of energy intake reported (%report) was calculated as the ratio of reported energy intake to measured energy expenditure (x 100%).
Body composition was determined by 18O dilution and daily energy expenditure by doubly labeled water.
Both groups underreported energy intake, but the % reported was significantly ↑ in the non-obese group (78.2+/-20.5% non-obese vs. 55.5+/-21.8% obese, p<0.001). Consumption of calories from chips & soda was similar among non-obese & obese adolescents. However, total energy intake from all HC foods was ↑ in the non-obese group than among the obese (617+/-356 kcal/day vs. 362+/-223 kcal/day; p<0.01) & represented 27.2+/-10.5% & 19.9+/-9.6% of reported energy intake in non-obese & obese groups, respectively. After adjustment for under-reporting, % of calories provided by each of the HC foods was similar in obese & non-obese groups except for ice cream, which remained significantly ↑ in the non-obese group (p<0.05).
Both non-obese & obese adolescents consume a substantial portion of reported calories from HC foods & obese adolescents do not consume more calories from these foods than non-obese adolescents. These data offer no evidence to support the widespread notion that obese adolescents eat more "junk food" than non-obese adolescents. Health professionals who treat obese adolescents must be aware that the excess calories in their diets may come from a variety of food sources & not solely from high-calorie snack foods.
McCrory M.A. et al., Dietary variety within food groups: association with energy intake and body fatness in men and women. Am J Clin Nutr. 1999 Mar;69(3):440-7.
Short-term experimental studies suggest that dietary variety may influence body fatness but no long-term human studies have been reported. To determine whether dietary variety w/in food groups influences energy intake & body fatness.
Seventy-one healthy men & women (aged 20-80 yrs)
Dietary intake & a body-composition assessment were studied.
Dietary variety was positively associated w. energy intake w/in ea of 10 food grps (r = 0.27-0.56, P < 0.05). In multiple regression analysis w. age & sex controlled for, dietary variety of sweets, snacks, condiments, entrees, & CHO’s (as a group) was positively associated w. body fatness (partial r = 0.38, P = 0.001) whereas variety from vegs was negatively associated (partial r = -0.31, P = 0.01) (R2 = 0.46, P <
Data, coupled w. those of previous short-term studies, suggest that a high variety of sweets, snacks, condiments, entrees, & carbohydrates coupled w. a low variety of vegetables promotes long-term increases in energy intake and body fatness. Findings may help explain the rising prevalence of obesity.
10

2005 Dietary Guidelines Advisory Committee Report
Summary of Nutrient Density Literature Search Included: clinical trials, human, English, 1995-2004 Full Citation Design &
Duration & Objective
Population Methods Outcome Measures Results Statistics, Conclusions, & Comments
0.0001). In separate models, both a variety ratio (variety of vegs/variety of sweets, snacks, condiments, entrees, & CHO) & % dietary fat were signif predictors of body fatness (controlled for age and sex, partial r = -0.39 & 0.31, respectively, P < 0.01). However, dietary fat was no longer signif. associated w. body fatness when the variety ratio & dietary fat were included in the same model.
Clemens L.H., The effect of eating out on quality of diet in premenopausal women. J Am Diet Assoc. 1999 Apr;99(4):442-4.
Compared the intake of ♀ who report varying levels of frequency of consuming food at commercial facilities outside the home. A 1-week descriptive study of dietary intake in ♀. Subjects completed daily diet records that included information regarding the source of the food eaten at ea meal/snack.
129 premenopausal ♀ were recruited via community advertising for an investigation of health habits. This study was conducted in a midsouthern US city.
Sample was divided on the basis of # of meals each subject reported obtaining from a commercial establishment outside the home. Of the 129 subjects, 56% (n = 72) reported eating out 5 times or less during the week of recording (Low Eating Out group) & the remainder (n = 57) reported eating out between 6 & 13 times (High Eating Out group)
Results were analyzed using independent sample t tests & chi 2 tests.
Mean intake was compared for the grps. The High Eating Out group was found to be consuming signif. more total energy (2,057 kcal vs 1,769 kcal; P = .002), fat (79.5 g vs 60.6 g; P < .001), & sodium (3,299 mg vs 2,903 mg; P = .043) & marginally more CHO (261.5 g vs 234.6 g; P = .055) & protein (71.5 g vs 65.4 g; P = .066). Total fiber or calcium intake did not differ between the groups.
Study demonstrates that ♀ who report eating out a greater number of times per week report more total energy intake as well as higher fat & sodium intakes. However, the High Eating Out group did not consume signif. more fiber or calcium in the extra energy consumed.
van der Wielen R.P., et al., J Gerontol A Dietary intakes of energy and water-soluble vitamins in different categories of aging. Biol Sci Med Sci. 1996 Jan;51(1):B100-7.
The dietary intakes of energy & the vits thiamin, riboflavin, B6, & C were assessed using modified dietary hx method.
4 groups of elderly consisting of ♀ nursing home (NH) residents (n = 40), people at admission to a nursing home (n = 21), free-living elderly people w. a sedentary life style (n = 120), & physically active free-living elderly people (n = 66).
Dietary intakes of selected vits were below the minimum requirements in almost half of nursing home residents.
Relative contribution of various food groups to the dietary intake of these vits was similar in the 4 groups of elderly people. Mean energy intake varied from 6.5 +/- 1.2 Megajoule (MJ)/day NH to 8.8 +/- 2.2 MJ/day (physically very active persons) in ♀ & from 8.8 +/- 2.5 MJ/day (admission to nursing home) to 10.1 +/- 2.3 MJ/day (physically very active persons) in ♂.
Stimulation of physical activity to increase energy requirements & use of foods with a high nutrient density may result in an improvement of dietary adequacy.
Kant A.K., and Schatzkin A. Consumption of energy-dense, nutrient-poor foods by the US population: effect on
To examine the association of consumption of foods from the fats, sweets, & alcohol group ("other group”) with nutrient profiles.
adults (n = 11,528) Using data from the NHANES II survey of 1976-80, categorized the foods reported to be consumed by adults (n = 11,528) into six groups: meat, dairy, grain, fruit, vegetable, and "other."
Nearly 1/3 of total daily energy intake was contributed by foods from the "other" category. As the proportion of daily energy intake from "other" foods ↑, total daily energy intake also ↑, as did the % energy from CHO & alcohol. However, % energy from fat
Data suggest that consumption of foods from the "other" group displaced nutrient-dense foods from diets of NHANES II respondents.
11
2005 Dietary Guidelines Advisory Committee Report
Summary of Nutrient Density Literature Search Included: clinical trials, human, English, 1995-2004 Full Citation Design &
Duration & Objective
Population Methods Outcome Measures Results Statistics, Conclusions, & Comments
nutrient profiles. J Am Coll Nutr. 1994 Jun;13(3):285-91.
& prot, intake of all examined micronutrients (except vit E), nutrient density, & the proportion of the population meeting RDA of various nutrients ↓ w. ↑ intake of "other" foods. Respondents were more likely to report no servings as well as < the recommended servings of foods from the major food groups w. ↑ intake of "other" foods.
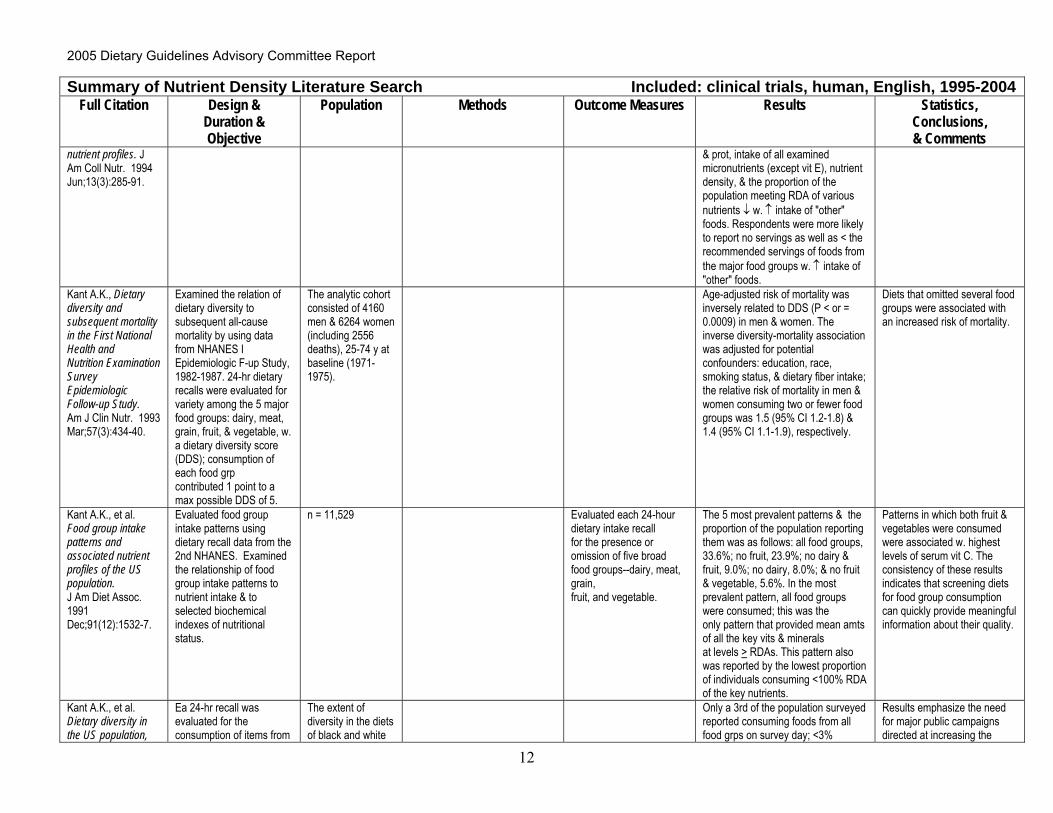
Kant A.K., Dietary diversity and subsequent mortality in the First National Health and Nutrition Examination Survey Epidemiologic Follow-up Study. Am J Clin Nutr. 1993 Mar;57(3):434-40.
Examined the relation of dietary diversity to subsequent all-cause mortality by using data from NHANES I Epidemiologic F-up Study, 1982-1987. 24-hr dietary recalls were evaluated for variety among the 5 major food groups: dairy, meat, grain, fruit, & vegetable, w. a dietary diversity score (DDS); consumption of each food grp contributed 1 point to a max possible DDS of 5.
The analytic cohort consisted of 4160 men & 6264 women (including 2556 deaths), 25-74 y at baseline (1971-1975).
Age-adjusted risk of mortality was inversely related to DDS (P < or = 0.0009) in men & women. The inverse diversity-mortality association was adjusted for potential confounders: education, race, smoking status, & dietary fiber intake; the relative risk of mortality in men & women consuming two or fewer food groups was 1.5 (95% CI 1.2-1.8) & 1.4 (95% CI 1.1-1.9), respectively.
Diets that omitted several food groups were associated with an increased risk of mortality.
Kant A.K., et al. Food group intake patterns and associated nutrient profiles of the US population. J Am Diet Assoc. 1991 Dec;91(12):1532-7.
Evaluated food group intake patterns using dietary recall data from the 2nd NHANES. Examined the relationship of food group intake patterns to nutrient intake & to selected biochemical indexes of nutritional status.
n = 11,529 Evaluated each 24-hour dietary intake recall for the presence or omission of five broad food groups--dairy, meat, grain, fruit, and vegetable.
The 5 most prevalent patterns & the proportion of the population reporting them was as follows: all food groups, 33.6%; no fruit, 23.9%; no dairy & fruit, 9.0%; no dairy, 8.0%; & no fruit & vegetable, 5.6%. In the most prevalent pattern, all food groups were consumed; this was the only pattern that provided mean amts of all the key vits & minerals at levels > RDAs. This pattern also was reported by the lowest proportion of individuals consuming <100% RDA of the key nutrients.
Patterns in which both fruit & vegetables were consumed were associated w. highest levels of serum vit C. The consistency of these results indicates that screening diets for food group consumption can quickly provide meaningful information about their quality.
Kant A.K., et al. Dietary diversity in the US population,
Ea 24-hr recall was evaluated for the consumption of items from
The extent of diversity in the diets of black and white
Only a 3rd of the population surveyed reported consuming foods from all food grps on survey day; <3%
Results emphasize the need for major public campaigns directed at increasing the
12

2005 Dietary Guidelines Advisory Committee Report
Summary of Nutrient Density Literature Search Included: clinical trials, human, English, 1995-2004 Full Citation Design &
Duration & Objective
Population Methods Outcome Measures Results Statistics, Conclusions, & Comments
NHANES II, 1976-1980. J Am Diet Assoc. 1991 Dec;91(12):1526-31.
the dairy, meat, grain, fruit, & vegetable grps (Food Group Score). A 2nd scoring method (Serving Score) evaluated every recall for consumption of at least 2 svgs ea from dairy, meat, fruit, & vegetable grps & 4 servings from the grain grp.
adults (n = 11,658) ages 19 to 74 yrs was evaluated from 24-hour dietary recalls obtained in the 2nd NHANES
reported consuming foods from all food grps in at least the recommended amt. Blacks scored lower on both types of diet diversity scores than whites. Both types of diversity scores showed a signif. trend to ↑ w. increasing income & level of education. Failure to consume any foods from dairy, meat, grain, fruit, & vegetable grps was reported by 24%, 6%, 5%, 46%, & 18%, respectively, of the population on survey day. The proportion of the population consuming at least the desired number of svgs from ea of these food grps was 51%, 71%, 29%, 29%, 61%, respectively.
diversity of US diets. Special target grps include minorities & those w. limited income & formal education.
Spiegel T.A. and Stellar E. Effects of variety on food intake of underweight, normal-weight and overweight women. Appetite. 1990 Aug;15(1):47-61.
Procedure used prevented subjects from selecting particular flavors of SFUs.
27 underweight, normal-weight & overweight ♀.
Food intake was monitored during laboratory luncheon meals of solid food units (SFUs), bite-sized spirals of bread w. different sandwich fillings. Simultaneous, but not sequential, presentation of 3 SFU flavors ↑’ed intake compared to presentation of a single flavor in normal-wt & overwt ♀.
Variety manipulation did not enhance intake in the underweight ♀. The fact that foods were so similar probably ↓’ed the effectiveness of the variety manipulations. Overwt & normal-wt subjects had different patterns of intake, but only when eating a single flavor of SFU. Only overwt subjects ate less when 3 flavors of SFUs were hidden from view in the apparatus used to monitor intake.
Differences in cognitive restraint probably do not explain the differences in eating behavior of normal-wt & overwt subjects in the present study. Lack of dietary restraint or a high level of hunger may account for the different eating behavior of the underwt subjects compared to the other subjects.
Krebs-Smith S.M., et al. The effects of variety in food choices on dietary quality. J Am Diet Assoc. 1987 Jul;87(7):897-903.
Examined the effects of overall dietary variety, variety among major food grps, & variety w/in maj. food grps on dietary quality. The variety terms added a signif. increment to the variation in MAR that was explained by ea of the models.
A study sample of 3,701 individuals was selected from USDA's 1977-78 Nationwide Food Consumption Survey, excluding pregnant and lactating women and children under 1 yr of age.
Multiple regression analyses were performed to examine the relationships between each type of variety and each diet quality measure, controlling for age, sex, the number of foods, and all of their two-way interactions with variety.
Nutritional adequacy, 1 aspect of dietary quality, was measured by a Mean Adequacy Ratio (MAR)--an index of the % of recommended intake for 11 nutrients. Other dietary quality measures included the % of calories from fat & sugar & total intakes of energy, chol. & sodium. Variety among 5 major food grps explained as much of the variation in MAR as did variety w/in
↑ in this type of variety were associated w. greater ↑ in MARs for ♀ than for ♂ & for persons w. lower vs. higher numbers of foods. None of the types of variety could account for a sizeable proportion of the variation in the intakes of energy, fat, sugar, sodium, or chol. That is, those measures were not related in any appreciable way to variety per se--either to the expansion or to restriction of food choices.
Dietary variety might best be defined as simply including foods from ea of the major grps. The key to limiting the intake of those constituents may be to selectively alter the scope of food choices to include more of some foods and less of others.
13

2005 Dietary Guidelines Advisory Committee Report
Summary of Nutrient Density Literature Search Included: clinical trials, human, English, 1995-2004 Full Citation Design &
Duration & Objective
Population Methods Outcome Measures Results Statistics, Conclusions, & Comments
those grps. Rolls B.J., et al., How sensory properties of foods affect human feeding behavior. Physiol Behav. 1982 Sep;29(3):409-17.
The sensory properties of food which can lead to a ↓ in the pleasantness of that food after it is eaten,& to enhanced food intake if that property of the food is changed by successive presentation of different foods, were investigated.
Changes in the color and shape of food (which affects both appearance and mouth feel) were introduced by offering subjects a variety of colored chocolates & 3 successive courses consisting of different shapes of pasta.
After eating chocolates of 1 color the pleasantness of the taste of the eaten color declined more than of the non-eaten colors, although these chocolates differed only in appearance. The presentation of a variety of colors of chocolates, either simultaneously or successively, did not affect food intake compared w. consumption of subject's favorite color. Changes in shape led to a specific ↓ in the pleasantness of the shape eaten & to a signif. enhancement (14%) of food intake when 3 shapes were offered compared w. intake of subject's favorite shape. Changes in just the flavor of food (i.e., cream cheese sandwiches flavored w. salt, or w. non-nutritive flavoring agents lemon & saccharin, or curry) led to a signif. enhancement (15%) of food intake when all 3 flavors were presented successively compared w. intake of the favorite.
Experiments elucidate some of the properties of food which are involved in sensory specific satiety, & which determine the amount of food eaten.
Rolls B.J., Variety in a meal enhances food intake in man. Physiol Behav. 1981 Feb;26(2):215-21.
Satiety can be partly specific to foods eaten. The possibility that this specificity of satiety leads to overeating if a wide variety of foods is readily available is tested here.
36 subjects The intakes of subjects offered a variety of foods in succession during a meal were compared to intakes when the same food was offered throughout.
Subjects ate 1/3 more when offered sandwiches w. 4 diff. Fillings than when just 1 filling was offered (p<.001). In another study subjects ate more when 3 flavors of yogurt (hazelnut, blackcurrant, orange)-distinctive in taste, texture, & color- were offered than when offered just 1 of the flavors (p<.01), even if the flavor was the favorite (p<.01). When subjects were offered 3 flavors of yogurt (strawberry raspberry, cherry)-differed only in taste- there was no enhancement of intake when the variety was offered.
Having a variety of foods presented in succession during a meal enhances intake & the more different the foods are the greater the enhancement is likely to be. Variety in the diet is important for the ingestion of a good balance of nutrients.
Bellisle F. and Le Magnen J., The
Subjects observed during various single or mixed
Lean & obese subjects
Chewing & swallowing responses were cont. recorded on an
A precise temporal analysis of their intrameal
Increasing palatability induced a ↓ in chewing activity per food unit & intra
Obese individuals appeared more stimulated than the lean
14

2005 Dietary Guidelines Advisory Committee Report
Summary of Nutrient Density Literature Search Included: clinical trials, human, English, 1995-2004 Full Citation Design &
Duration & Objective
Population Methods Outcome Measures Results Statistics, Conclusions, & Comments
structure of meals in humans: eating and drinking patterns in lean and obese subjects. Physiol Behav. 1981 Oct;27(4):649-58.
flavor meals of diff. palatability levels.
oscillograph. eating & drinking patterns was realized.
meal pause duration increased form the beginning to the end of meals, probably due to satiation.
at intermediate palatability levels. Prandial drinking occurred most often at the end of meals & may serve to enhance sensory stimulation.
Rolls B.J., Sensory specific satiety in man. Physiol Behav. 1981 Jul;27(1):137-42.
Investigated the specificity of satiety in man. Subjects rated the pleasantness of the taste of 8 foods, were then given 1 of the foods to eat for lunch, & re-rated the pleasantness of the taste 2 & 20 min after the end of the meal.
32 subjects Before the 1st course 24 subjects rated their liking for the taste of 8 foods, were given 1 of the foods to eat for lunch, & 2 min after finishing eating re-rated their liking for the taste of the 8 foods.
Pleasantness of the food eaten decreased more than that of the foods not eaten (p<.001). In a 2nd experiment it was shown that this relative specificity of satiety influenced subsequent food intake. Again liking ↓ more for the food eaten than for foods not eaten. These changes in liking for the foods eaten & not eaten were highly correlated (p<.001) w. the amt of those foods eaten in an unexpected 2nd course.
Satiety can be partly specific to foods eaten & this specificity may be an important determinant of the foods selected for consumption. Having a variety of foods aids the selection of a nutritionally balanced diet.
Pliner P., et al., Short-term intake of overweight individuals and normal weight dieters and non-dieters with and without choice among a variety of foods. Appetite. 1980;1:203-213.
1st study-to determine the effect of choice amongst a variety of foods on the intake of obese subjects & normal wt dieting & non-dieting subjects. 2nd study-to measure palatability after amount consumed was manipulated.
103 ♂ students. Data from 74 subjects was used. 42 ♂ 18-34 – students, research personnel & technicians.
Subjects given meal consisting of a variety of foods or a single food. ½ the subj rated pizza after consuming 20 units; the remainder rated pizza after consuming 20 egg rolls followed by 1 sl. Of pizza.
Dieters vs. non-dieters were determined using the modified version of the Restraint Scale.
Subjects consumed greater amts in the variety condition than w. no variety, regardless of dieting or wt status.
Effect may have been mediated by differential decreases in palatability; palatability declining more rapidly when only 1 food was available. The 2nd study supported the interpretation by demonstrating that palatability of food decreased w. the amt consumed of a particular food.
Reviews/Letters
Kant A.K., Dietary patterns and health outcomes. J Am Diet Assoc. 2004 Apr;104(4):615-35.
A systematic review of the literature on dietary patterns (multiple dietary components operationalized as a single exposure) r/t nutrient adequacy, lifestyle & demographic variables, & health outcome was
Irrespective of the approach used, patterns characterized by fruit/vegetable/whole grain/fish/poultry consumption generally have been reported to relate to micronutrient intake, & to selected biomarkers of dietary exposure & dz risk in the expected direction. Age, income,
Most of the published reports on the subject have used one of two methods to determine dietary patterns: (a) diet indexes or scores that assess compliance w. prevailing dietary guidance as dietary
An inverse association of healthful dietary patterns w. all-cause mortality & CVD risk was reported in most studies. However, the magnitude of risk reduction was modest & was attenuated after control for confounders. Few published studies showed an association between risk of most incident cancers & dietary
Both of the currently used approaches for extracting dietary patterns have limitations, are subject to dietary measurement errors, & have not generated new diet & dz hypotheses.
15

2005 Dietary Guidelines Advisory Committee Report
Summary of Nutrient Density Literature Search Included: clinical trials, human, English, 1995-2004 Full Citation Design &
Duration & Objective
Population Methods Outcome Measures Results Statistics, Conclusions, & Comments
conducted.
& education have been reported to be among positive predictors of the so-called more healthful dietary patterns.
patterns, & (b) data-driven methods that use factor or cluster analysis to derive dietary patterns.
patterns.
Scheidt D.M. and Daniel E. Composite index for aggregating nutrient density using food labels: ratio of recommended to restricted food components. J Nutr Educ Behav. 2004 Jan-Feb;36(1):35-9.
This article describes a ratio of recommended to restricted food components (RRR) designed to provide consumers w. a summary of food label information to guide healthful, single-item food selections.
As a ratio, RRR is interpreted such that better foods score over 1.0. The potential usefulness of the ratio is illustrated comparing foods w/in categories of the Food Guide Pyramid (eg, skim milk and whole milk).
The RRR is proposed for use at the point of purchase for single food items, summarizing the food label, or providing concise information where none is currently presented, such as in restaurants.
Lowik M.R., et al., Food-based dietary guidelines: some assumptions tested for The Netherlands. Br J Nutr. 1999 Apr;81 Suppl 2:S143-9.
The concept of food-based dietary guidelines was introduced by WHO & FAO. Validity & potential consequences are discussed on the basis of the Dutch National Food Consumption Surveys. Topics include interrelationships among dietary characteristics, nutrient density, diets in accordance with the guidelines, & food variety. To obtain insight into overall diet quality, a dietary quality index based on nutrients and a food-based quality index based on food groups were created and tested.
The information obtained w. a dietary quality index can be used to assess the feasibility of a particular goal in combination w. other relevant goals & to obtain clues or confirmation for recommendations regarding food consumption.
Results showed that ↑ dietary quality index was associated w. improved intake of nutrients included in the index, in particular a ↓ intake of total fat and cholesterol. This was r/t a lower consumption of cheese, fats & oils, meat & meat products, & a ↑ consumption of fruit & vegetables.
The food-based quality index showed that a combination of several food-based goals (formulated in quantitative terms) was associated w. an ↑ in food consumption, w/o clear relevance for dietary quality. Food-based guidelines should be based on explicitly stated dietary goals. Findings regarding nutrient density assumed a positive association between density & absolute intake. Variety & dietary intake were characterized mainly by differences in quantity rather than dietary quality. Data indicate that energy intake may be an important pitfall in implementing food-based dietary guidelines, that 'eat a variety of food' can be an empty slogan & that nutrient density is positively related to the absolute intake of specific micronutrients. The 'absence' of interrelationships among
16

2005 Dietary Guidelines Advisory Committee Report
Summary of Nutrient Density Literature Search Included: clinical trials, human, English, 1995-2004 Full Citation Design &
Duration & Objective
Population Methods Outcome Measures Results Statistics, Conclusions, & Comments
risk nutrients indicates a selection process has to be applied.
Lachance P.A. and Fisher M.C., Educational and technological innovations required to enhance the selection of desirable nutrients. Clin Nutr 1986;5(6):257-264.
Various fxns of food affect food prefs & food habits & the resultant dietary combinations selected by the consumer. Traditional dietary guidelines do not assure a balanced profile of nutrient intakes according to the RDA.
A combination of educational & technological innovations is required to enhance the delivery of a balanced array of nutrients. The educational approach requires (a) a food-grping presentation that graphically conveys proportions of the grpings to be eaten (b) a US RDA food labeling system that indicates the caloric & nutritive profile of indiv. foods, (c) an index of nutrient density based on existing nutrition labeling data.
Changes coupled w. technological approaches of controlled micronutrient fortification, will decidedly enhance the probability of the consumer’s attaining minimal nutrient needs.
Consumers who follow the philosophy of at least 2/3 plant food & 1/3 animal food plus attention to the % US RDA profile & the CFN as an indicator of nutrient density, could readily assure themselves foods(meals) of high nutritive value.
Summary of vitamin B12 Intake and the Elderly Included: clinical trials, human, English, 1999-2004, Literature Search supplements not excluded in key terms
Full Citation Design &
Duration & Objective*
Population Methods OutcomeMeasures
Results Statistics,Conclusions,
& Comments Carmel et. al. Serum cobalamin, homocysteine, and methylmalonic acid concentrations in a multiethnic elderly population: ethnic and sex difference in cobalamin and metabolite abnormalities. Am J Clin Nutr 70:904-10, 1999.
Clinical trial in free-living elderly at several community sites (VA clinic, apartment complex, 3 community clubs) in Los Angeles. *Determine the demographic characteristics of cobalamin deficiency in the elderly and role in hyperhomocysteinemia
725 subjects > 60y (folate in n=520 of 725) Ethnic: 134 Hispanic 237 white 151 black 68 Asian-American Gender: 345 ♂ 246 ♀
Serum cobalamin assay by radiodilution assay, intrinsic factor as binding protein; total homocysteine (Hcys) assayed by HPLC; methylmalonic acid (MMA) by Rusmmussen method (1989), modified (1996).
Cobalamin deficiency defined as <140 pmol/L.
Subnormal cobalamin in 70 (11.8%) subjects; 55.1% of these had abnormal MMA and 78.3% had subnormal Hcys. Whites and Hispanic had lower cobalamin than blacks and Asian Americans (p<0.005) and higher prevalence of cobalamin < 140 pmol/L. Elderly ♂ had higher [Hcys] than ♂ (p=0.0001). Whites had higher [Hcys] than all groups (p<0.05)
Excluded subjects taking cobalamin supplements or with renal insufficiency Low [cobalamin] and renal insufficiency strongest predictors of abnormal [Hcys]
Clarke R, et. al. *Assessment of OHAP
17

2005 Dietary Guidelines Advisory Committee Report
Summary of vitamin B12 Intake and the Elderly Included: clinical trials, human, English, 1999-2004, Literature Search supplements not excluded in key terms
Full Citation Design &
Duration & Objective*
Population Methods Outcome Measures
Results Statistics, Conclusions, & Comments
18
Screening for vitamin B12 and folate deficiency in older persons. Am J Clin Nutr 77:1241-7, 2003.
prevalence of vitamin B12 and folate deficiency in a population-based study of oler person living in Oxford City, UK (part of previous study by Clark et al., 2004)
(1991-4;1995-6 survivors): n=1,549 65-74y & 75+ y
Clarke R, et. al. Vitamin B12 and folate deficiency in later life. Age and Aging 33:34-41, 2004.
Population-based cross-sectional analysis of 3 studies of elderly in UK: Oxford Healthy Aging Project (OHAP), National Diet and Nutrition Survey (NDNS, 65+ years), Medical Research Council (MRC) nutrition study *Examine the prevalence of vitamin B12 and folate deficiencies in later life in representative samples of the elderly population in the UK.
3,511 people 65+ y (participants with complete blood profiles on B12, folate and homocysteine); Number of ♀~♂ (exact number not specified) OHAP (1991-4;1995-6 survivors): n=1,549 65-74y & 75+ y NDNS: n=956 65-74y, 75-84, and 85+ y 20% institution residents 80% free-living MRC: n=1,214 75+ y All free-living
B12 deficiency diagnosed if serum vitamin B12<150 pmol/L; “metabolically significant” if <200 pmol/L and homocysteine >20 µmol/L. OHAP B12 assays by competitive protein-binding radioimmunoassay and homocysteine by fluorescence polarisation immunoassay (FPIA); NDNS B12 assays by radio- immunoassay using human intrinsic factor as a binder and homocysteine by HPLC; MRC plasma B12 by Becton Dickinson Simultrac kit and homocysteine by FPIA
Associations of vitamin B12, folate, and homocysteine by linear regression
Prevalence of vitamin B12 increased with age in all 3 studies: 1 in 20 (5%) 65-74y were deficient (or metabolically significant deficient) and 1 in 10 (10%) in 75+ y. Odds ratio of having elevated homocysteine increased sharply at [vitamin B12] < 200 pmol/L, across 3 studies
Considerable inter-lab variability and inter-assay variation for different methods for vitamin B12 determination. To control for confounding by age and sex, the odds ratio of having elevated homocysteine (>20 µmol/L) for each level of serum B12 using regression splines.
Elian, KM and LJ Hoffer Hydroxocobalamin reduces hyperhomocysteinemia in end-stage renal disease. Metabolism 51(7): 881-6, 2002.
Prospective randomized controlled clinical trial
24 maintenance hemodialysis patients with normal or supranormal serum folate and vitamin B(12) concentrations
Patients received either standard therapy, which included 5 to 6 mg folic acid, 5 to 10 mg pyridoxine, and 6 to 10 micrograms oral vitamin B(12) per day, or standard therapy plus 1 mg hydroxocobalamin administered subcutaneously once per
Plasma tHcy and serum methylmalonic acid (MMA) concentrations were measured before and after 8 and 16 weeks of continuous treatment.
Hydroxocobalamin reduced plasma tHcy by an average of 32% (P <.005) and serum MMA by an average of 19% (P <.001). The Hcy-lowering effect of hydroxocobalamin was independent of baseline serum vitamin B(12), folic acid, and MMA concentrations. Patients with higher baseline plasma tHcy concentrations
These results show that parenteral hydroxocobalamin reduces plasma tHcy dramatically in vitamin B(12)-replete hemodialysis patients. Persons with considerable persisting hyperhomocysteinemia despite high-dose folic acid therapy are likely to respond

2005 Dietary Guidelines Advisory Committee Report
Summary of vitamin B12 Intake and the Elderly Included: clinical trials, human, English, 1999-2004, Literature Search supplements not excluded in key terms
Full Citation Design &
Duration & Objective*
Population Methods Outcome Measures
Results Statistics, Conclusions, & Comments
19
week after dialysis. had the greatest response (r = 0.80; P <.002).
to the addition of hydroxocobalamin, irrespective of their serum vitamin B(12) concentrations.
Garcia-Arias MT et. al. Iron, folate and vitamins B12 and C dietary intake of an elderly institutionalized population in Leon, Spain. Nutr Hosp 18:222-5, 2003.
Clinical trial *Evaluate the daily intake of micronutrients which cause anemia
n=125 nursing home residents aged 65-98y, H=80.5y. Gender: 60 ♂ and 64 ♀ Excluded: inflammatory disease, active peptic ulcer, anemia, chronic renal failure, liver disease
7-day dietary intake of B12 determined using actual weighing of the food. Dietary records analyzed with Spanish program (not described or named). Blood iron measurements only.
45.8% of ♂ and 6% ♀ were B12 deficient, according to Spanish RDA
McKay D et. al. The effects of a multivitamin/ mineral supplement on micronutrient status, antioxidant capacity and cytokine production in health older adults consuming a fortified diet. J Nutr 30(12):3090-3096, 2000.
8-week double-blind, placebo-controlled clinical trial * Determine whether a multivitamin/mineral supplement can improve micronutrient (B12) status in free-living older adults already consuming a fortified diet
n=80 50-87y; H = 66.5 " 8.6y free-living Boston residents
After gender stratification, subjects randomized into supplement or placebo group. All subjects received placebo 7 days prior to intervention. Daily, 6 µg B12, as part of multivitamin, administered to supplement group. Plasma B12 analysis after 8 weeks by radioimmunoassay.
Multivitamin treatment significantly increased (p<0.01 compared to placebo) plasma concentrations of B12 from 286 to 326 pmol/L and reduced prevalence of suboptimal plasma levels (p=0.004). Dietary intake of B12 did not change in either group during intervention.
Multivitamin supplement (includes 100%DV for B12) deceased prevalence of suboptimal B12 status.
McKay DL et. al. Multivitamin/mineral supplementation improves plasma B-vitamin status and homocysteine concentration in healthy older adults consuming a folate-fortified diet. J Amer Coll Nutr 19(5):613-21, 2000.
Same study as above

2005 Dietary Guidelines Advisory Committee Report
Summary of vitamin B12 Intake and the Elderly Included: clinical trials, human, English, 1999-2004, Literature Search supplements not excluded in key terms
Full Citation Design &
Duration & Objective*
Population Methods Outcome Measures
Results Statistics, Conclusions, & Comments
Nexo E. et al. Holo-transcobalamin is an early marker of changes in cobalamin homeostasis. A randomized placebo-controlled study. Clinical Chemistry 48(10):1768-1771, 2002.
Clinical Study Patients (n = 88; age range, 38-80 years) undergoing coronary angiography (part of the homocysteine-lowering Western Norway B-Vitamin Intervention Trial)
Patients were were allocated to daily oral treatment with (a) vitamin B(12) (0.4 mg), folic acid (0.8 mg), and vitamin B(6) (40 mg); (b) vitamin B(12) and folic acid; (c) vitamin B(6); or (d) placebo. EDTA blood was obtained before treatment and 3, 14, 28, and 84 days thereafter
Effect of oral vitamin B12 treatment on fluctuations in plasma total cobalamin and its binding proteins transcobalamin(TC) and haptocorrin (HC).
The intraindividual variation for patients not treated with B(12) was approximately 10% for plasma total cobalamin, total TC, apo-TC, and apo-HC, and <20% for holo-TC and TC saturation. In B(12)-treated patients, the maximum change in concentrations was observed already after 3 days for total TC (-16%), holo-TC (+54%), and TC saturation (+82%). At this time holo-HC (+20%) and plasma total cobalamin (+28%) showed an initial burst, but had increased further at 84 days. All changes were highly significant compared with the control group (P <0.0001)
Oral vitamin B(12) treatment produces maximal effects on total TC, holo-TC, and TC saturation within 3 days, whereas maximal increases in holo-HC and plasma total cobalamin occur later. The results support the view that holo-TC is an early marker of changes in cobalamin homeostasis.
Seal EC et al. A randomized, double-blind, placebo-controlled study of oral vitamin B12 supplementation in older patients with subnormal or borderline serum vitamin B12 concentrations. JAGS 50:146-151, 2002.
Randomized, double-blind, placebo-controlled *To assess the efficacy of oral cyanocobalamin (ow doses) in correcting low or borderline serum B12 concentrations, but with no evidence of pernicious anemia
31 inpatients with serum vitamin B12 levels 100-150 pmol/L and no pernicious anemia, malabsorption disorders or progressive neurological or terminal illness.
H = 81.4 y 11 placebo, 5♂ + 6♀ H = 77.6 y 10 low dose (10 µg), 4♂ + 6♀ H = 82.0 y 10 low dose (10 µg), 5♂ + 5♀ H = 84.9 y
4 week treatments of daily oral cobalamin or placebo
dietary history of B12 intake baseline serum B12, folate and Hcys by solid-phase, dual-count radioassay, hcys by HPLC Mini-Mental State Examination (MMSE) following treatment to test orientation, memory, other cognitive abilities.
Daily supplement of 50µg will significantly raise mean serum Vitamin B12 concentration, but not placebo or low dos (10µg)
No significant differences in baseline B12 among placebo or B12 groups
Significant difference between placebo and 50-µg and placebo blood B12 increases after 4 weeks (p<.044) but not 10-µg and placebo (p<.186)
Placebo 11.7 "24.5 pmol/L
10-µg 40.2 "34.4 pmol/L
50-µg 51.7 "47.1 pmol/L
Improvement in Hcys with cobalamin treatments (both) but not significant
NOVA, post hoc Tukey HSD for changes in B12 and MMSE results
Tiemeir H et al. Vitamin Population-based 55+ years, Interview: Vitamin B12 deficiency related Among 278 subjects with
20

2005 Dietary Guidelines Advisory Committee Report
Summary of vitamin B12 Intake and the Elderly Included: clinical trials, human, English, 1999-2004, Literature Search supplements not excluded in key terms
Full Citation Design &
Duration & Objective*
Population Methods Outcome Measures
Results Statistics, Conclusions, & Comments
B12, folate, and homocysteine in depression: The Rotterdam Study. Am J Psychiatry 159(12): 2099-2101, 2002
Rotterdam study H=72.9"7.1y 4,730 home interview 3,884 blood samples 278 with depressive symptoms 112 fulfilled criteria for DSM-IV classification of “depressive disorder” depressed
Center for Epidemiology Studies Depression Scale Present State Examination (DSM-IV criteria for depression) Stanford health Assessment Questionnaire Serum B12 by immunoassay Plasma Hcys by HPLC
to depressive disorders
Subjects with depressive symptoms more likely to be female (73 vs 58%) DSM-IV patients – those with B12 deficiency 70% more likely to have a depressive disorder
depressive symptoms, Vitamin B12 deficiency not associated with depression. When 112 subjects who fulfilled
van Asselt DZ, de Groot LC, van Staveren WA, Blom HJ, Wevers RA, Biemond I, Hoefnagels WH. Role of cobalamin intake and atrophic gastritis in mild cobalamin deficiency in older Dutch subjects. Am J Clin Nutr. Aug;68(2):328-34, 1998
Clinical study 105 healthy, free-living, older subjects aged 74-80 y
examined cobalamin intake, the
presence and severity of atrophic gastritis, the presence of Helicobacter pylori
infection, and plasma cobalamin and methylmalonic acid (MMA) concentrations
Mild cobalamin
deficiency, ie, low to low-normal plasma cobalamin concentrations (< 260 pmol/L) and elevated plasma MMA concentrations (> 0.32 micromol/L), were found in 23.8% of subjects; 25.7% of subjects were not cobalamin deficient (plasma cobalamin >
or = 260 pmol/L and plasma MMA < or = 0.32 micromol/L). Six subjects (5.8%), including 1 with mild cobalamin deficiency, had dietary cobalamin intakes below the Dutch recommended dietary intake of 2.5 microg/d. Mildly cobalamin-deficient subjects had lower total (diet plus supplements) cobalamin intakes (median: 4.9
microg/d; 25th and 75th percentiles: 3.9, 6.4) than did non-cobalamin-deficient subjects (median: 6.3 microg/d; 25th and 75th percentiles: 5.4, 7.9) (P =
0.0336), mainly because of less
The high prevalence of mild
cobalamin deficiency in healthy, free-living, older Dutch subjects could be
explained by inadequate cobalamin intake or severe atrophic gastritis in only
28% of the study population. Other mechanisms explaining mild cobalamin
deficiency in older people must be sought.
21

2005 Dietary Guidelines Advisory Committee Report
Summary of vitamin B12 Intake and the Elderly Included: clinical trials, human, English, 1999-2004, Literature Search supplements not excluded in key terms
Full Citation Design &
Duration & Objective*
Population Methods Outcome Measures
Results Statistics, Conclusions, & Comments
frequent use of cobalamin supplements (8% compared with 29.6%; chi2 = 3.9, P = 0.048). Atrophic gastritis was found in 32.4% of the total study group: mild to moderate in 19.6% and severe in 12.7%.
The prevalence of severe atrophic gastritis, but not mild-to-moderate atrophic gastritis, was higher in mildly cobalamin-deficient subjects (25%) than in non-cobalamin-deficient subjects (3.7%) (chi2 = 4.6, P = 0.032). The prevalence
of immunoglobulin G antibodies to H. pylori was similar in mildly
cobalamin-deficient subjects (54.2%) and in non-cobalamin-deficient subjects
(44.4%) (chi2 = 0.5, P = 0.5).
van Asselt DZ et al. Cobalamin supplementation improves gognitive and cerebral function in older, cobalamin-deficient persons. J Gerontol Med Sci 56A(12):M775-M779, 2001.
Single –blind, placebo-controlled intervention study
16 healthy community-swelling with low cobalamin (Cb1) concentrations and no cognitive impairments
1 month of treatment with placebo, followed by 5 months of treatment with intramuscular injections of hydroxycobalamin. Before and after measurements of plasma cobalamin, total Hcys, methylmalonic acid, quantitative electroencephalograph (qEEG), and psychometric tests were taken.
plasma cobalamin levels total homocysteine levels methylmalonic acid levels a quantitative electroencephalograph, and psychometric tests
After Cb1 supplementation, plasma Cb1 concentrations increased 110 pmol/L to 640 pmol?L (p<.001), but not with placebo plasma methylmalonic and homocysteine concentrations decreased. Psychometric tests improved. Electroencephalograph tests showed more fast activity and less slow activity. Lower plasma homocysteine concentrations were related to increased fast activity on the qEEG.
Electrographic signs of improved cerebral function and improved cognitive function were found after Cb1 supplementation in older subjects with low Cb1 concentrations who were free of significant cognitive impairment. The improvements were related to a reduction of total plasma homocysteine concentration.
Hcys = homocysteine
22

2005 Dietary Guidelines Advisory Committee Report
Full Citation Type of Literature Summary
Dharmarajan TS et al. Vitamin B12 deficiency. Recognizing subtle symptoms in older adults. Geriatrics 58(3):30-38, 2003.
Informational scientific article Current recommendation for B12 is 2.4 ug/d. Deficiency may occur for several reasons, but in older adults these include inadequate ingestion, inadequate absorption, inadequate utilization, inadequate stores, drug interactions, malabsorption, metabolic inactivation, and food-cobalamin malabsorption. Also included in the article is suggested screening for B12 deficiency and therapeutic options to treat B12 deficiency.
Klee GG. Cobalamin and folate evaluation: Measurement of methylmalonic acid and homocysteine vs vitamin B12 and folate. Clinical Chemistry 46:8(B), 2000.
Review article Vitamin B12 and folate are two vitamins that have interdependent roles in nucleic acid synthesis. Deficiencies of either vitamin can cause megaloblastic anemia; however, inappropriate treatment of B12 deficiency with folate can cause irreversible nerve degeneration. Laboratory support for the diagnosis and management of these multiple clinical entities is controversial and somewhat problematic. There are no “gold standards” for the diagnosis of these disorders, and controversy exists regarding the best diagnostic approach.
Spence, J. D., V. J. Howard, et al. Vitamin Intervention for Stroke Prevention (VISP) trial: rationale and design. Neuroepidemiology 20(1): 16-25, 2001.
Review Elevated plasma levels of homocyst(e)ine [H(e)] are surprisingly common and strongly associated with endothelial dysfunction and a marked increase in vascular risk. Treatment with a combination of folic acid, pyridoxine (vitamin B6) and cobalamin (vitamin B12) reduces plasma H(e) levels in most cases, restores endothelial function, and regresses carotid plaque, but there is no evidence that such treatment will reduce clinical events. The Vitamin Intervention for Stroke Prevention (VISP) study is a double-masked, randomized, multicenter clinical trial designed to determine if, in addition to best medical/surgical management, high-dose folic acid, vitamin B6, and vitamin B12 supplements will reduce recurrent stroke compared to lower doses of these vitamins. Patients at least 35 years old with a nondisabling ischemic stroke within 120 days, and screening plasma H(e) > the 25th percentile of benchmark population data are eligible. Secondary endpoints are myocardial infarction or fatal coronary heart disease. This paper describes the design and rationale of the study.
Summary of vitamin D Intake and the Elderly Included: clinical trials, human, English, 1999-2004
Full Citation Design & Duration & Objective
Population Methods Outcome Measures Results Statistics, Conclusions, & Comments
23

2005 Dietary Guidelines Advisory Committee Report
Summary of vitamin D Intake and the Elderly Included: clinical trials, human, English, 1999-2004 Full Citation Design &
Duration & Objective
Population Methods Outcome Measures Results Statistics, Conclusions, & Comments
Munger, K.L., et al., Vitamin D intake and incidence of multiple sclerosis. Neurology 2004;62:60-65.
A protective effect of vitamin D on risk of multiple sclerosis (MS) has been proposed, but no prospective studies have addresses this hypothesis.
Nurses Health Study - 92,253 ♀ 1980-2000 Nurses Health Study II – 95,310 ♀ 1991-2001
Dietary vit D intake examined directly re: risk of MS in 2 lg cohorts of ♀.
Diet assessed @ baseline & updated q. 4 yrs. During f/up 173 cases of MS w. onset of symptoms after baseline were confirmed.
Pooled age-adjusted relative risk (RR) comparing ♀ in highest quintile of total vit D intake @ baseline w. those in lowest was .67 (95% CI = .4 to 1.12; p for trend = .03. Intake of vit D from suppl. was also inversely associated w. risk of MS. RR comparing ♀ w. intake of > 400 IU/d w. no suppl. intake was .59 (95% CI = .38 to .91; p for trend = .006) No association was found between vit D from food and MS incidence.
Results support a protective effect of vit D intake on risk of developing MS.
Valimaki VV.J. , et al. Vitamin D status as a determinant of peak bone mass in young Finnish men. Clin Endocrinol Metab. 2004 Jan;89(1):76-80.
Coss-sectional study. Severe vit D deficiency causes rickets, but scarce data are available about the extent to which vit D status determines the development of the peak bone mass in young adults. Aim was to evaluate the prevalence of vit D deficiency < the lower limit of the reference range of 20-105 nmol/liter & the relationship between vit D status & peak bone mass among young Finnish ♂. Determinants of peak bone mass w. data on lifestyle factors was collected retrospectively.
220 young ♂, aged 18.3-20.6 yr. 170 ♂ were recruits of the Finnish Army, & 50 were ♂ of similar age who had postponed their military service for reasons not related to health.
Serum 25-OHD concentrations were followed prospectively for 1 yr. Bone mineral content, bone mineral density, & scan area were measured in lumbar spine & upper femur by dual energy x-ray absorptiometry.
In July 2000, only 0.9% of the♂ had vit D deficiency, but 6 months later, in the winter, the respective percentage was 38.9%. After adjusting for age, height, weight, exercise, smoking, calcium, & alcohol intake, there existed a positive correlation between serum 25-OHD & bone mineral content at lumbar spine (P = 0.057), femoral neck (P = 0.041), trochanter (P = 0.010), & total hip (P = 0.025).
The correlation coefficients for the bone mineral densities at the four measurement sites were 0.035, 0.061, 0.056, & 0.068, respectively. No correlation was found to scan area.
Vitamin D deficiency is very common in Finnish young ♂ in the winter, & it may have detrimental effects on the acquisition of maximal peak bone mass. As in Finland vit D supplementation to infants is now stopped at the age of 3 yr, it can be asked whether at our latitude it should be continued from that age onward, not for the prevention of rickets, but as prophylaxis for osteoporosis.
Merlino L.A., et al. Vitamin D Intake is Inversely Associated with Rheumatoid Arthritis-Results from the Iowa Women’s Health Study. Arthritis & Rheumatism Jan
Prospective cohort study. Vit D is a potent regulator of calcium homeostasis & may have immunomo-dulatory effects. The influence of Vit D on human autoimmune dz has not been well defined. Study was to evaluate the
29,368 ♀ ages 55-69 yrs w/o hx of rheumatoid arthritis at baseline in 1986.
Diet ascertained using a self-administered 127-item validated food frequency questionnaire that included supplemental vit D use.
Risk ratios & 95% confidence intervals were estimated using Cox proportional hazards regression, adjusting for potential confounders.
Thru 11 yrs of f-up, 152 cases of RA were validated against medical records. ↑ intake of vit D was inversely associated w. risk of RA (RR .67, 95% CI .44-1.0, P for trend=.05). Inverse associations were apparent for both dietary (RR .72, 95% CI .46-1.14, P for trend=.16) & suppl. (RR .66, 95% CI
Greater intake of vit D may be associated w. a lower risk of RA in older women, although this finding is hypothesis generating.
24

2005 Dietary Guidelines Advisory Committee Report
Summary of vitamin D Intake and the Elderly Included: clinical trials, human, English, 1999-2004 Full Citation Design &
Duration & Objective
Population Methods Outcome Measures Results Statistics, Conclusions, & Comments
2004;50(1):72-77. association of dietary & suppl vit D intake w. rheumatoid arthritis (RA) incidence.
.43-1.0, P for trend=.03) vit D. No indiv. Food item ↑ in vit D content and/or calcium was strongly associated with RA risk. Composite measure of milk products was suggestive of an inverse association w. risk of RA (RR .66, 95% CI .42-1.01, P for trend=.06)
Plotnikoff, G.A. and Quigley, B.A., Prevalence of Severe Hypovitaminosis D in Patients with Persistent, Nonspecific Musculoskeletal Pain. Mayo Clin Proc 2003 Dec;78(12):1463-70.
Cross-sectional study Determine the prevalence of hypovitaminosis D in primary care outpt’s w. persistent nonspecific musculoskeletal pain syndromes refractory to standard therapies.
150 pt’s between Feb 2000 & Jun 2002 w. persistent nonspecific musculoskeletal pain @ Community University Health Care Center, Minneapolis, Mn. (45°N) Immigrant n=67 both sexes ages 10-65
6 broad ethnic gps were screened for vit D status.
Serum 25-hydroxyvit D levels determined by radioimmunoassay.
Afric. Amer., East Afric., Hisp & Amer. Ind. pt’s had 100% deficient vit D levels. (< 20 ng/mL). Nonimmigrants had deficient vit D levels as well. (P=.48). Levels in ♂ were as deficient as in ♀ (P=.42). Of all pt’s, 28% had severely deficient vit D levels, incl. 55% who were < 30 yo. 5 pt’s (4 >35 yo) had levels below detection. Severity of deficiency was disproportionate by age for young ♀ (P<.001), by sex for East Afric. (=.006). Season was not a significant factor in determining vit D serum levels (P=.06).
All pt’s w. persistent nonspecific musculoskeletal pain are @ high risk for consequences of unrecognized & untreated severe hypovitaminosis D. Risk extends to nonelderly, nonhousebound, nonimmigrant persons of either sex. Nonimmigrant ♀ of childbearing age w. such pain appear to be at greatest risk for mis-dx or delayed dx.
Heaney, R., et al., Human serum 25-hydroxychole-calciferol response to extended oral dosing with cholecalciferol. Am J Clin Nutr 2003;77:204-10.
Intervention 5 mos - winter months (late Oct to late Feb or early Mar) for 2 successive yrs. To establish quantitative relationship between steady state cholecalciferol input & resulting serum 25-hydroxycholecalciferol concentration. To estimate proportion of daily requirement during winter that is met thru body tissue stores.
67 ♂, in good health, consumed no more than 1 svg milk/d. Did not take oral supplement. Consumed <5mcg cholecalciferol/d from food sources. Age: 38.7 + 11.2 Wt: 84.8 + 11.1 Kg BMI: 26.2 + 2.4 All resided in Omaha @ latitude 41.2 ˚ N. Excluded those planning a winter vacation at altitude or latitude with high solar radiation.
Random daily assignment of -no supplemental cholecalciferol -a tablet labled to contain 1000 IU cholecalciferol (actual 836 IU) -1 or 2 tablets labeled to contain 5000 IU cholecalciferol (actual 5500 IU) 2 lower dosage groups- monthly visits 2 higher dosage groups- visits at 1, 3, 6, 10, & 20 wks after beginning supplementation.
Blood samples taken at each visit to measure 25(OH)D, total serum calcium and PTH. At midpoint of study body composition was measured by dual energy X-ray absorptiometry. Gross body wt & body fat were variable modifying the effective oral dose. Early-rise component in serum 25(OH)D response curve.
For 1 subj in high-dosage group & for 17 subj in 2 lower-dosage groups, data were erratic & curve-filling algorithm would not converge to provide good estimates of parameters. (a) was taken as simple arithmetic difference between baseline & final values. For aggregated data sets, r2 exceeded .93 for 2 higher-dosage groups, showing overall aptness of the model for data. For 2 lower-dosage groups, r2 averaged .69 & .81; ea. Was highly significant & substantially > result provided by a simple linear fit. Conclusion: Healthy ♂ seem to use 3000-5000 IU cholecalciferol/d apparently meeting
PTH assays by 2-radioimmunometric assay. Serum calcium measured by routing measures. Cholecalciferol measured in lab-Nichols Method for cross-reactivity with other vit D metabolites. Model describing the expected time course for serum25(OH)D3 concentr: is: C(t)= C(0) + a(1-e( –kt)) C(t) is 25(OH)D3
concentr:
C(0) is 25(OH)3 value at start of study
25

2005 Dietary Guidelines Advisory Committee Report
Summary of vitamin D Intake and the Elderly Included: clinical trials, human, English, 1999-2004 Full Citation Design &
Duration & Objective
Population Methods Outcome Measures Results Statistics, Conclusions, & Comments
> 80% of their winter cholecalciferol need w. cutaneously synthesized accumulations from solar sources during the preceeding summer mos. Current rec. vit D inputs are inadequate to maintain serum 25-hydroxycholecalciferol concentration in the absence of substantial cutaneous production of vit D.
a is the increment at equilibrium produced by a given constant input k is rate constant representing the proportion of the total mass of 25(OH)D3 used/d t is the time in d All values expressed in nmol/L
Heaney, R., et al., Calcium Absorption Varies within the Reference Range for Serum 25-Hydroxyvitamin D. J Am Coll of Nutr 2003;22,2,142-146.
Randomized, cross-over study 2 experiments performed in spring, 1 yr apart. 1st, participants were pretreated with 25(OH)D, mean serum 25(OH)D concentr. Was 86.5 nmol/L. The other had no pretreatment, mean serum concentr. was 50.2 nmol/L. Participants received 500 mg oral calcium loads as part of a std low calcium breakfast. A low calcium lunch was provided at mid-day. Blood was obtained fasting & at freq. intervals for 10-12 hrs afterward. To quantify calcium absorption @ 2 levels of vit D repletion using pharmacokinetics and calcium supplements.
34 postmenopausal ♀, 14 took part in both studies. Age: 56 + 7 yrs (1st) 64 + 9 yrs (2nd) BMI: 29.2 + 5.2 (w/suppl) 28.8 + 3.8 (no suppl) Estrogen RT: 12 of the 24 (1st) 10 (2nd) Excluded were indiv w. digestive disorders, unstable med conds or on antibiotic use w/in 5 days. Conducted in Omaha, NE @ 41.3˚ N latitude.
Relative calcium absorption @ two 25OHD concentrations was estimated from the area under the curve (AUC) for load-induced increment in serum total calcium.
Blood was drawn immediately prior to the test breakfast (time zero) & at freq. intervals thereafter out to 24 hrs in the 1st study and to 12 hrs in the 2nd. AUC was calculated for 9, 10, 12 hrs by trapezoidal method using increment above ea. Indiv. Baseline serum calcium value and indiv partic AUC values were aggregated across ea. Study. Comparative absorption was expressed as the ratio of the means of the two AUC values. Fractional absorption was calculated from AUC values using the following: AbsFx = (51.1 x AUC)/Ingested load
AUC9(+ SEM) was 3.63 mg hr/dL + .234 in participants pretreated w 25OHD & 2.2 + .24 in those not pretreated (p<.001). Absorption was 65% higher at serum 25OHD levels averaging 86.5 nmol/L than at levels averaging 50 nmol/L.
Serum calcium measure by atomic absorption spectrophotometry. Serum 25OHD was measured once at baseline on ea subj in ea study. Serum iPTH measured as the intact molecule by IRMA. Individuals with low serum 25OHD levels may not be getting the full benefit from their calcium intake. Lower end of the current reference range is set too low.
Vieth, R., et al., Age-related Changes in the 25-Hydroxyvitamin D Versus Parathryroid Hormone Relationship
Cross-sectional lab analysis; descriptive study. May ’97- Dec ‘98 Vit D requirements are thought to vary with age. To determine whether
Studied 1741 euthyroid, thyroid clinic outpt’s w/o calcium abnormalities. Age: 19-97 (56.9 + 14.8) Samples: 60% obtained May-Oct 42˚N latitude ↑25(OH)D
Measured intact PTH molecule 25(OH)D w. RIA 1,25(OH)2D w. calf-thymus receptor assay
Review of biochemical data and clinical assessment through patient charts.
Comparisons of 25(OH)D, vit D intake, and age showed distinct increases in serum 25(OH)D w. ↑ vit D intake. Found no effect on 25(OH)D concentrations r/t age. No relationship between 25(OH)D & 1,25(OH)2D.
Statistical analysis done using SPSS. Locally weighted regression and scatterplot smoothing (LOWESS) techniques was applied. Exponential decay function was determined, fitting data to 3 parameters using iterative
26

2005 Dietary Guidelines Advisory Committee Report
Summary of vitamin D Intake and the Elderly Included: clinical trials, human, English, 1999-2004 Full Citation Design &
Duration & Objective
Population Methods Outcome Measures Results Statistics, Conclusions, & Comments
Suggest a Different Reason Why Older Adults Require More Vitamin D. JCEM 2003; 88(1):185-191.
25(OH)D concentration, vit D intake & PTH concentrations differ among adult age groups.
concentrations 12 patients excluded for>2.7 mmol/L serum calcium levels.
Change in creatinine occurred r= .146, P<.001 in 19-50 yr, correlates w. 25(OH)D. Creatinine did not correlate w. PTH in younger gp, bur was significant as age increased r=.365, P<.001
regression analysis to optimize the fit. PTH=3.54 (-.027x25(OH)D) +3.2 All age groups exhibit high prevalence of 25(OH)D insufficiency & 2˚ hyperthyroidism. Older adults need more vit D to produce higher 25(OH)D levels To obtain minimum target levels of 25(OH)D, daily consumption of vit D should be the same for all adults regardless of age.
Tangpricha V., et al., Fortification of orange juice with vitamin D: a novel approach for enhancing vitamin D nutrition health. AJCN 2003; 77:1478-83.
A. Randomized On 3 separate occasions, 25,000 IU vit D2 in 240 mL whole or skim milk or in .1 mL corn oil on toast were ingested. B. Double-blind, randomized, controlled trial investigated whether consumption of orange juice fortified w. vit D3 would ↑ serum 25(OH)D. 14 Subjects ingested 240mL OJ fortified w. 1000 IU vit D. 12 Subjects ingested control OJ daily for 12 wks. To determine whether vit D is bioavailable in orange juice and skim millk-non-fat beverages.
A. 19 healthy adults Average age: 36.3 + 10 y (19-68 yo) Excluded subjects w. hx of vit D deficiency, intestinal malabsorption, severe medical illness, hypercalcemia, cigarette smoking, or excessive ETOH use. Also subjects who were pregnant or taking meds known to interfere w. vit D metab. B. 30 adults Average age: 29 + 9 y (22-60 yo) Excluded were subjects on a MVI, who drank >16 oz milk/d, took meds interfering with vit D metab, had significant sun exposure w/in past month, planned to travel to sunny climate during study or w. hx of hypercalcemia.
A/B. Intra- & inter-assay methods by Chen et al. were used. Daily OJ was consumed at the end of winter.
A. Vit D2 serum concentrations were measured @ 0,2,4,8,12,48,72 h after ingestion. B. Measured serum 25(OH)D concentrations in healthy adults who consumed either unfortified OJ or OJ fortified w 1000 IU vit D3. thru weekly blood sampling.
A. Peak serum vit D2 concentrations did not differ after ingestion w/in different food vehicles. Consumption of fortified OJ cause serum 25(OH)D3 concentrations to ↑ by 150%. Serum PTH concentrations ↓ by 25% compared w. baseline. Control subjects had a seasonal ↑ of 45% in 25(OH)D & no significant ∆ in serum PTH.
A/B. Intraassay CV of 8% Interassay CV of 12% t-tests ANOVA Bonferroni techniques B. HPLC analysis of OJ performed. Fat content in milk does not affect vit D bioavailability. Vit D fortification at 1000 IU/240mL OJ for 12 wks safely increased 25(OH)D3 concentrations in adults. Comment: Rates of vit D deficiency are highest among elderly & institutionalized adults. Younger adults/adolescents are also @ risk.
27

2005 Dietary Guidelines Advisory Committee Report
Summary of vitamin D Intake and the Elderly Included: clinical trials, human, English, 1999-2004 Full Citation Design &
Duration & Objective
Population Methods Outcome Measures Results Statistics, Conclusions, & Comments
28
McCullough M.L., et al., Calcium, vitamin D, dairy products, and risk of colorectal cancer in the Cancer Prevention Study II Nutrition Cohort (United States). Cancer Causes Control 2003 Feb;14(1):1-12.
Calcium, vit D, & dairy product intake may reduce the risk of colorectal cancer. Examined the association between these factors & risk of colorectal cancer in a large prospective cohort of US ♂ & ♀.
After excluding participants w. a h/of cancer or incomplete dietary information, 60,866 ♂ & 66,883 ♀ remained for analysis. 1992-93 F-up thru 31 August 1997
Participants in the Cancer Prevention Study II Nutrition Cohort completed a detailed questionnaire on diet, medical hx & lifestyle. Documented 421 & 262 cases of incident colorectal cancers among ♂ & ♀, respectively.
Multivariate-adjusted rate ratios (RR) were calculated using Cox proportional hazards models.
Total calcium intake (diet & suppl) was associated w. marginally ↓ colorectal cancer risk in ♂ & ♀ (RR = 0.87, 95% CI 0.67-1.12, highest vs lowest quintiles, p trend = 0.02). The association was strongest for calcium from suppl (RR = 0.69, 95% CI 0.49-0.96 for > or = 500 mg/day vs none). Total vit D intake (diet & mvi) was also inversely associated w. risk of colorectal cancer, particularly among ♂ (RR = 0.71, 95% CI 0.51-0.98, p trend = 0.02). Dairy product intake was not related to overall risk.
Results support the hypothesis that calcium modestly reduces risk of colorectal cancer. Vit D was associated w. reduced risk of colorectal cancer only in ♂.
Looker, A., et al., Serum 25-Hydroxyvitamin D Status of Adolescents and Adults in Two Seasonal Subpopulations From NHANES III. Bone 2002;30(5):771-777.
Household interview & direct physical exams. Serum 25-OHD data examined in the 3rd National Health and Nutrition Examination Survey (NHANES III 1988-1994). Subclinical vit D deficiency may be common in certain subgroups in the US, but to date vit D data from other groups in the
18,875 individuals of selected non-institutionalized U.S. adolescent and adult civilian US population. Age: >12 yrs
Serum 25-OHD levels measured by a radioimmunoassay kit (DiaSorin, Inc., Stillwater, MN; normal range 22.5-94 nmol/L). Physical exams performed in mobile vans in NHANES, data could not be collected in northern latitudes during the winter; instead data were collected in northern latitudes
Blood samples collected in winter @ median latitude 32°N (25°-41°N) and in summer @ median latitude 39°N (25°-47°N). Groups may be at lower risk of inadequate vit D status due to potentially ↑ ultraviolet radiation levels present @ ↓ latitudes in winter or ↑ latitudes in summer months.
<1% of the winter/lower latitude subpopulation had vit D deficiency (25-OHD <17.5 nmol/L). However, the prevalence of vit D insufficiency in this group ranged from 1%-5% with 25-OHD <25 nmol/L to 25%-57% with 25-OHD <62.5 nmol/L, even though the median latitude for this subsample (32 degrees N) was considerably lower than the latitude at which vit D is not synthesized during winter months
Findings suggest vit D deficiency is unlikely in the 2 seasonal subpopulations of noninstitutionalized adolescents and adults that can be validly assessed in NHANES III. Vit D insufficiency is more common in these 2 seasonal subpopulations. Of particular interest is that insufficiency occurred fairly frequently in younger individuals, esp in the winter/lower latitude subsample. Findings support continued monitoring of this vitamin in the U.S. population.

2005 Dietary Guidelines Advisory Committee Report
Summary of vitamin D Intake and the Elderly Included: clinical trials, human, English, 1999-2004 Full Citation Design &
Duration & Objective
Population Methods Outcome Measures Results Statistics, Conclusions, & Comments
population have not been available.
during summer and in southern latitudes in winter. To address this season-latitude aspect of the NHANES design, sample was stratified into 2 seasonal subpopulations (winter/lower latitude and summer/higher latitude) before examining vitamin D status.
(approximately 42 degrees N). With the exception of elderly women, prevalence rates of vit D insufficiency were lower in the summer/higher latitude subpopulation (<1%-3% with 25-OHD <25 nmol/L to 21%-49% with 25-OHD <62.5 nmol/L). Mean 25-OHD levels were highest in non-Hispanic whites, intermediate in Mexican Americans, and lowest in non-Hispanic blacks.
Devine, A., et al., Effects of vitamin D metabolites on intestinal calcium absorption and bone turnover in elderly women. AJCN 2002;75:283-8.
Clinical Trial Food frequency questionnaire To examine the determinants of active gut calcium absorption ( +/- SD: 42 +/- 11%) after an overnight fast w. use of a low (10 mg) calcium load. Determine relative importance of vit D metabolites in the regulation of gut calcium absorption in elderly ♀ living in an environment w. abundant
120 elderly ♀ Age: 74.7 +/- 2.6 y Random selection by electoral roll from the community. Subjects were not receiving bone-active agents, or using vit D supplements or rich in ergocalciferol.
♀ underwent active calcium absorption test w. a radioactive calcium tracer, dietary analysis, measurement of markers of bone turnover and calcium metabolism.
Blood & urine samples collected @ baseline. ♀ instructed to eat their normal self-selected diet. Active calcium transport measured by using 10-mg calcium chloride carrier and a 5-uCi(Ca) tracer. Blood samples taken 1 hr post tracer admin. Specific brands of deionized H2O were recommended for consumption during 12 hrs before testing. Fraction absorbed(%)=[(cpm Ca/L blood) x body wt(kg) x .15]/totalcounts administered CV for active gut calcium absorption conducted in 12 ♀ 2 wks apart was 8.5%
Mean serum 25(OH)D concentrations @ time of calcium absorption test was 68 +/- 29 nmol/L. Gut calcium absorption was correlated with 25(OH)D but not 1,25-dihydroxyvitamin D (calcitriol), the free calcitriol index, or dietary calcium intake. After adjustment for age, calcitriol concentration, & dietary calcium intake, the significant determinant of fractional calcium absorption was the 25(OH)D concentration (r = 0.34, P = 0.001). When body weight was included in regression, both 25(OH)D (beta = 1.20 x 10(-3)) and calcitriol (beta = 1.00 x 10(-3)) were significantly correlated w. calcium absorption. Despite strong relation between 25(OH)D & gut calcium absorption, there was no relation with other aspects of bone turnover or calcium metabolism.
Data suggest that @ low calcium loads, 25(OH)D is a more important determinant of gut calcium absorption than is calcitriol in elderly ♀ exposed to abundant sunlight, but that this relation has little effect on overall calcium metabolism.
29

2005 Dietary Guidelines Advisory Committee Report
Summary of vitamin D Intake and the Elderly Included: clinical trials, human, English, 1999-2004 Full Citation Design &
Duration & Objective
Population Methods Outcome Measures Results Statistics, Conclusions, & Comments
sunlight.
Deroisy, R., et al., Administration of a supplement containing both calcium and vitamin D is more effective than calcium alone to reduce secondary hyperparathyroidism in postmenopausal women with low 25(OH)vitamin D circulating levels. Aging Clin Exp Res 2002;14:13-17.
Clinical Trial Randomized Controlled Trial Prospective, open label study For 90 days ♀ were randomly assigned to a daily supplement To compare the respective efficacy of calcium & calcium-vit D supplements in reducing serum parathyroid hormone levels in postmenopausal ♀ with prevalent ↓ 25(OH)vit D levels.
100 consecutive ambulatory postmenopausal ♀ w. serum 25(OH)vit D levels below 18 ng/mL
Daily supplementation of either one tablet of calcium gluconolactate and carbonate (500 mg calcium), or 1 powder-pack of an association of calcium carbonate (500 mg calcium), citric acid (2.175 gr) and cholecalciferol (200 IU). Venous blood samples collected.
Changes observed during the 90 days of the study in circulating PTH levels were the primary endpoint, while changes in serum 25(OH)D levels were assessed as secondary endpoint.
A significant difference was observed between calcium-vit D (CaD) and calcium (Ca) only groups for changes during the 90 day study in PTH (-14.5+/-40% and +2.5+/-46%) (p=0.009) and 25(OH)D (+67+/-77% and +18+/-55%) (p<0.001) circulating levels. PTH changes between baseline & day 90 were significant in CaD group, but not in Ca group. The odds ratio for a patient in Ca group to experience an absolute (<12 ng/mL) deficiency in circulating 25(OH)vit D levels, compared to a group CaD patient was statistically increased (OR: 3.22, 95% CI: 1.33-7.80).
Results expressed in mean & SD. Mean values compared to Student’s t-test and by Mann-Whitney U-test. Wilcoxon signed rank test used. Odds ratios w. 95% confidence intervals used. Results support the recommendation of supplementing postmenopausal women with low circulating levels of 25(OH)vit D with a combination of calcium and vit D, rather than with calcium alone.
Barger-Lux M.J. and Heaney R.P., Effects of above average summer sun exposure on serum 25-hydroxyvitamin D and calcium absorption. J Clin Endocrinol Metab 2002 Nov; 87(11):4952-6.
Purpose of this study was to examine the effects of summer sun exposure on serum 25(OH)D, calcium absorption fraction, & urinary calcium excretion.
Subjects were 30 healthy ♂ who had just completed a summer season of extended outdoor activity.
26 subjects completed both visits: after summer sun exposure & again approximately 175 d later, after winter sun deprivation. Each subject's sun exposure was characterized by locale, schedule & usual attire.
Median serum 25(OH)D ↓ from 122 nmol/liter in late summer to 74 nmol/liter in late winter. The median seasonal difference of 49 nmol/liter (interquartile range, 29-67) was highly significant (P < 0.0001). There was only trivial, nonsignificant seasonal difference in ca absorption fraction & no change in fasting urinary calcium to creatinine ratio. At both visits serum 25(OH)D, fasting urinary calcium to creatinine ratio, & ca absorption fraction were measured.
Findings from earlier work indicate that subjects' sun exposure was equivalent in 25(OH)D production to extended oral dosing w. 70 mcg/d vit D(3) (interquartile range, 41-96) or, equivalently, 2800 IU/d (interquartile range, 1640-3840). Despite this input, at the late winter visit, 25(OH)D was <50 nmol/liter in 3 subjects & < 75 nmol/liter in 15 subjects. Findings confirm & quantify relatively lg seasonal fluctuations in circulating 25OH vit D in association w. summer sun exp. Among outdoor workers.
Lips, P., et al., A Global Study of
Controlled Clinical Trial
7705 postmenopausal ♀ Baseline data from 7564
Fasting blood samples were obtained at baseline, and
Biochemical measurements performed
The mean (+/-SD) serum 25OHD was 70.8 +/- 30.9 nmol/L. A low
Serum 25OHD was less than 25 nmol/L in 4% of the women, and
30

2005 Dietary Guidelines Advisory Committee Report
31
Summary of vitamin D Intake and the Elderly Included: clinical trials, human, English, 1999-2004 Full Citation Design &
Duration & Objective
Population Methods Outcome Measures Results Statistics, Conclusions, & Comments
Vitamin D Status and Parathyroid Function in Post menopausal Women with Osteoporosis: Baseline Data from the Multiple Outcomes of Raloxifene Evaluation Clinical Trial. J Clin Endocrinol Metab 2001;86:1212-1221. Erratum in: J Clin Endocrinol Metab 2001 Jul;86(7):3008.
Nov 1994 & Aug 1995 International Multiple Outcomes of Raloxifene Evaluation (MORE) study, prospective intervention trial in postmenopausal ♀ w. osteoporosis, that compared vit D status & parathyroid fxn. Vit D deficiency leads to 2° hyperparathyroidism, ↑ bone turnover, bone loss & when severe, osteomalacia. Vit D deficiency is common in elderly people, esp the institutionalized. Definition of vit D deficiency is hampered by lg inter-laboratory differences in assays for serum 25OHD.
2 yr postmenopausal ♀ from 25 countries on 5 continents. Age: 31–80 yr (mean 66.5 yr) All ♀ had osteoporosis, i.e. bone mineral density (BMD) at femoral neck or lumbar spine was lower than t-score -2.5, or they had 2 vertebral fractures.
after centrifugation were kept frozen until analysis. Fasting blood samples were again obtained after 6 months of treatment w. vit D3 (400–600 IU/day), calcium (500 mg/day), and
either placebo or raloxifene. 6-month data of placebo
group are included in this paper. 6-month data of raloxifene groups are not included, because this drug can also influence PTH secretion.
in a central lab facility. Serum 25OHD measured by RIA. Serum PTH measured by immunoradiometric assay. BMD measured by dual x-ray absorptiometry.
serum 25OHD (<25 nmol/L) was observed in 4.1% of all ♀ in the MORE study, ranging from 0% in SE Asia (very few patients) to 8.3% in S Europe. Serum 25OHD was between 25-50 nmol/L in 24.3% of the ♀. Serum 25OHD showed a significant seasonal relationship w. lower values in all regions in winter. Serum PTH correlated negatively with serum 25OHD (r = -0.25; P < 0.001). This significant negative correlation was observed in all regions. When serum 25OHD was < 25, 25-50, or > 50 nmol/L, respectively, mean serum PTH levels were 4.8, 4.1, & 3.5 pmol/L, respectively (by ANOVA, P < 0.001). Similarly, mean alkaline phosphatase levels were 83.7, 79.1, & 75.7 U/L (P < 0.001), respectively, w. ↑ serum 25OHD. The effect of serum 25OHD on BMD was only significant for BMD of the trochanter where a serum 25OHD level < 25 nmol/L was associated w. a 4% lower BMD. After 6 months of treatment w. vit D(3) (400-600 IU/day) and calcium (500 mg/day), serum 25OHD ↑ from 70.8 +/- 29.8 to 92.3 +/- 28.6 nmol/L. Serum PTH ↓significantly after 6 months of treatment, and this ↓ depended on baseline serum 25OHD. When baseline serum 25OHD was < 25, 25-50, or > 50 nmol/L, respectively, serum PTH ↓ by 0.8, 0.5, or 0.2 pmol/L, respectively (P < 0.001).
this was associated with a 30% higher serum PTH. In 24% of the women serum 25OHD was between 25-50 nmol/L, associated with a 15% higher level of serum PTH compared with women with a serum 25OHD greater than 50 nmol/L. A low serum 25OHD level was also associated with higher serum alkaline phosphatase and lower BMD of the trochanter. Treatment with vitamin D(3) and calcium increased serum 25OHD and decreased serum PTH significantly; the effect was greater for lower baseline serum 25OHD. Consistent with previous assessments of vit D in various
countries, the prevalence of low serum 25OHD levels was lower in countries of North America and northern Europe than in those of central and southern Europe. The often practiced fortification of dairy products with vitamin D (400 IU/quart) in North American countries is probably responsible for much of this difference. The widespread consumption of fatty
fish provides an excellent source of dietary vitamin D for residents
of northern Europe and may explain the lower prevalence of vit D deficiency in this region compared with central and southern Europe.
Peters U., et al., Vitamin D,
Experimental studies suggest that vit D & ca
Persons (239) with histologically confirmed
With each 10 ng/ml ↑of serum 25-(OH)D, the risk of
Inverse association of serum 25-OH vit D [25-
Results provided limited evidence for a weak association between calcium
Study results suggested a protective effect for vitamin D on

2005 Dietary Guidelines Advisory Committee Report
Summary of vitamin D Intake and the Elderly Included: clinical trials, human, English, 1999-2004 Full Citation Design &
Duration & Objective
Population Methods Outcome Measures Results Statistics, Conclusions, & Comments
calcium, and vitamin D receptor polymorphism in colorectal adenomas. Cancer Epidemiol Biomarkers Prev 2001 Dec;10(12):1267-74.
protect against cancer by ↓ proliferation & inducing differentiation. Effects of vit D & ca may be mediated by the vit D receptor (VDR), which is encoded by the VDR gene. The present study investigated whether calcium intake & serum vit D, as an integrated measure of intake & endogenous production, were associated with risk of colorectal adenoma, known precursors of invasive colorectal cancer.
colorectal adenomas & 228 control individuals w/o colorectal adenomas
colorectal adenoma ↓ by 26% (odds ratio 0.74, 95% confidence interval 0.60-0.92).
(OH)D] w. colorectal adenoma.
intake & colorectal adenoma (odds ratio 0.97, 95% confidence interval 0.93-1.01 per ea 100-mg calcium intake). Inverse association of serum 25-(OH)D w. colorectal adenoma is suggested to be stronger in subjects w. calcium intake above the median (P for multiplicative interaction 0.13).
colorectal adenoma.
Vieth R, Chan PC & MacFarlane GD. 2001. Efficacy and safety of vitamin D (3) intake exceeding the lowest observed adverse effect level. Am J Clin Nutr 73:288-294.
Randomized Clinical Controlled Trial 95 mcg vit D/d is the lowest observed adverse effect level. Objective was to assess the efficacy & safety of prolonged vit D3 intakes of 25 & 100 mcg (1000 & 4000 IU)/d. Subjects were randomly assigned to receive either 25 or 100 mcg vit D3/d for 2-5 mo, starting between January & February.
Healthy ♂ and ♀ (n = 61) aged 41 +/- 9 y (mean +/- SD)
Efficacy was based on the lowest serum 25(OH)D concentration achieved by subjects taking vit D3; potential toxicity was monitored by measuring serum calcium concentrations & by calculating urinary calcium-creatinine ratios. Serum 25(OH)D was measured by radioimmunoassay.
Baseline serum 25(OH)D was 40.7 +/- 15.4 nmol/L (mean +/- SD). From 3 mo on, serum 25(OH)D plateaued at 68.7 +/- 16.9 nmol/L in the 25-mcg/d grp & at 96.4 +/- 14.6 nmol/L in the 100-mcg/d grp. Summertime serum 25(OH)D concentrations in 25 comparable subjects not taking vit D3 were 46.7 +/- 17.8 nmol/L. The min & max plateau serum 25(OH)D concentrations in subjects taking 25 & 100 mcg vit D3/d were 40 & 100 nmol/L & 69 & 125 nmol/L, respectively. Serum calcium & urinary calcium excretion did not change significantly at either dosage during the study.
100 mcg/d dosage of vitamin D3 effectively ↑ 25(OH)D to high-normal concentrations in practically all adults & serum 25(OH)D remained w/in the physiologic range. Intake of 100 mcg vit D3/d is considered to be safe.
Peacock, M., et al., Effect of Calcium or 25OH Vitamin D3 Dietary Supplementation on Bone Loss at the Hip in Men and Women
Clinical trial, randomized, double-blind, placebo-controlled trial Dietary supplements prevent bone loss @ the hip, can be applied safely
Elderly volunteers- 316 ♀ had a mean age of 73.7 yr 122 ♂ had a mean age of 75.9 yr Franklin, Indiana Subjects were excluded if
Baseline median calcium intake was 546 mg/day, and median serum 25OH vitamin D3 was 59 nmol/L. serum 25OH vitamin D concentration (<60 nmol/L & >60 nmol/L), & dietary
Bone mineral density (BMD) was measured by dual x-ray absorptiometry & bone structure by
On placebo, loss of BMD at total hip was 2% and femoral medulla expansion was 3% over 4 yr. Calcium reduced bone loss, secondary hyperparathyroidism, and bone turnover. 25OH vitamin D3 was intermediate between placebo and
Descriptive statistics for all variables were calculated. A calcium supplement of 750 mg/day prevents loss of BMD, reduces femoral medullary
32

2005 Dietary Guidelines Advisory Committee Report
Summary of vitamin D Intake and the Elderly Included: clinical trials, human, English, 1999-2004 Full Citation Design &
Duration & Objective
Population Methods Outcome Measures Results Statistics, Conclusions, & Comments
over the Age of 60*. J Clin Endocrinol Metab 2000;85:3011-3019.
in the elderly& are likely to reduce hip fractures. Bone loss @ the hip & other sites, bone turnover and calcium-regulating hormones were studied over 4 yrs. Institute of Medicine’s
recent recommendations- daily Adequate Intakes for ♂ & ♀ over 70 yr would be 1200 mg calcium and
15 µg (600 IU) vit D. Recommendations are largely based on studies in younger postmenopausal ♀. Recommendations do not address possible
interactions between calcium intake & vit D status.
they had a terminal illness; Paget’s disease of bone; recurrent urinary stone disease; had been treated w. sodium
fluoride, bisphosphonate, steroids, or dilantin; had renal disease requiring specific tx; or were excluded by their primary physician. Low BMD, previous skeletal fx, & estrogen replacement therapy were not reasons for exclusion.
calcium intake (<480 mg/day & >480 mg/day) Assessment of dietary calcium intake was available within 24 h & serum 25OH vit D concentration w/in 2 wks of baseline visit. Subjects were randomized into the study over a 17-month period. Subjects were seen every 6 months, had BMD measured, blood & urine collected, & questionnaire data
gathered. Radiographs were performed Q 12 months. At each clinic visit, fresh supplement & placebo were supplied, returned tablets & capsules recorded. Calcium supplement was given as calcium citrate malate. Tablets containing 250 mg elemental calcium or placebo & capsules containing 5 µg 25OH vit D3
or placebo (Bone Care) were taken three times/d w. meals. 25OH vit D3 content of capsules was analyzed every 6 mos. No significant ↓ seen over the 4 yrs. Placebos were of the same shape, color, and consistency as the active supplements.
radiographs. Calcium biochemistry and bone turnover markers were measured in blood and urine. Bone Mass Bone Structure Blood and urine biochemistry Fractures Diet history
calcium.
expansion, secondary hyperparathyroidism, and high bone turnover. A supplement of 15 mcg/day 25OH vit D3 is less effective, and because its effects are seen only at low calcium intakes, suggests that its beneficial effect is to reverse calcium insufficiency. The effect of a vitamin D supplement is less marked & is most beneficial in subjects who are vit D & calcium insufficient. A concerted effort is required to educate the elderly to take 1.2 g/day of calcium in the diet, to maintain their serum 25OH vit D above the vit D insufficiency level of 75 nmol/L w. expectations that this will reduce the incidence of fractures, particularly hip fx.
Dawson-Hughes, B., et al., Effect of withdrawal of calcium and vitamin D supplements on bone mass in elderly men and women.
Clinical Trial Randomized Controlled Trial Subjects completed a 3-y randomized, placebo-controlled trial of calcium &
295 healthy elderly ♂♀ Age: >68 y
Hip scans were performed in duplicate, with repositioning between scans, and the values were averaged. A phantom of bone ash embedded in a 12.0-cm block was scanned
BMD was measured by dual-energy X-ray absorptiometry & biochemical variables related to calcium metabolism and bone turnover were measured.
In the 128 ♂, supplement-induced ↑’es in spinal & femoral neck BMD were lost w/in 2 y of supplement d/c, but small benefits in total-body BMD remained. In the 167 ♀, there were no lasting benefits in total-body BMD or at any
Comparisons between the study groups were made w. two-sample
t-tests and w. analysis of covariance when adjustments were required. Within-group changes in selected variables between the beginning & end of
33

2005 Dietary Guidelines Advisory Committee Report
Summary of vitamin D Intake and the Elderly Included: clinical trials, human, English, 1999-2004 Full Citation Design &
Duration & Objective
Population Methods Outcome Measures Results Statistics, Conclusions, & Comments
AJCN 2000;72:745-50.
vit D supplementation & were followed for an additional 2 y during which no study supplements were given. Determine whether gains in BMD induced by calcium & vit D supplementation persist after supplement withdrawal.
bimonthly & measurements
were stable throughout the study.
BMC was measured with the same scanner and had a CV of 1.2%. Blood was drawn Serum osteocalcin was measured by immunoradiometric
assay as was serum intact PTH. The interassay variation of these 2 measures was 4–5%. For each analysis, baseline (36 mo) and final (30 mo) samples were analyzed at the same time. Questionnaires used to obtain medical hx. Dietary calcium & vit D intakes were assessed with food-frequ. questionnaire. Activity, ht & wt were recorded. Vertebral fractures were verified by X-ray reports or medical records.
bone site. Consistent w. observations on BMD, bone turnover rates in both ♂ and ♀ (as measured by serum osteocalcin concentrations) returned to their original higher concentrations
w/in the same 2-y period.
the study were examined with paired t-tests. Potential interactions of selected variables w. BMC were examined in multiple regression analyses. Statistical tests were conducted at the two-tailed 0.05 level. Discontinued calcium & vit D supplementation has limited cumulative effect on bone mass in ♂♀ aged 68 y.
Need, A., et al., Vitamin D status: effects on parathyroid hormone and 1,25-dihydroxyvitamin D in postmenopausal women. AJCN 2000;71:1577-81.
Cross-sectional study To study relations between
serum PTH, vit D metabolites & other calcium-related variables because low 25(OH)D concentrations commonly found in elderly & associated w. hip fx. Tx with vit D & calcium can reduce the risk of fx.
496 postmenopausal ♀ w/o vertebral fx Median age: 62 y (range: 35–88 y) Median weight: 66 kg (range: 40–120 kg) Median height: 158 cm (range: 130–183 cm). Pt’s w. spinal fx, 1° hyperparathyroidis, Paget disease or receiving tx known to affect bone metabolism were excluded.
Investigations followed standard protocol. Drank 5 µCi of 45Ca in 250 mL H20 w. 20 mg Ca carrier. Blood sample collected - 1 h. Hourly
fractional rate of calcium absorption calculated from
radioactivity in blood.
Serum follicle-stimulating hormone concentration >20 IU/L. Physical examination: ht, wt, skinfold. Plasma calcium, albumin, globulins, bicarbonate, & anion gap measured; serum 25(OH)D by competitive protein binding; 1,25(OH)2D by HPLC and radioimmunoassay; intact PTH by immunometric
assay . Plasma ionized calcium (Ca2+) calculated by iterative computer program.
PTH significantly positively r/t age &
serum 1,25(OH)2D, inversely r/ t 25(OH)D & plasma ionized calcium. Step-like ↑ in PTH as serum 25(OH)D ↓ below 40 nmol/L. 25(OH)D concentrations >40 nmol/L, 1,25(OH)2D positively r/t 25(OH)D; 25(OH)D concentrations <40 nmol/L, the relation was the inverse. 25(OH)D concentrations <40 nmol/L, 1,25(OH)2D most closely r/t PTH; 25(OH)D concentrations >40 nmol/L, 1,25(OH)2D most closely (inversely) r/t plasma creatinine. With serum 25(OH)D concentrations increasingly <40 nmol/L, serum 1,25(OH)2D becomes critically dependent on rising concentrations of PTH.
Data suggest, aging ♀ should maintain 25(OH)D concentrations >40 nmol/L (which is the lower limit of our normal range for healthy young subjects) for optimal bone health.
Skin thinning occurring by age, could be overcome by ↑ sunlight exposure. Alternatively, a small dose of oral vit D given regularly could have the same effect. Relations between PTH & other variables were examined by one-way analysis of variance & simple & multiple linear regression by using MINITAB.
34

2005 Dietary Guidelines Advisory Committee Report
Summary of vitamin D Intake and the Elderly Included: clinical trials, human, English, 1999-2004 Full Citation Design &
Duration & Objective
Population Methods Outcome Measures Results Statistics, Conclusions, & Comments
Means were compared by Student's t test for unpaired
samples. Pattanaungkul, S., et al., Relationship of Intestinal Calcium Absorption to 1,25-Dihydroxyvitamin D [1,25(OH)2D] Levels in Young Versus Elderly Women: Evidence for Age-Related Intestinal Resistance to 1,25(OH)2D Action.* J Clin Endo Metab 2000;85(11):4023-27.
To test for possible redux in intestinal sensitivity to 1,25(OH)2D action in elderly (compared with young) ♀ since intestinal calcium absorption ↓ with aging, but it is unclear whether this is attributable to an age-related intestinal resistance to 25(OH)2D action.
Age: elderly (mean 72.5 ± 3.0 yr) vs. Young ♀ (mean 28.7 ± 5.3 yr n = 20 per group
Assessed in vivo dose response of active intestinal calcium absorption to a broad range of circulating 1,25(OH)2D levels in elderly vs young. 5 subgroups: 1. given a high calcium intake of 75mmol/d suppressing 1,25(OH)2D levels; 2. given a normal calcium diet of 15–30 mmol/day representing
basal 1,25(OH)2D levels; 3. given a low-calcium diet of 5 mmol/day to stimulate endogenous1,25(OH)2D production; 4. given the low-calcium diet + 1 µg/day 1,25(OH)2D; 5. given a low-calcium diet + 2 µg/day
1,25(OH)2D.
After 7 days of diet &/or 1,25(OH)2D tx, fasting fractional calcium absorption (FCA) was assessed by double-tracer method using stable calcium isotopes. Serum
1,25(OH)2D & vit D-binding protein levels were measured concurrently, & the free 1,25(OH)2D index [molar ratio of 1,25(OH)2D to DBP] was calculated.
FCA significantly correlated w. free 1,25(OH)2D index in the young (R = 0.63, P = 0.003) but not in the elderly ♀ (R = 0.27, P = 0.25). Moreover, the slope of the relationship between FCA and free 1,25(OH)2D index (representing intestinal sensitivity to 1,25(OH)2D) was significantly ↑ in the young (compared with the elderly) ♀ [mean ± SEM, 0.15 ± 0.04 (young) vs. 0.03 ± 0.02, elderly, P = 0.03].
Paired t tests used to determine
significance, between young & elderly subjects in ea group. Results were significant P < 0.05. Pearson’s correlation coefficient used. Linear regression used to
assess the relationship between 1,25(OH)2D & free 1,25(OH)2D
index [molar ratio of 1,25(OH)2D to DBP] and FCA in the young
and elderly ♀. Bivariate linear regression models used to simult. assess impact of 1,25(OH)2D or the free 1,25(OH)2D index and 25(OH)D on FCA. Elderly ♀ have a resistance to 1,25(OH)2D action that may
contribute to their neg. calcium balance, 2° hyperparathyroidism & bone loss.
Glerup, H., et al., Commonly recommended daily intake of vitamin D is not sufficient if sunlight exposure is limited. J Int Med 2000;247:260-268.
Cross-sectional study. Sunlight exposure of the skin is known to be the most important source of vit D. To est vit D status amongst sunlight-deprived individuals (veiled Arab ♀, veiled ethnic Danish Moslem ♀ and Danish controls) To est oral intake of vit D nec to keep a normal vit D status in sunlight-deprived individuals.
Randomly selected 69 Arab ♀ (60 veiled, 9 non-veiled) & 44 age-matched Danish controls were randomly selected amongst patients contacting the primary health care centre for reasons other than vit D deficiency. Ten ethnic Danish Moslem women were included through a direct contact with their community.
food intake analysis Serum levels of 25-hydroxyvitamin D were used as estimates of vitamin D status. Intact parathyroid hormone (PTH) was used to control for secondary hyperparathyroidism. Alkaline phosphatase and bone-specific alkaline phosphatase were used as markers for osteomalacic bone involvement. Oral intake of vitamin D and calcium were estimated through a historical food intake interview performed by a trained clinical dietician.
Veiled Arab ♀ w. low values of 25-hydroxyvitamin D: 7.1 ± 1.1 nmol L1, compared with 17.5 ± 2.3 (P < 0.002) in ethnic Danish Moslems & 47.1 ± 4.6 (P < 1017) in Danish controls. PTH was ↑ amongst veiled Arab ♀: 15.6 ± 1.8 pmol L1, compared with 5.7 ± 1.4 in ethnic Danish Moslems & 2.7 ± 0.3 (P < 106) in Danish controls. Vit D intake (including food supplementation) was very low amongst Arab ♀: 1.04 µg day1, compared w. 13.53 amongst ethnic Danish Moslems & 7.49 amongst Danish controls (P < 0.0005).
Severe vit D deficiency is prevalent amongst sunlight-deprived individuals living in Denmark. In veiled Arab ♀, vit D deficiency is the result of a combination of limitations in sunlight exposure & low oral intake of vit D. Oral intake of vit D amongst veiled ethnic Danish Moslems was, however, very high, at 13.53 µg (approximately 600 IU), but they were still vit D-deficient. Results suggest daily oral intake of vit D in sunlight-deprived individuals should exceed 600 IU; most probably it should be 1000 IU day1 to secure a normal level of 25-hydroxyvitamin D.
35

2005 Dietary Guidelines Advisory Committee Report
Summary of vitamin D Intake and the Elderly Included: clinical trials, human, English, 1999-2004 Full Citation Design &
Duration & Objective
Population Methods Outcome Measures Results Statistics, Conclusions, & Comments
This finding is in contrast with the commonly used RDA for adults in Europe: 200 IU day1.
Platz E.A., et al., Plasma 1,25-dihydroxy- and 25-hydroxyvitamin D and adenomatous polyps of the distal colorectum. Cancer Epidemiol Biomarkers Prev 2000 Oct;9(10):1059-65.
1,25(OH)2D inhibits proliferation & promotes differentiation of human colon cancer cell lines. Epidemiological findings, suggest an inverse relationship between vit D intake & colorectal cancer & adenoma, colorectal cancer precursor lesions. Evaluated the relationship of plasma 1,25(OH)2D & 25(OH)D w. distal colorectal adenoma.
326 matched case & control pairs (nested in the prospective Nurses' Health Study), who provided blood in 1989-1990 & who underwent endoscopy in 1989-1996.
Plasma vitamin D metabolite concentrations were determined blindly by RIA. Odds ratios (ORs) and 95% confidence intervals (CIs) were estimated from multiple conditional logistic regression models.
Mean plasma 1,25(OH)2D & 25(OH)D levels did not significantly differ (P = 0.3 and 0.7, respectively) between cases (31.6 +/- 8.4 pg/ml & 26.4 +/- 10.6 ng/ml, respectively) & controls (32.2 +/- 8.6 pg/ml & 26.8 +/-10.2 ng/ml, respectively). However, ♀ whose plasma 1,25(OH)2D concentration was below 26.0 pg/ml were at increased risk of distal colorectal adenoma (OR, 1.58; 95% CI, 1.03-2.40). Compared w. the lowest 1,25(OH)2D quartile, ♀ in the second (OR, 0.64; 95% CI, 0.41-1.02), third (OR, 0.80; 95% CI, 0.50-1.30), or upper (OR, 0.71; 95% CI, 0.43-1.15) quartiles were at a statistically nonsignificant lower risk of adenoma. The relationship was stronger for large/villous adenoma & among those with consistent vitamin D intake over the 10 years prior to blood draw. Compared w. ♀ in the lowest quartile, for plasma 25(OH)D, ♀ in the second (OR, 0.64; 95% CI, 0.41-1.00) and third (OR, 0.58; 95% CI, 0.36-0.95) quartiles were at a statistically significantly lower risk of distal colorectal adenoma, but there was no difference in risk in the top quartile (OR, 1.04; 95% CI, 0.66-1.66).
Women who have low levels of circulating 1,25(OH)2D may be at higher risk of distal colorectal adenomas, but additional study is warranted.
Harris, S., et al., Plasma 25-Hydroxyvitamin D Responses of Younger and Older Men to Three Weeks of Supplementation
Clinical Trial Randomized Controlled Trial February – 3 wks To compare ∆’es in
9 younger ♂(22-28 yrs) 9 older ♂ (65-73 yrs)
Self-reported vit D intakes <
200 IU/d were enrolled in & randomized to 1800 IU/d of ergocalciferol (vitamin D2, n=11) or to a control group (n=7) & followed for 3 wks.
Blood was collected at baseline, and after one, two & three weeks for measurement of plasma
concentrations of total 25(OH)D, 25(OH)D2 & 25(OH)D3.
Both younger & older supplemented ♂, 25(OH)D2 & total 25(OH)D concentrations ↑ significantly during
the study, whereas values of these metabolites did not change in younger or older control subjects. No group showed significant changes in
Data are consistent with an age-related decline in the absorption, transport or liver hydroxylation of orally-consumed vitamin D.
36

2005 Dietary Guidelines Advisory Committee Report
Summary of vitamin D Intake and the Elderly Included: clinical trials, human, English, 1999-2004 Full Citation Design &
Duration & Objective
Population Methods Outcome Measures Results Statistics, Conclusions, & Comments
with 1800 IU/day of Vitamin D. JACN 1999;18(5):470-474.
plasma 25(OH)D levels of younger & older ♂ after 3 weeks of oral vit D supplementation.
25-hydroxyvitamin D3. There was a significant interaction between age group & supplement group, suggesting that the effect of vit D2 supplementation on changes in 25(OH)D2 changes w. age. The mean ↑ in 25(OH)D2 was ↑ in the younger supplemented ♂ than in the older supplemented ♂ (37±9 nmol/L vs. 19.5 nmol/L, p=0.027), & this
accounted for their significantly ↑ increase in total 25(OH)D.
Thomas MK, et al., Hypovitaminosis D in medical inpatients. The New England Journal of Medicine 338:777-783, 1998.
Vitamin D deficiency is a major risk factor for bone loss & fx. To detect vit D deficiency among hospitalized pt’s.
290 consecutive pt’s on a general medical ward.
Assessed vit D intake, ultra-violet light exposure, & risk factors for hypovitaminosis D.
Measured serum 25-OH vit D, PTH, & ionized calcium.
164 pt’s(57%) were considered vit D deficient. 65 (22%) were considered severely vit D deficient. Vit D concentrations were related inversely to PTH. Low vit D intake, less UV exposure, anti-convulsant drug tx, renal dialysis, nephrotic syndrome, HTN, DM, winter season, ↑ PTH levels and alkaline phosphatase, and ↓ ionized calcium and albumin were signif. univariate predictors of hypovitaminosis D.
Hypovitaminosis D is common in general medical inpatients, including those w. vit D intakes exceeding the RDA & those w/o apparent risk factors for vit D deficiency.
Dawson-Hughes B, et al., Effect of calcium and vitamin D supplementation on bone density in men and women 65 years of age or older. N Engl J Med 1997 Sep 4;337(10):670-6.
Clinical Trial Randomized Controlled Trial Inadequate dietary intake of calcium & vit D may contribute to the high prevalence of osteoporosis among older persons.
176 men & 213 women 65 years of age or older who were living at home.
Studied effects of 3 years of dietary supplementation w. ca & vit D on bone mineral density, biochemical measures of bone metabolism, & the incidence of nonvertebral fractures. Either 500 mg of calcium plus 700 IU of vit D3 (cholecalciferol) per day or placebo were given.
Bone mineral density was measured by dual-energy x-ray absorptiometry, blood & urine were analyzed q 6 months, & cases of nonvertebral fx were ascertained by means of interviews & verified w. use of hospital records.
Mean (+/-SD) changes in bone mineral density in the calcium-vit D & placebo groups were as follows: femoral neck, +0.50+/-4.80 & -0.70+/-5.03%,respectively (P=0.02); spine,+2.12+/-4.06 & +1.22+/-4.25% (P=0.04); & total body, +0.06+/-1.83 & -1.09+/-1.71% (P<0.001). The difference between the calcium-vit D & placebo groups was significant at all skeletal sites after 1 yr, but was significant only for total-body bone mineral density in the 2nd & 3rd yrs. Of 37 subjects who had nonvertebral frx, 26 were in the placebo group & 11 were in the calcium-vit D group (P=0.02).
In ♂ and ♀ 65 yrs of age or older who are living in the community, dietary supplementation w. calcium & vit D moderately reduced bone loss measured in the femoral neck, spine, & total body over the 3-year study period & reduced the incidence of nonvertebral fractures.
37

2005 Dietary Guidelines Advisory Committee Report
38
Summary of vitamin D Intake and the Elderly Included: clinical trials, human, English, 1999-2004 Full Citation Design &
Duration & Objective
Population Methods Outcome Measures Results Statistics, Conclusions, & Comments
Tangrea J., et al, Serum levels of vitamin D metabolites and the subsequent risk of colon and rectal cancer in Finnish men. Cancer Causes Control 1997 Jul;8(4):615-25.
Experimental and human epidemiologic data suggest a protective role for vit D in large bowel cancer. Conducted a nested case-control study w/in a Finnish clinical trial cohort.
Cases (n = 146) were participants diagnosed w. primary adenocarcinoma of the large bowel. Controls were matched (2:1) to cases on age, date of baseline blood draw & study clinic.
Prediagnostic serum levels of the vit D metabolites, 25-OH D & 1,25-DIOH D were used as primary exposure measures.
The baseline geometric-mean serum level of 25-OH D was 11.6% lower in cases than in controls (12.2 cf 13.8 ug/l, P = 0.01) while serum levels of 1,25-DIOH D did not differ by case-control status. No association was seen between serum levels of 1,25-DIOH D & lg bowel cancer risk. Est. relative risk (RR) of lg bowel cancer ↓ w. ↑ level of serum 25-OH D & association was more pronounced for rectal cancer (55 cases; RR by quartile = 1.00, 0.93, 0.77, 0.37; trend P = 0.06). Neither exclusion of early cases nor multivariate adjustment for potential confounders materially altered these estimates.
There was no evidence of effect modification by level of 1,25-dihydroxyvitamin D or with other known risk-factors for large bowel cancer.
Chapuy MC, Prevalence of vitamin D insufficiency in an adult normal population. Osteoporosis International 7:439-443, 1997.
Vitamin D insufficiency has been shown to be very common in the elderly. Vit D status of a general adult urban population was estimated.
Nov to Apr 1569 subjects 20 French cities 9 geographic regions
In healthy adults, 14% of subjects exhibited 25 OH vit D values < 30 nmol/l—lower limit for adults measured in winter.
Lowest 25-OH vit D levels found in northern regions & the greatest in the south.
Adults living in Urban areas lacked direct sunlight exposure & had failed diet -- inadequate amts of vit D. May need to consider winter supplementation with low doses of vit D.
Barger-Lux, M., et al., An Investigation of Sources of Variation in Calcium Absorption Efficiency. J Clin Endo Metab 1995; 80:406-411.
Clinical Trial Randomized Controlled Trial To examine putative sources of interindividual variation in calcium absorption efficiency
41 healthy premenopausal ♀ Mean age: 36.4 yr
Half randomized to pretreatment w. 20 mcg/d supplemental 25OHD for approx 34 days before testing.
Measured dietary factors, humoral regulators, intestinal motility, mucosal histology, mucosal vit D receptor levels, & calcium absorption efficiency.
In winter tests, but not in summer tests, calcium absorption fraction was significantly higher in pretreated group (mean, 0.465 vs. 0.387). Serum 25OHD, intestinal transit, & urinary calcium to creatinine ratio were all significantly & positively correlated to calcium absorption efficiency. However, neither level of 1,25-dihydroxyvitamin D receptors in duodenal mucosa nor circulating 1,25-dihydroxyvitamin D was related to calcium absorption efficiency.
These findings, which are consistent with other published human data, suggest that 25OHD plays a more prominent role in the regulation of calcium absorption than is generally believed. In a multiple regression model, serum 25OHD, mouth to cecum transit time, and fasting urinary calcium/creatinine ratio explained 44% of the observed variation in calcium absorption efficiency.
Chapuy M.C., et al., Vitamin D3 and calcium to prevent
Clinical Trial; Controlled Clinical Trial Hypovitaminosis D & a ↓
3270 healthy ambulatory women (mean [+/- SD] age, 84 +/- 6 yrs).
Studied effects of suppl w. vit D3 (cholecalciferol) & ca on freq of hip fx & other
Measured serial serum PTH & 25(OH)D concentrations in 142
Among ♀ who completed the 18-mth study, the # of hip fx was 43% lower (P = 0.043) & the total # of
Supplementation with vit D3 & ca ↓ the risk of hip fx & other nonvertebral fx among

2005 Dietary Guidelines Advisory Committee Report
39
Summary of vitamin D Intake and the Elderly Included: clinical trials, human, English, 1999-2004 Full Citation Design &
Duration & Objective
Population Methods Outcome Measures Results Statistics, Conclusions, & Comments
hip fractures in the elderly women. N Engl J Med 1992 Dec 3;327(23):1637-42.
ca intake contribute to ↑ PTH function in elderly persons. Ca & vit D suppl ↓ this 2° hyperparathyroidism, but whether such supplements ↓ the risk of hip fx among elderly people is not known.
nonvertebral fx, identified radiologically. Ea day for 18 mths, 1634 ♀ received tricalcium phosphate (1.2 g of elemental ca) & 20 mcgs (800 IU) vitD3, & 1636 ♀ received a double placebo.
♀ & determined the femoral bone mineral density at base line & after 18 mths in 56 ♀.
nonvertebral fx was 32% lower (P = 0.015) among the ♀ tx w. vit D3 & ca than among those who received placebo. Results of analyses according to active tx & intention to treat were similar. In vit D3-ca group, mean serum PTH concentr ↓ by 44% from base-line value @ 18 mths (P < 0.001) & serum 25(OH)D concentr ↑ by 162% over base-line value (P < 0.001). Bone density of proximal femur ↑ 2.7% in vit D3-calcium grp & ↓ 4.6% in placebo grp (P < 0.001).
elderly ♀.
Dawson-Hughes, B., et al., Effect of Vitamin D Supplementation on Wintertime and Overall Bone Loss in Healthy Postmenopausal Women. Ann Int Med 1991;115:505-512.
Clinical Trial; Randomized Controlled Trial; Double-blind, placebo-controlled, 1-year trial in 249 ♀. See methods for duration. To determine whether relative vit D deficiency during winter months contributes to age-related bone loss & whether rates of change in hard- & soft-tissue mass vary during the year.
Healthy, ambulatory postmenopausal ♀ with usual intakes of vit D of 100 IU/d.
Equal numbers of ♀ were randomized to either placebo or 400 IU of vit D/d. All ♀ received 377 mg/d of supplemental ca largely as ca citrate malate. Period 1 was June-July to Dec-Jan & period 2 was Dec-Jan to the next June-July. Serum PTH & plasma 25-OH vit D levels were measured during periods 1 and 2.
Duplicate spine & whole-body scans were done by dual energy x-ray absorptiometry @ 6-month intervals that were timed to periods when 25-OH vit D levels were highest & lowest.
In placebo group, spinal bone mineral density ↑ in period 1, ↓ in period 2, and sustained no net change. ♀ treated w. vit D had a similar spinal ↑ in period 1 (1.46% compared w. 1.40% in placebo), less loss in period 2 (-0.54% compared w. -1.22%, CI for the difference, 0.05% to 1.31%, P = 0.032) & significant overall benefit (0.85% compared w. 0.15%, CI for the difference, 0.03% to 1.37%, P = 0.04). In period 2, 25-hydroxyvit D levels were ↓ & PTH levels were ↑ in the placebo than in the vit D group. Whole-body lean & fat tissue & bone mineral density varied during the year but did not change overall.
At latitude 42°, healthy postmenopausal ♀ with vit D intakes of 100 IU/d can significantly ↓ late wintertime bone loss & improve net bone density of the spine over 1 yr by increasing intake of vit D to 500 IU/d. A long-term benefit of preventing vit D insufficiency in the winter seems likely although it remains to be shown. Observed changes in bone as well as in fat & lean tissue appear to be related to season.
Holick MF, Matsuoka LY, Wortsman J. Age, vitamin D, and solar ultraviolet. Lancet 4;2(8671):1104-1105, 1989.
Holick MF. The photobiology of vitamin D and its consequences for

2005 Dietary Guidelines Advisory Committee Report
Summary of vitamin D Intake and the Elderly Included: clinical trials, human, English, 1999-2004 Full Citation Design &
Duration & Objective
Population Methods Outcome Measures Results Statistics, Conclusions, & Comments
40
humans. Annals of the New York Academy of Sciences 453:1-13, 1985. Reviews/Letters
Hollis B.W. and Wagner C.L. Assessment of dietary vitamin D requirements during pregnancy and lactation. Am J Clin Nutr 2004 May;79(5):717-26.
Vit D concerns have resurfaced in medical & scientific literature since the prevalence of vit D deficiency in the US, particularly among darkly pigmented persons, has ↑’ed. Goal was to discuss past & current literature & to reassess DRI for vit D in adults, w. particular focus on ♀ during pregnancy & lactation. The appropriate dose of vit D during pregnancy & lactation is unknown, although it appears to be > the current DRI of 200-400 IU/d (5-10 micro g/d).
Doses of </= 10 000 IU vitamin D/d (250 micro g/d) for up to 5 mo do not ↑ circulating 25-OH vit D to concentrations > 90 ng/mL, whereas doses < 1000 IU/d appear, in many cases, to be inadequate for maintaining normal circulating 25-OH D concentrations of between 15 & 80 ng/mL.
Vit D plays no etiologic role in CVD, such as that observed in Williams syndrome. Animal models involving vit D intoxication that show an effect on cardiac disease are flawed & offer no insight into normal human physiology. Higher doses of vit D are necessary for a large segment of Americans to achieve concentrations equivalent to those in persons who live & work in sun-rich environments. Further studies are necessary to determine optimal vit D intakes for pregnant & lactating ♀ as a fxn of latitude & race.
Bischoff-Ferrari H.A., et al. Effect of Vitamin D on falls: a meta-analysis. JAMA. 2004 Apr 28;291(16):1999-2006.
Meta-Analysis Falls among elderly individuals occur frequently, ↑ with age, & lead to substantial morbidity/mortality. The role of vit D in preventing falls among elderly people has not been well established. To assess effectiveness of vit D in preventing an older person from falling.
Double-blind randomized, controlled trials (RCTs) of vit D in elderly populations (mean age, 60 yrs) that examined falls. Studies including pts in unstable health states were excluded. Five of 38 identified studies were included in the primary analysis & 5 other studies were included in a sensitivity analysis.
MEDLINE & the Cochrane Controlled Trials Register from January 1960 to February 2004, EMBASE from January 1991 to February 2004, clinical experts, bibliographies, & abstracts were used. Search terms included trial terms: randomized-controlled trial or controlled-clinical trial or random-allocation or double-blind method, or single-blind method or uncontrolled-trials with vitamin D terms:
Independent extraction by 3 authors using predefined data fields including study quality indicators.
Based on 5 RCTs involving 1237 participants, vitamin D reduced the corrected odds ratio (OR) of falling by 22% (corrected OR, 0.78; 95% confidence interval [CI], 0.64-0.92) compared with patients receiving calcium or placebo. From the pooled risk difference, the number needed to treat (NNT) was 15 (95% CI, 8-53), or equivalently 15 patients would need to be treated with vitamin D to prevent 1 person from falling. The inclusion of 5 additional studies, involving 10 001 participants, in a sensitivity analysis resulted in a smaller but still significant effect size
Vitamin D supplementation appears to reduce the risk of falls among ambulatory or institutionalized older individuals with stable health by more than 20%. Further studies examining the effect of alternative types of vitamin D and their doses, the role of calcium supplementation, and effects in men should be considered.

2005 Dietary Guidelines Advisory Committee Report
Summary of vitamin D Intake and the Elderly Included: clinical trials, human, English, 1999-2004 Full Citation Design &
Duration & Objective
Population Methods Outcome Measures Results Statistics, Conclusions, & Comments
cholecalciferol or hydroxycholecalciferols or calcifediol or dihydroxycholecalciferols or calcitriol or vitamin D/aa[analogs & derivates] or ergocalciferol or vitamin D/bl[blood]; & w. accidental falls or falls, & humans.
(corrected RR, 0.87; 95% CI, 0.80-0.96). Subgroup analyses suggested that the effect size was independent of calcium supplementation, type of vitamin D, duration of therapy, and sex, but reduced sample sizes made the results statistically nonsignificant for calcium supplementation, cholecalciferol, and among men.
Holick, M. Vitamin D: importance in the prevention of cancers, type 1 diabetes, heart disease, and osteoporosis. AJCN 2004;79:362-71
The recommended adequate intakes for vitamin D are inadequate, and, in the absence of exposure to sunlight, a minimum of 1000 IU vitamin D/d is required to maintain a healthy concentration of 25(OH)D in the blood.
Weaver, C. 2003 W.O. Atwater Memorial Lecture: Defining Nutrient Requirements from a Perspective of Bone-Related Nutrients. Am Soc Nut Sci J Nutr 2003;133:4063-4066.
Evidence to support the role of adequate calcium and vitamin D for bones is strong for the general population. The first line of treatment by clinicians for treating osteoporosis is to give calcium and vitamin D supplements. Have to assess the entire diet and give complete nutritional advice.
41

2005 Dietary Guidelines Advisory Committee Report
42
Summary of vitamin D Intake and the Elderly Included: clinical trials, human, English, 1999-2004 Full Citation Design &
Duration & Objective
Population Methods Outcome Measures Results Statistics, Conclusions, & Comments
Heaney, R. Long-latency deficiency disease: insights from calcium and vitamin D. EV McCollum Award Lecture. AMCN 2003;78:912-9.
Where the boundary between optimal and suboptimal serum 25(OH)D concentration may fall with respect to the emerging autocrine function of vitamin D is still quite unclear.
Heaney, R. and Weaver C., Calcium and vitamin D. Endo Metab Clin N Am 2003;32:181-194.
The quickest and safest way to achieve desired 25(OH)D levels is to supply 25(OH)D3 itself in a pharmacologic preparation. A dose averaging 10mcg/d suffices for most purposes.
Malabanan, A. and Holick, M., Vitamin D and bone health in postmenopausal women. J Womens Health (Larchmt) 2003;12(2):151-6.
Vit D intake between 500 and 800 IU/d w or w/o a calcium supplement, has been shown to ↑ bone mineral density (BMD) in ♀ with a mean age of approx 63 yrs. In ♀ older than 65, there is even more benefit with vit D intakes of between 800 and 900 IU/d and 1200-1300 mg of calcium/d w ↑ bone density, ↓ bone turnover, and ↓ nonvertebral fractures. There are insufficient available data supporting a benefit from vit D supplementation alone, w/o calcium, to prevent osteoporotic fracture in postmenopausal ♀.
Lehtonen-Veromaa, et al., Vitamin D and attainment of peak bone mass among peripubertal Finnish girls: a 3-y prospective study. AJCN 2002;76:144-53.
Letter to the Editor – Comments by RP Heaney Reply to RP Heaney
Cannot tell from study whether there was an association of vitamin D status and bone mass accumulation or at the least can not estimate its magnitude.
Janssen H.C., et al., Vitamin D deficiency,
Inadequate serum Elderly . Experimental studiesfound that vit D
Vit D suppl improved muscle strength, walking distance, &
Vit D deficiency is a condition that may cause muscle weakness in

2005 Dietary Guidelines Advisory Committee Report
Summary of vitamin D Intake and the Elderly Included: clinical trials, human, English, 1999-2004 Full Citation Design &
Duration & Objective
Population Methods Outcome Measures Results Statistics, Conclusions, & Comments
muscle function, and falls in elderly people. Am J Clin Nutr 2002 Apr;75(4):611-5.
vit D status is commonly seen in elderly people as the result of various risk factors interacting in this population. Apart from bone metab. This is also associated w. muscle weakness. Determine rationale behind vit D suppl in elderly to preserve/improve muscle strength & functional ability.
metabolites directly influence muscle cell maturation & functioning through a vit D receptor
functional ability & resulted in redux in falls & non-vertebral fx. In healthy elderly, muscle strength declined w. age & was not prevented by vit D suppl.
the elderly. Few intervention studies have been conducted, but available evidence indicates that vit D suppl preserves muscle strength in high risk gps-frail & mostly homebound. Additional research needed to further clarify to what extent vit D suppl can preserve muscle strength & prevent falls & fx in the elderly.
Pfeifer M., et al., Vitamin D and muscle function. Osteoporos Int 2002 Mar;13(3):187-94.
Current knowledge on the relation between vit D & muscle fxn. Molecular mechanisms of vit D action on muscle tissue have been known for many yrs& include genomic & non-genomic effects.
The skin has an enormous capacity for vit D production & supplies the body w. 80-100% of its vit D requirements. Age, latitude, time of day, season of the year & pigmentation can dramatically affect the production of vit D in the skin. Hypovitaminosis D is a common feature in elderly people living in northern latitudes & skin coverage has been established as an important factor leading to vit D deficiency.
Calcium & vit D supplements together might improve neuromuscular fxn in elderly persons who are deficient in ca & vit D. 800 IU of cholecalciferol in combination w. mg of elemental ca reduces hip fx & other non-vertebral fractures & should generally be recommended in individuals who are deficient in ca and vit D.
A serum 25-OH D level < 50 nmol/l has been associated w. ↑ body sway. Levels < 30 nmol/l w. ↓ muscle strength. Changes in gait, difficulties in rising from a chair, inability to ascend stairs & diffuse muscle pain are the main clinical symptoms in osteomalacic myopathy.
Given the strong interdependency of vit D deficiency, low serum calcium & high levels of PTH, however, it is difficult to identify exact mechanisms of action.
Lips P., Vitamin D deficiency and secondary
Vit D deficiency is common in the elderly, esp in housebound and in geriatric patients.
43

2005 Dietary Guidelines Advisory Committee Report
Summary of vitamin D Intake and the Elderly Included: clinical trials, human, English, 1999-2004 Full Citation Design &
Duration & Objective
Population Methods Outcome Measures Results Statistics, Conclusions, & Comments
hyperparathyroidism in the elderly: consequences for bone loss and fractures and therapeutic implications. Endocr Rev. 2001;22(4):477-501.
Prevention is feasible by UV light exposure, food fortification, and supplements. Vit D3 supplementation causes a ↓ of serum PTH concentration, a ↓ of bone turnover, and an ↑ of bone mineral density. Vit D3 & calcium may ↓ incidence of hip & other peripheral fractures. Vit D3 is recommended in housebound elderly, and may be cost-effective in hip fracture prevention in selected risk groups.
Prabhala A., et al., Severe myopathy associated with vitamin D deficiency in western New York. Arch Intern Med 2000 Apr 24;160(8):1199-203.
Case report 5 cases of severe myopathy associated w. vit D deficiency are described.
Ea pt was confined to a wheelchair b/c of weakness & immobility. 2 were elderly, 1 was a 37-yr-old Afric. Amer. w. type 1 dm, 1 was being treated for carcinoid syndrome, & 1 was severely malnourished due to poor oral intake.
Weakness had previously been attributed to other causes, including old age, concomitant diabetic neuropathy, or general debility. Correct dx was made initially by a high index of suspicion, following demonstration of clinical proximal myopathy; confirmation was made by demonstration of ↓ 25-OH D & ↑ PTHconcentrations. Tx with vit D caused resolution of body aches/pains & restoration of normal muscle strength in 4-6 wks.
4 pts became fully mobile & had normal 25-OH vit D concentrations, the 5th also became mobile. In the 4 fully recovered cases, PTH levels on f-up were ↓ but still ↑, suggesting a degree of autonomy of parathyroid secretion known to occur in cases of long-standing vit D deficiency.
Myopathy, due to chronic vit D deficiency, probably contributes toimmobility & ill health in a significant number of pts in the northern US. Awareness of this condition may significantly improve mobility & quality of life in pt populations vulnerable to vit D deficiency.
44

2005 Dietary Guidelines Advisory Committee Report
Summary of vitamin D Intake and the Elderly Included: clinical trials, human, English, 1999-2004 Full Citation Design &
Duration & Objective
Population Methods Outcome Measures Results Statistics, Conclusions, & Comments
Vieth, R., Vitamin D supplementation, 25-hydroxyvitamin D concentrations, and safety. AJCN 1999;69:842-56.
If vitamin D supplementation is intended to make up for what some people may not be getting from its natural source, the sun, then the current adult DRI of 200 IU/d is woefully inadequate.
Byrne, P., et al., Vitamin D Supplementation in the Elderly: Review of Saftely and Effectiveness of Different Regimes. Calcif Tissue Int 1995;56:518-520.
Vit D deficiency is common in the elderly, especially in countries where effective sunlight or exposure to sunlight is limited. Suggest that low dose continuous supplementation (10 to 20 mcgs/d) is the regime of choice but high-dose intermittent supplementation (2.5 mg six monthly) may be suitable where compliance is poor.
45

2005 Dietary Guidelines Advisory Committee Report
Literature Summary Table for Question on Physical Activity, Body Weight, and Health. Citation Country and
Date Study Type Subjects (N): sex, age at entry
Follow Up Assessment of Physical Activity
Statistical Adjustments
Main Effects of
PA Results Estimated PAL
Ball K, 2001. Associations of physical activity with body weight and fat in men and women. Int J of Obes. (Reviewed by IASO)
Australia, 1990
Cross-Sectional
1301 M & W (18-78 y)
Self reported PA (type, frequency, intensity, duration) performed for past 2 weeks.
Age, education +
% Overweight LTPA Men Women Sedentary 50 35 Low 42 27 High 34 20
Men Women 1.5 1.4 1.6 1.5 1.8+ 1.78+
Barefoot et al, 1998. Symptoms of depression and changes in body weight from adolescence to mid-life. Int J of Obes.
USA 1964-1966 Longitudinal 3885 M, 841 W
(mean 19 y) 21 y h/wk (questionnaire) at follow-up
BMI at entry, smoking, gender, depression
+ Exercise was negatively correlated with wt gain
Berkey C, 2000. Activity, Dietary Intake, and Weight Changes in a Longitudinal Study of Preadolescent and Adolescent Boys and Girls. Pediatrics
USA 1996-1997 Longitudinal
6149 Girls, 4620 boys ages 9-14
1y
youth physical activity questionnaire asking about 17 different pa's including intensity (how hard) and duration (h/wk)
race/ethnicity, baseline bmi, annual change in height, Tanner stage, age, energy, fiber and fat intake, screen time and # of pe classes
+
Larger increases in BMI from 1996-1997 were seen among girls who reported less physical activity (-0.0284 +/- 0.0142 kg/m2/hour/day; Beta +/- SE)
Bild et al, 1996. Activity, dietary intake, and weight changes in a longitudinal study of preadolescent and adolescent boys and girls. Pediatrics.
USA 1985-1986 Longitudinal
1100 M, 1096 F (18-36 y)
2 y
PA score (intensity and duration of PA at leisure and work)
Age, BMI, perception of fatness, physical fitness, education, smoking, diet, alcohol.
ns/- Low baseline PA predicted wt loss (OR = 0.05) in M. Change in PA was associated with wt change.
Ching 1996.Activity level and risk of overweight in male health professionals. Am J of Pub Health.
USA 1988-1990 Longitudinal
17,795 male health professionals
2
Harvard Alumni Survey asking h/wk over the past year of 9 different activities
Age and smoking and TV/VCR h/wk +
Baseline METS/wk RR of OW (BMI>27.8) </=6.9 1.0 >6.9 and </=14.5 1.01 (0.82, 1.24) >14.5 and </=25.3 0.80 (0.64, 1.00) >25.3 and </= 42.3 0.73 (0.58, 0.92) >42/3 0.81 (0.65, 1.01) Test for Trend P= .01
46

2005 Dietary Guidelines Advisory Committee Report
Coakley et al, 1998. Correlates and predictors of weight loss in youngg adults: the CARDIA study. Int J of Obes. (Reviewed by IASO)
USA 1986-92 Longitudinal 10,272 M
(44-54 y) 4
Vigorous PA (min/wk), TV/VCR watching (h/wk); questionnaire.
Age, diet, smoking, baseline values (including PA and TV/VCR use)
+
Vigorous LTPA Wt Increase(kg) Decrease <1.5 h/week 1.7 Maintain <1.5 h/week 1.1 Maintain > or =1.5 h/week 0.8 Increase > 1.5 h/week 0.2
1.5 1.6 1.7 1.8+
Crawford et al, 1999. Television viewing, physical activity and obesity. Int J of Obes.
Australia Longitudinal 176 M, 705 W(20-45 y) 3 y TV watching
Baseline BMI, obesityprevention treatment, age, education, baseline smoking, diet (multiple regression).
NS TV viewing at baseline, average TV viewing and change in TV viewing were not associated with wt change.
DiPietro, 1998. Improvements in Cardiorespiratory Fitness Attenuate Age-Related Weight Gain in Healthy Men and Women: The Aerobics Center Longitudinal Study. Int Jnl of Obesity.
1970-1994 Longitudinal 4599 Men and 724 Women Mean 7.5 y
Independent variable is change in fitness. PA/PAL not assessed (or not presented in study)
Age, height, baseline wt, baseline treadmill time, smoking, # of clinic visits, follow-up time
+
Improvements in fitness were associated with attenuating age-related weight gain. Estimated that for each minute improvement in treadmill time b/w the 1st and 2nd examination, significantly minimized wight gain by about 0.60 kg in both men and women and lowered the odds of a >/=5 kg and >/=10 kg gain by 14% and 21% respectively in men and by 9% and 21% respectively, in women over the 7.5 y follow-up
Duncan, 1991. Women walking for health and fitness. JAMA.
RCT102 Sedentary premenopausal women
24 weeks
Intervention groups walked 4.8 km/d, 5 days/wk at 8.0km/h, 6.4 km/h or 4.8 km/h
+
Change in body weight from baseline in brisk walkers (6.4km/h group) was different than controls. Change in body fat from baseline in strollers (4.8 km/h group) was different than controls.
Fogelholm et al, 2000. Predictors of weight change in middle-aged and old men. Obes Res.
Finland 1985-1995 Longitudinal 442 M (36-49
y) 10 y
Leisure PA score (intensity x duration x frequency).
Age, weight at age 20, weight at entry, chronic diseases, smoking, occupational class, diet, alcohol, marital status, former sports training.
+/ns
Increased PA was negatively associated (β = -2.23) with wt change. No association for decreased PA, continuous high PA or continuous low PA vs. wt change.
French et al, 1994. Predictors of weight change over two years among a population of working adults: the
USA Longitudinal 1639 M ,1913 W 2y
Habitual PA (times/week in each of 4 categories: moderate intensity, high intensity,
age, education level, occupation, marital status, treatment group, and smoking status or changes in
+
men: moderate pa group was negatively associated (β = -1.76) with weight change(p<.00001) vigorous pa group was negatively associated (β = -1.39) with weight
47
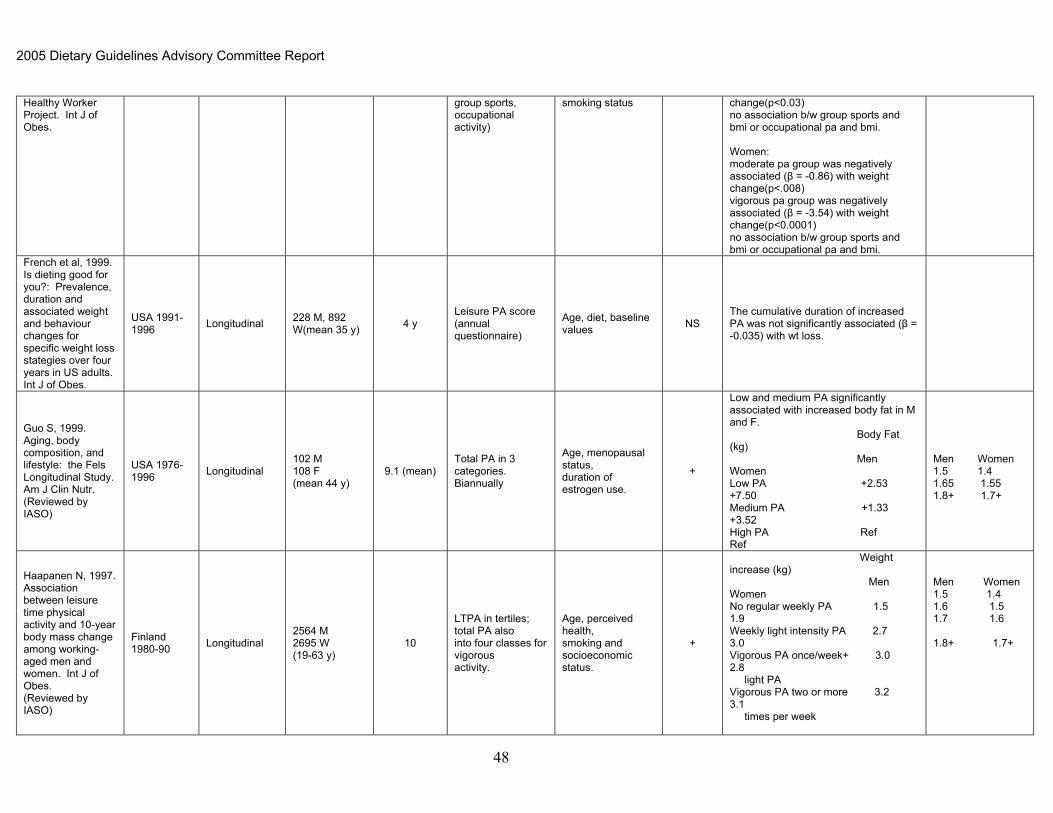
2005 Dietary Guidelines Advisory Committee Report
Healthy Worker Project. Int J of Obes.
group sports, occupational activity)
smoking status change(p<0.03) no association b/w group sports and bmi or occupational pa and bmi. Women: moderate pa group was negatively associated (β = -0.86) with weight change(p<.008) vigorous pa group was negatively associated (β = -3.54) with weight change(p<0.0001) no association b/w group sports and bmi or occupational pa and bmi.
French et al, 1999. Is dieting good for you?: Prevalence, duration and associated weight and behaviour changes for specific weight loss stategies over four years in US adults. Int J of Obes.
USA 1991-1996 Longitudinal 228 M, 892
W(mean 35 y) 4 y Leisure PA score (annual questionnaire)
Age, diet, baseline values NS
The cumulative duration of increased PA was not significantly associated (β = -0.035) with wt loss.
Guo S, 1999. Aging, body composition, and lifestyle: the Fels Longitudinal Study. Am J Clin Nutr. (Reviewed by IASO)
USA 1976-1996 Longitudinal
102 M 108 F (mean 44 y)
9.1 (mean) Total PA in 3 categories. Biannually
Age, menopausal status, duration of estrogen use.
+
Low and medium PA significantly associated with increased body fat in M and F. Body Fat (kg) Men Women Low PA +2.53 +7.50 Medium PA +1.33 +3.52 High PA Ref Ref
Men Women 1.5 1.4 1.65 1.55 1.8+ 1.7+
Haapanen N, 1997. Association between leisure time physical activity and 10-year body mass change among working-aged men and women. Int J of Obes. (Reviewed by IASO)
Finland 1980-90 Longitudinal
2564 M 2695 W (19-63 y)
10
LTPA in tertiles; total PA also into four classes for vigorous activity.
Age, perceived health, smoking and socioeconomic status.
+
Weight increase (kg) Men Women No regular weekly PA 1.5 1.9 Weekly light intensity PA 2.7 3.0 Vigorous PA once/week+ 3.0 2.8 light PA Vigorous PA two or more 3.2 3.1 times per week
Men Women 1.5 1.4 1.6 1.5 1.7 1.6 1.8+ 1.7+
48

2005 Dietary Guidelines Advisory Committee Report
Heitmann B, 1997. Are genetic determinants of weight gain modified by leisure-time physical activity? A prospecitve study of Finnish twins. Am J Clin Nutr. (Reviewed by IASO)
Finland 1975-81 Longitudinal
2110 M 2490 F (twin pairs) (18-39 years)
6 LTPA tertiles of METs
Age adjusted for all twins; Separate analyses of gene-PA interactions
+
PA at follow-up was significantly associated with wt change in group overall. BMI at follow-up Men Women Low PA 24.0 22.0 Moderate PA 24.0 21.8 High PA 23.6 21.7
Men Women 1.5 1.4 1.65 1.55 1.8+ 1.7+
Kahn, 1997. Stable behaviors associated with adults' 10-year change in body mass index and likelihood of gain at the waist. Am J Pub Health. (Reviewed by IASO)
USA 1982-92 Longitudinal
35,156 M, 44,080 W (mean 40 y)
10 y
Jogging, aerobics, tennis, gardening, and walking (h/wk).Both baseline and follow-up data were queried at follow-up.
Age, education, region of the country, BMI at age 18 y, marital status, diet, alcohol, smoking, menopausal status, estrogen use, parity.
+
Change in BMI Men Women Gardening/Mowing None Ref Ref 1-3 h/week -0.03 -0.09 > 4 h/week -0.11 -0.14 Walking None Ref Ref 1-3 h/week -0.01 -0.00 >4 h/week -0.8 -0.16
Men Women 1.5 1.4 1.6-1.7 1.5-1.6 1.8+ 1.7+ 1.5 1.4 1.6-1.7 1.5-1.6 1.8+ 1.7+
* Kawachi 1996. Can physical activity minimize weight gain in women after smoking cessation? Am J Pub Health 1996
USA 1986-88 Longitudinal
121,700 female nurses (40-75 y)
2 Questionnaire; MET-hours/wk were calculated.
# of cigarettes in 1986, baseline wt, wt change prior to baseline, ht in 1976, age in 86, intake of kcals, energy-adjusted alcohol intake, fat intake, whether hypertensive or with hypercholesterolemia.
+
Women who quit smoking and increased activity gained less weight than those who simply quit smoking over 2 yr. Compared with smokers, women who simply quit gained 2.3 kg more; those who quit and increased pa 8-16 METS/wk gained only 1.8 kg more over 2 yr (P < 0.05)
Klesges, 1992. A longitudinal analysis of the impact of dietary intake and physical activity on weight change in adults. Am J Clin Nutr.
USA Longitudinal 142 M, 152 W(mean 34 y) 2 y
Leisure Sportss PA and occupational PA score (Baeke PA scale) (data collected annually)
Baseline wt, diet, pregnancy, smoking, alcohol, family risk of obesity.
+/ns/-
Baseline work (β = -3.5) and leisure (β = -6.2) activity predicted wt loss in F but not in M. Baseline sports activity predicted wt gain in F (β = 3.0)and M (β = 1.9)
49

2005 Dietary Guidelines Advisory Committee Report
Koh-Banerjee, 2003. Prospective study of the association of changes in dietary intake, physical activity, alcohol consumption, and smoking with 9-y gain in waist circumference among 16,587 men. Am J Clin Nut.
USA 1987-1996 Longitudinal
16,587 male health professionals aged 40-75 at baseline in 1986
9y
METs/wk were assessed through a questionnaire assessing intensity and duration of different types of PA
age, baseline waist circumference, baseline BMI, baseline and changes in total calories and alcohol consumption and smoking
+
Increases of 25 METs h/wk in vigorous pa was associated with 0.38 cm decrease in waist circumference. (full results Table 4 on p724)
Lawlor D, 2002. Is housework good for health? Levels of physical activity and factors associated with activity in elderly women. Results from the British Women's Heart and Health Study. J of Epi and Comm Health.
England 1999-2000
Cross-Sectional
2341 women aged 60-79
Questionnaire assessing pa type (including housework and yardwork) and intensity and duration
health, smoking, ses +, ns
Women who participated in brisk walking for at least 2.5 hours / wk had reduced odds of being ow: OR 0.5 (95thCI 0.3-0.6) after adjusting for other forms of activity. Participating in at least 2.5 hours of heavy housework was not associated with reduced odds of being ow: OR 1.1 (0.8-1.4).
Lee I, 1993. Body weight and mortality: a 27-year follow-up of middle-aged men. JAMA. (reviewed by IASO)
USA 1962-88 Longitudinal
17,321 M (mean 46 years, Harvard Alumni)
12-16 years
Total PA by Paffenbarger quest. In KJ or METs
No relationship b/w total or vigorous activity and BMI
NS No relationship b/w total or vigorous activity and BMI
*Lewis C. Seven-year trends in body weight and associations with lifestyle and behavioral characteristics in black and white young adults: the CARDIA study. Am J Pub Health 1997
USA 1985-1993 Longitudinal 1823 men and
2083 women 7
Fitness assessed by treadmill test. PA score was determined from questionnaire asking about frequency and intensity of 13 common pa's
clinical center, baseline age and ow status, baseline total energy and alcohol intake, baseline pa and fitness, smoking status, parity, change in total energy, relative fat, and alcohol intake.
+
Decreases in fitness related to increased weight gain in both men and women. For each 1 minute decline in TMT, b = 1.5 kg for men and 2.1 kg for women (P <0.05) The association b/w self-reported pa and wt change was not significant.
Luke, 2002. Activity energy expenditure and adiposity among black adults in Nigeria and the United States
Nigeria (results of US participants not assessed prospectively)
Longitudinal
23 Nigerian women and 24 Nigerian men b/w ages 18-55
1y Doubly-labeled water (AEE)
body size (see p1047), age, site and gender
+
No significant associations seen (small sample size). Short-term wt change was negatively correlated with AEE and AEE divided by body weight in women.
50

2005 Dietary Guidelines Advisory Committee Report
Morris J, 1990. Exercise in leisure time: coronary attack and death rates. Br Heart J.(Reviewed by IASO)
UK 1976-1986 Longitudinal 2250 M (45-64
y) 9.33
y(mean) LTPA in four categories +
Vigorous PA % BMI > 27None 24Residual 18Less Frequent 14Frequent 10
1.61.71.81.9+
Owens et al, 1992. Can physical activity mitigate the effects of aging in middle-aged women? Circulation.
Longitudinal 500 F (42-50 y) 3 y
Leisure habitual PA (Paffenbarger questionnaire; kcal/wk)
Sex-hormone use, smoking, change inmenopausal status
+ Both baseline PA and increased PA were associated with less wt gain.
* Paeratakul S. Changes in diet and physical activity affect the body mass index of Chinese adults. Am J Pub Health 1998.
China 1989-1991 Longitudinal 3,484 working
adults 2y self reported occupational PA
biological and socio-economic factors?
+/ns
Increase activity related to attenuated weight gain in women only. For each categorical increase in occupational activity, b = -0.12 (P < 0.02)
Parker, 1997. Dietary factors in relation to weight change among men and women from two southeastern New England communities. Int J of Obes.
USA 1981-1993 Longitudinal 176 M, 289 W
(mean 47 y) 4 y
Participation in aerobic activity (dichotomous) at baseline.
age, smoking status, BMI, aerobic activity, and total energy.
NS
No association between baseline aerobic exercise and subsequent weight change (tertiles)
Rissanen et al, 1991. Determinants of weight gain and overweight in adult Finns. Eur J of Clin Nutr. (Reviewed by IASO)
Finland 1966-1972 Longitudinal 6165 M, 6504
F (25-62y) 5.7 y
(median)
Leisure PA at follow-up (questionnaire, 3 categories: frequent, occasional, rare)
Age, BMI, education, marital status, parity, smoking, alcohol, coffee, health status
+ PA at follow-up was inversely associated with wt gain in men and women
Men Women 1.5 1.4 1.65 1.55 1.8+ 1.7+
Schmitz, 2000. Physical activity and body weight: associations over ten years in the CARDIA study. Int J of Obes.
USA 1985-1996
Longitudinal (CARDIA study)
601 BM, 846 WM; 648 BM, 675 WM (18-30y at baseline)
10y
Leisure PA score (intensity x frequency)= exercise units.THIS SCORE DID NOT INCLUDE DURATION. Also, changes in PA were assessed
age, clinic site, education,smoking, alcohol intake, parity, percentage energy intake from fat, and changes in these variable over time.
+
Change in pa was inversely associated with change in body weight within all four race and sex subgroups (P<0.005). The predicted weight change associated with change in pa was 4-5x larger in participants who were ow at baseline. An increase in pa during 2-3y of follow-
51

2005 Dietary Guidelines Advisory Committee Report
and classified into 1 of 3 categories based on high intensity PA: decreases in high intensity PA; maintenance withing 100EU; and increases of 100 EU or more
up was associated with an attenuation of weight gain that was sustained through 5 y of follow-up whether or not the pa increase was maintained during the later years. The mean 5 y weight attenuation was 0.8-2.8 kg.
*Sesso H. Physical activity and coronary heart disease in men: the Harvard Alumni Health Study. Circulation 2000.
USA 1977-93 Longitudinal
12,516 M (mean age 58 years,Harvard Alumni)
16y Total PA by Paffenbarger quest.In KJ/week
None NS
BMI's Total PA (MJ week) 24.7 <2.1 24.0 2.1-4.2 24.4 4.2-8.4 24.4 8.4-12.6 24.4 ≥12.6
1.41.4-1.51.5-1.61.6-1.7 ≥1.7
Sherwood, 2000. Predictors of weight gain in the Pound of Prevention Study. Int Jnl of Obesity.
USA
RCT -2 groups control group or educational group
826 W; 218 M ages 20-45y 3y
Physical Activity History Questionnaire (frequency of 4 categories of PA: high intensity, moderate intensity, group and racquet sports and occupational PA
time, age, smoking status, treatment group, and treatment by time interaction
+
In men, the prospective association b/w PA and body weight was statistically significant primarily due to an inverse association b/w change in high-intensity pa and change in body weight. An increase of one 20 minute high-intensity exercise session per week was associated wit a decreas in weightof 0.54 kg (p399). In women, prospectively, higher levels of high-intensity, moderate-intensity and occupational pa are inversely associated with decreases in body weight over time (p400).
Taylor et al, 1994. Effects of life-style on body mass index change. Epi.
USA 1980-1989 Longitudinal 568 M, 668 W
(20-60 y) 7 y
Moderate and heavy PA, TV watching (h/day)
Age, smoking, sex + Increase PA (compared to stable or decreased PA) was associated with less wt gain
Thune et al, 1998. Physical activity improves the metabolic risk profiles in men and women. Arch Intern Med. (Reviewed by IASO)
USA 1982-92 Longitudinal
5220 M 5869 W (20-49 y)
7 LTPA at baseline and follow-up four categories
Age, smoking, coffee, dietary fat, menopausal status
+
Sustained high or increased PA was associated with less WG during follow-up period BMI Men Women Sedentary 25.7 23.6 Moderate 25.0 23.5 Hard 24.5 23.1 Very Hard 23.9
Men Women 1.5 1.4 1.6 1.5 1.75 1.65 2.0+
Tremblay 1994. Impact of Exercise Canada, Intervention:
2grps 13 men and 14 women (18- 15-20 wks The total energy
cost of each Despite its lower energy costs, the HIIT program induced a more pronounced
52

2005 Dietary Guidelines Advisory Committee Report
53
Intensity on Body Fatness and Skeletal Muscle Metabolism. Metabolism
1) 20 wk ET (endurance program -20.4 MJ) 2) 15 wk HIIT (high-intensity intermittant-training -57.9 MJ)
32y) training programwas estimated by referring to VO2 max and maximal work-output measurements.
reduction in sc adiposity compared to the ET program.
*Voorrips L. History of body weight and physical activity of elderly women differing in current physical activity. Int J of Obes 1992.
Netherlands Retrospective cohort
45 older women (mean age 71)
Recall back to 12 years
of age.
recall of pa and wt at ages 12, 25, 40, and 55 yr
Currently active had a lower BMI at age 25, 40, 55 and currently.Mean difference in BMI in currently active vs sedentary was 2.7 U at 25 y, 2.6 U at 40 y and 3.5 U at 55 y (P < 0.01)
Wagner 2001 Leisure-time pa and regular walking or cycling to work are associated with adiposity and 5y weight gain in middle-aged men: the PRIME study. Int J of Obesity
France 1991-1993 Longitudinal
8865 men aged 50-59 free of CHD
5y
MOSPA Questionniare assessing baseline PAE expressed in MET h/week
centre, age, marital status, educational level, socio-occupational class, pursuit of weight control, diet, alcohol and smoking habits.
+
Multiple regression analysis indicated that BMI, wt and change in BMI were inversely associated with PAE spent in getting to work (P<10-5, <10-5 and 0.04 respectively) and practice of high-intensity (≥6 MET) recreational activities (<0.01, 10-5 and <0.01). Ment who regularly spent more than 10 MET h/week in walking or cycling to work had a mean BMI, W and change in BMI respectively 0.3 kg/m2, 1 cm and 0.06 kg/m2 lower than those who did not expend energy in getting to work. In the subgroup of subjects who did not perform high-intensity activities, the level of recreational PAE was inversely associated with BMI and W but not with subsequent weight gain.
Weinsier 2002. Free-living activity energy expenditure in women successful and unsuccessful at maintaining a normal body weight. Am J Clin Nutr.
USA Longitudinal, doubly-labeled water
61normal wt W (20-46y)33 were previously ow
1y
AEE (and PAL) was calculated from TEE and SEE.(Note: subjects were maintained in a weight stable state on a controlled diet for 4 wk prior to evaluation and the final 2 wks of the evaluation.)
age, race, (where appropriate fat mass and LBM??)
+
The maintainers AEE was 2937 kj/d at baseline and 2841 kj/d at follow-up (NS).The maintainers PAL was 1.68 at baseline and 1.73 at follow-up (NS).The adjusted AEE was 44% higher (or 887 kj/d or 212 kcal/d) in the wt maintainers group compared to the wt gainers group.Outcome variable was categorized as: maintainers-gain of <3% initial bw; gainers-gain of >10% of initial bw. Note that 95% of the gainers were previously ow.

2005 Dietary Guidelines Advisory Committee Report
Westerterp 1997. Relationship between physical activity related energy expenditure and body composition: a gender difference. Int J of Obesity
Meta-analysis of 22 Cross-Sectional DLW Studies
290 healthy subjects ages 18049, 146 W and 144 M
NA
ADMR and BMR were measured using DLW. PAL was calculated from ADMR and BMR
In a regression analysis, age explained 3-7% and 5-20% of the variation in body fat in females and males, respectively. Adding physical activity to the model raised the explained variation in %body fat in males (partial r = -0.35, P <0.01). A higher level of physical activity was related to a lower % body fat. In females, there was no relationship between physical activity and body composition (partial r = 0.00, ns)
Wier L, 2001. Determining the amount of physical activity needed for long-term weight control. Int J of Obes. (Reviewed by IASO)
USA 1990s Longitudinal
341 M (mean age 42.1 y) 155 W (mean age 36.1 y) NASA space center employees
5.5 M 4.9 W
Total PA for previous 30 d at baseline and at follow-up. Graded activities 1-10.
Age and initial weight; time elapsed.
+
Average WG progressively limited for both M and W at levels of PA Weight change (kg) Men Women Inactive +1.7 +8.8 Moderately active +1.3 +1.1 Active +0.5 +0.7 Very Active -1.3 -3.1
Men Women 1.5 1.4 1.55 1.5 1.7 1.6 1.8+ 1.7+
Williamson D, 1993. Recreational physical activity and ten-year weight change in a US national cohort. Int J of Obes. (Reviewed by IASO)
USA 1971-84 Longitudinal
3515 M 5810 F (mean 47 years)
10 OA and LTPA: three categories
Age, BMI, race, education, smoking, alcohol, physician diagnosed health status, parity
+
Weight change was inversely associated with PA at follow-up. Decreased PA was associated with WG. Baseline PA was not associated with weight change. BMI
Men Women Low 26.1 26.4 Moderate 25.6 25.2 High 25.0 24.1
Men Women 1.6 1.5 1.7 1.6 1.8+ 1.7+
*Helmrich S. Physical activity and reduced occurrence of non-insulin dependent diabetes mellitus. N Eng J Med 1991.
USA 1962-1976 Longitudinal 5990 male U
Penn Alumni 14y
Questionnaire assessing kcals of pa/wk (including stairs, walking and sports)
+ The men's level of PA in 1962 was strongly correlated with their weight gain (r=0.1, P<0.001)
* Samaras K. Genetic and London Cross-
Sectional 970 healthy female twins 2 types of pa
questionnaires: age, diet, smoking, HRT use, and + Physical activity level was consistently
the strongest independent predictor of
54
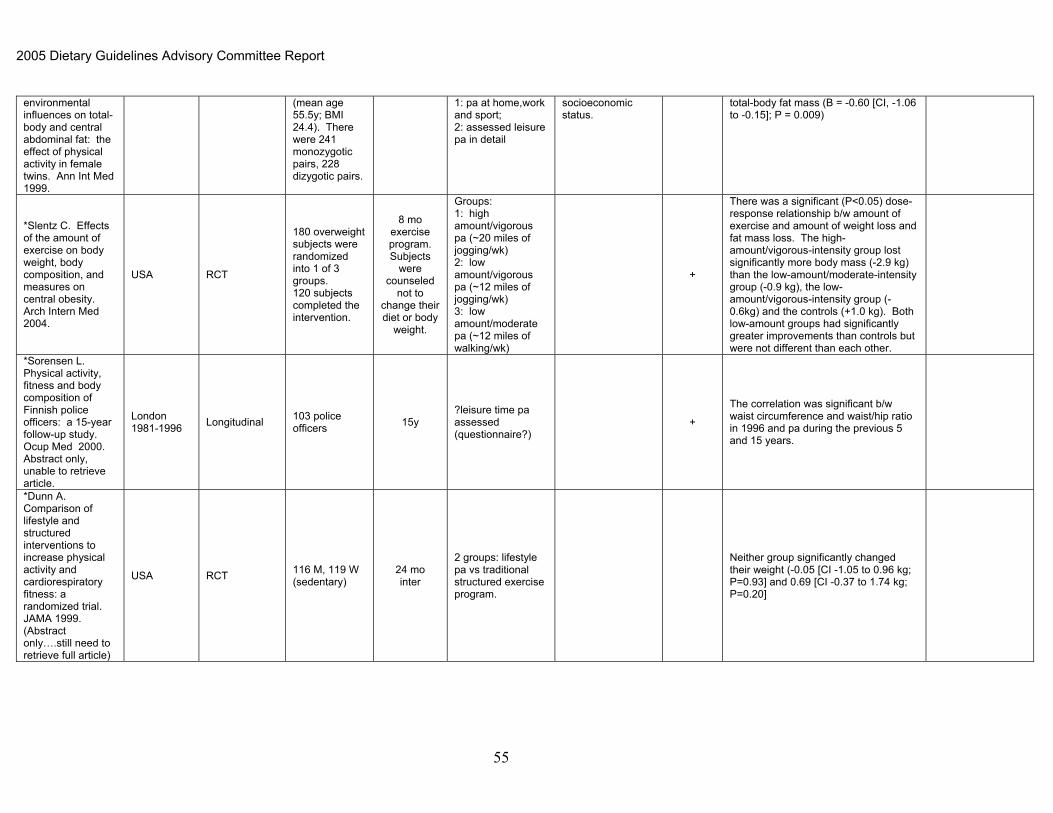
2005 Dietary Guidelines Advisory Committee Report
environmental influences on total-body and central abdominal fat: the effect of physical activity in female twins. Ann Int Med 1999.
(mean age 55.5y; BMI 24.4). There were 241 monozygotic pairs, 228 dizygotic pairs.
1: pa at home,work and sport; 2: assessed leisure pa in detail
socioeconomic status.
total-body fat mass (B = -0.60 [CI, -1.06 to -0.15]; P = 0.009)
*Slentz C. Effects of the amount of exercise on body weight, body composition, and measures on central obesity. Arch Intern Med 2004.
USA RCT
180 overweight subjects were randomized into 1 of 3 groups. 120 subjects completed the intervention.
8 mo exercise program. Subjects
were counseled
not to change their diet or body
weight.
Groups: 1: high amount/vigorous pa (~20 miles of jogging/wk) 2: low amount/vigorous pa (~12 miles of jogging/wk) 3: low amount/moderate pa (~12 miles of walking/wk)
+
There was a significant (P<0.05) dose-response relationship b/w amount of exercise and amount of weight loss and fat mass loss. The high-amount/vigorous-intensity group lost significantly more body mass (-2.9 kg) than the low-amount/moderate-intensity group (-0.9 kg), the low-amount/vigorous-intensity group (-0.6kg) and the controls (+1.0 kg). Both low-amount groups had significantly greater improvements than controls but were not different than each other.
*Sorensen L. Physical activity, fitness and body composition of Finnish police officers: a 15-year follow-up study. Ocup Med 2000. Abstract only, unable to retrieve article.
London 1981-1996 Longitudinal 103 police
officers 15y ?leisure time pa assessed (questionnaire?)
+
The correlation was significant b/w waist circumference and waist/hip ratio in 1996 and pa during the previous 5 and 15 years.
*Dunn A. Comparison of lifestyle and structured interventions to increase physical activity and cardiorespiratory fitness: a randomized trial. JAMA 1999. (Abstract only….still need to retrieve full article)
USA RCT 116 M, 119 W (sedentary)
24 mo inter
2 groups: lifestyle pa vs traditional structured exercise program.
Neither group significantly changed their weight (-0.05 [CI -1.05 to 0.96 kg; P=0.93] and 0.69 [CI -0.37 to 1.74 kg; P=0.20]
55

2005 Dietary Guidelines Advisory Committee Report
Summary of Pediatric Activity Intervention Trials for Physical Activity and Bone Health
Reference
Study Design
Description of Intervention Bone Measurement
Method Bone Sites Measured
Significant Findings: Comments
Morris et al. 69
Regional TB results: greater increases in leg, arm and pelvic BMD in I vs. C.
Longitudinal, non-randomized trial with exercise group within specific schools (N=4).
10 mo duration. 73 premenarcheal girls aged 9-10 y (71 completed)
N=38 for I N=33 for C I=high impact & strength exercises 30min 3x/wk
C=encouraged not to change activity patterns.
DXA for BMC, BA, BMD & BMAD (spine & neck)
Total Body Hip (total, femoral neck)
Lumbar spine
Greater increases in total body BMC & BMD; spine BMD, and BMAD; hip BMC & BMD, and femoral neck BMC & BA in I vs. C.
I group gained more lean mass in total body, trunk & leg than C and lost more TB fat mass.
Mean Ca intake approximately 980 mg/d.
Mean attendance (midway) was 96%.
Bradney et al. 63
Controlled prospective study.
8 mo duration. 38/40 boys aged 8.4-11.8 y from 2 schools (I vs. C) completed study.
All prepubertal (Tanner & serum testosterone & E2.
N=19 for I N=19 for C 30 min weight bearing activity 3x/wk for 32 wk
DXA for BMC, aBMD and areal vBMD (femoral midshaft & L3 vertebrate).
Estimates of periosteal & endocortical widths, cortical thickness, CSMI, section modulus, & strength index made from hip scan.
Total body Hip Spine
Total body aBMD, leg aBMD from TB scan, and spine aBMD greater in I vs. C.
Femoral midshaft: endocortical thickness and medullary area & volume less, while cortical thickness, cortical volume, BMC, aBMD, and areal vBMD greater in I vs. C.
Mean attendance was 96%.
Groups matched for age, standing height, sitting height, weight and baseline aBMD.
Specker et al. 32 RCT 12 mo duration. 72 infants 69/72 infants completed 9 mo of intervention.
All infants enrolled prior to 6 mo of age, with interventions beginning at 6 mo.
N=34 for I N=35 for C I=bone loading activities for 15-20 min/d, 5x/wk
C=infants held for equivalent time
DXA for SA-BMC Total body Significant interaction between Ca intake and activity group. No difference between activity groups in TB SA-BMC gain for high Ca intake; TB SA-BMC gain was lower in I vs. C for low Ca intake.
More compliant infants had less SA-BMC gain.
Infants tolerated bone loading activities approximately 65% of the time.
Heinonen et al. 60
Controlled trial 9 m duration 139 girls both pre- and post-menarcheal (126 completed)
Premenarcheal: N=25 for I N=33 for C Postmenarcheal: N=39 for I C=29 for C I=2 - 50 min step-aerobic sessions/wk
C=usual activities
DXA for BMC pQCT (midshaft of tibia) for cortical BMD, cortical area, and polar section modulus (BSI)
Spine Hip (total, femoral neck) Midshaft of tibia (pQCT)
Pre-menarcheal girls: gains in spine and femoral neck BMC greater in I vs. C, no differences in midshaft tibia
Post-menarcheal girls: No significant group differences.
Mean Ca intake approximately 1040 mg/d.
Compliance 70% & 65% in pre- and post-menarcheal groups.
56

2005 Dietary Guidelines Advisory Committee Report
Witzke & Snow 83
Non-randomized trial 9 months 56 girls aged 13-15 y from 2 high schools (53 completed).
N=25 for I N=28 for C I=30-45 min 3x/wk using weighted vests & plyometrics
C=usual activities
DXA for BMC Total body Spine Hip (femoral neck, trochanter, & femoral mid-shaft)
No significant differences between groups in BMC change.
I group gained trochanter BMC, while C group did not (groups did not differ).
Controls matched by age and months past menarche.
Average of 22.7 mo past menarche
McKay et al. 84 RCT with school as unit. 8 month duration. 144 boys & girls aged 6.9-10.2 y from 10 schools.
All boys T1; 66/74 girls T1, 8 girls T2.
N=63 for I N=81 for C I=10 tuck jumps 3x/wk + loading activities 2x/wk.
C=regular phys educ classes
DXA for BMC, BA BMD
Total body Lumbar spine Hip (total, femoral neck, trochanter)
Trochanter BMD greater in I vs. C.
Children in C schools had higher baseline activity levels & greater vertical jump than children in I schools.
Height gain was greater in C vs. I.
Mean Ca intake=988 mg/d
MacKelvie et al. 64
RCT with school as unit. 7 mo duration. 383 boys & girls from 14 schools, 191 girls aged 8.7-11.7 y included in this analysis (177 completed)
Prepubertal (T1): N=44 for I N=26 for C Early pubertal (T2 & T3): N=43 for I C=64 for C I=10-12m/d 3x/wk high impact jumping
C=stretching
DXA for BMC, aBMD & areal vBMD (femoral neck)
Total body Lumbar spine Hip (total, femoral neck, trochanter)
Prepubertal: No differences between I and C.
Early Puberty: Greater increases in spine BMC & aBMD and femoral neck BMC, and aBMD areal vBMD in I vs. C.
Compliance averaged approximately 80%.
MacKelvie et al. 65
RCT with school as unit. 7 mo duration. 383 boys & girls from 14 schools, 133 boys aged 8.8-11.7 y included in this analysis (121 completed).
All T1 at baseline.
N=61 for I N=60 for C I=10-12m/d 3x/wk high impact jumping
C=stretching
DXA for BMC, aBMD, & areal vBMD (femoral neck)
Total body Lumbar spine Hip (total, femoral neck, trochanter)
Greater increases in TB BMC and hip aBMD in I vs. C.
Compliance averaged approximately 80%.
Approximately 40% of boys advanced to T2 during study.
Boys with low/average BMI had greater change in LS BMC & trochanter BMD in I vs. C.
No differences between I & C in any measure for high BMI boys.
57

2005 Dietary Guidelines Advisory Committee Report
Fuchs et al. 68 RCT with classroom as
unit. 7 mo duration. 100 consenting boys & girls aged 5.9-9.8y in 5 classrooms (89 completed).
All were T1 at baseline & final visits.
N=45 for I (25 boys) N=44 for C (26 boys) I=20 min 3x/wk of 100 jumps off 61 cm box
C=20 min 3x/wk of stretching
DXA for BMC, BA, aBMD
Femoral neck Lumbar spine
Greater increases in femoral neck BMC, BA and spine BMC and aBMD in jumping vs. stretching group.
Mean Ca intake approximately 1265 mg/d.
Overall attendance 86-100%.
Petit et al. 62 See also 64
RCT with school as unit. 7 mo duration. 383 boys & girls from 14 schools, 177 girls included in this analysis.
Prepubertal (T1) and early pubertal (T2 & T3) girls.
Mean age of both groups = 10y.
Prepubertal: N=44 for I N=26 for C Early Pubertal: N=43 for I N=64 for C I=10-12m/d 3x/wk high impact jumpiing
C=stretching
HSA from DXA hip scan including areal vBMD, CSA, subperiosteal width, endosteal diameter, CWT, section modulus
DXA HSA of neck, intertrochanter & femoral shaft
Prepubertal girls: No effect of activity on any bone measure.
Early pubertal girls: Greater gains in FN and intertrochanter BMD; greater increases in CSA, CWT, and section modulus of the femoral neck.
Specker et al. 61 2x2 RCT with calcium and activity as main effects.
12 mo duration. 239 boys & girls 3-5 y (178 completed with >50% attendance).
Mean age=4 y.
N=88 for I N=90 for C I=30 min loading/d, 5d/wk (gross motor)
C=arts & crafts activities (fine motor)
DXA for SA-BMC, BA pQCT % for PC, EC, cortical area, CWT
Total body pQCT of 20% tibia
Interaction between Ca and activity in change of leg SA-BMC, and cortical area and CWT at study completion.
Interaction indicated a greater gain in leg SA-BMC and larger cortical area and CWT in Ca+gross motor group vs. other groups.
Baseline Ca intake = 940 mg/d
Iuliano-Burns et al. 80
2x2 RCT with calcium and activity as main effects.
8.5 mo duration. 73 girls aged 7-11 y (66 completed)
Mean age = 8.8y (T1 & T2).
N=34 for I N= 36 for C I=20 min 3x/wk of high-impact activities
C=20 min 3x/wk of low-impact activities
DXA for BMC Total body and spine
Ca-by-exercise interaction detected at the femur. Main effect of exercise at tibia-fibula.
Ca was fortified (434 mg/d) vs. non-fortified foods. Baseline Ca approximately 640 mg/d.
Sample size not based on detecting interaction.
Mean attendance was 93%.
58

2005 Dietary Guidelines Advisory Committee Report
Van Langendonck et al. 66
RCT 9 mo duration. 21 prepubertal female monozygotic twins aged 8.7 y
N=21 for I N=21 for C I=10 min of high impact exercise 3x/wk
DXA for BMC, BA, & aBMD
Total body (total and right arm)
Spine Hip (total, femoral neck)
No group differences except among 12 twin pairs who did not do high-impact leisure time activities. For these girls there was a greater hip BMC & aBMD in I vs. C.
Mean attendance approximately 69%.
Stear et al. 81 2x2 RCT with calcium and exercise as main effects.
15.5 mo duration. 144 females aged 16-18 y (131 completed)
N=75 for I N=56 for C (N=20 for >50% attendance)
I=45m exercise class 3x/wk C= no intervention Results are for good attendance only
DXA for BMC, BA and SA-BMC
Total Body Spine Radius (total, distal, & ultradistal
Hip (total, neck, trochanter, intertrochanter)
No effect if intent-to-treat analysis performed.
Based on good compliance (>50% attendance with exercises): No effect of loading on BMC or BA at any site. SA-BMC was greater with loading at the total hip and trochanter.
Mean attendance was 36%.
Baseline Ca intake=938 mg/d.
No Ca-by-activity interaction, although authors note that study was not sized to detect interaction.
Johannsen et al. 82
RCT 3 mo duration 55 boys & girls aged 3-5, 7-8, 11-12 & 15-18y (54 completed)
26 prepubertal (T1), 12 peripubertal T2&T3; 16 pubertal (T4&T5)
N=26 for I N=28 for C I=25 jumps/d 5x/wk for 12 wk C=no intervention
DXA for SA-BMC & BA
pQCT 4% tibia measures of total BMC, vBMD and bone area; 20% tibia measures of periosteal & endosteal circumferences & cortical area.
Total body (total&leg)
Spine Hip (femoral neck) 4% & 20% distal tibia
Greater increases in total body & leg SA-BMC.
Pubertal status-by-activity interaction significant for spine SA-BMC and 4% tibia total BMC & BMD: changes greater with I vs. C in pubertal, but less in peripubertal children.
Mean Ca intake=1130 mg/d.
Change in leg BMC correlated with Ca intake in I group, but no correlation in C group.
Mean attendance was 76%.
RCT = randomized clinical trial; T = Tanner stage; N = number; I = intervention group; C = control group; HSA = hip structural analysis; BMC = bone mineral content; BA = bone area; SA-BMC = size adjusted BMC; aBMD = areal bone mineral density; BMAD = bone mineral apparent density; PC = periosteal circumference; EC = endosteal circumference; CSA = cross-sectional area; CWT = cortical wall thickness; E2 = estradiol; CSMI = cross-sectional moment of inertia. (Vukovich and Specker, in press)
59

2005 Dietary Guidelines Advisory Committee Report
60
Meta-Analyses of Physical Activity and Bone Density Reference Population Studies
Included Total number of trials, subjects
Type of exercise
Study treatment effecta Significance level
Berard, 1997 Healthy women >50 yr of age without osteoporosis
Prospective controlled intervention trials
18 trials 1966-1996
Walking, running, physical conditioning, aerobics
Lumbar spine effect size = 0.8745
Lumbar spine<0.05 Forearm=ns Femoral neck=ns
Kelly, 1998 Postmenopausal women
Prospective controlled intervention trials
10 trials 1975-1994; 330 subjects
Aerobic activity Lumbar spine +2.83% Lumbar spine<0.05
Kelly, 1998 Postmenopausal women
Prospective controlled intervention trials
6 studies 1978-1995
Aerobic exercise
Hip +2.42% Hip<0.05
Kelly, 1998 Postmenopausal women
Randomized controlled trials
11 studies 1975-1995; 719 subjects
Aerobic or strength training
Any exercise +0.27% Aerobic +1.62% Strength +0.65%
All sites<0.05
Wolff, 1999 Pre- and Post-menopausal women
Prospective controlled intervention trials
25 studies 1966-1996
Aerobic, high-impact, or strength training at least 16 week duration
Prememopausal Aerobic+strength Lumbar spine +0.90% Femoral neck +0.90% Postmenopausal Aerobic Lumbar spine +0/96% Femoral neck +0/90% Strength training Lumbar spine +0.44% Femoral neck +0.86% Aerobic +strength Lumbar spine +0.79% Femoral neck +0.89%
All sites and modalities significant (<0.05) except for strength training in post-menopausal women
Wallace, 2000
Pre- and post- menopausal
Randomized controlled
32 studies 1966-1998
Impact (aerobic or heel drops)
Premenopausal Impact
All sites and modalities significant (<0.05)

2005 Dietary Guidelines Advisory Committee Report
women trials and strengthtraining
Lumbar spine +1.5% Femoral neck +0.90% Strength training Lumbar spine 1.2% Femoral neck insufficient data Postmenopausal Impact Lumbar spine +1.6% Femoral neck 0.9% Strength training Lumbar spine 1% Femoral neck 1.4%
except fot femoral neck in premenopausal women
Kelly, 2001 Pre- and post-menopausal women
Prospective controlled trials
29 studies 1966-1998; 1123 women
Resistance training
Femur +0.38% Lubmar spine +1.26% Radius +2.17%
Femur nonsignificant Lumbar spine <0.05 Radius <0.05
aStudy treatment effect is the difference between the percentage changes per year in bone mass (bone density or bone mineral content) in the training group minus the control group. A positive figure indicates a protective effect of exercise. Results are annualized for studies less than 12 months in duration, assuming a linear rate of change in bone mass (Singh, 2004).
61

2005 Dietary Guidelines Advisory Committee Report
Literature Summary Table for Question on physical activity needed to avoid weight regain in weight reduced persons. Citation Subjects Weight reduction and trial design Exercise Prescription Follow-up Results
Jakicic J. Effects of intermittent exercise and use of home exercise equipment on adherence, weight loss, and fitness in overweight women. 1999 JAMA
148 ow W
No initial wt loss phase followed by maintenance. Intervention is: 18 mo behavioral weight control program with 3 randomly assigned groups: long-bout exercise, multiple short-bout EX, or multiple short-bout EX with home exercise equipment using a treadmill.
115 of 148 completed the 18 mo intervention. PA was assessed by weekly logs, leisure time pa was assessed with Paffenbarger questionnaire
Individuals maintaining an average of >280 minutes of exercise/ wk maintained a weight loss of ~13 kg over the 18 mo intervention (vs 6.5 kg for 150-200 min/wk and 3.5 kg with < 150min/wk. Leisure time PA > 2000 kcal/wk was significantly assoc with less wt gain.
King A. Diet vs exercise in weight maintenance. Arch Intern Med 1989.
155 M 12 mo. Diet only, EX only. Wt losses 7.2 kg (diet) vs. 5.0 kg (EX)
3 x 40-50 min brisk walking weekly and encouragement to increase lifestyle activity (120-150 min/wk)
12 mo randomized into support contacts by mail and phone vs no contacts. 72 measured (70%); 48 in maintenance support.
2 y wt regain was smallest (17%) in EX subjects with maintenance support. EX without support gained 71% and the diet groups 41-42% of wt loss.
Leser M. A low-fat intake and greater activity are associated with lower weight regain 3 years after completing a very-low calorie diet. 2002 JADA
38W previously obese 6 mo VLCD. Mean weight change -20.7 kg.
3 years, 27 (38%) were evaluated. PA questionnaire included housework/caregiving as well as walking and recreational activities, converted variable to METS.
Those reporting higher activity level regained less weight (r= -.53).
62

2005 Dietary Guidelines Advisory Committee Report
Pavlou K. Exercise as an adjunct to weight loss and maintenance in moderately obese subjects. Am J Clin Nutr 1989.
160 M 8 wk. 4 different VLEDs (420-1000 kcal/d). Diet only, diet + EX (4x2 groups). Mean wt loss 13.3 kg.
3 x 90 min EX weekly, including 35-60 min aerobic EX per session (270 min/wk)
18 mo. 110 measured (69%)
EX groups regained about 10% of the wt loss, whereas the diet groups regained 92%.
Perri M. Enhancing the efficacy of behavior therapy for obesity: effects of aerobic exercise and a multicomponent maintenance program. J Sonsult Clin Psychol. 1986
14 M, 76W 20 wk: BT only, BT + EX Mean wt loss 9.4 kg 4 x 20 min aerobic EX
18 mo, including 6 mo maintenance support by mail and phone, 67 measured (74%)
Wt regain was similar in BT (3.1 kg) and BT + EX (3.3 kg ) groups.
Sikand G. Two-year follow-up of patients treated with a very-low-calorie diet and exercise training in weight maintenance. Arch Intern Med 1989
30W 4 mo: VLED only, VLED + EX. Mean weight loss 19.8kg
Aerobic EX. 2 supervised weekly sessions (about 60-90 min/wk)
24 mo. 21 measured (70%)
Wt regain tended to be less in EX subjects (58% vs 96%)
Skender M. Comparison of 2-year weight loss trends in behavioral treatments of obesity: diet, exercise, and combination interventions.
66 M, 61W 12 mo. Diet only, EX only, Diet + EX. Wt losses 6.8, 2.9, 8.9 kg.
Walking: target goal 5x45 min/wk (225 min/wk)
12 mo. 61 measured (48%)
Wt regain similar in diet + EX vs diet only groups. EX only lost and regained less.
63

2005 Dietary Guidelines Advisory Committee Report
Van Baak M. Leisure-time activity is an important determinant of long-term weight maintenance after weight loss in the Sibutramine Trial on Obesity Reduction and Maintenance (STORM trial). 2003 Am J Clin Nutr.
47 M, 214 W
6mo run-in, weight loss phase. Those who lost > 5% initial weight → 18 mo double-blind, randomized placebo controlled maintenance phase studying effects of sibutramine.
Encouragement by dietician to be physically active.
18 mo. 261 measured (56%) Physical activity indices was obtained by Baecke questionnaire.
Leisure-time PA index, as well as total PA index and the sports PA index were all significant determinants of wt maintenance. The work activity index was not.
van Dale D. Weight maintenance and resting metabolic rate 18-40 months after a diet/exercise treatment. Int J Obes 1990
15 M, 39 W Duration 12-14 wks. VLED only, VLED + EX. Mean wt loss 12.2 kg.
Aerobic (2-3 h/wk) and fitness (2h/wk) training (240-300 min/wk) (KTR to check this)
18-42 mo. 36 measured (67%)
In study 1, EX improved wt maintenance at 42 mo, but the difference was apparently caused by one outlier.
Wadden T. Exercise and the maintenance of weight loss: 1-year follow-up of a controlled trial. J Consult Clin Psychol.
99W
48wk. Aerobic EX + diet, strength training + diet, aerobic EX + strength training + diet, diet only. Mean wt loss 15.6 kg
2-3 weekly sessions. Aerobic=step aerobics; strength=universal gym or cybex equipment; combination=40% aerobic, 60% strength (120-180 min/wk)
12 mo. 77 measured (78%)
EX did not affect maintenance of wt loss
64

2005 Dietary Guidelines Advisory Committee Report
Wing R. Lifestyle intervention in overweight individuals with a family history of diabetes. Diabetes Care 1998.
32 M, 122 W 6 mo. CON, diet only, EX only, diet + EX. Mean wt losses 1.5, 9.1, 2.1, 10.3 kg
Brisk walking, etc., 5 days/wk, target EE 6.3 MJ (1500 kcal)/wk
18 mo. 129 measured (84%)
EX did not affect maintenance of wt loss
*Harris M. Self-directed weight control through eating and exercise. Behav Res Ther 1973.
27 subjects
3 groups: control; self-control, contract for eating group; self-control, contract for eating and exercise group. Intervention was 3 months long.
Increase activities of daily living, encouraging enjoyable non-strenuous activities.
7 mo, 21 subjects were weighed
The self-control, contract for eating and exercise group lost and maintained most weight loss.
*Stalonas P. Behavior modification for obesity: the evaluation of exercise, contingency management, and program adherence. J Consult Clin Psychol 1978.
37 W, 7 M; mean wt 181.1 lbs; mean age 31.5
4 groups: exercise; contingency (self-reinforcement for successfully applying program strategies); exercise and contingency; control.Intervention was 10 weeks long.
Subjects were encouraged to increase their pa by 150-400 kcals/day)
reassessed at 3mo and 12 mo.
The groups containing exercise were able to maintain wt loss (Table 1 is difficult to interpret)
65

2005 Dietary Guidelines Advisory Committee Report
Literature Summary Table for Question on optimal amounts of fat and carbohydrates for weight loss and maintenance.
66
Clinical Trials: Full Citations Design Population Groups Outcome Duration Baseline
Level Results Statistics Comments
Brehm B, Seeley R, Daniels S, D'Allessio D. A Randomized Trial Comparing a Very Low Carbohydrate Diet and a Calorie Restricted Low Fat Diet on Body Weight and Cardiovascular Risk Factors in Healthy Women. The Journal of Clinical Endocrinology & Metabolism. 2003. 88(4):1617-1623.
parallel
n=53; all females; 13AA; mean age =43.1(low fat ), 44.22 (low carb); U.S.; obese
27 subjects in the calorie restricted, moderately low fat group (55% carb, 15% protein, 30% fat) 27 subjects in the very low carbohydrate group (ad libitum diet, less than 20g carb/day for 2 wks, then 40-60g/day)
body weight 6 months
Weight (kg): 92.31, SD=6.0 (low fat group) 91.20, SD=8.4 (low carb group)
(low carb vs low fat) Mo. 3: -7.6+/-0.7 vs -4.2+/-0.8 kg body weight Mo. 6: -8.5 =/-1.0 vs. -3.9+/-1.0 kg body weight
P<0.001 P<0.001
Low-carbohydrate group lost significantly more weight at 3 and 6 months
Baba, N.H., et al., High protein vs high carbohydrate hypoenergetic diet for the treatment of obese hyperinsulinemic subjects. Int J Obes Relat Metab Disord, 1999. 23(11): p. 1202-6.
Parallel 4 week dietary intervention to test the hypothesis that hyperinsulinemic obese subjects would respond differently to changes in the
13 obese, hyperinsulinemic, normoglycemic males Age: Not reported BMI: 34-38 kg/m2
Two groups: Both were fed hypoenergetic diets providing 80% of resting energy expenditure. High-protein diet (HP) (45% protein, 25% CHO, 30% fat) High-CHO diet (HC) (12% protein, 58% CHO, 30% fat)
Body weight Anthropometry Body composition
1 month
Weight loss: HP = 8.3+0.7 kg, (P< 0.05) HC = 6.0+0.6 kg There was a decrease in body fat in both groups, whereas body water decreased significantly more in the HP group. REE decreased more in the HC than the HP group (-384.3+84.6 vs -132.3+51.0 kcal, P<0.05).
A low-carbohydrate (LC), HP hypoenergetic diet could be the diet composition of choice for a weight-reducing regimen in obese hyperinsulinemic subjects.

2005 Dietary Guidelines Advisory Committee Report
composition of hypoenergetic diets
Djuric Z, Lababidi S, Heilbrun L, Depper J, Poore K, Uhley V. Effect of Low-Fat and/or Low-Energy Diets on Anthropometric Measures in Participants of the Women's Diet Study. Journal of the American College of Nutrition. 2002; 21(1):38-46.
parallel
n=86 pre-menopausal women ages 25-50; U.S.; overweight
1. low-fat diet (15% energy from fat) 2. low-energy diet (25% reduction in energy intake) 3. combination low-fat and low-energy (15% energy from fat and 25% reduction in energy intake) 4. non-intervention group (followed usual diet)
body weight 12 weeks
Mean body weight = 75.7 kg
Combination low-fat/low-energy diet group lost most weight: Wk 12: -6.7kg
P<0.05 used ANCOVA models
Similar decreases in BMI over 12 weeks for all three of the diets over the control diet
Dumesnil J, Turgeon J, Tremblay A, Poirier P, Gilbert M, Gagnon L, St-Pierre S, Graneau C, Lemieux I, Pascto A, Bergeron J, Despres JP. Effect of a low-glycemic index-low-fat-high protein diet on the artherogenic metabolic risk profile of abdominally obese men. British Journal of Nutrition.
crossover
n= 12 males; mean age =47 (SD 11) years; Canada; overweight and otherwise healthy
1. American Heart Association phase I diet ad libitum 2. low-GI-low-fat-high-protein ad libitum 3. restricted AHA phase I diet
body weight
6 days for each diet (with a washout period of 2 weeks between each intervention)
Initial weights for regimens 1, 2, and 3: 101.7kg (SD 11.9), 102.2kg (SD 11.9), and 99.7kg SD (12.4), respectively
Regimen 1: no change in body weight Regimen 2: mean wt.loss 2.3 (SD 1.6) kg Regimen 3: mean wt. loss 1.4 (SD 0.9) kg
analyzed using one-way ANOVA design; P<0.001
The low-glycemic index diet produced the most weight loss without increases in hunger and had the most favorable impact on the metabolic profile.
67

2005 Dietary Guidelines Advisory Committee Report
2001; 86:557-568.
Ebbeling C, Leidig M, Sinclair K, Hangen J, Ludwig D. A Reduced--Glycemic Load in the Treatment of Adolescent Obesity. Archives of Pediatric Adolescent Medicine. Aug 2003; 157:773-779.
parallel
n=16 (11 female, 3 nonwhite) experimental: mean age=16.9 conventional: mean age=15.3 U.S., obese
8 in reduced GL group (ad libitum reduced-GL prescription); 8 in conventional reduced-fat group (limited fat, reduction of 250-500 kcal/day diet prescription)
BMI
12 months total: 6 mo intervention, 6 mo follow-up
BMI: 34.9 +/-1.0 (experimental group) 37.1+/-1.2 (conventional group)
BMI: Reduced GL vs conventional reduced fat:Mo 12: -1.3+/-0.7 vs 0.7+/-0.5 kg/m2
P=0.2
BMI and fat mass had decreased significantly more by 12 months in the experimental group than the conventional group. Of interest - no weight regain for between 6 and 12 months for the experimental group.
Foster G, Wyatt H, Hill J, McGuckin B, Brill C, Mohammed B, Szapary P, Rader D, Edman J, Klein S. A Randomized Trial of a Low-Carbohydrate Diet for Obesity. The New England Journal of Medicine. 2003; 348:2082-2090.
parallel
n=63, 43 females, 12 AA, 3 Hispanic; mean age =44; U.S.; obese
30 conventional diet (1200-1800 kcal, low-fat high-carb) 33 low-carbohydrate diet (low-carb, high-protein, high-fat)
body weight
12 months
Weight (kg): 98.3, SD 16.4 (low fat group) 98.7, SD 19.5 (low carb group)
Low-carb vs Conventional Diet: Mo 3: -6.8+/-5.0 vs -2.7+/-3.7 % body weight Mo 6: -7.0+/-6.5 vs -3.3+/-5.6 % body weight Mo 12: -4.4 +-/6.7 vs -2.5+/-6.3 % body weight
P=0.001 P=0.02 P=0.26
Attrition rate of 41% overall Low-carbohydrate group lost more wt at 3 and 6 months, but difference not statistically significant at 12 months
Lean MEJ, Han TS, Prvan T, Richmond PR, Avenell A. Weight loss with high and low carbohydrate 1200 kcal diets in free living women. European Journal of Clinical Nutrition.
parallel
n= 110 free living women; Germany; overweight and obese high-carb group: mean age =51.1 y low-carb group:
57 in High carbohydrate diet group (1200 kcal,58% energy from carbohydrates) 53 in Low carbohydrate diet group (1200 kcal, 35% energy from carbohydrates)
body weight 6 months
Weight (kg): 83.9 kg, SD 17.4 (high carb) 84.8 kg, SD 14.1 (low carb)
Mo 6: low CHO diet lost 6.8 +/-0.8 kg high CHO diet lost 5.6+/-0.8 kg
paired t-tests used; P<0.001 at both three and six months
dropout on the two diets similar - 25% over 6 months
68

2005 Dietary Guidelines Advisory Committee Report
1997; 51:243-248. mean age = 501 y
Maffeis, C., et al., Meal-induced thermogenesis and obesity: is a fat meal a risk factor for fat gain in children? J Clin Endocrinol Metab, 2001. 86(1): p. 214-9.
Cross-over to study whether a mixed meal rich in fat can elicit energy saving compared with an isocaloric and isoproteic meal rich in carbohydrate
11 girls Age: 10.1 + 0.3 yr6 obese, BMI: 25.6+ 0.6 kg/m25 nonobese, BMI: 19 + 1.6 kg/m2
Two groups: Low fat (LF; 20% fat, 68% CHO, and 12% protein) High fat, Isocaloric (2500 kJ or 600 Cal), isoproteic (HF; 48% fat, 40% CHO, and 12% protein)
Indirect calorimetry (ventilated hood system) to measure: Postabsorptive resting energy expenditure Respiratory quotient Thermic effect of a meal (TEM)
Two test periods with 1 week washout between
TEM, expressed as a percentage of energy intake was significantly higher after a LF meal than after a HF meal (6.5 + 0.7% vs. 4.3 + 0.4%; P < 0.01). Respiratory quotient (RQ) was significantly higher after a LF meal than after a HF meal (0.86 + 0.013 vs. 0.83 + 0.014; P < 0.001). The HF low CHO meal induced a significantly lower increase in carbohydrate oxidation than the LF meal (20.3 + 6.2 vs. 61.3 + 7.8 mg/min; P < 0.001). Fat oxidation was significantly higher after a HF meal than after a LF meal (-1.3 + 2.4 vs. -15.1 + 3.6 mg/min; P < 0.01). Postprandial fat storage was 8-fold higher after a HF meal than after a LF meal (17.2 + 1.7 vs. 1.9 + 1.8 g; P < 0.001).
These results suggest that a high fat meal is able to induce lower thermogenesis and a higher positive fat balance than an isocaloric and isoproteic low fat meal. Therefore, diet composition per se must be taken into account among the various risk factors that induce obesity in children.
Samaha F, Iqbal N, Seshadri P, Chicano K, Daily D, McGrory J, Williams T, Williams M,
parallel
n=132 low-carb: 20% F, 55%AA, 3% Hisp.; mean age
n= 64 low-carbohydrate diet (<30g/day) n= 68 low-fat diet (<30% kcal, -500 kcal/day)
body weight 6 months
Weight (kg): low-carb: 130.0 +/- 22.7 low-fat: 131.8 +/-27.3
Low-carb vs Low-fat: Mo 6: -5.8kg +/-8.6kg vs -1.9 +/-4.2kg
95% confidence interval; P=0.002
severely obese subjects with a high prevalence of diabetes and the metabolic syndrome
69

2005 Dietary Guidelines Advisory Committee Report
Gracely E, Stern L. A Low-Carbohydrate as Compared with a Low-Fat Diet in Severe Obesity. New England Journal of Medicine. 2003; 348: 2074-2081.
= 53 low-fat: 15%F, 62%AA, 3% Hisp.; mean age = 54 U.S., severely obese, 39% diabetes, 43% metabolic syndrome
lost more weight in a six-month period with a low-carbohydrate diet than a fat and calorie restricted diet
Shepard, T.Y., et al., Occasional physical inactivity combined with a high-fat diet may be important in the development and maintenance of obesity in human subjects. Am J Clin Nutr, 2001. 73(4): p. 703-8.
Cross-over To examine the effect of the interaction between diet composition and physical inactivity on energy and fat balances
35 subjects Age: 25-35 yr. 22 normal-weight: BMI 21.7 + 0.5 (8 females, 14 males) 14 obese: BMI 33.1 + 1.9 (8 females, 6 males)
Two groups: High-carbohydrate (HC) diet High-fat (HF) diet Both 15-day diets were isoenergetic.
Whole-room Indirect Calorimetry During the first 14 days, body weight and physical activity were maintained. On day 15, subjects spent 23° in a whole-room indirect calorimeter. While remaining physically inactive, they were fed a diet
Two15-day study periods with a 4-6 week washout between.
Energy intakes required to maintain body weight stability during the first 14 d were similar between diets. Normal-weight and obese subjects consuming both diets had a positive energy balance on the sedentary day (day 15), suggesting that subjects were less active in the calorimeter. There was no significant effect of diet composition on total energy balance and total protein-energy balance on day 15; however, carbohydrate balance was more positive with the HC (2497.8 + 301.2 kJ) than with the HF (1159 + 301.2 kJ) diet (P = 0.0032). Fat balance was more positive with the HF
Chronic consumption of a high-carbohydrate diet could provide some protection against body fat accumulation in persons with a pattern of physical activity that includes frequent sedentary days.
70

2005 Dietary Guidelines Advisory Committee Report
similar to that consumed during the previous 7 days.
(1790.8 + 510.4 kJ) than with the HC (-62.8 + 510.4 kJ) diet (P = 0.0011).
Skov AR, Tourbro S, Ronn B, Holm L, Astrup A. Randomized Trial on Protein vs Carbohydrate in ad libitum Fat Reduced Diet for the Treatment of Obesity. International Journal of Obesity. 1999; 23(5):528-36.
parallel
n=65 (50 women, 15 men) High Carb group: mean age =39.4 High Prot. Group: mean age = 39.8 Controls: mean age = 37.6 Denmark; overweight and obese
n=25 High Carbohydrate (ad libitum, target 58% carbohydrate, 12% protein, 30%fat) n=25 High Protein (ad libitum, target was 45% carb 25% protein, 30% fat) n=15 Controls (no change in regular diet; was about 40% fat)
body weight body fat (measured by DEXA)
6 months
Weight (kg): high-carb: 88.6+/-1.9 high-protein: 87.0+/-1.9 controls: 88.1+/-1.8 Body fat (kg): high-carb: 30.5+/-1.5 high-protein: 28.5+/-1.4 controls: 29.6+/-1.8
High Protein vs High Carbohydrate group: Wt at Mo.6: 8.7kg+/-5.0kg (no sig. change in controls) Body fat at Mo.6: 7.6kg vs 4.3 kg (no sig. change in controls)
P=0.002 95% confidence interval P<0.001
Reported energy intake in the High-Protein group was lower, possibly due to greater satiety
Volek J, Sharman M, Gomez A, Scheett P, Kraemer W. An Isoenergetic Very Low Carbohydrate Diet Improves Serum HDL Cholesterol and Triaglycerol Concentrations, the Total Cholesterol to HDL Cholesterol Ratio and Postprandial Lipemic Responses Compared with a Low Fat Diet in Normal Weight,
crossover
n=10 females; U.S.; healthy, normal weight; normolipidemic; mean age= 26.3 +/-6.1 y
two-period crossover design:low-fat diet and very low-carbohydrate diet; both designed to be isoenergetic
body weight
4 weeks each diet
Wt: 59.8+/-4.6kg
small, significant decreases in body mass during both treatments, but changes did not differ between diets: -1.2+/-0.8kg (very low carb) and -0.8+/-1.0kg (low-fat)
Also examined effects of diets on fasting serum total cholesterol, LDL cholesterol, and HDL-C.
71

2005 Dietary Guidelines Advisory Committee Report
Normolipidemic Women. The Journal of Nutrition. 2003; 133(9):2756-2761.
72

2005 Dietary Guidelines Advisory Committee Report
Question: What is the effect of fatty acids on metabolic syndrome? Inclusion criteria: Prospective, case-control, cross-sectional studies; human subjects; publication dates after 1999 Working Summary Table as of 2/13/04 Observational studies Full Citation Design Exposure Results Statistics Comments Brunner EJ, Wunsch H, Marmot MG. What is an optimal diet? Relationship of macronutrient intake to obesity, glucose tolerance, lipoprotein cholesterol levels and the metabolic syndrome in the Whitehall II study. Int J Obes Relat Metab Disord. 2001 Jan;25(1):45-53.
Cross-sectional; 4497 men and 1865 women aged 39-62 (in Whitehall II study)
Willet FFQ - Tertiles of nutrient intake (total fat, SFA, PUFA, MUFA)
Odds ratios of having metabolic syndrome - Significant results for having metabolic syndrome: MEN - tertile 3 for protein OR = 1.43 (1.13-1.80), tertile 3 for cholesterol OR = 1.53 (1.21-1.93); WOMEN - tertile 3 for cholesterol OR = 1.47 (1.04-2.08); total fat, SFA, PUFA, MUFA not significant; Obesity and metabolic variables (coefficients show change in dependent variable for a 10 g (chol 10 mg) increase in nutrient intake) MEN - fat intake and waist-hip ratio -0.0034, triglycerides -0.036, HDL-C -0.016; SFA intake and triglycerides -0.045; PUFA intake and waist-hip ratio -0.0057, triglycerides -0.069, LDL-C -0.110; carbohydrate intake and BMI -0.11, waist-hip ratio -0.0025, HDL-C -0.007, LDL-C -0.017; WOMEN - fat intake and HDL-C -0.082; SFA intake and BMI 0.62, HDL-C -0.054; PUFA intake and BMI 0.97, HDL-C -0.076; MUFA intake and BMI 0.47, waist-hip ratio 0.0084, LDL-C 0.158; CHO intake and BMI -0.071, waist-hip ratio -0.0011, HDL-C -0.011, LDL-C -0.016
Obesity and metabolic variables: MEN - fat intake and waist-hip ratio p<0.001, triglycerides p<0.01, HDL-C p=0.0001; SFA intake and triglycerides p<0.05; PUFA intake and waist-hip ratio p<0.001, triglycerides p<0.01, LDL-C p=0.001; carbohydrate intake and BMI p=0.0001, waist-hip ratio -p=0.0001, HDL-C p<0.01, LDL-C p<0.01; WOMEN - fat intake and HDL-C p<0.001; SFA intake and BMI p<0.05, HDL-C p<0.05; PUFA intake and BMI p<0.001, HDL-C p<0.01; MUFA intake and BMI p<0.05, waist-hip ratio p<0.01, LDL-C p<0.01; CHO intake and BMI p<0.05, waist-hip ratio p<0.01, HDL-C p=0.0001, LDL-C p<0.05
Summary - Both PUFA and CHO offered small metabolic benefits with few adverse effects compared with saturated fats.
Byberg L, Smedman A, Vessby B, Lithell H. Plasminogen activator inhibitor-1 and relations to fatty acid composition in the diet and in serum cholesterol esters. Arterioscler Thromb Vasc Biol. 2001 Dec;21(12):2086-92.
Cross-sectional; 871 men aged 70 years in Uppsala, Sweden
7-day dietary record - Dietary Intake (g/D) Fat 68.5+/-23.4 (21.3-176.4); SFA 30.4+/-11.6 (8.1-95.6); MUFA 24.2+/-8.1 (7.9-66.6); PUFA 10.2+/-3.8 (3.0-37.0)
Association with PAI-1 activity - CHO r=-0.14; protein r=0.11; fat r=0.09, SFA r=0.02; MUFA r=0.10; PUFA r=0.13
CHO p<0.001; protein p=0.002; total fat p=0.011; SFA p=0.494; MUFA p=0.003; PUFA p<0.001
Summary - Dietary intake of unsaturated fatty acids was positively associated with PAI-1 activity, while intake of SFA is not. Note - associations present between PAI-1 activity and fatty acids are partly influenced by metabolic syndrome related factors.
73

2005 Dietary Guidelines Advisory Committee Report
Harding AH, Williams DE, Hennings SH, Mitchell J, Wareham NJ. Is the association between dietary fat intake and insulin resistance modified by physical activity? Metabolism. 2001 Oct;50(10):1186-92.
Cross-sectional; 815 nondiabetic men and women residing in Ely, Cambridgeshire
Self-completed, semiqualitative FFG - P:S ratio used to represent the pattern of dietary fat intake due to high correlation between SFA and MUFA, MUFA and PUFA, SFA and PUFA, and fat types and total fat
Multiple regression models predicting fasting insulin with P:S ratio and PAL as explanatory variables: Adjusted for total energy intake and to PAL - P:S ratio = -0.370; Adjusted for age, sex, family history of diabetes, smoking, alcohol intake - P:S ratio = -0.118; Full multivariate model - P:S ratio = -0.241
Adjusted for total energy intake and to PAL - P:S ratio p<0.001; Adjusted for age, sex, family history of diabetes, smoking, alcohol intake - P:S ratio p=0.001; Full multivariate model - P:S ratio p=0.003
Summary - Multivariate model predicted that an increase in the P:S ratio of 1 corresponded to a 27% reduction in fasting insulin.
Laaksonen DE, Lakka TA, Lakka HM, Nyyssonen K, Rissanen T, Niskanen LK, Salonen JT. Serum fatty acid composition predicts development of impaired fasting glycaemia and diabetes in middle-aged men. Diabet Med. 2002 Jun;19(6):456-64.
4-yr prospective cohort; 894 normoglycemic men in eastern Finland
4-day food records and serum fatty acid composition; tertiles of baseline values
Change in fasting insulin levels during the 4-year follow-up (adjusted, the category with most favorable change was set at 1.00) - PUFA: Tertile 1 - 1.95 (1.42-2.49), Tertile 2 - 1.38 (0.83-1.97), Tertile 3 - 1.00 (0.43-1.57); SFA: 1 - 1.00 (0.43-1.57), 2 - 1.06 (0.51-1.61), 3 - 1.77 (1.23-2.31); P/S ratio: 1 - 1.82 (1.28-2.36), 2 - 1.42 (0.87-1.97), 3 - 1.00 (0.43-1.57); 16:0: 1 - 1.00 (0.44-1.56), 2 - 1.54 (0.98-2.10), 3 - 1.94 (1.39-2.48); 18:2: 1 - 2.24 (1.71, 2.79), 2 - 1.00 (0.45, 1.55), 3 - 1.18 (0.62-1.69)
Change in fasting insulin levels during the 4-year follow-up (adjusted, the category with most favorable change was set at 1.00) - PUFA: p-value for effect 0.020, p-value for linear trend 0.007; SFA: p-value for effect 0.034, p-value for linear trend 0.024; P/S ratio: p-value for effect 0.053, p-value for linear trend 0.020; 16:0: p-value for effect 0.019, p-value for linear trend 0.007; 18:2: p-value for effect <0.001, p-value for linear trend 0.002
Summary - Men who developed impaired fasting glycemia or diabetes has smaller proportions of linoleate at baseline than men who remained normoglycemic. Higher proportions of serum non-esterified and esterified linoleic acid were associated with a decreased risk of hyperglycemia and more favorable changes in fasting insulin and glucose concentrations.
Larsson H, Elmstahl S, Berglund G, Ahren B. Habitual dietary intake versus glucose tolerance, insulin sensitivity and insulin secretion in postmenopausal women. J Intern Med. 1999 Jun;245(6):581-91.
Cross-sectional; 74 postmenopausal women in Malmo, Sweden
Modified diet history - Daily Intake (g/day) Fat 87.9+/-13.5; SFA 37.9+/-9.2; MUFA 30.5+/-4.8; PUFA 13.9+/-3.9
Relationship between nutritional intake and metabolic variables: Total energy - fasting insulin r=-0.31, insulin sensitivity r=0.30; Carbohydrate - 2-h glucose r=-0.23; PUFA - 2-h glucose r=0.41, fasting insulin r=0.32, insulin sensitivity r=-0.27; Multivariate analyses: 2-h glucose (model 1) - PUFA r=0.41; 2-h glucose (model 2) - PUFA r=0.41; IS (model 1) - energy intake r=0.31, PUFA r=0.41; SI (model 2) - PUFA no longer significant
Relationship between nutritional intake and metabolic variables: Total energy - fasting insulin p=0.06, insulin sensitivity p=0.007; Carbohydrate - 2-h glucose p=0.05; PUFA - 2-h glucose p<0.001, fasting insulin p=0.005, insulin sensitivity p=0.022 Multivariate analyses: 2-h glucose (model 1) - PUFA p<0.001; 2-h glucose (model 2) - PUFA p<0.001; IS (model 1) - energy intake p=0.006, PUFA p=0.02
Summary - Dietary patterns were not independently associated with insulin sensitivity or insulin secretion in postmenopausal women.
74

2005 Dietary Guidelines Advisory Committee Report
Lovejoy JC, Champagne CM, Smith SR, DeLany JP, Bray GA, Lefevre M, Denkins YM, Rood JC. Relationship of dietary fat and serum cholesterol ester and phospholipid fatty acids to markers of insulin resistance in men and women with a range of glucose tolerance. Metabolism. 2001 Jan;50(1):86-92.
Cross-sectional; 19 men and 19 women from Baton Rouge metropolitan area
3-day diet record - Dietary Intake (Females and Males): Fat (g/d) 54.6 and 80.1; Fat (% kcals) 31.5 & 31.9; MUFA (g/d) 21.1 & 31.7; PUFA (g/d) 12.7 & 14.4; SFA (g/d) 16.6 & 27.2; TFA (g/d) 4.6 & 6.0; Cholesterol (mg/d) 170.9 & 320.3
Relationship between nutritional intake and metabolic variables: Fasting insulin - total fat r=0.50, MUFA r=0.44, SFA r=0.49; Fasting glucose - total fat r=0.39, MUFA r=0.37; Multivariate analysis: Fasting insulin - total fat r2=0.26, SFA r2=0.25; Fasting glucose - dietary fat r2=0.17-0.18
Relationship between nutritional intake and metabolic variables: Fasting insulin - total fat p<0.01, MUFA p<0.01, SFA pp<0.01; Fasting glucose - total fat p<0.05, MUFA p<0.05; Multivariate analysis: Fasting insulin - total fat r2=0.26, SFA r2=0.25; Fasting glucose - dietary fat r2=0.17-0.18
Summary - Self-reported intakes of saturated and monounsaturated fats, but not trans fats, are associated with markers of insulin resistance.
Mayer-Davis EJ, Levin S, Bergman RN, D'Agostino RB Jr, Karter AJ, Saad MF; Insulin Resistance Atherosclerosis Study (IRAS). Insulin secretion, obesity, and potential behavioral influences: results from the Insulin Resistance Atherosclerosis Study (IRAS). Diabetes Metab Res Rev. 2001 Mar-Apr;17(2):137-45.
Cross-sectional; 1007 IRAS participants from CA, TX, CO
1-yr, semi-qualitative FFI
Statistically significant only - Pearson correlation coefficients: participants with normal glucose tolerance - AIR - fat (%) 0.14***, SFA (%) 0.11**, PUFA (%) 0.13***, oleic acid (%) 0.14***; SI - fat -0.09*, PUFA -0.10**, oleic acid -0.10*; BMI - fat 0.10*, SFA 0.10*, PUFA 0.08*; WC - fat 0.09*, SFA 0.09*, oleic acid 0.10*; participants with impaired glucose tolerance - SI - oleic acid -0.11*; BMI - fat 0.15**, SFA 0.12*, PUFA 0.11*, oleic acid 0.13*; Associations with AIR: PUFA (10g/d) 13.77 percent change in AIR in participants with normal glucose tolerance
Pearson correlation coefficients: * p<0.05; **p<0.01; ***P,0.001; Association of PUFA to AIR p>0.05
Summary - Dietary fat intake appeared to have little direct effect on insulin secretion. Central obesity was related to higher insulin secretion.
75

2005 Dietary Guidelines Advisory Committee Report
Robitaille J, Despres JP, Perusse L, Vohl MC. The PPAR-gamma P12A polymorphism modulates the relationship between dietary fat intake and components of the metabolic syndrome: results from the Quebec Family Study. Clin Genet. 2003 Feb;63(2):109-16.
Cohort; 720 adults in Quebec Family Study
Method of assessing dietary intake not reported - Subjects divided into quartiles of fat and saturated fat intake; Quartiles of fat intake (g): 1=22.53<65.56; 2=65.56<86.64; 3=86.84<109.13; 4=109.13<248; Quartiles of SFA (g): 1=3.09<18.97; 2=18.97<25.51; 3=25.51<33.04; 4=33.04<79.88
Relationship between fat, saturated fat intakes and metabolic and anthropometric profiles within each PPAR-γ P12A genotype (statistically significant only):P12/P12: Total fat intake - HDL-C r=-0.20, TC/HDL-C r=0.15, VAT area r=0.15, BMI r=0.18, WC r=0.33, FBG r=0.23; Saturated fat intake - HDL-C r=-0.17, TC/HDL-C r=0.12, VAT area r=0.12, BMI r=0.11, WC r=0.25, FBG r=0.26; A12 carriers - no statistically significant relationships
Relationship between fat, saturated fat intakes and metabolic and anthropometric profiles within each PPAR-γ P12A genotype (statistically significant only): P12/P12: Total fat intake - HDL-C p=0.0001, TC/HDL-C p=0.0006, VAT area p=0.003, BMI p=0.0001, WC p=0.0001, FBG p=0.0001; Saturated fat intake - HDL-C p=0.0001, TC/HDL-C p=0.03, VAT area p=0.02, BMI p=0.009, WC p=0.0001, FBG p=0.0001; A12 carriers - no statistically significant relationships
Summary - Total fat and saturated fat intakes were more closely associated to components of metabolic syndrome in P12/P12 homozygotes than carriers of the A12 allele.
Wirfalt E, Hedblad B, Gullberg B, Mattisson I, Andren C, Rosander U, Janzon L, Berglund G. Food patterns and components of the metabolic syndrome in men and women: A cross-sectional study within the Malmo Diet and Cancer Cohort. Am J Epidemiol. 2001 Dec 15;154(12):1150-9.
Cross-sectional; Swedish men (2040) and women (2959)
7-day menu book and diet history questionnaire - Six food patterns identified (%calories from fat,P/S ratio,n3/n6 ratio)- Many foods and drinks (40.9%,0.39,0.30); Fiber bread (35.4%,0.46,0.21); Low-fat and high-fiber foods (33.5%,0.46,0.22); White bread (38.3%,0.46,0.18); Milk fat (45%, 0.27, 0.26); Sweets and cakes (37.5%, 0.39, 0.20)
Risk (controlling for lifestyle factors and nutrients) MEN - Many foods and drinks and hyperglycemia OR=1.64; Fiber bread and central obesity OR=0.61; WOMEN - White bread and hyperinsulinemia OR=1.39; Milk fat and hyperinsulinemia OR=0.58
MEN - Many foods and drinks and hyperglycemia 95% CI (1.24,2.17) p=0.0006 ; Fiber bread and central obesity 95% CI (0.42, 0.89) p=0.011; WOMEN - White bread and hyperinsulinemia 95% CI (1.02,1.89) p=0.033; Milk fat and hyperinsulinemia 95% CI (0.40, 0.84) p=0.004
Summary - There were relationships between food patterns and hyperglycemia and central obesity in men and hyperinsulinemia in women, independent of specific nutrients.
76

2005 Dietary Guidelines Advisory Committee Report
Yao M, Lichtenstein AH, Roberts SN, Ma G, Gao S, Tucker KL, McCrory MA. Relative influence of diet and physical activity on cardiovascular risk factors in urban Chinese adults. Int J Obes. 2003;27:920-932.
Cross-sectional; 130 weight stable adults living in urban Beijing, China
Chinese FFQ - Daily dietary intakes: Total fat (% of energy) 36.9+/-1.0 (17.4-61.6); Saturated fat (% of energy) 10.4+/-0.3 (4.1-18.5); Monounsaturated fat (% of energy) 15.5+/-0.5 (6.5+26.5); Polyunsaturated fat (% of energy) 8.4+/-0.3 (4.0-13.9); Carbohydrate (% of energy) 38.4+/-1.4 (17.3-71.2); Protein (% of energy) 16.9+/-0.3 (11.6-22.1)
19% of subjects had metabolic syndrome (26% of men and 13% of women); Regression coefficients for predicting cardiovascular risk factors (only significant presented): CHO (% calories) 0.02; PUFA (% calories) -0.09; No dietary factors were associated with the risk of having metabolic syndrome
CHO p=0.04; PUFA p<0.05
Summary - Regardless of total body fatness and fat distribution, multiple unfavorable dietary factors and low physical activity independently increase risk for cardiovascular disease. Avoidance of sedentary lifestyle additionally reduces the risk of developing metabolic syndrome.
77

2005 Dietary Guidelines Advisory Committee Report
Clinical trials
Full Citation Design Groups Results Statistics Comments Abbasi F, McLaughlin T, Lamendola C, Kim HS, Tanaka A, Wang T, Nakajima K, Reaven GM. High carbohydrate diets, triglyceride-rich lipoproteins, and coronary heart disease risk. Am J Cardiol. 2000 Jan 1;85(1):45-8.
Randomized 14-day crossover feeding trial; 8 healthy, Caucasian subjects
High-carbohydrate, low-fat diet (HC) - 60/25/25, fiber 13.5g/1000kcal; High-fat diet (HF) - 40/45/15, fiber 10.5 g/1000kcal; For both diets - saturated fat <10% of calories; P:S ratio matched at 0.9
HC vs. HF; Triglycerides 206+/-50 vs. 113+/-19; Remnant lipoprotein cholesterol: 15+/-6 v. 6+/-1; RLP triglyceride: 56+/-25 vs. 16+/-3; HDL 39+/-3 vs. 44+/-3; TC: 198+/-19 vs. 191+/-12; LDL-C: 123+/-11 vs. 124+/-11
Statistically significant for HC vs. HF: Triglycerides, p=0.03; RLP Cholesterol, p=0.005; RLP Triglycerides, p=0.003; HDL-C, p=0.003
Summary - HC diet results in higher TG, RLP cholesterol, RLP triglycerides and lower HDL-C. (Total fat: CHO)
Berrino F, Bellati C, Secreto G, Camerini E, Pala V, Panico S, Allegro G, Kaaks R. Reducing bioavailable sex hormones through a comprehensive change in diet: the diet and androgens (DIANA) randomized trial. Cancer Epidemiol Biomarkers Prev. 2001 Jan;10(1):25-33.
4.5 months random clinical trial; 104 healthy women in Milan, age 50-65 years old
Intervention Diet - Mediterranean and macrobiotic based, encouraged to limit meat, eggs, dairy, refined CHO and consume soy, olive oil, seeds, fish, seaweed; Control Diet - typical diet; Actual Intakes: Intervention - 1550 kcal, 51.3/30.8/15.7 with 6.2% SFA, 14.6% MUFA, 13.8% PUFA, 35.5 g fiber; Control - 1805 kcal, 47/33/15.2 with 10.1% SFA, 15.9% MUFA, 14.9% PUFA, 23.3 g fiber
Intervention vs. Control (change from baseline); Weight -4.06 vs. -0.54; BMI -1.62 vs. -0.22; Waist -3.88 vs. -0.49; Hip -2.47 vs. 0.20; Waist:hip -0.02 vs. -0.01; Intervention vs. Control (percent change from baseline); Fasting insulin -10.6 vs. 5.2; Insulin area -7.7 vs. 9.4; Fasting glucose -5.7 vs. -1.2; Glycemic area 4.8 vs. 5.8
Statistically significant for difference in change from baseline for Intervention vs. Control; Weight p=0.0001; BMI p=0.0001; Waist p=0.0001; Hip p=0.0001; Waist:hip p=0.0045; Insulin area p=0.0404; Fasting glucose p=0.0260
Summary - Intervention diet results in decreased body weight, insulinemic response to oral glucose, decreased fasting glucose, and decreased cholesterol. (Total fat (fatty acids): CHO) Note - Intervention group consumed 250 fewer kcal per day, less meat and more fish, soy, flax, seaweed, whole grains, nuts/seeds, legumes, cruciferous vegetables and berries than control.
78

2005 Dietary Guidelines Advisory Committee Report
Brynes AE, Mark Edwards C, Ghatei MA, Dornhorst A, Morgan LM, Bloom SR, Frost GS. A randomized four-intervention crossover study investigating the effect of carbohydrates on daytime profiles of insulin, glucose, non-esterified fatty acids and triacylglycerols in middle-aged men. Br J Nutr. 2003 Feb;89(2):207-18.
Random, 24-day cross-over; 17 moderately overweight, healthy, middle-aged men with one or more cardiac risk factors (defined as BMI>25, TC:HDL>5, waist circumference>1000mm
High-Fat (HF) current diet plus olive oil; Low-GI current diet plus wholegrain rye bread; Sucrose current diet plus sugar; High-GI current diet plus instant potato; Actual Intakes: HF 35.9/47/17.1, 16.1% MUFA, GI 87; Low-GI 47.1/33.4/19.5, 9% MUFA, GI 69; Sucrose 51/33.2/15.8, 9% MUFA, GI 88; High-GI 46.4/35.9/17.1, 10% MUFA, GI 97
HF vs. Low-GI vs. Sucrose vs. High-GI (fasting); TC 5.2 vs. 5.2 vs. 5.3 vs. 5.0; TC:HDL 5.5 vs. 5.8 vs. 5.3 vs. 5.0; HDL 1.01 vs. 0.96 vs. 0.96 vs. 0.99; LDL 3.4 vs. 3.5 vs. 3.5 vs. 3.3; TG 1.5 vs. 1.7 vs. 1.7 vs. 1.7; Glucose 5.4 vs. 5.4 vs. 5.4 vs. 5.2; Insulin 71 vs. 85 vs. 90 vs. 80; HF vs. Low-GI vs. Sucrose vs. High-GI (total IAUC change day 1-day 24) Glucose -166 vs. -97 vs. -55 vs. 86; Insulin 10.1 vs. -1.4 vs. 18.4 vs. 14.6; TG -20 vs. 29.4 vs. 76.7 vs. 143; HF vs. Low-GI vs. Sucrose vs. High-GI (Postprandial homeostatic assessment model, mean percent change from day 1 to day 24) -61 vs. -43 vs. -20 vs. 31
Statistically significant only for HF vs. other diets: Lower postprandial insulin (Total IAUC p=0.0001, Breakfast p=0.03, Lunch p=0.0001) and glucose (Lunch p=0.02), higher postprandial TG (Total IAUC p=0.008); Statistically significant only for High-GI vs. other diets: Postprandial homeostatic assessment model, mean percent change from day 1 to day 24, p<0.001
Summary - HM diet had beneficial effects on postprandial glucose and insulin response; accompanied by adverse TG metabolism. Low-Gi diet had most favorable postprandial profiles of the three high-CHO diets. (MUFA: CHO)
Campbell LV, Marmot PE, Dyer JA, Borkman M, Storlien LH. The high-monounsaturated fat diet as a practical alternative for NIDDM. Diabetes Care. 1994;17(3):177-182.
2-week cross-over; 10 men with mild NIDDM
High-monounsaturated fat (HM) 40/37/23 with 7% SFA, 8% PUFA, 22% MUFA), >30 g fiber, CHO - sugar 10%, starch 30%; High-carbohydrate (HC) 55/22/23 with 7% SFA, 7% PUFA, 8% MUFA, >30 g fiber, CHO - sugar 10%, starch 45%
HC vs. HM; prandial glucose 11.7+/-1.3 vs. 10.4+/-1.0; Urinary glucose excretion 10.6 (1.1-21.7) vs. 6.1 (1.1-23.7); fasting TG 1.4+/-0.02 vs. 1.1+/-0.2; Body weight and energy intake similar for both diets. Fasting TC, HDL-C, LDL-C and prandial triglyceride concentrations did not differ significantly.
Statistically significant for HC vs. HM: Mean prandial glucose, p=0.015; Urinary glucose excretion, p=0.007; Fasting triglyceride, p=0.013
Summary - HM diet was better on some aspects of glycemic control and lipids (MUFA: CHO)
Garg A, Bantle JP, Henry RR, Coulston AM, Griver KA, Raatz SK, Brinkley L, Chen I, Grundy SM, Huet BA, Reaven GM. Effects of varying carbohydrate content of diet in patients with non-insulin dependent diabetes mellitus. JAMA. 1994;271:1421-1428.
Randomized 6-week cross-over; 42 NIDDM subjects receiving glipizide therapy
High-carbohydrate diet (HC) 55/30/15; High-MUFA diet (HM) 40/45/15; SFA and PUFA (10% of the total energy intake), protein (15% total energy intake), cholesterol (120 mg per 1000 kcal), and sucrose (10% of total energy intake) contents of diets were matched
HC Diet vs. HM Diet; Energy intake 10.6+/-1.6 vs. 10.6+/-1.6; Body weight 82.3+/-12.2 vs. 82.2+/-12.0, glucose 8.3+/-1.9 vs. 8.1+/-1.8; insulin 144+/-79 vs. 144+/-79; HbgA1C 8.2+/-2.1 vs. 7.9+/-1.5; Cholesterol 5.07 vs. 4.97; fasting plasma triglycerides 2.19 vs. 1.79; VLDL cholesterol 0.8 vs. 0.65; LDL-C 3.36 vs. 3.36; HDL-C 0.94 vs. 0.96
Statistically significant for HC vs. HM (at week 6): triglycerides p<0.001; VLDL p=0.001
Summary - HC diet increased triglycerides and VLDL with no impact on LDL. (MUFA: CHO)
79

2005 Dietary Guidelines Advisory Committee Report
Garg A, Grundy SM, Unger RH. Comparison of effects of high and low carbohydrate diets on plasma lipoproteins and insulin sensitivity in patients with mild NIDDM. Diabetes. 1992;41:1278-85.
Randomized, 21-week cross-over; 8 men with NIDDM in Dallas, TX; mean age 63+/-2 years
High-CHO (HC) diet 60/25/15 with 8% SFA, 12% MUFA, 5% PUFA; Low-CHO (LC) diet 35/50/15 with 11% SFA, 32% MUFA, 7% PUFA; Diets matched for fiber (25 g/d)
HC Diet vs. LC Diet; TC 5.12+/-0.28 vs. 4.89+/-0.25; trigs 3.25+/-0.28 vs. 2.55+/-0.31; VLDL-C 1.44+/-0.14 vs. 1.13+/-0.17; LDL-C 3.01+/-0.37 vs. 3.01+/-0.32; HDL-C 0.68+/-0.04 vs. 0.76+/-0.05; TC: HDL-C 7.65+/-0.38 vs. 6.57+/-0.40; Meal tolerance test (significant only) LC diet (day 4 vs. day 21) glucose 36.7+/-3.8 vs. 35.1+/-4.2, all other comparisons NS
Statistically significant for HC vs. LC; trigs p=0.002; VLDL-C p=0.021; HDL-C p=0.013; TC: HDL-C p=0.007; Meal tolerance test, LC, day 4 vs. day 21 p=0.02
Summary - HC diet did not improve glycemic control nor insulin sensitivity and it increased triglycerides and VLDL. (MUFA: CHO)
Heilbronn LK, Noakes M, Clifton PM. Effect of energy restriction, weight loss, and diet composition on plasma lipids and glucose in patients with Type 2 diabetes. Diabetes Care. 1999;22:889-895.
12-week randomized; 35 free-living obese people with type 2 diabetes in Australia
Diets designed for 30% energy restriction: High-CHO (HC) 10% fat, 4% SFA; High-MUFA (HM) 32% fat, 7% SFA; High-SFA (HS) 32% fat, 17% SFA; Actual intakes: HC - 72.6/9.9/16.8 with 3.5% SFA, 3.0% MUFA, 2.1% PUFA; HM - 49.5/32.2/18.2 with 6.8% SFA, 14.8% MUFA, 9% PUFA; HS - 52.2/31.4/16.6 with 16.6% SFA, 9.9% MUFA, 2.1% PUFA
HC vs. HM vs. HS: glucose: 7.24 vs. 6.78 vs. 6.64; GHb 7.00 vs. 6.75 vs. 6.55; AUC 38.51 vs. 37.1 vs. 37.07; Insulin 15.74 vs. 13.53 vs. 11.32; SBP 131 vs. 134 vs. 136; DBP 71 vs. 72 vs. 76; TC 5.4 vs. 5.1 vs. 5.4; LDL-C 3.52 vs. 3.28 vs. 3.46; HDL-C 0.93 vs. 0.86 vs. 1.14; TC/HDL ratio 6.01 vs. 6.04 vs. 4.77; FFA 0.48 vs. 0.53 vs. 0.48; triacylglycerol 2.11 vs. 2.14 vs. 2.18
Statistically significant: Between HM and HS - TC p<0.001, adjusted for baseline p<0.01, LDL-C p<0.001, adjusted for baseline p=0.03; Between HC and HS - TC p<0.01 and adjusted for baseline p=0.03, LDL-C p<0.001, adjusted for baseline p=0.01; Between HM and HC - HDL-C p<0.01; Between HS and HC - HDL-C p<0.01
Summary - Energy restriction, regardless of diet composition, improves glycemic control. Replacing SFA with CHO or MUFA reduces LDL. (MUFA: CHO)
Lovejoy JC, Smith SR, Champagne CM, Most MM, Lefevre M, DeLany JP, Denkins YM, Rood JC, Veldhuis J, Bray GA. Effects of diets enriched in saturated (palmitic), monounsaturated (oleic), or trans (elaidic) fatty acids on insulin sensitivity and substrate oxidation in healthy adults. Diabetes Care. 2002 Aug;25(8):1283-8.
Randomized, 4-week double-blind crossover; 25 healthy, nonobese people in Baton Rouge area
All three diets - 55/30/15, 275 mg cholesterol, 7.5g/1000 kcal dietary fiber; MUFA diet (HM) with minimum 9% energy as oleic; SFA diet (HS) with target 9% energy as palmitic acid; TFA diet (HT) with target 9% energy as elaidic acid
HM vs. HS vs. HT; fasting glucose 4.9 vs. 4.8 vs. 4.7; fasting insulin 26.2 vs. 24.0 vs. 25.2; SI 3.44 vs. 3.20 vs. 3.40; TC 3.78 vs. 3.93 vs. 3.90; LDL-C 2.15 vs. 2.20 vs. 2.24; HDL-C 1.23 vs. 1.28 vs. 1.23; TG 0.88 vs. 0.88 vs. 0.94
Statistically significant for HM vs. HS: TC p<0.05, HDL-C p<0.05; Statistically significant for HT vs. HS: HDL-C p<0.05
Summary - Dietary fatty acid composition did not impact insulin sensitivity in lean individuals. Overweight individuals were more susceptible to developing insulin resistance on high-saturated fat diets (not statistically significant) (MUFA: SFA; TFA: SFA)
80

2005 Dietary Guidelines Advisory Committee Report
81
Parillo M, Rivellese AA, Ciardullo AV, Capaldo B, Giacco A, Genovese S, Riccardi G. A high-monounsaturated-fat/low-carbohydrate diet improves peripheral insulin sensitivity in non-insulin-dependent diabetic patients. Metabolism. 1992;41(12):1373-1378.
Randomized 15-day crossover metabolic feeding study; 10 subjects from Italy (7 men, 3 women) with NIDDM
High-MUFA/low-CHO (HM) 40/40/20 (SFA 7%, MUFA 29%, PUFA 4%) (15% simple CHO, 25% complex CHO); Low-MUFA/high-CHO (HC) 60/20/20 (SFA 5%, MUFA 13%, PUFA 2%) (14% simple CHO, 46% complex CHO); same fiber content in each diet
HM vs. HC; weight 68.7+/-11.6 vs. 68.9+/-11.9; postprandial plasma glucose concentrations 8.76+/-2.12 v. 10.08+/-2.76; FBG 6.39+/-1.97 vs. 6.74+/-2.28; postprandial plasma insulin levels 195.0+/-86.4 vs. 224.4+/-75.6; FPI 43.2+/-14.4 vs. 57.6+/-23.4; fasting plasma triglyceride levels 1.16+/-0.59 v 1.37+/-0.59; TC 4.68+/-1.01 vs. 4.52+/-0.96; HDL-C 0.99+/-0.2 vs. 0.95+/-0.2
Statistically significant for HM vs. HC: postprandial plasma glucose p<0.05, postprandial plasma insulin levels p<0.02, fasting plasma triglyceride levels p<0.01
MUFA: CHO, Summary - Decrease in dietary CHO associated with an increase in MUFA improves insulin resistance.
Perez-Jimenez F, Lopez-Miranda J, Pinillos MD, Gomez P, Paz-Rojas E, Montilla P, Marin C, Velasco MJ, Blanco-Molina A, Jimenez Pereperez JA, Ordovas JM. A Mediterranean and a high-carbohydrate diet improve glucose metabolism in healthy young persons. Diabetologia. 2001 Nov;44(11):2038-43.
Initial diet phase followed by 28-day randomized cross-over; 59 healthy normolipemic subjects (30 men and 29 women) attending University of Cordoba, Spain
SFA diet (HS) 47/38/15 with 20% SFA, 12% MUFA, 6% PUFA; High-CHO diet (HC) 57/28/15 with <10% SFA. 12% MUFA, 6% PUFA; High-MUFA diet (HM) 47/38/15 with <10% SFA, 22% PUFA, 6% PUFA, 75% of total MUFA provided by olive oil
HS vs. HC vs. HM; TG 0.77 vs. 0.78 vs. 0.79; TC 4.27 vs. 3.67 vs. 3.74; HDL-C 1.12 vs. 0.99 vs. 1.03; LDL-C 2.80 vs. 2.32 vs. 2.34; fasting glucose 4.89 vs. 4.87 vs. 4.79; fasting insulin 32.3 vs. 13.8 vs. 14.7; fasting free fatty acids 0.52 vs. 0.37 vs. 0.37; mean glucose in SSPG 8.06 vs. 6.61 vs. 6.25; in vitro basal glucose uptake 10.6 vs. 27.4 vs. 24.7; in vitro insulin stimulated glucose update 16 vs. 35.8 vs. 36.26
Statistically significant for HS vs. HC: TC, HDL-C, LDL-C, fasting insulin, fasting free fatty acids, mean glucose in SSPG, in vitro basal glucose uptake, in vitro insulin stimulated glucose update (p<0.001 for each); Statistically significant for HS vs. HM: TC, HDL-C, LDL-C, fasting insulin, fasting free fatty acids, mean glucose in SSPG, in vitro basal glucose uptake, in vitro insulin stimulated glucose update (p<0.001 for each)
Summary - Isocaloric substitution of carbohydrates and monounsaturated fatty acids for saturated fatty acids improved insulin sensitivity. (MUFA: SFA; CHO: SFA)
Poppitt SD, Keogh GF, Prentice AM, Williams DEM, Sonnemans HMW, Valk EEJ, Robinson E, Wareham NJ. Long-term effects of ad libitum low-fat, high-carbohydrate diets on body weight and serum lipids in overweight subjects with metabolic syndrome. Am J Clin Nutr. 2002;75:11-20.
6-month randomized; 46 overweight subjects from Cambridge, UK area with > 3 metabolic syndrome risk factors
Control diet (35-40% energy from fat); Low-fat, high complex carbohydrate diet (LF-CC) simple: complex CHO ratio 1:2; Low-fat, high-simple carbohydrate diet (LF-SC) simple to complex CHO ratio 2:1 Both low-fat diets with fat intake reduced by 10% of total energy from control/habitual diet; Actual Intake (mean for 1-6 months): Control 35% fat; LF-CC 24% fat;
Control vs. LF-CC vs. LF-SC; change in body weight 1.03 vs. -4.25 vs. -0.28; decrease in TC -0.33 vs. -0.63 vs. -0.06 mmol/l; Additional results available only in figures: no significant differences in waist circumference, LDL-C or HDL-C between groups; SBP higher in control group than either low-fat group and DBP higher in control group than LF-CC group; Effects of weight change on metabolic syndrome variables - BMI, waist circumference, total cholesterol and triacylglycerol decreased significantly only in those subjects who lost > 3% body weight; HDL cholesterol, LDL cholesterol and systolic blood pressure also tended to decrease
Statistically significant: Body weight (diet x time interaction, p<0.001) and (time effect for LF-CC, p<0.01); TC (diet x time interaction, NS) and (diet effect for LF-CC vs. LF-SC, p<0.05); SBP (diet effect, p<0.01); DBP (diet effect, p<0.05); Effects of weight change on metabolic syndrome for BMI, WC, TC, triacylglycerol, p<0.05
Summary - LF-CC diet led to moderate weight loss and some improvement in cholesterol. An increase in simple carbohydrates did not promote weight gain nor improve lipid profile. (Fat: CHO) Note - 39 subjects completed study.

2005 Dietary Guidelines Advisory Committee Report
LF-SC 20% fat
Rasmussen OW, Thomsen C, Hansen KW, Vesterlund M, Winther E, Hermansen K. Effects on blood pressure, glucose, and lipid levels of a high-monounsaturated fat diet compared with a high-carbohydrate diet in NIDDM subjects. Diabetes Care. 1993 Dec;16(12):1565-71.
Randomized 3-week crossover; 15 NIDDM subjects in Denmark (10 men, 15 women), 7 received oral antidiabetic drugs
High-CHO diet (HC) 50/30/20 with 10% of energy as MUFA, enriched by bread, potatoes, rice; High MUFA diet (HM) 30/50/20 with 30% energy as MUFA, olive oil 29% kcal; Actual intake - HC 49/34/66; HM 36/50/14
HM vs. HC; Daytime SBP 131+/-3 vs. 137+/-3mmHg; 24-h SBP 126+/-8 vs. 130+/-10 mmHg; daytime DBP 78+/-2 vs. 84+/-2 mmHg; diurnal DBP 75+/-6 vs. 78+/-5 mmHg; FBG 6.1+/-0.3 vs. 6.8+/-0.5 mM; lower average BG 7.4+/-0.5 vs. 8.2+/-0.6 mM; peak BG responses 9.9+/-0.6 vs. 11.3+/-0.7 mM; The two diets had the same impact on lipid levels.
Statistically significant for HM vs. HC: Daytime SBP p < 0.04; 24-h SBP p < 0.03; daytime DBP p < 0.02; diurnal DBP p < 0.03; FBG p < 0.05; lower average BG p < 0.04; peak BG responses p < 0.02
Summary - HM diet had beneficial effects on BP and glucose metabolism with no adverse effects on lipid composition. (MUFA: CHO) Note - Subjects has minor weight reductions on both diets (average 0.9 kg on HC and 0.8 kg on HM)
Robertson MD, Jackson KG, Fielding BA, Williams CM, Frayn KN. Acute effects of meal fatty acid composition on insulin sensitivity in healthy post-menopausal women. Br J Nutr. 2002;88:635-640.
Single-blind, randomized; 10 healthy post-menopausal women in UK; average age 56 y (50-63); average BMI 25 (20.6-32)
High-fat breakfast (40 g fat) with varied fatty acid composition for each visit (74% n-6 PUFA, 22% n-3 PUFA, 72% MUFA, 50% SFA) followed by low-fat, high-carbohydrate lunch (5-7 grams fat)
Plasma insulin response significantly higher following the SFA meal than after the other meals after both breakfast and lunch (p<0.006) although there was no effect of breakfast fatty acid composition on plasma glucose concentrations. Postprandial insulin sensitivity was significantly lower after lunch than after breakfast for all four test meals (p=0.019) following the same rank order (SFA < n-6 PUFA < n-3 PUFA < MUFA) for each meal
Plasma insulin response following the SFA meal compared to other meals p<0.006; Postprandial insulin sensitivity lower after lunch than after breakfast for all four test meals p=0.019
Summary - A single meal rich in SFA reduced postprandial SI with carry-over effects for next meal. (n-6 vs. n3 vs MUFA vs SFA) Note - Single meal study
82
http://www.ncbi.nlm.nih.gov/entrez/query.fcgi?cmd=Retrieve&db=PubMed&list_uids=8117360&dopt=Abstract
http://www.ncbi.nlm.nih.gov/entrez/query.fcgi?cmd=Retrieve&db=PubMed&list_uids=8117360&dopt=Abstract
http://www.ncbi.nlm.nih.gov/entrez/query.fcgi?cmd=Retrieve&db=PubMed&list_uids=8117360&dopt=Abstract
http://www.ncbi.nlm.nih.gov/entrez/query.fcgi?cmd=Retrieve&db=PubMed&list_uids=8117360&dopt=Abstract
http://www.ncbi.nlm.nih.gov/entrez/query.fcgi?cmd=Retrieve&db=PubMed&list_uids=8117360&dopt=Abstract
http://www.ncbi.nlm.nih.gov/entrez/query.fcgi?cmd=Retrieve&db=PubMed&list_uids=8117360&dopt=Abstract
http://www.ncbi.nlm.nih.gov/entrez/query.fcgi?cmd=Retrieve&db=PubMed&list_uids=8117360&dopt=Abstract
http://www.ncbi.nlm.nih.gov/entrez/query.fcgi?cmd=Retrieve&db=PubMed&list_uids=8117360&dopt=Abstract
http://www.ncbi.nlm.nih.gov/entrez/query.fcgi?cmd=Retrieve&db=PubMed&list_uids=8117360&dopt=Abstract
http://www.ncbi.nlm.nih.gov/entrez/query.fcgi?cmd=Retrieve&db=PubMed&list_uids=8117360&dopt=Abstract
http://www.ncbi.nlm.nih.gov/entrez/query.fcgi?cmd=Retrieve&db=PubMed&list_uids=8117360&dopt=Abstract

2005 Dietary Guidelines Advisory Committee Report
Samaha F, Iqbal N, Seshadri P, Chicano K, Daily D, McGrory J, Williams T, Williams M, Gracely E, Stern L. A Low-Carbohydrate as Compared with a Low-Fat Diet in Severe Obesity. New England Journal of Medicine. 2003; 348: 2074-2081.
6-month Parallel; 132 severely obese (including 77 blacks and 23 women); 43% with metabolic syndrome; 39% with diabetes
Low-CHO (LC) - 30 grams CHO per day (Actual consumption at 6 months - 1630+/-894 calories, 37/41/22) ; Low-fat (LF)- deficit of 500 calories per day, 30% or less of total calories from fat (Actual consumption at 6 months - 1576+/-760 calories, 51/33/16)
LF vs. HC (change from baseline) trigs -7+/-54 vs. -38+/-8-; TC -1+/-29 vs. 2+/-34; HDL-C -1+/-7 vs. 0+/-5; LDL-C 3+/-18 vs. 5+/-23; insulin sensitivity -0.01+/-0.03 vs. 0.02+/-0.03; glucose (all subjects) -2+/-21 vs. -11+/-24 ; glucose (nondiabetic subjects) 1+/-10 vs. -2+/-11; glucose (diabetic subjects) -5+/-31 vs. -26+/-31; insulin level (w/o diabetes meds) 1+/-10 vs. -6+/-16; insulin level (with diabetes meds) 0+/-20 vs. -8+/-30; HgbA1c (diabetic subjects) 0.0+/-1.0 vs. -0.6+/-1.2; uric acid -0.2 vs 0.1
Statistically significant for LF vs. HC (unpaired t-test) - trigs p=0.001; insulin sensitivity p=0.01; glucose (all subjects) p=0.017; glucose (diabetic subjects) p=0.01; insulin level (w/o diabetes meds) p=0.008;
Summary - Severely obese lost more weight on CHO restricted diet with improvements in SI and triglyceride levels. Note - 79 subjects completed the six-month study. (Fat: CHO)
Scott LW, Balasubramanyam A, Kimball K, Ahrens AK, Frodis CM, Ballantyne CM. Long-term, randomized clinical trial of two diets in the metabolic syndrome and type 2 diabetes. Diabetes Care. 2003;28(8):2481-2.
42 week randomized controlled trial; 35 patients with metabolic syndrome or type II diabetes (enrollment criteria were BMI > 25 kg/m2, elevated fasting glucose (6.1-6.9 mmol/l for impaired fasting glucose and > 6.9 mmol/l for diabetes), calculated LDL cholesterol > 2.8 mmol/l and fasting triglyceride > 1.7 mmol/l)
American Heart Association diet (AHA) 55/30/15 with 15% calories from MUFAs; HiPro-HiMUFA diet (HPHM) 45/40/25 with 22% calories from MUFAs
AHA vs. HPHM (change from baseline) weight -5.9 vs. -9.1 kg; triglycerides -0.8 vs. -1.1 mmol/l; fasting glucose -2.2 vs. -3.2 mmol/l; LDL-C 0.23 vs. 0.18 mmol/l; glycemic control normalized in all 10 patients with impaired fasting glucose; glycemic control normalized in 2 and reduced to impaired fasting glucose in 3 of 7 patients with diabetes
At 42 weeks, changes were not significantly different between the AHA and HPHM groups; weight p=0.768, triglycerides p=0.920, fasting glucose p=0.153, LDL cholesterol p=-.217
Summary - Diet high in protein and MUFA may be advantageous in correcting glucose and lipid metabolism abnormalities. (MUFA/Protein: CHO) Note - 12 patients withdrew within 6 weeks.
83

2005 Dietary Guidelines Advisory Committee Report
84
Straznicky NE, O'Callaghan CJ, Barrington VE, Louis WJ. Hypotensive effect of low-fat, high-carbohydrate diet can be independent of changes in plasma insulin concentrations. Hypertension. 1999;34:580-5.
Randomized 2-week cross-over; 14 healthy, nondiabetic men with mean age 26+/-4 years
High-fat diet (HF) 40/43/17 with 3% PUFA, 15% MUFA, 25% SFA; Low-fat diet (LF) 56/25/19 with 8% as each fatty acid group; Ratio of sugar to starch identical for diets
LF vs. HF weight 80+/-9.8 vs. 80.6+/-10.1 kg; resting supine BP 122+/-11/65+/-6 vs. 129+/-13/68+/-7 mm Hg; Triglycerides 0.8+/-0.3 vs. 0.8+/-0.3; TC 4.0+/-0.6 vs. 5.1+/-0.8; LDL-C 2.6+/-0.5 vs. 3.5+/-0.8; HDL-C 1.05+/-0.19 vs. 1.28+/-0.23; LDL:HDL ratio 2.6+/-0.9 vs. 2.9+/-1.0; FBG 5.1+/-0.6 vs. 5.4+/-0.5; glucose AUC 1-180 min 1111+/-101 vs. 1204+/-106; fasting insulin 3.8+/-2.2 vs. 3.3+/-1.6; insulin sensitivity 2.81+/-1.24 vs. 2.09+/-1.02
Significant differences LF vs. HF: supine BP p<0.01; TC p<0.001; LDL-C p<0.001; HDL-C p<0.001; FBG p=0.03; glucose AUC p=0.003; insulin sensitivity p=0.03
Summary - Short term consumption of LF, high P/S diet is accompanied by beneficial changes in BP, lipids and glucose tolerance. (Fat/MUFA: CHO)
Vessby B, Unsitupa M, Hermansen K, Riccardi G, Rivellese AA, Tapsell LC, Nalsen C, Berglund L, Louheranta A, Rasmussen BM, Calvert GD, Maffetone A, Pedersen E, Gustafsson IB, Storlien LH; KANWU Study. Substituting dietary saturated for monounsaturated fat impairs insulin sensitivity in healthy men and women: The KANWU Study. Diabetologia. 2001 Mar;44(3):312-9.
3-week Random; 162 healthy subjects from centers in Sweden, Finland, Denmark, Italy and Australia (86 men, 72 women)
SFA diet (HS) 44/37/15 with 17% SFA, 14% MUFA, 6% PUFA (Actual consumption 13.5/13/4.8); MUFA diet (HM) 46/37/15 with 8% SFA, 23% MUFA, 6% PUFA (Actual consumption 9.6/21.2/4.6) Within each group there was a second random assignment to supplements with fish oil (3.6 g n-3 fatty acids/d) or placebo
Mean difference in treatment HS vs. HM; insulin sensitivity -0.52; insulin 0.60; insulin response -0.5; FBP 0.03; TC 0.28; trig 0.01; LDL-C 0.34; HDL-C -0.01; ApoB 0.06; ApoA -0.01; Lp(a) -30
Statistically significant for differences; insulin sensitivity p=0.0534; TC p=0.0007; HDL-C p=0.0001; ApoB p=0.001; Lp(a) p=0.0209
Summary - Change in proportion of fatty acids (decreasing SFA and increasing MUFA) improved SI but has no effect on insulin secretion. Favorable effects of substituting a MUFA diet for a SFA diet on insulin sensitivity were only seen at a total fat intake below median (37% of energy). Addition of n-3 fatty acids influenced neither insulin sensitivity nor insulin secretion. (SFA: MUFA)
Wien MA, Sabate JM, Ikle DN, Cole SE, Kandeel FR. Almonds vs complex carbohydrates in a weight reduction program. Int J Obes Relat Metab Disord. 2003 Nov;27(11):1365-72.
Randomized, 24-week prospective; 65 overweight and obese adults entering the 24-week Diabetes and Cardiovascular Risk Reduction Program (California)
Almond-LCD: formula based LCD with 84 g/d of almonds 32/39/29 with 25% MUFA; CHO-LCD: formula based LCD with self-selected complex carbohydrates 53/18/29 with 5% MUFA
Almond-LCD vs. CHO-LCD (% change from baseline); weight/BMI -18% vs. -11%; waist circumference -14% vs. -9%; fat mass -30% vs. -20%; SBP -11% vs. 0%; HDL-C -6% vs. +15%; Glucose, insulin, DBP, TC, triglycerides, LDL-C and LDL-C to HDL-C ratio decreased to a similar extent in both groups
Statistically significant for differences; weight/BMI p<0.0001; WC p<0.05; fat mass p<0.05; SBP p<0.01; HDL-C p<0.05
Summary - Almond-enriched LCD improved abnormalities associated with metabolic syndrome. (MUFA: CHO)

2005 Dietary Guidelines Advisory Committee Report
Metabolic Syndrome Summary Table Key ApoA apolipoprotein A ApoB apolipoprotein B AUC area under curve BMI body mass index CHO carbohydrate CI confidence interval DSP diastolic blood pressure FBG fasting blood glucose FFA free fatty acids FM fat mass GI glycemic index HC high carbohydrate HDL-C high density lipoprotein HF high fat HgbA1c glycosylated hemoglobin HM high monounsaturated fatty acids HP high polyunsaturated fatty acids HS high saturated fatty acids HTN hypertension IAUC incremental area under curve LC low carbohydrate LDL-C low density lipoprotein Lp(a) lipoprotein (a) MUFA monounsaturated fatty acids NIDDM non-insulin dependent diabetes mellitus OR odds ratio PAI-1 plasma activator inhibitor PUFA polyunsaturated fatty acids RLP remnant lipoprotein SBP systolic blood pressure SFA saturated fatty acids SI insulin sensitivity TC total cholesterol TG triglycerides WC waist circumference
85

2005 Dietary Guidelines Advisory Committee Report
Added Sugar Literature Summary Study/Citation Design and Subjects Results Authors’ Conclusions Berkey, CS, et al.; 2004. Sugar-added beverages and adolescent weight change. Obes Res 12(5): 778-88.
Prospective cohort study , 2 year follow-up Included >10,000 boys and girls, 9 to 14 years old, participating in the U.S. Growing Up Today Study. Examined the relationship between BMI changes and intakes of sugar-added beverages, milk, fruit juices, and diet soda. Analyses adjusted for activity and inactivity.
Consumption of sugar-added beverages was associated with small BMI gains during the corresponding year (boys: +0.03 kg/m2 per daily serving, p = 0.04; girls: +0.02 kg/m2, p = 0.096). In models not assuming a linear dose-response trend, girls who drank 1 serving/d of sugar-added beverages gained more weight (+0.068, p = 0.02) than girls drinking none, as did girls drinking 2 servings/d (+0.09, p = 0.06) or 3+ servings/d (+0.08, p = 0.06). Analyses of year-to-year change in beverage intakes provided generally similar findings; boys who increased consumption of sugar-added beverages from the prior year experienced weight gain (+0.04 kg/m2 per additional daily serving, p = 0.01). Children who increased intakes by 2 or more servings/d from the prior year gained weight (boys: +0.14, p = 0.01; girls +0.10, p = 0.046). Further adjusting our models for total energy intake substantially reduced the estimated effects, which were no longer significant.
Consumption of sugar-added beverages may contribute to weight gain among adolescents, probably due to their contribution to total energy intake, because adjustment for calories greatly attenuated the estimated associations.
Berkey CS, et al. 2000. Activity, dietary intake, and weight changes in a longitudinal study of preadolescent and adolescent boys and girls. Pediatrics 105(4): E56.
Prospective cohort study, 1 year 6149 girls and 4620 boys, 9 to 14 years old
Girls who reported higher caloric intakes had larger increases in BMI (.0061 +/-.0026 kg/m(2) per 100 kcal/day; beta +/- standard error), less physical activity (-.0284 +/-.0142 kg/m(2)/hour/day) and more time with TV/videos/games (.0372 +/-.0106 kg/m(2)/hour/day) Larger BMI increases were found among boys who reported more time with TV/videos/games (.0384 +/-.0101). For both boys and girls, a larger rise in caloric intake from 1996 to 1997 predicted larger BMI increases
For both boys and girls, a 1-year increase in BMI was larger in those who reported more time with TV/videos/games during the year between the 2 BMI measurements, and in those who reported that their caloric intakes increased more from 1 year to the next. Larger year-to-year increases in BMI were also seen among girls who reported higher caloric intakes and less physical activity during the year between the 2 BMI measurements. Although the magnitudes of these estimated effects were small,
86

2005 Dietary Guidelines Advisory Committee Report
87
Abstract reviewed, paper requested, 21 July 04.
(girls:.0059 +/-.0027 kg/m(2) per increase of 100 kcal/day; boys:.0082 +/-.0030). No significant associations were noted for energy-adjusted dietary fat or fiber.
their cumulative effects, year after year during adolescence, would produce substantial gains in body weight.
Forshee RA, Storey ML; 2003 Total beverage consumption and beverage choices among children and adolescents. Int J Food Sci Nutr. 2003 Jul;54(4):297-307.
Cross-sectional, multiple regression models Data from CSFII ‘94-‘96, ‘98. All races, both sexes, ages 6-11 and 12-19. Ind variables included BMI, age, race, and family income. Physical activity was not examined.
Age, race, and gender play a significant role in the total amount, types, and relative proportions of beverages consumed by children and adolescents. Individuals in the first decile drink approximately 212.9 g beverages per day, indiv. in the tenth decile drink 2036.2 g. Boys drink more of most beverages than girls. Older teens tend to drink more carbonated beverages, fruit drinks/ades, and citrus juice, but less fluid milk and non-citrus juice. Mean consumption of all beverages generally increased across the deciles of total consumption for 6-19yr olds. White adolescent boys are heavy consumers of most beverages, including carbonated soft drinks, milk, and fruit drinks/ades.
BMI is positively assoc. with consumption of diet carbonated bev. and neg. associated with consumption of citrus juice. BMI was not associated with consumption of milk, reg. carbonated bev., reg. or diet fruit drinks/ades, or non-citrus juices. Total beverage consumption and bev. choices are strongly related to age, race, and gender. BMI was only related to consumption of diet carbonated beverages and milk, and those relationships were weak.
Forshee, unpublished; 2004
Frary CD, et al. (2004). Children and adolescents' choices of foods and beverages high in added sugars are associated with intakes of key nutrients and food groups. J Adolesc
Cross-sectional CSFII 1994-96 and 1998 3038 individuals ( 1913 children age 6-11 and 1125 adolescents age 12) Examined associations between intakes of the primary food and beverage sources of added sugars and
Consumption of sweetened dairy products was positively associated with calcium intakes for children and adolescents. Consumption of presweetened cereals increased the likelihood of the children and adolescents meeting recommendations for the essential shortfall micronutrients calcium, folate, and iron, whereas the consumption of sugar-sweetened beverages, sugars and sweets, and sweetened grains decreased the likelihood of meeting the Dietary Reference Intakes (DRI) for these nutrients.
On average, consumption of sweetened dairy foods and beverages and presweetened cereals had a positive impact on children and adolescents' diet quality, whereas sugar-sweetened beverages, sugars and sweets, and sweetened grains had a negative impact on their diet quality.

2005 Dietary Guidelines Advisory Committee Report
Health 34(1): 56-63. intakes of key nutrients and food pyramid groups among U.S. children. Physical activity and BMI were not examined.
Only children who were non-consumers of sugar-sweetened beverages had a mean calcium intake that met the adequate intakes (AI). Consumption of sweetened dairy products and presweetened cereals was positively associated with the number of dairy servings consumed per day for both age groups.
Giammattei J, et al.; 2003. Television watching and soft drink consumption: associations with obesity in 11- to 13-year-old schoolchildren. Arch Pediatr Adolesc Med 157(9): 882-6.
Cross-sectional study 385 Sixth- and seventh-grade students (186 boys, 199 girls) Height, weight, and body fat were measured. Total physical activity level was not examined, but TV viewing was.
35.3% of students had a BMI > 85th percentile, and half of these students (17.4%) had a BMI > the 95th percentile. Significant associations were found between BMI and hours of television watched per evening and daily soft drink consumption. The mean (SE) BMI z score for those watching less than 2 hours per night (0.34 [0.09]) was lower than for those watching 2 or more hours per night (0.82 [0.08]; P<.001). The mean (SE) BMI z score for those consuming less than 3 soft drinks per day (0.51 [0.07]) was lower than for those consuming 3 or more soft drinks per day (1.02 [0.13]; P =.003). Latino students watched more television (2.4 hours per night) than did non-Hispanic white or Asian students (1.3 hours per night; P<.001 for each) and consumed more soft drinks (1.6 per day) than non-Hispanic white students (1.1 per day; P =.004) or Asian students (0.7 per day; P<.001).
Time spent watching television and the number of soft drinks consumed were significantly associated with obesity. Latinos spent more time
Gillis LJ and O Bar-Or; 2003. Food away from home, sugar-sweetened drink consumption and juvenile obesity. J Am
Cross-sectional study 181 children and adolescents ages 4 - 16, 91 obese ( BMI>95th%), 90 non-obese (BMI < 75th %) Food intake obtained using
Obese children and adolescents consumed significantly more servings of meat and alternatives, grain products, food away from home (FAFH), sugar-sweetened drinks and potato chips which contributed to a higher calorie, fat and sugar intake compared to non-obese children and adolescents. The consumption of meat servings, sugar-sweetened
Obese children and adolescents need to limit their access to food consumed away from home and sugar-sweetened drinks as there is a relationship between these foods and body fatness.
88

2005 Dietary Guidelines Advisory Committee Report
Coll Nutr 22(6): 539-45.
dietary history and food frequency questionnaire. Body fat determined by bioelectrical impedance. Physical activity was not examined.
drinks and FAFH was positively correlated with percent body fat.
Harnack L, et al.; 1999. Soft drink consumption among US children and adolescents: nutritional consequences. J Am Diet Assoc 99(4): 436-41.
Cross-sectional 1810 children, aged 2 to 18 years Data was from CSFII 1994 Logistic regression analyses were conducted to predict the odds of low milk and juice consumption by soft drink consumption level. Physical activity was not examined.
Energy intake was positively associated with consumption of non-diet soft drinks. Mean adjusted energy intake was 1830 kcal/day for non-consumers of soft drinks compared with 2018 kcal/day for children who consumed an average of 9 oz of soda or more per day. Those in the highest soft drink consumption category consumed less milk and fruit juice compared with those in the lowest consumption category (non-consumers).
Nutrition education messages targeted to children and/or their parents should encourage limited consumption of soft drinks. Policies that limit children's access to soft drinks at day care centers and schools should be promoted.
James J, et al.; 2004. Preventing childhood obesity by reducing consumption of carbonated drinks: cluster randomised controlled trial. BMJ, 328(7450): 1237.
Randomized controlled trial, school based intervention to reduce consumption of carbonated beverages, 29 classroom sized clusters from six primary schools 644 children, 7-11 yo (320 girls, 324 boys) BMI, height and weight measured at baseline, 6
Consumption of carbonated drinks over three days decreased by 0.6 glasses (average glass size 250 ml) in the intervention group but increased by 0.2 glasses in the control group (mean difference 0.7, 95% confidence interval 0.1 to 1.3). At 12 months the percentage of overweight and obese children increased in the control group by 7.5%, compared with a decrease in the intervention group of 0.2% (mean difference 7.7%, 2.2% to 13.1%).
A targeted, school based education program produced a modest reduction in the number of carbonated drinks consumed, which was associated with a reduction in the number of overweight and obese children.
89

2005 Dietary Guidelines Advisory Committee Report
and 12 months. Physical activity was not examined.
Ludwig DS, et al.; 2001. Relation between consumption of sugar-sweetened drinks and childhood obesity: a prospective, observational analysis. Lancet 357(9255): 505-8..
Prospective cohort study, 19 months 548 ethnically diverse schoolchildren (age 11.7 years, SD 0.8) Independent variable was sugar-sweetened drinks. Assessed BMI and frequency of obesity. Used linear and logistic regression. Adjusted for confounding variables and clustering of results within schools. Physical activity was examined.
For each additional serving of sugar-sweetened drink consumed, both body mass index (BMI) (mean 0.24 kg/m2; 95% CI 0.10-0.39; p=0.03) and frequency of obesity (odds ratio 1.60; 95% CI 1.14-2.24; p=0.02) increased after adjustment for anthropometric, demographic, dietary, and lifestyle variables. Baseline consumption of sugar-sweetened drinks was also independently associated with change in BMI (mean 0.18 kg/m2 for each daily serving; 95% CI 0.09-0.27; p=0.02).
Consumption of sugar-sweetened drinks is associated with obesity in children.
90

2005 Dietary Guidelines Advisory Committee Report
Mrdjenovic, G. and D. A. Levitsky; 2003. Nutritional and energetic consequences of sweetened drink consumption in 6- to 13-year-old children. J Pediatr 142(6): 604-10. July 04.
Small, short-term longitudinal study Daily dietary intakes of 30 children aged 6 to 13 years old were collected over 4 to 8 weeks. Weights and heights of children were measured at the beginning and end of the study in 21 children. Data were analyzed by ANOVA and multiple regression.
Excessive sweetened drink consumption (>12 oz/day) displaced milk from children's diets (122-147 g/day less milk drank, P <.0001) because caregivers served less milk and the children consumed smaller amounts of milk. The consequences were lower daily protein, calcium, magnesium, phosphorus, and vitamin A intakes. Because children failed to reduce consumption of solid foods to compensate for the caloric contribution of sweetened drinks, higher daily energy intakes were observed. The greater the sweetened drink consumption the greater the weight gain (1.12 +/- 0.7 kg) compared with children who consumed <12 oz per day (0.32-0.48 +/- 0.4 kg).
Excessive sweetened drink consumption is associated with the displacement of milk from children's diets, higher daily energy intake, and greater weight gain.
Newby PK, al.; 2004. Beverage consumption is not associated with changes in weight and body mass index among low-income preschool children in North Dakota. J Am Diet Assoc 104(7): 1086-94.
Prospective cohort study, 1 year 1345 children age 2 to 5, North Dakota Special WIC program participants Linear regression analyzed the association between beverage consumption and annual change in weight and body mass index. Study also dichotomized fruit juice, fruit drinks, and milk at high intakes. Physical activity was not examined.
Weight change was not significantly related to intakes (per ounce) of fruit juice (beta=0.01 lb/year, 95% CI: -0.01 to 0.20, P=.28), fruit drinks (beta=-0.03 lb/year, 95% CI: -0.07 to 0.01, P=.28), milk (beta=0.00 lb/year, 95% CI: -0.02 to 0.02, P=.86), soda (beta=-0.00 lb/year, 95% CI: -0.08 to 0.08, P=.95), or diet soda (beta=0.01 lb/year, 95% CI: -0.11 to 0.13, P=.82). Findings remained null upon examination of associations with body mass index and when fruit juice, fruit drinks, and milk were dichotomized at high intake levels in both analyses. Adjusted for age, sex, energy intake, change in height, and additional sociodemographic variables.
Study did not show an association between beverage consumption and changes in weight or body mass index in this population of low-income preschool children in North Dakota.
91

2005 Dietary Guidelines Advisory Committee Report
Nicklas TA, et al.; 2003. Eating patterns and obesity in children. The Bogalusa Heart Study. Am J Prev Med. Jul;25(1):9-16.
Cross-sectional study 24-hr dietary recall of 1562 children aged 10 years (65% Euro-American [EA], 35% African American [AA]) over a 21-yr period. Multivariate logistic regression was used to investigate association between eating patterns and overweight. Overweight defined as BMI > 85th percentile using CDC reference standards. Physical activity was not examined.
Consumption that was positively associated with overweight status included: sweetened beverages (58% soft drinks, 20% fruit flavor drinks, 19% tea, and 3% coffee) (p<0.001); sweets (desserts, candy, and sweetened bev) (p<0.001); meats (mixed meats, poultry, seafood, eggs, pork, and beef) (p<0.051); and total consumption of low-quality foods (p<0.01) Total amt of food consumed, specifically from snacks, was positively associated with overwt status (p<0.05). There was a lack of congruency in the types of eating patterns associated with overwt status across 4 ethnic-gender groups. % variance explained from the eating pattern-overwt models was very small. The interaction of ethnicity and gender was significantly associated with overwt status (p<0.001). The odds of being overwt for EA males were 1.2 times higher than for AA females.
Numerous eating patterns were associated with overwt status, yet the odds of being overwt were very small. Additional studies are needed to confirm these findings in a longitudinal sample having multiple days of assessment.
Phillips SM, et al.; 2004. Energy-dense snack food intake in adolescence: longitudinal relationship to weight and fatness. Obes Res 12(3): 461-72.
Prospective cohort study 196 girls, non-obese 8 to 12 yo, followed until 4 years after menarche. Data collected on percentage body fat (%BF), BMI z score, and dietary intake. Categories of energy dense snack (EDS) foods considered were baked goods, ice cream, chips, sugar-sweetened soda, and
At study entry, girls had a mean +/- SD BMI z score of -0.27 +/- 0.89, consumed 2.3 +/- 1.7 servings of EDS foods per day, and consumed 15.7 +/- 8.1% of daily calories from EDS foods. Linear mixed effects modeling indicated no relationship between BMI z score or %BF and total EDS food consumption. Soda was the only EDS food that was significantly related to BMI z score over the 10-year study period, but it was not related to %BF. In addition, a significant, positive relationship was observed between EDS food consumption and television viewing
In this cohort of initially non-obese girls, overall EDS food consumption does not seem to influence weight status or fatness change over the adolescent period.
92

2005 Dietary Guidelines Advisory Committee Report
93
candy. Physical activity was not examined, but TV viewing was.
Schulze MB, et al.; in press 2004. Sugar-sweetened beverages, weight gain, and incidence of type 2 diabetes in young and middle-aged women.
Prospective cohort study, Nurses’ Health Study II, 8 years of follow-up Diabetes analysis, n = 91,249 women free of diabetes and other major chronic diseases at baseline in 1991. Weight change analysis, n = 51,603 women for whom complete dietary information and body weight were ascertained in 1991, 1995, and 1999. 741 incident cases of confirmed type 2 diabetes were identified during 716,300 person-years of follow-up.
Those with stable consumption patterns had no difference in weight gain, but weight gain over a 4-year period was highest among women who increased their sugar-sweetened soft drink consumption from ≤1/week to ≥1/day (multivariate adjusted means: 4.69 kg for 1991-95, 4.20 kg for 1995-99), and smallest among women who decreased their intake (1.34 and 0.15 kg for the two time periods), after adjusting for lifestyle and dietary confounders. An increased consumption of fruit punch was also associated with greater weight gain compared to those who decreased their consumption. After adjustment for potential confounders, women consuming sugar-sweetened soft drinks ≥1/day had a relative risk of type 2 diabetes of 1.83 (95% CI: 1.42-2.36; P<0.001 for trend) compared with those who consumed these beverages <1/month. Similarly, consumption of fruit punch was associated with increased diabetes risk (RR ≥1/day compared with <1/month: 2.00; 95% CI: 1.33-3.03; P=0.001).
Higher consumption of sugar-sweetened beverages is associated with a greater magnitude of weight gain and an increased risk for developing type 2 diabetes in women, possibly by providing excessive calories and large amounts of rapidly absorbable sugars.
Skinner, J. D., et al.; 2003. Longitudinal calcium intake is negatively related to children's body fat indexes. J Am Diet Assoc 103(12): 1626- 31.
Prospective, 8yr follow-up 52 white children (25 boys, 27 girls) Height, weight, dietary intakes, and related variables were monitored from ages 2 months to 8 years during in-home interviews.
At 8 years of age, mean BMI was 17.3+/-2.1 (standard deviation) for boys and 17.1+/-2.5 for girls. Percent BF was 22.7+/-6.7 for boys and 26.2+/-7.9 for girls, as assessed by DEXA. Dietary variety was positively related to calcium intake, and intakes of carbonated beverages and other sweetened beverages were negatively related. Dietary calcium (mg) and polyunsaturated fat intake (g) were negatively related to percent BF (P=.02 to.04) in 3 statistical
Children should be strongly encouraged to regularly include calcium-rich foods and beverages in their diets

2005 Dietary Guidelines Advisory Committee Report
At age 8, children’s percent F and kg BF were assessed by dual energy x-ray absorptiometry (DEXA). Sedentary activity was examined.
models, which predicted 28% to 34% of the variability in BF among children. Variables positively associated with percent BF were total dietary fat (g) or saturated fat (g), female gender, sedentary activity (hours/day), father's BMI, and mothers' percent BF. Calcium intakes were significantly correlated over time.
Storey ML, et al., 2003. Demographic and lifestyle factors associated with BMI among children and adolescents. Int J Food Sci Nutr. Nov;54(6):491-503.
Cross-sectional study CSFII) 1994-1996-98 sample contained 5739 children aged 6-11 and 4182 adolescents aged 12-19 NHANES III sample contained 4720 children and 2216 adolescents Multivariate regression models examined assoc. between age, gender, race/ethnicity, family income, diet, and TV viewing) and BMI. Physical activity data was available only for the NHANES samples.
Among the lifestyle variables, dietary factors were not associated with BMI in children. Carbohydrates (less added sugars) had a statistically significant inverse relationship to BMI among adolescents. In both children and adolescents, television viewing was markedly associated with BMI, and participation in team sports was negatively associated with BMI. In the children's model, the statistically significant demographic predictors of BMI were age, race, gender, and family income. Among adolescents, the demographic predictors were age, race, and gender.
The overall process by which overwt. develops is complex, and our 4 models explained only a small portion of total variance of BMI. The CSFII models explained 8.5% of the variance for children and 11.4% of the variance for adolescents. The NHANES models explained 8.8% of the variance for children and 12.5% of the variance for adolescents. Demographic variables accounted for roughly one-half of the explained variance for both children and adolescents. The rest of the explained variance was accounted for by TV viewing, diet, and family income.
94

2005 Dietary Guidelines Advisory Committee Report
Storey et al.; 2004. Associations of Adequate Intake of Calcium with Diet, Beverage Consumption, and Demographic Characteristics among Children and Adolescents. J Am Coll Nutr. 23: 18-33.
Cross-sectional study; regression analysis. Data was CSFII ‘94-‘96, ‘98 Age groups (2-3, 4-8, 9-13, and 14-18 yo) based on calcium AI of - 500, 800, 1300, and 1300 mglday, respectively. Physical activity and BMI were not examined.
Consumption of milk products strongly and positively associated w/ Ca intake. Consumption of soft drinks & other non-dairy bev. was also positively associated w/ Ca intake, but assoc. was very weak. Bev. choices of African-American children and adolescents significantly different than white & Hispanic children& adolescents. African-American adolescent girls consume fewer milk products & more fruit drinks/ades. Ave. daily soft drink consump. is approx. 1.6 and 1.0 – 12oz cans among 14-18 yr. old boys & girls, respectively.
Soft drink consumption in adolescent girls is modest and doesn’t appear to be linked to decreased Ca intake. Creative effective, efficient, & targeted policies should be considered to help adolescent girls increase Ca intake. Making low-fat milk products, flavored milks, calcium-fortified bev. and foods more attractive & available will help encourage girls to consume more Ca.
95

2005 Dietary Guidelines Advisory Committee Report
Summary Table: Types of Fiber and Coronary Heart Disease Quintiles Reference and Study Design
1 2 3 4 5 P for Trend
Notes
Incidence of CHD Energy Intake kcal/d 2722 2787 2781 2754 2705Dietary Fiber g/d 16.1 20.7 24.3 28.3 34.8Dietary Fiber g/1000 kcal 5.9 7.4 8.7 10.3 12.9 Multivariate Relative Risk (RR)
1.00 0.91 0.88 0.86 0.84 p = 0.03
Soluble Fiber g/d 3.7 4.7 5.4 6.2 7.4 Multivariate RR 1.00 0.84 0.85 0.74 0.79 p = 0.04 Insoluble Fiber g/d 12.2 15.9 18.9 22.3 27.7 Multivariate RR 1.00 0.92 0.89 0.85 0.86 p = 0.07 Fatal CHD Energy Intake kcal/d 2722 2787 2781 2754 2705Dietary Fiber g/d 16.1 20.7 24.3 28.3 34.8Dietary Fiber g/1000 kcal 5.9 7.4 8.7 10.3 12.9 Multivariate RR 1.00 0.87 0.78 0.67 0.68 p = <0.001 RR between 1st and 5th
quintiles was 0.45 Soluble Fiber g/d 3.7 4.7 5.4 6.2 7.4 Multivariate Relative Risk 1.00 0.73 0.77 0.59 0.68 p = 0.003 Insoluble Fiber g/d 12.2 15.9 18.9 22.3 27.7
Pietinen et al., 1996
21,930 Finnish men, 50–69 y, 6-y follow-up
Multivariate RR 1.00 0.94 0.82 0.70 0.71 p = 0.002
Total CHD (fatal & non-fatal) Energy Intake kcal/d 2000 2000 2000 2000 2000Dietary Fiber g/d 12.4 16.6 19.6 23.0 28.9Dietary Fiber g/1000 kcal 6.2 8.3 9.8 11.5 14.45 Age-adjusted RR 1.00 0.97 0.91 0.87 0.59 p = <0.001 RR per 10 g increase =
0.56 Multivariate RR 1.00 1.01 0.96 0.92 0.64 p = 0.004 Non-fatal CHD, Age-adjusted 1.00 0.86 0.87 0.93 0.65 p = 0.02
Rimm et al., 1996 43,757 U.S. men, 40–75 y 6-y follow-up
Fatal CHD, Age-adjusted RR 1.00 1.22 1.02 0.73 0.45 p = <0.001
96

2005 Dietary Guidelines Advisory Committee Report
97
Quintiles Reference and Study Design
1 2 3 4 5 P for Trend
Notes
Total CHD (fatal & non-fatal) Energy Intake kcal/d 1,600 1,600 1,600 1,600 1,600 Dietary Fiber g/d 11.5 14.3 16.4 18.8 22.9 Dietary Fiber g/1000 kcal 7.2 8.9 10.25 11.75 14.31
Wolk et al., 1999 68,782 U.S. women, 37–64y, 10-y follow-up
Age-adjusted RR 1.00 0.98 0.92 0.87 0.77 p = 0.07
Cardiovascular Disease (CVD)
Energy Intake kcal/d 1707 1742 1752 1734 1694 Dietary Fiber g/d 12.5 15.7 18.2 21.1 26.3 Dietary Fiber g/1000 kcal 7.32 9.13 10.39 12.10 15.52 Age-adjusted RR 1.00 0.71 0.72 0.64 0.65 p = 0.001 Soluble Fiber g/d 3.7 4.8 5.8 6.5 8.6 Age-adjusted RR 1.00 0.92 0.88 0.85 0.74 p = 0.02 Insoluble Fiber g/d 9.5 12.2 14.2 14.5 21.8 Age-adjusted RR 1.00 0.79 0.66 0.68 0.69 p = 0.006 Myocardial Infarction (MI) Dietary Fiber g/d 12.5 15.7 18.2 21.1 26.3 Age-adjusted RR 1.00 0.54 0.54 0.43 0.46 p = 0.0005 RR between 1st and 5th
quartile = 0.46 Soluble Fiber g/d 3.7 4.8 5.8 6.5 8.6 Age-adjusted RR 1.00 0.74 0.63 0.54 0.56 p = 0.0005 Insoluble Fiber g/d 9.5 12.2 14.2 14.5 21.8
Liu, et al., 2002 39.876 U.S. women, 45-75 y; Women’s Health Study 6-y follow-up
Age-adjusted RR 1.00 0.83 0.66 54 0.54 p = 0.002
Incidence of CHD Quartiles Energy Intake kcal/d 1794 1836 1713 1596 Dietary Fiber g/d 5.8 10.0 13.1 22,2 Dietary Fiber g/1000 kcal 3.23 5.44 7.64 13.90 Age-adjusted RR 1.00 1.01 0.91 0.88 p = 0.05 RR for 10g increase =
0.93 Soluble Fiber g/d <1.3 1.3-2.3 2.4-4.0 >4.0
Bazzano, et al., 2003 9,776 U.S. adults, NHANES 19-y follow-up
Age-adjusted RR 1.00 1.04 0.88 0.85 p = 0.004 RR between 1st and 4th quartile = 0.85

2005 Dietary Guidelines Advisory Committee Report
Meta-analysis
Incidence of CHD per 10g/d increments of fiber
All CHD Events
P for Trend
Fatal CHD
P for Trend
Total Dietary Fiber (Model 3) 0.86 p =0.005 0.73 p< 0.001 Soluble Fiber RR 0.72 * 0.46 * Insoluble Fiber RR 0.90 * 0.80 *
Pereira, et al., 2004 245186 women and 91058 men, 6 to 10-yr follow-up, pooled analysis of 10 cohort studies (2506581 person-years)
* The paper did not provide p values.
98

2005 Dietary Guidelines Advisory Committee Report
References: Bazzano, L.A., et al., Dietary fiber intake and reduced risk of coronary heart disease in US men and women: the National Health and Nutrition Examination Survey I Epidemiologic Follow-up Study. Arch Intern Med, 2003. 163(16): p. 1897-904. Liu, S., et al., A prospective study of dietary fiber intake and risk of cardiovascular disease among women. J Am Coll Cardiol, 2002. 39(1): p. 49-56. Mozaffarian D et al., Cereal, fruit, and vegetable fiber intake and the risk of cardiovascular disease in elderly individuals. JAMA. 2003 Apr 2;289(13):1659-66. Pietinen, P., Rimm E.B., et al., Intake of dietary fiber and risk of coronary heart disease in a cohort of Finnish men: The alpha-tocopherol, beta-carotene cancer prevention study. Circulation, 1996; 94, 2720-2727. Pereira, M.A., et al., Dietary fiber and risk of coronary heart disease: a pooled analysis of cohort studies. Arch Intern Med, 2004. 164(4): p. 370-6. Rimm, E.B., et al., Vegetable, fruit, and cereal fiber intake and risk of coronary heart disease among men. JAMA, 1996; 275, 447-51. Wolk, A., Manson J.E., Stampfer M.J., Colditz G.A., Hu F.B., Speizer F.E., Hennekens C.H. and Willett W.C. Long-term intake of dietary fiber and decreased risk of coronary heart disease among women. Journal of the American Medical Association,1999; 281: 1998-2004
99

2005 Dietary Guidelines Advisory Committee Report
Summary Table: Sources of Fiber and Coronary Heart Disease – Prospective Studies Quintiles
Reference and Study Design
1 2 3 4 5 P for Trend
Notes
Incidence of CHD Energy Intake kcal/d 2722 2787 2781 2754 2705Dietary Fiber g/d 16.1 20.7 24.3 28.3 34.8Dietary Fiber g/1000 kcal 5.9 7.4 8.7 10.3 12.9 Multivariate Relative Risk (RR)
1.00 0.91 0.88 0.86 0.84 p = 0.03
Cereal Fiber g/d 12.2 15.9 18.9 22.3 27.7 Multivariate RR 1.00 0.92 0.89 0.85 0.86 p = 0.07 Vegetable Fiber g/d 2.9 3.9 4.7 5.6 7.1 Multivariate RR 1.00 0.91 0.79 0.72 0.84 p = 0.003 Fruit Fiber g/d 0.7 1.5 2.4 3.4 5.3 Multivariate RR 1.00 1.00 1.03 0.90 0.90 p = 0.11 Fatal CHD Dietary Fiber g/d 16.1 20.7 24.3 28.3 34.8 Multivariate RR 1.00 0.87 0.78 0.67 0.68 p = <0.001 RR between 1st and 5th
quintiles was 0.45 Cereal Fiber g/d 8.8 12.8 16.0 19.9 26.3 Multivariate RR 1.00 0.92 0.93 0.84 0.77 p = 0.03 Vegetable Fiber g/d 2.9 3.9 4.7 5.6 7.1 Multivariate RR 1.00 0.80 0.80 0.57 0.73 p = <0.001 Fruit Fiber g/d 0.7 1.5 2.4 3.4 5.3
Pietinen et al., 1996
21,930 Finnish men, 50–69 y, 6-y follow-up
Multivariate RR 1.00 0.95 1.09 0.92 0.82 p = 0.03
Total CHD (fatal & non-fatal) Energy Intake kcal/d 2000 2000 2000 2000 2000Dietary Fiber g/d 12.4 16.6 19.6 23.0 28.9Dietary Fiber g/1000 kcal 6.2 8.3 9.8 11.5 14.45 Age-adjusted RR 1.00 0.97 0.91 0.87 0.59 p = <0.001 RR per 10 g increase =
0.56 Fatal CHD, Age-adjusted RR 1.00 1.22 1.02 0.73 0.45 p = <0.001 Fruit Fiber g/d 3.7 4.7 5.4 6.2 7.4 Multivariate RR 1.00 0.93 0.83 0.84 0.81 p = 0.10 Vegetable Fiber g/d 3.2 4.8 6.1 7.8 11.1 Multivariate RR 1.00 1.08 0.99 1.00 0.83 p = 0.05
Rimm et al., 1996 43,757 U.S. men, 40–75 y, 6-y follow-up
Cereal Fiber g/d 2.2 3.7 5.0 6.8 9.7
100

2005 Dietary Guidelines Advisory Committee Report
p = 0.007 Multivariate RR 1.00 0.96 0.88 0.86 0.71 Quintiles
Reference and Study Design
1 2 3 4 5 P for Trend
Notes
Total CHD (fatal & non-fatal) Energy Intake kcal/d 1,600 1,600 1,600 1,600 1,600
Wolk et al., 1999
Dietary Fiber g/d 11.5 14.3 16.4 18.8 22.9 68,782 U.S.
Dietary Fiber g/1000 kcal 7.2 8.9 10.25 11.75 14.31 women, Age-adjusted RR 1.00 0.98 0.92 0.87 0.77 p = 0.07 37–64 y, Fruit Fiber g/d 1.3 2.4 3.4 4.6 6.8 10-y follow-up
p = 0.79 Multivariate RR 1.00 0.90 0.80 0.98 0.91 RR per 5g fruit fiber increase = 0.98
Vegetable Fiber g/d 3.6 4.9 5.9 7.1 9.5 Multivariate RR 1.00 0.95 0.97 0.92 0.86 p = 0.38 RR per 5g vegetable
fiber increase = 0.93 Cereal Fiber g/d 2.2 3.7 5.0 6.8 9.7 Multivariate RR p = <0.001 1.00 1.06 0.71 0.76 0.66 RR per 5g cereal fiber
increase = 0.63
Cardiovascular Disease (CVD)
Energy Intake kcal/d 1707 1742 1752 1734 1694 Dietary Fiber g/d 12.5 15.7 18.2 21.1 26.3 Dietary Fiber g/1000 kcal 7.32 9.13 10.39 12.10 15.52 Age-adjusted RR 1.00 0.71 0.72 0.64 0.65 p = 0.001 Fruit Fiber g/d 2.5 3.5 .42 4.9 6.0 Multivariate RR 1.00 0.94 1.10 0.80 0.82 p = 0.09 Vegetable Fiber g/d 5.9 6.4 6.8 7.2 8.0 Multivariate RR 1.00 0.89 1.10 1.07 0.96 p = 0.78 Cereal Fiber g/d 3.0 3.8 4.4 5.0 6.5 Multivariate RR 1.00 1.00 1.09 1.08 1.11 p = 0.38 Myocardial Infarction (MI) Fruit Fiber g/d 2.5 3.5 .42 4.9 6.0 Multivariate RR 1.00 0.94 1.10 0.80 0.82 p = 0.09 Vegetable Fiber g/d 5.9 6.4 6.8 7.2 8.0 Multivariate RR 1.00 0.89 1.10 1.07 0.96 p = 0.78 Cereal Fiber g/d 3.0 3.8 4.4 5.0 6.5
Liu, et al., 2002 39.876 U.S. women, 45-75 y; Women’s Health Study, 6-y follow-up
Multivariate RR 1.00 1.00 1.09 1.08 1.11 p = 0.38
101

2005 Dietary Guidelines Advisory Committee Report
Quintiles
Reference and Study Design
1 2 3 4 5 P for Trend
Notes
Incidence of Cardiovascular Disease (CVD)
Energy Intake, kcal/d – mean for population
1820 1820 1820 1820 1820
Total Fiber g/d* <9.7 9.7-13.2 13.5-17.6 17.9-23.0 >23.0 Age-adjusted RR (Model 1) 1.00 0.95 0.90 0.92 0.77 p = 0.03 Fruit Fiber, range g/d <2.8 2.8-4.2 4.3-5.7 5.8-7.5 >7.5 Multivariate RR (Model 1) 1.00 0.91 0.85 0.93 0.88 p = 0.36 Vegetable Fiber, range g/d <4.2 4.2-5.7 5.8-7.2 7.3-9.2 >9.2 Multivariate RR (Model 1) 1.00 1.00 1.13 0.82 1.06 p = 0.99 Cereal Fiber, range g/d <1.7 1.7-3.3 3.4-4.7 4.8-6.3 >6.3
Mozaffarian, et al., 2003 3588 U.S. men and women, > 65 y; 10-y follow-up
Multivariate RR (Model 1) 1.00 0.97 0.81 0.83 0.78 p = 0.009 * Total fiber intakes were not stated in the paper although relative risks by quintile range were given. The values in this table represent the sum of the fruit, vegetables and cereal fiber ranges.
Quartiles
Reference and Study Design
1 2 3 4 P for Trend
Notes
Incidence of CHD Energy Intake kcal/d 1794 1836 1713 1596 Dietary Fiber g/d 5.8 10.0 13.1 22,2 Dietary Fiber g/1000 kcal 3.23 5.44 7.64 13.90
Bazzano, et al., 2003 9,776 U.S. adults, NHANES 19-y follow-up
Age-adjusted RR 1.00 1.01 0.91 0.88 p = 0.05 RR for 10g increase = 0.93
Meta-analysis
Incidence of CHD per 10g/d increments of fiber
All CHD Events
P for Trend
Fatal CHD
P for Trend
Total Dietary Fiber (Model 3) 0.86 p =0.005 0.73 p< 0.001 Fruit Fiber RR 0.84 p = 0.04 0.70 p = 0.004 Vegetable Fiber RR 1.00 p = 0.97 1.00 p = 0.97 Cereal Fiber RR 0.90 p = 0.23 0.75 p = 0.003
Pereira, et al., 2004 245186 women and 91058 men, 6 to 10-yr f/up, pooled analysis of 10 cohort studies (2506581 person-years)
102

2005 Dietary Guidelines Advisory Committee Report
References: Bazzano, L.A., et al., Dietary fiber intake and reduced risk of coronary heart disease in US men and women: the National Health and Nutrition Examination Survey I Epidemiologic Follow-up Study. Arch Intern Med, 2003. 163(16): p. 1897-904. Liu, S., et al., A prospective study of dietary fiber intake and risk of cardiovascular disease among women. J Am Coll Cardiol, 2002. 39(1): p. 49-56. Mozaffarian D et al., Cereal, fruit, and vegetable fiber intake and the risk of cardiovascular disease in elderly individuals. JAMA. 2003 Apr 2;289(13):1659-66. Pietinen, P., Rimm E.B., et al., Intake of dietary fiber and risk of coronary heart disease in a cohort of Finnish men: The alpha-tocopherol, beta-carotene cancer prevention study. Circulation, 1996; 94, 2720-2727. Pereira, M.A., et al., Dietary fiber and risk of coronary heart disease: a pooled analysis of cohort studies. Arch Intern Med, 2004. 164(4): p. 370-6. Rimm, E.B., et al., Vegetable, fruit, and cereal fiber intake and risk of coronary heart disease among men. JAMA, 1996; 275, 447-51. Wolk, A., Manson J.E., Stampfer M.J., Colditz G.A., Hu F.B., Speizer F.E., Hennekens C.H. and Willett W.C. Long-term intake of dietary fiber and decreased risk of coronary heart disease among women. Journal of the American Medical Association,1999; 281: 1998-2004
103

2005 Dietary Guidelines Advisory Committee Report
Summary Table: Whole Grains and Chronic Disease Risk – Prospective Studies Coronary Heart Disease Quintiles Reference and Study Design
1 2 3 4 5 P for Trend
Notes
Incidence of CHD Energy Intake, kcal/d 1998 2039 2038 2012 1884Total Fiber, g/d 17 19 21 22 26 Whole Grain, g/d (Median Intake) 3.5 9.6 16.0 24.7 42.4 Age-adjusted HR* 1.00 0.88 0.80 0.69 0.64 p <0.0001 Multivariate HR 1.00 0.97 0.94 0.86 0.82 p = 0.01 Added Bran, g/d (Median Intake) 0.0 0.30 1.40 4.23 11.10 Age-adjusted HR 1.00 0.78 0.72 0.69 0.60 p <0.0001
Jensen et al., (in press 2004) 42,850 U.S. men, 40–75 y 14-y follow-up Health Professionals Study
Multivariate HR * HR = Hazard Ratio
1.00 0.81 0.78 0.79 0.70 p <0.0001
CHD (fatal and non-fatal) Energy Intake, kcal/d Range for study
inclusion was 600-3500. Actual levels not stated.
Dietary Fiber, g/d 14 15 16 18 20 Whole grain, svg/d 0.13 0.43 0.85 1.31 2.70 Age and smoking-adjusted RR
1.00
0.87
0.82
0.72
0.67
p <0.001
RR between 1st and 5th quintile = 0.51, p <0.0001
Liu, et al., 1999 75,521 U.S. women, 38–63 y, 10 y follow-up Nurse’s Health Study
Multivariate RR 1.00 0.93 0.94 0.86 0.79 p = 0.07 Meta-analysis
Risk of CHD P Trend Total fiber (heterogenous) 0.73 * Whole grain/w wheat bread RR 0.64 * Cereal fiber RR 0.90 *
Anderson et al, 2000
Pooled cohort of 12 population-based studies (See paper for pop. sizes )
Vegetable fiber RR 0.77 *
Meta-analysis showed that regular intake of whole grain foods
was associated with a 26% reduction in risk for CHD. * The paper did not provide amounts consumed or p values for these RR.
Fruit fiber RR (heterogenous) 0.86 *
104

2005 Dietary Guidelines Advisory Committee Report
Ischemic Disease Quintiles Reference and Study Design
1 2 3 4 5 P for Trend
Notes
Ischemic Heart Disease (fatal) Energy Intake, Mj/d 5.9 6.7 7.3 8.1 9.7 Dietary Fiber, g/d 16.3 18.3 19.8 21.9 22.3 Whole grain, svg/d 0.2 0.9 1.2 1.9 3.2 Age and energy-adjusted RR 1.00 0.84 0.58 0.45 0.60 p = 0.0002 Multivariate RR 1.00 0.96 0.71 0.64 0.70 p = 0.018 Refined grain, svg/wk 4.0 8.0 12.0 18.0 30.0
Jacobs, et al., 1998 34,492 U.S. women, 55-69 y, 10 y follow-up Iowa Women’s Health Study Age and energy-adjusted RR 1.00 0.99 1.14 1.04 1.12 p = 0.57
Ischemic Stroke Dietary Fiber, g/d 14 15 16 18 20 Whole Grain, svg/d 0.13 0.43 0.85 1.31 2.70 Age-adjusted RR 1.00 0.68 0.69 0.49
0.57
p = 0.003
Multivariate RR 1.00
0.72
0.78
0.60
0.69
p = 0.08
RR between 1st and 5th quintile = 0.76, p = 0.38
Refined Grain, svg/d *
Liu et al, 2000 75,521 U.S. women, 38-63 y, 10 y follow-up Nurse’s Health Study
Multivariate RR 1.00
1.11
1.18 0.94
0.97
p = 0.58
* Refined grain quintiles not stated. The median range of intake for 25th –75th percentile was 1.13-2.71 svg/d.
105

2005 Dietary Guidelines Advisory Committee Report
All-cause Mortality, Coronary Artery Disease(CAD), and Ischemic Stroke
Quintiles
Reference and Study Design
1 2 3 4 5 P for Trend
Notes
Whole grain, svg/d 0.1 0.5 1.0 1.5 3.0 All-cause mortality RR* 1.00 0.84 0.66 0.63 0.52 p = 0.001 All-cause mortality Multi RR 1.00 0.96 0.80 0.87 0.77 p = 0.02 CAD RR* 1.00 0.71 0.80 0.56 0.52 p = 0.001 CAD Multivariate RR 1.00 0.76 0.93 0.73 0.72 p = 0.05 Ischemic Stroke RR* 1.00 1.09 0.73 0.78 0.62 p = 0.016 Isch Stroke Multivariate RR 1.00 1.11 0.79 0.89 0.75 p = 0.15 Refined grain, svg/d 0.5 1.5 2.0 3.0 5.5 All-cause mortality RR* 1.00 0.96 1.08 1.07 1.34 p = 0.02 All-cause mortality Multi RR 1.00 0.96 1.03 0.97 1.08 p = 0.62 CAD RR* 1.00 0.92 1.25 1.53 1.54 p = 0.001 CAD Multivariate RR 1.00 0.91 1.14 1.28 1.17 p = 0.11 Ischemic Stroke RR* 1.00 1.12 1.06 0.76 1.01 p = 0.53 Isch Stroke Multivariate RR 1.00 1.10 1.00 0.68 0.82 p = 0.16 Fruits and Vegetables, svg/d 1.5 2.5 3.0 5.0 7.5 All-cause mortality RR* 1.00 0.97 0.76 0.64 0.53 p = 0.001 All-cause mortality Multi RR 1.00 1.08 0.94 0.87 0.78 p = 0.02 CAD RR* 1.00 0.96 1.01 0.82 0.59 p = 0.001 CAD Multivariate RR 1.00 1.10 1.21 1.06 0.82 p = 0.29 Ischemic Stroke RR* 1.00 1.47 1.04 0.91` 0.89 p = 0.21
Steffen, et al., 2003 15,792 U.S. adults, 45-64 y, 11 y follow-up ARIC Study
Isch Stroke Multivariate RR 1.00 1.55 1.10 1.04 0.94 p = 0.40
Inverse assoc. for Af Am pop. only, p = 0.01
* RR adjusted for age at baseline, race, sex, and time-dependent energy intake.
106

2005 Dietary Guidelines Advisory Committee Report
Type 2 Diabetes Quintiles Reference and Study Design
1 2 3 4 5 P for Trend
Notes
Type 2 Diabetes Dietary Fiber, g/d Ranged from 17-25 g/d
Whole Grain, svg/d 0.4 0.8 1.3 1.9 3.2
Multivariate RR 1.00 0.87
0.82
0.72
0.67
p <0.001
RR between 1st and 5th quintile = 0.58, p <0.0001
Refined Grain, svg/d 0.8 1.3 1.9 2.6 4.1
Fung, et al., 2002 42,898 U.S. men, 40-75 y, <12 y follow-up
Multivariate RR 1.00 1.07 1.07 0.98 1.01 p = 0.78
Type 2 Diabetes Whole Grain, svg/wk 1 4 7 10.5 20.5
Multivariate RR 1.00 0.99
0.98
0.92
0.79
p = 0.0089
RR between 1st and 5th quintile = 0., p <0.0001
Dietary Fiber, g/d 13.27 16.64 19.03 21.82 26.50 Multivariate RR 1.00 1.09 1.00 0.94 0.78 p = 0.005 RR between 1st and 5th
quintile = 0.78, p = 0.005
Insoluble Fiber, g/d 9.93 12.48 14.31 16.34 19.84 Multivariate RR 1.00 o.96 0.92 0.81 0.75 p = 0.0012 RR between 1st and 5th
quintile = 0.75, Soluble Fiber, g/d 4.19 5.19 5.88 6.64 8.01 Multivariate RR 1.00 1.00 1.02 0.99 0.89 p = 0.23 RR between 1st and 5th
quintile = 0.89, Cereal Fiber, g/d 2.66 3.87 4.91 6.40 9.43
Meyer et al, 2000 41,836 U.S. postmenopausal women, 55-69, 6 y follow-up Iowa Women’s Health Study
Multivariate RR 1.00 0.93 0.88 0.77 0.64 p = 0.0001 RR between 1st and 5th quintile = 0.64,
Type 2 Diabetes Total Energy Intake, kcal/d 1566 1648 1722 1826 1973 Dietary Fiber, g/d 14 15 16 18 20 Whole Grain, svg/d 0.13 0.43 0.85 1.31 2.70 Multivariate RR 1.00 0.91
0.94
0.74
0.73
p <0.0001
RR between 1st and 5th quintile = 0.62, p <0.0001
Liu et al, 2000 75,521 U.S. women, 38-63 y, 10 y follow-up Nurse’s Health Study Refined Grain, svg/d *
107

2005 Dietary Guidelines Advisory Committee Report
Multivariate RR 1.00 1.09 1.01 1.09 1.11 p = 0.26 RR between 1st and 5th quintile = 1.31, p = 0.0003
Refined to Whole Grain Ratio 1.00 1.09 1.15 1.27 1.26 p = 0.01 Multivariate RR RR between 1st and 5th
quintile = 1.57, p < 0.0001
These findings suggest that substituting whole- for refined-grain products may decrease the risk of diabetes mellitus.
*Refined grain quintiles not stated. Median range of intake for 25th –75th percentile - extracted from Liu’s Ischemic Stroke paper - was 1.13-2.71 svg/d. Insulin Resistance/Metabolic Syndrome Quintiles Reference and Study Design
1 2 3 4 5 P for Trend
Notes
Insulin Resistance Synd (IRS) Dietary Fiber g/d 11.6 14.9 17.4 20.1 25.5 Mean HOMA-IR 7.0 6.7 6.7 6.7 6.4 p <0.001 IRS Odds Ratio 1.00 0.81 0.88 0.81 0.73 p = 0.11 Whole Grains svg/wk 0.90 3.5 6.4 9.5 20.4 Mean HOMA-IR 6.8 6.9 6.7 6.6 6.6 p = 0.05 IRS Odds Ratio R 1.00 0.81 1.09 0.82 0.67 p = 0.01 RR between 1st and 5th
quintile = 0.67 Refined Grains svg/wk 6.9 11.9 16.7 23.7 38.8 Mean HOMA-IR 6.8 6.6 6.8 6.8 6.7 p = 0.81 IRS Odds Ratio 1.00 1.13 1.01 1.03 0.76 p = 0.05 Cereal Fiber g/d 2.6 3.7 4.6 5.8 8.0 Mean HOMA-IR 6.8 6.9 6.8 6.6 6.5 p = 0.02 IRS Odds Ratio 1.00 0.87 0.88 0.74 0.62 p = 0.002 RR between 1st and 5th
quintile = 0.62 Fruit Fiber g/d 0.7 1.7 2.8 4.2 5.8 Mean HOMA-IR 7.0 6.8 6.8 6.6 6.5 p <0.001 IRS Odds Ratio 1.00 1.07 0.74 0.89 0.88 p = 0.36 Vegetable Fiber g/d 2.4 3.7 4.8 6.1 8.4 Mean HOMA-IR 6.7 6.9 6.7 6.8 6.8 p = 0.64 IRS Odds Ratio 1.00 1.08 1.04 1.00 1.15 P = 0.51
McKeown, et al., 2004 2,834 U.S. adults, 26-82 y, Cross-sectional
1991-95 exam of
Framingham
Offspring Cohort
* Mean HOMA-IR = Insulin Resistance Homeostasis Model Assessment
108

2005 Dietary Guidelines Advisory Committee Report
Metabolic Risk Factors Quintiles Reference and Study Design
1 2 3 4 5 P for Trend
Notes
Metabolic Risk Factors for Type 2 DM and CVD
Total energy, kJ/d 7067.0 7336.7 7484.4 7466.7 7244.8 Dietary Fiber, g/d 11.6 14.9 17.4 20.1 25.5 Whole Grains, svg/wk 0.90 3.5 6.4 9.5 20.5 BMI (Model 1) 27.0 26.8 27.1 26.4 26.3 p =0.003 Refined Grains, svg/wk by Whole Grain quintile
23.7 21.9 20.7 18.2 16.2
Waist-to-hip ratio Multivariate RR (Model 2)
0.92 0.91 0.92 0.91 0.90 p < 0.001
Fasting Insulin (pmol/L) 210 209 204 197 195 p < 0.001
McKeown, et al., 2002 2,941 U.S. adults, 26-82 y, Cross-sectional,
1991-95 exam of
Framingham
Offspring Cohort
LDL Cholesterol (mmol/L) 3.17 3.14 3.22 3.17 3.04 p = 0.006
109

2005 Dietary Guidelines Advisory Committee Report
Obesity and Weight Gain Quintiles Reference and Study Design
1 2 3 4 5 P for Trend
Notes
Obesity (BMI > 30) Total Energy Intake, kcal/d 1694 * 1808 * 1740 Dietary Fiber, g/d by quintile of whole grain intake
13 * 16 * 20
Change in Dietary Fiber Intake, g/d
-3.40 0 2.20 4.60 8.90
Multivariate RR 1.00 0.77
0.67
0.69
0.66
p <0.0001
Change in Whole Grain Intake, svg/1000 cal/d
-0.59 -0.09 0.11 0.38 0.90
Multivariate RR 1.00 0.85 0.87 0.82 0.81 p = 0.0002 Change in Refined Grain Intake, svg/1000 cal/d
-0.91 -.029 0.02 0.32 0.86
Multivariate RR 1.00 0.96 0.94 1.03 1.18 p <0.0001 Weight Gain (> 25 KG) Dietary Fiber, g/d by quintile of whole grain intake
13 * 16 * 20
Change in Dietary Fiber Intake, g/d
-3.40 0 2.20 4.60 8.90
Multivariate RR 1.00 0.69
0.56
0.53
0.51
p <0.0001
RR between 1st and 5th quintile = 0.51, p <0.0001
Change in Whole Grain Intake, svg/1000 cal/d
-0.59 -0.09 0.11 0.38 0.90
Age-adjusted RR 1.00 0.87 0.79 0.75 0.73 p = 0.006 Multivariate RR 1.00 0.96 0.97 0.83 0.77 p = 0.03 Change in Refined Grain Intake, svg/1000 cal/d
-0.91 -.029 0.02 0.32 0.86
Age-adjusted RR 1.00 0.96 1.03 1.16 1.61 p <0.0001
Liu et al, 2000 74,091 U.S. women, 38-63 y, 12 y follow-up Nurse’s Health Study
Multivariate RR 1.00 0.85 0.86 0.94 1.26 p = 0.04 * Values not stated in paper.
110

2005 Dietary Guidelines Advisory Committee Report
References: Anderson, JW et al., Whole grain foods and heart disease risk. J Am Coll Nutrition, 2000; 19(90003): p. 291S-299S. Fung, TT et al., Whole-grain intake and the risk of type 2 diabetes: a prospective study in men. Am J Clin Nutr, 2002; 76(3): p. 535-40. Jacobs, DR et al., Whole-grain intake may reduce the risk of ischemic heart disease death in postmenopausal women: the Iowa Women’s Health Study. Am J Clin Nutr, 1998; 68: p. 248-57. Jensen, MK et al., Intake of whole grains, bran and germ and risk of coronary heart disease among men. (AJCN in press, 2004) Liu, S et al., Relation between changes in intakes of dietary fiber and grain products and changes in weight and development of obesity among middle-aged women. Am J Clin Nutr. 2003 Nov;78(5):920-7. Liu, S et al., Whole-grain consumption and risk of coronary heart disease: results from the Nurses' Health Study. Am J Clin Nutr, 1999; 70(3): p. 412-9. Liu, S et al., Whole grain consumption and risk of ischemic stroke in women: A prospective study. JAMA, 2000 Sep 27; 284(12):1534-40. Liu, S et al., A prospective study of whole-grain intake and risk of type 2 diabetes mellitus in US women. Am J Public Health, 2000; 90: p. 1409-1415. Meyer, KA et al., Carbohydrates, dietary fiber, and incident type 2 diabetes in older women. Am J Clin Nutr, 2000; 71(4): p. 921-30. McKeown, NM et al., Carbohydrate Nutrition, Insulin Resistance, and the Prevalence of the Metabolic Syndrome in the Framingham Offspring Cohort. Diabetes Care, 2004; 27(2): p. 538-46. McKeown, NM et al., Whole-grain intake is favorably associated with metabolic risk factors for type 2 diabetes and cardiovascular disease in the Framingham Offspring Study. Am J Clin Nutr. 2002 Aug;76(2):390-8. Steffen, LM et al., Associations of whole-grain, refined grain, and fruit and vegetable consumption with risks of all-cause mortality and inbcident coronary artery disease and ischemic stroke: the Atheroscloerosis Risk in Communities Study. Am J Clin Nutr, 2003; 78: p. 383-90.
111

2005 Dietary Guidelines Advisory Committee Report
Summary of Research on Dairy Intake & Skeletal Status
Full Citation Population: Age Group
Effect Outcome Measures
Bony site
Comments
Randomized controlled trials Baran D., et al. Dietary modification with Dairy products for preventing vertebral bone loss in premenopausal women: a three-year prospective study. J Clin Enocrinol Metab 1989 70:264-270.
adult + bone mass s
Cadogan J., et. al. Milk intake and bone mineral acquisition in adolescent girls: randomized, controlled intervention trial. Br Med J 1997 315:1255-1260.
adolescent + bone mass b
Chan, G. Effects of dairy products on bone and body composition in pubertal girls. J Pediatr 1995 126(4):551-556.
children + bone mass h,s,r,b + for s & b
Chee W.S.S., et al. The effect of milk supplementation on bone mineral density in postmenopausal Chinese women in Malasia. Osteoporos Int 2003 14:828-834.
adult + BMD b,h,s 1200 mg Ca from dairy + ~470 mg diet Ca
Lau E.M. Calcium and bone health in Asians. Clin Calcium 2001 11(2):168-172. adult + bone mass
Prince R., et. al. The effects of calcium supplementation (milk powder or tablets) and exercise on bone density in postmeno pausal women. J Bone Miner Res 1995 10:1068-1075.
adult + bone mass h,s
Storm D., et al. Calcium supplementation prevents seasonal bone loss and changes in biochemical markers of bone turnover in elderly New England women: a randomized placebo-controlled trial. J Clin Endocrinol Metab 1998 83:3817-3825.
elderly + bone resorption/mass h,s + for both resorption & BMD
Observational studies Alekel, D.L., et al. Lifestyle and biologic contributors to proximate femur bone mineral density and hip axis length in two distinct ethnic groups of premenopausal women. Osteoporos Int 1999 9:327-338.
adult + bone mass h
Black R.E., et al. Children who avoid drinking cow milk have low dietary calcium intakes and poor bone health. Am J Clin Nutr 2002 76:675-680.
children + bone mass, BMD b,h,s,r Milk avoiders negative effect
Chiu J.F., et al. Long-term vegetarian diet and bone mineral density in postmenopausal Taiwanese women. adult + bone mass h,s late vegetarian effects
112

2005 Dietary Guidelines Advisory Committee Report
Calcif Tissue Int 1997 60(3):245-249. Cumming R.G. and Klineberg R.J. Case-control study of risk factors for hip fractures in the elderly. Am J Epidemiol 1994 139:493-503.
elderly – hip fractures -- recalled dairy 60 yrs earlier
Du XQ., et al. Milk consumption and bone mineral content in Chinese adolescent girls. Bone 2002 31(3):521-528.
adolescent + SPA forearm; bone width r
649 pubertal Chinese girls; milk effect greater than its tested nutrients
Finkenstedt G., et al. Lactose absorption, milk consumption, and fasting blood glucose concentrations in women with idiopathic osteoporosis. Brit Med J Clin Res 1986 292:161-162.
adult +/0 osteoporosis -- case control study
Fujiwara S., et al. Risk factors for hip fracture in a Japanese cohort. J Bone Miner Res 1997 12:998-1004. elderly + hip fractures -- cohort study
Hawker G.A., et al. Correlates of forearm bone mineral density in young Norwegian women. The Nord-Trqndelag Health Study. Am J Epidemiol 2002 156(5):418-427.
adult + BMD r Nord-Trøndelag Study (n=963)
Hirota T., et al. Effect of diet and lifestyle on bone mass in Asian young women. Am J Clin Nutr 992 55:1168-1173.
adult + bone mass r
Honkanen R.J., et al. Interaction of calcium and HRT in the prevention of bone loss and fractures in early postmenopausal women. J Bone Miner Res 1999:14:S181.
adult + fractures/bmd s calcium & estrogen interact
Hu J-F., et al. Dietary Calcium and bone density among middle-aged and elderly women in China. Am J Clin Nutr 1993 58:219-227.
adult + bone mass r
J\nsson B., et al. Life-style and different fracture prevalence: a cross-secional comparative population-based study. Calcif Tissue Int 1993 52:425-433.
adult 0 fracture b
Kanis J., et al. Risk factors for hip fracture in men from Southern Europe: the MEDOS study. Osteoporos Int 1999 9:45-54.
adult + hip fracture -- case control study (MEDOS)
Khan K.M., et al. Retired elite female ballet dancers and nonathletic controls have similar bone mineral density at weightbearing sites. J Bone Miner Res 1996 11:1566-1574.
adult + bone mass b non-weight bearing bones only
Lunt M., et al. The effects of lifestyle, dietary dairy intake and diabetes on bone density and vertebral deformity prevalence: The EVOS Study. Osteoporos Int 2001 12:688-698.
adult + BMD s European vertebral osteoporosis study
113

2005 Dietary Guidelines Advisory Committee Report
Matkovic V., et al. Nutrition influences skeletal development from childhood to adulthood: a study of hip, spine, and forearm in adolescent females. J Nutr 2004 134:701S-705S.
childhood/ adolescence + BMD s Longitudinal study, cross-
sectional radius +
Matkovic V., et al. Bone status and fracture rate in two regions of Yugoslavia. Am J Clin Nutr 1979 32:540-549. adult + bone
mass/fractures m 0 wrist fx; + bone mass & hip fx
McCabe L.D., et al. Dairy intake impacts vone density in the elderly. Am J Clin Nutr. In press, 2004. elderly + BMD h effect driven by men
Michaelsson K., et al. A high dietary calcium intake is needed for a positive effect on bone density in Swedish postmenopausal women. Osteoporos Int 1997 7(2):155-161.
adult + bone mass h,s,b
Murphy S., et al. Milk consumption and bone mineral density in middle aged and elderly women. Brit Med J 1994 308(6934):939-941.
elderly + bone mass h,s
Shaw C.K. An epidemiologic study of osteoporosis in Taiwan. Ann Epidemiol 1993 3(3):264-271. adult +/0 bone mass s
Sone T., et al. Influence of exercise and degenerative vertebral changes on BMD: a cross-sectional study in Japanese men. Gerontology 1996 42 Suppl 1:57-66.
adult + bone mass h,s
Soroko S., et al. Lifetime milk consumption and bone mineral density in older women. Am J Public Health 1994 84(8):1319-1322.
adult + bone mass h,s,r
Stallings V.A., et al. Bone mineral content and dietary calcium intake in children prescribed a low-lactose diet. J Pediatr Gastroenterol Nutr 1994 18(4):440-445.
children + bone mass r children with lactose intolerance
Teegarden D., et al. Previous milk consumption is associated with greater bone density in young women. Am J Clin Nutr 1999 69(5):1014-1017.
young adult + bone mass h,s,r
Turner 1998 see: Peacock M., et al. Bone mass and structure at the hip in men and women over the age of 60 years. Osteoporos Int 1998 8(3):231-239.
elderly 0 hip fracture -- case control (NHANES-I)
Tylavsky F.A. and Anderson J.J. Dietary factors in bone health of elderly lactoovovegetarian and ominivorous women. Am J Clin Nutr 1988 Sep 48(3 Suppl):842-849.
elderly 0 bone mass r
Ulrich C.M., et al. Bone mineral density in mother-daughter pairs: relations to lifetime exercise, lifetime milk consumption, and calcium supplements. Am J Clin Nutr 1996 63(1):72-79.
adult + bone mass b
VandenBergh M.F., et al. Physical activity, calcium children 0 bone mass m mean Ca intake v. high all
114

2005 Dietary Guidelines Advisory Committee Report
intake, and bone mineral content in children in the Netherlands. J Epidemiol Community Health 1995 49(3):299-304.
groups
Welten D.C., et al. Weight-bearing activity during youth is a more important factor for peak bone mass than calcium intake. J Bone Miner Res 1994 9(7):1089-1096.
adolescent 0 bone mass s
Whiting 2001 see: Carter L.M., et al. Self-reported calcium intake and cone mineral content in children and adolescents. J Am Coll Nutr 2001 20(5):502-509.
adolescent + BMC b
Wittich A., et al. Professional football (soccer) players have a markedly greater skeletal mineral content, density and size than age- and BMI-matched controls. Calcif Tissue Int 1998 63(2):112-117.
young adult 0 bone mass b
Wyshak G., et al. Nonalcoholic carbonated beverage consumption and bone fractures among women former college athletes. J Orthop Res 1989 7(1):91-99.
adult + fractures -- cohort study
Yano K., et al. The relationship between diet and bone mineral content of multiple skeletal sites in elderly Japanese-American men and women living in Hawaii. Am J Clin Nutr 1985 42(5):877-888.
adult + bone mass r,o men & women
Notes: * a report may appear in more than one category Year: the emphasis is mostly on studies published since 1980; see AJCN 36:986–1013 (1982) for earlier studies Effect: "+": significantly greater bone gain, reduced bone loss, reduced fracture, "0": no significant change in the above "–": significantly greater fracture risk or significantly greater bone loss Bony site: "b" = total body; "h" = hip; "r" = radius; "s" = lumbar spine; "o" = os calcis; "m" = metacarpals or phalanges; “oth” = other Comment: special features singled out; for fracture end-point in observational studies, study type identified.
115

2005 Dietary Guidelines Advisory Committee Report
Question: What is the relationship between moderate alcohol consumption and nutrient intake? Inclusion criteria: Prospective, case-control, cross-sectional studies; human subjects Working summary table as of 3/08/04 OBSERVATIONAL STUDIES
Full Citation Design Population Exposure Outcome Duration Results Statistics Comments Barefoot JC, Gronbeck M, Feaganes JR, McPherson RS, Williams RB, Siegler IC. Alcoholic beverage preference, diet, and health habits in the UNC Alumni Heart Study
cross-sectional
2864 men and 1571 women in
UNC Alumni Heart Study
Nondrinkers, drinkers (prefer spirits, prefer
beer, no preference, prefer wine);
Measured using Food-
Frequency Questionnaire
Food group indexes
(fruit, vegetables, red or fried
meats); Nutrient intakes
N/A Significant only for nondrinkers vs. drinkers:
Food group indexes in servings per day (women, men):
VEGETABLES - Nondrinkers 3.02, 2.77; Prefer beer 3.13, 2.92;
Prefer spirits 2.92, 2.78; No preference 3.37, 3.21;
Prefer wine 3.49, 3.22; Nutrient intakes (women, men):
SAT FAT (% kcal) Nondrinkers 10.6, 11.1; Prefer beer 10.9, 10.8;
Prefer spirits 10.8, 11.0; No preference 10.4, 10.8;
Prefer wine 10.3, 10.7; FIBER (g/1000ml) -
Nondrinkers 2.6, 2.4; Prefer beer 2.4, 2.3;
Prefer spirits 2.3, 2.1; No preference 2.4, 2.3;
Prefer wine 2.6, 2.5
Nondrinkers vs. drinkers: Fruit NS,
Vegetables p<0.0001, Red or fried meats NS, Saturated fat p=0.05,
Fiber p<0.0001, Cholesterol NA;
Beverage preference main effect:
Fruits p<0.0001, Vegetables p<0.0001,
Red or fried meats p<0.0001, Saturated fat
p=0.0005, Fiber p<0.0001,
Cholesterol p<0.0005
Alcohol intake and alcoholic-beverage preference were found to be associated with a variety of dietary indicators (and with smoking, exercise and BMI). There was evidence that wine drinkers has potentially healthier diets.
D'Avanzo B, La Vecchia C, Braga C, Franceschi, Negri E, Parpinel M. Nutrient intake according to education, smoking, and alcohol in Italian women. Nutrition and Cancer 1997;28:46-51.
cross-sectional
2588 controls in
case-control study
nondrinkers, >0-8
drinkers/wk, >8 drinks/wk;
Measured using Food-
Frequency Questionnaire
Nutrient intake
N/A Significantly different for nondrinker vs. >0-8 drinks/wk: fiber(g) 23.23 vs.
22.41; retinol(mcg) 661.05 vs. 749.96; iron(mg) 12.56 vs. 13.16;
potassium(mg) 3356 vs. 3394
p<0.05 Differences in macro and micro-nutrient intakes were generally moderate across categories of alcohol consumption.
de Castro JM, Orozco S. Moderate alcohol intake and spontaneous eating patterns of humans: evidence of unregulated supplementation. Am J Clin Nutr. 1990;52:246-53.
cross-sectional
23 men and 69 women
no-alcohol; low-alcohol
consumption; moderate-
alcohol consumption;
Measured using diet diary
energy intake
7 days No vs. Low vs. Moderate: Kcals 1879/2026/2174*;
CHO Kcal 859/918/899; Fat Kcal 715/749/782;
Protein Kcal 305/324/353*; ETOH Kcal 0/35/140
*signicantly greater than no-alcohol group, p<0.05
Signicantly more calories were ingested on days when alcohol was ingested than on days when it was not ingested.
116

2005 Dietary Guidelines Advisory Committee Report
Jacques PF, Sulsky S, Hartz SC, Russell RM. Moderate alcohol intake and nutritional status in nonalcoholic elderly subjects. Am J Clin Nutr 1989;50:875-83.
cross-sectional
761 individuals
aged 60-100 years, living
in Boston
0-4 g/day; 5-14 g/day;
15+g/day; Measured using
3-day food record
mean nutrient intake
N/A Significantly different (0-4g/ 5-14g/ 15+g): total energy
1644/1707/1818*; zinc(mg) 15.1/12.6**/12.7
*p<0.01; **p<0.05 In this study of adequately nourished, nonalcoholic elderly subjects, effects of alcohol on nutrient intake were small.
Rosell M, de Faire U, Hellenius M-L. Low prevalence of metabolic syndrome in wine drinkers - is it the alcohol beverage or lifestyle? Eur J Clin Nutr. 2003;57:227-234.
cross-sectional
4232 60 year old men and
women
no alcohol intake (0 g alcohol/d); moderate
intake (>10-30 g/d);
high intake (>30 g/d);
Measured using questionnaire
with five questions
concerning intake of beer,
wine, and spirits
Daily intake of fruit; daily
intake of vegetables;
Non-oily fish > 3
times/week; Sausage/ba
con >1 time/week;
Fried potatoes >
1 time/week
N/A Prevalence (%) of food intake (Fruit/Veg/Fish/Sausage/Potat):
MEN - no alcohol 49/56/53/45/43; low alcohol 60/56/64/47/32;
mod. wine 55/66*/78***/37*/40; mod. beer 45***/56/61/48/41*;
mod. spirits 48/52/76/76***/47*; mod. mixed 55/61/68/44/40*;
WOMEN - no alcohol 72/71/62/32/22; low alcohol 78/69/66/30/18;
mod. wine 76/74/74**/23**/21; mod. beer 65*/76/70/59***/32*;
mod. spirits 44***/41***/38***/28/13; mod. mixed 74/71/71/20**24*
*p<0.05;** p<0.01;*** p<0.001
(Chi-square performed using "low" alcohol group
as reference)
Daily intake of fruit and vegetables was less frequent in the beer and spirits group compared with low alcohol group. The wine group had higher intake of fish and vegetables.
Schroder H, Marrugat J, Elosua R, Covas MA. Tobacco and alcohol consumption: impact on other cardiovascular and cancer risk factors in a southern European Mediterranean population. Br J Nutr 2002;88:273-81.
cross-sectional
1748 25-74 year old
Spanish men and women
nondrinkers; moderate
drinkers (<40 g/d for men, <25 g/d for women);
heavy drinkers (>40 g/day for
men, >25 g/day for
women); Measured using 72 hour recall
mean nutrient intake
N/A Significantly different for nondrinker vs. moderate:
unsat fat(g) 51.9 vs. 54.6; SFA (%kcal) 12.1 vs. 11.8;
unsat fat(%kcal) 23.2 vs. 23.5
p<0.05 In multiple linear regression model, alcohol consumption was associated with unsaturated fatty acid intake.
117

2005 Dietary Guidelines Advisory Committee Report
Tremblay A, Wouters E, Wenker M, St-Pierre A, Bouchard C, Despres JP. Alcohol and a high-fat diet: a combination favoring overfeeding. Am J Clin Nutr 1995;62:639-44. (STUDY 2)
cross-sectional
351 men and 360 women
in the Quebec
Family Study
quartiles of absolute
alcohol intake (g/d); Measured
using 3-day food record
energy and macronutrie
nt intake
N/A Significant correlation between alcohol intake and energy intake in
men and women. Daily energy intake was significantly greater in subjects of the upper quartile for
alcohol consumption, than those in the lower quartile. There was no
difference in lipid intake
not given Tables with numerical results were not included in electronic copy of article.
CLINICAL TRIALS Full Citation Design Population Groups Outcome Duration Baseline
Level Results Statistics Comments
Folton RW, Kelly TH, Fischman MW. Ethanol as an energy source in humans: comparisons with dextrose-containing beverages. Appetite. 1993;20:95-110.
cross-over
6 healthy men
2400 kJ from
dextrose; 2400 kJ
from alcohol; 4600 kJ
from dextrose; 4600 kJ
from alcohol
energy and macronutrien
t intake
2 days for each group
Under no-beverage
control condition, intake was
2650 kcal with 28% of total energy from fluid items; 1400 kcal
from carbohydrate; 900 kcal from
fat;
There were no differences in energy intake, snack and
meal intake, or energy intake from fat and protein between the energy-matched dextrose
and ethanol conditions. Energy intake from carbohydrate was
significantly greater at both levels of dextrose vs. ethanol.
p<0.001 for carbohydrate differences
2400 kJ was 22% of kcal intake; 4600 kJ was 42% of kcal intake
Orozco S, de Castro JM. Effects of alcohol abstinence on spontaneous feeding patterns in moderate alcohol consuming humans. Pharmacol Biochem Behav. 1991;40:867-73.
cross-over
13 men and 12 women
from Georgia State
University
alcohol week;
no alcohol week
energy and nutrient intake
10 days N/A Significantly different for alcohol week vs. no alcohol
week: Kcal 2205 vs. 1829*;
phosphorus (mg) 1392 vs.1223*;
niacin(mg) 55 vs. 34**; magnesium(mg) 271 vs.
215**
*p<0.01; **p<0.05 Alcohol added additional calories without altering other macronutrient intake.
118

2005 Dietary Guidelines Advisory Committee Report
Tremblay A, Wouters E, Wenker M, St-Pierre A, Bouchard C, Despres JP. Alcohol and a high-fat diet: a combination favoring overfeeding. Am J Clin Nutr 1995;62:639-44. (STUDY 1)
2x2 factorial design
8 healthy male
subjects
1) low-fat, placebo;
2) low-fat, alcohol;
3) high-fat, placebo;
4) high-fat, alcohol
alcohol and macronutrien
t intake
2 days for each diet
N/A Energy intake was significantly greater under the high-fat than the low-fat diet condition, with both alcohol and placebo. The greatest energy intake was found
under the high-fat + alcohol condition.
Both alcohol and diet composition had
significant effect on total energy intake
(p<0.05).
Tables with numerical results not available.
119

2005 Dietary Guidelines Advisory Committee Report
Question: What is the relationship between moderate alcohol consumption and weight/BMI? Inclusion criteria: Prospective, case-control, cross-sectional studies; human subjects; publication dates 1996 and after Working Summary Table as of 3/08/04 OBSERVATIONAL STUDIES
Full Citation Design Population Exposure Outcome Duration Results Statistics Comments
Andersson I, Rossner S. The Gustaf Study: Repeated, telephone administered 24-hour dietary recalls of obese and normal-weight men - energy intake and macronutrient intake and distribution over the days of the week. J Am Diet Assoc. 1996;96:686-692.
case-control 86 obese men, 20-60 years old and 61 normal weight, age-
matched men
Percent energy from alcohol; Measured from 24-hour recall
percent energy from
alcohol
N/A Intake of alcohol (% kcal) in obese and control men
(min/25th/med/75th/max): Obese
0/1/2/6/18, Control 0/3/5/8/26
p<0.001 for difference between groups
The obese men reported a lower alcohol intake than the control men.
Barefoot JC, Gronbeck M, Feaganes JR, McPherson RS, Williams RB, Siegler IC. Alcoholic beverage preference, diet, and health habits in the UNC Alumni Heart Study. Am J Clin Nutr. 2002 Aug; 76(2): 466-72.
cross-sectional
2864 men and 1571 women in
UNC Alumni Heart Study
nondrinkers; drinkers (prefer spirits, prefer beer, no preference,
prefer wine); Measured from FFQ
BMI N/A BMI (women, men); Nondrinkers 25.1,
26.6; Prefer beer 22.9,
25.8; Prefer spirits 23.8, 26.2; No preference 24.7, 26.0; Prefer wine
23.6, 25.8
Nondrinkers vs. drinkers p<0.0001;
Beverage preference main effect p<0.0001
Alcohol intake and alcoholic-beverage preference were found to be associated with BMI.
120

2005 Dietary Guidelines Advisory Committee Report
Dorn JM, Hovey K, Muti P, Freudenheim JL, Russell M, Nochajski TH, Trevisan M. Alcohol drinking patterns differentially affect central adiposity as measured by abdominal height in women and men.J Nutr. 2003 Aug; 133(8): 2655-62.
cross-sectional
2343 healthy Causcasian and African American men and women
from Western New York, 35-79
y old
Beverage type; Total grams of
ethanol; Drinking frequency; Drinking intensity; Drinking with or
without food; Drinking frequency
categorized by (a)lifetime abstainer
(never had 12 or more drinks in their lifetime
or in any 1-year period), (b)
noncurrent drinker (previously consumed 12 or more drinks in lifetime or 1-y period, but did not consume any alcohol in last 30 d), (c) current drinker (consumed at least
one alcoholic beverage in 30 d
before the interview); Current drinkers
further categorized - (c1)daily drinkers, (c2) weekly, but less than
daily drinkers, (c3) less than weekly drinkers; Weekly drinkers further categorized into weekend only drinkers and
throughout the week drinkers; Measured as assessed drinking pattern as reported for
the past 30 d, including beverage type and amount,
frequency of consumption,
percentage of time drinking while eating and number of drinks consumed/drinking
day.
abdominal height (as
measure of visceral fat)
N/A Adjusted means for abdominal height
(cm): Men - abstainers 21.63, noncurrent
drinkers 22.50, current drinkers
21.90; Women -
abstainers 20.99, noncurrent drinkers
20.99, current drinkers 20.00
Women current drinkers vs.
nondrinkers p<0.0001
Current drinkers tended to have smaller abdominal heights than nondrinkers. For drinking pattern, frequency was inversely associated, but drinking intensity was positively associated with central adiposity in women (P trend for frequency, 0.0007; intensity, 0.0010) and men (P trend for frequency, 0.0005; intensity, 0.0004), even when age, education, physical activity, smoking status and amount of alcohol (g) were included in the models.
121

2005 Dietary Guidelines Advisory Committee Report
Gavaler JS, Rosenblum E. Predictors of postmenopausal body mass index and waist to hip ratio in the Oklahoma Postmenopausal Health Disparities Study. J Am Coll Nutr. 2003;22:269-76.
cross-sectional
649 postmenopausal
women
drinks/week among drinkers; Measured
using 3-day food records
BMI N/A Standardized regression
coeffiecients for total weekly drinks:
All women = -0.072; White
women = -0.113
Moderate drinking was a significant predictor of BMI in all women and white women.
Hoffmeister H, Schelp FP, Mensink GB, Dietz E, Bohning D. The relationship between alcohol consumption, health indicators, and mortality in the German population. Int J Epidemiol. 1999 Dec;28(6):1066-72.
prospective cohort
15,400 representative
sample of German
population and 2370 regional sample of the
Berlin-Spandau, ages 25-69
years
0 g/day; 1-20 g/day;
21-40 g/day; 41-80 g/d;
>80 g/day; Measured using self-
administered questionnaire
BMI Mean BMI for Men: 0 g/day 26.5; 1-20 g/d 26.6;
21-40 g/d 26.5; 41-80 g/d 26.7; >80 g/d 27.4; Mean BMI for
Women: 0 g/day 26.1; 1-20 g/d 25.8;
21-40 g/d 25.6; 41-80 g/d 25.6;
>80 g/d 25.5
Among males, BMI not associated with increasing consumption of alcohol, except for group of very heavy drinkers. In general, female drinkers had lower BMI than nondrinkers.
Lahti-Koski M, Pietinen P, Heliovaara M, Vartiainen E. Associations of body mass index and obesity with physical activity, food choices, alcohol intake, and smoking in the 1982-1997 FINRISK Studies. Am J Clin Nutr. 2002 May; 75(5): 809-17.
cross-sectional
15,761 men and 15,518 women in
Finland, aged 25-64 y
0 portions/week; 1-3 portions/week; 4-9 portions/week; >10 portions/week;
Measured using self-administered
questionnaire with questions on type,
frequency, and amount of alcohol
consumed during the previous week
BMI 15 years Odds Ratios for BMI >30:
Men - 0 portions/wk 1.16
(0.99,1.36); 1-3 portions/wk
1.00; 4-9 portions/wk
1.11 (0.93,1.33); >10 portions/wk
1.33 (1.12, 1.58);
Women - 0 portions/wk 1.19
(1.04,1.36); 1-3 portions/wk
1.00; 4-9 portions/wk
0.82 (0.66,1.01); >10 portions/wk
1.20 (0.86, 1.66)
95% confidence interval
122

2005 Dietary Guidelines Advisory Committee Report
Rosell M, de Faire U, Hellenius M-L. Low prevalence of metabolic syndrome in wine drinekrs - is it the alcohol beverage or lifestyle? Eur J Clin Nutr. 2003;57:227-234.
cross-sectional
4232 60 year old men and women
no alcohol intake (0 g alcohol/d); moderate intake (>10-30 g/d);
high intake (>30 g/d); Measured using
questionnaire with five questions concerning intake of beer, wine,
and spirits
waist-to-hip ratio
N/A Mean Waist-to-hip ratio: MEN - no alcohol 0.96*; low alcohol 0.94; moderate wine
0.93; moderate beer
0.94; moderate spirits
0.96**; moderate mixed
0.93; WOMEN - no
alcohol 0.84***; low alcohol 0.82; moderate wine
0.82; moderate beer
0.83; moderate spirits
0.86**; moderate mixed
0.81
*p<0.05; **p<0.01;
***p<0.001 (t-tests performed using "low" alcohol group as reference)
Sherwood NE, Jeffery RW, French SA, Hannan PJ, Murray DM. Predictors of weight gain in the Pound of Prevention Study. Int J Obes. 2000;24:395-403.
cross-sectional and prospective
826 women and 218 men, 20-45
years old
Percent energy from alcohol; measured using Block Food
Frequency Questionnaire
weight 3 years Multivariate associations (coeffecient): MEN cross-
sectional -0.400, prospective 0.088;
WOMEN cross-sectional -0.446,
prospective 0.011; Mean change in % kcal from alcohol between baseline
and year 3 by weight change
status (wt
losers/maintainers/gainers): MEN +0.1/+1.4/+0.5;
WOMEN +0.1/+0.1/+0.4
Effect of percent energy from alcohol on weight gain not
statistically significant.
123

2005 Dietary Guidelines Advisory Committee Report
Vahtera J, Poikolainen K, Kivimaki M, Ala-Mursula L, Pentti J. Alcohol intake and sickness absence: A curvilinear relation. Am J Epidemiol. 2002;156:969-976.
prospective cohort
1490 male and 4952 females
municipal employees in
Finland
lifelong abstainers; former drinkers;
1-50 g/week; 51-100 g/week;
101-275 g/week; >275 g/week;
Measured using reported habitual
frequency and amount of beer, wine
and spirits intake
BMI 4 years Mean BMI (SE): lifelong abstainers
24.9 (0.7); former drinkers
25.0 (0.4); 1-50 g/week 25.8
(0.2); 51-100 g/week
26.1 (0.2); 101-275 g/week
26.0 (0.2); >275 g/week 26.6
(0.2)
p=0.008 (age- and income-adjusted
analysis of variance for continuous and
logistic regression for dichotomous
variables)
Wannamethee SG, Shaper AG. Alcohol, body weight, and weight gain in middle-aged men. Am J Clin Nutr 2003;77:1312-7.
prospective cohort
7608 men aged 40-59 y from 24
British towns
None; Occasional (<1
unit/wk); Light-moderate (1-20
units/wk); Heavy (21-42
units/wk); Very heavy (>42
units/wk); measured using nurse
administered questionnaire and
postal questionnaire
BMI 5 years Adjusted OR for BMI >28: None
1.00; Occasional 0.95
(0.73, 1.24); Light-mod. 0.92 (0.71,
1.19); Heavy 1.24 (0.95, 1.61);
Very heavy 1.42 (1.07, 1.90)
95% confidence interval; p <0.0001 for
trend; Very heavy significantly difference
from none p<0.05
Similar patterns were seen for all types and combinations of alcohol. After 5 years of follow-up, stable and new heavy drinkers showed the greatest weight gain and had the highest prevalence rates of high BMI.
124